Formulation & Evaluation of Floatable Insitu Gel for Stomach-specific Drug Delivery of Ofloxacin
15
American Journal of Advanced Drug Delivery www.ajadd.co.uk American Journal of Advanced Drug Delivery www.ajadd.co.uk Original Article Formulation & Evaluation of Floatable In- situ Gel for Stomach-specific Drug Delivery of Ofloxacin SANKET CHANIYARA *1 , DRON MODI 1 , RAVI PATEL 1 , JAY PATEL 1 , RAHUL DESAI 2 , SUNITA CHAUDHARY 1 1 Department of Pharmaceutics, Arihant school of Pharmacy and Bio Research Institute, ADALAJ- GANDHINAGAR, INDIA 2 Department of pharmaceutical Technology, L. J. Institute of Pharmacy, AHMEDABAD, INDIA ABSTRACT Objective: The purpose of this study was to evaluate the potential for oral sustained delivery of ofloxacin. The plasma half-life of ofloxacin was 4 hrs and dose was 200-800mg twice/thrice a day depending on severity of infection. Dose >400mg was given in two divided dose. Hence ofloxacin was chosen as a model drug with an aim to develop a sustained release system for 16 hrs. Experimental Method: Oral administration of aqueous solution of sodium alginate (1% w/v) containing calcium ion (1.5% w/v) in complexed form resulted in formulation of gel. The effects of different concentration of sodium alginate and calcium carbonate on viscosity and drug release at 10 hrs (% Q10) were studied using 3 2 factorial designs. The prepared formulation were evaluated for various parameter like floating lag time, total floating time, pH, gelling time and gelling capacity, swelling index, drug content and in-vitro drug release. The optimized formulation was subjected to stability study for 1 month. Keywords: In-situ gel, sodium alginate, sustained drug delivery. INTRODUCTION In situ gel forming systems have been widely investigated as vehicles for sustained drug. This interest has been sparked by the advantages shown by in situ forming polymeric delivery systems such as ease of administration and reduced frequency of administration, improved patient compliance and comfort. In situ gel formation occurs due to one or combination of different stimuli like pH change, temperature modulation and solvent exchange. So, In situ gelling system via different route such as oral, nasal, ophthalmic etc can be formulated. Various natural and synthetic polymers such as gellan gum, alginic acid, xyloglucan, pectin, Date of Receipt- 25/07/2013 Date of Revision- 15/08/2013 Date of Acceptance- 19/08/2013 Address for Correspondence Department of Pharmaceutics, Arihant school of Pharmacy and Bio Research Institute, ADALAJ- GANDHINAGAR, INDIA E-mail: chaniyarasanket88 @gmail.com
-
Upload
cpmelankolis -
Category
Documents
-
view
223 -
download
0
Transcript of Formulation & Evaluation of Floatable Insitu Gel for Stomach-specific Drug Delivery of Ofloxacin

American Journal of Advanced Drug Delivery
www.ajadd.co.uk
American Journal of Advanced Drug Delivery www.ajadd.co.uk
Original Article
Formulation & Evaluation of Floatable In-situ Gel for Stomach-specific Drug Delivery of Ofloxacin SANKET CHANIYARA*1, DRON MODI1, RAVI PATEL1, JAY PATEL1, RAHUL DESAI2, SUNITA CHAUDHARY1
1Department of Pharmaceutics, Arihant school of Pharmacy and Bio Research Institute, ADALAJ- GANDHINAGAR, INDIA 2Department of pharmaceutical Technology, L. J. Institute of Pharmacy, AHMEDABAD, INDIA
ABSTRACT
Objective: The purpose of this study was to evaluate the potential for oral sustained delivery of ofloxacin. The plasma half-life of ofloxacin was 4 hrs and dose was 200-800mg twice/thrice a day depending on severity of infection. Dose >400mg was given in two divided dose. Hence ofloxacin was chosen as a model drug with an aim to develop a sustained release system for 16 hrs. Experimental Method: Oral administration of aqueous solution of sodium alginate (1% w/v) containing calcium ion (1.5% w/v) in complexed form resulted in formulation of gel. The effects of different concentration of sodium alginate and calcium carbonate on viscosity and drug release at 10 hrs (% Q10) were studied using 32 factorial designs. The prepared formulation were evaluated for various parameter like floating lag time, total floating time, pH, gelling time and gelling capacity, swelling index, drug content and in-vitro drug release. The optimized formulation was subjected to stability study for 1 month.
Keywords: In-situ gel, sodium alginate, sustained drug delivery.
INTRODUCTION
In situ gel forming systems have been widely investigated as vehicles for sustained drug. This interest has been sparked by the advantages shown by in situ forming polymeric delivery systems such as ease of administration and reduced frequency of administration, improved patient compliance and comfort. In situ gel
formation occurs due to one or combination of different stimuli like pH change, temperature modulation and solvent exchange. So, In situ gelling system via different route such as oral, nasal, ophthalmic etc can be formulated. Various natural and synthetic polymers such as gellan gum, alginic acid, xyloglucan, pectin,
Date of Receipt- 25/07/2013 Date of Revision- 15/08/2013 Date of Acceptance- 19/08/2013
Address for Correspondence Department of Pharmaceutics, Arihant school of Pharmacy and Bio Research Institute, ADALAJ-GANDHINAGAR, INDIA E-mail: chaniyarasanket88 @gmail.com

chaniyara et al__________________________________________________ISSN-2321-547X
AJADD[1][3][2013]285-299
chitosan, poly (DL lactic acid), poly (DL-lactide-co-glycolide) and poly-caprolactone are used for formulation development of in situ forming drug delivery systems. Gastroretentive in situ gelling system helps to increase bioavailability of drug compared to conventional liquid dosage form. The gel formed from in situ gelling system, being lighter than gastric fluids, floats over the stomach contents or adhere to gastric mucosa due to presence of bioadhesive nature of polymer and produce gastric retention of dosage form and increase gastric residence time resulting in prolonged drug delivery in gastrointestinal tract. This review attempts to discuss stomach specific in situ gelling system in detail including formulation factors to be considered in the development of in-situ drug delivery system.
In situ forming gels are formulations, applied as a solution, which undergoes gelation after instillation due to physicochemical changes inherent to the biological fluids. In this way, the polymers, which show sol-gel phase transition and thus trigger drug release in response to external stimuli, are the most investigated. In-situ hydrogels are providing such ‘sensor’ properties and can undergo reversible sol-gel phase transitions upon changes in the environmental condition. These “intelligent” or “smart” polymers play important role in drug delivery since they may dictate not only where a drug is delivered, but also when and with which interval it is released.
Ofloxacin is a synthetic fluorinated carboxyquinolone that has a broad spectrum of activity. It is highly soluble in acidic pH and has absorption window to upper part of GIT. 200-800mg dose administered twice or thrice a day for 5-7 days depending on severity of infection. Dose greater than 400 mg is given in two divided dose. In the present study, the potential for the sustained delivery of ofloxacin of a liquid formulation comprising a dilute aqueous solution of
sodium alginate that is designed to form gels in situ in the acidic environment of the stomach. It requires multiple dosing to obtain the required therapeutic doses and to attain steady state plasma concentration. So, large dose of drug can be incorporated and ultimately frequency of administration is being reduced. MATERIALS AND METHODS
Materials used in present investigation Ofloxacin, Na-Alginate, HPMC
K4M, HPMC K15M, Calcium Carbonate, Sodium Bicarbonate, Sodium Bicarbonate, Methyl Paraben, Propyl paraben, aspartame, 0.1 N HCl, HPMC K100M. Equipments used
See table 1. Method of preparation of in situ gelling solution
Sodium alginate solutions of concentrations 0.25, 0.5, 1.0, 1.5 and 2.0% (w/v) were prepared by adding the alginate to purified water containing 0.50% (w/v) Trisodium citrate with stirring and calcium carbonate (prescreened by 60 #) was dissolved in another beaker. Ofloxacin (2700 mg) was then dissolved in 10 ml of 0.1N HCl solution (pH 1.2) and added in the resulting solution. The HPMC K4M, HPMC K15M and HPMC K100M were also added in respective batch in different concentration. Methyl Paraben and Propyl Paraben were dissolved in 9:1 ratio in purified water in sufficient quantity along with aspartame. These solutions were mixed with above solution. The resulting alginate in situ gel solution containing Ofloxacin was checked for lag time, viscosity and gelling property. In the preliminary batches P1 to P15 the concentration of Aspartame, preservatives and Trisodium citrate were kept constant at 0.5, 0.2, and 0.5% respectively.

chaniyara et al__________________________________________________ISSN-2321-547X
AJADD[1][3][2013]285-299
Dose calculation Total dose = loading dose
(immediate) + maintenance dose (sustained) = 170mg + 640mg = 810mg
Now, 810mg dose is given in 1 table spoonful (i.e. 15ml). So, for 50ml solution 50*810/15 = 2700mg ofloxacin required. [loading dose was calculated by IR = Css× Vd / F formula while maintenance dose was calculated by MD = IR (1+0.693× t/t1/2) formula.]
Determination of drug & its compatibility with excipients 1) IR Spectroscopy
The Infra red spectroscopy of the sample was carried out to ascertain identity of the drug. A pellet of approximately 1mm diameter of each drug was prepared by compressing 3-5mg of the drug with 100-150mg of potassium bromide in KBr press (Model M-15, Techno Search Instruments). The pellet was mounted in IR compartment and scanned between wave number 4000–600cm-1 using a Shimadzu Model 8400 FTIR. 2) Drug-Excipients Compatibility Study
FTIR absorption spectra of pure drug and physical mixture were recorded in range of 4000 – 400 cm-1 by KBr disc method using FTIR spectrophotometer. EVALUATION PARAMETER OF IN SITU FLOATIG GEL pH
The pH was measured of in situ solutions of ofloxacin using a calibrated digital pH meter at 25°C. All measurements of pH were made in triplicate.
In-vitro floating study
Floating study was carried out in 500 ml of 0.1 N HCl (pH 1.2) in a beaker. Accurately measured 10 ml of solution was added to HCl. Time requires for immersed on
surface after adding solution (floating lag time) and total floating time were measured.
Viscosity measurement of in situ gels
Viscosity of the in situ gelling solution was determined with a Brookfield viscometer (Model no RVT 6513476) using a 20 ml aliquot of the sample. Measurements were performed using spindle number 2 and the temperature was maintained at 25±10C. All measurements were made in triplicate.
In vitro gelation study
To evaluate formulation for their gelling capacity by visual method, coloured solution of in situ gel was prepared. The gelling capacity was measured by placing 5 ml of gelation solution (0.1 N HCl, pH 1.2) in test tube and maintained at 37±10C. One ml of coloured solution was added with pipette. The formulation was transferred in such a way that places pipette at surface of fluid in test tube and formulation was slowly released from pipette. As solution comes in contact with gelation solution, it was immediately converted into stiff gel like structure. The gelling capacity was evaluated on basis of stiffness of formed gel and time period for which formed gel remained as such. The gelling capacity was graded in 3 categories on basis of gelation time and time period for which formed gel remain as such. + = gels after few minutes, dispersed rapidly ++ = gelation immediate remains for few hour +++ = gelation immediate remains for an extended period. Determination of drug content
Accurately, 1ml of in situ gelling solution (equivalent to 54mg of ofloxacin) was added to 53ml of purified water to yield solution containing strength of 1000µg/ml. From that 5µg/ml solution was prepared by diluting stock solution. The UV absorbance of the sample was determined at a wavelength of 294nm.

chaniyara et al__________________________________________________ISSN-2321-547X
AJADD[1][3][2013]285-299
Swelling Index A gel of 100mg was weighed
accurately (W1). It was kept in a petri dish and 50ml of 0.1 N HCl was added. The petri dish was kept aside for 16 hrs. The weight of swollen matrix gel (W2) was measured and swelling index was calculated using following formulae:
Where, W1 = initial weight of gel (100mg)
W2 = weight of swollen matrix after 16 hrs.
In vitro drug release study The release rate of ofloxacin was
determined using USP apparatus 1 (basket covered with muslin cloth/cellophane paper) at 50 rpm. This speed slow enough to avoid breaking of gelled formulation and was maintaining mild agitation condition exist in vivo. The dissolution medium used was 900ml of 0.1 N HCl and temperature was maintained at 370C. A sample was withdrawn at 0.5,1,2,3,4,6,8,10,12,14 and 16 hrs of dissolution. The sample was analysed and % cumulative release was calculated. Stability study
Accelerated stability testing of promising formulation was performed as per International Conference on Harmonization (ICH) guidelines. The optimized formulation (F5) was stored at 40±20C/75±5% RH in Temperature/ Humidity Control Chamber for a period of 1 months. The chemical stability was analyzed by percentage drug release. The samples were withdrawn after 1 month and the was analyzed spectrophotometrically at 294nm. RESULT & DISCUSSION
Justification for selection of promising batch (p13)
Sodium alginate at 1% concentration, it formed stiff gel. Below 1%, gel was formed but rupture. HPMC-K15M formed viscous solution at 0.5% concentration. HPMC-K100M formed non-pourable solution at 0.5% concentration. HPMC-K4M at low concentration (0.5%) gave moderately viscous solution along with enough gel strength. Sodium bicarbonate showed dosage form dumping & gel shows fragmentation within 4-5 hr. Calcium carbonate at low concentration (<1%) showed poor cross-linking due to insufficient concentration of Calcium ions.
Here, in batches P1, P2 and P3 gel was formed but it was rupture and showed fragmentation in 2-3 hrs due to poor cross linking of sodium ion due to low concentration of sodium bicarbonate. While in case of batches P4, P5 and P6 solution were highly viscous due to HPMC K15M. At the same time batches P7 and P8 were non-pourable due to HPMC K100M. Dissolution studies were performed only for P6, P7 and P8 batches. In case of batches from P9 to P12, gel were formed and remained intake for 7-8 hrs with floating lag time ranges from 30-90 seconds. Batch P13 was taken as a promising batch. The reason was that it remained intake for >16 hrs and it had optimum viscosity along with sufficient gel capacity. Concentration of sodium alginate was optimized at 1% and HPMC K 4M was optimized at 0.5%. Among all these batches (from P1 to P15), batch 13 had optimum viscosity and it has enough gel capacity. P13 showed maximum drug release in 16 hrs among selected batches. So, on bases of these evaluation parameters and release profile, P13 had been selected as promising batch. Comparison of dissolution of preliminary batches
See fig. 3 & Table 7.

chaniyara et al__________________________________________________ISSN-2321-547X
AJADD[1][3][2013]285-299
Comparison of dissolution of factorial Design batches
Here, batch F1, F2 and F3 formed gel and it remained intake upto 8 hrs due to slightly low concentration of sodium alginate. Hence, dissolution of these batches was not taken. Batch F5 gives maximum % release of drug in 16 hrs. F4 releases more than 90% of drug but only for 10-11 hrs. F9 showed 85% release in 16 hrs due to slightly higher amount of Sodium alginate and calcium carbonate. So, F5 considered as optimized batch in suitable time period. Statistical analysis of data A full factorial 32 design was used for
optimization procedure. This study investigated utility of a 2-factor, 3-level design and optimization process. The studied factors (independent variables) were concentration of sodium alginate (X1) and concentration of calcium carbonate (X2). Preliminary studies provided a setting of the levels for each formulation variable. The response (Y) (dependent variables) studied were viscosity and % drug release at 10 hrs (Q10). The factorial formulations were coded as F1 to F9.
A statistical model incorporating interactive and polynomial term was used to evaluate the response
Y = β0 + β1X1+ β2X2 + β12X1X2 + β11X12 + β22X22
Where, Y is the dependent variables, β0 is the arithmetic mean response of the nine runs, and β1 is the estimated coefficient for the factor β1. The main effects (X1 and X2) represent the average result of changing one factor at a time from its low to high value. The interaction terms (X1X2) show how the response changes when two factors are simultaneously changed. The polynomial terms (X12and X22) are included to investigate non-linearity.
From the data of viscosity, a polynomial equation for full model was derived as shown below:
Y1 = 233.7756 + 48.11X1 + 31.22167X2 – 1.335X1X2 – 0.3333X12 + 6.331667X22
Equation gives positive value of X1 and X2 which indicates X1 and X2 have positive effect on viscosity. From regression analysis for viscosity, it was shown that only effect of X1 and X2 are significant. So polynomial equation has reduced form as shown in equation below:
Y1 = 233.7756 + 48.11X1 + 31.22167X2
From the data of Q10, a polynomial equation for full model was derived as shown below:
Y2 = 78.27778 + 33.00833X1 – 5.15333X2 – 3.5325X1X2 – 47.6917X12 + 3.63333X22
Equation gives positive value of X1 which indicates X1 have positive effect on Q10 i.e. drug release in 10 hrs. From regression analysis for Q10, it was shown that only effect of X1 and X12 are significant. So polynomial equation has reduced form as shown in equation below:
Y2 = 78.27778 + 33.00833X1 - 47.6917X12 Photoes of In-situ gel
See fig. 5,6.
Conclusion
Ofloxacin was successfully formulated as a floatable in-situ gel for delivery of drug into gastric region for 16 hrs. The floating lag time decreases as concentration of calcium carbonate increases and viscosity increases with increases in concentration of sodium alginate and HPMC K4M. The optimized formulation (F5 of factorial batch i.e. 1.0 % sodium alginate, 0.5% HPMC K4M and 1.5% calcium

chaniyara et al__________________________________________________ISSN-2321-547X
AJADD[1][3][2013]285-299
carbonate) showed moderate viscosity along with sufficient gel strength. >95.0% drug release achieved at the end of 16.0 hrs. Drug release and viscosity could be adjusted by varying concentration of sodium alginate, HPMC K4M and calcium carbonate. The optimized formulation F5 was seen to be stable after 1 month of stability study. The result suggested that developed floating in-situ gel could perform better than conventional dosage form leading to improve efficacy and better patient compliance. REFERENCES 1. Rao UG, Murari P, “Buoyant sustained
release drug delivery systems current potentials advancements role of polymers.” International journal of comprehensive pharmacy. 2012, 3(2), 1-5.
2. Shah S, Upadhyay P, Parikh D, Shah J, “In-situ gel: a novel approach of gastroretentive drug delivery.” Asian journal of biomedical and pharmaceutical sciences. 2012, 2(8), 1-8.
3. Miyazaki S and Kawasaki N, “Comparison of in situ gelling formulations for the oral delivery of cimetidine.” International Journal of Pharmcy. 2001, 220, 161–168.
4. Rajnikanth PS, Mishra B, “Development and evaluation of a novel floating in situ gelling system of amoxicillin for eradication of H. pylori.” International Journal of Pharmaceutics. 2007, 335, 114–122.
5. Rajinikanth PS, Mishra B, “Floating in situ gelling system for stomach site-specific delivery of clarithromycin to eradicate H. pylori.” Journal of controlled release.2008, 125, 33–41.
6. Patel RP, Dadhani B, Ladani R, Baria AH, Patel J, “Formulation, evaluation and optimization of stomach specific in
situ gel of clarithromycin and metronidazole benzoate.” International journal of drug delivery. 2010, 2, 141-153.
7. Watarukubo, Miyazaki S, Attwood D, “Oral sustained delivery of paracetamole from in-situ gelling gellan and sodium alginate formulation.” International journal of pharmaceutics. 2003, 258, 55-64.
8. Watarukubo, Miyazaki S, Attwood D, “Oral sustained delivery of ambroxol from in-situ gelling pectin formulation.” International journal of pharmaceutics. 2004, 271, 233-240.
9. Patel RP, Baria AH, Pandya NB, “Stomach-specific drug delivery of famotidine using floating alginate beads.” International journal of pharmatech research. 2009, 1(2), 288-291.
10. Wamorkar V, Varma MM and Manjunath SY, “Formulation and evaluation of stomach specific in-situ gel of metoclopramide using natural, bio-degradable polymers.” International journal of research in pharmaceutical and biomedical Sciences. 2011, 2 (1), 193-201.
11. Debnath S, NiranjanBabu M, Kusuma G, Saraswathi K, Sramika NR, Reddy AK, “Formulation and evaluation of floatable in situ gel as carrier for stomach-specific drug delivery of metaclopramide HCl.” International journal of pharmceutical research, 2011, 1(1), 53-56.
12. Patel DM, Patel DK, Patel CN, “Formulation and evaluation of floating oral in situ gelling system of amoxicillin.” ISRN-2011, article ID 276250, 1-8
13. Patil P, Rao SB, Kulkarni SV, Surpur C and Anand A, “Formulation and in vitro evaluation of floating matrix tablets of ofloxacin.” Asian journal of research

chaniyara et al__________________________________________________ISSN-2321-547X
AJADD[1][3][2013]285-299
pharmaceutical science. 2011, 1(1), 17-22.
14. Kumaria V, Muruganandhamb V, “Formulation, development & characterization of ofloxacin microspheres.” Indo Global journal of Pharmaceutical science. 2012, 2(2), 130-141.
15. Padmavathy J, Saravanan D, Rajesh D, “Formulation and evaluation of ofloxacin floating tablets using hpmc.” International journal of pharmacy & pharmaceutical science. 2011, 3(1), 170-173.
16. Reddy P, Bajjuri S, Sanka K, Ajmeru RK, “Formulation and evaluation of gastroretentive dosage form of ofloxacin.” Stamford journal of pharmaceutical science. 2011, 4(1), 9-18.
17. Malik K, Arora G, Singh I, “Taste masked microspheres of ofloxacin:
formulation and evaluation of orodispersible tablets.” Scientia pharamaceutica. 2011, 79, 653-672.
18. Sreenivas SA, Hiremath SP and Godbole AM, “ Ofloxacin ocular inserts: design, formulation and evaluation.” Iranian journal of pharmacology & therapeutics. 2006, 5(2), 159-162.
19. Sahoo S, Chakraborti CK, Nanda U, Naik S, Mishra S, “Analytical characterization of controlled release ofloxacin /carbopol 934 mucoadhesive polymeric suspension.” International journal of pharma and bio Sciences. 2011, 2(2), 350-364
20. De PK, Sahana B, Rakshit S, “Enhancement of dissolution rate and stability study of ofloxacin solid dispersion.” Der Pharmacia Sinica. 2011, 2 (5), 169-181.
Table 1. List of equipments used in present investigation
EQUIPMENTS MODEL/COMPANY
Digital weighing balance Shimadzu-AUX220 UV-spectrophotometer Shimadzu-1800
Mechanical stirrer DBK- instruments IR spectrophotometer Shimadzu 8400
Dissolution test apparatus Electrolab TDT-081 Brookfield viscometer RVT-6513476
chaniyara et al__________________________________________________ISSN-2321-547X
AJADD[1][3][2013]285-299
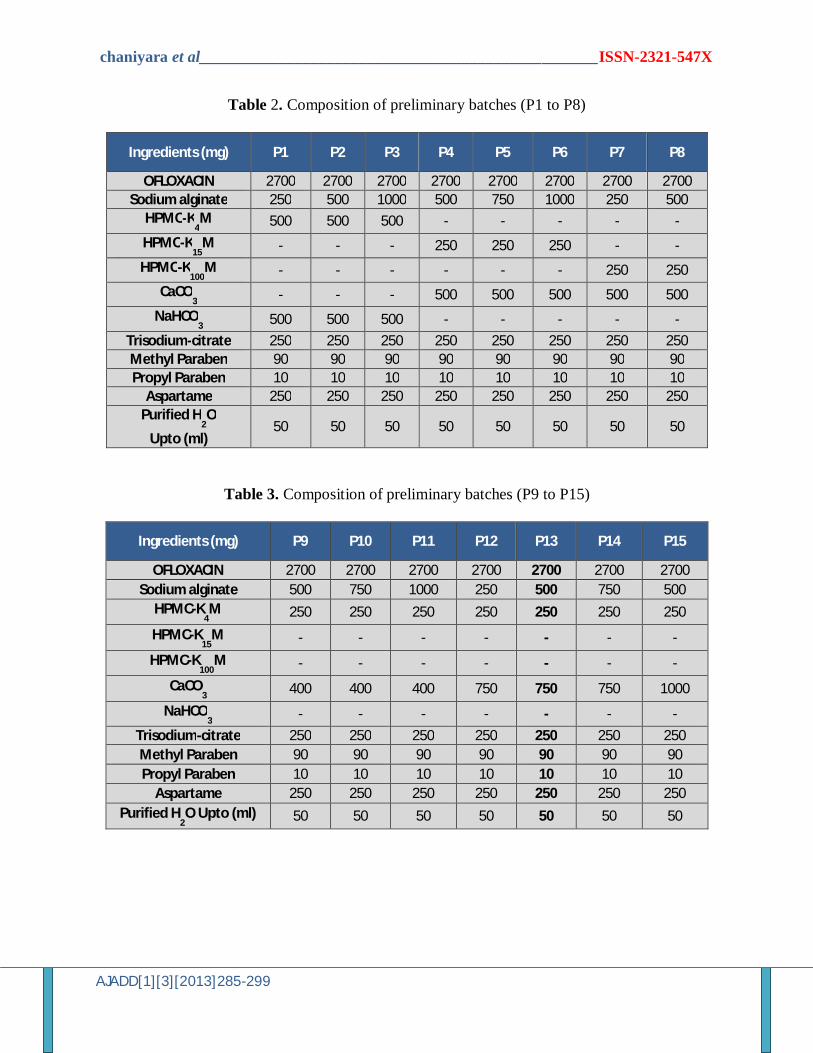
Table 2. Composition of preliminary batches (P1 to P8)
Ingredients (mg) P1 P2 P3 P4 P5 P6 P7 P8
OFLOXACIN 2700 2700 2700 2700 2700 2700 2700 2700 Sodium alginate 250 500 1000 500 750 1000 250 500
HPMC-K4M 500 500 500 - - - - -
HPMC-K15
M - - - 250 250 250 - -
HPMC-K100
M - - - - - - 250 250
CaCO3 - - - 500 500 500 500 500
NaHCO3 500 500 500 - - - - -
Trisodium-citrate 250 250 250 250 250 250 250 250 Methyl Paraben 90 90 90 90 90 90 90 90 Propyl Paraben 10 10 10 10 10 10 10 10
Aspartame 250 250 250 250 250 250 250 250 Purified H
2O
Upto (ml) 50 50 50 50 50 50 50 50
Table 3. Composition of preliminary batches (P9 to P15)
Ingredients (mg) P9 P10 P11 P12 P13 P14 P15
OFLOXACIN 2700 2700 2700 2700 2700 2700 2700 Sodium alginate 500 750 1000 250 500 750 500
HPMC-K4M 250 250 250 250 250 250 250
HPMC-K15
M - - - - - - -
HPMC-K100
M - - - - - - -
CaCO3 400 400 400 750 750 750 1000
NaHCO3 - - - - - - -
Trisodium-citrate 250 250 250 250 250 250 250 Methyl Paraben 90 90 90 90 90 90 90 Propyl Paraben 10 10 10 10 10 10 10
Aspartame 250 250 250 250 250 250 250 Purified H
2O Upto (ml) 50 50 50 50 50 50 50

chaniyara et al__________________________________________________ISSN-2321-547X
AJADD[1][3][2013]285-299
Table 4. Composition of 32 factorial design batches
Ingredients (mg) F1 F2 F3 F4 F5 F6 F7 F8 F9
Ofloxacin 2700 2700 2700 2700 2700 2700 2700 2700 2700 Sodium alginate 350 350 350 500 500 500 650 650 650
HPMC-K4M 250 250 250 250 250 250 250 250 250
CaCO3 600 750 900 600 750 900 600 750 900
Trisodium-citrate 250 250 250 250 250 250 250 250 250 Methyl Paraben 90 90 90 90 90 90 90 90 90 Propyl Paraben 10 10 10 10 10 10 10 10 10
Aspartame 250 250 250 250 250 250 250 250 250 Purified H
2O Upto (ml) 50 50 50 50 50 50 50 50 50
Table 5. Evaluation parameter of preliminary batches P1 to P8
Evaluation Parameter
P1 P2 P3 P4 P5 P6 P7 P8
Lag time (sec)
55.66± 2.51
78.33 ± 2.516
112.3± 2.516
65.66 ± 2.309
87.33 ± 2.081
107.6 ± 6.658
79.0 ± 1.732
102.3± 6.027
pH 7.13± 0.057
7.03 ± 0.057
6.86 ± 0.057
6.96 ± 0.057
7.13 ± 0.057
7.16 ± 0.057
7.23 ± 0.057
7.26± 0.057
Gelling time (min)
3.33± 0.152
2.33± 0.208
2.43± 0.208
9.66± 0.057
7.46± 0.208
6.70± 0.173
7.63 ± 0.152
6.26 ± 0.057
Gel capacity + + + + + + + + + + + + + + + + +
Viscosity (cp)
78.0± 2.00
92.66 ± 1.154
134.6 ± 3.055
253.3 ± 3.055
284.6 ± 3.055
324.0 ± 3.464
421.6±2.886
470.0 ± 5.00
Total Floating Time (hr)
<3 <3 <5 <8 <8 >16 >16 > 16
Swelling index
(% at 16 hr)
34.69± 3.11
47.98 ± 2.647
62.80 ± 3.601
42.02 ± 2.245
55.22 ± 2.557
65.51 ± 1.992
59.77±1.651
77.5 ± 3.330
Drug content (%)
83.59± 4.36
83.42± 4.348
93.3± 1.773
89.56 ± 0.807
103.1 ± 4.497
93.13 ± 2.127
95.96 ±2.543
108.7±3.820
Dissolution (%CR upto )
- - - - - 79.87
(16 hr) 64.64 (16
hr) 61.36 (16 hr)

chaniyara et al__________________________________________________ISSN-2321-547X
AJADD[1][3][2013]285-299
Table 6. Evaluation parameter of preliminary batches P9 to P15
Evaluation Parameter
P9 P10 P11 P12 P13 P14 P15
Lag time (sec)
65.66 ± 2.081
80.66 ± 2.56
86.66 ± 4.59
35.33 ± 1.57
56.0 ± 2.65
72.66 ± 3.24
48.66 ± 2.309
pH 7.13± 0.057
7.00± 0.07
6.93 ± 0.07
7.23 ± 0.07
7.36 ± 0.07
7.40 ± 0.07
7.46 ± 0.057
Gelling time (min)
9.73 ± 0.152
8.56 ± 0.28
7.93 ± 0.12
12.46 ± 0.28
10.26 ± 0.12
8.96 ± 0.28
9.96 ± 0.152
Gel capacity ++ ++ ++ ++ +++ +++ +++
Viscosity (cp)
106.0 ± 3.464
122.6 ± 1.14
134.6 ± 3.05
201.3 ± 2.39
241.3 ± 3.05
272.0 ± 2.00
265.3 ± 1.154
TFT (hr) <8 <8 <8 <8 >16 >16 >16
Swelling index (% at 16 hr)
43.09 ± 1.842
58.72 ± 1.94
71.79 ± 3.25
28.41 ± 2.73
43.54 ± 2.51
61.44 ± 1.73
48.58 ± 1.887
Drug content (%) 96.32 ± 2.607
83.58 ± 2.81
87.74 ± 1.78
92.93 ± 0.55
98.62 ± 2.17
93.01 ± 1.92
85.28 ± 1.392
Dissolution (%CR upto )
- - - - 94.72 (16
hr) 88.82
(16 hr) 90.62 (16 hr)

chaniyara et al__________________________________________________ISSN-2321-547X
AJADD[1][3][2013]285-299
Table 7. Evaluation parameter of Factorial Design Batches
Evaluation Parameter
F1 F2 F3 F4 F5 F6 F7 F8 F9
Lag time (sec)
80.0 ± 3.605
58.3 ± 2.516
40.3 ± 4.725
86.0 ± 4.00
53.0± 2.645
44.3 ± 3.214
86.3 ± 4.932
57.3 ± 4.041
46.6 ± 4.725
pH 7.26 ± 0.057
7.43 ± 0.057
7.66 ± 0.057
7.16 ± 0.057
7.43 ± 0.057
7.56 ± 0.057
6.96 ± 0.057
7.10 ± 1.087
7.26 ± 0.057
Gelling time (min)
12.50± 0.26
11.86± 0.208
10.86± 0.208
11.16± 0.057
10.2 ± 0.057
9.90 ± 0.173
9.13 ± 0.115
8.66 ± 0.152
8.10± 0.200
Gel capacity ++ ++ ++ ++ +++ +++ +++ +++ +++
Viscosity (cp)
161.3 ± 1.15
185.3 ± 3.05
222.0 ± 2.00
205.3 ± 3.05
232.0± 2.00
276.6 ± 1.15
259.3 ± 2.30
283.3± 1.15
314.6± 3.05
Total Floating Time (hr)
<8 <8 <8 <12 >16 >16 >16 >16 >16
Swelling index (% at 16 hr)
32.89± 1.60
37.56± 4.206
41.72± 0.620
44.38± 1.818
48.2 ± 1.550
53.9 ± 1.899
53.95± 2.767
58.3 ± 1.355
60.7 ± 1.831
Drug content (%) 86.82±
1.51 103.8± 3.825
95.11± 1.877
89.09± 2.123
97.8 ± 0.767
93.5± 2.078
105.5± 2.754
83.7 ± 2.154
95.5 ± 3.690
Dissolution (%CR of 16 hr)
- - - 93.72
(10 hr) 97.84 94.64 93.52 90.22 85.80
Table 8. Regression analysis of viscosity (Y1)
Regression statistics
Multiple R 0.998272 R square 0.996546
Adjusted R square 0.990791 Standard error 4.785369
Coefficients P value β0 = + 233.7756 7.83E – 06 β1 = + 48.11 0.000147
β2 = + 31.22167 0.000533 β12 = -1.335 0.61581 β1
2 = -0.3333 0.927741 β2
2 = +6.331667 0.158067

chaniyara et al__________________________________________________ISSN-2321-547X
AJADD[1][3][2013]285-299
Table 9. Regression analysis of Q10 (Y2)
Table 10. Summary of results of regression analysis
Viscosity
Response β0 β1 β2 β12 β12 β2
2
FM 233.7756 48.11 P=0.000147
31.221 P=0.000533 - 1.335 - 0.3333 6.3316
RM 233.7756 48.11 31.221 - - -
%Q10
Response β0 β1 β2 β12 β12 β2
2
FM 78.27778 33.00833 P=0.001288 - 5.1533 -
3.5325 - 47.6917
P=0.002195 3.63333
RM 78.27778 33.00833 - - - 47.6917
Regression statistics
Multiple R 0.993902 R square 0.98784
Adjusted R square 0.967574 Standard error 6.815843
Coefficients P value β0 = + 233.7756 0.000594 β1 = + 48.11 0.001288
β2 = + 31.22167 0.161102 β12 = -1.335 0.376161 β1
2 = -0.3333 0.002195 β2
2 = +6.331667 0.505697
chaniyara et al__________________________________________________ISSN-2321-547X
AJADD[1][3][2013]285-299
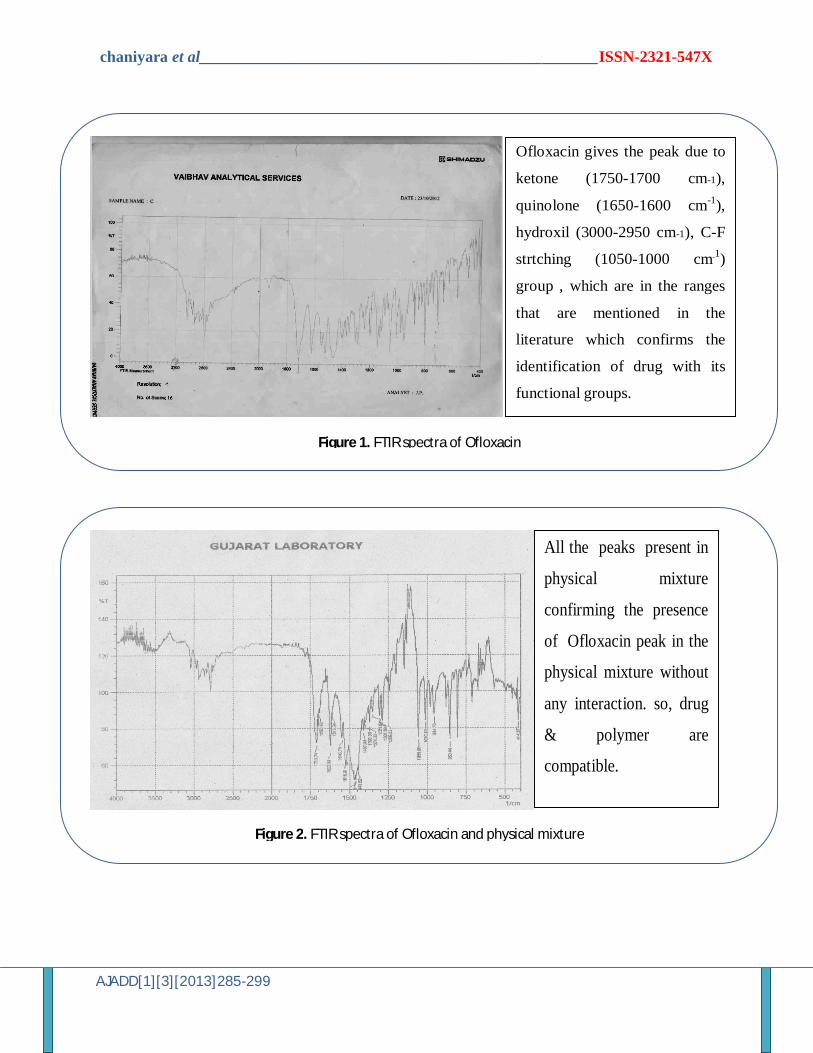
Figure 1. FTIR spectra of Ofloxacin
Ofloxacin gives the peak due to
ketone (1750-1700 cm-1),
quinolone (1650-1600 cm-1),
hydroxil (3000-2950 cm-1), C-F
strtching (1050-1000 cm-1)
group , which are in the ranges
that are mentioned in the
literature which confirms the
identification of drug with its
functional groups.
Figure 2. FTIR spectra of Ofloxacin and physical mixture
All the peaks present in
physical mixture
confirming the presence
of Ofloxacin peak in the
physical mixture without
any interaction. so, drug
& polymer are
compatible.

chaniyara et al__________________________________________________ISSN-2321-547X
AJADD[1][3][2013]285-299
Figure 3. Comparison of release profile of selected batches
0
10
20
30
40
50
60
70
80
90
100
0 2 4 6 8 10 12 14 16 18
C. P
. R.
TIME (hr)
F6
F7
F8
F13
F14
F15
Figure 4. Comparison of release profile of factorial batches
0
20
40
60
80
100
120
0 2 4 6 8 10 12 14 16 18
C. P
. R.
TIME (hr)
F4
F5
F6
F7
F8
F9

chaniyara et al__________________________________________________ISSN-2321-547X
AJADD[1][3][2013]285-299
Figure 5. Immersion of floating in-situ gel towards interface
Figure 6. Top view of floating in-situ gel after 2 hrs