Formula SAE Electric Drive Control - University of Akron SAE Electric Drive Control Project Design...
47
Formula SAE Electric Drive Control Project Design Report Design Team 05 Nick Gatta Alex Klein Alex Spickard Tyler Zoner Faculty Advisor: Dr. Sozer November 15, 2012
Transcript of Formula SAE Electric Drive Control - University of Akron SAE Electric Drive Control Project Design...

Formula SAE Electric Drive Control
Project Design Report
Design Team 05
Nick Gatta
Alex Klein
Alex Spickard
Tyler Zoner
Faculty Advisor: Dr. Sozer
November 15, 2012
i
Table of Contents
Table of Figures .................................................................................................................. ii
List of Tables ..................................................................................................................... iii
Problem Statement .............................................................................................................. 1
Need ................................................................................................................................ 1
Objective ......................................................................................................................... 1
Background ..................................................................................................................... 1
Marketing Requirements ................................................................................................. 2
Objective Tree ................................................................................................................. 3
Design Requirement Specification ..................................................................................... 4
Accepted Technical Design ................................................................................................ 6
Sensors ............................................................................................................................ 6
Hardware Design ............................................................................................................. 6
Hardware Design ........................................................................................................... 11
Hardware Schematic ..................................................................................................... 15
Motor and Battery Sizing .............................................................................................. 16
Sensor Calculation ......................................................................................................... 22
Wiring System ............................................................................................................... 23
Software Design ............................................................................................................ 23
Project Schedules .............................................................................................................. 34
Design Team Information ................................................................................................. 36
References ......................................................................................................................... 37
Appendix ........................................................................................................................... 38
Data Sheets .................................................................................................................... 38
Sensors ....................................................................................................................... 38
Microcontroller .......................................................................................................... 38
MATLAB Simulations for Power Profile ..................................................................... 38
Acceleration Event .................................................................................................... 38
Autocross Event ......................................................................................................... 40
ii
Table of Figures Figure 1: Objective Tree ..................................................................................................... 3 Figure 2: Hardware Level 0 Block Diagram ....................................................................... 7 Figure 3: Hardware Level 1 Block Diagram ....................................................................... 8 Figure 4: Hardware Level 2 Block Diagram ..................................................................... 10 Figure 5: Hardware Level 0 Block Diagram ..................................................................... 11 Figure 6: Hardware Level 1 Block Diagram ..................................................................... 12 Figure 7: Hardware Level 2 Block Diagram ..................................................................... 14 Figure 8 Hardware Schematic ........................................................................................... 15 Figure 9: Graphs of power and acceleration on a 75m acceleration at full throttle. ......... 17 Figure 10: The autocross course from Lincoln, Nebraska event 2012.[5] ........................ 18 Figure 11: The endurance course from Lincoln, Nebraska event 2012[5] ....................... 19 Figure 12: Results of the autocross simulation. ................................................................ 21 Figure 13: Results of the endurance simulation. ............................................................... 21 Figure 14: Software Level 0 Block Diagram .................................................................... 23 Figure 15: Software Level 1 Block Diagram .................................................................... 24 Figure 16: Software Level 2 Block Diagram. ................................................................... 26 Figure 17: The overall software architecture .................................................................... 28 Figure 18: Interrupt flow charts ........................................................................................ 29 Figure 19: Control Logic flow chart ................................................................................. 30 Figure 20: Torque calculation pseudocode ....................................................................... 32

iii
List of Tables Table 1: Engineering Requirements .................................................................................... 5 Table 2: Formula Electric Drive Control hardware Functional requirements .................... 7 Table 3: Microcontroller Module Hardware Functional Requirements ............................. 8 Table 4: Right and Left Motor Controllers Module Hardware Functional Requirements . 8 Table 5: Brake Sensor Module Hardware Functional Requirements ................................. 9 Table 6: Wheel Sensor Module Hardware Functional Requirements ................................ 9 Table 7: Steering Sensor Module Hardware Functional Requirements .............................. 9 Table 8: Throttle Sensor Module Hardware Functional Requirements .............................. 9 Table 9: Safety System Module Hardware Functional Requirements ................................ 9 Table 10: Signal conditioning module Functional requirements ...................................... 10 Table 11: Voltage regulator module functional requirements .......................................... 10 Table 12: Ground fault indicator functional requirements ............................................... 10 Table 13: Safety switches module Functional requirement .............................................. 10 Table 14: Formula Electric Drive Control hardware Functional requirements ................ 11 Table 15: Microcontroller Module Hardware Functional Requirements ......................... 12 Table 16: Right and Left Motor Controller Module Hardware Functional Requirements 12 Table 17: Brake Sensor Module Hardware Functional Requirements ............................. 13 Table 18: Wheel Sensor Module Hardware Functional Requirements ............................ 13 Table 19: Steering Sensor Module Hardware Functional Requirements .......................... 13 Table 20: Throttle Sensor Module Hardware Functional Requirements .......................... 13 Table 21: Safety System Module Hardware Functional Requirements ............................ 13 Table 22: Signal conditioning module Functional requirements ...................................... 14 Table 23: Voltage regulator module Functional requirements ......................................... 14 Table 24: Ground fault indicator Functional requirements ............................................... 14 Table 25: Safety switches module Functional requirement .............................................. 14 Table 26: Formula Electric Drive Control software Functional requirements ................. 23 Table 27: Drive Control Module software Functional requirements ................................ 25 Table 28: Input signal filtering and processing module Functional requirements ............ 25 Table 29: Output signal processing module Functional requirements .............................. 25 Table 30: Driver display module Functional requirements .............................................. 25 Table 31: BMS communication module Functional requirements ................................... 25 Table 32: Drive Control Module Functional requirements ............................................... 27 Table 33: Input Signal Processing Module ....................................................................... 27 Table 34: Output Signal Processing Module Functional requirements ............................ 27 Table 35: Driver Display Module Functional requirements ............................................. 27 Table 36: BMS Communication Module Functional requirements .................................. 27 Table 37: Final Design Gantt ............................................................................................ 34 Table 38: Proposed Implementation Gantt Chart ............................................................. 35
1
Abstract The Formula SAE Electric Vehicle requires a functioning drive control system. The drive control system uses sensors to convert inputs from the driver into torque outputs for the motor controller that will ensure the vehicle moves quickly, easily, comfortable, and safely.
Problem Statement
Need
In this project, a drive control system for an electric racecar is needed. This drive control system must enable a driver to be competitive on the racetrack in both speed and efficiency. It must also meet all requirements of the Formula SAE Electric rules and regulations. Adherence to these rules ensures that the vehicle is safe, and is required to foster fair competition.
Objective
Our objective is to create a drive control system that can compete strongly against those from the competing teams. It must also complement the battery management system created by our fellow ECE students, and the rest of the car created by the Mechanical Engineering teams. The drive control system should convert inputs from the driver into outputs for motors and the battery system to enable the driver to race quickly, easily, comfortably, and safely.
Background
Formula SAE is a design competition for undergraduate and graduate university students organized by the Society of Automotive Engineers. Formula Electric is a class that requires students to design and build a small, formula style, electric, autocross vehicle. Cars are judged over the course of three days in a number of static and dynamic events including: technical inspection, cost, presentation, design, performance and endurance.
Teams must follow an extensive set of rules and regulations in order to perform in competition. Mechanical and Electrical engineering design teams must work on individual sub systems. Electrical Engineering groups are responsible for Drive Control and Battery Management.
Electric cars have been gaining popularity in the last several years. Concerns over the future of our environment have resulted in an increased focus in green technology. With this increased focus, the popularity of electric hybrid vehicles as well as electric vehicles
2
has skyrocketed. As the popularity of electric vehicles increases, pollution rates as well as fossil fuel dependency will decrease. There are a number of useful electric motor qualities that are beneficial in both everyday driving and racing. With the excellent acceleration capabilities of electric motors, and the short distances in racing, electric motors seem to be a good choice for small racecars.
Internal combustion powered vehicles require significant amounts of gearing to effectively transmit power to the wheels of a vehicle. Around 60% of energy is lost in the form of heat in internal combustion engines. Electric vehicles have the option of putting a separate motor on each individual wheel. This eliminates mechanical transmission losses, and reduces weight and volume due to the replacement of the mechanical drivetrain with a single small motor at each wheel.[1] Removal of the mechanical drivetrain eliminates potentially damaging vibrations on the vehicle. An all-electric vehicle is more reliable and nearly silent compared to an internal combustion powered vehicle.
Electric motor vehicles typically have a motor on each rear wheel. This creates a redundancy in the event that a motor is inoperable. An internal combustion engine powered vehicle performs traction control by lowering the engine power and braking on slipping wheels. Control systems allow power to be transferred mechanically to non-slipping wheels so that power is not wasted.
In an electric motor system, each wheel is independently controlled. Slipping is prevented by independent control of the electric motors. Controlling the separate motors enables traction control resulting in superior performance when operating the vehicle.[2] There are several patents in this area that would need to be dealt with if pursued.[3][4]
Marketing Requirements
• Reliable enough to work for races • Durable enough for a race • Inexpensive enough to be marketed towards autocross/track-day racers as per the
scenario in the competition • Comfortable and high-performance enough for autocross/track-day racers • Programmed and designed to be quick enough to win the race while meeting
competition requirements • Capable of regenerative braking to recharge batteries • Capable of providing intelligent power delivery to enable traction control
functionality. • Safe enough for a autocross/track-day racer to be willing and to meet competition
requirements • Efficient enough to meet competition requirements and make good use of
available battery power • Long-lasting enough to complete the competition with available battery power • Must meet all of the rules of the competition

3
Below in figure 1 is the objective tree for our design. The objective tree essentially is a hierarchical representation of our marketing requirements. This allows us to organize our requirements in a way that is easier to understand than being in a list form.
Objective Tree
SAE Formula Electric Car
Efficient Inexpensive and Standardized Parts
Regenerative Braking
Safe
Make Efficient use of Energy
Contains Necessary Safety Kill-
Switches
Warning Light and Sound at StartupTraction Control Compliant with
Competition Rules
High Performance
Powerful Motors with Sufficient Electric Supply
Figure 1: Objective Tree
4
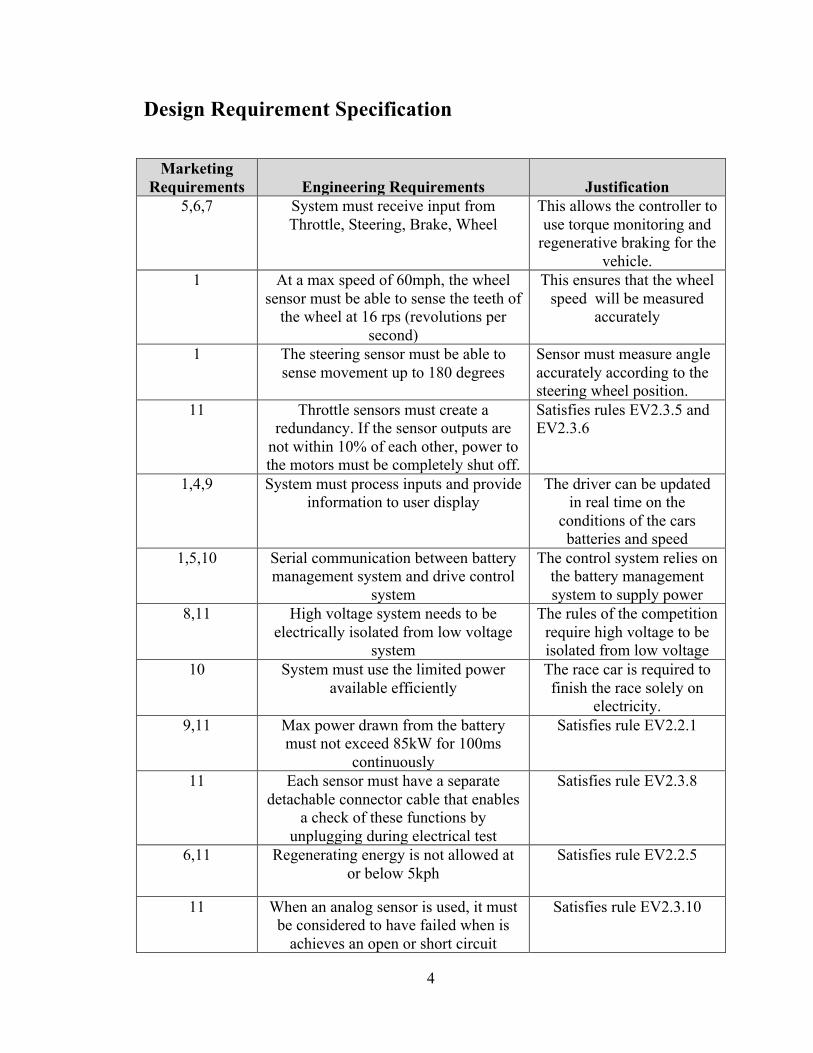
Design Requirement Specification
Marketing Requirements Engineering Requirements Justification
5,6,7 System must receive input from Throttle, Steering, Brake, Wheel
This allows the controller to use torque monitoring and
regenerative braking for the vehicle.
1 At a max speed of 60mph, the wheel sensor must be able to sense the teeth of
the wheel at 16 rps (revolutions per second)
This ensures that the wheel speed will be measured
accurately
1 The steering sensor must be able to sense movement up to 180 degrees
Sensor must measure angle accurately according to the steering wheel position.
11 Throttle sensors must create a redundancy. If the sensor outputs are
not within 10% of each other, power to the motors must be completely shut off.
Satisfies rules EV2.3.5 and EV2.3.6
1,4,9 System must process inputs and provide information to user display
The driver can be updated in real time on the
conditions of the cars batteries and speed
1,5,10 Serial communication between battery management system and drive control
system
The control system relies on the battery management system to supply power
8,11 High voltage system needs to be electrically isolated from low voltage
system
The rules of the competition require high voltage to be isolated from low voltage
10
System must use the limited power available efficiently
The race car is required to finish the race solely on
electricity. 9,11 Max power drawn from the battery
must not exceed 85kW for 100ms continuously
Satisfies rule EV2.2.1
11 Each sensor must have a separate detachable connector cable that enables
a check of these functions by unplugging during electrical test
Satisfies rule EV2.3.8
6,11 Regenerating energy is not allowed at or below 5kph
Satisfies rule EV2.2.5
11 When an analog sensor is used, it must be considered to have failed when is
achieves an open or short circuit
Satisfies rule EV2.3.10
5
condition
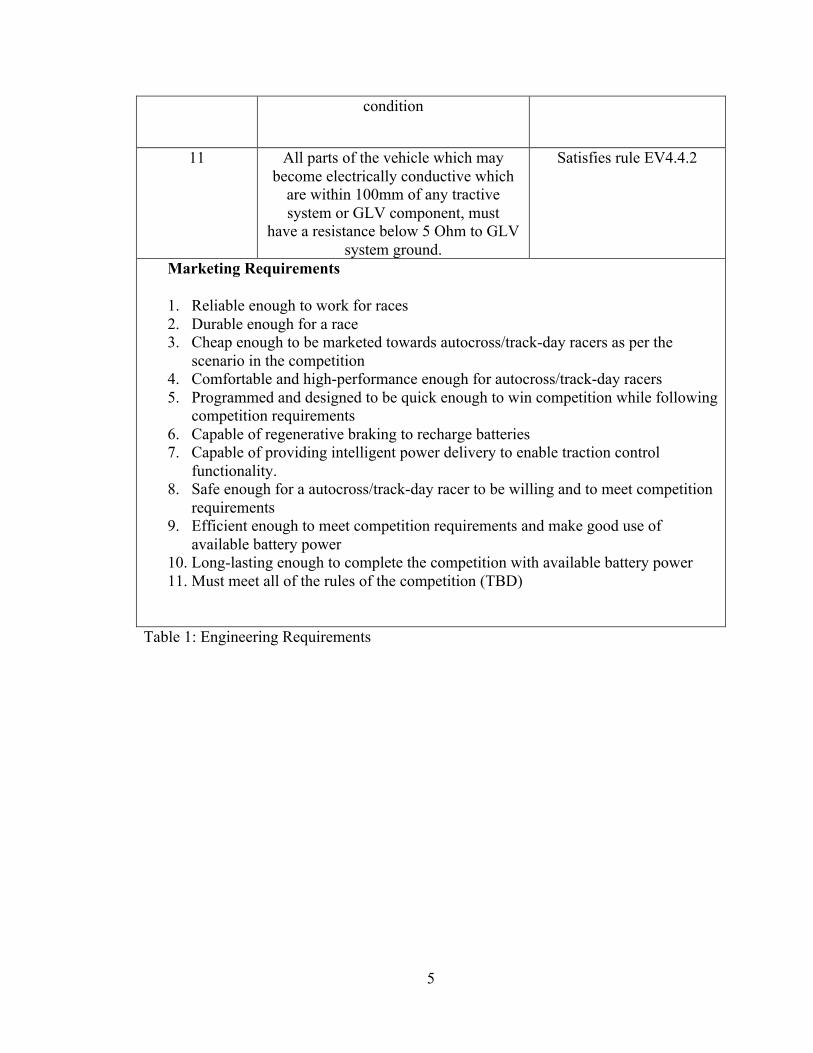
11 All parts of the vehicle which may become electrically conductive which
are within 100mm of any tractive system or GLV component, must
have a resistance below 5 Ohm to GLV system ground.
Satisfies rule EV4.4.2
Marketing Requirements
1. Reliable enough to work for races 2. Durable enough for a race 3. Cheap enough to be marketed towards autocross/track-day racers as per the
scenario in the competition 4. Comfortable and high-performance enough for autocross/track-day racers 5. Programmed and designed to be quick enough to win competition while following
competition requirements 6. Capable of regenerative braking to recharge batteries 7. Capable of providing intelligent power delivery to enable traction control
functionality. 8. Safe enough for a autocross/track-day racer to be willing and to meet competition
requirements 9. Efficient enough to meet competition requirements and make good use of
available battery power 10. Long-lasting enough to complete the competition with available battery power 11. Must meet all of the rules of the competition (TBD)
Table 1: Engineering Requirements
6
Accepted Technical Design
Sensors
The Curtis PB-8 potentiometer will be used in multiple applications in the drive control system. The throttle pedal will have two Curtis potentiometers measuring the position of the pedal. Two potentiometers are required for the throttle pedal in order to create a redundancy. For the drive system to function properly the position measurement from each potentiometer must be within 10% of each other. If the measurement differs more than 10% between the two potentiometers the controller then shuts the motors down. The brake pedal will also be using a potentiometer. Similar to the throttle pedal, the potentiometer will be measuring the position of the pedal and transmit an analog output to the motor controllers. The brake pedal position information will allow the racecar to have regenerative braking. The controllers will be configured for regenerative braking to occur for the range that begins when the car starts to slow down, and ends when the speed is 5kph.
The steering system of the car will also be monitored by a Curtis potentiometer. The shaft at the bottom of the steering system will be connected to the potentiometer. As the user rotates the steering wheel the steering system will turn, rotating the shaft at the bottom. As the shaft rotates, the potentiometer will measure the rotation and again send a 0-5V analog output to the controller. This information will be used for torque vectoring. Torque vectoring is used be analyzing speed and the angle of the wheel to determine which motor needs more power. The difference in motors makes the vehicle more efficient, faster, and ultimately a better vehicle.
The speed of the wheels will be monitored using inductive sensors to provide speed information back to the controller. The Pepperl & Fuchs inductive sensor will be mounted perpendicular to the wheel. The sensor functions by detecting the teeth cut out of the wheel as they pass across the face of the sensor. As the wheel spins the teeth will be counted and the controller will use that information to help monitor the two individual motors. The information will be sent as pulses along the output line to the controller.
To ensure the drive system does not overheat a temperature sensor is require per the given race regulations. The sensor is highly accurate and very reliable. It will be placed on input lines to the motors to regulate their temperature. If the range goes above, or in a very rare case, below the programmed range the system will automatically shutdown to prevent further damage.
Hardware Design
7
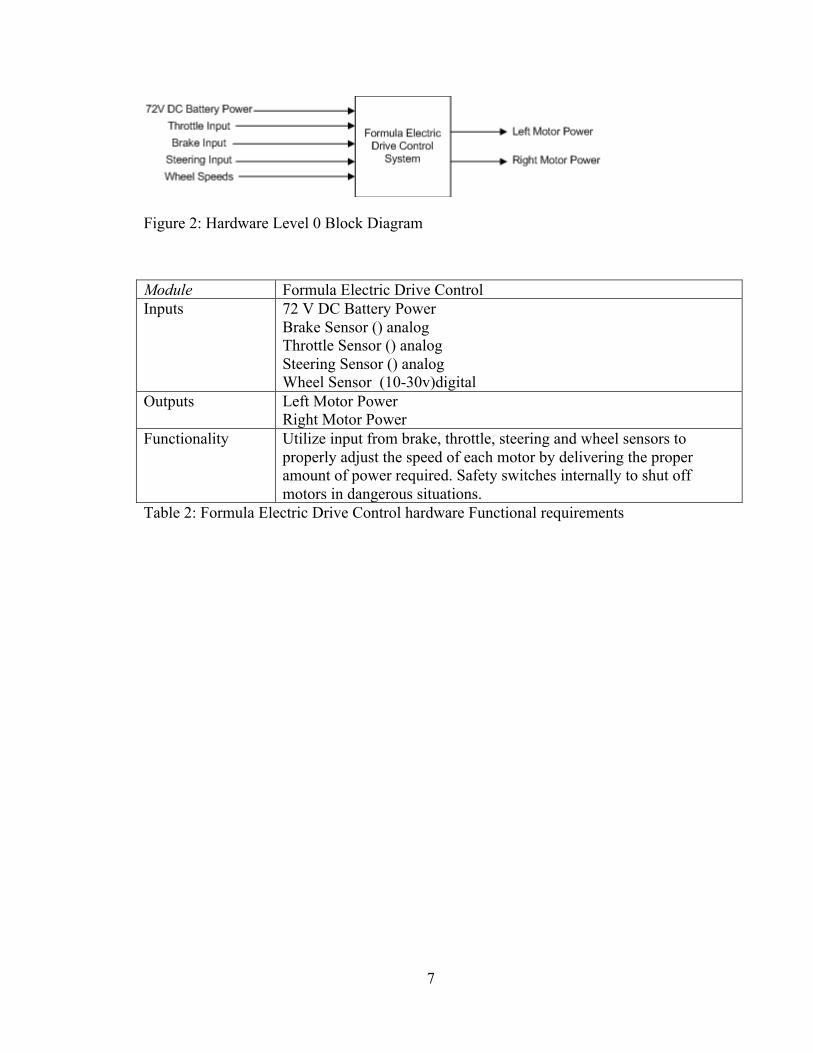
Figure 2: Hardware Level 0 Block Diagram
Module Formula Electric Drive Control Inputs 72 V DC Battery Power
Brake Sensor () analog Throttle Sensor () analog Steering Sensor () analog Wheel Sensor (10-30v)digital
Outputs Left Motor Power Right Motor Power
Functionality Utilize input from brake, throttle, steering and wheel sensors to properly adjust the speed of each motor by delivering the proper amount of power required. Safety switches internally to shut off motors in dangerous situations.
Table 2: Formula Electric Drive Control hardware Functional requirements
8
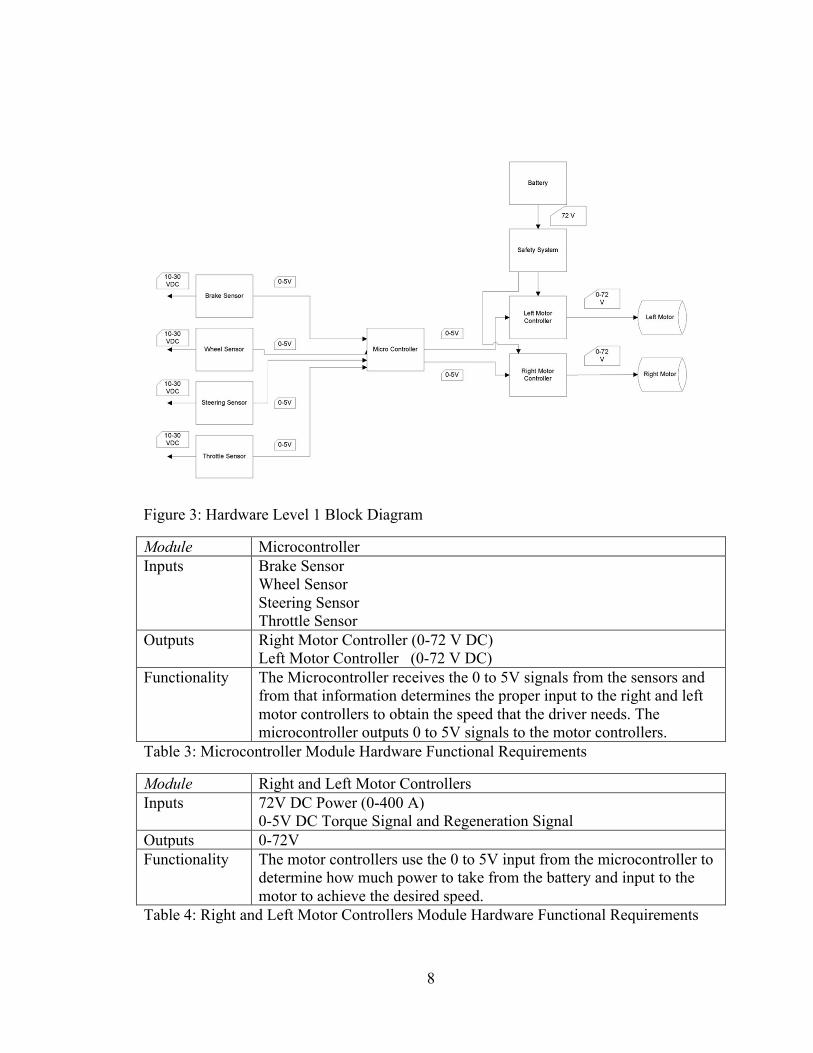
Figure 3: Hardware Level 1 Block Diagram
Module Microcontroller Inputs Brake Sensor
Wheel Sensor Steering Sensor Throttle Sensor
Outputs Right Motor Controller (0-72 V DC) Left Motor Controller (0-72 V DC)
Functionality The Microcontroller receives the 0 to 5V signals from the sensors and from that information determines the proper input to the right and left motor controllers to obtain the speed that the driver needs. The microcontroller outputs 0 to 5V signals to the motor controllers.
Table 3: Microcontroller Module Hardware Functional Requirements
Module Right and Left Motor Controllers Inputs 72V DC Power (0-400 A)
0-5V DC Torque Signal and Regeneration Signal Outputs 0-72V Functionality The motor controllers use the 0 to 5V input from the microcontroller to
determine how much power to take from the battery and input to the motor to achieve the desired speed.
Table 4: Right and Left Motor Controllers Module Hardware Functional Requirements
9
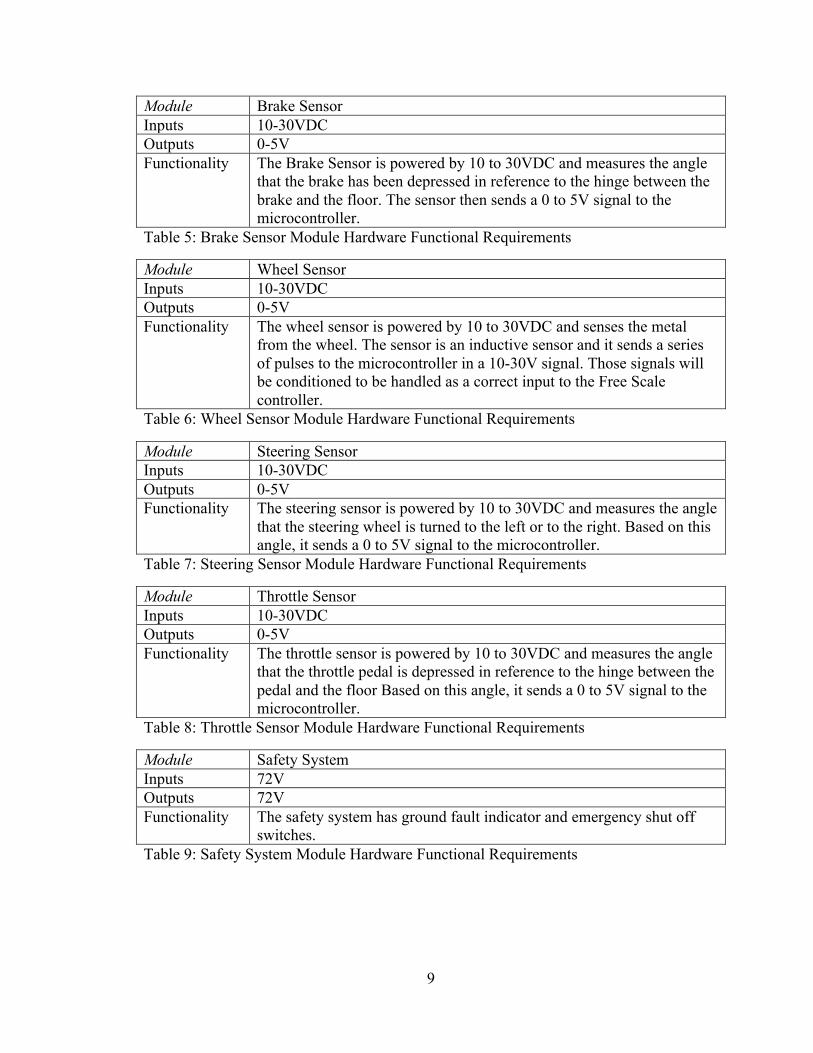
Module Brake Sensor Inputs 10-30VDC Outputs 0-5V Functionality The Brake Sensor is powered by 10 to 30VDC and measures the angle
that the brake has been depressed in reference to the hinge between the brake and the floor. The sensor then sends a 0 to 5V signal to the microcontroller.
Table 5: Brake Sensor Module Hardware Functional Requirements
Module Wheel Sensor Inputs 10-30VDC Outputs 0-5V Functionality The wheel sensor is powered by 10 to 30VDC and senses the metal
from the wheel. The sensor is an inductive sensor and it sends a series of pulses to the microcontroller in a 10-30V signal. Those signals will be conditioned to be handled as a correct input to the Free Scale controller.
Table 6: Wheel Sensor Module Hardware Functional Requirements
Module Steering Sensor Inputs 10-30VDC Outputs 0-5V Functionality The steering sensor is powered by 10 to 30VDC and measures the angle
that the steering wheel is turned to the left or to the right. Based on this angle, it sends a 0 to 5V signal to the microcontroller.
Table 7: Steering Sensor Module Hardware Functional Requirements
Module Throttle Sensor Inputs 10-30VDC Outputs 0-5V Functionality The throttle sensor is powered by 10 to 30VDC and measures the angle
that the throttle pedal is depressed in reference to the hinge between the pedal and the floor Based on this angle, it sends a 0 to 5V signal to the microcontroller.
Table 8: Throttle Sensor Module Hardware Functional Requirements
Module Safety System Inputs 72V Outputs 72V Functionality The safety system has ground fault indicator and emergency shut off
switches. Table 9: Safety System Module Hardware Functional Requirements
10
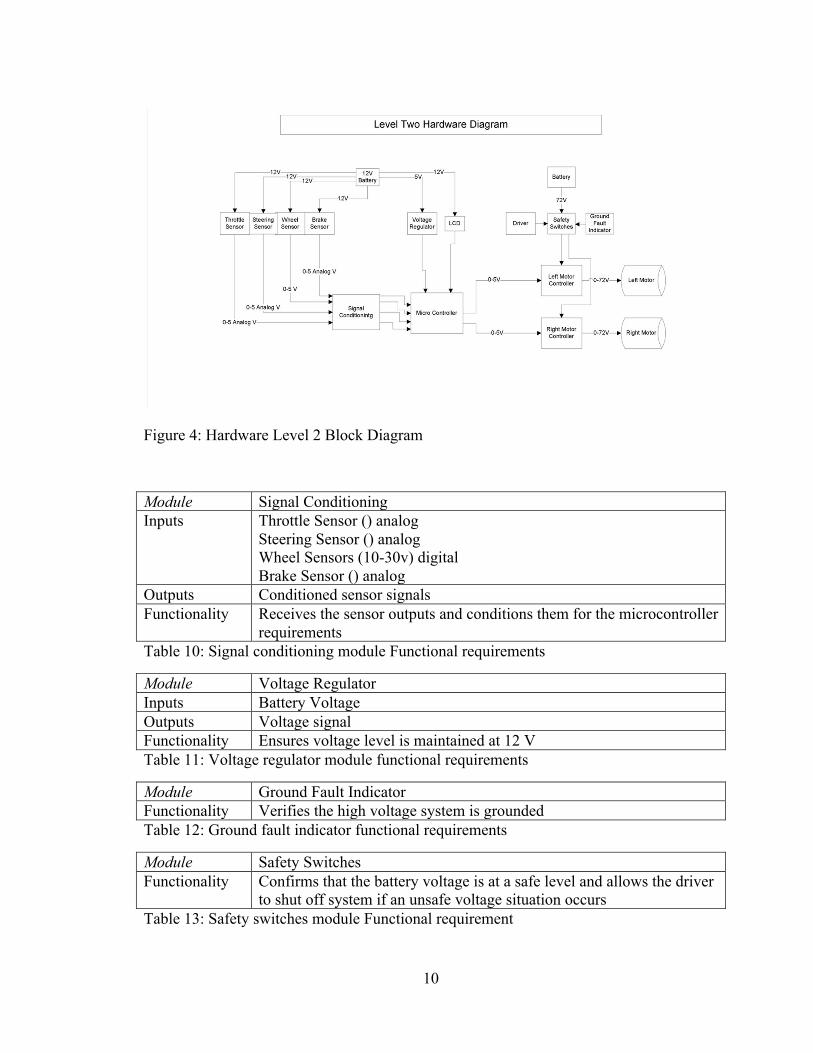
Figure 4: Hardware Level 2 Block Diagram
Module Signal Conditioning Inputs Throttle Sensor () analog
Steering Sensor () analog Wheel Sensors (10-30v) digital Brake Sensor () analog
Outputs Conditioned sensor signals Functionality Receives the sensor outputs and conditions them for the microcontroller
requirements Table 10: Signal conditioning module Functional requirements
Module Voltage Regulator Inputs Battery Voltage Outputs Voltage signal Functionality Ensures voltage level is maintained at 12 V Table 11: Voltage regulator module functional requirements
Module Ground Fault Indicator Functionality Verifies the high voltage system is grounded Table 12: Ground fault indicator functional requirements
Module Safety Switches Functionality Confirms that the battery voltage is at a safe level and allows the driver
to shut off system if an unsafe voltage situation occurs Table 13: Safety switches module Functional requirement

11
Hardware Design
Figure 5: Hardware Level 0 Block Diagram
Module Formula Electric Drive Control Inputs 72 V DC Battery Power
Brake Sensor () analog Throttle Sensor () analog Steering Sensor () analog Wheel Sensor (10-30v)digital
Outputs Left Motor Power Right Motor Power
Functionality Utilize input from brake, throttle, steering and wheel sensors to properly adjust the speed of each motor by delivering the proper amount of power required. Safety switches internally to shut off motors in dangerous situations.
Table 14: Formula Electric Drive Control hardware Functional requirements

12
Figure 6: Hardware Level 1 Block Diagram
Module Microcontroller Inputs Brake Sensor
Wheel Sensor Steering Sensor Throttle Sensor
Outputs Right Motor Controller (0-72 V DC) Left Motor Controller (0-72 V DC)
Functionality The Microcontroller receives the 0 to 5V signals from the sensors and from that information determines the proper input to the right and left motor controllers to obtain the speed that the driver needs. The microcontroller outputs 0 to 5V signals to the motor controllers.
Table 15: Microcontroller Module Hardware Functional Requirements
Module Right and Left Motor Controllers Inputs 72V DC Power (0-400 A)
0-5V DC Torque Signal and Regeneration Signal Outputs 0-72V Functionality The motor controllers use the 0 to 5V input from the microcontroller to
determine how much power to take from the battery and input to the motor to achieve the desired speed.
Table 16: Right and Left Motor Controller Module Hardware Functional Requirements

13
Module Brake Sensor Inputs 10-30VDC Outputs 0-5V Functionality The Brake Sensor is powered by 10 to 30VDC and measures the angle
that the brake has been depressed in reference to the hinge between the brake and the floor. The sensor then sends a 0 to 5V signal to the microcontroller.
Table 17: Brake Sensor Module Hardware Functional Requirements
Module Wheel Sensor Inputs 10-30VDC Outputs 0-5V Functionality The wheel sensor is powered by 10 to 30VDC and senses the metal
from the wheel. The sensor is an inductive sensor and it sends a series of pulses to the microcontroller in a 10-30V signal. Those signals will be conditioned to be handled as a correct input to the Free Scale controller.
Table 18: Wheel Sensor Module Hardware Functional Requirements
Module Steering Sensor Inputs 10-30VDC Outputs 0-5V Functionality The steering sensor is powered by 10 to 30VDC and measures the angle
that the steering wheel is turned to the left or to the right. Based on this angle, it sends a 0 to 5V signal to the microcontroller.
Table 19: Steering Sensor Module Hardware Functional Requirements
Module Throttle Sensor Inputs 10-30VDC Outputs 0-5V Functionality The throttle sensor is powered by 10 to 30VDC and measures the angle
that the throttle pedal is depressed in reference to the hinge between the pedal and the floor Based on this angle, it sends a 0 to 5V signal to the microcontroller.
Table 20: Throttle Sensor Module Hardware Functional Requirements
Module Safety System Inputs 72V Outputs 72V Functionality The safety system has ground fault indicator and emergency shut off
switches. Table 21: Safety System Module Hardware Functional Requirements

14
Figure 7: Hardware Level 2 Block Diagram
Module Signal Conditioning Inputs Throttle Sensor () analog
Steering Sensor () analog Wheel Sensors (10-30v) digital Brake Sensor () analog
Outputs Conditioned sensor signals Functionality Receives the sensor outputs and conditions them for the microcontroller
requirements Table 22: Signal conditioning module Functional requirements
Module Voltage Regulator Inputs Battery Voltage Outputs Voltage signal Functionality Ensures voltage level is maintained at 12 V Table 23: Voltage regulator module Functional requirements
Module Ground Fault Indicator Functionality Verifies the high voltage system is grounded Table 24: Ground fault indicator Functional requirements
Module Safety Switches Functionality Confirms that the battery voltage is at a safe level and allows the driver
to shut off system if an unsafe voltage situation occurs Table 25: Safety switches module Functional requirement

15
Hardware Schematic
In figure 8 is the hardware schematic, particularly the sensors, the microcontroller, and the signal conditioning needed to ensure the circuit will work and microcontroller provides the motor controllers accurate torque values to send to the motors. These components are all part of the low voltage system, which is defined as any voltage below 40Vdc or 25Vac rms. The motor controllers can be considered both a low and high voltage system because they are connected electrically to the batteries, which are above the 40V threshold at 72V.
Figure 8 Hardware Schematic
A 12V battery was selected as the voltage source for the sensors and microcontroller. Since some of the sensors and the microcontroller cannot be powered by a 12V input, a voltage regulator is used to step down the voltage to a 5V input. This voltage can then be used to supply power to the brake sensor, throttle sensors, steering sensor and the microcontroller. The wheel sensors have an input voltage range from 10-30V and can be
Title
Size Document Number Rev
Date: Sheet of
1 1
Formula SAE Hardware Schematic
A
1 1Thursday , Nov ember 15, 2012
POT1
0
POT2
0
V112V
0
0
0
Brake Sensor
Throttle Pedal Sensors
Tower Board
Wheel Sensors
Steering Sensor Right Motor Controller
Left Motor Controller
Four Inductive Sensors
U5
U4
U3
U2 BK(Out)BN(+)
BU(-)
BK(Out)BN(+)
BU(-)
BK(Out)BN(+)
BU(-)
BK(Out)BN(+)
BU(-)
I3I2I1 O1
I4
I6I5
GNDI7
O3O2
O5O4
O7O6
CM
POT3
0
ADC1
ADC3ADC2
ADC4
TD62004P
GPIO4GPIO3GPIO2GPIO1
U6
U1
LM340LA/TO92
IN3
OU
T1
U7
POT4
0
Left Motor Torque Output
Regenerative Braking Output
Right Motor Torque Output
0-5V Regenerative Braking Input
0-5V Regenerative Braking Input
0-5V Input Torque
0-5V Input Torque
5V Input Voltage
GND

16
powered by the 12V battery directly. These sensors pulse a 12V digital voltage signal at the output and this voltage signal needs to be stepped down to a 5V pulse signal to be measured by the microcontroller. A bipolar digital integrated circuit is used at the output of the wheel sensors to attain the voltage step down that is desired. The output of the bipolar digital integrated circuit feeds these 5V digital pulse signals to the microcontroller and the microcontroller counts the number of pulses in a certain time to determine the speed of the wheel.
The throttle sensors, the brake sensor, and the steering sensor all use a potentiometer to measure the position of these elements. The 5V source is connected to each of the inputs of the potentiometers. The throttle and brake potentiometers’ resistances ranges from 0 to 5000Ω and the output can be anywhere from 0 to 5V analog based on the position of the wiper. The steering sensor has a resistance range from 0 to 1000Ω and the output is also a 0 to 5V analog signal. The analog output signals from the potentiometers can be sent into and measured by the microcontroller to determine the position of the steering, brake, and throttle.
Motor and Battery Sizing
The Drive Control System is independent of what motors are used in the vehicle. As long as the motors are brushed DC, the same controllers will work. Other types of motors have controllers with the same interface, and could also be used with a controller change.
For this vehicle, Agni 95R motors were selected in collaboration with the Mechanical Engineering drive train team. These motors were determined to be the best motors in our price range in terms of weight, power, and reliability.
To verify that the motors would be acceptable, and that the batteries could meet our needs, we had to perform calculations of hard acceleration as would be experienced in a race. To simulate this, we performed a MATLAB simulation of a 75 meter acceleration at full throttle, from a standing start. The MATLAB code, including assumptions made for car attributes, is included in the Appendix.
This simulation is also important to ensuring we will be able to complete the 75m acceleration run in the competition.
17
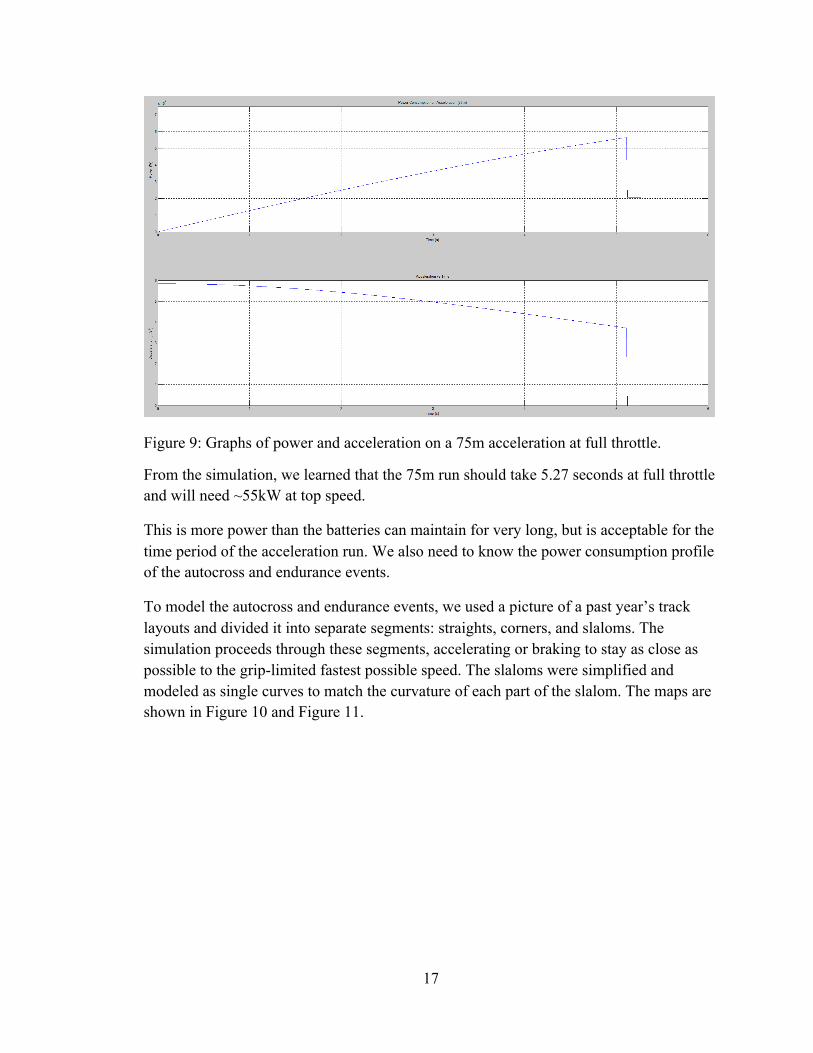
Figure 9: Graphs of power and acceleration on a 75m acceleration at full throttle.
From the simulation, we learned that the 75m run should take 5.27 seconds at full throttle and will need ~55kW at top speed.
This is more power than the batteries can maintain for very long, but is acceptable for the time period of the acceleration run. We also need to know the power consumption profile of the autocross and endurance events.
To model the autocross and endurance events, we used a picture of a past year’s track layouts and divided it into separate segments: straights, corners, and slaloms. The simulation proceeds through these segments, accelerating or braking to stay as close as possible to the grip-limited fastest possible speed. The slaloms were simplified and modeled as single curves to match the curvature of each part of the slalom. The maps are shown in Figure 10 and Figure 11.

18
Figure 10: The autocross course from Lincoln, Nebraska event 2012.[5]
19
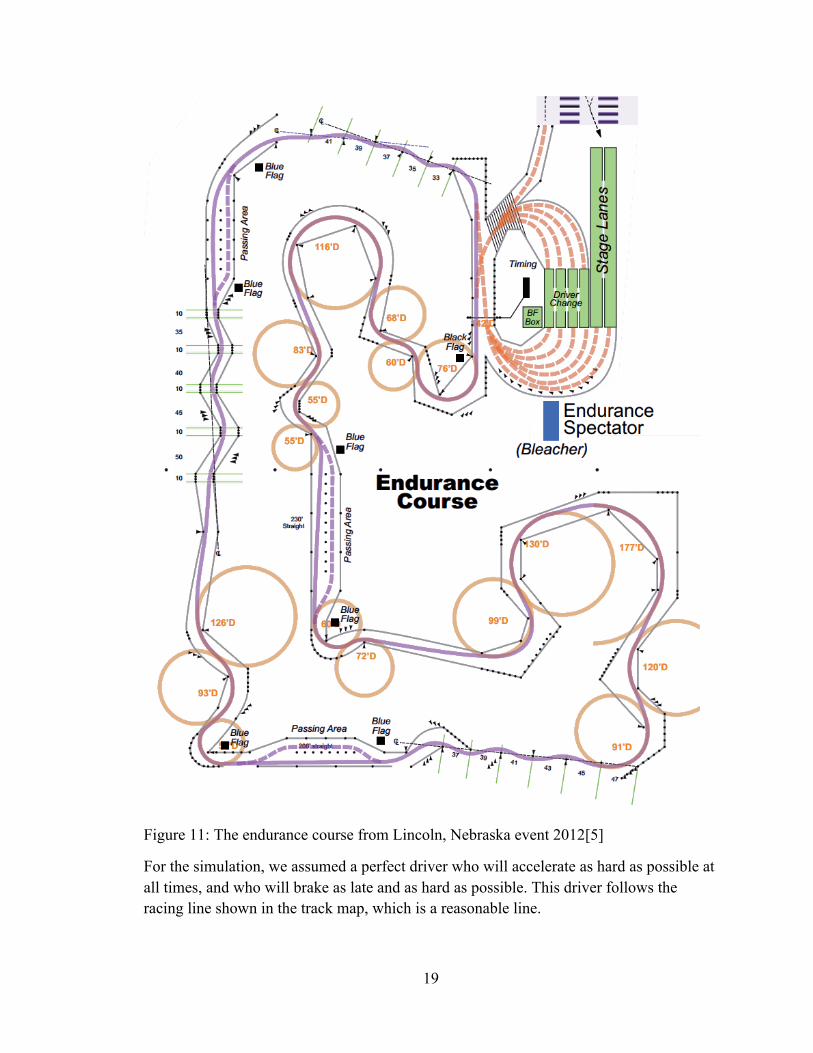
Figure 11: The endurance course from Lincoln, Nebraska event 2012[5]
For the simulation, we assumed a perfect driver who will accelerate as hard as possible at all times, and who will brake as late and as hard as possible. This driver follows the racing line shown in the track map, which is a reasonable line.
20
The simulator takes in to account a multitude of forces acting longitudinally on the vehicle. Braking, rolling resistance, air resistance, and steering forces act against the forward movement of the car, while driving forces from the motors push it forwards.
The braking force was determined by the brakes subteam to be 1167.094 lbs in the front, and 120.9058 in the rear. Summing and converting to newtons gives ~5729 N. This is the maximum force with which the car can brake. Since our simulator is assuming a perfect driver, this maximum is used for all periods of braking.
To calculate the maximum speed through the curves, Equation (1) is used where 𝑟 is the radius of the curve, 𝜇 is the coefficient of friction between the rubber and the pavement and 𝑔 is the acceleration of gravity.
𝑣!"# = 𝑟×𝜇×𝑔 ( 1 )
Rolling resistance is the resistance of the tires rolling on the pavement and is given below where 𝜇!! is the coefficient of rolling friction.
𝐹!! = 𝜇!!×𝑀𝑎𝑠𝑠×𝑔 ( 2 )
The force of air resistance is a function of velocity, and must be calculated at each time step of the simulation. It is calculated from Equation (3), where 𝜌!"#is air density, 𝐴!is the measured frontal area of the vehicle, and 𝐶!is the coefficient of aerodynamic drag.
𝐹! =12×𝜌!"#×𝐴!×𝐶!×𝑉
! ( 3 )
Longitudinal forces from steering are the most difficult to calculate and the largest. These forces are the longitudinal component of the lateral force normal to the front wheels. The lateral force at maximum cornering velocity is known from the gas formula team as being approximately 4855 N. This force is related to the square of cornering velocity. The force is estimated by the equation below.
𝐹! = (𝑣!"##$%&𝑣!"#
)!×sin(𝜃!"##$%&')×𝐹!"#$%"!2 ( 4 )
The results of the simulations are shown in Figure 12 and Figure 13.
21
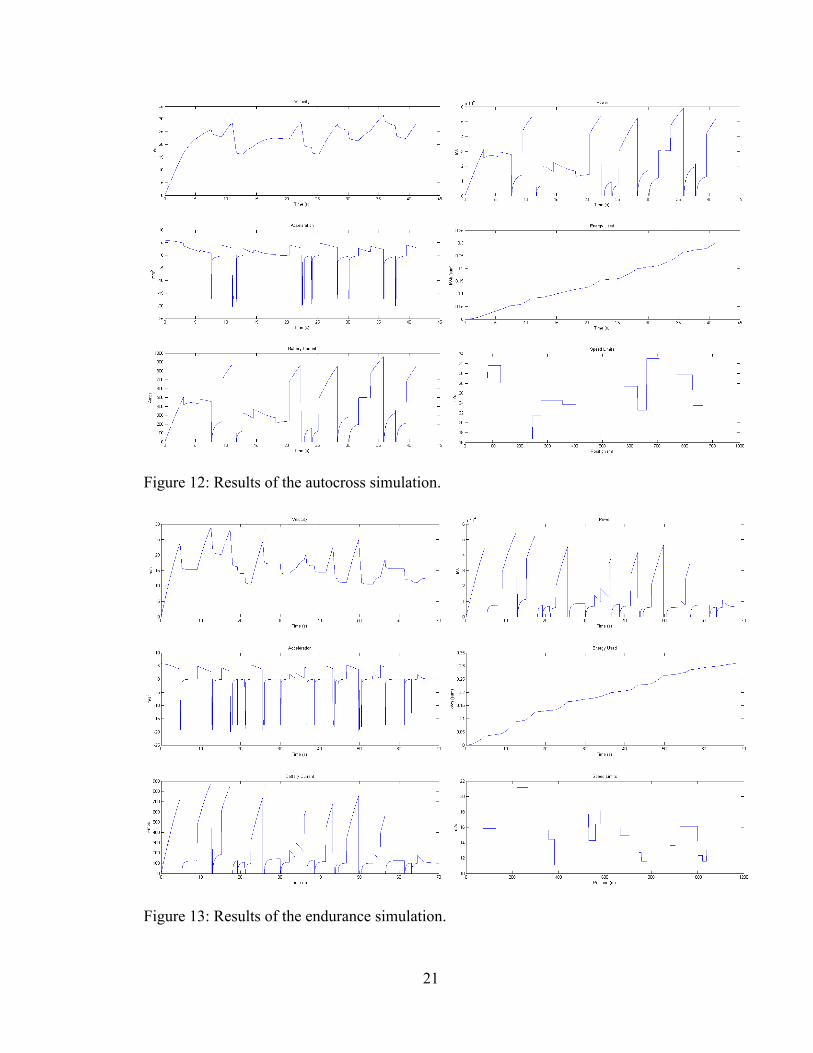
Figure 12: Results of the autocross simulation.
Figure 13: Results of the endurance simulation.

22
These results show a low power consumption overall, with very large spikes in the straight sections of the course. The Speed Limits graph shows the maximum grip-limited speed at each meter of the course. The breaks in the line show the straights where the speed is not grip-limited.
The simulation also outputs that the vehicle will complete the 1078 meter course in 67.81 seconds. This single lap will consume 0.306 kWh of energy, at an average rate of 14.632 kW. Energy consumption is not important for the autocross event, but if this usage is extrapolated out to the 22km endurance event distance, total energy is found to be 6.24 kWh. This is over the 5.5 kWh maximum allowed by the rules, but does not include any possible gains from regenerative braking. These results show that the system will have to track energy usage as well as race quickly. The average power draw, around 200 A, is also at the limit of what the batteries can supply. It is likely that a real driver will not be able to push the vehicle to this limit, but to prevent damage to the batteries, the drive control system will have to keep a slow moving average of battery current. Using this information, the system can reduce the maximum torque allowed as current used increases.
By simply reducing the maximum allowed torque by 20%, the simulation shows a lap completion time of 70.1 seconds with 0.265 kWh, at an average rate of 12.257 kW. Extrapolated out, this is 5.41 kWh. This is within the allowed energy consumption. Reducing maximum torque by 20% is not a good solution, but will not likely be necessary since the simulation assumes such a perfect driver and the ability to fully accelerate even in the turns.
Sensor Calculation
In order to pick an inductive sensor wheel sensor calculations had to be made. At a maximum speed of 60mph, the number of revolutions of the wheel per second had to be determined. Doing so resulted in the finding of 16 revolutions per minute. By adjusting the teeth cut into the wheel accordingly, the 500 hz specification of the sensor will function correctly. The calculation is shown below.
C=2πr= 2(10) π = 5.23 ft
𝟓𝟐𝟖𝟎𝟓.𝟐𝟑
= 1008.4 ft/hr
𝟏𝟎𝟎𝟖.𝟒𝟔𝟎
= 16.8 rps
23
Wiring System
It was also important to calculate Voltage Loss that will occur in the wiring in the vehicle. Losses will vary depending on the both the length of the wire, and the cross sectional area (gauge) of the wire. The voltage loss can be calculated using ohm’s law V=I*R. Resistance will be calculated as R = (ρ*L)/A. With ρ=resistivity. Copper wire will be used in the vehicle therefore the resistivity will be 1.712 x 10⁻⁸ ohm meters @250
C.
Software Design
The software system of the project is what controls the motors through the motor controllers. It needs to take the signals provided by the hardware system and determine how much torque to apply to each drive wheel. The entire software system runs on a Freescale TWR-K40X256. The TWR-K40X256 is a 32-bit ARM Cortex-M4 development kit.
Freescale is a large supplier in the automotive industry, and the exclusive supplier for NASCAR embedded solutions. Freescale runs an extensive University Program, and generously donated the TWR-K40X256 and selection and development assistance.
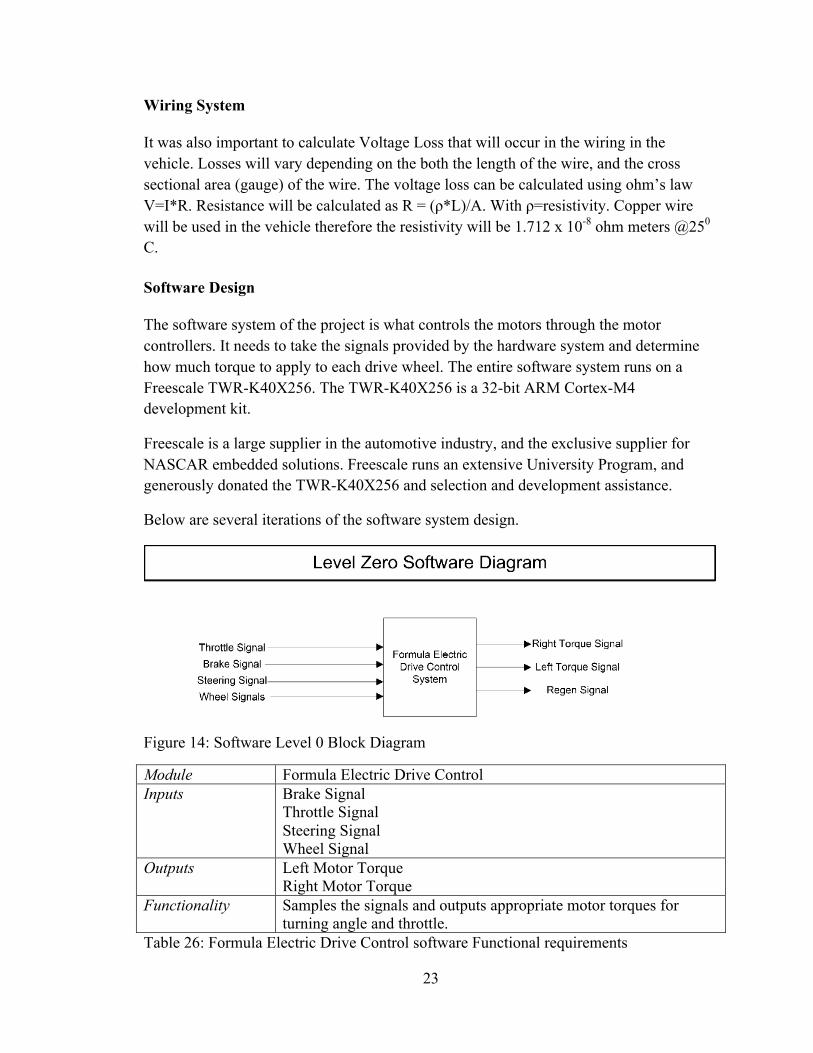
Below are several iterations of the software system design.
Figure 14: Software Level 0 Block Diagram
Module Formula Electric Drive Control Inputs Brake Signal
Throttle Signal Steering Signal Wheel Signal
Outputs Left Motor Torque Right Motor Torque
Functionality Samples the signals and outputs appropriate motor torques for turning angle and throttle.
Table 26: Formula Electric Drive Control software Functional requirements

24
Figure 15: Software Level 1 Block Diagram
Module Drive Control Module Inputs Digital wheel speed values
Digital throttle values Digital brake values Digital steering values BMS current BMS state of charge
Outputs Desired torque values Output information to driver Communication with BMS
Functionality Determine, from signal inputs, how much torque to apply at each of the wheels to best perform the driver’s desired actions. Also output important performance and health information to a driver display module, and to the
25
BMS system. Table 27: Drive Control Module software Functional requirements
Module Input Signal Filtering and Processing Module Inputs Digital pulse wheel speed signals (0-5V DC)
Analog throttle signals (0-5V DC) Analog brake signals (0-5V DC) Analog steering signals (0-5V DC)
Outputs Digital wheel speed values Digital throttle values Digital brake values Digital steering values
Functionality Condition the sensor signals for the Drive Control Module. Table 28: Input signal filtering and processing module Functional requirements
Module Output Signal Processing Module Inputs Desired left torque value
Desired right torque value Outputs Analog left torque signal (0-5V DC)
Analog right torque signal (0-5V DC) Functionality Condition the torque values from the Drive Control Module for
transmission to the motor controllers. Table 29: Output signal processing module Functional requirements
Module Driver Display Module Inputs Values to be displayed Outputs Signals to LCD to display inputs Functionality Take values and display them on the LCD. Table 30: Driver display module Functional requirements
Module BMS Communication Module Inputs Any statuses to relay to the BMS
Any statuses from BMS to relay to drive control Outputs Any statuses to relay to the BMS
Any statuses from BMS to relay to drive control Functionality Handle communication between BMS and drive control. Table 31: BMS communication module Functional requirements

26
Figure 16: Software Level 2 Block Diagram.
27
Module Drive Control Module Inputs Digital wheel speed values
Digital throttle values Digital brake values Digital steering values BMS health statuses
Outputs Desired torque values Output information to driver
Functionality Determine, from signal inputs, how much torque to apply at each of the wheels to best perform the driver’s desired actions. Also output important performance and health information to a driver display module.
Table 32: Drive Control Module Functional requirements
Module Input Signal Processing Module Inputs Digital wheel speed pulse signals (0-5V DC)
Digital throttle signals (0-5V DC) Digital brake signals (0-5V DC) Digital steering signals (0-5V DC)
Outputs Wheel speed values in C variable Throttle value in C variable Brake value in C variable Steering value in C variables
Functionality Gets input values from the ADCs connected to the sensors and puts them into correctly formatted C variables for use by the Drive Control Module.
Table 33: Input Signal Processing Module
Module Output Signal Processing Module Inputs Desired left torque value
Desired right torque value Outputs Digital left torque value
Digital right torque value Functionality Takes the desired torque values from the drive control module, formats
them, and outputs them to the DACs connected to the Kelly Controllers. Table 34: Output Signal Processing Module Functional requirements
Module Driver Display Module Inputs Speed
State of charge Outputs Signals to LCD to display inputs Functionality Take values and sends them to the onboard LCD controller for display. Table 35: Driver Display Module Functional requirements
Module BMS Communication Module Inputs Any statuses from BMS to relay to drive control Outputs Any statuses from BMS to relay to drive control Functionality Interface between the CAN bus and the program on the microcontroller. Table 36: BMS Communication Module Functional requirements

28
The above diagrams show a conceptual view of the software system. A more code-centric diagram is shown in Figure 17.
Figure 17: The overall software architecture
The design stores all of the working data in the “Shadow Copy.” This way, the control logic simply operates on a set of variables, without having to be concerned with I/O. It also helps separate the different types of inputs and ouputs.
The Input Timer ISR handles inputs that don’t require particularly fast sampling, such as the steering, throttle, and brake. The Output Timer ISR handles the outputs to the motor controllers. Each of these are on timer interrupts so that the frequencies can be adjusted easily.
The Wheel Speed GPIO ISR handles the digital pulses coming from the wheel sensors. The interrupt will be triggered by a positive edge on any of the GPIO pins with wheel speed sensors.
29
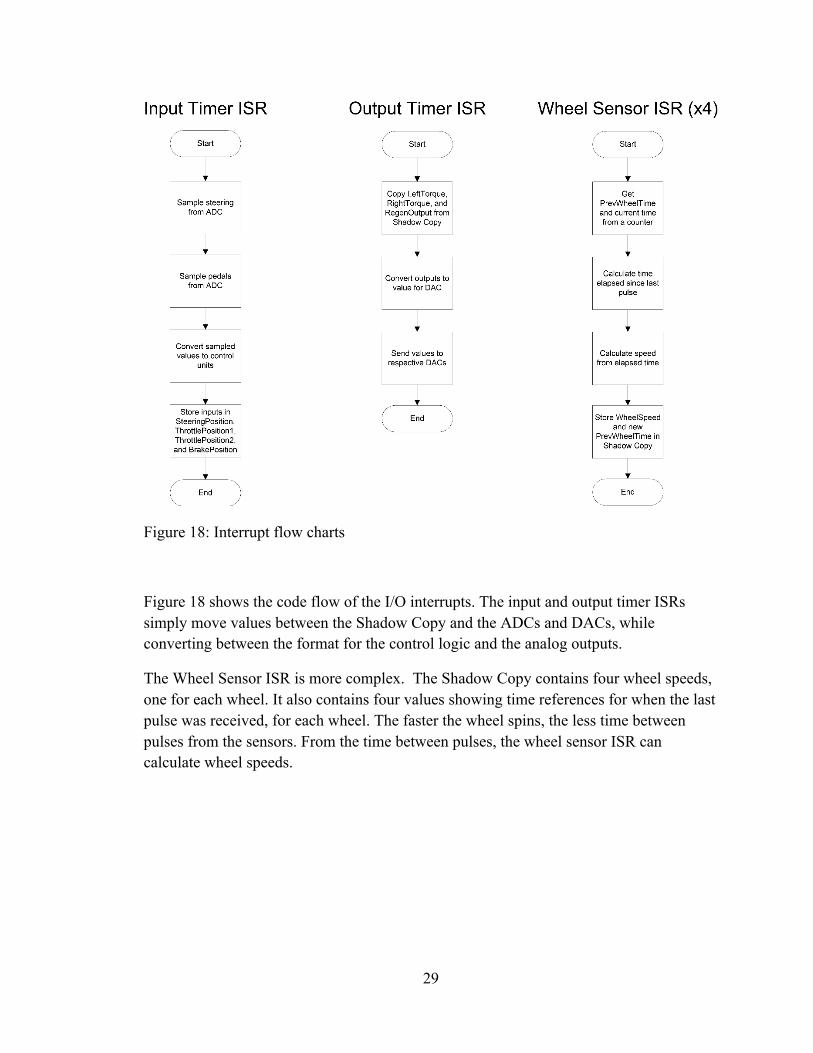
Figure 18: Interrupt flow charts
Figure 18 shows the code flow of the I/O interrupts. The input and output timer ISRs simply move values between the Shadow Copy and the ADCs and DACs, while converting between the format for the control logic and the analog outputs.
The Wheel Sensor ISR is more complex. The Shadow Copy contains four wheel speeds, one for each wheel. It also contains four values showing time references for when the last pulse was received, for each wheel. The faster the wheel spins, the less time between pulses from the sensors. From the time between pulses, the wheel sensor ISR can calculate wheel speeds.

30
Figure 19: Control Logic flow chart
The main control loop is running constantly in the main function. Before it begins looping, it has to initialize everything. It will initialize the Shadow Copy, setup and start
31
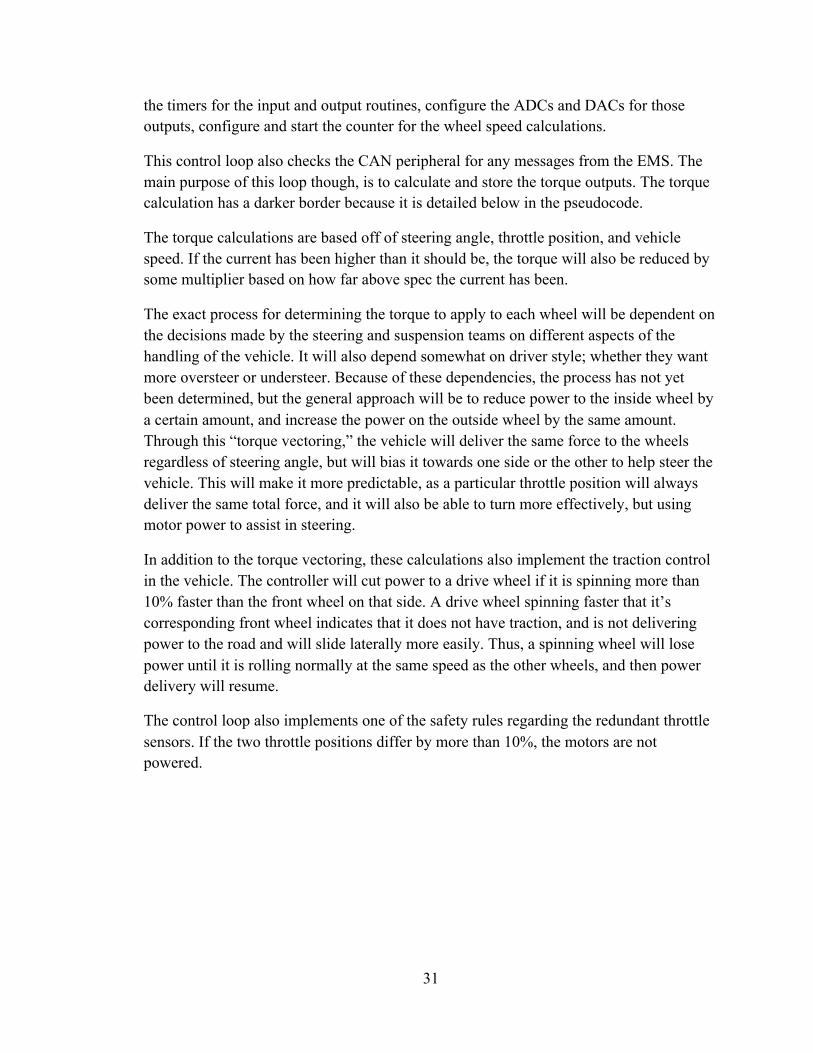
the timers for the input and output routines, configure the ADCs and DACs for those outputs, configure and start the counter for the wheel speed calculations.
This control loop also checks the CAN peripheral for any messages from the EMS. The main purpose of this loop though, is to calculate and store the torque outputs. The torque calculation has a darker border because it is detailed below in the pseudocode.
The torque calculations are based off of steering angle, throttle position, and vehicle speed. If the current has been higher than it should be, the torque will also be reduced by some multiplier based on how far above spec the current has been.
The exact process for determining the torque to apply to each wheel will be dependent on the decisions made by the steering and suspension teams on different aspects of the handling of the vehicle. It will also depend somewhat on driver style; whether they want more oversteer or understeer. Because of these dependencies, the process has not yet been determined, but the general approach will be to reduce power to the inside wheel by a certain amount, and increase the power on the outside wheel by the same amount. Through this “torque vectoring,” the vehicle will deliver the same force to the wheels regardless of steering angle, but will bias it towards one side or the other to help steer the vehicle. This will make it more predictable, as a particular throttle position will always deliver the same total force, and it will also be able to turn more effectively, but using motor power to assist in steering.
In addition to the torque vectoring, these calculations also implement the traction control in the vehicle. The controller will cut power to a drive wheel if it is spinning more than 10% faster than the front wheel on that side. A drive wheel spinning faster that it’s corresponding front wheel indicates that it does not have traction, and is not delivering power to the road and will slide laterally more easily. Thus, a spinning wheel will lose power until it is rolling normally at the same speed as the other wheels, and then power delivery will resume.
The control loop also implements one of the safety rules regarding the redundant throttle sensors. If the two throttle positions differ by more than 10%, the motors are not powered.
32
#define SLIP_RATIO 1.1 // Adjustable amount of slipping/error to allow in wheel speed measurements void CalculateAndStoreTorques() { float LfWheelSpeed, RfWheelSpeed, LrWheelSpeed, RrWheelSpeed; // TODO: Copy wheel speeds from Shadow Copy to these local variables float SteeringAngle, ThrottlePosition1, ThrottlePosition2; // TODO: Copy from Shadow Copy to these local variables float ThrottleDiff = ThrottlePosition1 -‐ ThrottlePosition2; ThrottleDiff /= ThrottlePosition1 + 1; // +1 to avoid division by zero float ThrottlePosition = (ThrottlePosition1 + ThrottlePosition2) / 2; //Average throttle position for calculations float VehicleSpeed = (LfWheelSpeed + RfWheelSpeed) / 2; //Speed of the vehicle. Rear wheels are more likely to be slipping, so not used. float PowerManagementMultiplier = GetPowerLimit(Current); // Get multiplier to limit torque based on battery current if (ThrottleDiff >= 0.1) // Safety check for disparity in throttle sensors { //No torque if the throttle sensors dont agree within 10% LeftTorque = 0; RightTorque = 0; // TODO: Alert the driver return; } if (LfWheelSpeed < LrWheelSpeed / SLIP_RATIO) // If the left drive wheel is slipping, don't apply torque { LeftTorque = 0; } else { //Calculate torque based on steering angle, throttle position, and vehicle speed LeftTorque = GetLeftTorque(SteeringAngle, ThrottlePosition, VehicleSpeed); LeftTorque = LeftTorque * PowerManagementMultiplier; } if (RfWheelSpeed < RrWheelSpeed / SLIP_RATIO) // If the right drive wheel is slipping, don't apply torque { RightTorque = 0; } else { //Calculate torque based on steering angle, throttle position, and vehicle speed RightTorque = GetRightTorque(SteeringAngle, ThrottlePosition, VehicleSpeed); RightTorque = RightTorque * PowerManagementMultiplier; } // TODO: Store the torque outputs }
Figure 20: Torque calculation pseudocode
33
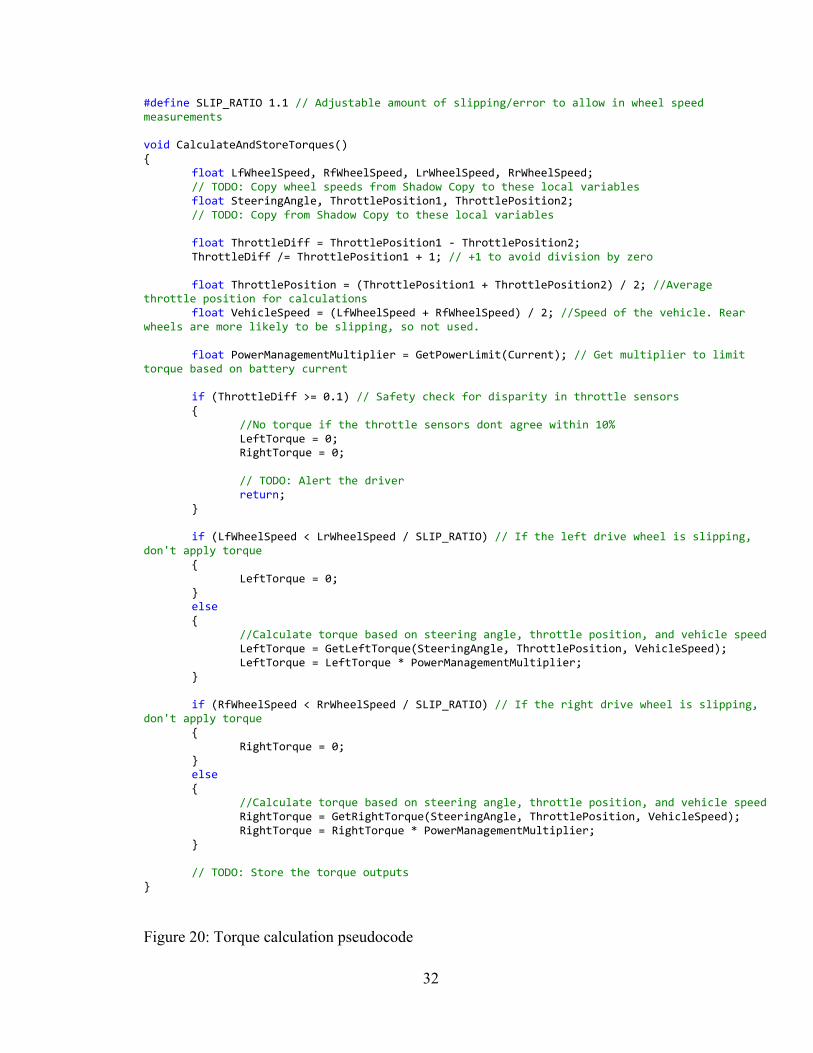
Parts List Unit Total
Qty. Part Num. Description Cost Cost3 PB-8 Curtis PB-8 Potentiometer Box $95.00 $285.001 LM340LAZ-5.0/NOPBIC REG LDO 5V .1A TO92-3 0.95 0.951 TD32003APG(O,N)IC DRIVER DARL SNK TTL 7CH 16DIP 0.92 0.924 NBB8-18GM30-E2-V1Inductive Sensors2 KDZ J1 KDZ J1 Cable 19.00 38.002 KDZ J2 KDZ J2 Cable 19.00 38.002 KDZ72551 KDZ PM Motor Speed Controller 459.00 918.002 ZJW400A Main Contactor ZJW 72VDC Coils 400A 69.00 138.001 CNN 800A Fuse 15.00 15.001 Fuse Holder 7.00 7.001 USB to RS232 Converter 29.00 29.001 SP22E-1K Precision Potentiometer 1W 1KΩ 19.23 19.231 KTY83/122 Temperature Sensor 1.02 1.02
Total $1,490.12
Table # Revised Material Cost
34
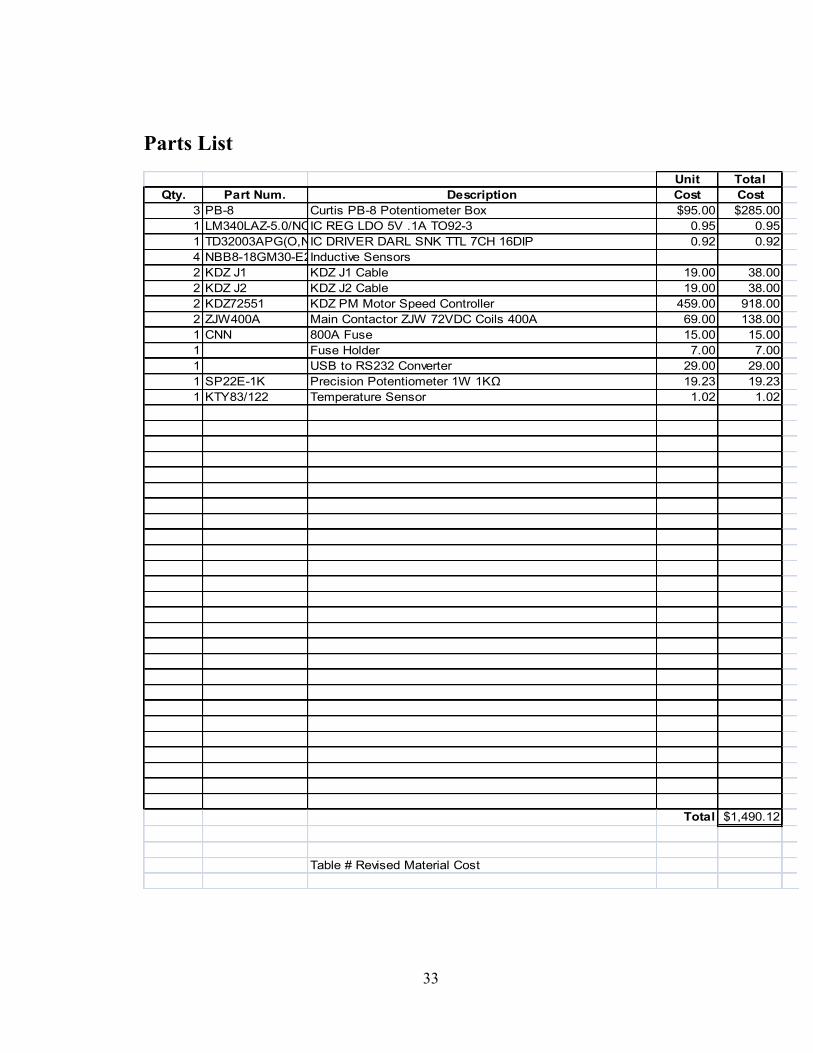
Project Schedules
Table 37: Final Design Gantt

35
Table 38: Proposed Implementation Gantt Chart

36
Design Team Information Nick Gatta, Electrical Engineer, Archivist Alex Klein, Computer Engineer, Software Manager Alex Spickard, Electrical Engineer, Team Leader Tyler Zoner, Electrical Engineer, Hardware Manager
Conclusion
Producing a functioning Formula SAE Electric Vehicle is a complex process. Research, calculations, and simulations were conducted during the course of the semester to produce the components of a functioning drive system. Based on discussions with the mechanical engineers of the Formula SAE team, the motor and motor controllers were selected and verified using the Matlab simulations from the report. Many Matlab codes were written & simulated to ensure the correct motors were chosen. The simulations also produced results ensuring the regenerative braking and torque vectoring features of the system will function correctly. The wheel, steering, and pedal sensors all provide vital information to the system, and research and calculations produced the information for selecting the sensors. In conclusion, the drive control will provide a safe, efficient, and effective system to the formula SAE racecar. All in all, the drive control design has been a great success! It is our hope to in the next couple months work towards ordering parts and implementing the system we have designed.
37
References
[1] S. E. Lyshevshi, A. Sinha, M. Rizkalla, M. El-Sharkawy, A. Nazarov, P. C. Cho, W. Wylam, J. Mitchell and M. Friesen, "Analysis and Control of Hybrid-Electric Vehicles With Individual Wheel Brushless Traction Motors," in American Control Conference, Chicago, 2000.
[2] L. Shoubo, L. Chenglin, C. Shanglou and W. Lifang, "Traction Control of Hybrid Electric Vehicle," in Vehicle Power and Propulsion Conference, Dearborn, 2009.
[3] W. E. Earleson, "Traction Control for DC Electric Motor". United States of America Patent 20100162918, 1 July 2010.
[4] X. T. Tao, T. M. Steinmetz, T.-M. Hsieh and W. R. Cawthorne, "Method for Automatic Traction Control in a Hybrid Electric Vehicle". United States of America Patent 7222014, 22 May 2007.
[5] "Formula SAE Lincoln 2012 Event Guide," 2012. [Online]. Available: http://students.sae.org/competitions/formulaseries/west/eventguide.pdf. [Accessed 21 September 2012].
[6] M. Brain, "How Electric Motors Work," HowStuffWorks, Inc, [Online]. Available: http://electronics.howstuffworks.com/motor1.htm. [Accessed 22 March 2012].
[7] "Formula Student Electric Germany," 26 April 2011. [Online]. Available: http://www.formulastudentelectric.de/uploads/media/FSE_Rules_2011_v1.1.0.pdf. [Accessed 22 March 2012].
[8] H. Neudorfer, "Comparison of three different electric powertrains for the use in high performance Electric Go-Kart," in International Aegean Conference on Electric Machines and Power Electronics, Istanbul, 2007.

38
Appendix
Data Sheets
Sensors
Inductive (x's4)
http://files.pepperl-fuchs.com/selector_files/navi/productInfo/edb/087743_eng.pdf
Cable(x's4)
http://files.pepperl-fuchs.com/selector_files/navi/productInfo/edb/191108_eng.pdf
Encoder
http://files.pepperl-fuchs.com/selector_files/navi/productInfo/edb/t49170_eng.pdf
Encoder cable
Potentiometers(x's3)
http://www.electroauto.com/catalog/potbox.shtml
Temperature sensor
http://www.nxp.com/documents/data_sheet/KTY83_SER.pdf
Microcontroller
http://www.freescale.com/webapp/sps/site/prod_summary.jsp?code=TWR-K40X256&fpsp=1&tab=Documentation_Tab
MATLAB Simulations for Power Profile
Acceleration Event
PowerSimulation.m clear all FrontArea = 1.1148; %sq meters AirDensity = 1.2250; %kg/cubic meters DragCoeff = 1.5; MphPerMs = 2.236936; WheelRadius = 0.254; %meters (10 inches) PeakTorque = 50; %NM

39
MaxRpm = 4850; %RPM MechanicalEfficiency = 0.95; Mass = 320; %kg GR = 5; Distance = 75; TimeDelta = 0.01; EndTime = 100; Acceleration = 0; %M/s/s Velocity = 0; %M/s Position = 0; % M MaxSpeed = ((MaxRpm/GR/60) * (WheelRadius*2*pi)) i = 1; while (i <= 100/.01) ForceDrag = (0.5)*AirDensity*DragCoeff*FrontArea*(Velocity.^2); ForceAtWheels = 2 * PeakTorque/WheelRadius * GR * MechanicalEfficiency if (Velocity >= MaxSpeed) ForceAtWheels = ForceDrag; Velocity = MaxSpeed; Acceleration = 0; else Acceleration = (ForceAtWheels - ForceDrag)/Mass; Velocity = Velocity + (Acceleration * TimeDelta); end Accel(i) = Acceleration; Position = Position + (Velocity * TimeDelta); Power(i) = ((ForceAtWheels * Velocity) / 0.9) / 0.95; %taking into account motor efficiency and drivetrain losses if(Position > Distance) fprintf('%f GR: %f seconds at %f mph (Max = %f)\n', GR, i/100, Velocity * MphPerMs, MaxSpeed * MphPerMs) break; end i = i + 1; Times(i) = i*TimeDelta; end subplot(2,1,1), plot(Times, Power) title('Power Consumption on Acceleration (75m)') xlabel('Time (s)') ylabel('Power (W)') axis([0 6 0 75000]) grid on subplot(2,1,2), plot(Times, Accel) axis([0 6 0 6]) title('Acceleration vs Time') xlabel('Time (s)') ylabel('Acceleration (m/s^2)') grid on
40
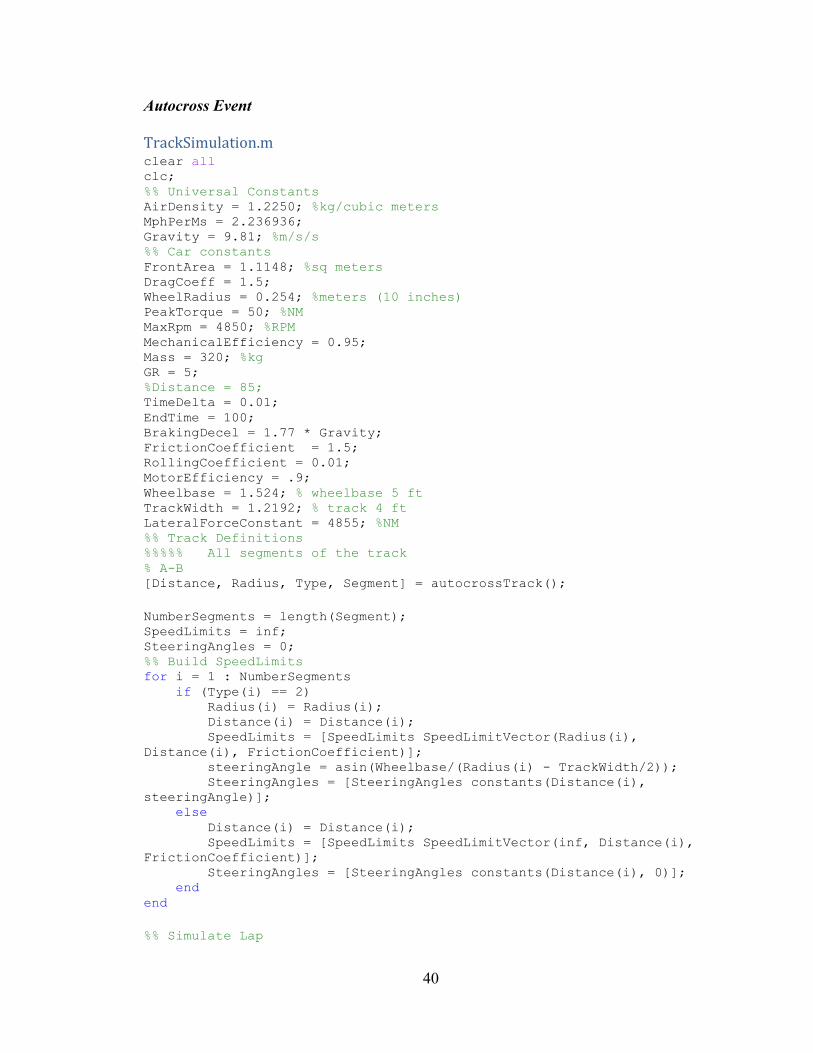
Autocross Event
TrackSimulation.m clear all clc; %% Universal Constants AirDensity = 1.2250; %kg/cubic meters MphPerMs = 2.236936; Gravity = 9.81; %m/s/s %% Car constants FrontArea = 1.1148; %sq meters DragCoeff = 1.5; WheelRadius = 0.254; %meters (10 inches) PeakTorque = 50; %NM MaxRpm = 4850; %RPM MechanicalEfficiency = 0.95; Mass = 320; %kg GR = 5; %Distance = 85; TimeDelta = 0.01; EndTime = 100; BrakingDecel = 1.77 * Gravity; FrictionCoefficient = 1.5; RollingCoefficient = 0.01; MotorEfficiency = .9; Wheelbase = 1.524; % wheelbase 5 ft TrackWidth = 1.2192; % track 4 ft LateralForceConstant = 4855; %NM %% Track Definitions %%%%% All segments of the track % A-B [Distance, Radius, Type, Segment] = autocrossTrack(); NumberSegments = length(Segment); SpeedLimits = inf; SteeringAngles = 0; %% Build SpeedLimits for i = 1 : NumberSegments if (Type(i) == 2) Radius(i) = Radius(i); Distance(i) = Distance(i); SpeedLimits = [SpeedLimits SpeedLimitVector(Radius(i), Distance(i), FrictionCoefficient)]; steeringAngle = asin(Wheelbase/(Radius(i) - TrackWidth/2)); SteeringAngles = [SteeringAngles constants(Distance(i), steeringAngle)]; else Distance(i) = Distance(i); SpeedLimits = [SpeedLimits SpeedLimitVector(inf, Distance(i), FrictionCoefficient)]; SteeringAngles = [SteeringAngles constants(Distance(i), 0)]; end end %% Simulate Lap
41
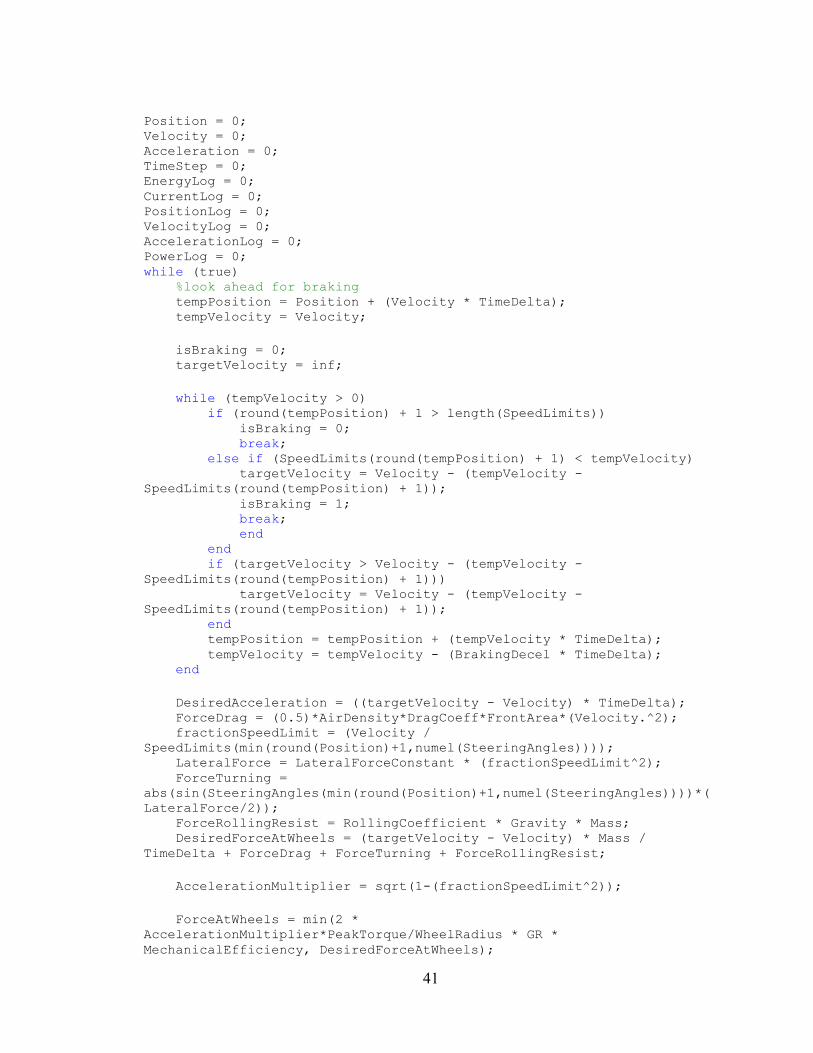
Position = 0; Velocity = 0; Acceleration = 0; TimeStep = 0; EnergyLog = 0; CurrentLog = 0; PositionLog = 0; VelocityLog = 0; AccelerationLog = 0; PowerLog = 0; while (true) %look ahead for braking tempPosition = Position + (Velocity * TimeDelta); tempVelocity = Velocity; isBraking = 0; targetVelocity = inf; while (tempVelocity > 0) if (round(tempPosition) + 1 > length(SpeedLimits)) isBraking = 0; break; else if (SpeedLimits(round(tempPosition) + 1) < tempVelocity) targetVelocity = Velocity - (tempVelocity - SpeedLimits(round(tempPosition) + 1)); isBraking = 1; break; end end if (targetVelocity > Velocity - (tempVelocity - SpeedLimits(round(tempPosition) + 1))) targetVelocity = Velocity - (tempVelocity - SpeedLimits(round(tempPosition) + 1)); end tempPosition = tempPosition + (tempVelocity * TimeDelta); tempVelocity = tempVelocity - (BrakingDecel * TimeDelta); end DesiredAcceleration = ((targetVelocity - Velocity) * TimeDelta); ForceDrag = (0.5)*AirDensity*DragCoeff*FrontArea*(Velocity.^2); fractionSpeedLimit = (Velocity / SpeedLimits(min(round(Position)+1,numel(SteeringAngles)))); LateralForce = LateralForceConstant * (fractionSpeedLimit^2); ForceTurning = abs(sin(SteeringAngles(min(round(Position)+1,numel(SteeringAngles))))*(LateralForce/2)); ForceRollingResist = RollingCoefficient * Gravity * Mass; DesiredForceAtWheels = (targetVelocity - Velocity) * Mass / TimeDelta + ForceDrag + ForceTurning + ForceRollingResist; AccelerationMultiplier = sqrt(1-(fractionSpeedLimit^2)); ForceAtWheels = min(2 * AccelerationMultiplier*PeakTorque/WheelRadius * GR * MechanicalEfficiency, DesiredForceAtWheels);
42
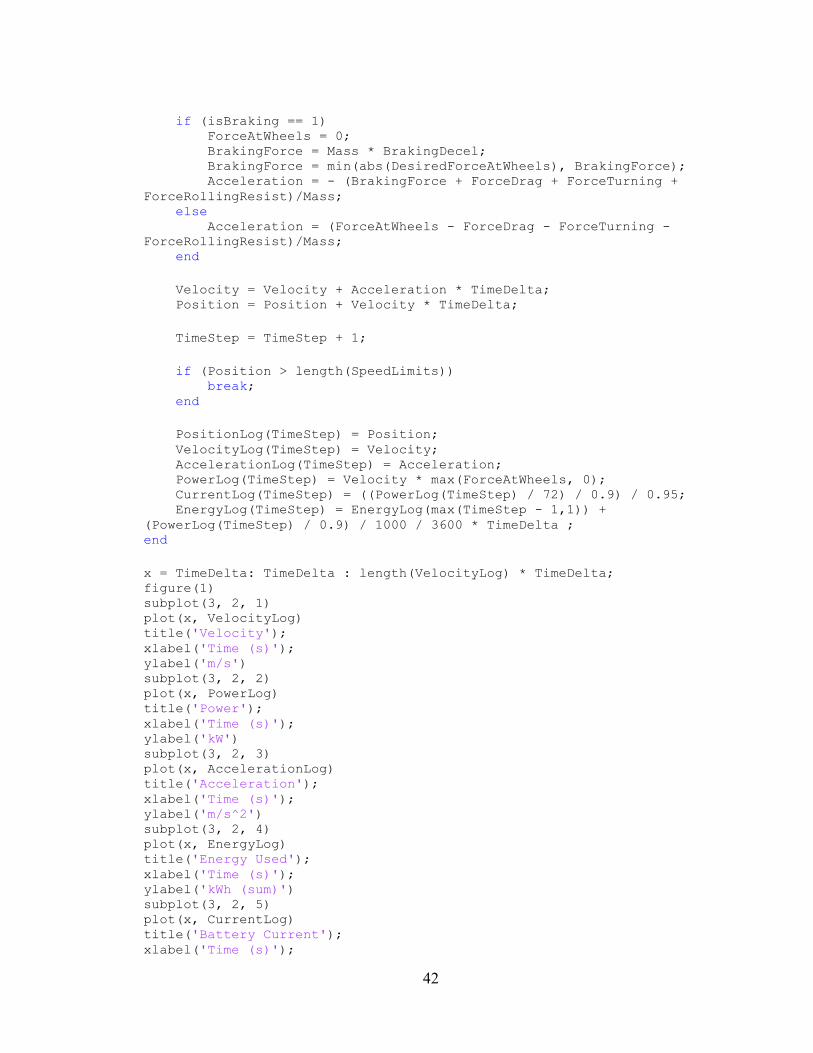
if (isBraking == 1) ForceAtWheels = 0; BrakingForce = Mass * BrakingDecel; BrakingForce = min(abs(DesiredForceAtWheels), BrakingForce); Acceleration = - (BrakingForce + ForceDrag + ForceTurning + ForceRollingResist)/Mass; else Acceleration = (ForceAtWheels - ForceDrag - ForceTurning - ForceRollingResist)/Mass; end Velocity = Velocity + Acceleration * TimeDelta; Position = Position + Velocity * TimeDelta; TimeStep = TimeStep + 1; if (Position > length(SpeedLimits)) break; end PositionLog(TimeStep) = Position; VelocityLog(TimeStep) = Velocity; AccelerationLog(TimeStep) = Acceleration; PowerLog(TimeStep) = Velocity * max(ForceAtWheels, 0); CurrentLog(TimeStep) = ((PowerLog(TimeStep) / 72) / 0.9) / 0.95; EnergyLog(TimeStep) = EnergyLog(max(TimeStep - 1,1)) + (PowerLog(TimeStep) / 0.9) / 1000 / 3600 * TimeDelta ; end x = TimeDelta: TimeDelta : length(VelocityLog) * TimeDelta; figure(1) subplot(3, 2, 1) plot(x, VelocityLog) title('Velocity'); xlabel('Time (s)'); ylabel('m/s') subplot(3, 2, 2) plot(x, PowerLog) title('Power'); xlabel('Time (s)'); ylabel('kW') subplot(3, 2, 3) plot(x, AccelerationLog) title('Acceleration'); xlabel('Time (s)'); ylabel('m/s^2') subplot(3, 2, 4) plot(x, EnergyLog) title('Energy Used'); xlabel('Time (s)'); ylabel('kWh (sum)') subplot(3, 2, 5) plot(x, CurrentLog) title('Battery Current'); xlabel('Time (s)');

43
ylabel('Amps') subplot(3, 2, 6) x = 1: length(SpeedLimits); plot(x, SpeedLimits) title('Speed Limits'); xlabel('Position (m)'); ylabel('m/s') fprintf('Friction Coeff: %f completed in %f seconds with %f kWh with average power: %f kW, average battery current: %f Amps\n\n', FrictionCoefficient, length(VelocityLog) * TimeDelta, EnergyLog(TimeStep-1), mean(PowerLog)/1000, mean(CurrentLog))
constants.m function y = constants( length, value ) %UNTITLED Summary of this function goes here % Detailed explanation goes here temp(1:round(length)) = value; y = temp; end
SpeedLimitVector.m function [ y ] = SpeedLimitVector( radius, distance, friction) %UNTITLED2 Summary of this function goes here % Detailed explanation goes here MaxSegmentSpeed = sqrt( friction * 9.81 * radius ); y = constants(distance, MaxSegmentSpeed); end