Forms of Business Organization The Sole Proprietorship The Partnership –General Partnership...
67
Forms of Business Organization • The Sole Proprietorship • The Partnership – General Partnership – Limited Partnership • The Corporation
-
Upload
stephanie-fletcher -
Category
Documents
-
view
224 -
download
1
Transcript of Forms of Business Organization The Sole Proprietorship The Partnership –General Partnership...

Forms of Business Organization
• The Sole Proprietorship
• The Partnership– General Partnership– Limited Partnership
• The Corporation
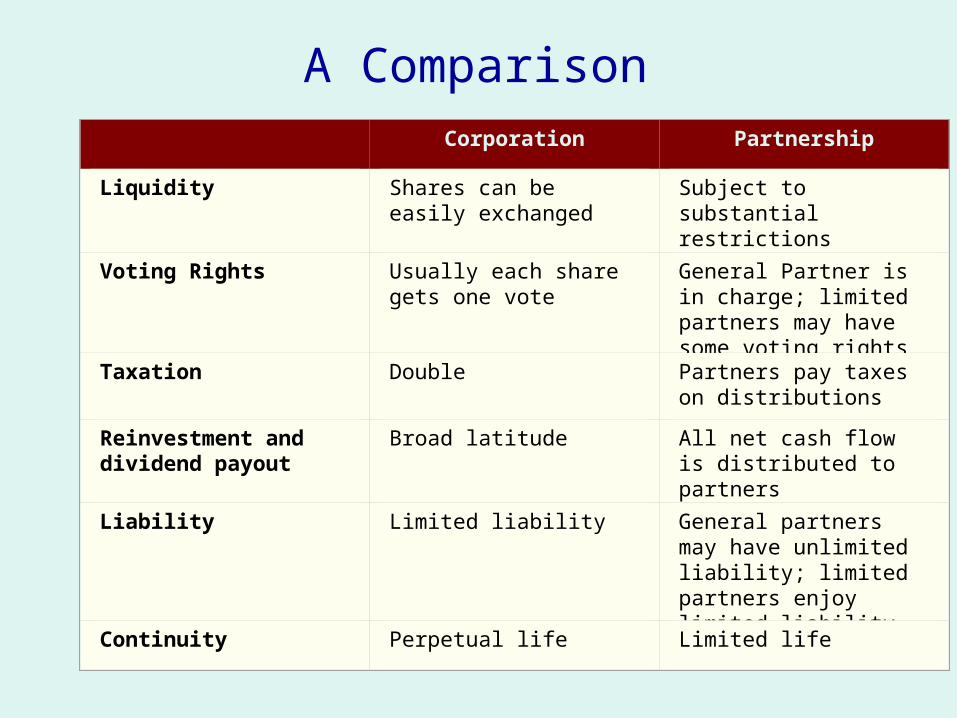
A Comparison Corporation Partnership
Liquidity Shares can be easily exchanged
Subject to substantial restrictions
Voting Rights Usually each share gets one vote
General Partner is in charge; limited partners may have some voting rights
Taxation Double Partners pay taxes on distributions
Reinvestment and dividend payout
Broad latitude All net cash flow is distributed to partners
Liability Limited liability General partners may have unlimited liability; limited partners enjoy limited liability
Continuity Perpetual life Limited life

The Agency Problem
• Agency relationship– Principal hires an agent to represent his/her
interest– Stockholders (principals) hire managers
(agents) to run the company
• Agency problem– Conflict of interest between principal and
agent

Managerial Goals
• Managerial goals may be different from shareholder goals:– Expensive perquisites– Survival– Independence
• Increased growth and size are not necessarily equivalent to increased shareholder wealth

Managing Managers
• Managerial compensation– Incentives can be used to align management and
stockholder interests– The incentives need to be structured carefully to make
sure that they achieve their intended goal
• Corporate control– The threat of a takeover may result in better
management
• Other stakeholders

Financial Statement
• A financial statement (or financial report) is a formal record of the financial activities of a business, person, or other entity.
• For a business enterprise - all the relevant financial information, presented in a structured manner and in a form easy to understand.

An annual report
• An annual report is a comprehensive report on a company's activities throughout the preceding year.
• Annual reports are intended to give shareholders and other interested people information about the company's activities and financial performance.
• Most jurisdictions require companies to prepare and disclose annual reports, and many require the annual report to be filed at the company's registry.
• Companies listed on a stock exchange are also required to report at more frequent intervals (depending upon the rules of the stock exchange involved).

Typically annual reports will include: • Chairman's report • CEO's report • Auditor's report on corporate governance • Mission statement • Corporate governance statement of compliance • Statement of directors' responsibilities • Invitation to the company's AGM as well as financial statements including:• Auditor's report on the financial statements • Balance sheet • Statement of retained earnings • Income statement • Cash flow statement • Notes to the financial statements • Accounting policies
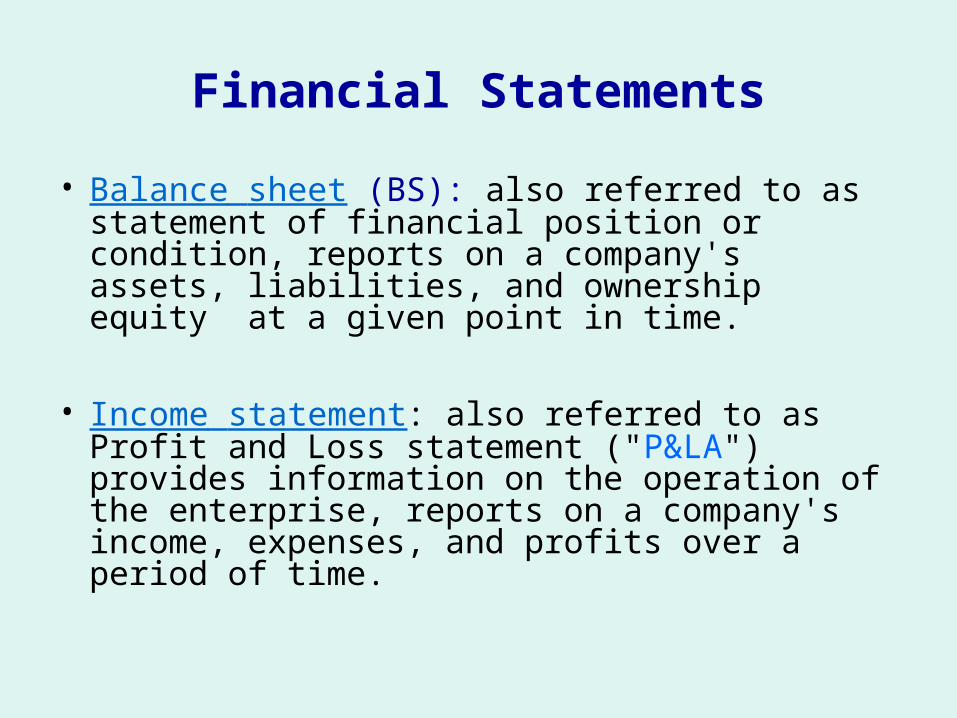
Financial Statements
• Balance sheet (BS): also referred to as statement of financial position or condition, reports on a company's assets, liabilities, and ownership equity at a given point in time.
• Income statement: also referred to as Profit and Loss statement ("P&LA") provides information on the operation of the enterprise, reports on a company's income, expenses, and profits over a period of time.

Financial Statements
• Statement of Owner's Equity shows the change in owner's equity during a given time period. It lists the owner equity balance at the beginning of the period, additions and subtractions to the balance, and the ending balance. Additions come from owner investments and income; subtractions from owner withdrawals and losses.
• Statement of cash flows: reports on a company's cash flow activities, particularly its operating, investing and financing activities. Indicates whether enough cash is available to carry on routine operations.
Financial Statements
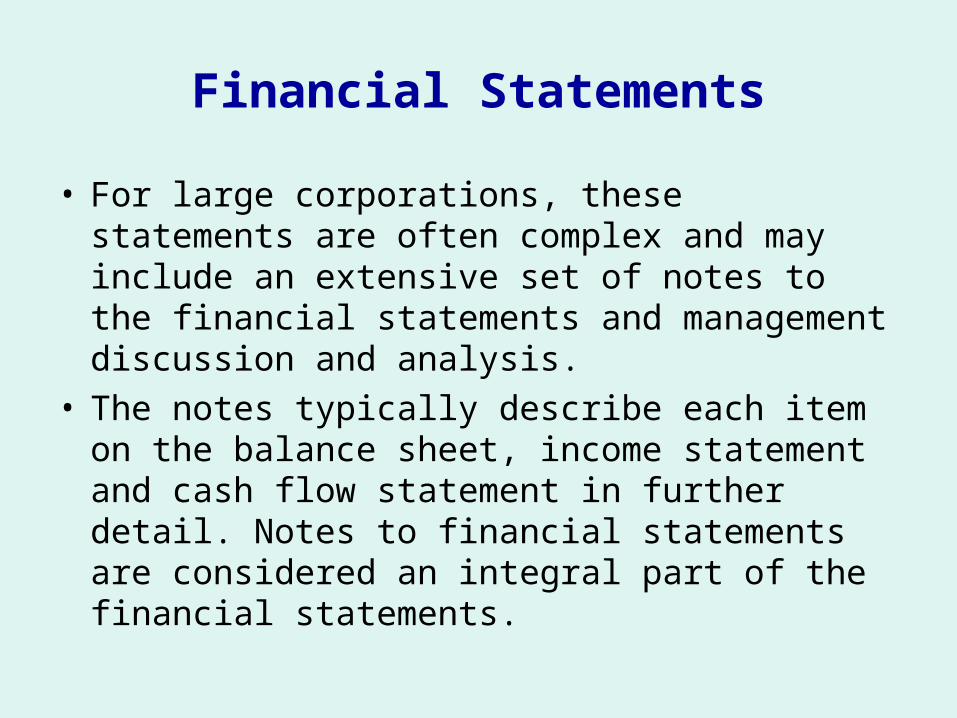
• For large corporations, these statements are often complex and may include an extensive set of notes to the financial statements and management discussion and analysis.
• The notes typically describe each item on the balance sheet, income statement and cash flow statement in further detail. Notes to financial statements are considered an integral part of the financial statements.

Financial statements
Financial statements should be understandable, relevant, reliable and comparable.

Identification of the user
• The IASB Framework states:
The objective of financial statements is to provide information … that is useful to a wide range of users in making economic decisions.
• Owners, prospective investors and managers require financial statements to make important business (investment) decisions (buy/sell/hold) that affect its continued operations. Return on capital employed (ROCE) and related performance and asset management ratios are likely to be of interest to this group of users.
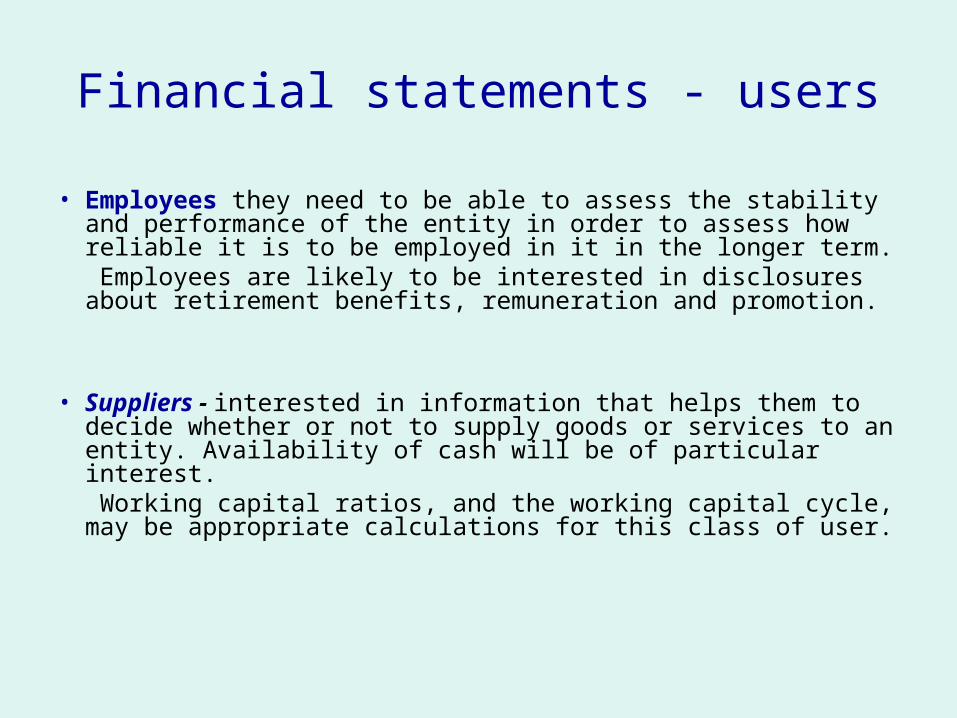
Financial statements - users
• Employees they need to be able to assess the stability and performance of the entity in order to assess how reliable it is to be employed in it in the longer term. Employees are likely to be interested in disclosures about retirement benefits, remuneration and promotion.
• Suppliers - interested in information that helps them to decide whether or not to supply goods or services to an entity. Availability of cash will be of particular interest.
Working capital ratios, and the working capital cycle, may be appropriate calculations for this class of user.

Financial statements - users
• Lenders and potential lenders - are interested in assessing whether or not the loans that they have made are likely to be repaid, and whether or not the related interest charge will be paid in full and on time. They are particularly interested in ratios such as interest cover and gearing, and will be interested in the nature and longevity of other categories of loan to the entity.
• Customers - interested in assessing the risks which threaten their supplier.

Financial statements - users
• Government entities require special-purpose reports, especially tax computations, general-purpose reports- statistics.
• Media and the general public are also interested in financial statements for a variety of reasons.

Audit and legal implications
• Although laws differ from country to country, an audit of the financial statements of a public company is usually required for investment, financing, and tax purposes. These are usually performed by independent accountants or auditing firms.
• Results of the audit are summarized in an audit report that either provide an unqualified opinion on the financial statements or qualifications as to its fairness and accuracy.
• The audit opinion on the financial statements is usually included in the annual report.

Standards and regulations
• Different countries have developed their own accounting principles over time, making international comparisons of companies difficult.
• Recently there has been a push towards standardizing accounting rules made by the International Accounting Standards Board ("IASB"). IASB develops International Financial Reporting Standards that have been adopted by e.g.Australia, Canada and the European Union (for publicly quoted companies only)
• It ensures uniformity and comparability between financial statements prepared by different companies ( a set of guidelines and rules).

Financial statement analysis
…is the application of analytical tools and techniques to general-purpose financial statements and related data to derive estimates and inferences useful in business analysis. …refers to an assessment of the viability, stability and profitability of a business.… decreases the uncertainty of business analysis, and provides a systematic and effective basis for it.

Comparability problems (Accounting risk )
1. Lack of uniformity in accounting leads to comparability problems.
2. Discretion and imprecision in accounting can distort financial statement information(errors, omissions).
3. Managers might use their discretion in accounting to manipulate or window-dress financial statements.
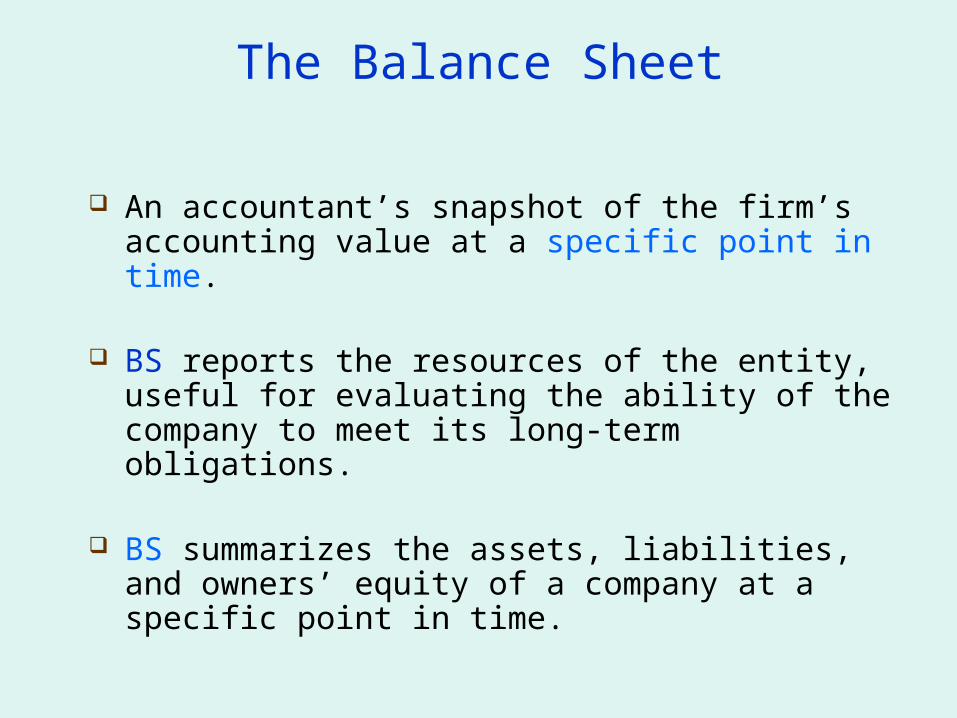
The Balance Sheet
An accountant’s snapshot of the firm’s accounting value at a specific point in time.
BS reports the resources of the entity, useful for evaluating the ability of the company to meet its long-term obligations.
BS summarizes the assets, liabilities, and owners’ equity of a company at a specific point in time.

The Balance Sheet
Current Assets
Fixed Assets
1 Tangible
2 Intangible
Total Value of Assets:
Shareholders’ Equity
Current Liabilities
Long-Term Debt
Total Firm Value to Investors:
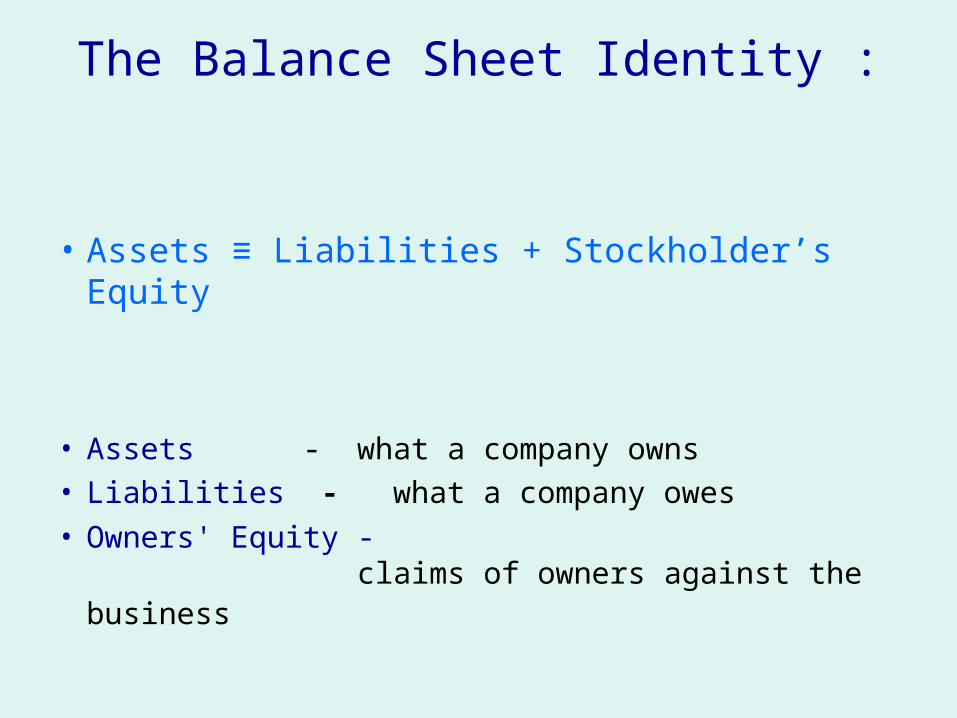
The Balance Sheet Identity :
• Assets ≡ Liabilities + Stockholder’s Equity
• Assets - what a company owns • Liabilities - what a company owes
• Owners' Equity - claims of owners against the business

Assets - valuable resources providing future benefits to the company
• Current assets are assets that quickly and easily can be converted into cash (within 12 months), sometimes at a discount to the purchase price. Current assets include cash, accounts receivable, marketable securities, notes receivable, inventory, and prepaid assets such as prepaid insurance.
• Fixed assets (relatively long life) include tangible assets (land, buildings, and equipment, recorded at historical cost, which often is much lower than the market value), and intangible assets such as trademark, patents.

U.S. Composite Corporation Balance Sheet
2007 2006 2007 2006Current assets: Current Liabilities: Cash and equivalents $140 $107 Accounts payable $213 $197 Accounts receivable 294 270 Notes payable 50 53 Inventories 269 280 Accrued expenses 223 205 Other 58 50 Total current liabilities $486 $455 Total current assets $761 $707
Long-term liabilities:Fixed assets: Deferred taxes $117 $104
Property, plant, and equipment $1,423 $1,274 Long-term debt 471 458 Less accumulated depreciation (550) (460) Total long-term liabilities $588 $562 Net property, plant, and equipment 873 814 Intangible assets and other 245 221 Stockholder's equity: Total fixed assets $1,118 $1,035 Preferred stock $39 $39
Common stock ($1 per value) 55 32 Capital surplus 347 327 Accumulated retained earnings 390 347 Less treasury stock (26) (20) Total equity $805 $725
Total assets $1,879 $1,742 Total liabilities and stockholder's equity $1,879 $1,742
The assets are listed in order by the length of time it would normally take a firm with ongoing operations to convert them into cash.
Average values
Clearly, cash is much more liquid than property, plant, and equipment.

Liabilities (claims to assets)
• represent the portion of a firm's assets that are owed to creditors;
• present obligation of the enterprise arising from past events, the settlement of which is expected to result in an outflow from the enterprise of resources embodying economic benefits
• Current liabilities (expected to be liquidated within a year) include accounts payable, notes payable, interest payable, wages payable, and taxes payable.
• Long-term liabilities (expected not to be liquidated within a year) include mortgages, notes payable and bonds payable.
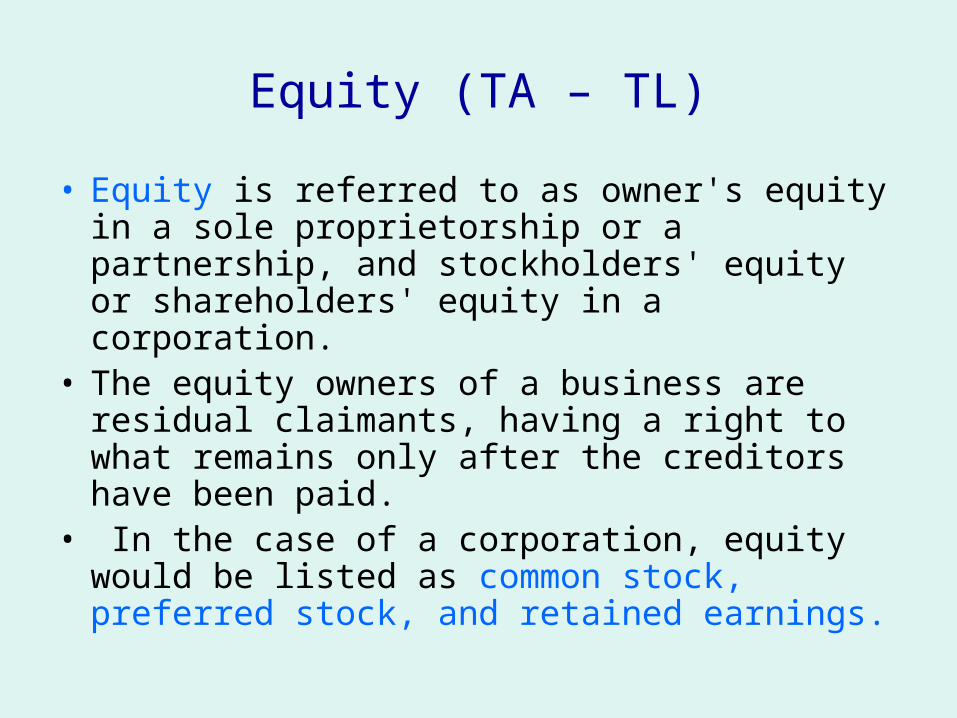
Equity (TA – TL)
• Equity is referred to as owner's equity in a sole proprietorship or a partnership, and stockholders' equity or shareholders' equity in a corporation.
• The equity owners of a business are residual claimants, having a right to what remains only after the creditors have been paid.
• In the case of a corporation, equity would be listed as common stock, preferred stock, and retained earnings.

U.S. Composite Corporation Balance Sheet
Labilities and Owners’ Equity 2007 2006
Total current liabilities 486 455 Accounts payable 213 197
Notes payable 50 53 Accrued expenses 223 205
Long-term debt 588 562Total owners’ equity 805 725 Preferred stck 39 39
Common stock ($1) 55 32 Capital surplus 347 327 Retained earnings 390 347
Total liabilities 1879 1742

The Capital Budgeting Decision
Current Assets
Fixed Assets
1 Tangible
2 IntangibleShareholders’
Equity
Current Liabilities
Long-Term Debt
What long-term investments should the firm choose?
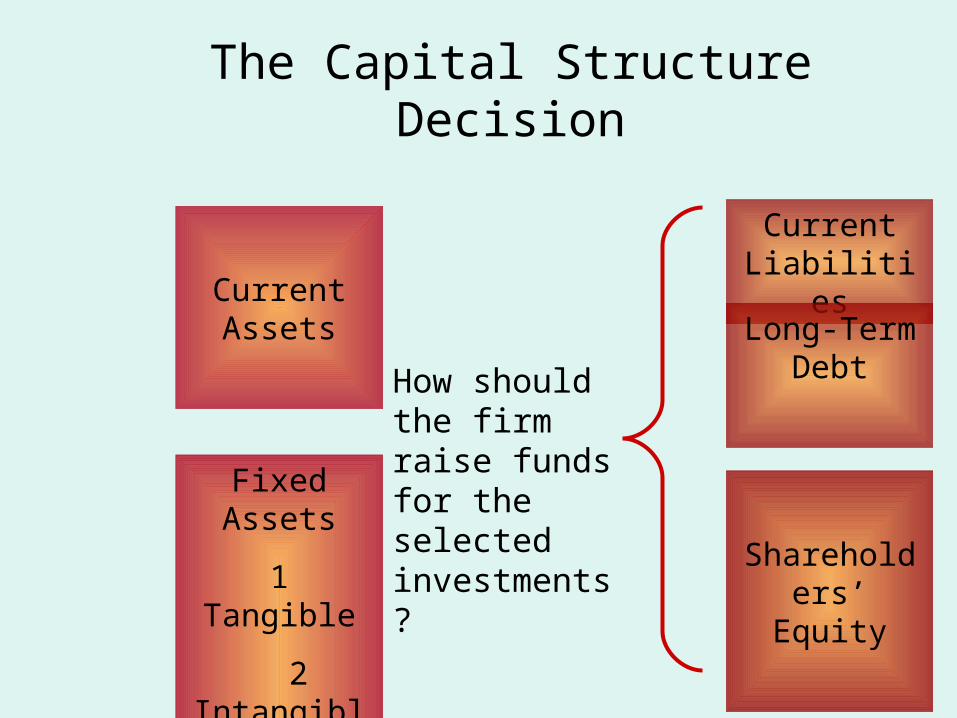
The Capital Structure Decision
How should the firm raise funds for the selected investments?
Current Assets
Fixed Assets
1 Tangible
2 IntangibleShareholders’
Equity
Current Liabilities
Long-Term Debt
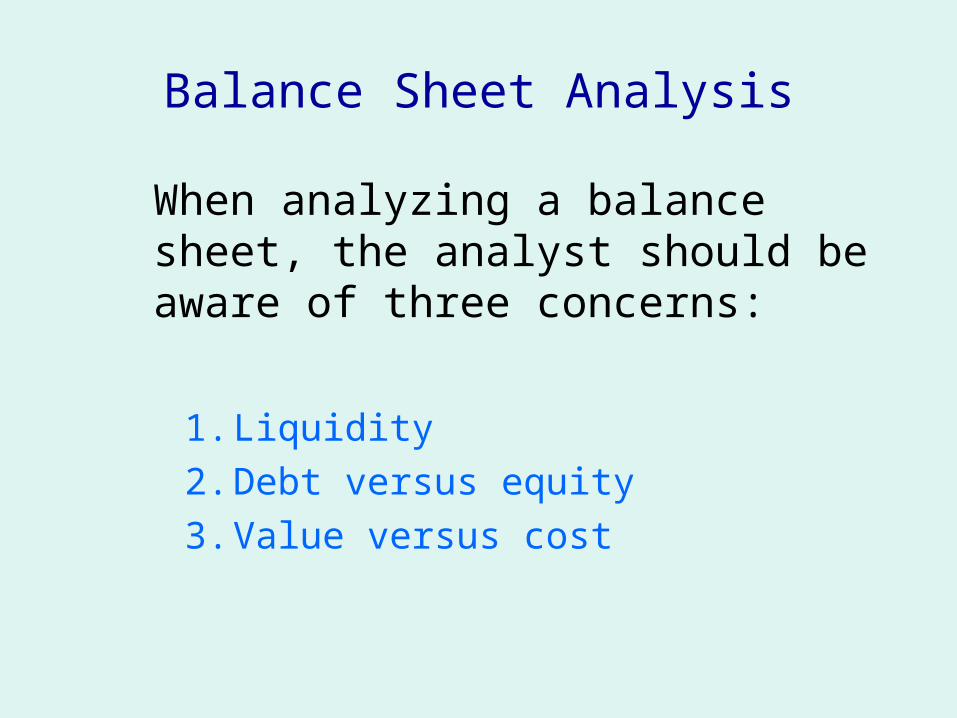
Balance Sheet Analysis
When analyzing a balance sheet, the analyst should be aware of three concerns:
1. Liquidity
2. Debt versus equity
3. Value versus cost

Liquidity
• Refers to the ease and quickness with which assets can be converted to cash—without a significant loss in value (cost, time)
• Current assets are the most liquid.
• The more liquid a firm’s assets, the less likely the firm is to experience problems meeting short-term obligations (financial distress).

Net Working Capital
A measure of both a company's efficiency and its short-term financial health.
Net Working Capital ≡ Current Assets – Current Liabilities
NWC usually grows with the firm
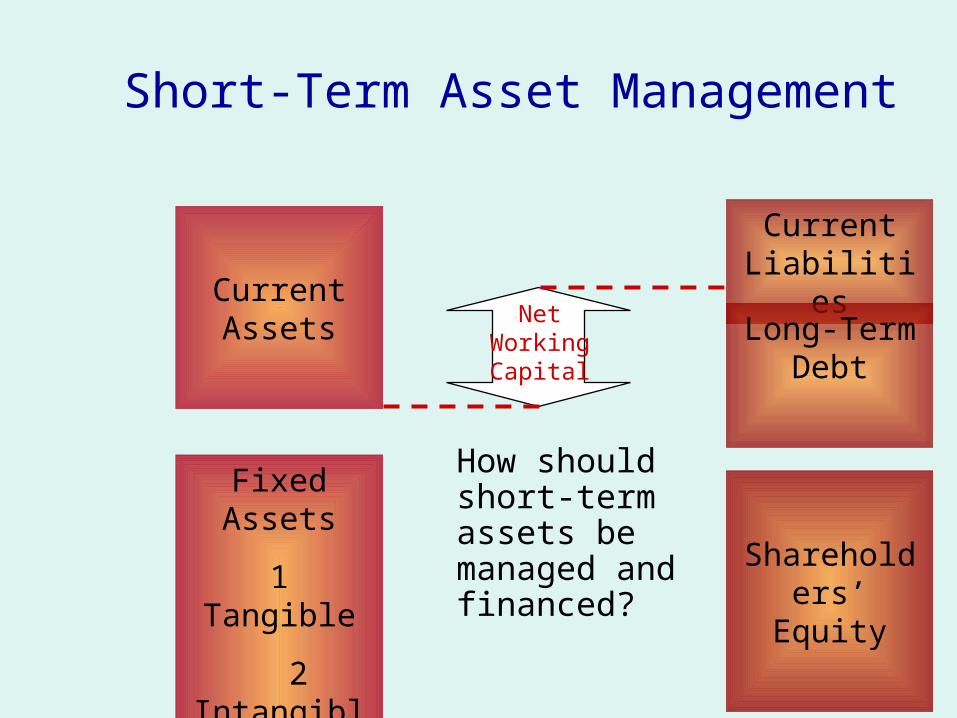
Short-Term Asset Management
How should short-term assets be managed and financed?
Net Working Capital
Shareholders’ Equity
Current Liabilities
Long-Term Debt
Current Assets
Fixed Assets
1 Tangible
2 Intangible

Net Working Capital
• Positive working capital means that the company is able to pay off its short-term liabilities.
• Negative working capital means that a company currently is unable to meet its short-term liabilities with its current assets (cash, accounts receivable and inventory).
• A declining working capital ratio over a longer time period could also be a red flag that warrants further analysis.

U.S.C.C. Balance Sheet
2007 2006 2007 2006Current assets: Current Liabilities: Cash and equivalents $140 $107 Accounts payable $213 $197 Accounts receivable 294 270 Notes payable 50 53 Inventories 269 280 Accrued expenses 223 205 Other 58 50 Total current liabilities $486 $455 Total current assets $761 $707
Long-term liabilities:Fixed assets: Deferred taxes $117 $104 Property, plant, and equipment $1,423 $1,274 Long-term debt 471 458 Less accumulated depreciation (550) (460 Total long-term liabilities $588 $562 Net property, plant, and equipment 873 814 Intangible assets and other 245 221 Stockholder's equity: Total fixed assets $1,118 $1,035 Preferred stock $39 $39
Common stock ($1 par value) 55 32 Capital surplus 347 327 Accumulated retained earnings 390 347 Less treasury stock (26) (20) Total equity $805 $725
Total assets $1,879 $1,742 Total liabilities and stockholder's equity $1,879 $1,742
Here we see NWC grow to $275 million in 2006 from $252 million in 2005.
This increase of $23 million is an investment of the firm.
$23 million
$275m = $761m- $486m
$252m = $707- $455
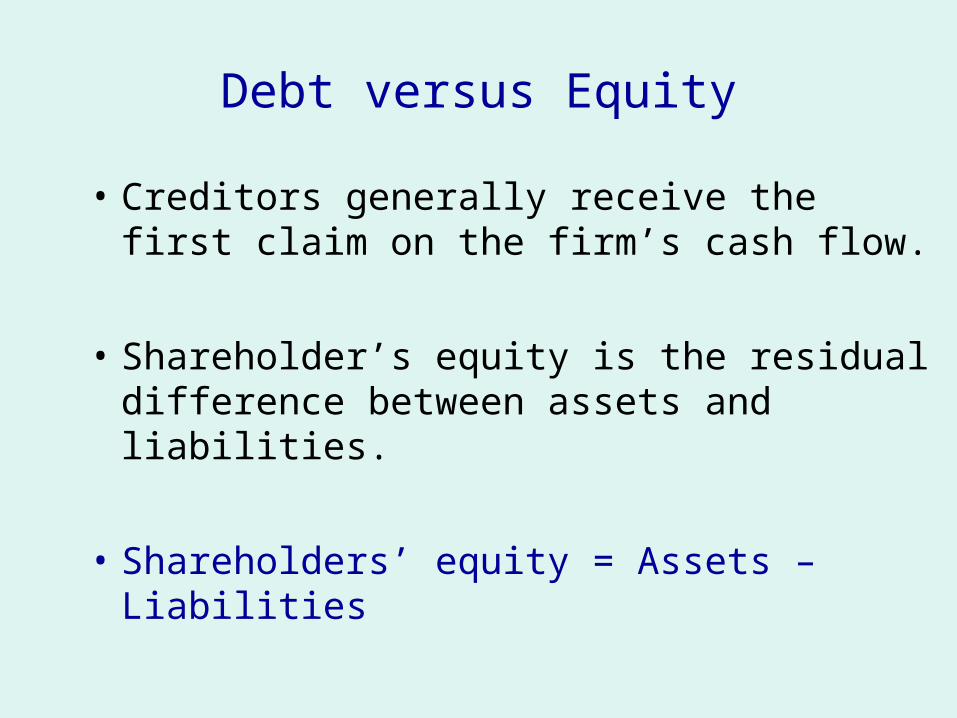
Debt versus Equity
• Creditors generally receive the first claim on the firm’s cash flow.
• Shareholder’s equity is the residual difference between assets and liabilities.
• Shareholders’ equity = Assets – Liabilities

Capital Structure
The value of the firm can be thought of as a pie.
The goal of the manager is to increase the size of the pie.
The Capital Structure decision can be viewed as how best to slice the pie.
If how you slice the pie affects the size of the pie, then the capital structure decision matters.
50% Debt
50% Equity
25% Debt
75% Equity
70% Debt
30% Equity

Value versus Cost
• Under Generally Accepted Accounting Principles (GAAP), audited financial statements of firms in the U.S. carry assets at cost.
• Market value is the price at which the assets, liabilities, and equity could actually be bought or sold, which is a completely different concept from historical cost.

The Income Statement (a video)
• measures financial performance (the results of the entity's operations) over a specific period of time.
• summarizes the revenues and expenses of a company for a period of time.
• The accounting definition of income is:
Revenue – Expenses ≡ Income
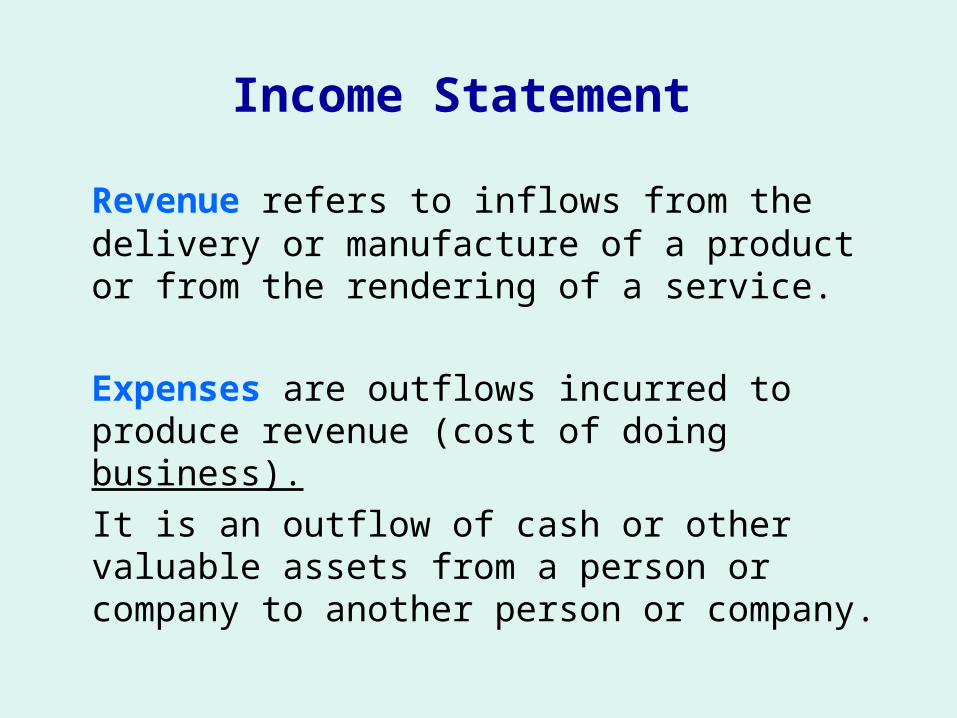
Income Statement
Revenue refers to inflows from the delivery or manufacture of a product or from the rendering of a service.
Expenses are outflows incurred to produce revenue (cost of doing business).
It is an outflow of cash or other valuable assets from a person or company to another person or company.

U.S.C.C. Income Statement
Total operating revenuesCost of goods soldSelling, general, and administrative expensesDepreciation
Operating incomeOther incomeEarnings before interest and taxesInterest expensePretax incomeTaxes Current: $71 Deferred: $13Net income Addition to retained earnings $43 Dividends: $43
The operations section of the income statement reports the firm’s revenues and expenses from principal operations.
$2,262 1,655
327 90
$190 29
$219 49
$170 84
$86

Total operating revenues $2,262Cost of goods sold 1,655Selling, general, and administrative expenses 327Depreciation 90Operating income $190Other income 29
Earnings before interest and taxes $219Interest expense 49
Pretax income $170Taxes 84 Current: $71 Deferred: $13Net income $86 Addition to retained earnings: $43 Dividends: $43
The non-operating section of the income statement includes all financing costs, such as interest expense.
U.S.C.C. Income Statement

Total operating revenuesCost of goods soldSelling, general, and administrative expensesDepreciationOperating incomeOther incomeEarnings before interest and taxesInterest expensePretax incomeTaxes Current: $71 Deferred: $13Net income Retained earnings: $43 Dividends: $43
Net income is the “bottom line.”
$2,262 1,655
327 90
$19029
$219 49
$170 84
$86
U.S.C.C. Income Statement

Cash Flow Statement
• The nature of accrual accounting is such that a company may be profitable but nonetheless experience a shortfall in cash.
• The statement of cash flows is useful in evaluating a company's ability to pay its bills. For a given period, the cash flow statement provides the following information:– Sources of cash – Uses of cash – Change in cash balance

Cash Flow Statement
• The financial statement that summarizes an entity’s cash receipts and cash payments during the period. It breaks the sources and uses of cash into the following categories:– operating activities – concerned with the acquisition
and sale of products and services– investing activities – concerned with the acquisition
and disposal of long-term assets– Financing activities - concerned with the raising and
repayment of funds in the form of debt and equity.

Financial Cash Flow
• The information used to construct the cash flow statement comes from the beginning and ending balance sheets for the period and from the income statement for the period.
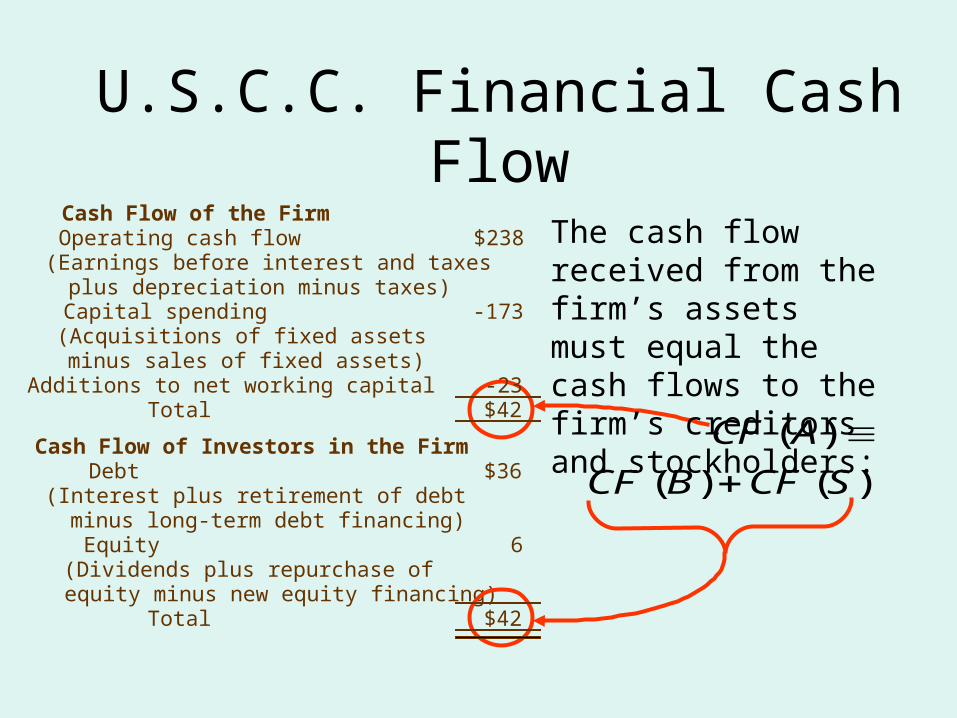
• the cash flow received from the firm’s assets must equal the cash flows to the firm’s creditors and stockholders.
CF(A)≡ CF(C) + CF(S)

CASH FLOW EQUATIONS – Cash flow from assets
Cash flow from assets = operating cash flow – net capital spending - Change in net working capital
OCF = EBIT + depreciation – taxes
NCS = ending net fixed assets – beginning net fixed assets + depreciation
change in NWC = ending NWC – begining NWC
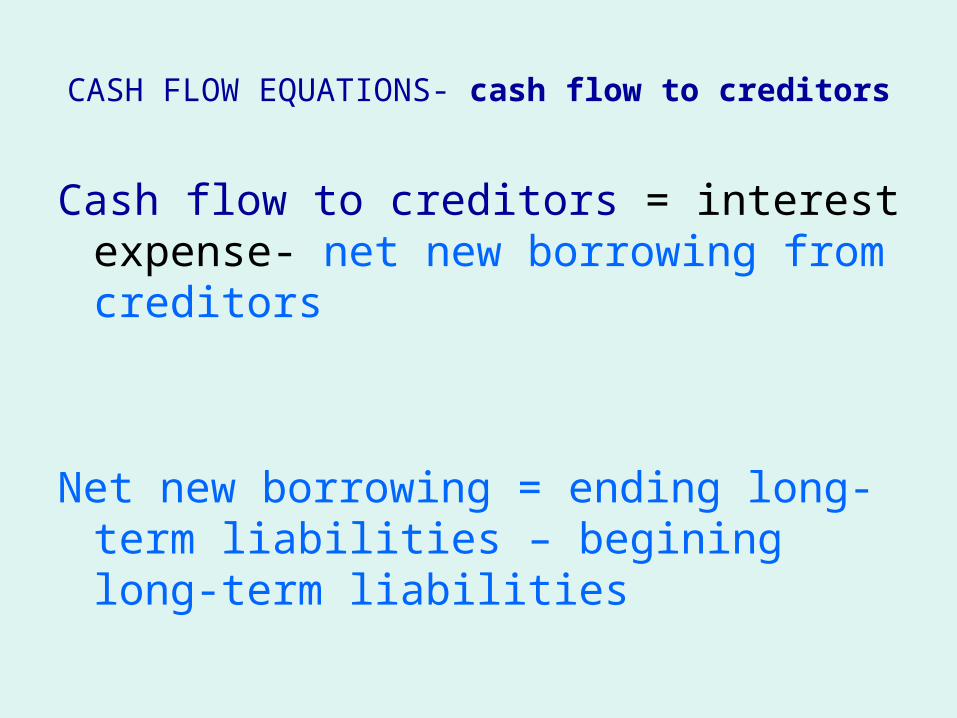
CASH FLOW EQUATIONS- cash flow to creditors
Cash flow to creditors = interest expense- net new borrowing from creditors
Net new borrowing = ending long-term liabilities – begining long-term liabilities
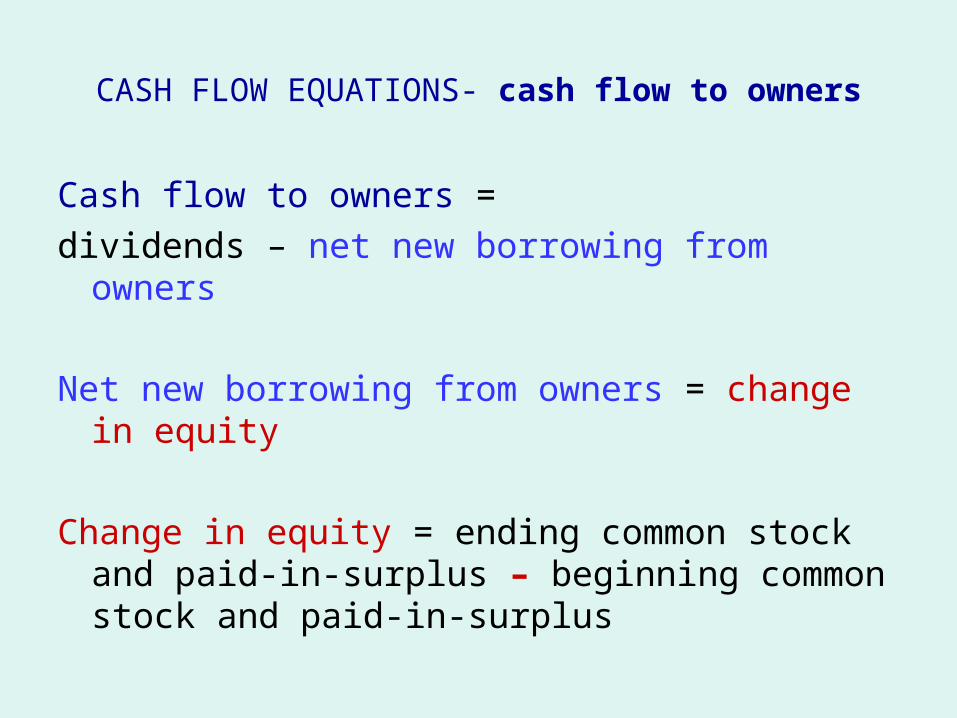
CASH FLOW EQUATIONS- cash flow to owners
Cash flow to owners =
dividends – net new borrowing from owners
Net new borrowing from owners = change in equity
Change in equity = ending common stock and paid-in-surplus – beginning common stock and paid-in-surplus

U.S.C.C. Financial Cash Flow
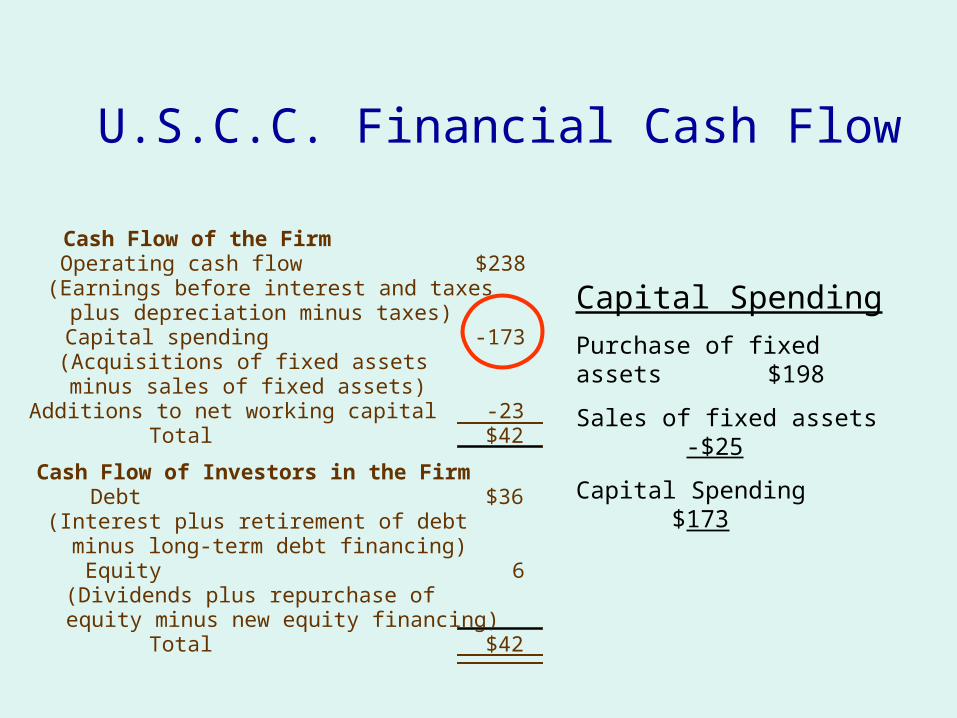
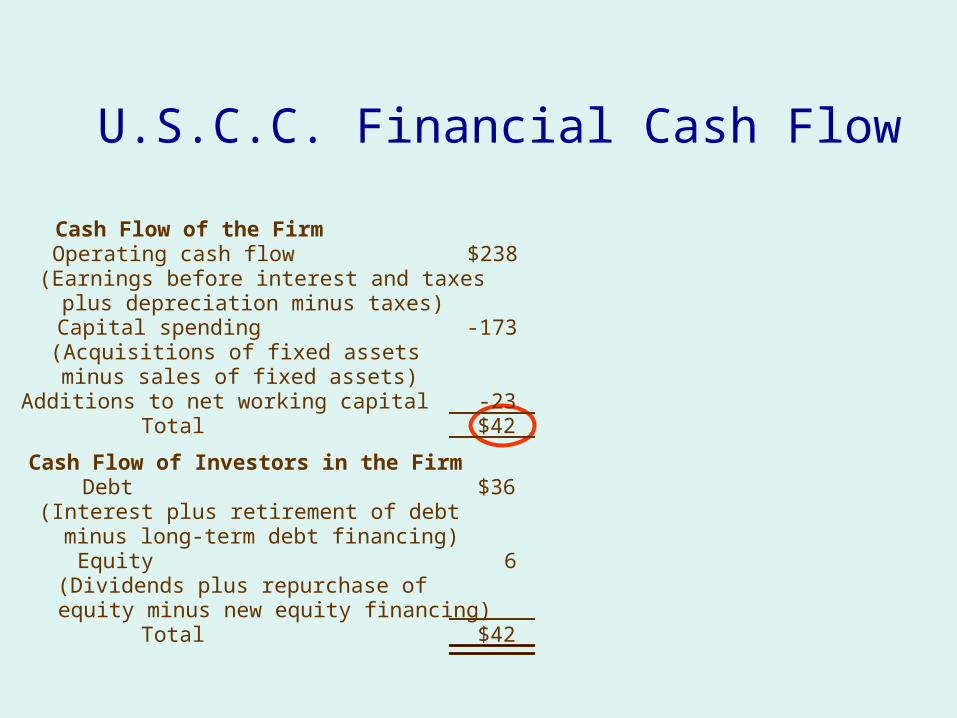
Cash Flow of the FirmOperating cash flow $238 (Earnings before interest and taxes plus depreciation minus taxes)Capital spending -173 (Acquisitions of fixed assets minus sales of fixed assets)Additions to net working capital -23 Total $42
Cash Flow of Investors in the FirmDebt $36 (Interest plus retirement of debt minus long-term debt financing)Equity 6 (Dividends plus repurchase of equity minus new equity financing) Total $42
Operating Cash Flow:
EBIT $219
Depreciation $90
Current Taxes -$71
OCF $238
U.S.C.C. Financial Cash Flow
Cash Flow of the FirmOperating cash flow $238 (Earnings before interest and taxes plus depreciation minus taxes)Capital spending (Acquisitions of fixed assets minus sales of fixed assets)Additions to net working capital Total
Cash Flow of Investors in the FirmDebt (Interest plus retirement of debt minus long-term debt financing)Equity (Dividends plus repurchase of equity minus new equity financing) Total
Capital Spending
Purchase of fixed assets $198
Sales of fixed assets -$25
Capital Spending $173
-173
-23$42
$36
6
$42

U.S.C.C. Financial Cash Flow
Cash Flow of the FirmOperating cash flow $238 (Earnings before interest and taxes plus depreciation minus taxes)Capital spending (Acquisitions of fixed assets minus sales of fixed assets)Additions to net working capital Total
Cash Flow of Investors in the FirmDebt (Interest plus retirement of debt minus long-term debt financing)Equity (Dividends plus repurchase of equity minus new equity financing) Total
NWC grew from $275 million in 2007 from $252 million in 2006.
This increase of $23 million is the addition to NWC.
-173
-23$42
$36
6
$42
U.S.C.C. Financial Cash Flow
Cash Flow of the FirmOperating cash flow $238 (Earnings before interest and taxes plus depreciation minus taxes)Capital spending (Acquisitions of fixed assets minus sales of fixed assets)Additions to net working capital Total
Cash Flow of Investors in the FirmDebt (Interest plus retirement of debt minus long-term debt financing)Equity (Dividends plus repurchase of equity minus new equity financing) Total
-173
-23$42
$36
6
$42

U.S.C.C. Financial Cash Flow
Cash Flow of the FirmOperating cash flow $238 (Earnings before interest and taxes plus depreciation minus taxes)Capital spending (Acquisitions of fixed assets minus sales of fixed assets)Additions to net working capital Total
Cash Flow of Investors in the FirmDebt (Interest plus retirement of debt minus long-term debt financing)Equity (Dividends plus repurchase of equity minus new equity financing) Total
Cash Flow to Creditors
Interest$49
Retirement of debt 73
Debt service 122
Proceeds from new debt sales -86
Total $36
-173
-23$42
$36
6
$42

U.S.C.C. Financial Cash Flow
Cash Flow of the FirmOperating cash flow $238 (Earnings before interest and taxes plus depreciation minus taxes)Capital spending (Acquisitions of fixed assets minus sales of fixed assets)Additions to net working capital Total
Cash Flow of Investors in the FirmDebt (Interest plus retirement of debt minus long-term debt financing)Equity (Dividends plus repurchase of equity minus new equity financing) Total
Cash Flow to Stockholders
Dividends $43
Repurchase of stock 6
Cash to Stockholders 49
Proceeds from new stock issue -43
Total $6
-173
-23$42
$36
6
$42
U.S.C.C. Financial Cash FlowCash Flow of the FirmOperating cash flow $238 (Earnings before interest and taxes plus depreciation minus taxes)Capital spending (Acquisitions of fixed assets minus sales of fixed assets)Additions to net working capital Total
Cash Flow of Investors in the FirmDebt (Interest plus retirement of debt minus long-term debt financing)Equity (Dividends plus repurchase of equity minus new equity financing) Total
)()(
)(
SCFBCF
ACF
The cash flow received from the firm’s assets must equal the cash flows to the firm’s creditors and stockholders:
-173
-23$42
$36
6
$42
U.S.C.C. Cash Flow from Operations
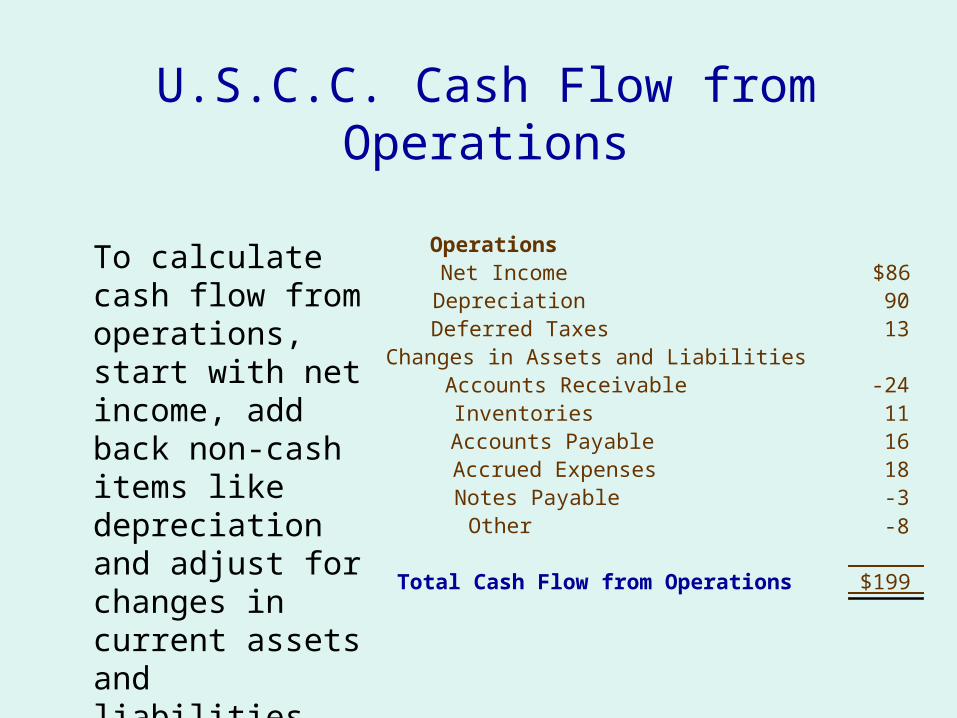
To calculate cash flow from operations, start with net income, add back non-cash items like depreciation and adjust for changes in current assets and liabilities (other than cash).
OperationsNet IncomeDepreciationDeferred TaxesChanges in Assets and Liabilities
Accounts ReceivableInventoriesAccounts PayableAccrued ExpensesNotes PayableOther
Total Cash Flow from Operations
$869013
-24111618-3
$199
-8
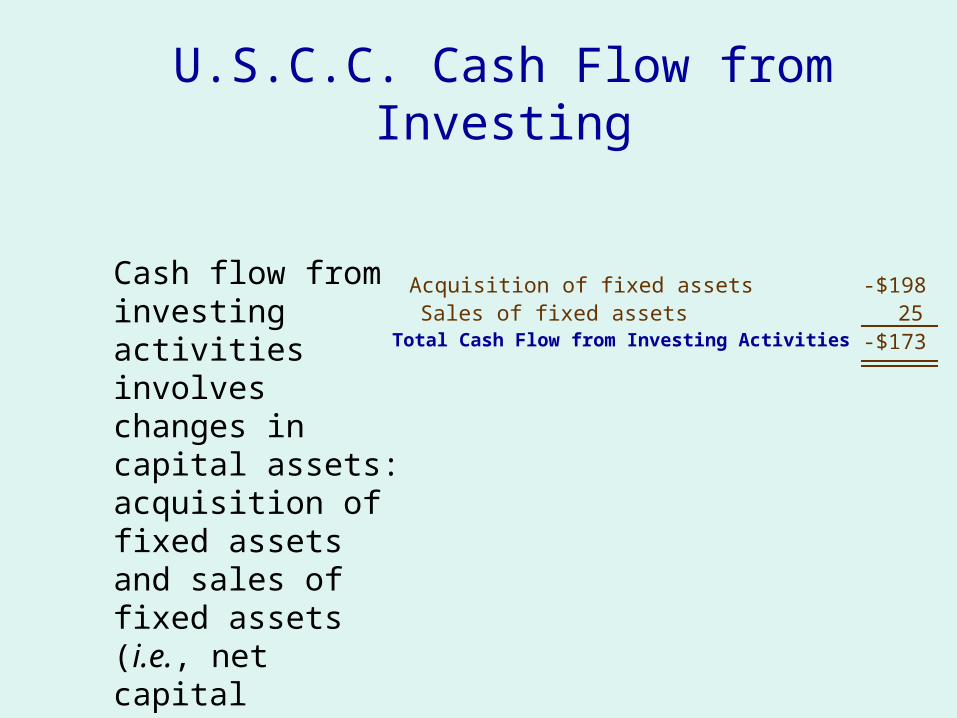
U.S.C.C. Cash Flow from Investing
Cash flow from investing activities involves changes in capital assets: acquisition of fixed assets and sales of fixed assets (i.e., net capital expenditures).
Acquisition of fixed assetsSales of fixed assets
Total Cash Flow from Investing Activities
-$19825
-$173

U.S.C.C. Cash Flow from Financing
Cash flows to and from creditors and owners include changes in equity and debt.
Retirement of debt (includes notes)Proceeds from long-term debt salesDividendsRepurchase of stockProceeds from new stock issue
Total Cash Flow from Financing
-$73 86
-43
43
$7
-6

U.S.C.C. Statement of Cash Flows
The statement of cash flows is the addition of cash flows from operations, investing, and financing.
OperationsNet IncomeDepreciationDeferred TaxesChanges in Assets and Liabilities
Accounts ReceivableInventoriesAccounts PayableAccrued ExpensesNotes PayableOther
Total Cash Flow from Operations
$869013
-24111618-3
$199-8
Acquisition of fixed assetsSales of fixed assets
Total Cash Flow from Investing Activities
-$19825
-$173
Investing Activities
Financing ActivitiesRetirement of debt (includes notes)Proceeds from long-term debt salesDividendsRepurchase of stockProceeds from new stock issue
Total Cash Flow from Financing
-$7386-43
43$7
-6
Change in Cash (on the balance sheet) $33
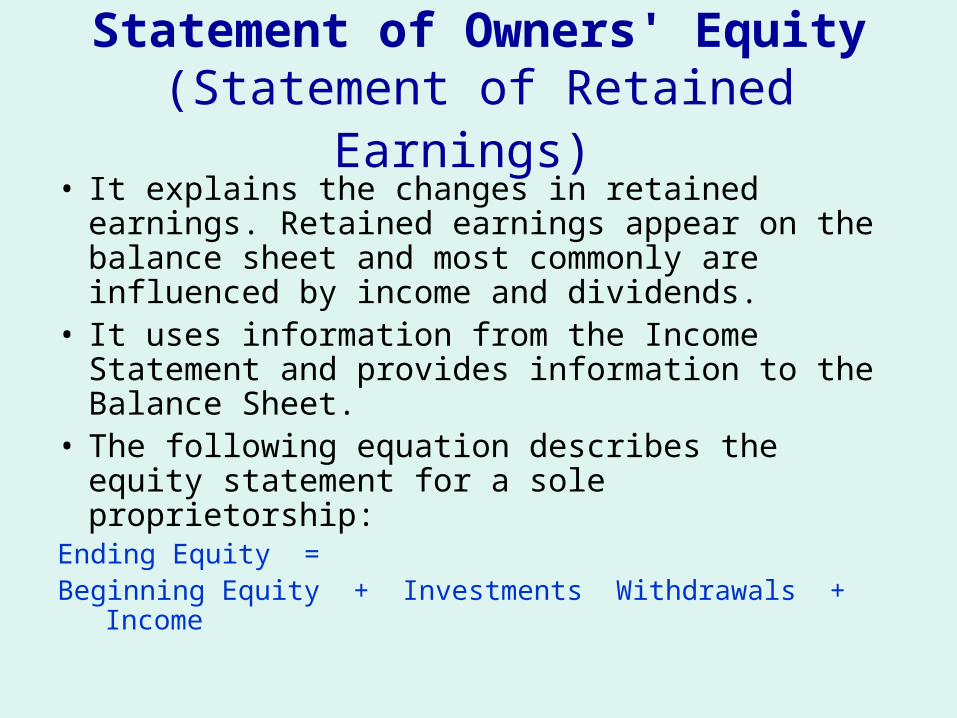
Statement of Owners' Equity (Statement of Retained Earnings)
• It explains the changes in retained earnings. Retained earnings appear on the balance sheet and most commonly are influenced by income and dividends.
• It uses information from the Income Statement and provides information to the Balance Sheet.
• The following equation describes the equity statement for a sole proprietorship:
Ending Equity = Beginning Equity + Investments Withdrawals + Income

The stockholders' equity in a corporation is calculated:
Common Stock (recorded at par value) + Premium on Common Stock (issue price minus par value) + Preferred Stock (recorded at par value) + Premium on Preferred Stock (issue price minus par value) + Retained Earnings ---------------------------------------------------------------- = Stockholders' Equity
• Note that the premium on the issuance of stock is based on the price at which the corporation actually sold the stock on the market. Afterwards, market trading does not affect this part of the equity calculation. Stockholders' equity does not change when the stock price changes!

Methods of financial statements analysis
• Horizontal analysis – a comparison of financial statement items over a period of time.
• Vertical analysis – a comparison of various financial statement items within a single period with the use of commonsize statements.

Financial Statements Analysis
• Common-Size Balance Sheets (Vertical) – Compute all accounts as a percent of total assets
• Common-Size Income Statements– Compute all line items as a percent of sales
Standardized statements make it easier to compare financial information, particularly as the company grows.
They are useful for comparing companies of different sizes, particularly within the same industry.

Using Financial Statements
• Ratios are not very helpful by themselves: they need to be compared to something
• Time-Trend Analysis– Used to see how the firm’s performance is
changing through time
• Peer Group Analysis– Compare to similar companies or within
industries

Methods
• Past Performance - Across historical time periods for the same firm (the last 5 years for example),
• Future Performance - Using historical figures and certain mathematical and statistical techniques, including present and future values. This extrapolation method is the main source of errors in financial analysis as past statistics can be poor predictors of future prospects.
• Comparative Performance - Comparison between similar firms.