Formative Evaluation of Students at Quest to Learnmyweb.fsu.edu/vshute/pdf/Q2L evaluation.pdf1...
40
1 Formative Evaluation of Students at Quest to Learn Valerie J. Shute, Florida State University, Matthew Ventura, Florida State University, Robert Torres, Bill & Melinda Gates Foundation Abstract Quest to Learn (Q2L) is a public school that opened in 2009 to respond to the needs of kids who are growing up in a highly networked, globally competitive and complex world. The school was designed to include a game-based pedagogy that provides a dynamic, interdisciplinary curriculum, as well as immersive, challenge-based learning experiences. The present article reports the findings from a 20-month evaluation of Q2L. This research was launched when the school opened, with the main goal to identify and assess a set of key student competencies that are relevant and important to Q2L. This student-level evaluation focused on students’ development of three core skills (i.e., systems thinking, time management, and teamwork) over the 20-month time period. We found that students significantly improved their systems thinking skills over the duration of the study, and improved (albeit, not significantly) on their time management and teamwork skills as well. Keywords: assessment, evidence-centered design, game-based pedagogy
Transcript of Formative Evaluation of Students at Quest to Learnmyweb.fsu.edu/vshute/pdf/Q2L evaluation.pdf1...

1
Formative Evaluation of Students at Quest to Learn
Valerie J. Shute, Florida State University,
Matthew Ventura, Florida State University,
Robert Torres, Bill & Melinda Gates Foundation
Abstract
Quest to Learn (Q2L) is a public school that opened in 2009 to respond to the needs
of kids who are growing up in a highly networked, globally competitive and complex
world. The school was designed to include a game-based pedagogy that provides a
dynamic, interdisciplinary curriculum, as well as immersive, challenge -based
learning experiences. The present article reports the findings from a 20-month
evaluation of Q2L. This research was launched when the school opened, with the
main goal to identify and assess a set of key student competencies that are relevant
and important to Q2L. This student-level evaluation focused on students’
development of three core skills (i.e., systems thinking, time management, and
teamwork) over the 20-month time period. We found that students significantly
improved their systems thinking skills over the duration of the study, and improved
(albeit, not significantly) on their time management and teamwork skills as well.
Keywords: assessment, evidence-centered design, game-based pedagogy
2
Formative Evaluation of Student Learning at Quest to Learn
Much education today is monumentally ineffective. All too often we are giving young
people cut flowers when we should be teaching them to grow their own plants. J. W.
Gardner
Children growing up in the 21st century need to be able to think differently from
kids in past generations. When confronted with complex problems, they need to be able
to think creatively, systemically, critically, as well as work collaboratively with others
(e.g., Resnick 2007; The Partnership for 21st Century Skills 2006). In contrast to these
needs, current educational practices typically adhere to outdated theories of learning and
pedagogy, evidenced by a so-called “content fetish” (Gee 2005). That is, schools focus on
increasing students’ proficiency in traditional subjects such as math and reading, via
didactic approaches, which leaves many students disengaged. Schools that depart from
the entrenched pedagogy are the exception to the rule.
Quest to Learn (Q2L) is one of these exceptions. Q2L was designed to respond to
the needs of kids who are growing up in a digital, information-rich, globally competitive
and complex world. Designed to serve students in grades 6-12 school, the school
currently houses about 240 students in grades 6-8, and will add one grade each year until
full capacity is reached in 2015 with approximately 560 students. It opened in 2009 as a
regular (non-charter) New York City Department of Education public school in
Manhattan’s Community School District 2. Students are selected through an open lottery
system; admission is not based on prior academic achievement. A sister school to Q2L,
called ChicagoQuest, which uses its game-based curricular model, opened in Chicago in
2011. Both schools are intended to enable all students, regardless of their academic or

3
personal challenges, to contribute to the design and innovation necessary to meet the
needs and demands of a global knowledge society. The model provides a learning
environment that includes a dynamic, interdisciplinary curriculum, as well as immersive,
challenge-based learning experiences (Salen, Torres, Wolozin, Rufo-Tepper, and Shapiro
2011). Towards that end, the model’s culture and pedagogy aim to foster deep curiosity
for lifelong learning as well as a commitment to social responsibility, and respect for
others and self. For more, see http://q2l.org/.
Background: Q2L Curriculum and Assessment
The Q2L curriculum is inspired by the notion that learning is not simply an
individualized affair, but a highly social, context-dependent and collaborative
achievement (e.g., Bransford, Brown, and Cocking 2000; Lave and Wenger 1991;
Vygotsky 1978). Q2L uses a systems-thinking framework as a core curricular and
pedagogical strategy. Systems thinking is defined as a holistic perspective that sees the
world as increasingly interconnected and can be understood as progressively
interconnected, from elemental components to complex systems of activity (e.g., Assaraf
and Orion 2005; Barak and Williams 2007; Forrester 1994; Ossimitz 2000; Salisbury
1996). This broad definition includes social, natural, and technological systems that can
be studied and understood as having certain cross-cutting commonalities, such as rules,
goals, and particular behaviors.
The school also employs a game-based pedagogy, designed by teachers,
professional game designers, curriculum directors, and other content experts.
Collectively, they create a series of 10-week "missions" (i.e., units of study) which

4
comprise an immersive world in which students take on various identities—from
cartographers to architects to zoologists—to solve design and systems-based problems.
Beyond simply employing games to teach, Q2L uses the internal architecture of
games to create gamelike learning environments, whether they are analog or digital.
Games instantiate constrained systems of activity (or worlds) in which players engage
mediational tools, other players, and rule sets to achieve clearly defined winning (or goal)
conditions. This requires players to enact specific game behaviors. These behaviors in the
gaming world are called core mechanics, which players must perform to successfully
complete a game. In the classroom, similar behaviors are required to successfully acquire
new knowledge and skills.
To suit the needs of the 21st century, learning environments should reflect
knowledge domains (or discourse communities) that reflect the epistemology of current
real world professional and/or industry domains. That is, learners should be offered
opportunities to apply the actual kinds of knowledge, skills, values, and behaviors (i.e.,
core mechanics) needed to participate in the domain of, say, U.S. history, journalism, or
cellular biology. Learners should be offered genuine and ample opportunities to produce
and iterate on content endemic to real knowledge domains. In other words, students
should be learning to grow their own flowering plants, in line with our opening quote.
Q2L strives to create meet these goals. Moreover, Q2L students are provided with (and
often establish on their own) communities of practice where they can collaborate and
informally (or formally) share their work with a community of peers (as well as with
teachers, game and curriculum designers, as warranted). Similarly, the gamelike
curriculum at Q2L is intended to engage students in collaborations with others to

5
complete various tasks. Many quests (i.e., smaller units of a mission) are designed for
students to work with others by integrating different types of expertise and providing
ongoing feedback to each other.
The school also employs a distinctive approach to assessment. The basic principle
of assessment at Q2L is that assessment should be embedded within learning and it
should exist in situ—located in the discourse and actions of students and teachers (Salen,
Torres, Wolozin, Rufo-Tepper, and Shapiro 2011). Therefore, students’ knowledge and
performance is currently assessed at Q2L by holistic and qualitative techniques such as
interviews and observations. As part of the original design documents, Q2L has three
learning dimensions—civic and social-emotional learning, design, and content—that
guide the curriculum and assessment.
Table 1 Three Learning Dimensions of Q2L
Dimension 1:
Civic & Social-Emotional Learning
Dimension 2:
Design
Dimension 3:
Content
Learning from peers and others Systems Thinking Code Worlds
Planning, organizing, adapting, and
managing goals and priorities
Iteration Wellness
Persisting to overcome complex
challenges
Digital media tool use The Way Things Work
Table 1 (adapted from Salen, Wolozin, Rufo-Tepper, and Shapiro 2011) depicts
some of the specific and valued competencies that undergird and frame Q2L. Assessment
in Q2L does not focus only on how much a student knows the content, but rather, how
6
she uses what she knows while displaying other important 21st competencies (e.g.,
systems thinking, teamwork, and time management skills).
Research Approach
Quest to Learn redefines what a school looks like, feels like, and what kids need
to learn to succeed—at school and life. Ultimately, Q2L may be able to provide a new
school model for 21st century learning. Before the model is applied more broadly, we first
need to answer some important questions. For instance, how do we define what
comprises “success” at Q2L? How do we know if (and to what degree) Q2L is
accomplishing its goals? Our 20-month study (September 2009 – May 2011) was
implemented as a preliminary attempt to answer these questions related to Q2L. The
answer to the first question, concerning the identification of important school-level
variables, was described elsewhere (see Shute and Torres, 2012). Our second question
examines growth in focal student-level variables and is the focus of the present paper.
We set up our study to coincide with the school opening in September 2009. Our
main research goal herein was to identify and assess a set of key student competencies
that are relevant and important to Q2L.
Student-Level Evaluation
The purpose of this paper is to report the results of our assessment of specific 21st
century competencies that have been identified as being important to the school. We
periodically assessed the following three competencies during the 20-month period: (1)
systems thinking skill, (2) teamwork (i.e., learning from peers and others), and (3) time
management skill (i.e., planning, organizing, and managing goals and priorities).

7
We selected these three competencies because (a) they were identified in the
original Q2L design documents as core competencies that the school intended to support
(see Table 1), (b) they were consistently identified by QL stakeholders/interviewees and
were included in the school objectives model (see Shute and Torres, 2012), and (c)
validated assessment instruments for these three competencies already exist. Each of
these competencies has its own set of facets. Figure 1 (1a, 1b, 1c) shows the three
competencies and their facets.
Our assessment for the systems thinking skill (Figure 1a) is based on the protocol
employed by Sweeney and Sterman (2007). For the teamwork model (Figure 1b), we
synthesized research described by the following: Rysavy and Sales (1991); Tindale,
Stawiski, and Jacobs (2008); Totten, Sills, Digby, and Russ (1991); Van den Bossche,
Segers, and Kirschner (2006); and Zhuang, MacCann, Wang, Liu, and Roberts (2008).
The three-factor solution shown in Figure 1b has been consistently reported for this
variable relative to middle- and high-school students (see Zhuang et al., 2008). Finally,
our time management model (Figure 1c) was based on the findings of Liu, Rijmen,
MacCann, and Roberts (2009); MacCann, Duckworth, and Roberts (2009); Macan,
Shahani, Dipboye, and Phillips (1990); and Roberts, Schultze, and Minsky (2006). This
two-factor solution has been reported relative to middle-school students.

8
Figure 1 Three competency models for student assessment at Q2L
The first research question that we addressed related to student assessment was:
Does the incoming cohort of 6th grade students at Q2L demonstrate improved
performance over 20 months in the areas of systems thinking, teamwork, and time
management skills? These three competencies are supported (albeit implicitly) during the
course of daily school activities (e.g., completing projects in small groups, designing
games).
In addition, we examined this cohort’s academic achievement (i.e., mathematics
and reading skills) in relation to New York state standardized tests. Thus the second
research question is: Do the three focal competencies predict academic achievement
relative to the state mandated math and reading test scores? We tested whether Q2L is
successfully supporting students’ development of important new competencies as a

9
function of its unique environment, while not sacrificing traditional (i.e., math and
reading) academic achievements.
In relation to our first research question, we hypothesized that students will, on
average, demonstrate improved performance in relation to the three focal competencies
from the initial (Time 1, September 2009) to the final (Time 4, May 2011) assessment. In
terms of research question 2, we hypothesized that there will be significant relationships
among our three competencies and the annual standardized state test scores, despite the
fact that there are no explicit math and reading courses at Q2L. Rather, the courses are
interdisciplinary in nature—where math and reading skills, along with systems thinking
and design thinking skills are exercised in various courses like Code Worlds and The
Way Things Work.
As noted earlier, we used existing instruments to assess our three focal
competencies during this research project. The systems thinking competency was
assessed using a modified version of the protocol described in Torres’ recent (2009)
dissertation on the topic, which in turn was based on the protocol described in Sweeney
and Sterman (2007). There are 12 constructed-response items in this assessment, with
different examples of systems used across administrations (e.g., hunger/eating vs.
predator/prey relations). Appendix 1 includes the full set of questions used in the ST
assessment.
Teamwork and time management skills were measured via instruments that have
been designed, developed, and validated by the Educational Testing Service for use by
middle school students (see, for example, MacCann, Duckworth, and Roberts 2009;
Wang, MacCann, Zhuang, Liu, and Roberts 2009; Zhuang, MacCann, Wang, Liu, and

10
Roberts 2008). The first teamwork assessment contained 57 Likert-scale items and 12
scenario-based items, but subsequent administrations of the assessment used fewer items
(i.e., 22 Likert-scale items that had the strongest weights on the three focal factors—
cooperating, negotiating, and influencing others, along with 12 scenario-based items).
The first time management assessment contained 36 Likert-scale items, and subsequent
administrations employed only 24 items (again, those weighting most strongly on the
focal two factors—making plans and meeting deadlines). The items comprising the
assessments for both the teamwork and time management skills are presented in
Appendices 2 and 3.
Example items (with text boxes for entering constructed responses) from the
systems thinking protocol include: How are hunger and eating related or connected to
each other? If you just finished eating, what happens to your level of hunger over time?
Can you think of another situation that feels or seems like the same as this? Rubrics have
been adapted from Torres’ (2009) and Sweeney and Sterman’s (2007) research to score
the responses. For instance, there are five levels for the systems thinking rubric (from 0 to
4). Each level contains a description as well as multiple examples of student responses
for each of the three main variables: dynamic thinking, closed-loop thinking, and transfer
of models (i.e., Level 0: Incorrect or non-applicable response; Level 1: Describes static
interconnections; Level 2: Describes aspects of system structures and behaviors; Level 3:
Demonstrates understanding of principles guiding system behaviors (though descriptions
may be limited); and Level 4: Full utilization of systems intelligence, such as a
description of a system at multiple levels). See Table 2 for the five scoring levels across
the three main facets of ST.

11
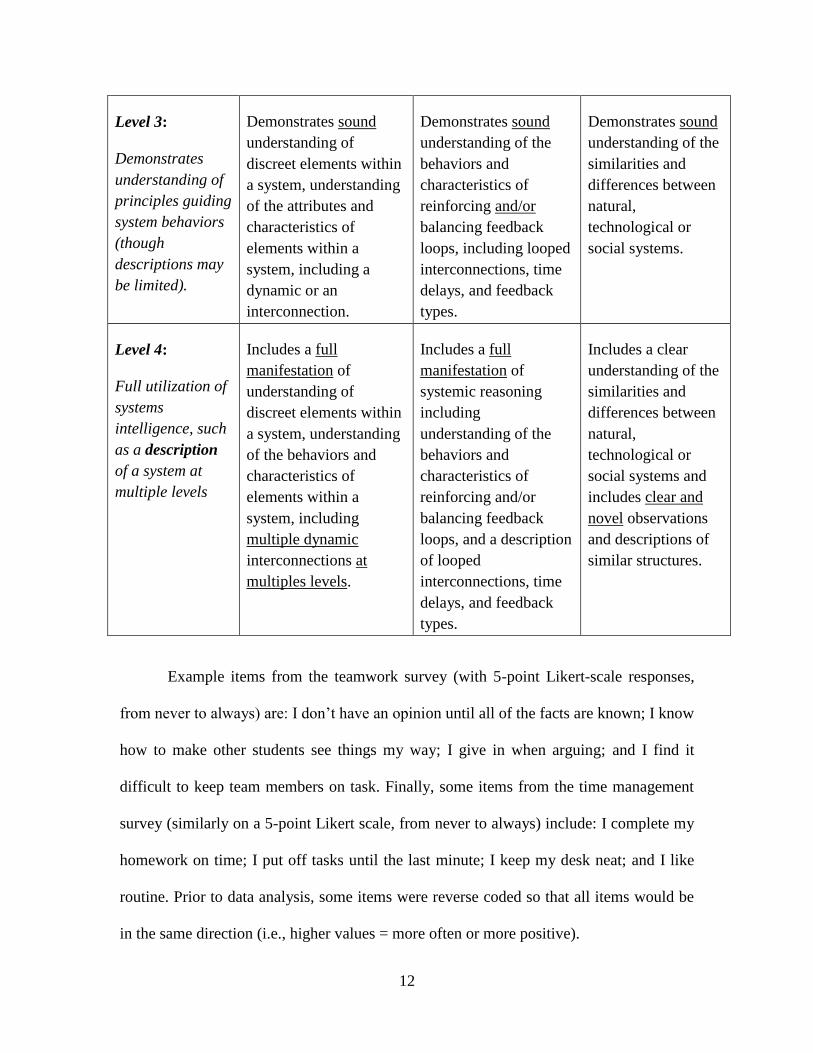
Table 2 Systems Thinking Scoring Rubric (adapted from Sweeney and Sterman, 2007)
Dynamic Thinking
Level A: Identification
of system
elements and
interrelations
Level B: Specify
variables and
problems
Closed-loop Thinking
Level A:
Understanding
of basic system
concepts
Level B: Elaborate
causal
reasoning
Transfer the Model
Identification of
similarities across
systems
Level 0:
Incorrect or non-
applicable
response
There is no response,
response of “I don’t
know”, or non-
applicable response.
There is no response,
response of “I don’t
know”, or non-
applicable response.
There is no
response, response
of “I don’t know”, or
non-applicable
response.
Level 1:
Describes static
interconnections
Includes identification
of some discrete
elements within a
system.
Interconnections and
inter-relationships are
described in linear
and/or static (vs.
dynamic) terms.
Includes a description
of interconnections and
inter-relationships in
linear and/or static (vs.
in closed loop) terms.
Involves an attempt
to indicate a similar
structure.
Level 2:
Describes aspects
of system
structures and
behaviors.
Shows some
identification of discreet
elements within a
system, understanding
of the attributes and
characteristics of
elements within a
system, including a
dynamic or an
interconnection.
Shows some
understanding of the
behaviors and
characteristics of
reinforcing and/or
balancing feedback
loops, including looped
interconnections, time
delays, and feedback
types.
Shows some
understanding of the
similarities and
differences between
natural,
technological or
social systems.
12
Level 3:
Demonstrates
understanding of
principles guiding
system behaviors
(though
descriptions may
be limited).
Demonstrates sound
understanding of
discreet elements within
a system, understanding
of the attributes and
characteristics of
elements within a
system, including a
dynamic or an
interconnection.
Demonstrates sound
understanding of the
behaviors and
characteristics of
reinforcing and/or
balancing feedback
loops, including looped
interconnections, time
delays, and feedback
types.
Demonstrates sound
understanding of the
similarities and
differences between
natural,
technological or
social systems.
Level 4:
Full utilization of
systems
intelligence, such
as a description
of a system at
multiple levels
Includes a full
manifestation of
understanding of
discreet elements within
a system, understanding
of the behaviors and
characteristics of
elements within a
system, including
multiple dynamic
interconnections at
multiples levels.
Includes a full
manifestation of
systemic reasoning
including
understanding of the
behaviors and
characteristics of
reinforcing and/or
balancing feedback
loops, and a description
of looped
interconnections, time
delays, and feedback
types.
Includes a clear
understanding of the
similarities and
differences between
natural,
technological or
social systems and
includes clear and
novel observations
and descriptions of
similar structures.
Example items from the teamwork survey (with 5-point Likert-scale responses,
from never to always) are: I don’t have an opinion until all of the facts are known; I know
how to make other students see things my way; I give in when arguing; and I find it
difficult to keep team members on task. Finally, some items from the time management
survey (similarly on a 5-point Likert scale, from never to always) include: I complete my
homework on time; I put off tasks until the last minute; I keep my desk neat; and I like
routine. Prior to data analysis, some items were reverse coded so that all items would be
in the same direction (i.e., higher values = more often or more positive).

13
The student assessments occurred at approximately six-month intervalsi, including
the initial and final weeks of this 20-month period, yielding four different data collection
times (i.e., September 2009, March 2010, November 2010, and May 2011). This enabled
us to capture the current levels of the competencies, and monitor their development over
time. The systems thinking assessment took approximately 45 minutes while teamwork
and time management took around 25 minutes each to complete. All were administered
during non-academic periods, and staggered across two days (i.e., ST on one day and TW
and TM on the next) to attenuate fatigue. The first administration of each of our three
assessment instruments was delivered in paper and pencil format. The three remaining
administrations were delivered online, where students simply clicked on a link that took
them directly to the assessment. Earlier analyses revealed no differences in terms of
delivery mode (see Shute and Torres, 2012).
Traditional achievement testing occurred as part of normal New York state
requirements for sixth-grade students. This took place at the end of the school year (i.e.,
June 2010).
Method
Sample
The primary sample we studied at Q2L consisted of 70 students (42 male, 28
female) who began the study in 2009 in the sixth grade and concluded at the end of the
seventh grade. They were assessed at four different time periods. We also tested students
who began in the fall of 2010 as new sixth graders (n = 76). This second cohort of
students was only assessed at two time periods.
14
Among the students at the school, about 40% received free or reduced lunch, and
60% paid for lunch in full. The ethnicity composition of the students is approximately
34% Caucasian, 32% African-American, 29% Hispanic, and 5% Asian.
Reliability
Before analyzing student performance on our set of assessments, we first needed
to establish that the instruments we employed were, in fact, sound (i.e., reliable and
valid). Because the systems thinking assessment was the only one involving constructed
responses, we additionally needed to determine the inter-rater reliability of the scores.
Inter-rater Reliability of Systems Thinking Scores. To score the responses on the
ST assessment, we used two separate teams of scorers, with two persons per team.
Scoring in the first administration (Time 1) was accomplished by the two teams
independently scoring all students' constructed responses using our 5-point (levels 0-4)
rubric. Both teams (a) recorded their scores in an Excel spreadsheet, then (b) exchanged
spreadsheets with the other team, and (c) highlighted scores that differed by > 2 points.
The highlighted scores were then discussed and re-scored; in some cases converging on
the same number, and in other cases changing to scores that differed by only one point. In
the first administration of the ST assessment, this exchange-discuss-revise process
required two full iterations until no scores were > 1 point different. By the time of the
second, third, and fourth administrations, using the same teams, just one iteration was
required, with only a few discrepant scores requiring discussion. The inter-rater
reliabilities of the scores on the ST assessment were: Time 1, Spearman's rho = .87, and
for Time 2, Spearman's rho = .96. Subsequent administrations, using the same two-team
process, showed similarly high inter-rater reliabilities (i.e., in the mid-90s).

15
Internal Reliability. The alpha reliabilities of the three assessments were
calculated across all four administrations and were judged to be appropriate. See Table 3
for Cronbach alpha reliabilities for each of the three assessments across the four time
periods.
Table 3 Reliabilities (and sample sizes) for assessments across four time periods
Competency Time 1 Time 2 Time 3 Time 4
Systems Thinking .82 (n=70) .85 (n=66) .80 (n=41) .84 (n=43)
Teamwork .84 (n=63) .82 (n=59) .88 (n=49) .86 (n=53)
Time Management .81 (n=69) .83 (n=62) .84 (n=59) .84 (n=54)
Next, we examine learning or growth over time in relation to our three
competencies.
Results
Table 4 displays the overall means (and standard deviations) of the three
competencies over the four time points.
Table 4 Focal Competency Means, SDs and Statistics for the Four Administrations
Time 1 Time 2 Time 3 Time 4 n F
Systems
Thinking
0.90
(.42)
1.20
(.53)
0.95
(.48)
1.13
(.62)
26 2.07
Teamwork
3.49
(.45)
3.40
(.41)
3.60
(.45)
3.51
(.29)
33 1.03
Time
Management
3.65
(.52)
3.57
(.49)
3.55
(.50)
3.65
(.45)
35 0.01
We computed a repeated measure ANOVA using Time 1, Time 2, Time 3, and
Time 4 as the repeated measures. As can be seen, there were no significant differences

16
among the means across all four time points. However, note that the means in Table 4
represent students who participated in all four administrations. That is, if a student
missed even one administration (e.g., completed assessments at Times 1, 3, and 4, but
was absent at Time 2) her data (from all four times) were removed from the analysis
given our repeated-measures design. In addition, note that data collection with middle
school students can be difficult. Assessments were given in the classroom, where students
were sitting adjacent to one another. This can (and did) create distractions to students
who were trying to take the assessment seriously. Thus we felt that a better analysis was
to take the first and fourth administrations and run a separate analysis to see if there were
any significant changes to mean scores.
This simplified analysis also serves to increase the sample size (compared to the
data in Table 4) as it includes students who only had to participate in the first and fourth
administrations. To illustrate, for ST, the sample size of students who participated in all
four administrations (shown in Table 4) was n = 26 compared to those who completed the
Time 1 and Time 4 ST assessments shown in Table 5 (n = 35). Table 5 displays the
means of the three competencies for students who took the assessments at Time 1 and
Time 4.
As can be seen, the results show a significant improvement from Time 1 to Time
4 for ST. There are no significant improvements, however, for teamwork and time
management.
17
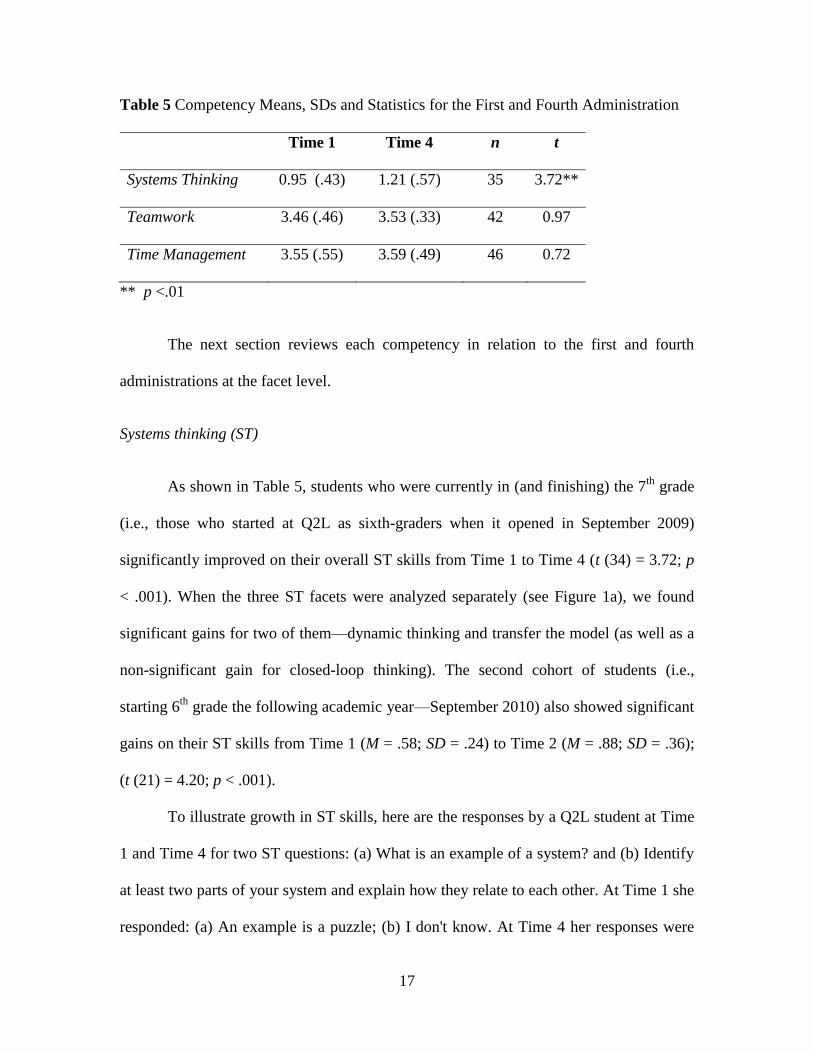
Table 5 Competency Means, SDs and Statistics for the First and Fourth Administration
Time 1 Time 4 n t
Systems Thinking 0.95 (.43) 1.21 (.57) 35 3.72**
Teamwork 3.46 (.46) 3.53 (.33) 42 0.97
Time Management 3.55 (.55) 3.59 (.49) 46 0.72
** p <.01
The next section reviews each competency in relation to the first and fourth
administrations at the facet level.
Systems thinking (ST)
As shown in Table 5, students who were currently in (and finishing) the 7th
grade
(i.e., those who started at Q2L as sixth-graders when it opened in September 2009)
significantly improved on their overall ST skills from Time 1 to Time 4 (t (34) = 3.72; p
< .001). When the three ST facets were analyzed separately (see Figure 1a), we found
significant gains for two of them—dynamic thinking and transfer the model (as well as a
non-significant gain for closed-loop thinking). The second cohort of students (i.e.,
starting 6th
grade the following academic year—September 2010) also showed significant
gains on their ST skills from Time 1 (M = .58; SD = .24) to Time 2 (M = .88; SD = .36);
(t (21) = 4.20; p < .001).
To illustrate growth in ST skills, here are the responses by a Q2L student at Time
1 and Time 4 for two ST questions: (a) What is an example of a system? and (b) Identify
at least two parts of your system and explain how they relate to each other. At Time 1 she
responded: (a) An example is a puzzle; (b) I don't know. At Time 4 her responses were

18
more meaningful: (a) The transportation or subway system is an example of a system; (b)
Two parts of the transportation system are the people and the metrocards. They relate to
each other because the system wouldn't work if people didn't buy metrocards to use for
the trains. If there were no metrocards, people wouldn’t be able to go on the trains and
buses, and the government would not be able to make a profit.
Table 6 displays the relationship among ST scores across the four time points,
which shows that the test-retest reliability of ST is consistent over the four time points.
Table 6 Correlations among ST Measures across the Four Time Points
ST2 ST3 ST4
ST1 0.51** 0.55** 0.69**
ST2 0.37* 0.57**
ST3 0.74**
* p < .05; ** p < .01
Teamwork (TW)
While students showed higher Time 4 than Time 1 scores on their overall
teamwork scores, the difference was not significant. However one of the facets of TW
(i.e., influencing others) did show a statistically significant increase over time (t (41) =
5.13; p < .001). The 6th
graders did not show significant gains on TW—either overall or
by factors. Table 7 displays the relationship among TW across the four time points.
These correlations show that the test-retest reliability of TW is consistent over the four
time points.

19
Table 7 Correlations among TW Measures across the Four Time Points
TW2 TW3 TW4
TW1 0.53** 0.47* 0.43*
TW2 0.70** 0.55**
TW3 0.57**
* p < .05; ** p < .01
Time management (TM)
Similar to the findings of TW over time, students did show a small improvement
on their overall TM scores from Time 1 to Time 4, but this was not statistically
significant. However, one of the TM facets (meeting deadlines) did show a significant
gain (t (45) = 2.18; p < .05). The 6th
graders did not show significant gains on TM—
either overall or by factors. Table 8 displays the relationship among TM across the four
time points. Again, this illustrates that the test-retest reliability of TM is consistent over
time.
Table 8 Correlations among TM Measures across Four Time Points
TM2 TM3 TM4
TM1 0.68** 0.34* 0.59**
TM2 0.66** 0.63**
TM3 0.74**
* p < .05; ** p < .01
Relationships among the three competencies

20
Table 9 displays the relationships among the three competencies at Time 4. As
can be seen, there is no significant relationship between ST and either TW or TM. There
is, however, a moderate relationship between TM and TW. This is important since it
shows that the three assessments are not measuring the same competencies. That is, if the
correlation between TW and TM was .70 or higher (which it was not), we would suspect
they were measuring the same construct. Also, because both TW and TM were assessed
via the same method (i.e., self-report, with five-point Likert scale), we would expect
some degree of overlap given that they share method variance.
The next section shows how these variables uniquely predict state test scores.
Table 9 Correlations among Competencies at Time 4
TM TW
ST 0.30 0.15
TM 0.54**
* p < .05; ** p < .01
Predictive Validity
We found that the scores from the last administration of the three competency
assessments correlated with state test scores. ST significantly correlated with math (r =
.44, p < .01) and reading (r = .41, p < .01) test scores; TW only significantly correlated
with math (r = .29, p < .05) and not reading; and TM marginally correlated with reading
(r = .27, p = .05), but not with math. Scores came from the final (Time 4) assessments.
This suggests that the competencies are positively associated with state test scores.

21
To examine the incremental validity of the three competencies on state
standardized math and reading scores, we then conducted two hierarchical regression
analyses. In the first, we predicted math score from ST, TW, and TM (see Table 10). We
chose to enter ST first in both analyses given that it was a more cognitive measure than
either TW or TM.
Table 10 Hierarchical regression analysis with competencies and math
Model R-Square F Change
1--ST .219 9.80**
2--ST, TW .235 0.74
3--ST, TW, TM .236 0.03
** p < .01
Table 11 shows the results from our hierarchical regression analysis predicting
reading test score.
Table 11 Hierarchical regression analysis with competencies and reading
Model R-Square F Change
1--ST .163 7.21*
2--ST, TW .194 1.36
3--ST, TW, TM .238 2.02
* p < .05
Results from both regression analyses indicate that ST significantly predicts both
math (22% unique variance) and reading (16% unique variance) standardized test scores
while our other two competencies (TW and TM) do not appear to predict any unique
variance of the state test scores. This suggests that (a) ST is an important skill to continue
to support as it positively predicts state test scores, and (b) while TW and TM may indeed
not predict state test scores, we may still want to explore alternative methods of
assessment for TW and TM, which we will describe further in the discussion section.

22
Gender and Socio-Economic Status (SES)
Although the sample size is small, we conducted an exploratory examination of
the effects of gender and SES in relation to ST growth. First, we examined students’
scores for ST at Time 1 vs. Time 4, separately by boys (n = 21) and girls (n = 16) in our
sample. We computed a repeated measures ANOVA (ST Time 1 and Time 4) with
gender as the between-subjects variable. The main effect was significant (F (1, 35) =
10.42; p = .003) and the interaction with gender was also significant (F (1, 35) = 5.99; p
= .02). A graph of the interaction is shown in Figure 2. Further analysis showed that the
boys significantly improved over time relative to ST more than the girls (t (20) = 4.10; p
= .001.
Figure 2 Interaction among ST (Time 1 vs. Time 4) and gender
We similarly evaluated gender and our other two competencies (i.e., TW and
TM), but found no interactions.
Our SES variable was coded relative to whether students at Q2L received a free or
reduced lunch, or not. We again computed a repeated measures ANOVA for our three
0.4
0.6
0.8
1
1.2
1.4
ST Time 1 ST Time 4
Boys Girls
23
competencies (at Time 1 vs. Time 4) with SES as the between-subjects variable. For
each of the three competencies, no interactions involving SES were found. This may be
viewed positively as students, regardless of SES, appear to be improving equally on ST.
Discussion
This research attempted to answer preliminary questions regarding the
effectiveness of Q2L, particularly in relation to supporting important 21st century
competencies. We hypothesized that students would demonstrate improved performance
in relation to the three focal competencies from initial (Time 1, September 2009) to final
(Time 4, May 2011) assessment. We found partial support for this hypothesis in that ST
did improve significantly when comparing the data from Time 1 and Time 4. While we
did not find growth in TW and TM from Time 1 to Time 4, this may be attributed to the
method (i.e., self-report) by which we chose to assess TW and TM. Moreover, self-
report measures are easy to administer, but they are not typically used to measure growth
over time. Additionally, self-report measures are susceptible to social desirability effects
which can affect the validity of the assessment. Using more performance-based methods
(e.g., classroom observation) to assess TM and TM in Q2L might yield more favorable
results.
While the results of this formative evaluation are interesting—particularly
regarding the improvement for systems thinking skill from Time 1 to Time 4—more
research is needed to understand fully how (and why) Q2L impacts students. Given the
relatively small sample size, it was difficult to measure the growth of competencies
unequivocally. In the future, larger samples of students will enable researchers to see how
certain characteristics and demographics of the students (e.g., gender, SES) as well as

24
context play a role in how Q2L impacts students. For example, how do girls versus boys
grow in important competencies in Q2L over time? Does Q2L help to reduce the
achievement gap among different SES brackets or ethnicities? What are the best settings
at Q2L to foster better thinking (and behaving) skills?
Given the current design, we do not know conclusively if students’ gains are
simply a function of normal cognitive development or are, in fact, a function of being
part of Q2L. Furthermore, the current research did not include a control group in the
analysis of competency growth. However, given that students at Q2L did demonstrate
significant improvements in ST skill across the 20-month period, and ST is a difficult
skill to master (even for adults), we suspect that the ST growth was primarily a function
of being part of Q2L.
Looking forward, while the assessments that we used in this study were adequate
for the exploratory nature of this research, they are not optimal for large-scale,
meaningful evaluations within Q2L and across multiple schools—especially for the TW
and TM competencies. Future research should focus on using more performance-based
assessments across a range of competencies that are of value to Q2L.
Finally, this evaluation research should be viewed as a preliminary probe into the
opportunities and challenges encountered in the process of translating a new, innovative
model of schooling into practice. As such, we have only analyzed the tip of the proverbial
iceberg which is the Q2L model with its many dynamic and interrelated parts (e.g.,
interdisciplinary curriculum, immersive environment, challenge-based learning
experiences). And as with any bold new idea, the success of its implementation won’t be
known for years, and certainly not after just 20 months.

25
Acknowledgements
The present research was possible thanks to the generous support from Connie
Yowell and the John D. and Catherine T. MacArthur foundation. We also like to thank
Katie Salen for welcoming us to the school and providing support for our efforts. We
would like to thank the all of the Q2L teachers and designers who understood the
importance of our research, accommodated our needs, and gave up some of their precious
time for the study. Finally, we would like to thank all of the students at Q2L for
participating in the assessments.
Notes
Our third administration (i.e., November, 2010) was delayed for two months as
Q2L physically moved its location over the summer and was still in the process of setting
up the technical infrastructure in September and October 2010, thus delaying the third
assessment session.

26
References
Assaraf, O. B.-Z., and Orion, N. 2005. Development of system thinking skills in the
context of earth system education. Journal of Research in Science Teaching 42
(5): 518-560.
Barak, M., and Williams, P. 2007. Learning elemental structures and dynamic processes
in technological systems: A cognitive framework. International Journal of
Technology and Design Education 17 (3): 323-340.
Bransford, J., Brown, A., and Cocking, R. 2000. How People Learn: Brain, Mind, and
Experience & School. Washington, DC: National Academy Press.
Forrester, J. W. 1994. System dynamics, systems thinking, and soft OR. System
Dynamics Review 10 (2-3): 245-256.
Gee, J. P. 2005. What would a state of the art instructional video game look like?
Innovate 1 (6). http://www.innovateonline.info/index.php?view=article&id=80
(accessed June 20, 2011).
Gee, J. P. 2011. “Reflections on empirical evidence on game and learning.” In Computer
games and instruction, edited by S. Tobias and J. D. Fletcher, 223-232. Charlotte,
NC: Information Age Publishers.
Hmelo, C. E., Holton, D. L., and Kolodner, J. L. 2000. Designing to learn about complex
systems. Journal of the Learning Sciences 9 (3): 247-298.
Ito, M., Baumer, S., Bittanti, M., et al. 2010. Hanging out, messing around and geeking
out: kids living and learning with new media. The John D. and Catherine T.
MacArthur Foundation Series on Digital Media and Learning. Cambridge, MA:
The MIT Press.

27
Lave, J., and Wenger, E. 1991. Situated learning: Legitimate peripheral participation.
Cambridge: Cambridge University Press.
Liu, O. L., Rijmen, F., MacCann, C., and Roberts, R. D. 2009. Measuring time
management abilities for middle school students. Personality and Individual
Differences 47 (3): 174-179.
Macan, T. H., Shahani, C., Dipboye, R. L., and Phillips, A. P. 1990. College students’
time management: Correlations with academic performance and stress. Journal of
Educational Psychology 82 (4): 760-768.
MacCann, C., Duckworth, A. L., and Roberts, R. D. 2009. Empirical identification of the
major facets of Conscientiousness. Learning and Individual Differences 19 (4):
451-458.
Ossimitz, G. 2000. The development of systems thinking skills using system dynamics
modeling tools. http://wwwu.uni-klu.ac.at/gossimit/sdyn/gdm_eng.htm (accessed
May 10, 2010).
Partnership for 21st Century Skills. 2006. Assessment of 21st century skills. Washington,
DC: Partnership for 21st Century Skills.
Powell, W. W., and Snellman, K. 2004. The Knowledge Economy. Annual Review of
Sociology 30 (1): 199-220.
Resnick, M. 2007. Sowing the seeds for a more creative society. Learning and Leading
with Technology 35 (4): 18-22.
Roberts, R. D., Schulze, R., and Minsky, J. April, 2006. The relation of time management
dimensions to scholastic outcomes. Presentation at Annual Meeting of the
American Educational Research Association, San Francisco, CA.

28
Rysavy, D. M., and Sales, G. C. 1991. Cooperative learning in computer-based
instruction. Educational Technology Research & Development 39 (2):70-79.
Salen, K., Torres, R., Wolozin, L., Rufo-Tepper, R., and Shapiro, A. 2011. Quest to
learn: Developing the school for digital kids. The John D. and Catherine T.
MacArthur Foundation Reports on Digital Media and Learning. Cambridge, MA:
The MIT Press.
Salisbury, D. F. 1996. Five technologies for educational change: systems thinking,
systems design, quality science, change management. Englewood Cliffs, NJ:
Educational Technology Publications.
Shute, V. J., & Torres, R. (2012). Where streams converge: Using evidence-centered
design to assess Quest to Learn. In M. Mayrath, J. Clarke-Midura, & D. H.
Robinson (Eds.). Technology-based assessments for 21st Century
skills: Theoretical and practical implications from modern research (pp. 91-124).
Charlotte, NC: Information Age Publishing.
Sweeney, L. B., and Sterman, J. D. 2007. Thinking about systems: Student and teacher
conceptions of natural and social systems. System Dynamics Review 23 (2/3):
285-312.
Tindale, R. S., Stawiski, S., and Jacobs, E. 2008. “Shared cognition and group learning.”
In Work group learning: Understanding, improving and assessing how groups
learn in organizations, edited by V. I. Sessa and M. London, 73-90. New York:
Lawrence Erlbaum Associates.

29
Torres, R. 2009. Learning on a 21st century platform: Gamestar Mechanic as a means to
game design and systems-thinking skills within a nodal ecology. New York
University: ProQuest Dissertations.
Totten, S., Sills, T., Digby, A., and Russ, P. 1991. Cooperative learning: A guide to
research. New York: Garland.
Van den Bossche, P., Segers, M., and Kirschner, P. A. 2006. Social and cognitive factors
driving teamwork in collaborative learning environments. Small Groups Research
37 (5): 490-521.
Vygotsky, L. S. 1978. Mind in society: The development of higher psychological
processes. Cambridge, MA: Harvard University Press.
Wang, L., MacCann, C., Zhuang, X., Liu, O. L., and Roberts, R. D. 2009. Assessing
teamwork skills: A multi-method approach. Canadian Journal of School
Psychology 24 (2): 108-124.
Zhuang, X., MacCann, C., Wang, L., Liu, O. L., and Roberts, R. D. 2008. Development
and Validity Evidence Supporting a Teamwork and Collaboration Assessment for
High School Students, ETS Research Report, RR-08-50, Princeton, NJ.

30
Appendix 1—Systems Thinking Assessment Questions
Directions
Below you will find 12 questions that you should read and respond to. Please answer
all questions. Don't spend too much time deciding on what your answer should be. There
are no right or wrong answers.
SYSTEMS
1. What does the word “system” mean to you?
2. What is an example of a system?
3. Identify at least two parts of the system and explain how they relate to each other.
TIREDNESS AND SLEEP
Think about the relationship between tiredness and the number of hours slept.
4. How are tiredness and amount of sleep related or connected to each other?
5. If you sleep less, what happens to your level of tiredness over time?
6. Can you think of a different situation that feels the same as this?
SILLY BANDZ
7. You and your best friend Margot have been collecting silly bandz for a year. You
often argue about who has more. You definitely want to have more silly bandz
than Margot because you don’t want her to brag about it. Think about the
relationship(s) among: (a) the number of silly bandz you have, (b) the level of
competition between you and Margot, and (c) your motivation to buy more silly
bandz. How might these three be interrelated? What do you think happens to your
motivation to buy more silly bandz and the number of silly bandz you have over
time?
31
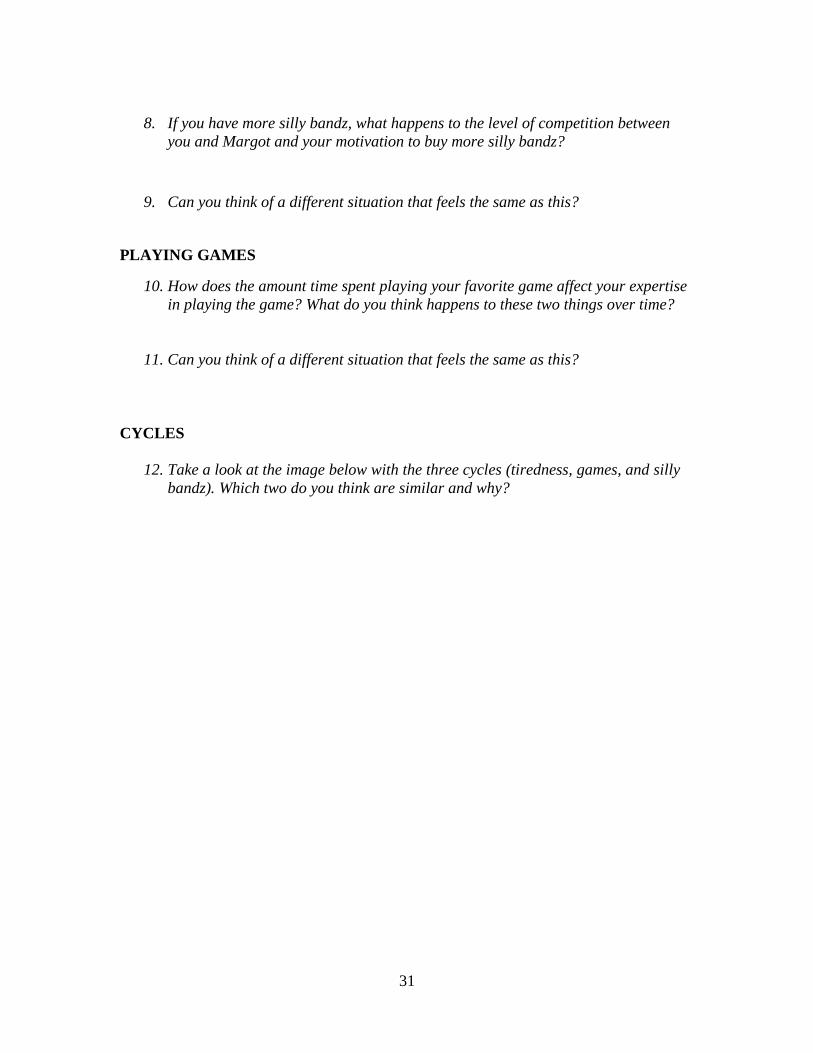
8. If you have more silly bandz, what happens to the level of competition between
you and Margot and your motivation to buy more silly bandz?
9. Can you think of a different situation that feels the same as this?
PLAYING GAMES
10. How does the amount time spent playing your favorite game affect your expertise
in playing the game? What do you think happens to these two things over time?
11. Can you think of a different situation that feels the same as this?
CYCLES
12. Take a look at the image below with the three cycles (tiredness, games, and silly
bandz). Which two do you think are similar and why?

32

33
Appendix 2—Teamwork Survey
Section 1: Thinking, Feeling, and Acting
Directions Below you’ll find 22 statements about how you behave when you are in team situations
or during group projects. You should read and decide how well each one of them describes the
way you think or feel in these situations. For each item, please choose one of the 5 options
ranging from “never” to “always.” Please reply to all statements. Don’t spend too long deciding
what your answer should be. Answer all statements even if you're not entirely sure of your
answer. There are no right or wrong answers. SELECT THE CIRCLE FOR EACH ITEM THAT
MATCHES YOUR BEST RESPONSE.
1. I don’t have an opinion until all of the facts are known.
Never Rarely Sometimes Often Always
2. I know how to make other students see things my way.
Never Rarely Sometimes Often Always
3. I am flexible when doing group projects.
Never Rarely Sometimes Often Always
4. I dislike being in a position of responsibility for other people.
Never Rarely Sometimes Often Always
5. I like to be in charge of group projects.
Never Rarely Sometimes Often Always
6. I enjoy helping team members.
Never Rarely Sometimes Often Always
7. I prefer working alone over working with others.
Never Rarely Sometimes Often Always

34
8. I can make deals in any situation.
Never Rarely Sometimes Often Always
9. Feedback is important to me.
Never Rarely Sometimes Often Always
10. I like to solve problems using different tactics.
Never Rarely Sometimes Often Always
11. During group assignments, I make demands on other students.
Never Rarely Sometimes Often Always
12. I suggest different solutions to problems.
Never Rarely Sometimes Often Always
13. I find it difficult to approach classmates.
Never Rarely Sometimes Often Always
14. I enjoy bringing team members together.
Never Rarely Sometimes Often Always
15. I believe that I’m a good leader.
Never Rarely Sometimes Often Always
16. I can convince my peers about anything.
Never Rarely Sometimes Often Always

35
17. I can fight for a cause that I believe in.
Never Rarely Sometimes Often Always
18. I know when to step in when an argument starts getting out of control.
Never Rarely Sometimes Often Always
19. I'm influenced by other students' opinions.
Never Rarely Sometimes Often Always
20. I learn from other students.
Never Rarely Sometimes Often Always
21. I think that trading ideas among students leads to the best solutions.
Never Rarely Sometimes Often Always
22. I am inspired by others' ideas and thoughts.
Never Rarely Sometimes Often Always
36
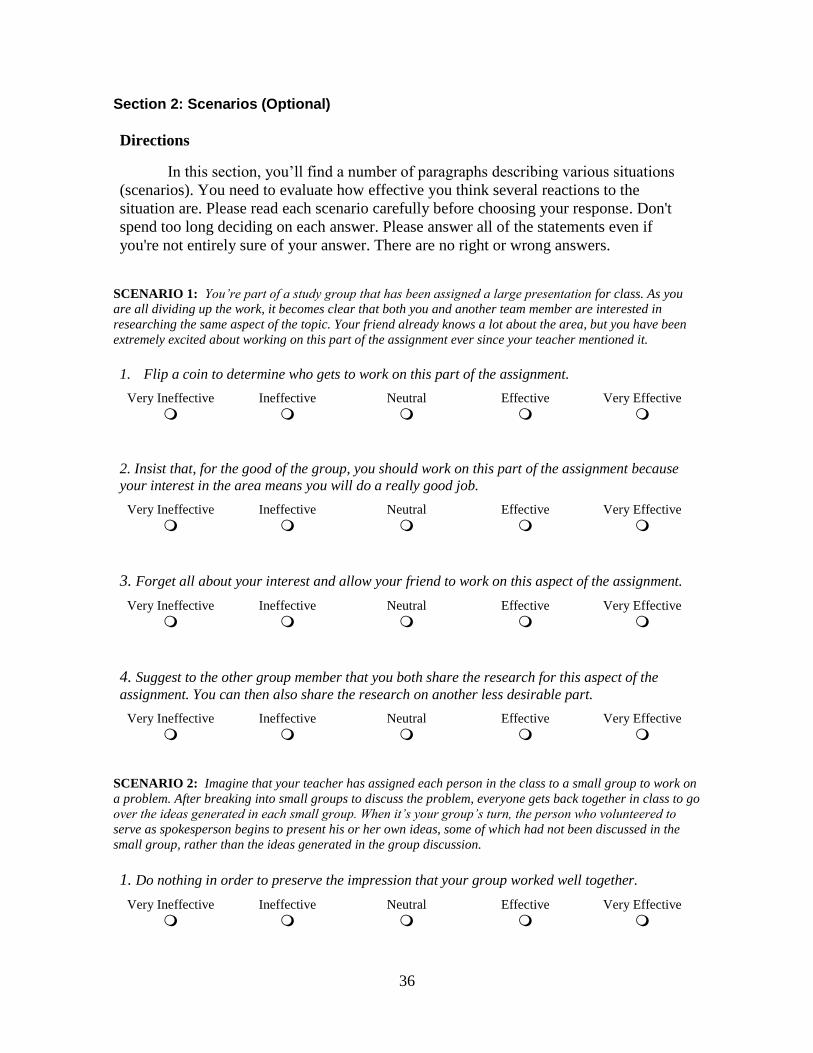
Section 2: Scenarios (Optional)
Directions
In this section, you’ll find a number of paragraphs describing various situations
(scenarios). You need to evaluate how effective you think several reactions to the
situation are. Please read each scenario carefully before choosing your response. Don't
spend too long deciding on each answer. Please answer all of the statements even if
you're not entirely sure of your answer. There are no right or wrong answers.
SCENARIO 1: You’re part of a study group that has been assigned a large presentation for class. As you
are all dividing up the work, it becomes clear that both you and another team member are interested in
researching the same aspect of the topic. Your friend already knows a lot about the area, but you have been
extremely excited about working on this part of the assignment ever since your teacher mentioned it.
1. Flip a coin to determine who gets to work on this part of the assignment.
Very Ineffective Ineffective Neutral Effective Very Effective
2. Insist that, for the good of the group, you should work on this part of the assignment because
your interest in the area means you will do a really good job.
Very Ineffective Ineffective Neutral Effective Very Effective
3. Forget all about your interest and allow your friend to work on this aspect of the assignment.
Very Ineffective Ineffective Neutral Effective Very Effective
4. Suggest to the other group member that you both share the research for this aspect of the
assignment. You can then also share the research on another less desirable part.
Very Ineffective Ineffective Neutral Effective Very Effective
SCENARIO 2: Imagine that your teacher has assigned each person in the class to a small group to work on
a problem. After breaking into small groups to discuss the problem, everyone gets back together in class to go
over the ideas generated in each small group. When it’s your group’s turn, the person who volunteered to
serve as spokesperson begins to present his or her own ideas, some of which had not been discussed in the
small group, rather than the ideas generated in the group discussion.
1. Do nothing in order to preserve the impression that your group worked well together.
Very Ineffective Ineffective Neutral Effective Very Effective

37
2. Challenge the spokesperson, because it’s important that only the ideas agreed upon by your
group be presented.
Very Ineffective Ineffective Neutral Effective Very Effective
3. Keep silent during class, but afterwards speak with the instructor privately about the
spokesperson.
Very Ineffective Ineffective Neutral Effective Very Effective
4. Politely add additional comments, making sure that the ideas the group discussed are
presented.
Very Ineffective Ineffective Neutral Effective Very Effective
SCENARIO 3: You’ve decided to set up a new web site about your school—from the perspective of students.
You’ve been given permission and a deadline: three weeks to complete it. Nine other students have signed up
to help you. At your first meeting, you want to assign jobs for everyone, such as creating the graphics (2D
and 3D), animations, code, content, online surveys/polls, and so on. But how will you assign each person to
the tasks?
1. Ask each student which job they would like and then resolve any conflicts based on who
asked first.
Very Ineffective Ineffective Neutral Effective Very Effective
2. Ask each team member which job they would like to take on, and then resolve any conflicts by
drawing names out of a hat.
Very Ineffective Ineffective Neutral Effective Very Effective
3. Make a list of the team members’ strengths and preferences and assign jobs that match their
strengths most closely.
Very Ineffective Ineffective Neutral Effective Very Effective
4. Assign the best jobs to your friends first, and then give the remaining jobs to the rest of the
team members randomly.
Very Ineffective Ineffective Neutral Effective Very Effective
38
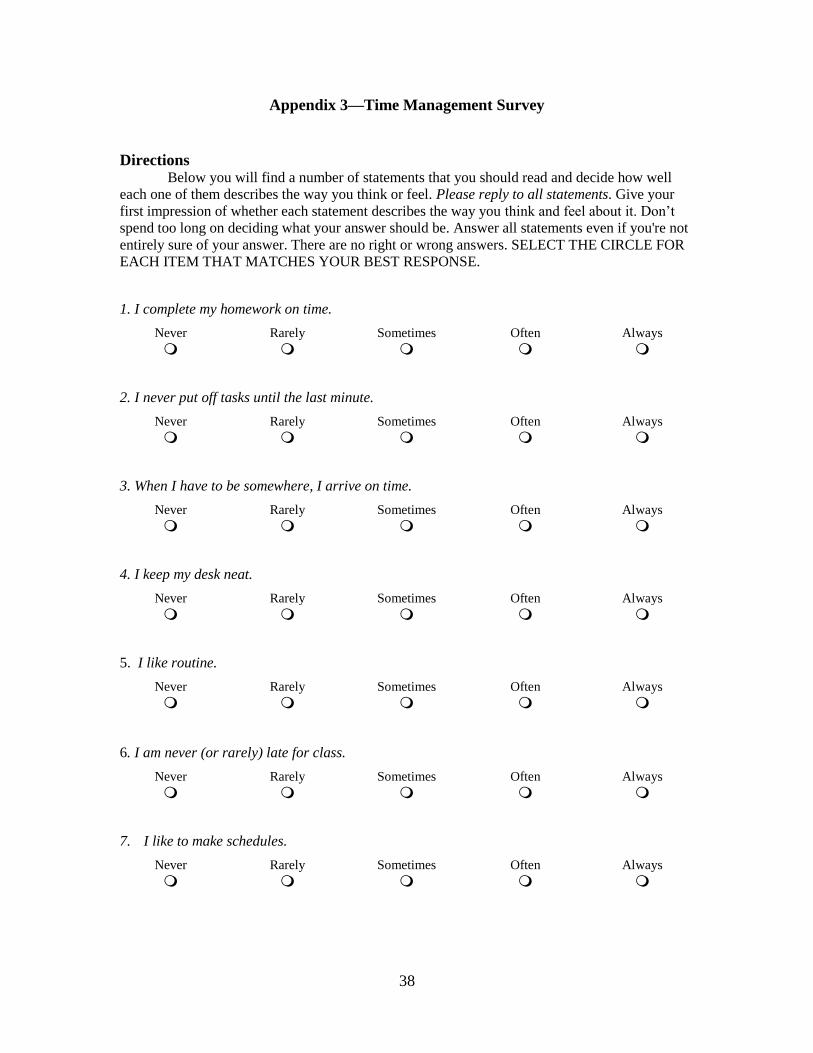
Appendix 3—Time Management Survey
Directions Below you will find a number of statements that you should read and decide how well
each one of them describes the way you think or feel. Please reply to all statements. Give your
first impression of whether each statement describes the way you think and feel about it. Don’t
spend too long on deciding what your answer should be. Answer all statements even if you're not
entirely sure of your answer. There are no right or wrong answers. SELECT THE CIRCLE FOR
EACH ITEM THAT MATCHES YOUR BEST RESPONSE.
1. I complete my homework on time.
Never Rarely Sometimes Often Always
2. I never put off tasks until the last minute.
Never Rarely Sometimes Often Always
3. When I have to be somewhere, I arrive on time.
Never Rarely Sometimes Often Always
4. I keep my desk neat.
Never Rarely Sometimes Often Always
5. I like routine.
Never Rarely Sometimes Often Always
6. I am never (or rarely) late for class.
Never Rarely Sometimes Often Always
7. I like to make schedules.
Never Rarely Sometimes Often Always

39
8. I write tasks down so I won't forget to do them.
Never Rarely Sometimes Often Always
9. When I am going somewhere, I am never late.
Never Rarely Sometimes Often Always
10. I use computers or cell phones to remind me of deadlines.
Never Rarely Sometimes Often Always
11. I know what is in my backpack.
Never Rarely Sometimes Often Always
12. Each day, I spend a few minutes planning what I am going to do tomorrow.
Never Rarely Sometimes Often Always
13. I mark dates that are important to me on a calendar.
Never Rarely Sometimes Often Always
14. People never complain that I am late.
Never Rarely Sometimes Often Always
15. I like to make lists of things to do.
Never Rarely Sometimes Often Always
16. My teachers are glad that I'm never late for class.
Never Rarely Sometimes Often Always

40
17. I keep my locker neat.
Never Rarely Sometimes Often Always
18. I'm rarely late for breakfast.
Never Rarely Sometimes Often Always
19. I finish tests with plenty of time to go over my answers.
Never Rarely Sometimes Often Always
20. I plan events ahead of time with my friends.
Never Rarely Sometimes Often Always
21. I have already planned all the things I am going to do tomorrow.
Never Rarely Sometimes Often Always
22. I am early for practice (sports, music) or anything I might do after school.
Never Rarely Sometimes Often Always
23. I am one of the first people to get to class.
Never Rarely Sometimes Often Always
24. I know what I want to do next weekend.
Never Rarely Sometimes Often Always