Formation mechanisms of atmospheric nitrate and sulfate ... · 1 Formation mechanisms of...
28
1 Formation mechanisms of atmospheric nitrate and sulfate during the 1 winter haze pollution periods in Beijing: gas-phase, heterogeneous 2 and aqueous-phase chemistry 3 Pengfei Liu 1, 2, 3, 5 , Can Ye 1, 3 , Chaoyang Xue 1, 3 , Chenglong Zhang 1, 2, 3 , Yujing Mu 1, 2, 3, 4 , Xu 4 Sun 1, 6 5 1 Research Center for Eco-Environmental Sciences, Chinese Academy of Sciences, Beijing, 100085, China. 6 2 Center for Excellence in Urban Atmospheric Environment, Institute of Urban Environment, Chinese Academy of 7 Sciences, Xiamen, 361021, China. 8 3 University of Chinese Academy of Sciences, Beijing, 100049, China. 9 4 National Engineering Laboratory for VOCs Pollution Control Material & Technology, University of Chinese 10 Academy of Sciences, Beijing, 100049, China. 11 5 Key Laboratory of Atmospheric Chemistry, China Meteorological Administration, Beijing, 100081, China. 12 6 Beijing Urban Ecosystem Research Station, Beijing, 100085, China. 13 Correspondence: Yujing Mu ([email protected]) 14 Abstract 15 A vast area in China is currently going through severe haze episodes with drastically elevated 16 concentrations of PM2.5 in winter. Nitrate and sulfate are main constituents of PM2.5 but their 17 formations via NO2 and SO2 oxidation are still not comprehensively understood, especially under 18 different pollution or atmospheric relative humidity (RH) conditions. To elucidate formation 19 pathways of nitrate and sulfate in different polluted cases, hourly samples of PM2.5 were collected 20 continuously in Beijing during the wintertime of 2016. Three serious pollution cases were 21 identified reasonably during the sampling period and the secondary formations of nitrate and 22 sulfate were found to make a dominant contribution to atmospheric PM2.5 under the relatively high 23 RH condition. The significant correlation between NOR (NOR = NO3 - / (NO3 - +NO2)) and [NO2] 2 × 24 [O3] during the nighttime under the RH≥60% condition indicated that the heterogeneous 25 hydrolysis of N2O5 involving aerosol liquid water was responsible for the nocturnal formation of 26 nitrate at the extremely high RH levels. The more coincident trend of NOR and [HONO] × [DR] 27
Transcript of Formation mechanisms of atmospheric nitrate and sulfate ... · 1 Formation mechanisms of...
1
Formation mechanisms of atmospheric nitrate and sulfate during the 1
winter haze pollution periods in Beijing: gas-phase, heterogeneous 2
and aqueous-phase chemistry 3
Pengfei Liu1, 2, 3, 5, Can Ye1, 3, Chaoyang Xue1, 3, Chenglong Zhang1, 2, 3, Yujing Mu1, 2, 3, 4, Xu 4
Sun1, 6 5
1 Research Center for Eco-Environmental Sciences, Chinese Academy of Sciences, Beijing, 100085, China. 6
2 Center for Excellence in Urban Atmospheric Environment, Institute of Urban Environment, Chinese Academy of 7
Sciences, Xiamen, 361021, China. 8
3 University of Chinese Academy of Sciences, Beijing, 100049, China. 9
4 National Engineering Laboratory for VOCs Pollution Control Material & Technology, University of Chinese 10
Academy of Sciences, Beijing, 100049, China. 11
5 Key Laboratory of Atmospheric Chemistry, China Meteorological Administration, Beijing, 100081, China. 12
6 Beijing Urban Ecosystem Research Station, Beijing, 100085, China. 13
Correspondence: Yujing Mu ([email protected]) 14
Abstract 15
A vast area in China is currently going through severe haze episodes with drastically elevated 16
concentrations of PM2.5 in winter. Nitrate and sulfate are main constituents of PM2.5 but their 17
formations via NO2 and SO2 oxidation are still not comprehensively understood, especially under 18
different pollution or atmospheric relative humidity (RH) conditions. To elucidate formation 19
pathways of nitrate and sulfate in different polluted cases, hourly samples of PM2.5 were collected 20
continuously in Beijing during the wintertime of 2016. Three serious pollution cases were 21
identified reasonably during the sampling period and the secondary formations of nitrate and 22
sulfate were found to make a dominant contribution to atmospheric PM2.5 under the relatively high 23
RH condition. The significant correlation between NOR (NOR = NO3-/ (NO3
-+NO2)) and [NO2]2 × 24
[O3] during the nighttime under the RH≥60% condition indicated that the heterogeneous 25
hydrolysis of N2O5 involving aerosol liquid water was responsible for the nocturnal formation of 26
nitrate at the extremely high RH levels. The more coincident trend of NOR and [HONO] × [DR] 27

2
(direct radiation) × [NO2] than [Dust] × [NO2] during the daytime under the 30%<RH<60% 28
condition provided convincing evidence that the gas-phase reaction of NO2 with OH played a 29
pivotal role in the diurnal formation of nitrate at moderate RH levels. The extremely high mean 30
values of SOR (SOR = SO42- / (SO4
2-+SO2)) during the whole day under the RH≥60% condition 31
could be ascribed to the evident contribution of SO2 aqueous-phase oxidation to the formation of 32
sulfate during the severe pollution episodes. Based on the parameters measured in this study and 33
the known sulfate production rate calculation method, the oxidation pathway of H2O2 rather than 34
NO2 was found to contribute greatly to the aqueous-phase formation of sulfate. 35
1. Introduction 36
In recent years, severe haze has occurred frequently in Beijing as well as the North China 37
Plain (NCP) during the wintertime, which has aroused great attention from the public due to its 38
adverse impact on atmospheric visibility, air quality and human health (Chan and Yao, 39
2008;Zhang et al., 2012;Zhang et al., 2015). 40
To mitigate the severe haze pollution situations, a series of regulatory measures for primary 41
pollution sources have been implemented by the Chinese government. For example, coal 42
combustion for heating in winter has gradually been replaced with electricity and natural gas in 43
the NCP, coal-fired power plants have been strictly required to install flue-gas denitration and 44
desulfurization systems (Chen et al., 2014), the stricter control measures such as terminating 45
production in industries and construction as well as the odd and even number rule for vehicles 46
have been performed in megacities during the period of the red alert for haze and so on. These 47
actions have made tremendous effects to decline pollution levels of primary pollutants including 48
PM2.5 (fine particulate matter with an aerodynamic diameter less than 2.5 m) in recent years (Li 49

3
et al., 2019). However, the serious pollution events still occurred in many areas of 50
Beijing-Tianjin-Hebei (BTH) region in December 2016 and January 2017 (Li et al., 2019). It has 51
been acknowledged that the severe haze pollution is mainly ascribed to stagnant meteorological 52
conditions with high atmospheric relative humidity (RH) and low mixed boundary layer height, 53
strong emissions of primary gaseous pollutants and rapid formation of secondary inorganic 54
aerosols (SIAs, the sum of sulfate, nitrate and ammonium), especially sulfate and nitrate (Cheng et 55
al., 2016;Guo et al., 2014;Huang et al., 2014). Some studies suggested that the contribution of 56
SIAs to PM2.5 was higher than 50% during the most serious haze days (Quan et al., 2014;Xu et al., 57
2017;Zheng et al., 2015a). 58
Generally, atmospheric sulfate and nitrate are formed through the oxidations of the precursor 59
gases (SO2 and NO2) by oxidants (e.g. OH radical, O3) via gas-phase, heterogeneous and 60
aqueous-phase reactions (Ravishankara, 1997;Wang et al., 2013;Yang et al., 2015). It should be 61
noted that the recent study proposed the remarkable emissions of primary sulfate from residential 62
coal combustion with the sulfur contents of coal in range of 0.81-1.88% in Xi’an (Dai et al., 2019), 63
but the primary emissions of sulfate could be neglected due to the extremely low sulfur content of 64
coal (0.26-0.34%) used prevailingly in the NCP (Du et al., 2016;Li et al., 2016). Atmospheric RH 65
is a key factor that facilitates the SIAs formation and aggravates the haze pollution (Wu et al., 66
2019), and hence the secondary formations of sulfate and nitrate are simply considered to be 67
mainly via gas-phase reaction at relatively low atmospheric RH levels (RH<30%) and 68
heterogeneous reactions and aqueous-phase reactions at relatively high atmospheric RH levels 69
(RH>60%) (Li et al., 2017). However, their formation mechanisms at different atmospheric RH 70
levels still remain controversial and unclear (Cheng et al., 2016;Ge et al., 2017;Guo et al., 2017;Li 71

4
et al., 2018;Liu et al., 2017a;Wang et al., 2016;Yang et al., 2017). For example, the recent studies 72
proposed that atmospheric SO2 oxidation by NO2 dissolved in aqueous aerosol phases under the 73
extremely high atmospheric RH conditions played a dominant role in sulfate formation under 74
almost neutral aerosol solutions (a pH range of 5.4-7.0) during the serious pollution periods 75
(Cheng et al., 2016;Wang et al., 2018a;Wang et al., 2016). However, Liu et al. (2017a) and Guo et 76
al. (2017) found that the aerosol pH estimated by ISORROPIA-II model was moderately acidic (a 77
pH range of 3.0-4.9) and thus the pathway of SO2 aqueous-phase oxidation by dissolved NO2 was 78
unimportant during severe haze events in China. Additionally, although the pathway of N2O5 79
heterogeneous hydrolysis has been recognized as being responsible for the nocturnal formation of 80
NO3- under relatively high atmospheric RH conditions (Tham et al., 2018;Wang et al., 81
2018b;Wang et al., 2018c), the effects of NO2 gas-phase chemistry and NO2 heterogeneous 82
chemistry on the diurnal formation of NO3- under moderate atmospheric RH conditions 83
(30%<RH<60%) have not yet been understood. Therefore, measurements of the species in PM2.5 84
in different polluted cases during the wintertime are urgently needed to elucidate formation 85
pathways of sulfate and nitrate. 86
In this study, hourly filter samples of PM2.5 were collected continuously in Beijing during the 87
wintertime of 2016, and the pollution characteristics and formation mechanisms of sulfate and 88
nitrate in the PM2.5 samples were investigated comprehensively under different atmospheric RH 89
conditions in relation to gas-phase, heterogeneous and aqueous-phase chemistry. 90
2. Materials and Methods 91
2.1. Sampling and analysis 92
The sampling site was chosen on the rooftop (around 25 m above the ground) of a six-story 93

5
building in Research Center for Eco-Environmental Sciences, Chinese Academy of Sciences 94
(RCEES, CAS), which was located in the northwest of Beijing and had been described in detail by 95
our previous studies (Liu et al., 2016;Liu et al., 2017b). The location of the sampling site 96
(400029.85 N, 1162029.71 E) is presented in Figure S1. Hourly PM2.5 samples were collected 97
on prebaked quartz fiber filters (90mm, Munktell) from January 7th to 23th of 2016 by 98
median-volume samplers (Laoying-2030) with a flow rate of 100 L min-1. Water-soluble ions 99
(WSI), including Na+, NH4+, Mg2+, Ca2+, K+, Cl-, NO2
-, NO3- and SO4
2-, as well as carbon 100
components including organic carbon (OC) and element carbon (EC) in the filter samples were 101
analyzed by ion chromatography (Wayeal IC6200) and thermal optical carbon analyzer 102
(DRI-2001A), respectively (Liu et al., 2017b). Analysis relevant for quality assurance & quality 103
control (QA/QC) was presented in detail in section M1 of the Supplementary Information (SIs). 104
Atmospheric H2O2 and HONO were monitored by AL2021-H2O2 monitor (AERO laser, Germany) 105
and a set of double-wall glass stripping coil sampler coupled with ion chromatography (SC-IC), 106
respectively (Ye et al., 2018;Xue et al., 2019a;Xue et al., 2019b). More details about the 107
measurements of H2O2 and HONO were ascribed in section M2 of the SIs. Meteorological data, 108
including wind speed, wind direction, ambient temperature and RH, as well as air quality index 109
(AQI) derived by PM2.5, SO2, NOx, CO and O3 were obtained from Beijing urban ecosystem 110
research station in RCEES, CAS (http://www.bjurban.rcees.cas.cn/). 111
2.2. Aerosol liquid water contents and pH prediction by ISORROPIA-II model 112
The ISORROPIA-II model was employed to calculate the equilibrium composition for 113
Na+-K+-Ca2+-Mg2+-NH4+-Cl--NO3
--SO42--H2O aerosol system, which is widely used in regional 114
and global atmospheric models and has been successfully applied in numerous studies for 115

6
predicting the physical state and composition of atmospheric inorganic aerosols (Fountoukis and 116
Nenes, 2007;Guo et al., 2015;Shi et al., 2017). It can be used in two modes: forward mode and 117
reverse mode. Forward mode calculates the equilibrium partitioning given the total concentrations 118
of gas and aerosol species, whereas reverse mode involves predicting the thermodynamic 119
compositions based only on the concentrations of aerosol components. Forward mode was 120
adopted in this study because reverse mode calculations have been verified to be not suitable to 121
characterize aerosol acidity (Guo et al., 2015;Hennigan et al., 2015;Murphy et al., 2017;Pathak et 122
al., 2004;Weber et al., 2016). The ISORROPIA-II model is available in “metastable” or “solid + 123
liquid” state solutions. Considering the relatively high RH during the sampling period, the 124
metastable state solution was selected in this study due to its better performance than the latter 125
(Bougiatioti et al., 2016;Guo et al., 2015;Liu et al., 2017a;Weber et al., 2016). Additionally, 126
although the gaseous HNO3, H2SO4, HCl and NH3 were not measured in this study, gas-phase 127
input with the exception of NH3 has an insignificant impact on the aerosol liquid water contents 128
(ALWC) and pH calculation due to the lower concentrations of HNO3, H2SO4 and HCl than NH3 129
in the atmosphere (Ding et al., 2019;Guo et al., 2017). Based on the long-term measurement in the 130
winter of Beijing, an empirical equation between NOx and NH3 concentrations was derived from 131
the previous study (Meng et al., 2011), that is, NH3 (ppb) = 0.34 × NOx (ppb) + 0.63, which was 132
employed for estimating the NH3 concentration in this study. The predicted daily average 133
concentrations of NH3 varied from 3.3 g m-3 to 36.9 g m-3, with a mean value of 16.6 g m-3 134
and a median value of 14.6 g m-3, which were in line with those (7.6-38.1 g m-3, 18.2 g m-3 135
and 16.2 g m-3 for the daily average concentrations, the mean value and the median value of NH3, 136
respectively) during the winter of 2013 in Beijing in the previous study (Zhao et al., 2016). 137

7
Then, the aerosol pH could be calculated by the following equation: 138
𝑝𝐻 = −𝑙𝑜𝑔101000×𝐻+
𝑊 139
where H+ (g m-3) and W (g m-3) are the equilibrium particle hydrogen ion concentration 140
and aerosol water contents, respectively, both of which could be output from ISORROPIA-II. 141
2.3. Production of sulfate in aqueous-phase reactions 142
The previous studies showed that there were six pathways of the aqueous-phase oxidation of 143
SO2 to the production of sulfate, i.e. H2O2 oxidation, O3 oxidation, NO2 oxidation, transition metal 144
ions (TMI) + O2 oxidation, methyl hydrogen peroxide (MHP) oxidation and peroxyacetic acid 145
(PAA) oxidation (Cheng et al., 2016;Zheng et al., 2015a). Because some TMIs, such as Ti(III), 146
V(III), Cr(III), Co(II), Ni(II), Cu(II) and Zn(II), displayed much less catalytic activities (Cheng et 147
al., 2016), only Fe(III) and Mn(II) were considered in this study. In addition, due to the extremely 148
low concentrations of MHP and PAA in the atmosphere, their contributions to the production of 149
sulfate could be ignored (Zheng et al., 2015a). To investigate the formation mechanism of sulfate 150
during the serious pollution episodes, the contributions of O3, H2O2, NO2 and Fe(III) + Mn(II) to 151
the production of sulfate in aqueous-phase reactions were calculated by the formulas as follows 152
(Cheng et al., 2016;Ibusuki and Takeuchi, 1987;Seinfeld and Pandis, 2006): 153
−(𝑑[𝑆(𝐼𝑉)]
𝑑𝑡)𝑂3 = (𝑘0[𝑆𝑂2𝐻2𝑂] + 𝑘1[𝐻𝑆𝑂3
−] + 𝑘2[𝑆𝑂32−])[𝑂3(𝑎𝑞)] (R1) 154
−(𝑑[𝑆(𝐼𝑉)]
𝑑𝑡)𝐻2𝑂2 =
𝑘3[𝐻+][𝐻𝑆𝑂3
−][𝐻2𝑂2(𝑎𝑞)]
1+𝐾[𝐻+] (R2) 155
−(𝑑[𝑆(𝐼𝑉)]
𝑑𝑡)𝐹𝑒(𝐼𝐼𝐼)+𝑀𝑛(𝐼𝐼) = 𝑘4[𝐻
+]𝑎[𝑀𝑛(𝐼𝐼)][𝐹𝑒(𝐼𝐼𝐼)][𝑆(𝐼𝑉)] (R3) 156
−(𝑑[𝑆(𝐼𝑉)]
𝑑𝑡)𝑁𝑂2 = 𝑘5[𝑁𝑂2(𝑎𝑞)][𝑆(𝐼𝑉)] (R4) 157
where k0 = 2.4×10⁴ M-1 s-1, k1 = 3.7×10⁵ M-1 s-1, k2 = 1.5×10⁹ M-1 s-1, k3 = 7.45×10⁷ M-1 s-1, K = 158
13 M-1, k4 = 3.72×10⁷ M-1 s-1, a = -0.74 (pH≤4.2) or k4 = 2.51×10¹³ M-1 s-1, a = 0.67 (pH>4.2), and 159

8
k5 = (1.24-1.67)×107 M-1 s-1 (5.3≤pH≤8.7, the linear interpolated values were used for pH between 160
5.3 and 8.7) at 298 K (Clifton et al., 1988); [O3(aq)], [H2O2(aq)] and [NO2(aq)] could be calculated by 161
the Henry’s constants which are 1.1×10⁻² M atm-1, 1.0×10⁵ M atm-1 and 1.0×10⁻² M atm-1 at 298 K 162
for O3, H2O2 and NO2 respectively (Seinfeld and Pandis, 2006). As for [Fe(III)] and [Mn(II)], their 163
concentrations entirely depended on the values of pH due to the precipitation equilibriums of 164
Fe(OH)3 and Mn(OH)2 (Graedel and Weschler, 1981). Considering the aqueous-phase ionization 165
equilibrium of SO2, the Henry’s constants of HSO3-, SO3
2- and S(IV) could be expressed by the 166
equations as follows (Seinfeld and Pandis, 2006): 167
𝐻𝐻𝑆𝑂3−∗ = 𝐻𝑆𝑂2
𝐾𝑆1
[𝐻+] (R5) 168
𝐻𝑆𝑂32−∗ = 𝐻𝑆𝑂2
𝐾𝑆1𝐾𝑆2
[𝐻+]2 (R6) 169
𝐻𝑆(𝐼𝑉)∗ = 𝐻𝑆𝑂2(1 +
𝐾𝑆1
[𝐻+]+
𝐾𝑆1𝐾𝑆2
[𝐻+]2) (R7) 170
where HSO2 = 1.23 M atm-1, KS1 = 1.3×10⁻² M and KS2 = 6.6×10⁻⁸ M at 298 K. In addition, all 171
of rate constants (k), Henry’s constants (H) and ionization constants (K) are evidently influenced 172
on the ambient temperature and are calibrated by the formulas as follows (Seinfeld and Pandis, 173
2006): 174
𝑘(𝑇) = 𝑘(𝑇0)𝑒[−
𝐸
𝑅(1
𝑇−
1
𝑇0)]
(R8) 175
𝐻(𝑇) = 𝐻(𝑇0)𝑒[−
∆𝐻
𝑅(1
𝑇−
1
𝑇0)]
(R9) 176
𝐾(𝑇) = 𝐾(𝑇0)𝑒[−
𝐸
𝑅(1
𝑇−
1
𝑇0)]
(R10) 177
where T is the ambient temperature, T0=298 K, both E/R and ∆H/R varied in the different 178
equations and their values could be found in Cheng et al., (2016). 179
Furthermore, mass transport was also considered for multiphase reactions in different 180
medium and across the interface in section M3 of the SIs. 181

9
3. Results and Discussion 182
3.1. Variation characteristics of the species in PM2.5 and typical gaseous pollutants 183
The concentrations of the species in PM2.5 and typical gaseous pollutants including NO2, SO2, 184
O3, HONO and H2O2 as well as atmospheric RH are shown in Figure 1. The meteorological 185
parameters (wind speed, wind direction, ambient temperature and direct radiation (DR)) as well as 186
the concentrations of PM2.5 are displayed in Figure S2. During the sampling period, the 187
concentrations of the species in PM2.5 and typical gaseous pollutants varied similarly on a 188
timescale of hours with a distinct periodic cycle of 3-4 days, suggesting that meteorological 189
conditions played a vital role in accumulation and dispersion of atmospheric pollutants (Xu et al., 190
2011;Zheng et al., 2015b). For example, the relatively high levels of PM2.5 (>100 g m-3) usually 191
occurred under the relatively stable meteorological conditions with the low south wind speed (<2 192
m s-1) and the high RH (>60%) which favored the accumulation of pollutants. Besides 193
meteorological conditions, the extremely high concentrations of the species in PM2.5 might be 194
mainly ascribed to strong emissions of primary pollutants and rapid formation of secondary 195
aerosols during the wintertime in Beijing. 196
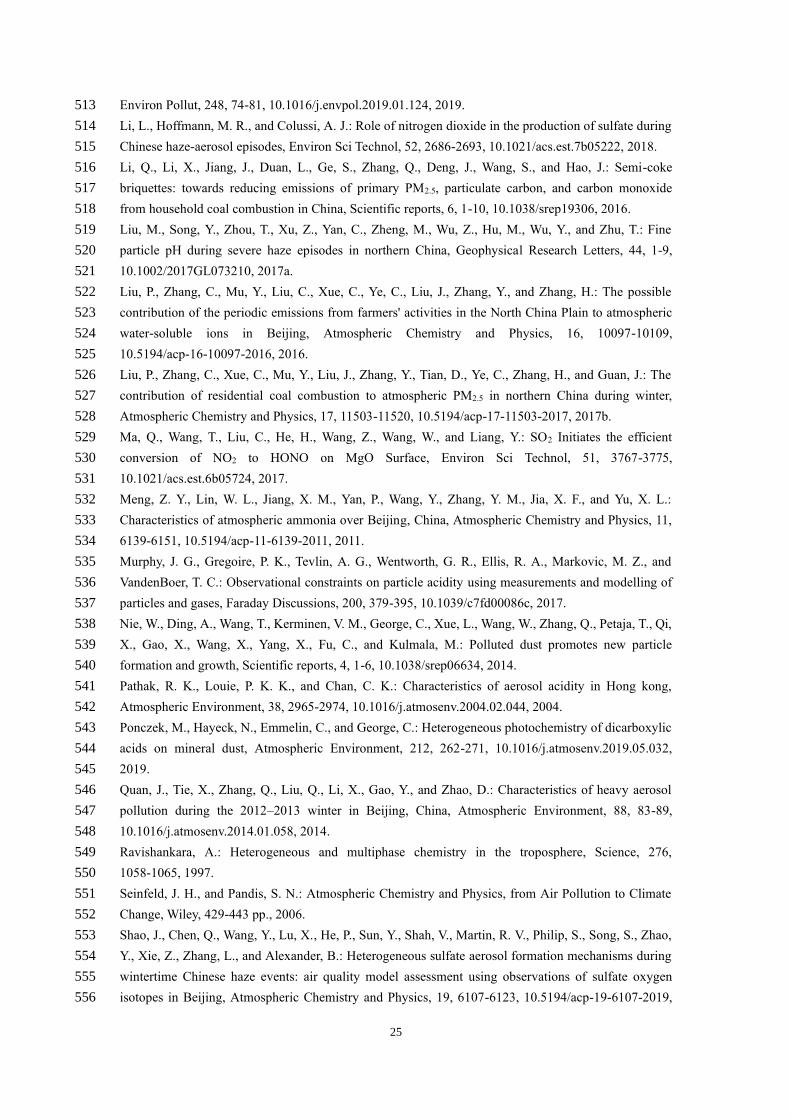
The average concentrations of the species in PM2.5 and typical gaseous pollutants during 197
clean or slightly polluted (C&SP) episodes (PM2.5<75 g m-3), during polluted or heavy polluted 198
(P&HP) episodes (PM2.5≥75 g m-3) and during the whole sampling period are illustrated in Table 199
1. It is evident that the average concentrations of NO3-, SO4
2-, NH4+, OC and EC during P&HP 200
episodes were about a factor of 5.0, 4.1, 6.1, 3.6 and 3.2 greater than those during C&SP episodes, 201
respectively, indicating that the formations of SIAs were more efficient compared to other species 202
in PM2.5 during the serious pollution episodes. Given that the average concentrations of gaseous 203

10
precursors (NO2 and SO2) during P&HP episodes were approximately a factor of 2.0-2.2 greater 204
than those during C&SP episodes, the obviously higher elevation of NO3- and SO4
2- implied that 205
the oxidations of NO2 and SO2 by the major atmospheric oxidizing agents (OH radicals, O3 and 206
H2O2 etc.) might be greatly accelerated due to the relatively high concentrations of oxidants and 207
atmospheric RH during the serious pollution episodes (Figure 1). The average concentration of 208
H2O2 was found to be a factor of 1.7 greater during P&HP episodes than during C&SP episodes, 209
indicating that atmospheric H2O2 might contribute to the formation of SIAs especially sulfate 210
during the serious pollution episodes with high atmospheric RH, which will be discussed in Sect. 211
3.3.2. However, the obvious decrease in O3 average concentration was observed during P&HP 212
episodes compared to C&SP episodes, which was mainly attributed to the relatively weak solar 213
radiation and the titration of NO during the serious pollution episodes (Ye et al., 2018). In addition, 214
the evidently higher average concentration of HONO during P&HP episodes than during C&SP 215
episodes might be also due to the relatively weak solar radiation as well as the heterogeneous 216
reaction of NO2 on particle surfaces during the serious pollution episodes (Tong et al., 2016;Wang 217
et al., 2017). 218
3.2. Three serious pollution cases during the sampling period 219
Based on the transition from the clean to polluted periods, three haze cases were identified 220
during the sampling period (Figure 1 and Figure S2): from 13:00 on January 8th to 1:00 on January 221
11th (Case 1), from 14:00 on January 14th to 7:00 on January 17th (Case 2), and from 8:00 on 222
January 19th to 2:00 on January 22nd (Case 3). The serious pollution duration in the three cases 223
could last 1-3 days due to the differences of their formation mechanisms. 224
In Case 1, the variation trends of the concentrations of the species in PM2.5, NO2, SO2, 225

11
HONO and H2O2 were almost identical and exhibited three pollution peaks at night (Figure 1), 226
which might be ascribed to the possibility that the decrease of nocturnal mixed boundary layer 227
accelerated the pollutant accumulation (Bei et al., 2017;Zhong et al., 2019). Considering the 228
relatively low RH (15-40%) and wind speeds (<2 m s-1) in Case 1 (Figure S2), primary emissions 229
around the sampling site were suspected to be a dominant source for the increase in the PM2.5 230
concentrations. Further evidence is that the correlation between the concentrations of PM2.5 and 231
CO is better in Case 1 (R2=0.55) than in Case 2 and Case 3 (R2=0.20~0.52) (Figure S3). Identical 232
to Case 1, three obvious pollution peaks were also observed in Case 2 (Figure 1). The variation 233
trends of the concentrations of the species in PM2.5 and typical gaseous pollutants at the first peak 234
in Case 2 were found to be similar with those in Case 1, which were mainly attributed to their 235
similar formation mechanism. However, the evident decreases in NOx and SO2 were observed 236
when the concentrations of the species in PM2.5 were increasing and the atmospheric oxidation 237
pollutant (e.g. H2O2) concentration peaks were prior to others at the last two peaks in Case 2, 238
suggesting that secondary formation from gaseous precursors might be dominant for PM2.5 239
pollution. The relatively high RH (50-80%) and the low south wind speeds (<2 m s-1) in Case 2 240
(Figure S2) provided further evidence for the above speculation. In contrast to Case 1 and Case 2, 241
the relatively high south wind speeds (>3 m s-1) (Figure S2) with the concentrations of the species 242
in PM2.5 and typical gaseous pollutants increasing slowly (Figure 1) at the beginning of Case 3 243
indicated that regional transportation might be responsible for the atmospheric species. 244
Subsequently, the concentrations of the species in PM2.5 remained relatively high when the 245
atmospheric RH lasted more than 60%, implying that secondary formation from gaseous 246
precursors dominated PM2.5 pollution during the late period of Case 3. 247
12
The average mass proportions of the species in PM2.5 in the three cases are illustrated in 248
Figure S4, the proportions of the primary species such as EC (10-13%), Cl- (6-7%) and Na+ (4%) 249
in the three cases were almost identical, indicating that primary particle emissions were relatively 250
stable during the sampling period. However, the proportions of SIA in Case 2 (42%) and Case 3 251
(38%) were conspicuously greater than that in Case 1 (28%), further confirming that secondary 252
formation of inorganic ions (e.g. nitrate, sulfate) made a significant contribution to atmospheric 253
PM2.5 in Case 2 and Case 3. 254
3.3. Formation mechanism of nitrate and sulfate during serious pollution episodes 255
As for nitrate and sulfate in the three cases, the highest mass proportion (18%) of nitrate was 256
observed in Case 2, whereas the highest mass proportion (15%) of sulfate was found in Case 3 257
(Figure S4). Although the concentrations of SO2 were obviously lower than the concentrations of 258
NO2 in both Case 2 and Case 3 (Figure 1 and Table 1), the extremely high proportion of sulfate in 259
Case 3 might be ascribed to the long-lasting plateau of RH (Figure S2) because the aqueous-phase 260
reaction could accelerate the conversion of SO2 to SO42-. To further investigate the pollution 261
characteristics of nitrate and sulfate during the serious pollution episodes, the relations between 262
NOR (NOR = NO3- / (NO3
-+NO2)) as well as SOR (SOR = SO42- / (SO4
2-+SO2)) and RH are 263
shown in Figure 2. There were obvious differences in the variations of NOR and SOR under 264
different atmospheric RH conditions. The variation trends of NOR and SOR almost stayed the 265
same when atmospheric RH was below 30%, and then simultaneously increased with atmospheric 266
RH in the range of 30-60%. The enhanced gas-phase reaction and the heterogeneous reaction 267
involving aerosol liquid water might make a remarkable contribution to the elevation of NOR and 268
SOR, respectively, which were further discussed in the following section. Subsequently, the 269

13
variation trend of NOR slowly decreased whereas the variation trend of SOR significantly 270
increased when atmospheric RH was above 60%, which was very similar with the previous studies 271
(Sun et al., 2013;Zheng et al., 2015b). Considering that the heterogeneous reactions of NO2 on 272
particle surface were dependent on atmospheric RH due to the competition of water for surface 273
reactive sites of particles (Ponczek et al., 2019), the slow reduction of NOR might be due to the 274
suppressed heterogeneous reaction of NO2 to nitrate formation under high RH condition (Tang et 275
al., 2017), while the elevation of SOR revealed the dominant contribution of the aqueous-phase 276
reaction to sulfate formation. 277
3.3.1. Formation mechanism of nitrate 278
Atmospheric nitrate is considered to be mainly from NO2 oxidation by OH radical in the gas 279
phase, heterogeneous uptake of NO2 on the surface of particles and heterogeneous hydrolysis of 280
N2O5 on wet aerosols or chloride-containing aerosols (He et al., 2014;He et al., 2018;Nie et al., 281
2014;Ravishankara, 1997;Wang et al., 2018b). Since atmospheric N2O5 is usually produced by the 282
reaction of NO3 radical with NO2 as well as both NO3 radical and N2O5 are easily photolytic 283
during the daytime, the heterogeneous hydrolysis of N2O5 is a nighttime pathway for the 284
formation of atmospheric nitrate (He et al., 2018;Wang et al., 2018b). As shown in Figure 3a, the 285
mean values of NOR during the nighttime remarkably elevated with atmospheric RH increasing, 286
the disproportionation of NO2 and the heterogeneous hydrolysis of N2O5 involving aerosol liquid 287
water were suspected to dominate the nocturnal formation of nitrate under high RH conditions 288
during the sampling period (Ma et al., 2017;Wang et al., 2018b;Li et al., 2018). However, the 289
productions of HONO and nitrate should be equal through the disproportionation of NO2 (Ma et 290
al., 2017), which could not explain the wide gaps between the average concentrations of HONO 291
14
(about 6.5 g m-3) and nitrate (about 20.1 g m-3) observed at the nighttime under high RH 292
conditions during the sampling period. Thus, the disproportionation of NO2 made insignificant 293
contribution to the nocturnal formation of nitrate under high RH conditions. Considering that the 294
formation of atmospheric NO3 radical is mainly via the oxidation of NO2 by O3, the heterogeneous 295
hydrolysis of N2O5 occurs only at high O3 and NO2 levels during the nighttime (He et al., 296
2018;Wang et al., 2018b). Therefore, the correlation between [NO2]2 × [O3] and NOR can 297
represent roughly the contribution of the heterogeneous hydrolysis of N2O5 to atmospheric nitrate 298
at night. As shown in Figure 3b, the variations of [NO2]2 × [O3] at the nighttime (18:00-7:00) were 299
all positively correlated with NOR under the three different RH conditions, and their correlation 300
under the RH 60% condition (R2 = 0.552) was significantly stronger than those under the RH < 301
60% condition (R2 0.181). It has been acknowledged that the correlation between two species 302
means the impact of changes in one species on another. The stronger the correlation is, the greater 303
the impact is. Therefore, the positive correlations between NOR and [NO2]2 × [O3] indicated that 304
the heterogeneous hydrolysis of N2O5 could contribute to the formation of atmospheric nitrate at 305
the nighttime under different RH conditions. The significantly stronger correlations between NOR 306
and [NO2]2 × [O3] under the RH 60% condition than under the RH < 60% condition revealed 307
that the heterogeneous hydrolysis of N2O5 made a remarkable contribution to atmospheric nitrate 308
at the nighttime under high RH condition. Additionally, the obviously lower slope of the 309
correlation between NOR and [NO2]2 × [O3] under the RH 60% condition (slope = 11691) than 310
under the RH < 60% condition (slope 17399) (Figure 3b) also suggested that the formation of 311
atmospheric nitrate at the nighttime under high RH condition was more sensitive to the pathway of 312
N2O5. 313

15
However, the obvious increase in the mean values of NOR during the daytime (especially for 314
10:00-17:00) under the 30%<RH<60% condition (Figure 3a) indicated that additional sources 315
rather than the heterogeneous hydrolysis of N2O5 were responsible for the formation of nitrate. To 316
explore the possible formation mechanisms of nitrate in this case, the daily variations of [Dust] 317
(the sum of Ca2+ and Mg2+) × [NO2] and [HONO] (the main source of OH) × [DR] × [NO2], 318
which can represent roughly the heterogeneous reaction of NO2 on the surface of mineral aerosols 319
and the gas-phase reaction of NO2 with OH, are shown in Figure 3c and Figure 3d, respectively. 320
The mean values of [HONO] × [DR] × [NO2] during the daytime were found to be remarkably 321
greater under the 30%<RH<60% condition than under the RH≤30% condition, whereas the mean 322
values of [Dust] × [NO2] almost stayed the same under the two different RH conditions. 323
Considering the coincident trend of NOR and [HONO] × [DR] × [NO2] during the daytime 324
(10:00-17:00) under the 30%<RH<60% condition, the gas-phase reaction of NO2 with OH played 325
a key role in the diurnal formation of nitrate at moderate RH levels with the haze pollution 326
accumulating. It should be noted that the mean values of [HONO] × [DR] × [NO2] decreased 327
dramatically from 14:00 to 17:00 (Figure 3d), which was not responsible for the high mean values 328
of NOR at that time (Figure 3a). However, the slight increase in the mean values of [Dust] × [NO2] 329
after 14:00 was observed under the 30%<RH<60% condition (Figure 3c) and hence the 330
heterogeneous reaction of NO2 on the surface of mineral aerosols was suspected to contribute to 331
the diurnal formation of nitrate at that time under moderate RH condition. 332
3.3.2. Formation mechanism of sulfate 333
Atmospheric sulfate is principally from SO2 oxidation pathway, including gas-phase 334
reactions with OH radical or stabilized Criegee intermediates, heterogeneous-phase reactions on 335

16
the surface of particles and aqueous-phase reactions with dissolved O3, NO2, H2O2 and organic 336
peroxides, as well as autoxidation catalyzed by TMI (Cheng et al., 2016;Li et al., 337
2018;Ravishankara, 1997;Shao et al., 2019;Wang et al., 2016;Xue et al., 2016;Zhang et al., 2018). 338
As shown in Figure 4, similar to the daily variations of NOR, the mean values of SOR were found 339
to elevated remarkably under the 30%<RH<60% condition compared to the RH30% condition, 340
especially during 14:00-22:00, which might be mainly ascribed to the enhanced gas-phase reaction 341
and the heterogeneous reaction of SO2 involving aerosol liquid water under the relatively high RH 342
condition. The extremely high mean values of SOR during the whole day under the RH≥60% 343
condition implied that aqueous oxidation of SO2 dominated the formation of sulfate during the 344
severe pollution episodes, which was in line with previous studies (Zhang et al., 2018;Cheng et al., 345
2016). A key factor that influenced the aqueous oxidation pathways for sulfate formation has been 346
considered to be the aerosol pH (Guo et al., 2017;Liu et al., 2017a), varying from 4.5 to 8.5 at 347
different atmospheric RH and sulfate levels during the sampling period (Figure 5a) on the basis of 348
the ISORROPIA-II model. Considering that the aqueous-phase chemistry of sulfate formation 349
usually occurs in severe haze events with relatively high atmospheric RH, the aerosol pH (4.5-5.3) 350
under the RH≥60% condition, which was lower than those (5.4-7.0) in the studies of Wang et al., 351
(2016) and Cheng et al., (2016) but was slightly higher than those (3.0-4.9) in the studies of Liu et 352
al., (2017a) and Guo et al., (2017), was adopted for evaluating sulfate production in this study. In 353
addition, in terms of oxidants, the obvious increase in the average concentration of NO2 (Figure 5b) 354
and the evident decrease in the average concentration of O3 (Figure 5d) were observed with the 355
deterioration of PM2.5 pollution. Furthermore, the average concentration of H2O2 was also found 356
to be extremely high (0.25 ppb) under the HP condition (Figure 5c) and was above 1 order of 357

17
magnitude higher than that (0.01 ppb) assumed by Cheng et al., (2016), which probably resulted in 358
the underestimation of the contribution of H2O2 to sulfate formation in the study of Cheng et al., 359
(2016). 360
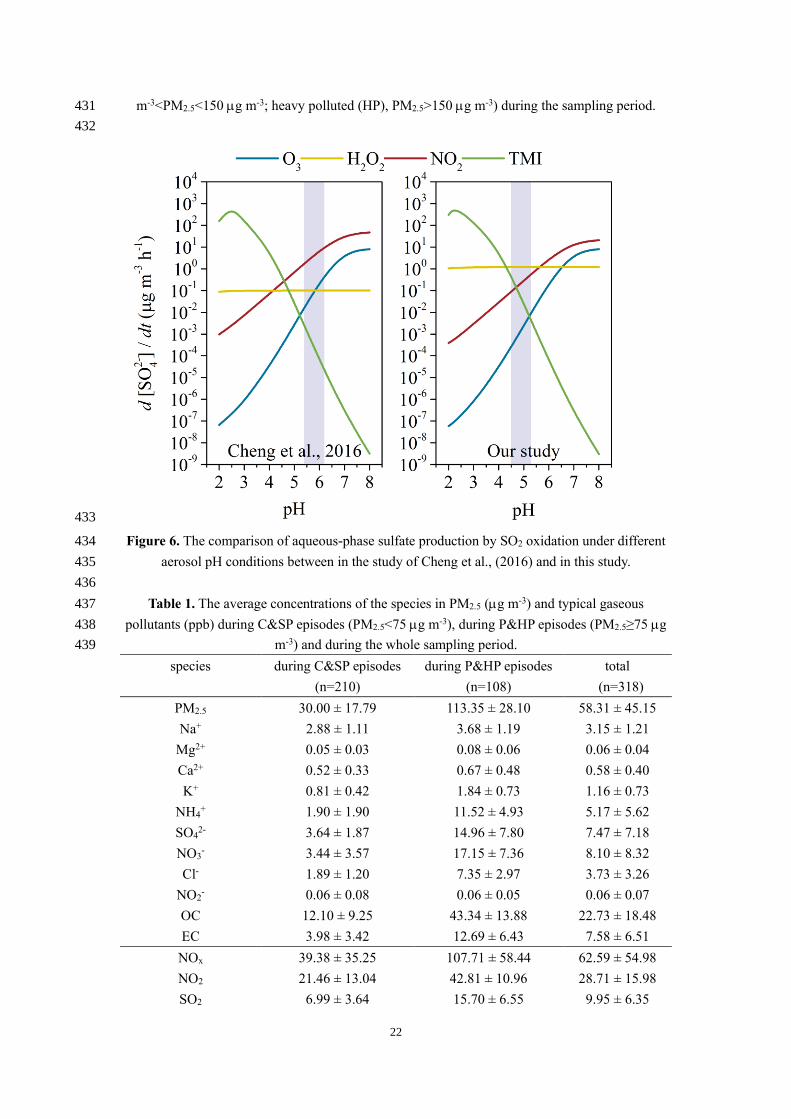
To further explore the contribution of H2O2 to sulfate production rate under the HP condition, 361
the parameters measured in this study (Table 2) and the same approach that was adopted by Cheng 362
et al., (2016) were used to calculate sulfate production. As shown in Figure 6, the relationships 363
between different aqueous oxidation pathways and aerosol pH in this study were found to be very 364
similar with those of Cheng et al., (2016). However, the contribution of H2O2 to sulfate production 365
rate was about a factor of 17 faster in this study (about 1.16 g m-3 h-1) than in the study (about 366
6.95×10⁻² g m-3 h-1) of Cheng et al., (2016), implying that the contribution of H2O2 to sulfate 367
formation was largely neglected. Furthermore, considering the aerosol pH calculated under the HP 368
condition during the sampling period, the oxidation pathway of NO2 might play an insignificant 369
role in sulfate production rate (8.96×10⁻²-0.56 g m-3 h-1) and its importance proposed by the 370
previous studies (1.74-10.85 g m-3 h-1) was not necessarily expected. 371
4. Conclusion 372
Based on the comprehensive analysis of the pollution levels, the variation characteristics and 373
the formation mechanisms of the key species in PM2.5 and the typical gaseous pollutants during 374
the winter haze pollution periods in Beijing, three serious haze pollution cases were obtained 375
during the sampling period and the SIAs formations especially nitrate and sulfate were found to 376
make an evident contribution to atmospheric PM2.5 under the relatively high RH condition. The 377
significant correlation between [NO2]2 × [O3] and NOR at night under the RH≥60% condition 378
indicated that the heterogeneous hydrolysis of N2O5 on wet aerosols was responsible for the 379

18
nocturnal formation of nitrate under extremely high RH conditions. The more coincident trend of 380
NOR and [HONO] × [DR] × [NO2] than [Dust] × [NO2] during the daytime under the 381
30%<RH<60% condition suggested that the gas-phase reaction of NO2 with OH played a key role 382
in the diurnal formation of nitrate under moderate RH conditions. The extremely high mean values 383
of SOR during the whole day under the RH≥60% condition could be explained by the dominant 384
contribution of aqueous-phase reaction of SO2 to atmospheric sulfate formation during the severe 385
pollution episodes. According to the parameters measured in this study and the same approach that 386
was adopted by Cheng et al., (2016), the oxidation pathway of H2O2 rather than NO2 was found to 387
contribute greatly to atmospheric sulfate formation. 388
Our results revealed that the heavy pollution events in winter usually occurred with high 389
concentration levels of pollutants and oxidants as well as high liquid water contents of moderately 390
acidic aerosols in the NCP. Thus, emission controls of NOx, SO2 and VOCs especially under the 391
extremely high RH conditions are expected to reduce largely the pollution levels of nitrate and 392
sulfate in northern China and even in other pollution regions of China. 393
394
Data availability. Data are available from the corresponding author upon request 395
([email protected]) 396
397
Author contributions. YJM designed the experiments. PFL carried out the experiments and 398
prepared the manuscript. CY and CYX carried out the experiments. CLZ was involved in part of 399
the work. XS provided the meteorological data and trace gases in Beijing. 400
401

19
Competing interests. The authors declare that they have no conflict of interest. 402
403
Acknowledgement. This work was supported by the National research program for Key issues in 404
air pollution control (No. DQGG0103, DQGG0209, DQGG0206), the National Natural Science 405
Foundation of China (No. 91544211, 4127805, 41575121, 21707151), the National Key Research 406
and Development Program of China (No. 2016YFC0202200, 2017YFC0209703, 407
2017YFF0108301) and Key Laboratory of Atmospheric Chemistry, China Meteorological 408
Administration (No. 2018B03). 409
410
411
Figure 1. Time series of the species in PM2.5 and typical gaseous pollutants (NO2, SO2, O3, 412
HONO and H2O2) as well as atmospheric RH during the sampling period. 413
414

20
415
Figure 2. The relations between NOR as well as SOR and RH during the sampling period. 416
417
418
Figure 3. Daily variation of NOR (a), the correlation between NOR and [NO2]2 × [O3] at the 419
nighttime (18:00-7:00) (b), daily variations of [Dust] × [NO2] and [HONO] × [DR] × [NO2] (c, d) 420
under different atmospheric RH conditions during the sampling period. 421
422

21
423
Figure 4. Daily variation of SOR under different atmospheric RH conditions during the sampling 424
period. 425
426
427
Figure 5. The correlations among aerosol pH, atmospheric RH and atmospheric SO42- (a), the 428
average concentrations of NO2, H2O2 and O3 (b, c, d) under different pollution conditions (clean 429
(C), PM2.5<35 g m-3; slightly polluted (SP), 35 g m-3<PM2.5<75 g m-3; polluted (P), 75 g 430
22
m-3<PM2.5<150 g m-3; heavy polluted (HP), PM2.5>150 g m-3) during the sampling period. 431
432
433
Figure 6. The comparison of aqueous-phase sulfate production by SO2 oxidation under different 434
aerosol pH conditions between in the study of Cheng et al., (2016) and in this study. 435
436
Table 1. The average concentrations of the species in PM2.5 (g m-3) and typical gaseous 437
pollutants (ppb) during C&SP episodes (PM2.5<75 g m-3), during P&HP episodes (PM2.5≥75 g 438
m-3) and during the whole sampling period. 439
species during C&SP episodes
(n=210)
during P&HP episodes
(n=108)
total
(n=318)
PM2.5 30.00 ± 17.79 113.35 ± 28.10 58.31 ± 45.15
Na+ 2.88 ± 1.11 3.68 ± 1.19 3.15 ± 1.21
Mg2+ 0.05 ± 0.03 0.08 ± 0.06 0.06 ± 0.04
Ca2+ 0.52 ± 0.33 0.67 ± 0.48 0.58 ± 0.40
K+ 0.81 ± 0.42 1.84 ± 0.73 1.16 ± 0.73
NH4+ 1.90 ± 1.90 11.52 ± 4.93 5.17 ± 5.62
SO42- 3.64 ± 1.87 14.96 ± 7.80 7.47 ± 7.18
NO3- 3.44 ± 3.57 17.15 ± 7.36 8.10 ± 8.32
Cl- 1.89 ± 1.20 7.35 ± 2.97 3.73 ± 3.26
NO2- 0.06 ± 0.08 0.06 ± 0.05 0.06 ± 0.07
OC 12.10 ± 9.25 43.34 ± 13.88 22.73 ± 18.48
EC 3.98 ± 3.42 12.69 ± 6.43 7.58 ± 6.51
NOx 39.38 ± 35.25 107.71 ± 58.44 62.59 ± 54.98
NO2 21.46 ± 13.04 42.81 ± 10.96 28.71 ± 15.98
SO2 6.99 ± 3.64 15.70 ± 6.55 9.95 ± 6.35

23
O3 8.01 ± 6.35 2.13 ± 0.56 6.01 ± 5.87
HONO 0.60 ± 0.43 1.90 ± 0.97 1.01 ± 0.87
H2O2 0.17 ± 0.11 0.29 ± 0.14 0.20 ± 0.13
440
Table 2. The comparisons for parameters of sulfate production rate calculations between in the 441
study of Cheng et al., (2016) and in this work during the most polluted haze periods 442
Parameters This study Cheng et al., (2016)
NO2 57 ppb 66 ppb
H2O2 0.25 ppb 0.01 ppb
O3 2 ppb 1 ppb
SO2 35 ppb 40 ppb
Fe(III)a 18 ng m-3 18 ng m-3
Mn(II)a 42 ng m-3 42 ng m-3
ALWC 146 μg m-3 300 μg m-3
Aerosol droplet radius (R)a 0.15 μm 0.15 μm
Temperature 270 K 271 K
pH 4.5-5.3 5.4-6.2
a: both the concentrations of Fe(III) and Mn(II) and aerosol droplet radius were not measured in 443
this study and were derived from Cheng et al., (2016). 444
445
References 446
Bei, N., Wu, J., Elser, M., Feng, T., Cao, J., El-Haddad, I., Li, X., Huang, R., Li, Z., Long, X., Xing, L., 447
Zhao, S., Tie, X., Prévôt, A. S. H., and Li, G.: Impacts of meteorological uncertainties on the haze 448
formation in Beijing–Tianjin–Hebei (BTH) during wintertime: a case study, Atmospheric Chemistry 449
and Physics, 17, 14579-14591, 10.5194/acp-17-14579-2017, 2017. 450
Bougiatioti, A., Nikolaou, P., Stavroulas, I., Kouvarakis, G., Weber, R., Nenes, A., Kanakidou, M., and 451
Mihalopoulos, N.: Particle water and pH in the eastern Mediterranean: source variability and 452
implications for nutrient availability, Atmospheric Chemistry and Physics, 16, 4579-4591, 453
10.5194/acp-16-4579-2016, 2016. 454
Chan, C. K., and Yao, X.: Air pollution in mega cities in China, Atmospheric Environment, 42, 1-42, 455
10.1016/j.atmosenv.2007.09.003, 2008. 456
Chen, L. H., Sun, Y. Y., Wu, X. C., Zhang, Y. X., Zheng, C. H., Gao, X., and Cen, K.: Unit-based 457
emission inventory and uncertainty assessment of coal-fired power plants, Atmospheric Environment, 458
99, 527-535, 10.1016/j.atmosenv.2014.10.023, 2014. 459
Cheng, Y., Zheng, G., Wei, C., Mu, Q., Zheng, B., Wang, Z., Gao, M., Zhang, Q., He, K., Carmichael, 460
G., Pöschl, U., and Su, H.: Reactive nitrogen chemistry in aerosol water as a source of sulfate during 461
haze events in China, Science Advances, 2, 1-11, 10.1126/sciadv.1601530, 2016. 462
Clifton, C. L., Altstein, N., and Huie, R. E.: Rate-constant for the reaction of NO2 with sulfur(IV) over 463
the pH range 5.3-13, Environ. Sci. Technol., 22, 586-589, 10.1021/es00170a018, 1988. 464
Dai, Q., Bi, X., Song, W., Li, T., Liu, B., Ding, J., Xu, J., Song, C., Yang, N., Schulze, B. C., Zhang, Y., 465
Feng, Y., and Hopke, P. K.: Residential coal combustion as a source of primary sulfate in Xi'an, China, 466
Atmospheric Environment, 196, 66-76, 10.1016/j.atmosenv.2018.10.002, 2019. 467
Ding, J., Zhao, P., Su, J., Dong, Q., Du, X., and Zhang, Y.: Aerosol pH and its driving factors in Beijing, 468

24
Atmospheric Chemistry and Physics, 19, 7939-7954, 10.5194/acp-19-7939-2019, 2019. 469
Du, Q., Zhang, C., Mu, Y., Cheng, Y., Zhang, Y., Liu, C., Song, M., Tian, D., Liu, P., Liu, J., Xue, C., 470
and Ye, C.: An important missing source of atmospheric carbonyl sulfide: Domestic coal combustion, 471
Geophysical Research Letters, 43, 8720-8727, 10.1002/2016gl070075, 2016. 472
Fountoukis, C., and Nenes, A.: ISORROPIA II: a computationally efficient thermodynamic equilibrium 473
model for K+-Ca2+-Mg2+-NH4+-Na+-SO4
2--NO3--Cl--H2O aerosols, Atmospheric Chemistry and Physics, 474
7, 4639-4659, 2007. 475
Ge, X., He, Y., Sun, Y., Xu, J., Wang, J., Shen, Y., and Chen, M.: Characteristics and Formation 476
Mechanisms of Fine Particulate Nitrate in Typical Urban Areas in China, Atmosphere, 8, 62, 477
10.3390/atmos8030062, 2017. 478
Graedel, T. E., and Weschler, C. J.: Chemistry within aqueous atmospheric aerosols and raindrops, 479
Reviews of Geophysics, 19, 505-539, 10.1029/RG019i004p00505, 1981. 480
Guo, H., Xu, L., Bougiatioti, A., Cerully, K. M., Capps, S. L., Hite, J. R., Carlton, A. G., Lee, S. H., 481
Bergin, M. H., Ng, N. L., Nenes, A., and Weber, R. J.: Fine-particle water and pH in the southeastern 482
United States, Atmospheric Chemistry and Physics, 15, 5211-5228, 10.5194/acp-15-5211-2015, 2015. 483
Guo, H., Weber, R. J., and Nenes, A.: High levels of ammonia do not raise fine particle pH sufficiently 484
to yield nitrogen oxide-dominated sulfate production, Scientific reports, 7, 12109, 485
10.1038/s41598-017-11704-0, 2017. 486
Guo, S., Hu, M., Zamora, M. L., Peng, J., Shang, D., Zheng, J., Du, Z., Wu, Z., Shao, M., Zeng, L., 487
Molina, M. J., and Zhang, R.: Elucidating severe urban haze formation in China, Proceedings of the 488
National Academy of Sciences of the United States of America, 111, 17373-17378, 489
10.1073/pnas.1419604111, 2014. 490
He, H., Wang, Y., Ma, Q., Ma, J., Chu, B., Ji, D., Tang, G., Liu, C., Zhang, H., and Hao, J.: Mineral 491
dust and NOx promote the conversion of SO2 to sulfate in heavy pollution days, Scientific reports, 4, 492
1-5, 10.1038/srep04172, 2014. 493
He, P., Xie, Z., Chi, X., Yu, X., Fan, S., Kang, H., Liu, C., and Zhan, H.: Atmospheric Δ17O(NO3−) 494
reveals nocturnal chemistry dominates nitrate production in Beijing haze, Atmospheric Chemistry and 495
Physics, 18, 14465-14476, 10.5194/acp-18-14465-2018, 2018. 496
Hennigan, C. J., Izumi, J., Sullivan, A. P., Weber, R. J., and Nenes, A.: A critical evaluation of proxy 497
methods used to estimate the acidity of atmospheric particles, Atmospheric Chemistry and Physics, 15, 498
2775-2790, 10.5194/acp-15-2775-2015, 2015. 499
Huang, R. J., Zhang, Y., Bozzetti, C., Ho, K. F., Cao, J. J., Han, Y., Daellenbach, K. R., Slowik, J. G., 500
Platt, S. M., Canonaco, F., Zotter, P., Wolf, R., Pieber, S. M., Bruns, E. A., Crippa, M., Ciarelli, G., 501
Piazzalunga, A., Schwikowski, M., Abbaszade, G., Schnelle-Kreis, J., Zimmermann, R., An, Z., Szidat, 502
S., Baltensperger, U., El Haddad, I., and Prevot, A. S.: High secondary aerosol contribution to 503
particulate pollution during haze events in China, Nature, 514, 218-222, 10.1038/nature13774, 2014. 504
Ibusuki, T., and Takeuchi, K.: Sulfur-dioxide oxidation by oxygen catalyzed by mixtures of 505
manganese(II) and iron(III) in aqueous-solutions at environmental reaction conditions, Atmospheric 506
Environment, 21, 1555-1560, 10.1016/0004-6981(87)90317-9, 1987. 507
Li, G., Bei, N., Cao, J., Huang, R., Wu, J., Feng, T., Wang, Y., Liu, S., Zhang, Q., Tie, X., and Molina, 508
L. T.: A possible pathway for rapid growth of sulfate during haze days in China, Atmospheric 509
Chemistry and Physics, 17, 3301-3316, 10.5194/acp-17-3301-2017, 2017. 510
Li, J., Liao, H., Hu, J., and Li, N.: Severe particulate pollution days in China during 2013-2018 and the 511
associated typical weather patterns in Beijing-Tianjin-Hebei and the Yangtze River Delta regions, 512
25
Environ Pollut, 248, 74-81, 10.1016/j.envpol.2019.01.124, 2019. 513
Li, L., Hoffmann, M. R., and Colussi, A. J.: Role of nitrogen dioxide in the production of sulfate during 514
Chinese haze-aerosol episodes, Environ Sci Technol, 52, 2686-2693, 10.1021/acs.est.7b05222, 2018. 515
Li, Q., Li, X., Jiang, J., Duan, L., Ge, S., Zhang, Q., Deng, J., Wang, S., and Hao, J.: Semi-coke 516
briquettes: towards reducing emissions of primary PM2.5, particulate carbon, and carbon monoxide 517
from household coal combustion in China, Scientific reports, 6, 1-10, 10.1038/srep19306, 2016. 518
Liu, M., Song, Y., Zhou, T., Xu, Z., Yan, C., Zheng, M., Wu, Z., Hu, M., Wu, Y., and Zhu, T.: Fine 519
particle pH during severe haze episodes in northern China, Geophysical Research Letters, 44, 1-9, 520
10.1002/2017GL073210, 2017a. 521
Liu, P., Zhang, C., Mu, Y., Liu, C., Xue, C., Ye, C., Liu, J., Zhang, Y., and Zhang, H.: The possible 522
contribution of the periodic emissions from farmers' activities in the North China Plain to atmospheric 523
water-soluble ions in Beijing, Atmospheric Chemistry and Physics, 16, 10097-10109, 524
10.5194/acp-16-10097-2016, 2016. 525
Liu, P., Zhang, C., Xue, C., Mu, Y., Liu, J., Zhang, Y., Tian, D., Ye, C., Zhang, H., and Guan, J.: The 526
contribution of residential coal combustion to atmospheric PM2.5 in northern China during winter, 527
Atmospheric Chemistry and Physics, 17, 11503-11520, 10.5194/acp-17-11503-2017, 2017b. 528
Ma, Q., Wang, T., Liu, C., He, H., Wang, Z., Wang, W., and Liang, Y.: SO2 Initiates the efficient 529
conversion of NO2 to HONO on MgO Surface, Environ Sci Technol, 51, 3767-3775, 530
10.1021/acs.est.6b05724, 2017. 531
Meng, Z. Y., Lin, W. L., Jiang, X. M., Yan, P., Wang, Y., Zhang, Y. M., Jia, X. F., and Yu, X. L.: 532
Characteristics of atmospheric ammonia over Beijing, China, Atmospheric Chemistry and Physics, 11, 533
6139-6151, 10.5194/acp-11-6139-2011, 2011. 534
Murphy, J. G., Gregoire, P. K., Tevlin, A. G., Wentworth, G. R., Ellis, R. A., Markovic, M. Z., and 535
VandenBoer, T. C.: Observational constraints on particle acidity using measurements and modelling of 536
particles and gases, Faraday Discussions, 200, 379-395, 10.1039/c7fd00086c, 2017. 537
Nie, W., Ding, A., Wang, T., Kerminen, V. M., George, C., Xue, L., Wang, W., Zhang, Q., Petaja, T., Qi, 538
X., Gao, X., Wang, X., Yang, X., Fu, C., and Kulmala, M.: Polluted dust promotes new particle 539
formation and growth, Scientific reports, 4, 1-6, 10.1038/srep06634, 2014. 540
Pathak, R. K., Louie, P. K. K., and Chan, C. K.: Characteristics of aerosol acidity in Hong kong, 541
Atmospheric Environment, 38, 2965-2974, 10.1016/j.atmosenv.2004.02.044, 2004. 542
Ponczek, M., Hayeck, N., Emmelin, C., and George, C.: Heterogeneous photochemistry of dicarboxylic 543
acids on mineral dust, Atmospheric Environment, 212, 262-271, 10.1016/j.atmosenv.2019.05.032, 544
2019. 545
Quan, J., Tie, X., Zhang, Q., Liu, Q., Li, X., Gao, Y., and Zhao, D.: Characteristics of heavy aerosol 546
pollution during the 2012–2013 winter in Beijing, China, Atmospheric Environment, 88, 83-89, 547
10.1016/j.atmosenv.2014.01.058, 2014. 548
Ravishankara, A.: Heterogeneous and multiphase chemistry in the troposphere, Science, 276, 549
1058-1065, 1997. 550
Seinfeld, J. H., and Pandis, S. N.: Atmospheric Chemistry and Physics, from Air Pollution to Climate 551
Change, Wiley, 429-443 pp., 2006. 552
Shao, J., Chen, Q., Wang, Y., Lu, X., He, P., Sun, Y., Shah, V., Martin, R. V., Philip, S., Song, S., Zhao, 553
Y., Xie, Z., Zhang, L., and Alexander, B.: Heterogeneous sulfate aerosol formation mechanisms during 554
wintertime Chinese haze events: air quality model assessment using observations of sulfate oxygen 555
isotopes in Beijing, Atmospheric Chemistry and Physics, 19, 6107-6123, 10.5194/acp-19-6107-2019, 556
26
2019. 557
Shi, G., Xu, J., Peng, X., Xiao, Z., Chen, K., Tian, Y., Guan, X., Feng, Y., Yu, H., Nenes, A., and 558
Russell, A. G.: pH of aerosols in a polluted atmosphere: source contributions to highly acidic aerosol, 559
Environ Sci Technol, 51, 4289-4296, 10.1021/acs.est.6b05736, 2017. 560
Sun, Y., Wang, Z., Fu, P., Jiang, Q., Yang, T., Li, J., and Ge, X.: The impact of relative humidity on 561
aerosol composition and evolution processes during wintertime in Beijing, China, Atmospheric 562
Environment, 77, 927-934, 10.1016/j.atmosenv.2013.06.019, 2013. 563
Tang, M., Huang, X., Lu, K., Ge, M., Li, Y., Cheng, P., Zhu, T., Ding, A., Zhang, Y., Gligorovski, S., 564
Song, W., Ding, X., Bi, X., and Wang, X.: Heterogeneous reactions of mineral dust aerosol: 565
implications for tropospheric oxidation capacity, Atmospheric Chemistry and Physics, 17, 11727-11777, 566
10.5194/acp-17-11727-2017, 2017. 567
Tham, Y. J., Wang, Z., Li, Q., Wang, W., Wang, X., Lu, K., Ma, N., Yan, C., Kecorius, S., Wiedensohler, 568
A., Zhang, Y., and Wang, T.: Heterogeneous N2O5 uptake coefficient and production yield of ClNO2 in 569
polluted northern China: roles of aerosol water content and chemical composition, Atmospheric 570
Chemistry and Physics, 18, 13155-13171, 10.5194/acp-18-13155-2018, 2018. 571
Tong, S. R., Hou, S. Q., Zhang, Y., Chu, B. W., Liu, Y. C., He, H., Zhao, P. S., and Ge, M. F.: Exploring 572
the nitrous acid (HONO) formation mechanism in winter Beijing: direct emissions and heterogeneous 573
production in urban and suburban areas, Faraday Discussions, 189, 213-230, 10.1039/c5fd00163c, 574
2016. 575
Wang, G., Zhang, R., Gomez, M. E., Yang, L., Levy Zamora, M., Hu, M., Lin, Y., Peng, J., Guo, S., 576
Meng, J., Li, J., Cheng, C., Hu, T., Ren, Y., Wang, Y., Gao, J., Cao, J., An, Z., Zhou, W., Li, G., Wang, 577
J., Tian, P., Marrero-Ortiz, W., Secrest, J., Du, Z., Zheng, J., Shang, D., Zeng, L., Shao, M., Wang, W., 578
Huang, Y., Wang, Y., Zhu, Y., Li, Y., Hu, J., Pan, B., Cai, L., Cheng, Y., Ji, Y., Zhang, F., Rosenfeld, D., 579
Liss, P. S., Duce, R. A., Kolb, C. E., and Molina, M. J.: Persistent sulfate formation from London Fog 580
to Chinese haze, Proceedings of the National Academy of Sciences of the United States of America, 581
113, 13630-13635, 2016. 582
Wang, G., Zhang, F., Peng, J., Duan, L., Ji, Y., Marrero-Ortiz, W., Wang, J., Li, J., Wu, C., Cao, C., 583
Wang, Y., Zheng, J., Secrest, J., Li, Y., Wang, Y., Li, H., Li, N., and Zhang, R.: Particle acidity and 584
sulfate production during severe haze events in China cannot be reliably inferred by assuming a 585
mixture of inorganic salts, Atmospheric Chemistry and Physics, 18, 10123-10132, 586
10.5194/acp-18-10123-2018, 2018a. 587
Wang, H., Lu, K., Chen, X., Zhu, Q., Wu, Z., Wu, Y., and Sun, K.: Fast particulate nitrate formation via 588
N2O5 uptake aloft in winter in Beijing, Atmospheric Chemistry and Physics, 18, 10483-10495, 589
10.5194/acp-18-10483-2018, 2018b. 590
Wang, H., Lu, K., Guo, S., Wu, Z., Shang, D., Tan, Z., Wang, Y., Le Breton, M., Lou, S., Tang, M., Wu, 591
Y., Zhu, W., Zheng, J., Zeng, L., Hallquist, M., Hu, M., and Zhang, Y.: Efficient N2O5 uptake and NO3 592
oxidation in the outflow of urban Beijing, Atmospheric Chemistry and Physics, 18, 9705-9721, 593
10.5194/acp-18-9705-2018, 2018c. 594
Wang, J., Zhang, X., Guo, J., Wang, Z., and Zhang, M.: Observation of nitrous acid (HONO) in Beijing, 595
China: Seasonal variation, nocturnal formation and daytime budget, The Science of the total 596
environment, 587-588, 350-359, 10.1016/j.scitotenv.2017.02.159, 2017. 597
Wang, Y., Yao, L., Wang, L., Liu, Z., Ji, D., Tang, G., Zhang, J., Sun, Y., Hu, B., and Xin, J.: 598
Mechanism for the formation of the January 2013 heavy haze pollution episode over central and 599
eastern China, Science China Earth Sciences, 57, 14-25, 10.1007/s11430-013-4773-4, 2013. 600

27
Weber, R. J., Guo, H., Russell, A. G., and Nenes, A.: High aerosol acidity despite declining 601
atmospheric sulfate concentrations over the past 15 years, Nature Geoscience, 9, 282-285, 602
10.1038/ngeo2665, 2016. 603
Wu, J., Bei, N., Hu, B., Liu, S., Zhou, M., Wang, Q., Li, X., Liu, L., Feng, T., Liu, Z., Wang, Y., Cao, J., 604
Tie, X., Wang, J., Molina, L. T., and Li, G.: Is water vapor a key player of the wintertime haze in North 605
China Plain?, Atmospheric Chemistry and Physics, 19, 8721-8739, 10.5194/acp-19-8721-2019, 2019. 606
Xu, L., Duan, F., He, K., Ma, Y., Zhu, L., Zheng, Y., Huang, T., Kimoto, T., Ma, T., Li, H., Ye, S., Yang, 607
S., Sun, Z., and Xu, B.: Characteristics of the secondary water-soluble ions in a typical autumn haze in 608
Beijing, Environ Pollut, 227, 296-305, 10.1016/j.envpol.2017.04.076, 2017. 609
Xu, W. Y., Zhao, C. S., Ran, L., Deng, Z. Z., Liu, P. F., Ma, N., Lin, W. L., Xu, X. B., Yan, P., He, X., 610
Yu, J., Liang, W. D., and Chen, L. L.: Characteristics of pollutants and their correlation to 611
meteorological conditions at a suburban site in the North China Plain, Atmospheric Chemistry and 612
Physics, 11, 4353-4369, 10.5194/acp-11-4353-2011, 2011. 613
Xue, C., Ye, C., Ma, Z., Liu, P., Zhang, Y., Zhang, C., Tang, K., Zhang, W., Zhao, X., Wang, Y., Song, 614
M., Liu, J., Duan, J., Qin, M., Tong, S., Ge, M., and Mu, Y.: Development of stripping coil-ion 615
chromatograph method and intercomparison with CEAS and LOPAP to measure atmospheric HONO, 616
The Science of the total environment, 646, 187-195, 10.1016/j.scitotenv.2018.07.244, 2019a. 617
Xue, C., Ye, C., Zhang, Y., Ma, Z., Liu, P., Zhang, C., Zhao, X., Liu, J., and Mu, Y.: Development and 618
application of a twin open-top chambers method to measure soil HONO emission in the North China 619
Plain, Sci. Total Environ., 659, 621-631, 10.1016/j.scitotenv.2018.12.245, 2019b. 620
Xue, J., Yuan, Z., Griffith, S. M., Yu, X., Lau, A. K., and Yu, J. Z.: Sulfate Formation Enhanced by a 621
Cocktail of High NOx, SO2, Particulate Matter, and Droplet pH during Haze-Fog Events in Megacities 622
in China: An Observation-Based Modeling Investigation, Environ Sci Technol, 50, 7325-7334, 623
10.1021/acs.est.6b00768, 2016. 624
Yang, T., Sun, Y., Zhang, W., Wang, Z., Liu, X., Fu, P., and Wang, X.: Evolutionary processes and 625
sources of high-nitrate haze episodes over Beijing, Spring, J Environ Sci (China), 54, 142-151, 626
10.1016/j.jes.2016.04.024, 2017. 627
Yang, Y. R., Liu, X. G., Qu, Y., An, J. L., Jiang, R., Zhang, Y. H., Sun, Y. L., Wu, Z. J., Zhang, F., Xu, 628
W. Q., and Ma, Q. X.: Characteristics and formation mechanism of continuous hazes in China: a case 629
study during the autumn of 2014 in the North China Plain, Atmospheric Chemistry and Physics, 15, 630
8165-8178, 10.5194/acp-15-8165-2015, 2015. 631
Ye, C., Liu, P., Ma, Z., Xue, C., Zhang, C., Zhang, Y., Liu, J., Liu, C., Sun, X., and Mu, Y.: High H2O2 632
Concentrations Observed during Haze Periods during the Winter in Beijing: Importance of H2O2 633
Oxidation in Sulfate Formation, Environmental Science & Technology Letters, 5, 757-763, 634
10.1021/acs.estlett.8b00579, 2018. 635
Zhang, H., Chen, S., Zhong, J., Zhang, S., Zhang, Y., Zhang, X., Li, Z., and Zeng, X. C.: Formation of 636
aqueous-phase sulfate during the haze period in China: Kinetics and atmospheric implications, 637
Atmospheric Environment, 177, 93-99, 10.1016/j.atmosenv.2018.01.017, 2018. 638
Zhang, Q., He, K. B., and Huo, H.: Cleaning China's air, Nature, 484, 161-162, 2012. 639
Zhang, R., Wang, G., Guo, S., Zamora, M. L., Ying, Q., Lin, Y., Wang, W., Hu, M., and Wang, Y.: 640
Formation of urban fine particulate matter, Chem Rev, 115, 3803-3855, 10.1021/acs.chemrev.5b00067, 641
2015. 642
Zhao, M., Wang, S., Tan, J., Hua, Y., Wu, D., and Hao, J.: Variation of Urban Atmospheric Ammonia 643
Pollution and its Relation with PM2.5 Chemical Property in Winter of Beijing, China, Aerosol and Air 644

28
Quality Research, 16, 1390-1402, 10.4209/aaqr.2015.12.0699, 2016. 645
Zheng, B., Zhang, Q., Zhang, Y., He, K. B., Wang, K., Zheng, G. J., Duan, F. K., Ma, Y. L., and Kimoto, 646
T.: Heterogeneous chemistry: a mechanism missing in current models to explain secondary inorganic 647
aerosol formation during the January 2013 haze episode in North China, Atmospheric Chemistry and 648
Physics, 15, 2031-2049, 10.5194/acp-15-2031-2015, 2015a. 649
Zheng, G. J., Duan, F. K., Su, H., Ma, Y. L., Cheng, Y., Zheng, B., Zhang, Q., Huang, T., Kimoto, T., 650
Chang, D., Pöschl, U., Cheng, Y. F., and He, K. B.: Exploring the severe winter haze in Beijing: the 651
impact of synoptic weather, regional transport and heterogeneous reactions, Atmospheric Chemistry 652
and Physics, 15, 2969-2983, 10.5194/acp-15-2969-2015, 2015b. 653
Zhong, J., Zhang, X., Wang, Y., Wang, J., Shen, X., Zhang, H., Wang, T., Xie, Z., Liu, C., Zhang, H., 654
Zhao, T., Sun, J., Fan, S., Gao, Z., Li, Y., and Wang, L.: The two-way feedback mechanism between 655
unfavorable meteorological conditions and cumulative aerosol pollution in various haze regions of 656
China, Atmospheric Chemistry and Physics, 19, 3287-3306, 10.5194/acp-19-3287-2019, 2019. 657
658