Formation Evaluation and Petrophysics Mr D. G. Bowen
132
D G Bowen March 2003 i Formation Evaluation and Petrophysics Mr D G Bowen Core Laborato ries Jakarta Indonesia
Transcript of Formation Evaluation and Petrophysics Mr D. G. Bowen

8/10/2019 Formation Evaluation and Petrophysics Mr D. G. Bowen
http://slidepdf.com/reader/full/formation-evaluation-and-petrophysics-mr-d-g-bowen 1/225
Formation Evaluation and Petrophysics
Mr D G BowenCore Laborato riesJakartaIndonesia

8/10/2019 Formation Evaluation and Petrophysics Mr D. G. Bowen
http://slidepdf.com/reader/full/formation-evaluation-and-petrophysics-mr-d-g-bowen 2/225
CONTENTS
Chapter Section Title Heading Page
1 Section 1 FundamentalProperties Physico-chemistry & Mineralogy
13
Porosity 11Permeability 14Natural Gamma-activity 19
Acoustic properties 28Density 30Saturation 31Electrical Properties 35
2 Section 1Down-hole Logs
Wellbore Environment 48 Section 2
Lithology Logs 53Mudlogs 54Downhole Log Formats 55
G R 58
8/10/2019 Formation Evaluation and Petrophysics Mr D. G. Bowen
http://slidepdf.com/reader/full/formation-evaluation-and-petrophysics-mr-d-g-bowen 3/225
Chapter Section Title Heading PageSection 4 Resistivity
SaturationLogs (cont.)
Induction Logs 140Electromagnetic PropagationLogs
150
3 Section 1Formation Evaluation Log Analysis 154
Guide 155Lithology and Porosity 156Neutron-Density Cross-Plot 157M - N Plot 158MID Plot 159RHO maa Versus U maa 160Rw and Sw From Logs 161Sw Determination 166Pickett Plot 166Hingle Plot 167Sw Determination - Shaly Sands 169
V h l 170

8/10/2019 Formation Evaluation and Petrophysics Mr D. G. Bowen
http://slidepdf.com/reader/full/formation-evaluation-and-petrophysics-mr-d-g-bowen 4/225
Introduction
This course is provided to introduce students to the nature and use of petrophysical borehole
experiments in petroleum engineering and reservoir description. It consists of the following
content:
There are 5 days allocated to the course. Much of this time will be spent on taught material.
However, there will be some practical work. This consists of hand-calculated worked exercises
in log data integration and analysis. Scientific calculators will be required.
Most days the lectures will run to will run from 8:00 am till 4.30 pm with a lunch-break from
12:00 to 1:00 pm. There may be some exercises to complete in the evening.
The Course objectives are to train the students in critical assessment of the quality and
application of log data in reservoir description. By the end of the course students will become
familiar with at least one method of log derived petrophysical data integration.
Th C i l i i l f h d l d l i l

8/10/2019 Formation Evaluation and Petrophysics Mr D. G. Bowen
http://slidepdf.com/reader/full/formation-evaluation-and-petrophysics-mr-d-g-bowen 5/225
The recommended textbooks on the subject,
Essential Reading
Schlumberger. Log Interpretation Charts. Schlumberger, 1988/89 - 2000
Schlumberger. Log Interpretation Principles and Applications. Schlumberger, 1989.
Optional Reading
Dewan, T.J. Essentials of Modern Open-Hole Log Interpretation. Tulsa: PennWell, 1983.
Doveton, J.H. Geologic Log Analysis Using Computer Methods . Tulsa: AAPG, 1994.(AAPG Computer Applications in geology, No. 2).
Serra, O. Fundamentals of Well-Log Interpretation 1: The Acquisition of Logging Data. Amsterdam: Elsevier, 1984.
Serra, O. Fundamentals of Well-Log Interpretation 2: The Interpretation of Logging Data. Amsterdam: Elsevier, 1986.
8/10/2019 Formation Evaluation and Petrophysics Mr D. G. Bowen
http://slidepdf.com/reader/full/formation-evaluation-and-petrophysics-mr-d-g-bowen 6/225
INTRODUCTION
Open-hole well logging began after the first world war, with tools being developed for the
mining industry to identify the presence of metaliferous ores in the vicinity of a borehole. In
1927 the first oil well was logged by the Schlumberger brothers, Conrad and Marcell, and H G
Doll. These early logs were called “electric cores” establishing a 70+ year goal of well logging;trying to establish the properties of the formations cut by the wellbore, without the need to
recover a core.
Well Logging is a sophisticated form of proximal, or not so remote, sensing. Modern tools and
evaluation procedures are at the cutting edge of technology. For example modern geosteering
inertial navigation sensors have to be about 10 times more precise than the technology that
got man to the moon.
Not only are modern tools technically advanced, there is a huge engineering effort that has
gone into packaging all that technology in tubular devices that can operate under extreme
di i f hi h d

8/10/2019 Formation Evaluation and Petrophysics Mr D. G. Bowen
http://slidepdf.com/reader/full/formation-evaluation-and-petrophysics-mr-d-g-bowen 7/225
CHAPTER 1.
FUNDAMENTAL PROPERTIES
Petrophysics: Rock and Fluid Properties
That Influence Both Well Log and Core Based
8/10/2019 Formation Evaluation and Petrophysics Mr D. G. Bowen
http://slidepdf.com/reader/full/formation-evaluation-and-petrophysics-mr-d-g-bowen 8/225
8/10/2019 Formation Evaluation and Petrophysics Mr D. G. Bowen
http://slidepdf.com/reader/full/formation-evaluation-and-petrophysics-mr-d-g-bowen 9/225
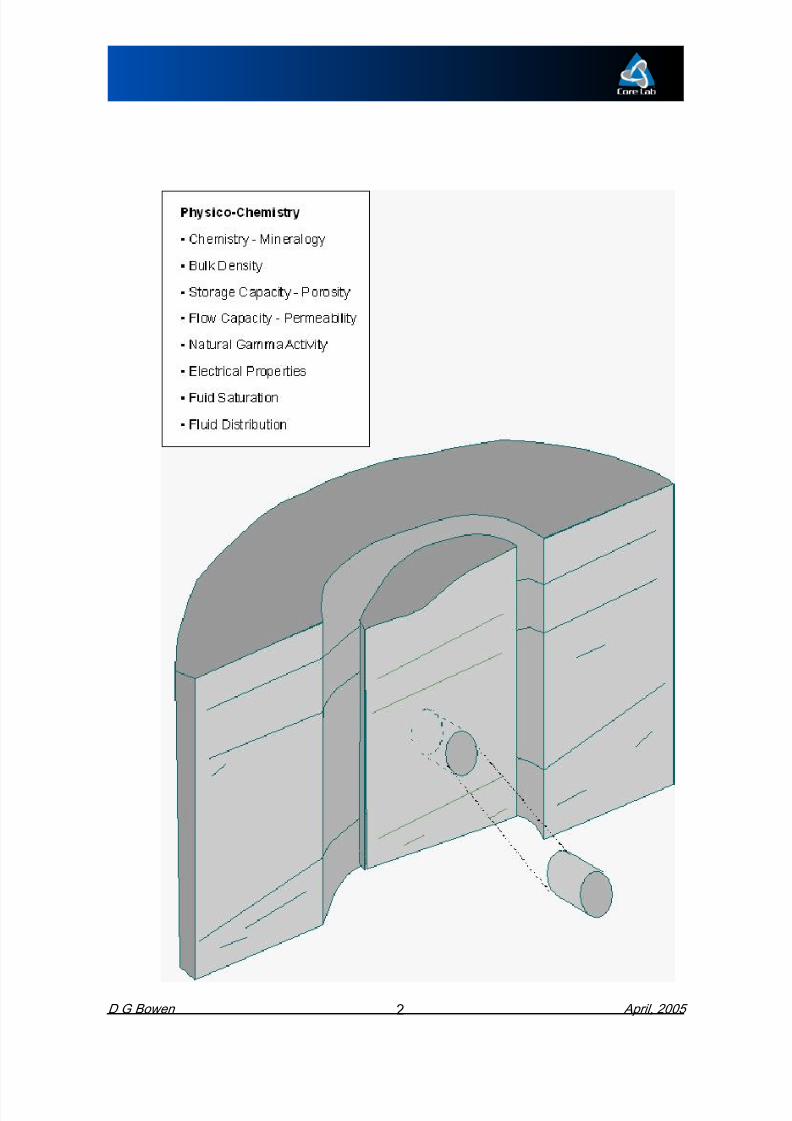
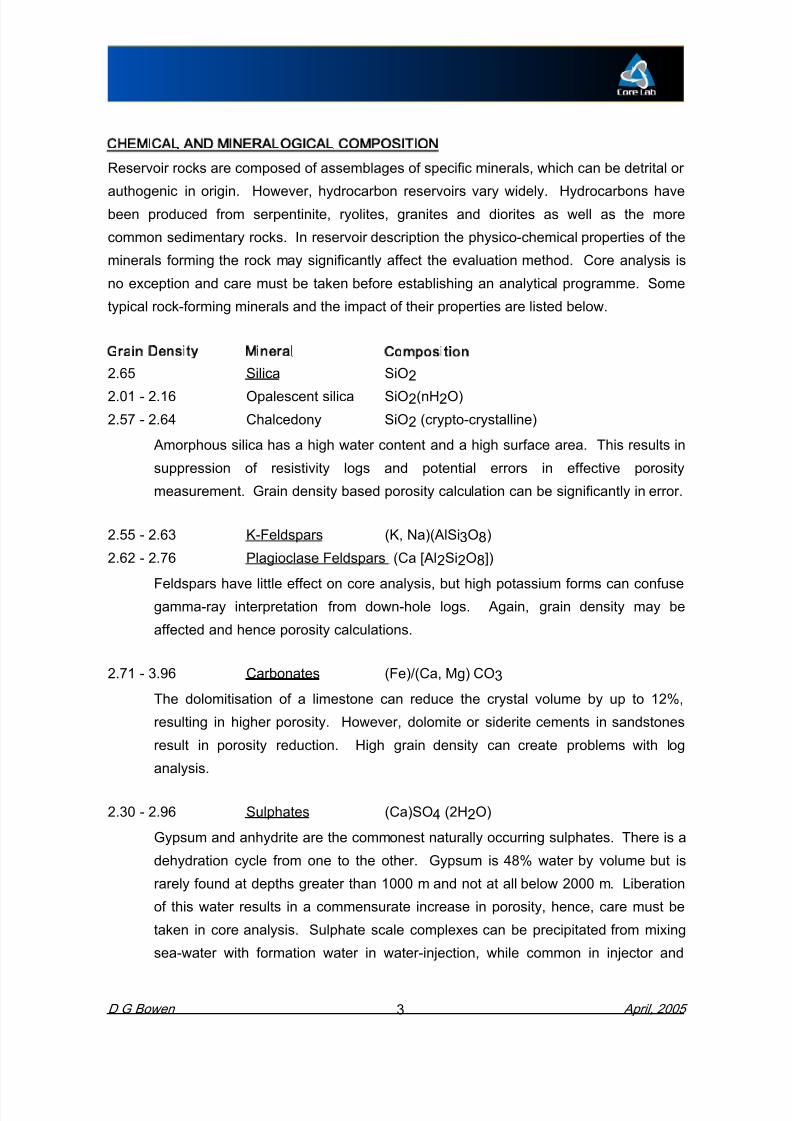
CHEMICAL AND MINERALOGICAL COMPOSITION Reservoir rocks are composed of assemblages of specific minerals, which can be detrital orauthogenic in origin. However, hydrocarbon reservoirs vary widely. Hydrocarbons havebeen produced from serpentinite, ryolites, granites and diorites as well as the morecommon sedimentary rocks. In reservoir description the physico-chemical properties of theminerals forming the rock may significantly affect the evaluation method. Core analysis isno exception and care must be taken before establishing an analytical programme. Sometypical rock-forming minerals and the impact of their properties are listed below.
Grain Density Mineral Composition 2.65 Silica SiO22.01 - 2.16 Opalescent silica SiO
2(nH
2O)
2.57 - 2.64 Chalcedony SiO2 (crypto-crystalline)
Amorphous silica has a high water content and a high surface area. This results insuppression of resistivity logs and potential errors in effective porositymeasurement. Grain density based porosity calculation can be significantly in error.

8/10/2019 Formation Evaluation and Petrophysics Mr D. G. Bowen
http://slidepdf.com/reader/full/formation-evaluation-and-petrophysics-mr-d-g-bowen 10/225
producer wells and surface equipment, these are rarely encountered in cores,although at least one example from the Scott Field in the N. Sea exists.
Grain Density Mineral Composition 2.07 Sulphur S
Free sulphur can occur in petroleum reservoirs. It is of low density and highsolubility in hot water solutions, and poses real problems in those fields where itoccurs.
4.30 - 5.254 Iron Oxides Fe2O3 - Fe3O4 - a-FeO.OHHematite, Magnetite and Goethite all have high densities and range from ferro –
para - non magnetic. Hematite and Magnetite can also be semiconductors in situ.Goethite, when in its Limonite form, can contain abundant water, which may beliberated under heating. However this form is not common in the deep subsurfaceand is occasionally seen as the principal mineral in oolitic ironstones or, morecommonly, as a weathering product in outcrop samples.

8/10/2019 Formation Evaluation and Petrophysics Mr D. G. Bowen
http://slidepdf.com/reader/full/formation-evaluation-and-petrophysics-mr-d-g-bowen 11/225
Coals Amber
Low grain density and a propensity for non-pyrobitumens to dissolve under solventextraction can cause problems, both in the lab and down-hole. High temperaturedistillation can result in cracking and the production of ‘oil’ from these solids.
8/10/2019 Formation Evaluation and Petrophysics Mr D. G. Bowen
http://slidepdf.com/reader/full/formation-evaluation-and-petrophysics-mr-d-g-bowen 12/225
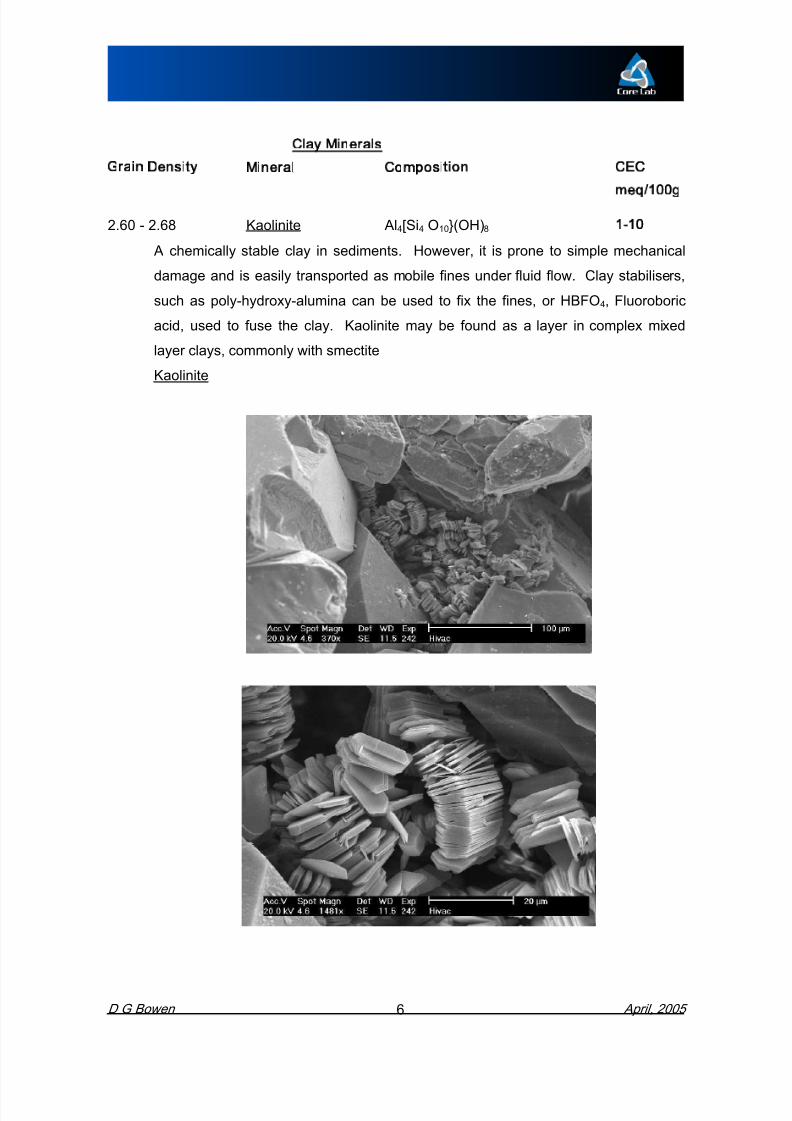
Clay Minerals
Grain Density Mineral Composi tion CEC
meq/100g
2.60 - 2.68 Kaolinite Al4[Si4 O10}(OH)8 1-10
A chemically stable clay in sediments. However, it is prone to simple mechanical
damage and is easily transported as mobile fines under fluid flow. Clay stabilisers,such as poly-hydroxy-alumina can be used to fix the fines, or HBFO4, Fluoroboric
acid, used to fuse the clay. Kaolinite may be found as a layer in complex mixed
layer clays, commonly with smectite
Kaolinite
8/10/2019 Formation Evaluation and Petrophysics Mr D. G. Bowen
http://slidepdf.com/reader/full/formation-evaluation-and-petrophysics-mr-d-g-bowen 13/225
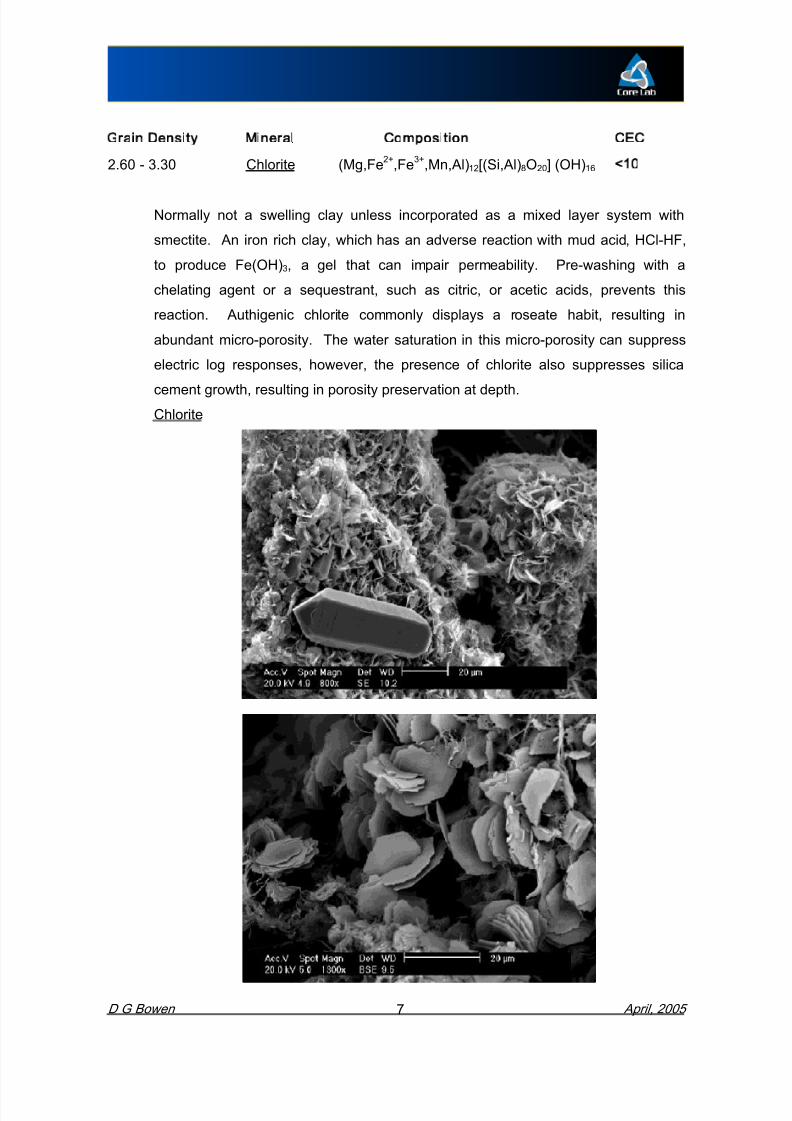
Grain Density Mineral Composi tion CEC 2.60 - 3.30 Chlorite (Mg,Fe2+,Fe3+,Mn,Al)12[(Si,Al)8O20] (OH)16 <10
Normally not a swelling clay unless incorporated as a mixed layer system with
smectite. An iron rich clay, which has an adverse reaction with mud acid, HCl-HF,
to produce Fe(OH)3, a gel that can impair permeability. Pre-washing with achelating agent or a sequestrant, such as citric, or acetic acids, prevents this
reaction. Authigenic chlorite commonly displays a roseate habit, resulting in
abundant micro-porosity. The water saturation in this micro-porosity can suppress
electric log responses, however, the presence of chlorite also suppresses silica
cement growth, resulting in porosity preservation at depth.
Chlorite

8/10/2019 Formation Evaluation and Petrophysics Mr D. G. Bowen
http://slidepdf.com/reader/full/formation-evaluation-and-petrophysics-mr-d-g-bowen 14/225
Grain Density Mineral Composi tion CEC
2.60 - 2.90 Illite K1.5-1.0 Al4[Si6.5-7.0 Al1.5-1.0O20](OH)4 10-40
Originally known to American petrologists as Hydro-muscovite, this mineral is
chemically similar to the mica. However, the authigenic form is rarely seen in a
simple platy form, but rather forms fibrous to blocky mats coating grains and
bridging pore throats. Permeability loss due to this form has been reported. The
fibrous (hairy) fines are very rate sensitive during fluid flow. In the laboratory care
must be taken to avoid destruction of the fibrous clay mats. Also a component of
mixed layer clays, Illite is the principal mineral source of the K40 radioactive isotope
natural g-ray response in shales.
Illite

8/10/2019 Formation Evaluation and Petrophysics Mr D. G. Bowen
http://slidepdf.com/reader/full/formation-evaluation-and-petrophysics-mr-d-g-bowen 15/225
Grain Density Mineral Composi tion CEC
2.00 - 3.00 Smectite 80-150
( 12Ca,Na)0.7(Al,Mg,Fe)4[(Si,Al)8O20] (OH)4.n H2O
( 12Ca,Na)0.7(Mg,Fe, Al)6[(Si,Al)8O20] (OH)4.n H2O
Smectites also can establish a fines problem under production. In addition to this
they swell in the presence of water. Swelling is caused by the net 1/2 charge
imbalance in the unit cell. No ion carries half a charge, so cations attracted to the
interlayer site cause further charge imbalance. The water molecule, due to its polar
structure, is attracted to this site. However, the molecule is much larger than the
typical mono- or divalent cations occupying this site and it pushes the unit cell apart
from about 10 to 20 Å.Clay swelling can result in severe permeability impairment. Smectites also display a
sponge-like habit, with high micro porosity, often bridging pore throats. This
combination, coupled with their high cation exchange capacity, gives a strong
suppression of electric logs. Na-Montmorilonite is up to 33% water by volume. This
8/10/2019 Formation Evaluation and Petrophysics Mr D. G. Bowen
http://slidepdf.com/reader/full/formation-evaluation-and-petrophysics-mr-d-g-bowen 16/225
Grain Density Mineral Composi tion CEC
2.00 – 2.80 Zeolites 100 - >500
Laumontite Ca4(Al8,Si16,O48).16H2O
Heulandite (Ca,Na2,K2)4 [Al8,Si28,O72].24H2O
The zeolites occur as natural authigenic minerals in volcanic rocks and sediments.
They may even grow in the deep marine environment at 4°C in the sediment waterinterface. They also form from the alteration of volcanic glass, tuff and feldspar in
high pH conditions. They contain large volumes of water and have the highest
cation ion exchange capacity in nature. When present they suppress resistivity
tools through excess conductivity. They can easily liberate their water upon
heating, and reabsorb it upon cooling in a humid atmosphere. There are sodiumrich varieties and even barium rich zeolites, which have densities approaching 2.80.
From the chemical point of view there are rocks that contain mineral mixes that haveproperties that are quite different to those we commonly associate with sandstones andlimestone. We need to understand these properties, but also the rock fabric, or way that
8/10/2019 Formation Evaluation and Petrophysics Mr D. G. Bowen
http://slidepdf.com/reader/full/formation-evaluation-and-petrophysics-mr-d-g-bowen 17/225
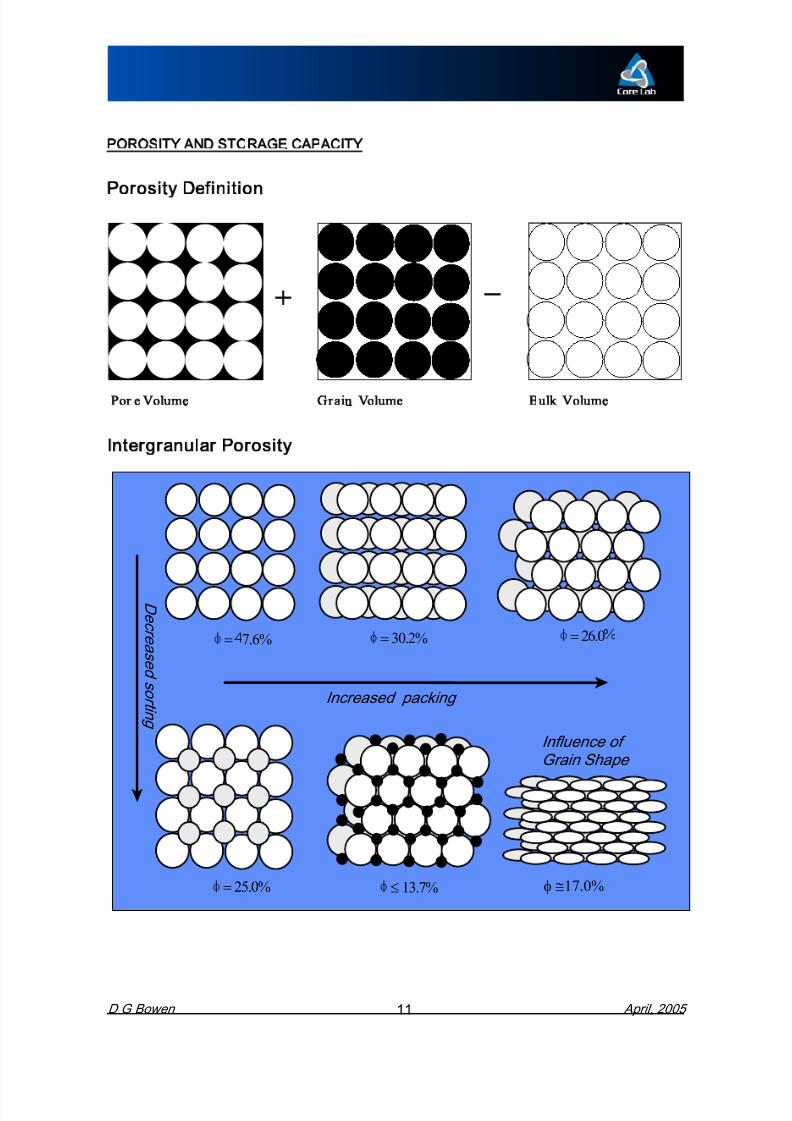
POROSITY AND STORAGE CAPACITY
Porosity Definition
=
Por e Volume Gr ain Volume Bulk Volume
Intergranular Porosi ty

8/10/2019 Formation Evaluation and Petrophysics Mr D. G. Bowen
http://slidepdf.com/reader/full/formation-evaluation-and-petrophysics-mr-d-g-bowen 18/225
POROSITY AND STORAGE CAPACITY
Definition
Porosity is defined as the ratio of the pore volume to the bulk volume of a substance. In oiland gas reservoirs, the pore volume is the space available for the storage of thehydrocarbons and water. Porosity is normally expressed as a percentage of bulk volumeand is symbolised by f .
Porosity, f = Pore VolumeBulk Volume
x 100
Porosity, f = Bulk Volume - Grain Volume
Bulk Volumex 100
Porosity, f = Pore Volume
Pore Volume + Grain Volumex 100
8/10/2019 Formation Evaluation and Petrophysics Mr D. G. Bowen
http://slidepdf.com/reader/full/formation-evaluation-and-petrophysics-mr-d-g-bowen 19/225
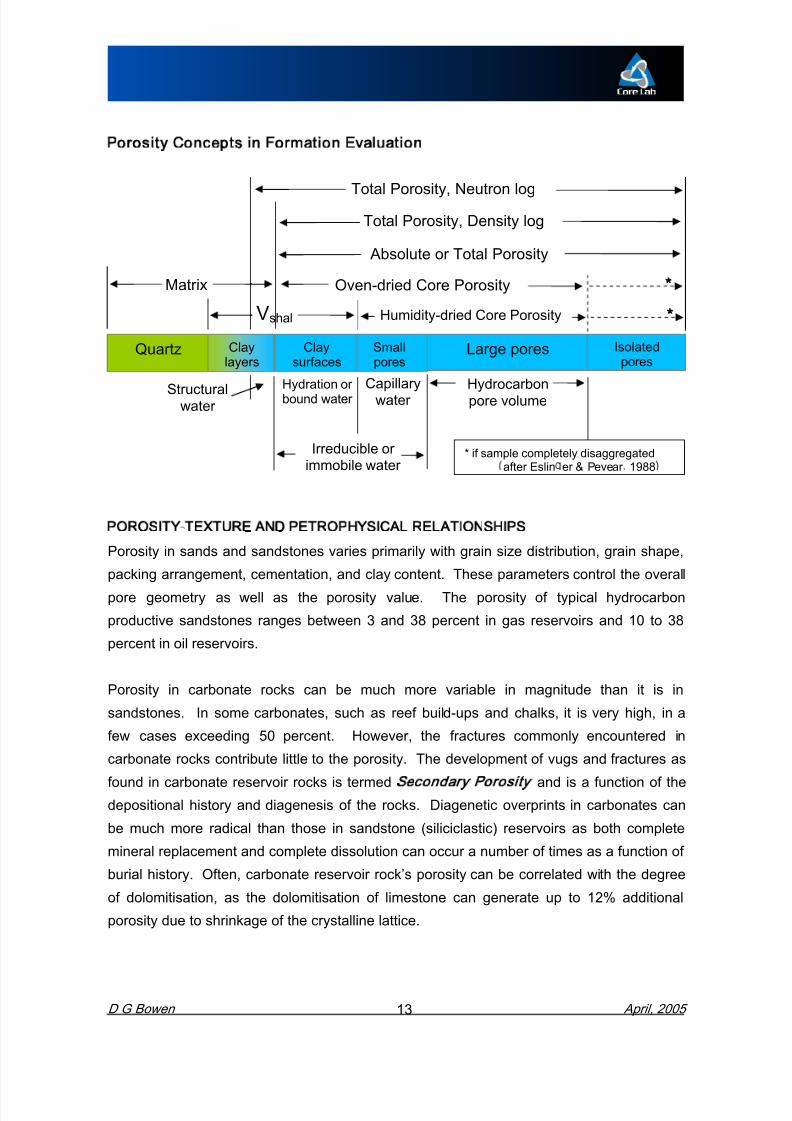
Porosity Concepts in Formation Evaluation
POROSITY-TEXTURE AND PETROPHYSICAL RELATIONSHIPS
Total Porosity, Neutron log
Total Porosity, Density log
Absolute or Total Porosity
Humidity-dried Core Porosity
Capillary
water
Quartz Claylayers
Smallpores
Large pores Isolatedpores
Claysurfaces
Vshal
Oven-dried Core PorosityMatrix
Hydrocarbon
pore volume
Structural
water
Hydration orbound water
Irreducible orimmobile water
**
**
* if sample completely disaggregatedafter Eslin er & Pevear 1988

8/10/2019 Formation Evaluation and Petrophysics Mr D. G. Bowen
http://slidepdf.com/reader/full/formation-evaluation-and-petrophysics-mr-d-g-bowen 20/225
While vugular porosity can be large, caverns of some tens of metres size having beenencountered in some rare cases, fractures, which make up the other major component ofsecondary porosity tend to be of a smaller aperture. This is because fractures are aresponse to reservoir stress history and there are always forces attempting to close them.
A common misconception is how much they contribute to overall reservoir porosity.

8/10/2019 Formation Evaluation and Petrophysics Mr D. G. Bowen
http://slidepdf.com/reader/full/formation-evaluation-and-petrophysics-mr-d-g-bowen 21/225
PERMEABILITY
Definition and Theory
Permeability is a measure of the ability of a porous material to transmit fluid. The unit ofmeasurement is the Darcy, named after a French hydrologist who investigated flow of
water through filter beds in order to design the public drinking fountains of the city of Dijonin the year 1856.

8/10/2019 Formation Evaluation and Petrophysics Mr D. G. Bowen
http://slidepdf.com/reader/full/formation-evaluation-and-petrophysics-mr-d-g-bowen 22/225
In practical units, one Darcy permeability will yield a flow of approximately one barrel/day ofone centipoise oil through one foot of formation thickness in a well bore when the pressuredifferential is about one psi.
Darcy's Law is used to determine permeability, which is a constant when the followingboundary conditions are met:
1. Linear-laminar flow2. No reaction between fluid and rock3. One phase present at 100 percent pore-space saturation4. Incompressible fluid
Because of the relatively high value of the base-unit, the millidarcy, (one thousandth,1/1000, of a Darcy) is commonly in use in reservoir description. The Darcy has a SIequivalent in the µm2. Formation permeabilities typically vary from a fraction to more than10,000 millidarcies.
Permeability and Porosity Relationships

8/10/2019 Formation Evaluation and Petrophysics Mr D. G. Bowen
http://slidepdf.com/reader/full/formation-evaluation-and-petrophysics-mr-d-g-bowen 23/225
The Geological environment and depositional factors influencing porosity also influencepermeability, and often there can be an obvious relationship between the two. Therelationship varies with formation and rock type, and reflects the variety of pore geometrypresent. Typically, in sandstone reservoirs, increased permeability is accompanied byincreased porosity. Constant permeability accompanied by increased porosity indicates thepresence of more numerous but smaller pores.
Post depositional processes in sands including compaction and cementation result in ashift to the left of the permeability-porosity trend line, while dolomitisation of limestonetends to shift the permeability-porosity trend lines to the right.
Directional Permeability
Permeability is a directional quantity and should be truly considered a tensor property.Water-borne deposition of sand occurs with alignment of the long axis of the grains parallelto the current. In Aeolian sands the long axis may be at right angles to the paleo-winddirection. The greatest cross-sectional area of the grains lies in a horizontal plane.

8/10/2019 Formation Evaluation and Petrophysics Mr D. G. Bowen
http://slidepdf.com/reader/full/formation-evaluation-and-petrophysics-mr-d-g-bowen 24/225
Fractures or joint trends existing in carbonates and hard, low porosity sands, result inwidely varying directional permeability. This anisotropy is important in understandingreservoir behaviour.
Spatially oriented cores coupled with detailed core descriptions, listing strike and dip ofmajor and minor fractures, core-goniometry, and directional permeability measurements,assist in defining fracture trends and permeability variation.
Supplementary Notes
8/10/2019 Formation Evaluation and Petrophysics Mr D. G. Bowen
http://slidepdf.com/reader/full/formation-evaluation-and-petrophysics-mr-d-g-bowen 25/225
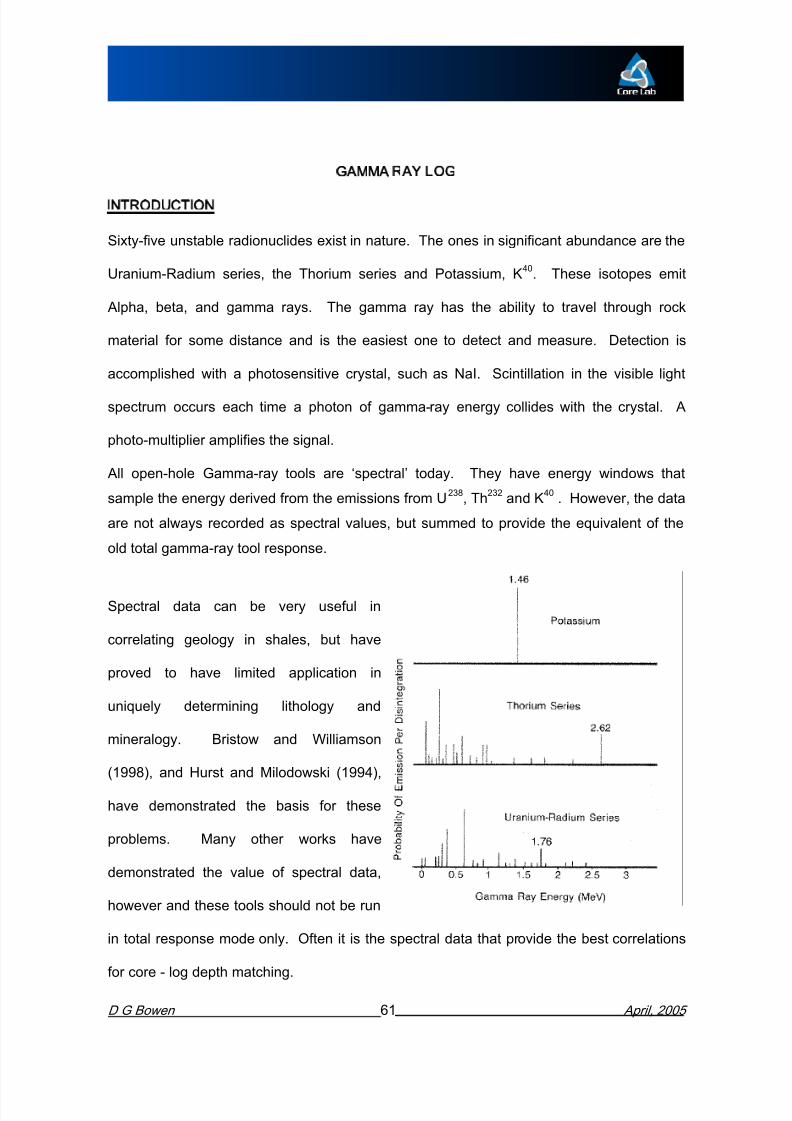
NATURAL GAMMA RADIATION CHARACTERISTICS The natural gamma radiation of sedimentary rocks is generally attributed to the presence of
uranium group trace elements in certain heavy minerals and/or the potassium isotope, K 40.
Potassium exists in Feldspars, Micas, KCl salt evaporites and Illite clays, while Uranium
and Thorium are concentrated in Phosphatic minerals, such as Monazite, typical of low
sedimentation environments. The Uranyl (U6+) ion tends to be very soluble in water, but
precipitates readily in reduced environments, such as organically rich, or pyritic facies.
Typically, shales have high gamma activity, carbonate rocks have low activity, and
sandstones vary in activity between the former two types.
The natural gamma ray logs are utilised for discerning lithology and for correlationpurposes.
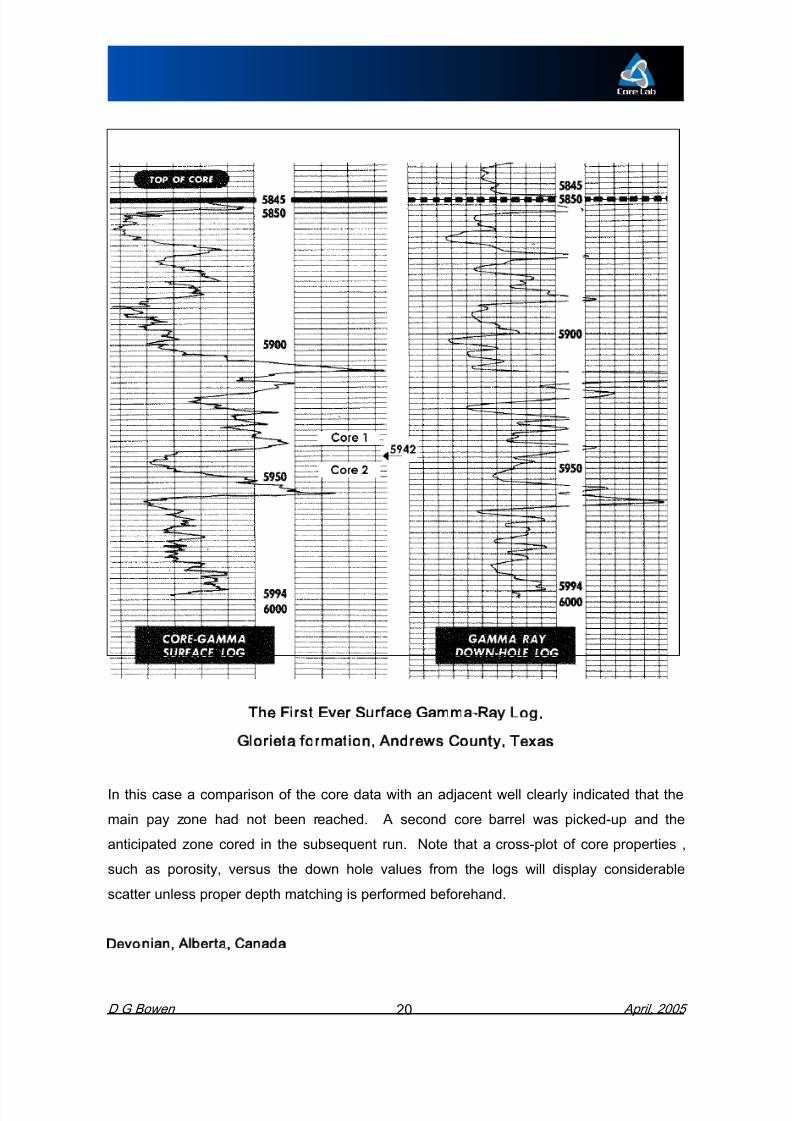
Core-Gamma Surface Log
The natural gamma radiation of a core is monitored and recorded as a function of depth for
8/10/2019 Formation Evaluation and Petrophysics Mr D. G. Bowen
http://slidepdf.com/reader/full/formation-evaluation-and-petrophysics-mr-d-g-bowen 26/225
8/10/2019 Formation Evaluation and Petrophysics Mr D. G. Bowen
http://slidepdf.com/reader/full/formation-evaluation-and-petrophysics-mr-d-g-bowen 27/225
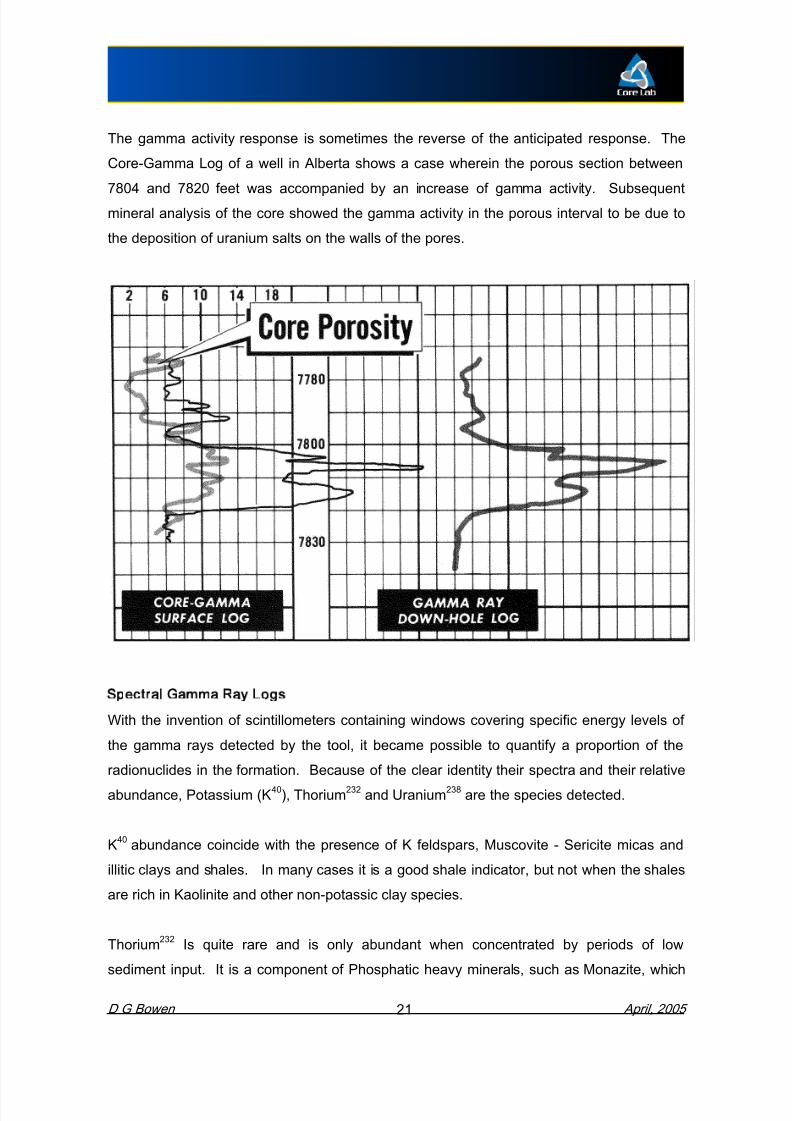
The gamma activity response is sometimes the reverse of the anticipated response. TheCore-Gamma Log of a well in Alberta shows a case wherein the porous section between
7804 and 7820 feet was accompanied by an increase of gamma activity. Subsequent
mineral analysis of the core showed the gamma activity in the porous interval to be due to
the deposition of uranium salts on the walls of the pores.
8/10/2019 Formation Evaluation and Petrophysics Mr D. G. Bowen
http://slidepdf.com/reader/full/formation-evaluation-and-petrophysics-mr-d-g-bowen 28/225
are either detrital or may be complexed in times of phosphoritic formation. Early authorsattempted to relate Thorium content to clay chemistry. In particular it was related to
Kaolinite content. (Schlumberger Chart CP-19) This approach has been discredited by
Hurst and Milodowski (1994). Thorium has been successfully related to maximum flooding
surfaces in a sequence stratigraphic interpretation.
Uranium238, like Thorium is also present in detrital heavy minerals such as Zircon and as
Uranium salt precipitates. The Uranyl ion is very mobile, being readily soluble in most
formation waters. It tends to precipitate when there is a drop in the pH of the environment.
In percolating waters this may occur where there has been the most deposition of organic
materials. This often is when there is the least input of sediment and also corresponds to a
maximum flooding surface. In the Devonian example above, the presence of H2S andreduced sulphides as pore-linings, was the cause of the Uranium deposition in the
formation.
Supplementary Notes

8/10/2019 Formation Evaluation and Petrophysics Mr D. G. Bowen
http://slidepdf.com/reader/full/formation-evaluation-and-petrophysics-mr-d-g-bowen 29/225
ACOUSTIC PROPERTIES OF ROCKSElastic Wave Velocit ies in Solids
The velocity of elastic waves in solids is a function of the density and elastic properties of a
material.
Vb = E r × 1 - m ( ) 1 + m ( )1 - 2m ( )
Vs = E
r × 1
2 1 + m ( )
WHERE: Vb = Velocity of bulk compressional waves
Vs = Velocity of shear wave
8/10/2019 Formation Evaluation and Petrophysics Mr D. G. Bowen
http://slidepdf.com/reader/full/formation-evaluation-and-petrophysics-mr-d-g-bowen 30/225
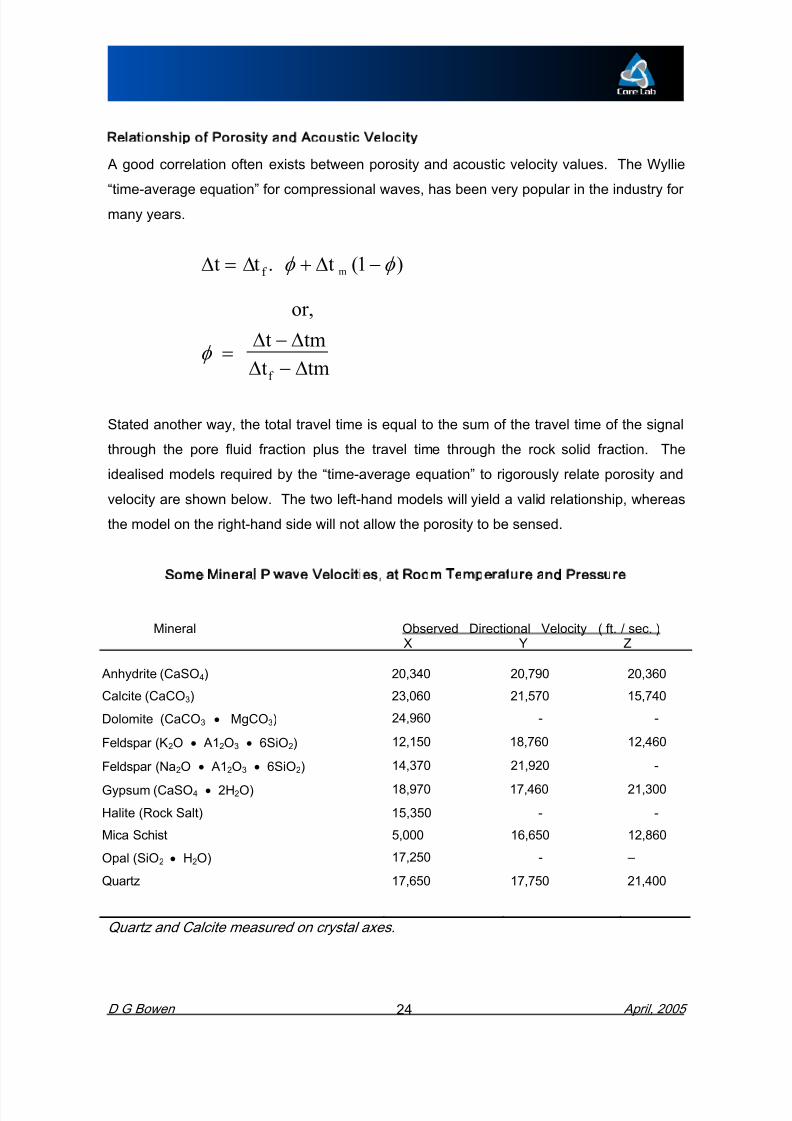
Relationship of Porosit y and Acoustic Velocity A good correlation often exists between porosity and acoustic velocity values. The Wyllie
“time-average equation” for compressional waves, has been very popular in the industry for
many years.
Dt = Dtf. f + Dt m (1 - f )
or,
f = Dt - Dtm Dt f - Dtm
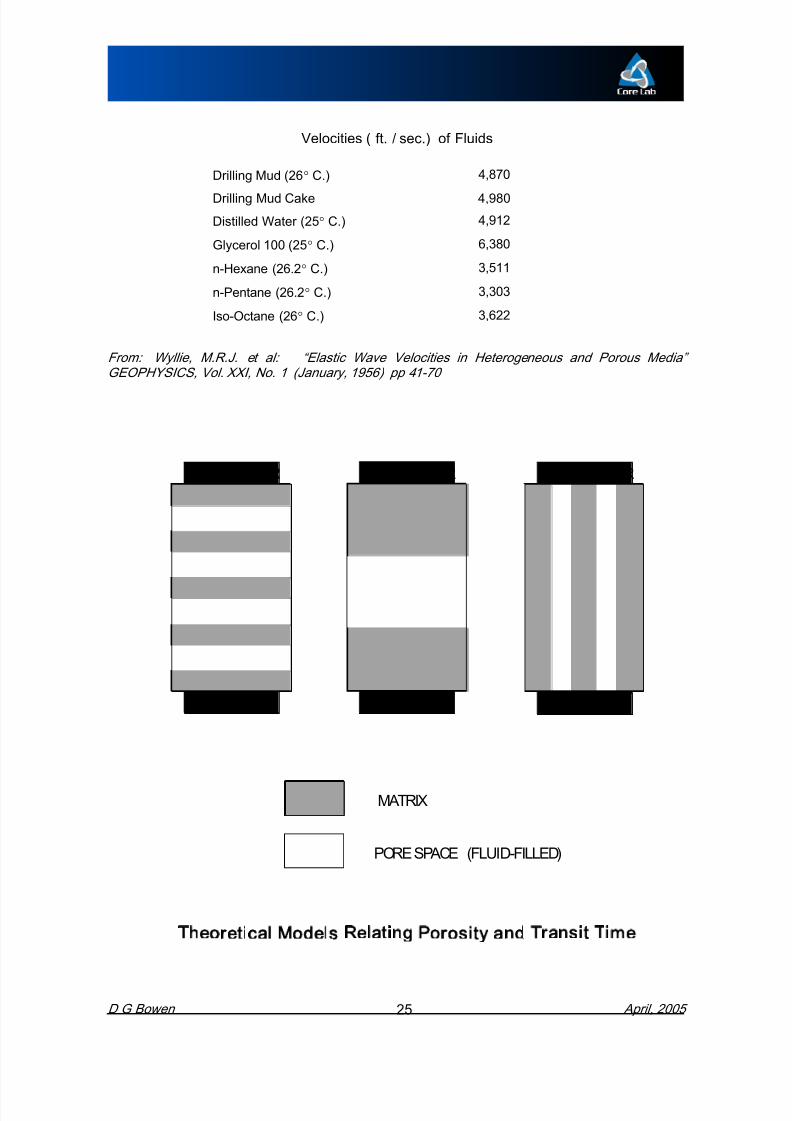
Stated another way, the total travel time is equal to the sum of the travel time of the signal
through the pore fluid fraction plus the travel time through the rock solid fraction. The
idealised models required by the “time-average equation” to rigorously relate porosity and
velocity are shown below. The two left-hand models will yield a valid relationship, whereas
the model on the right-hand side will not allow the porosity to be sensed.
8/10/2019 Formation Evaluation and Petrophysics Mr D. G. Bowen
http://slidepdf.com/reader/full/formation-evaluation-and-petrophysics-mr-d-g-bowen 31/225
Velocities ( ft. / sec.) of FluidsDrilling Mud (26° C.) 4,870
Drilling Mud Cake 4,980
Distilled Water (25° C.) 4,912
Glycerol 100 (25° C.) 6,380
n-Hexane (26.2° C.) 3,511
n-Pentane (26.2 ° C.) 3,303
Iso-Octane (26° C.) 3,622
From: Wyllie, M.R.J. et al: “Elastic Wave Velocities in Heterogeneous and Porous Media”GEOPHYSICS, Vol. XXI, No. 1 (January, 1956) pp 41-70
TRANSMITTER TRANSMITTER TRANSMITTER
8/10/2019 Formation Evaluation and Petrophysics Mr D. G. Bowen
http://slidepdf.com/reader/full/formation-evaluation-and-petrophysics-mr-d-g-bowen 32/225
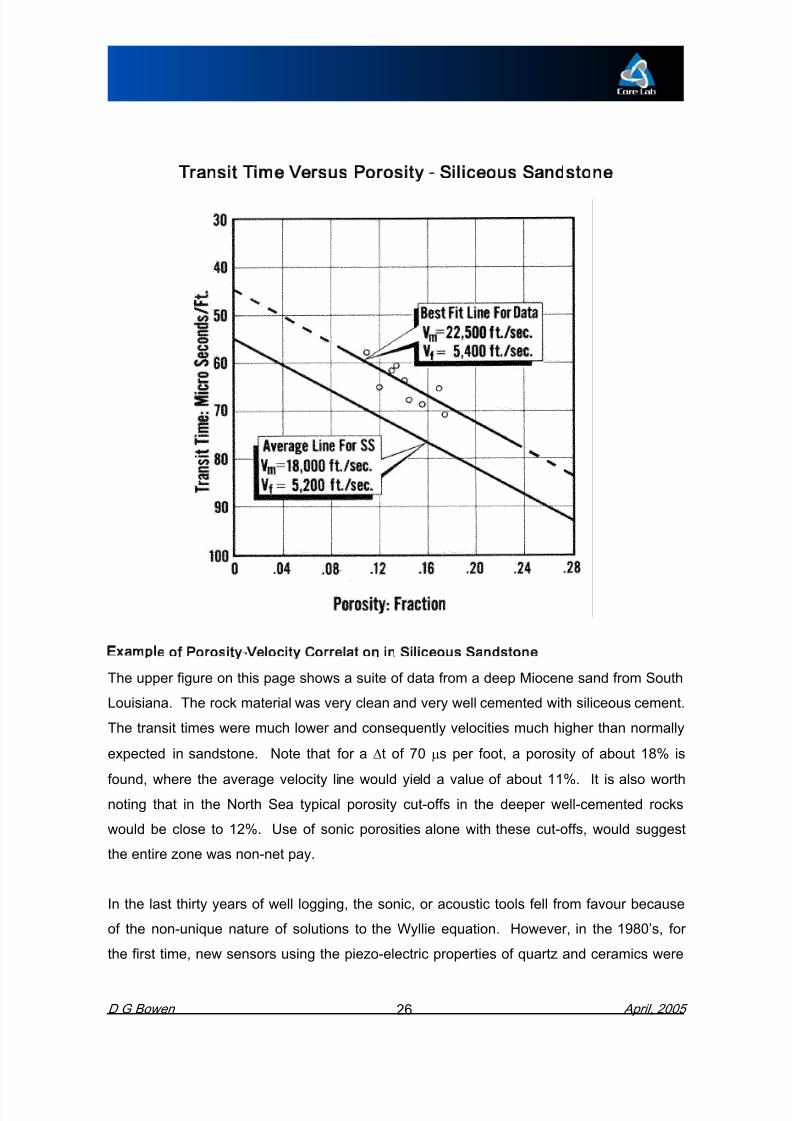
Transit Time Versus Porosity - Siliceous Sandstone
8/10/2019 Formation Evaluation and Petrophysics Mr D. G. Bowen
http://slidepdf.com/reader/full/formation-evaluation-and-petrophysics-mr-d-g-bowen 33/225
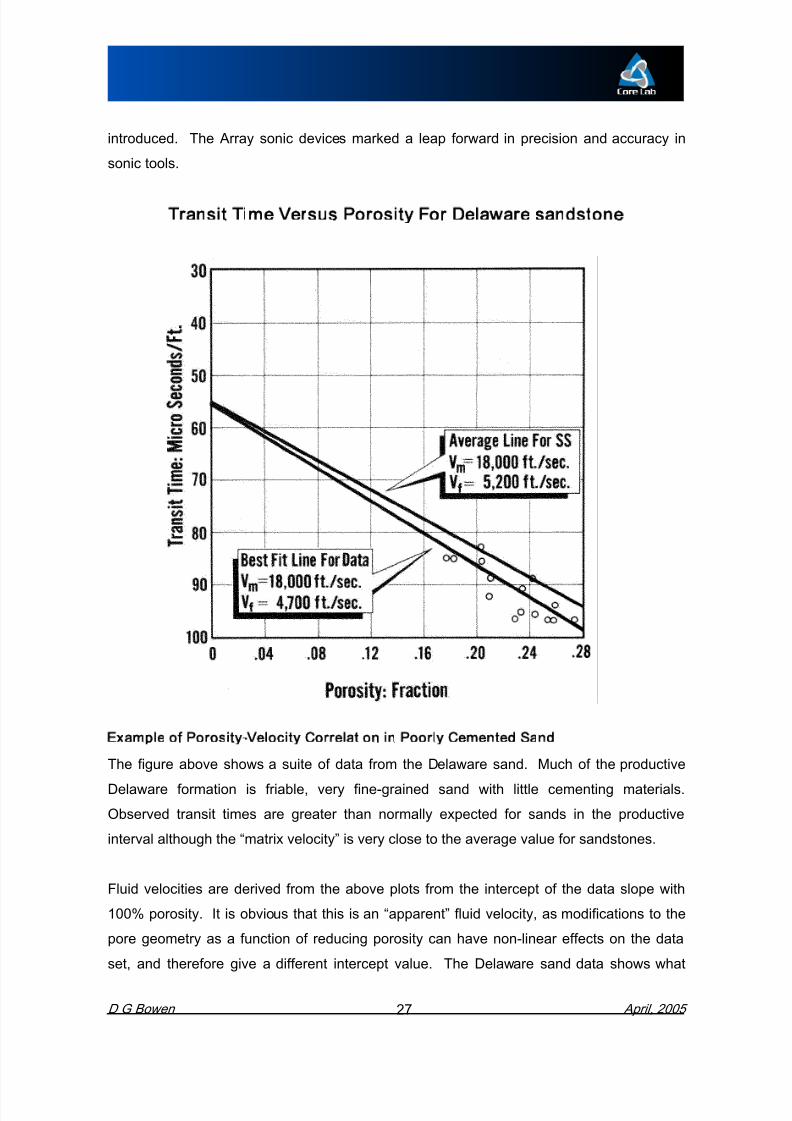
introduced. The Array sonic devices marked a leap forward in precision and accuracy insonic tools.
Transit Time Versus Porosity For Delaware sandstone
8/10/2019 Formation Evaluation and Petrophysics Mr D. G. Bowen
http://slidepdf.com/reader/full/formation-evaluation-and-petrophysics-mr-d-g-bowen 34/225
can occur, with a result that 90 ms per foot transit times yield 25% porosity, when the truevalue is closer to 22%. In fields such as Prudoe Bay, 0.1% porosity equals $100,000,000
in producible oil. In unitisation disputes, we obviously need accurate porosity information.
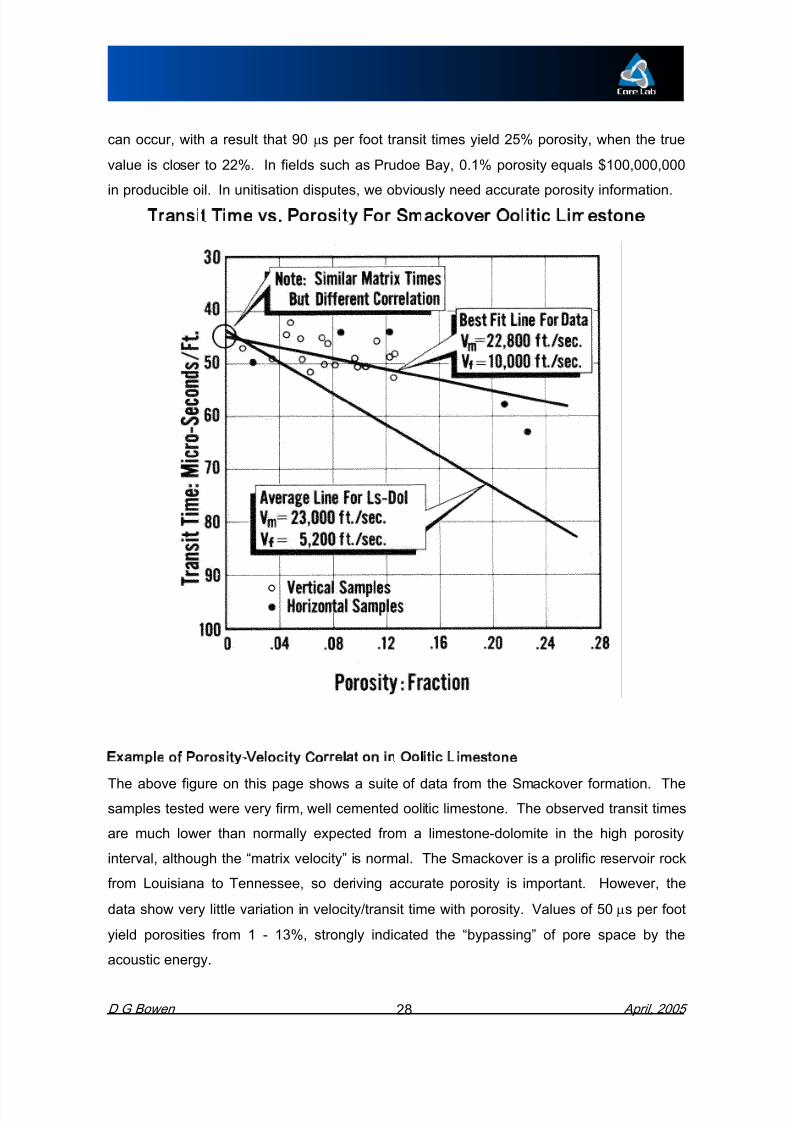
Transit Time vs. Porosity For Smackover Oolitic Limestone

8/10/2019 Formation Evaluation and Petrophysics Mr D. G. Bowen
http://slidepdf.com/reader/full/formation-evaluation-and-petrophysics-mr-d-g-bowen 35/225
In cases like this, there is little point in using acoustic tools to attempt to derive porosity.
Alternative porosity tools should be chosen.
Transit Time vs. PorosityFor Dolomite
8/10/2019 Formation Evaluation and Petrophysics Mr D. G. Bowen
http://slidepdf.com/reader/full/formation-evaluation-and-petrophysics-mr-d-g-bowen 36/225
relationship. It is worth noting that all such measurements must be performed under netconfining stress and with synthetic reservoir fluids in the pore space.
Shear Wave Propert ies
In addition to compressional, or P, wave velocities being measured in the wellbore and on
the core, more modern tools allow for the determination of shear wave velocity as well.
Shear, S waves cannot be sustained in fluid. Therefore shear waves transit around fluid
filled porosity. Shear waves are slower than P waves and the ratio Vp/Vs is used to
determine petrophysical properties. It is normally a ratio between 1.4 and 2.5, although
examples exist of the ratio reaching values as high as 4.0 in unconsolidated sandstones.
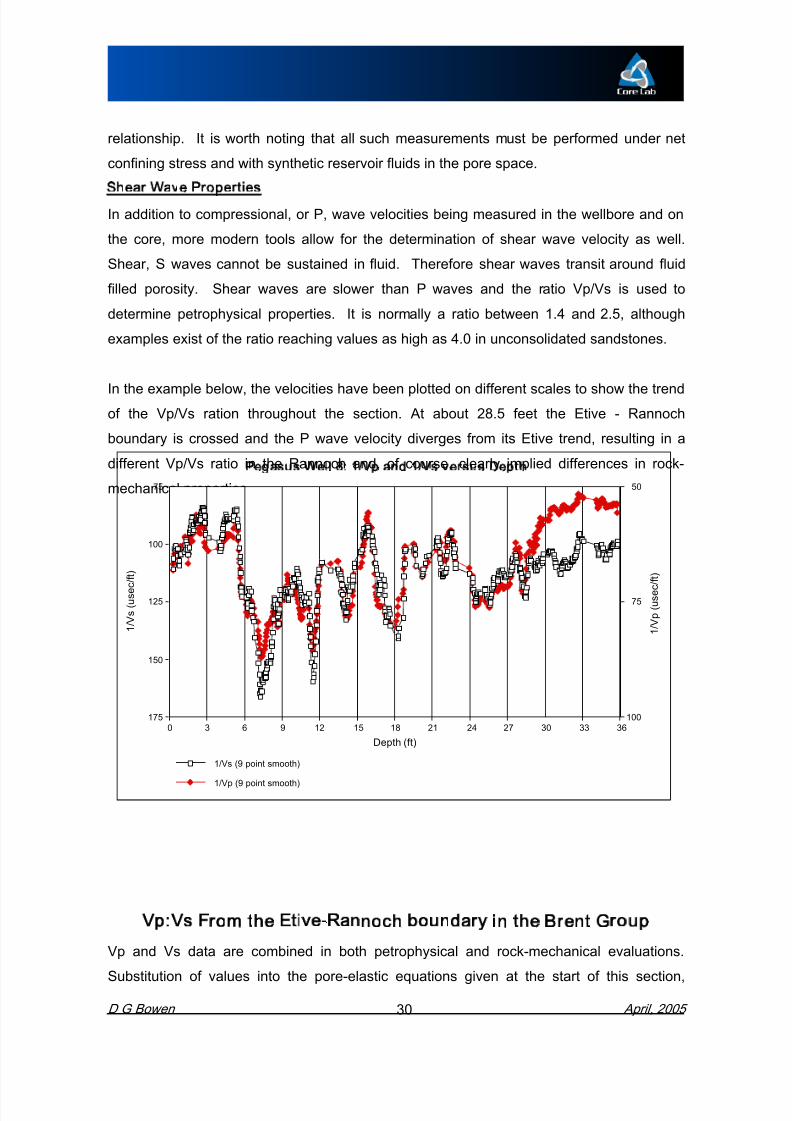
In the example below, the velocities have been plotted on different scales to show the trend
of the Vp/Vs ration throughout the section. At about 28.5 feet the Etive - Rannochboundary is crossed and the P wave velocity diverges from its Etive trend, resulting in a
different Vp/Vs ratio in the Rannoch and, of course, clearly implied differences in rock-
mechanical properties. 5075
Pegasus Well 8: 1/Vp and 1/Vs versu s Depth

8/10/2019 Formation Evaluation and Petrophysics Mr D. G. Bowen
http://slidepdf.com/reader/full/formation-evaluation-and-petrophysics-mr-d-g-bowen 37/225
allows for the computation of dynamic elastic moduli, young’s modulus and Poisson’s ratio.From these data the full mechanical properties, predicting borehole breakout or sand-face
failure, can be calculated.
DENSITY CHARACTERISTICS
Grain density is a function of the mineral composition of a rock, and the state of hydration
of the minerals.
The bulk density of an in-situ reservoir rock is the density of the overall bulk of the rock,
with pore fluids in place and under reservoir environmental conditions. The gamma-
gamma density logging tools are designed to sense this characteristic of rocks.
Bulk density, grain density, pore fluid density, and porosity are related in the followingmanner:
f = r ma - r b r ma - r f
WHERE: r ma = Grain density
8/10/2019 Formation Evaluation and Petrophysics Mr D. G. Bowen
http://slidepdf.com/reader/full/formation-evaluation-and-petrophysics-mr-d-g-bowen 38/225
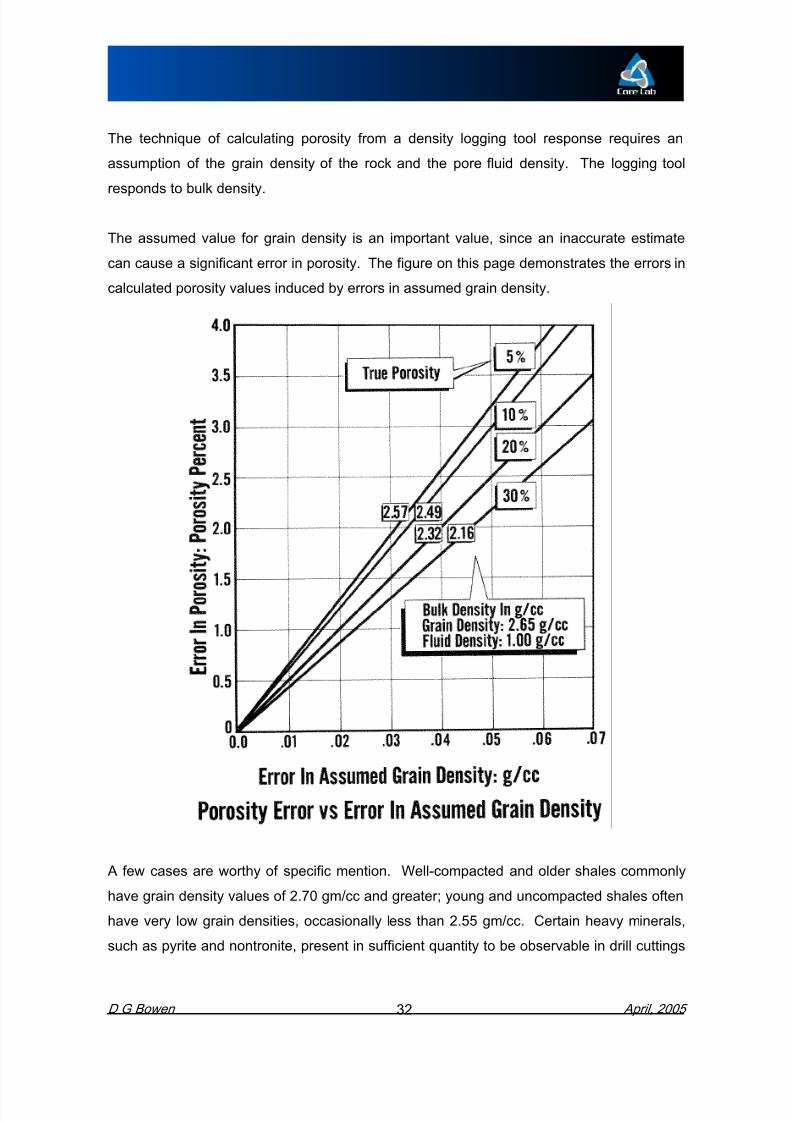
The technique of calculating porosity from a density logging tool response requires anassumption of the grain density of the rock and the pore fluid density. The logging tool
responds to bulk density.
The assumed value for grain density is an important value, since an inaccurate estimate
can cause a significant error in porosity. The figure on this page demonstrates the errors in
calculated porosity values induced by errors in assumed grain density.

8/10/2019 Formation Evaluation and Petrophysics Mr D. G. Bowen
http://slidepdf.com/reader/full/formation-evaluation-and-petrophysics-mr-d-g-bowen 39/225
and cores, must be taken into account for an accurate porosity evaluation. Typically, core
derived density data are used to provide r ma values for the density log interpretation.
SATURATIONS
The saturating fluid content of a porous rock may be quantitatively described in one of two
ways. The saturation may be expressed as a fractional proportion, or percentage of the
porosity that is occupied by the specific fluid phase, or the fractional proportion, or
percentage of the bulk volume that is occupied by the fluid phase.
In formation evaluation we are most often concerned with the water saturation (Sw) as this
is the phase that carries electrical current from the logging tools. By necessity 1-Sw is the
hydrocarbon saturation of the pore-space. The Sw commonly derived is the portion of the
porosity that is water and
8/10/2019 Formation Evaluation and Petrophysics Mr D. G. Bowen
http://slidepdf.com/reader/full/formation-evaluation-and-petrophysics-mr-d-g-bowen 40/225
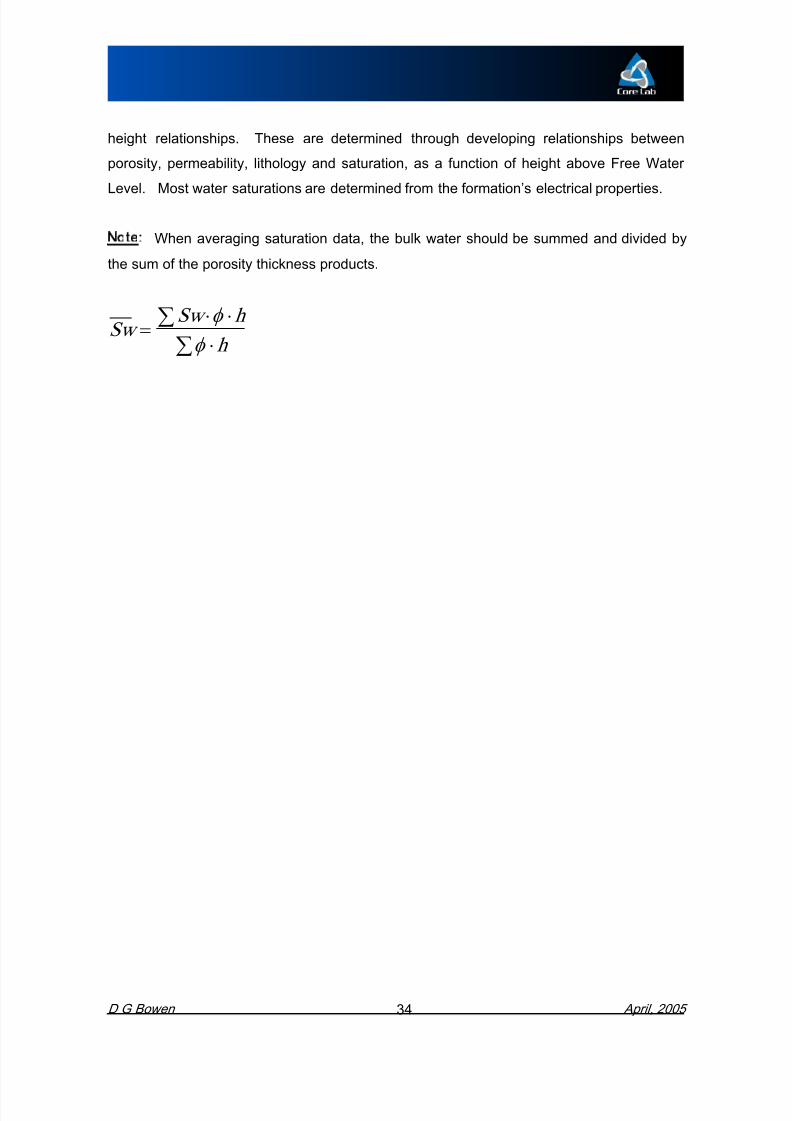
height relationships. These are determined through developing relationships between
porosity, permeability, lithology and saturation, as a function of height above Free Water
Level. Most water saturations are determined from the formation’s electrical properties.
Note: When averaging saturation data, the bulk water should be summed and divided by
the sum of the porosity thickness products.
Sw = Sw ×f ×h å
f ×h å

8/10/2019 Formation Evaluation and Petrophysics Mr D. G. Bowen
http://slidepdf.com/reader/full/formation-evaluation-and-petrophysics-mr-d-g-bowen 41/225
ELECTRICAL PROPERTIES
The electrical conductivity of any material is an index of its ability to conduct an electric
current. It is independent of the dimensions of the element of the material, and it is the
electrical analogue of permeability. The reciprocal of conductivity is resistivity. Resistivity
and the electrical resistance are related as follows:
r µ LA
,
r = R × LA
,
R = r × AL
.
Where:
r = Resistance of element of any material of dimension A and L, ohm
R = Resistivity of any element ohm length
8/10/2019 Formation Evaluation and Petrophysics Mr D. G. Bowen
http://slidepdf.com/reader/full/formation-evaluation-and-petrophysics-mr-d-g-bowen 42/225
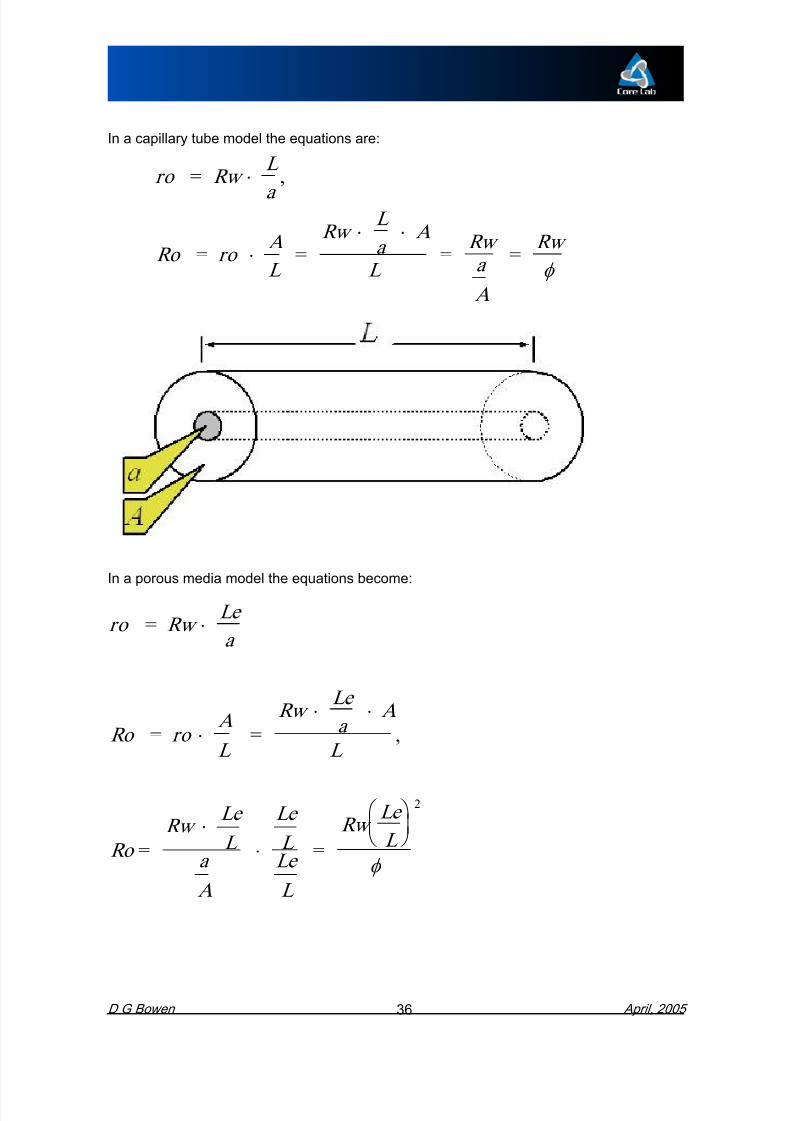
In a capillary tube model the equations are:
ro = Rw × La
,
Ro = ro × AL
= Rw × L
a × A
L =
Rw aA
= Rw f
8/10/2019 Formation Evaluation and Petrophysics Mr D. G. Bowen
http://slidepdf.com/reader/full/formation-evaluation-and-petrophysics-mr-d-g-bowen 43/225
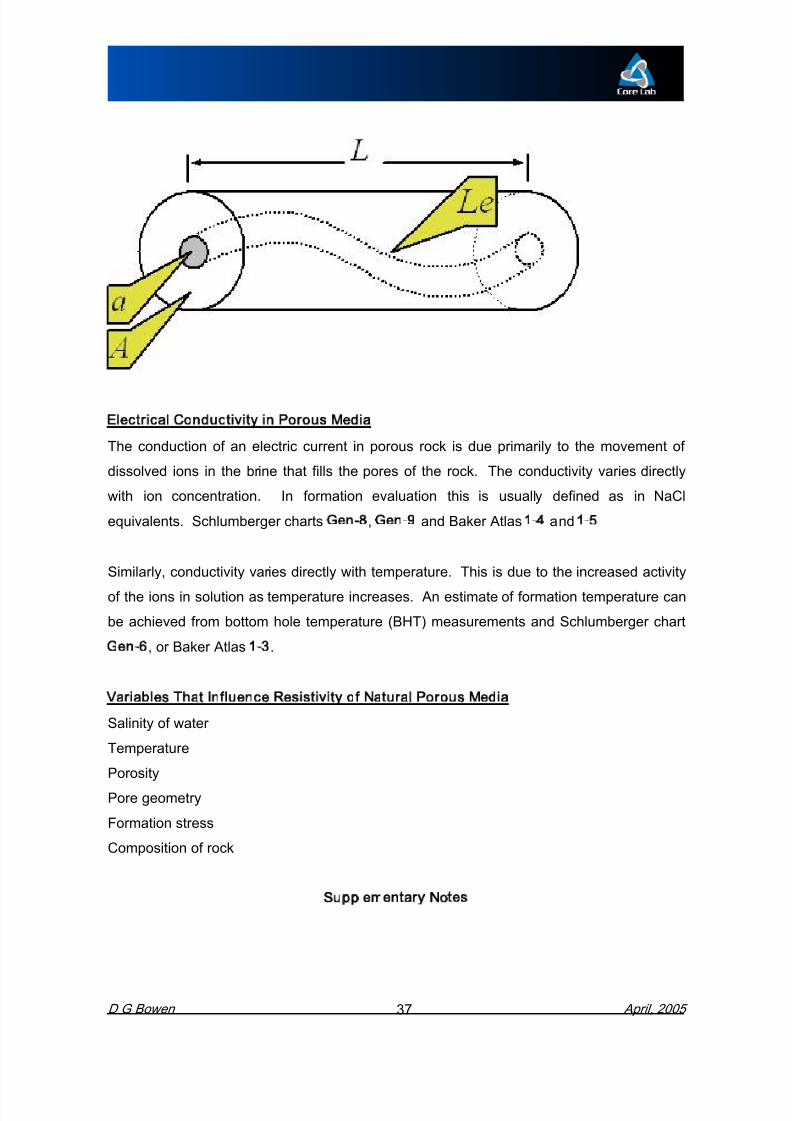
Electrical Conductivity in Porous Media The conduction of an electric current in porous rock is due primarily to the movement of
dissolved ions in the brine that fills the pores of the rock. The conductivity varies directly
with ion concentration. In formation evaluation this is usually defined as in NaCl
equivalents. Schlumberger charts Gen-8 , Gen-9 and Baker Atlas 1-4 and 1-5
8/10/2019 Formation Evaluation and Petrophysics Mr D. G. Bowen
http://slidepdf.com/reader/full/formation-evaluation-and-petrophysics-mr-d-g-bowen 44/225
THE ARCHIE RELATIONSHIP
The Archie relationship simply states that the true resistivity, Rt, is equal to the product of a
factor of the formation, F, the resistivity of the saturating brine, Rw and a resistivity index of
saturation, RI, or
Rt = F ×Rw ×RI .
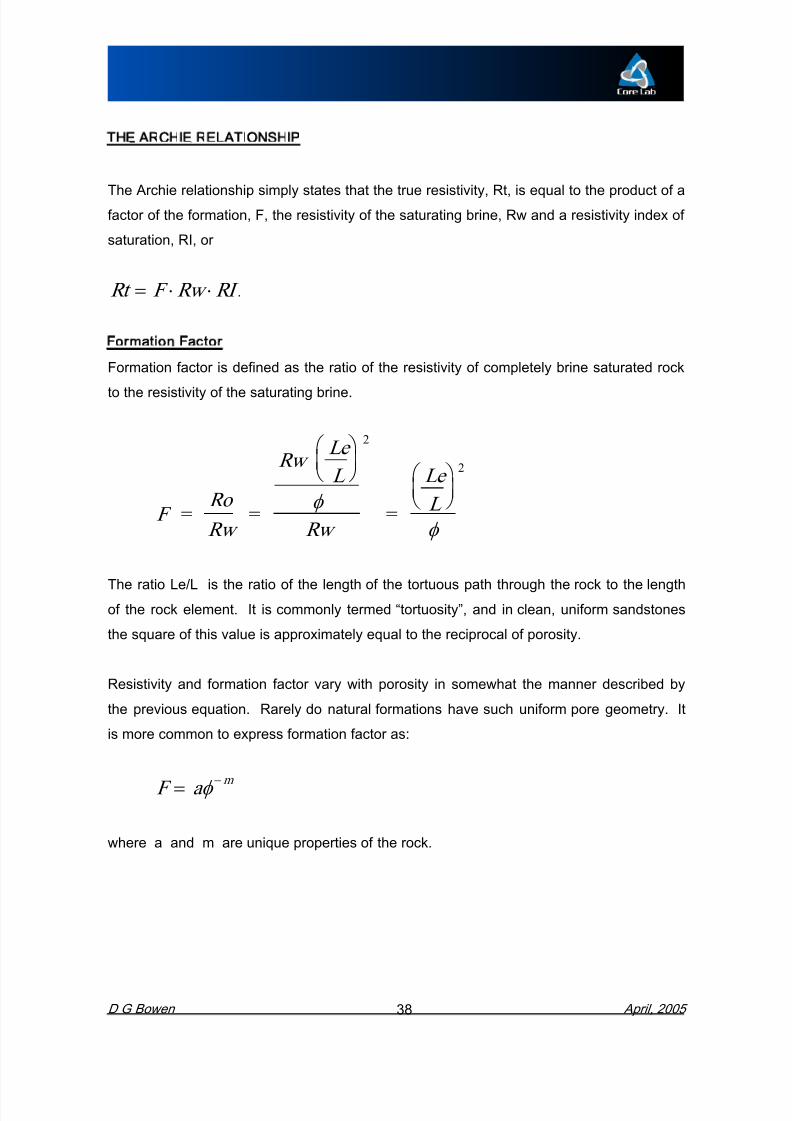
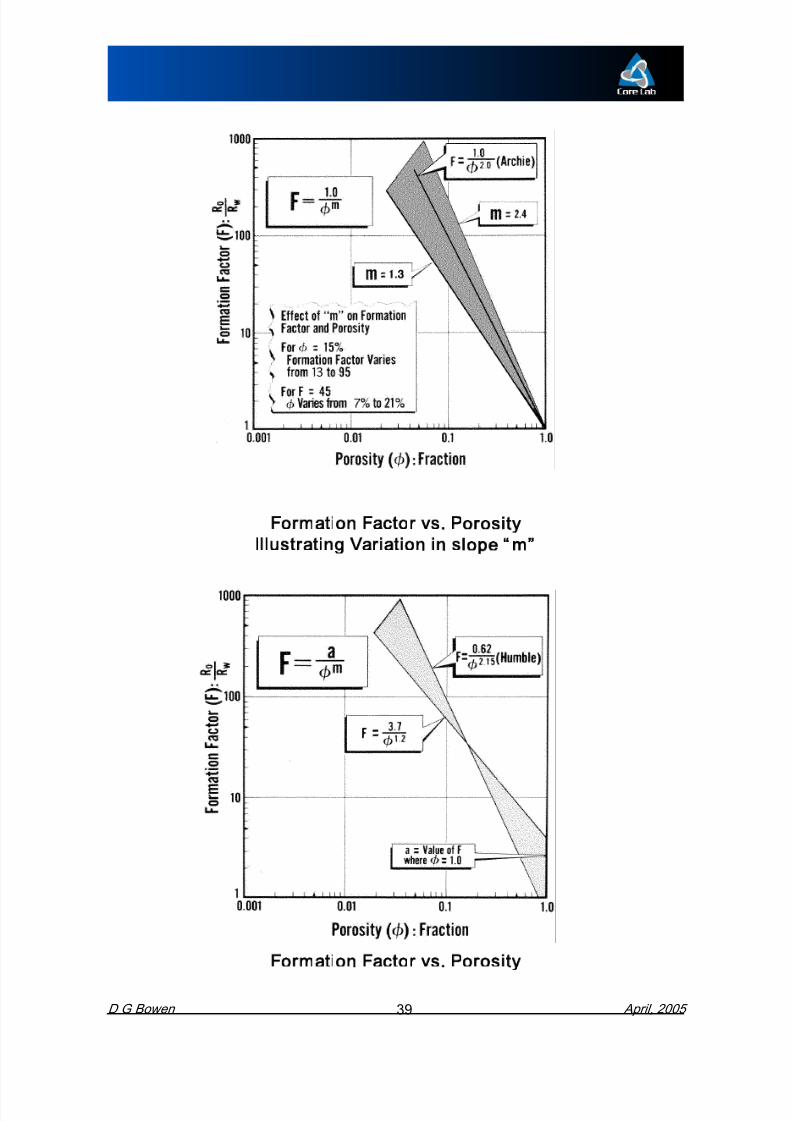
Formation Factor
Formation factor is defined as the ratio of the resistivity of completely brine saturated rock
to the resistivity of the saturating brine.
F = RoRw
=
RwLeL
æèç
ö ø÷
f Rw
2
=
LeL
æèç
ö ø÷
f
2
8/10/2019 Formation Evaluation and Petrophysics Mr D. G. Bowen
http://slidepdf.com/reader/full/formation-evaluation-and-petrophysics-mr-d-g-bowen 45/225
8/10/2019 Formation Evaluation and Petrophysics Mr D. G. Bowen
http://slidepdf.com/reader/full/formation-evaluation-and-petrophysics-mr-d-g-bowen 46/225
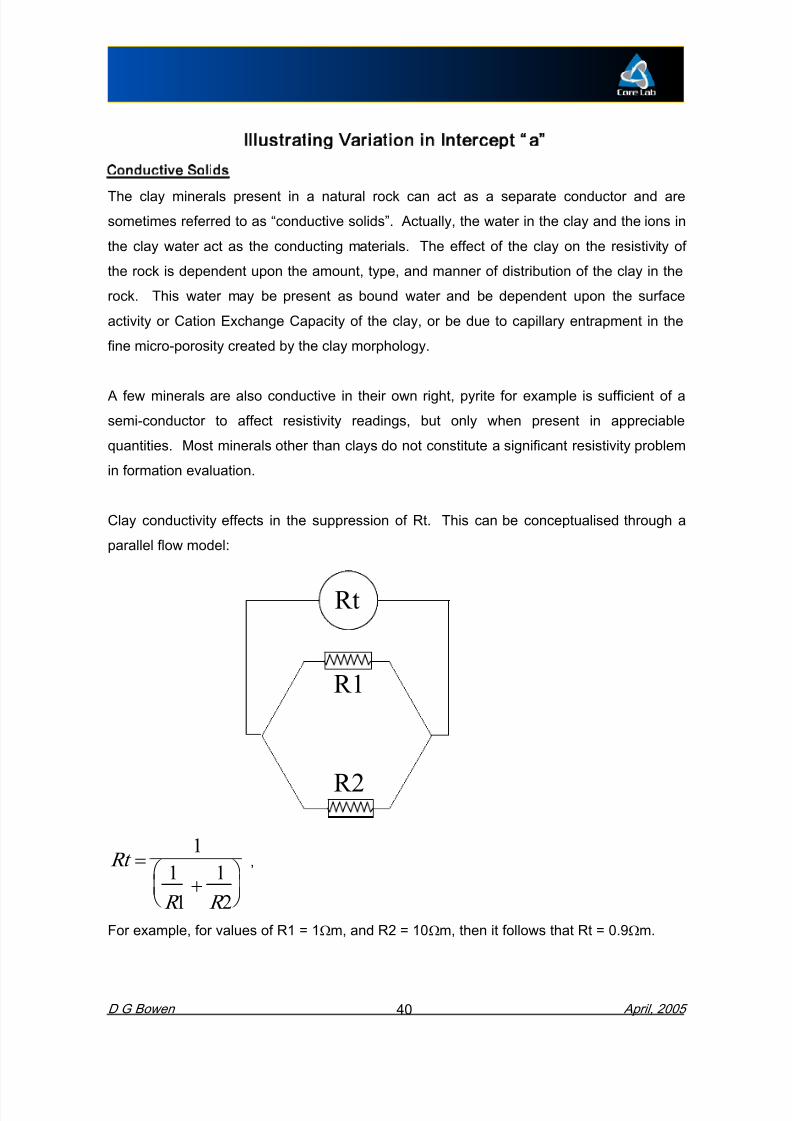
Illustrating Variation in Intercept “a”Conductive Solids
The clay minerals present in a natural rock can act as a separate conductor and are
sometimes referred to as “conductive solids”. Actually, the water in the clay and the ions in
the clay water act as the conducting materials. The effect of the clay on the resistivity of
the rock is dependent upon the amount, type, and manner of distribution of the clay in the
rock. This water may be present as bound water and be dependent upon the surface
activity or Cation Exchange Capacity of the clay, or be due to capillary entrapment in the
fine micro-porosity created by the clay morphology.
A few minerals are also conductive in their own right, pyrite for example is sufficient of a
semi-conductor to affect resistivity readings, but only when present in appreciablequantities. Most minerals other than clays do not constitute a significant resistivity problem
in formation evaluation.
Clay conductivity effects in the suppression of Rt. This can be conceptualised through a

8/10/2019 Formation Evaluation and Petrophysics Mr D. G. Bowen
http://slidepdf.com/reader/full/formation-evaluation-and-petrophysics-mr-d-g-bowen 47/225
The situation is made worse when Rw becomes larger. This is the case when formation
water becomes fresher. In SE Asia on the Baram Delta or in the Malay Basin it is not
unusual for oil producing horizons to have less resistivity than the adjacent water zones.

8/10/2019 Formation Evaluation and Petrophysics Mr D. G. Bowen
http://slidepdf.com/reader/full/formation-evaluation-and-petrophysics-mr-d-g-bowen 48/225
Effect of Overburden PressureOn Formation Factor
Effect of Overburden Pressure on Resistivity
Confinement or overburden pressure may cause a significant increase in resistivity. This
usually occurs in rocks that are not well cemented and in lower porosity rocks. In the past,most resistivity measurements and formation factors have been determined on unconfined
core samples, and nearly all of the porosity formation factor correlations in widespread use
today were derived from such data. Resistivity measurements and formation factors
determined under confining pressures that represent the in-situ formation conditions are
essential for accurate log analysis.
The figure above demonstrates the effect of overburden pressure on formation factor
values observed on samples from a reef-limestone from Canada. Note the increasing
difference between the overburden and non-overburden values as the porosity decreases.
8/10/2019 Formation Evaluation and Petrophysics Mr D. G. Bowen
http://slidepdf.com/reader/full/formation-evaluation-and-petrophysics-mr-d-g-bowen 49/225
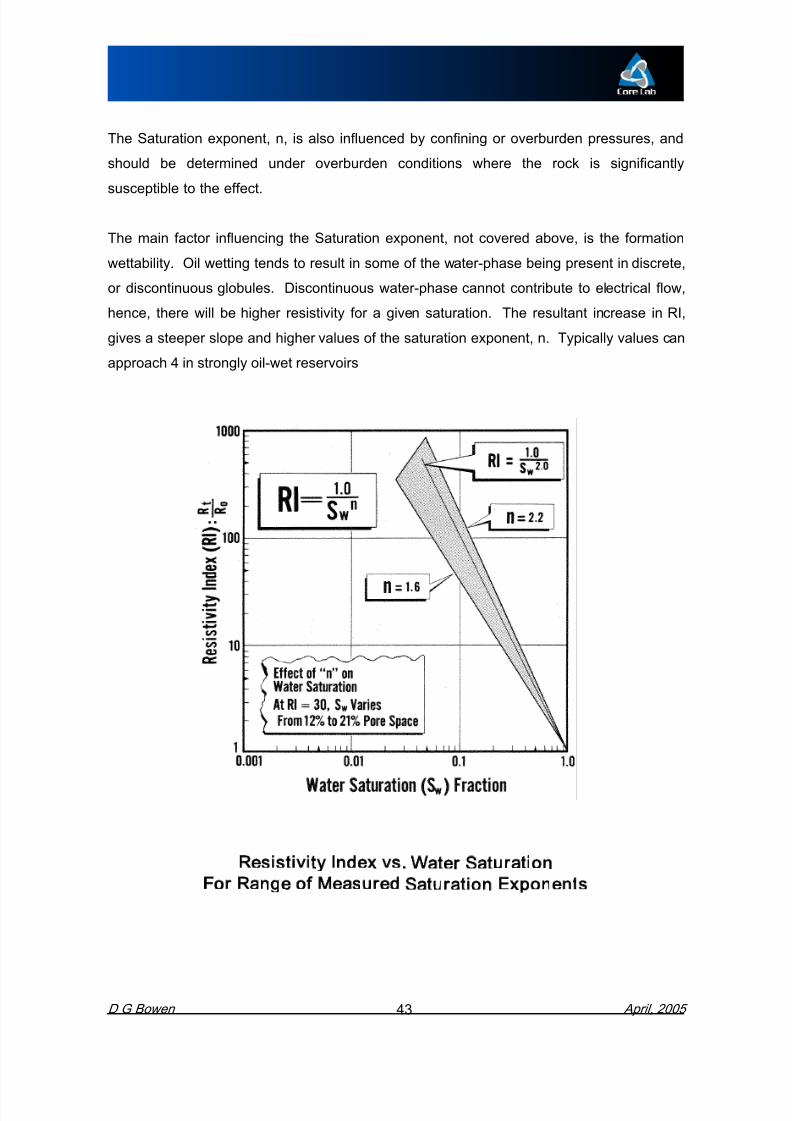
The Saturation exponent, n, is also influenced by confining or overburden pressures, and
should be determined under overburden conditions where the rock is significantly
susceptible to the effect.
The main factor influencing the Saturation exponent, not covered above, is the formation
wettability. Oil wetting tends to result in some of the water-phase being present in discrete,
or discontinuous globules. Discontinuous water-phase cannot contribute to electrical flow,hence, there will be higher resistivity for a given saturation. The resultant increase in RI,
gives a steeper slope and higher values of the saturation exponent, n. Typically values can
approach 4 in strongly oil-wet reservoirs

8/10/2019 Formation Evaluation and Petrophysics Mr D. G. Bowen
http://slidepdf.com/reader/full/formation-evaluation-and-petrophysics-mr-d-g-bowen 50/225
8/10/2019 Formation Evaluation and Petrophysics Mr D. G. Bowen
http://slidepdf.com/reader/full/formation-evaluation-and-petrophysics-mr-d-g-bowen 51/225
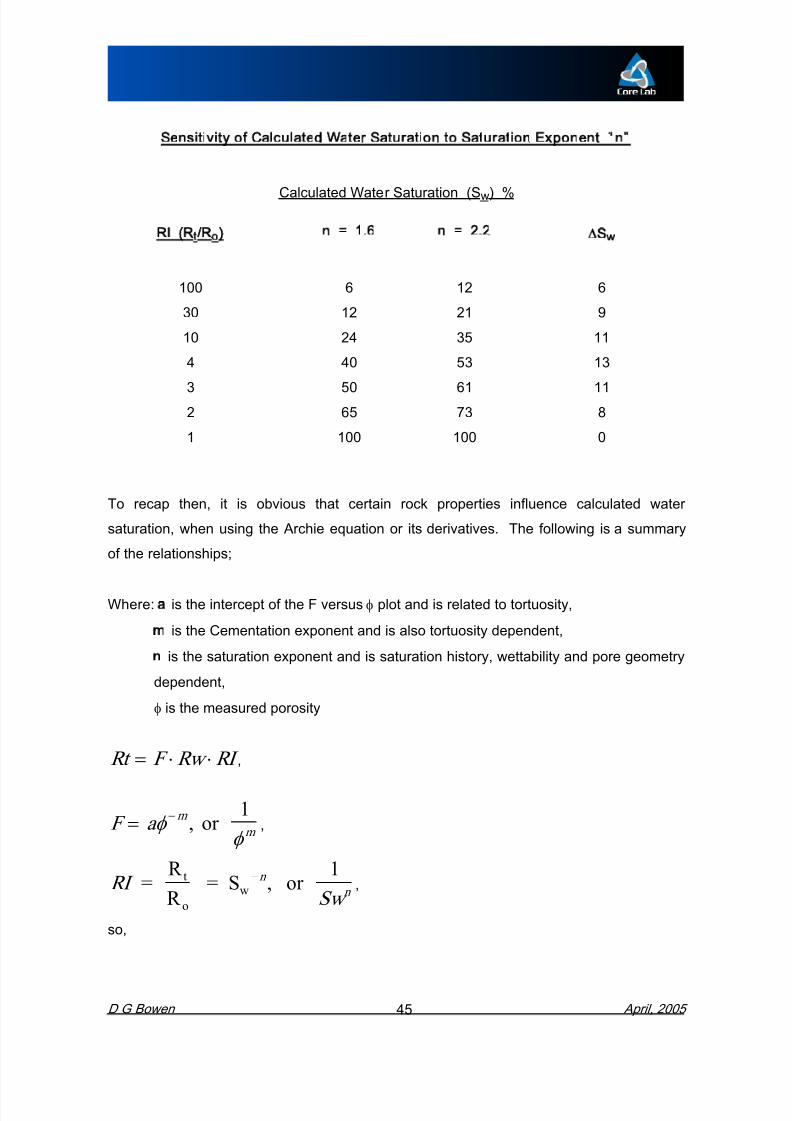
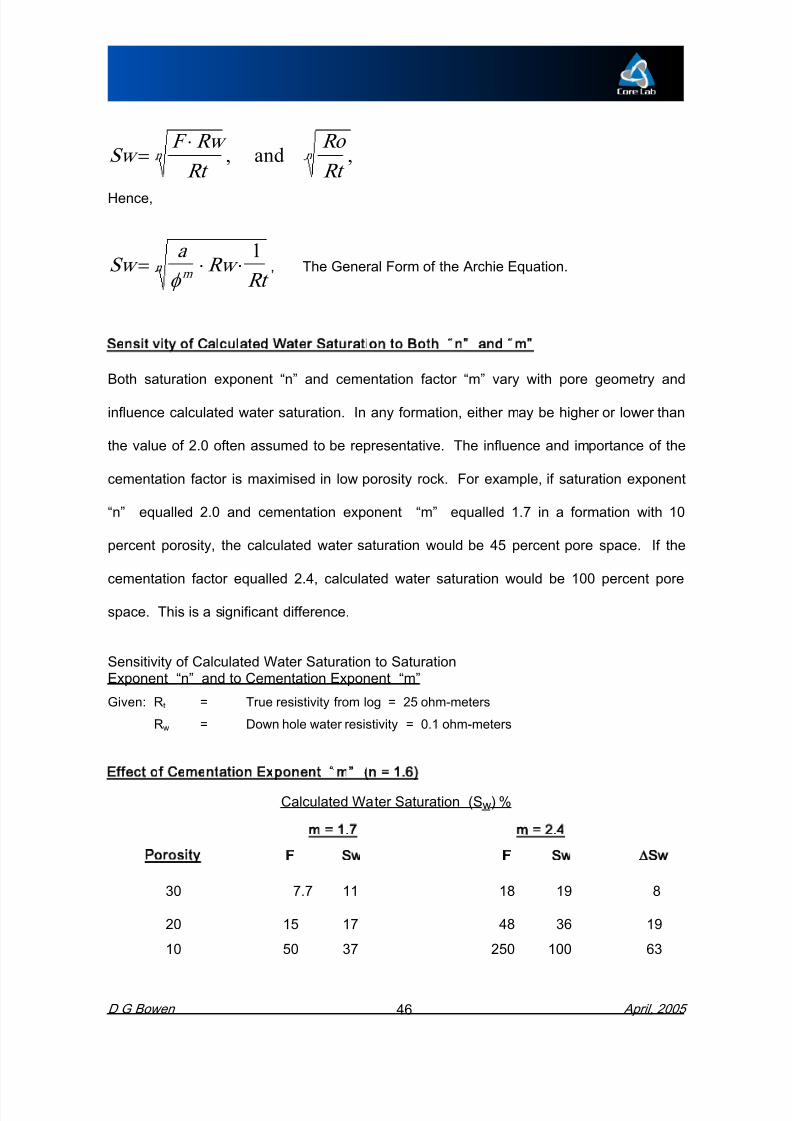
Sensitivity of Calculated Water Saturation to Saturation Exponent “ n”
Calculated Water Saturation (S w) %
RI R t/Ro ) n = 1.6 n = 2.2 S w
100 6 12 630 12 21 9
10 24 35 11
4 40 53 13
3 50 61 11
2 65 73 81 100 100 0
To recap then, it is obvious that certain rock properties influence calculated water
saturation, when using the Archie equation or its derivatives. The following is a summary
8/10/2019 Formation Evaluation and Petrophysics Mr D. G. Bowen
http://slidepdf.com/reader/full/formation-evaluation-and-petrophysics-mr-d-g-bowen 52/225

8/10/2019 Formation Evaluation and Petrophysics Mr D. G. Bowen
http://slidepdf.com/reader/full/formation-evaluation-and-petrophysics-mr-d-g-bowen 53/225
8/10/2019 Formation Evaluation and Petrophysics Mr D. G. Bowen
http://slidepdf.com/reader/full/formation-evaluation-and-petrophysics-mr-d-g-bowen 54/225
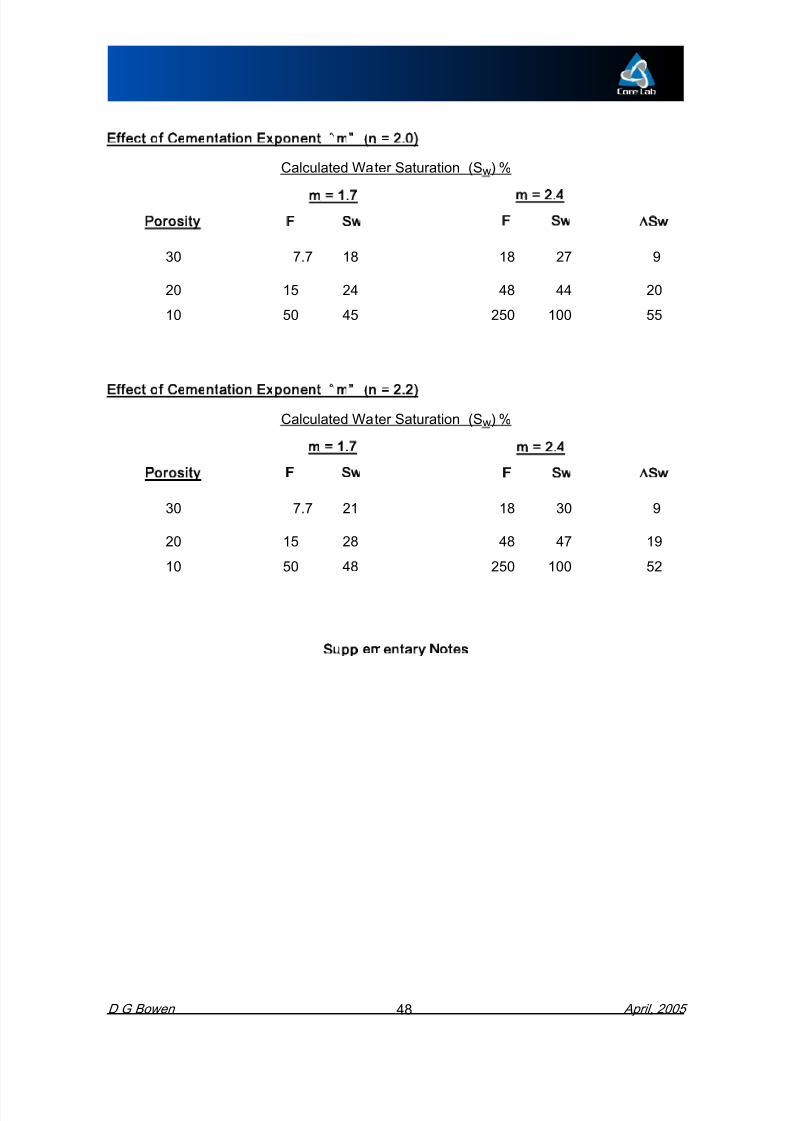
Effect of Cementation Exponent “ m” n = 2.0)
Calculated Water Saturation (S w) %
m = 1.7 m = 2.4
Porosity F Sw F Sw Sw
30 7.7 18 18 27 9
20 15 24 48 44 2010 50 45 250 100 55
Effect of Cementation Exponent “ m” n = 2.2)
Calculated Water Saturation (S w) %
m = 1.7 m = 2.4
Porosity F Sw F Sw Sw
30 7.7 21 18 30 9
20 15 28 48 47 19
8/10/2019 Formation Evaluation and Petrophysics Mr D. G. Bowen
http://slidepdf.com/reader/full/formation-evaluation-and-petrophysics-mr-d-g-bowen 55/225
CHAPTER 2.
DOWN-HOLE LOGS
Log Properties and Environments That Influence
Formation Evaluation
Section 1
Wellbore Environment

8/10/2019 Formation Evaluation and Petrophysics Mr D. G. Bowen
http://slidepdf.com/reader/full/formation-evaluation-and-petrophysics-mr-d-g-bowen 56/225
BOREHOLE - WELLBORE ENVIRONMENT
Once a drill-bit has penetrated through a formation, the local environment has been altered
from the conditions that existed before drilling. The longer the hole remains open, the
more change to the environment occurs. The actual drilling process involves removing
material that is part of the mechanical fabric of the system. The hole could not remain
open unless it was supported by a column of fluid which is about as dense, or denser, than
the equivalent pore fluid column. However, in maintaining an open hole, where
permeability exists some of the fluid invades the formation. Drilling muds are designed to
form a low permeability membrane against the hole side. This is called the filter-cake. In
order to form this, there must be a spurt fluid loss to the formation. This is followed by a
much slower continuous filtering of fluid (filtrate) over the period of time the hole remains
open The type of filtrate and filter cake is dependent on the type of drilling fluid utilised
8/10/2019 Formation Evaluation and Petrophysics Mr D. G. Bowen
http://slidepdf.com/reader/full/formation-evaluation-and-petrophysics-mr-d-g-bowen 57/225
8/10/2019 Formation Evaluation and Petrophysics Mr D. G. Bowen
http://slidepdf.com/reader/full/formation-evaluation-and-petrophysics-mr-d-g-bowen 58/225
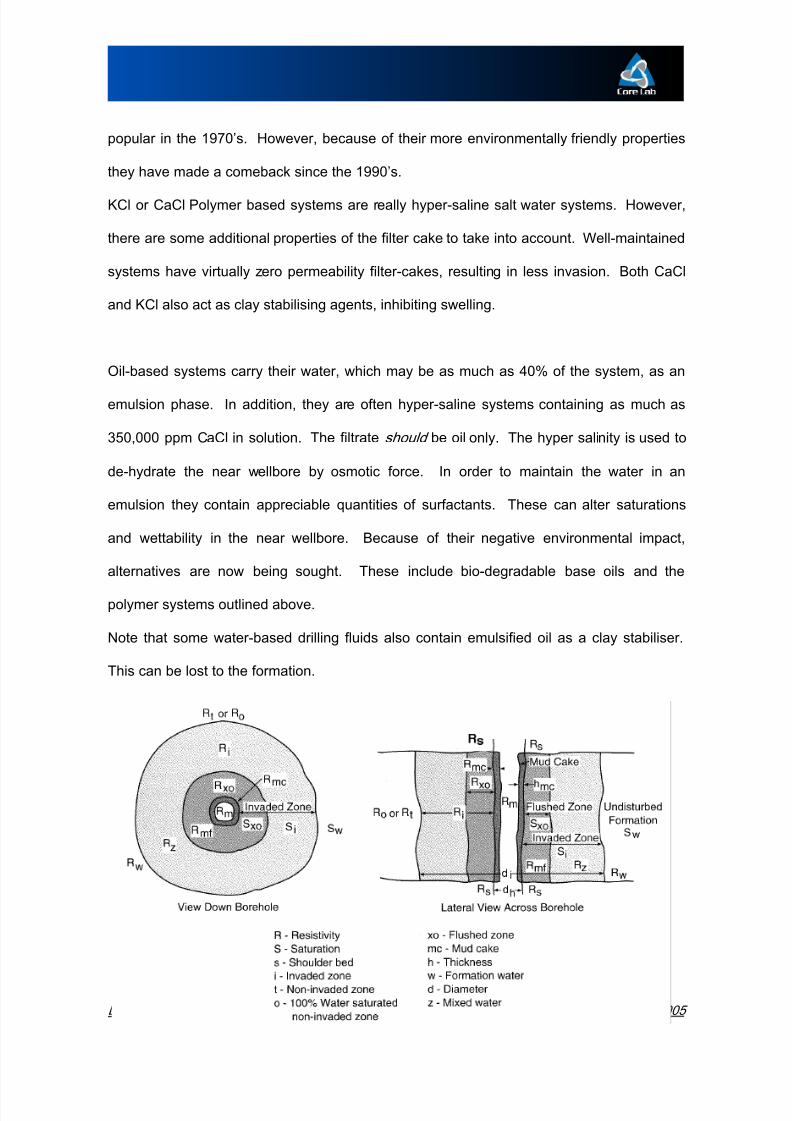
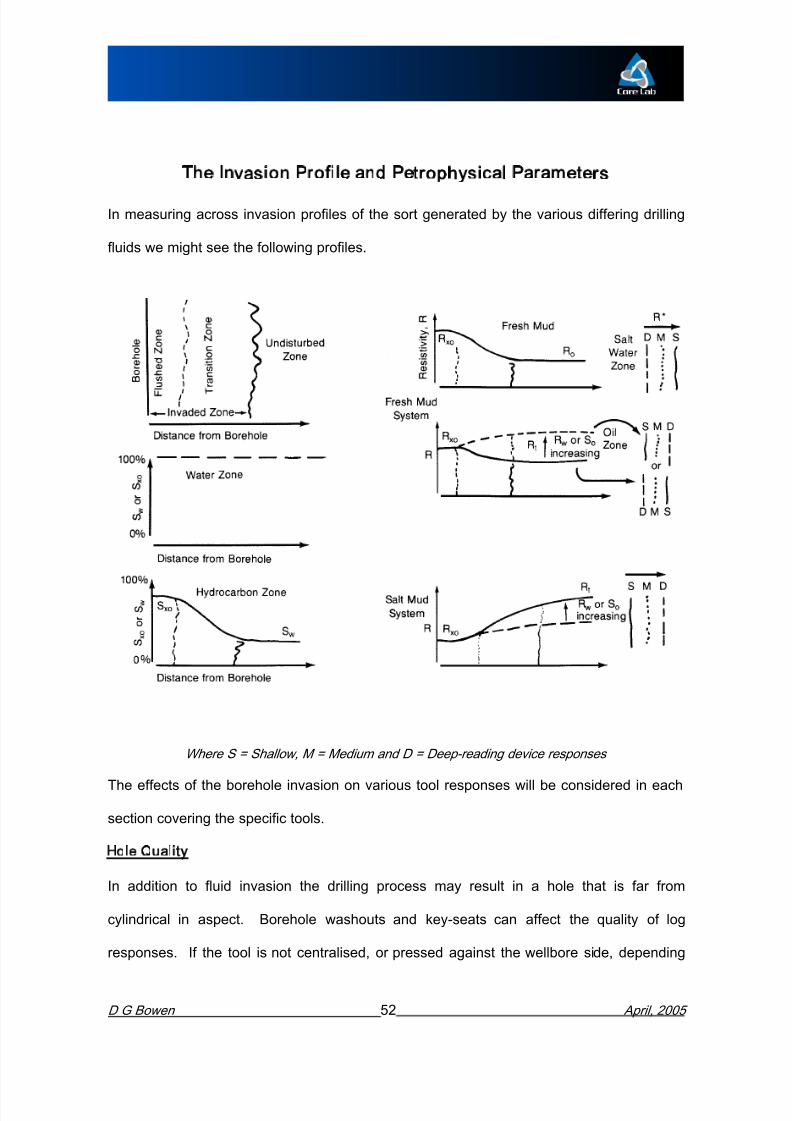
The Invasion Profile and Petrophysical Parameters
In measuring across invasion profiles of the sort generated by the various differing drilling
fluids we might see the following profiles.
8/10/2019 Formation Evaluation and Petrophysics Mr D. G. Bowen
http://slidepdf.com/reader/full/formation-evaluation-and-petrophysics-mr-d-g-bowen 59/225
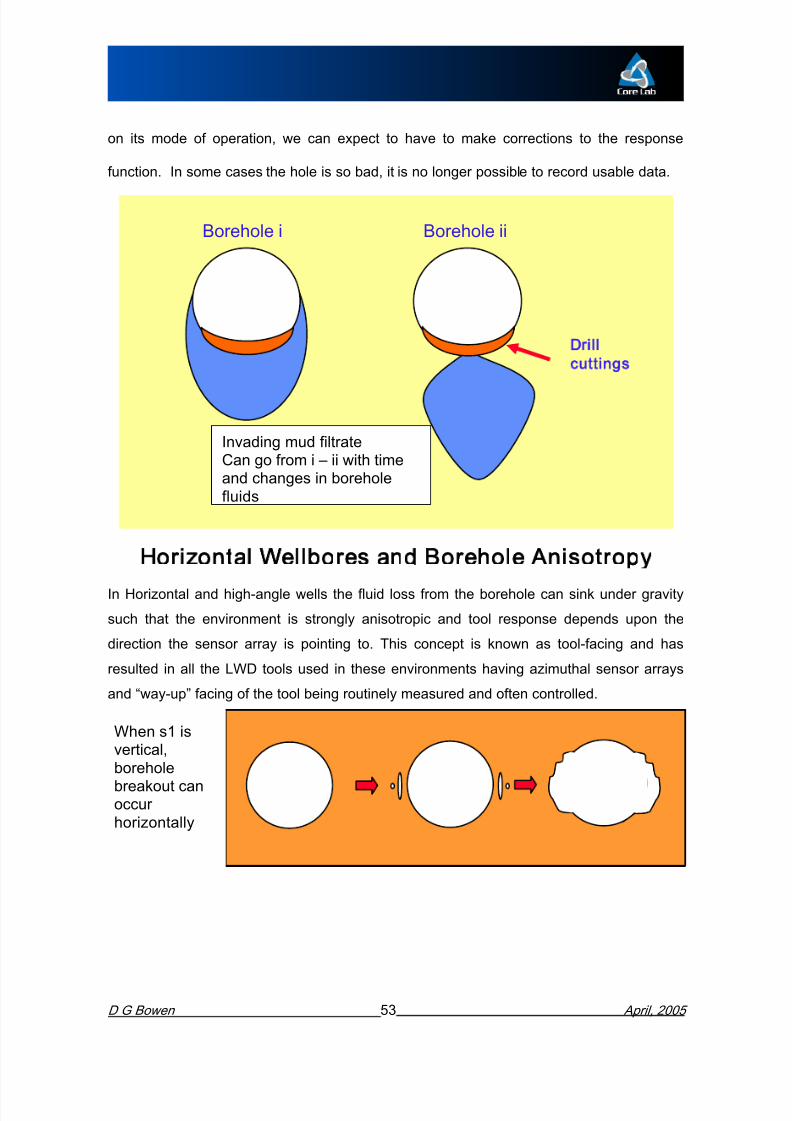
on its mode of operation, we can expect to have to make corrections to the response
function. In some cases the hole is so bad, it is no longer possible to record usable data.
Invading mud filtrateCan go from i – ii with timeand changes in boreholefluids
Drillcuttings
Borehole i Borehole ii
8/10/2019 Formation Evaluation and Petrophysics Mr D. G. Bowen
http://slidepdf.com/reader/full/formation-evaluation-and-petrophysics-mr-d-g-bowen 60/225
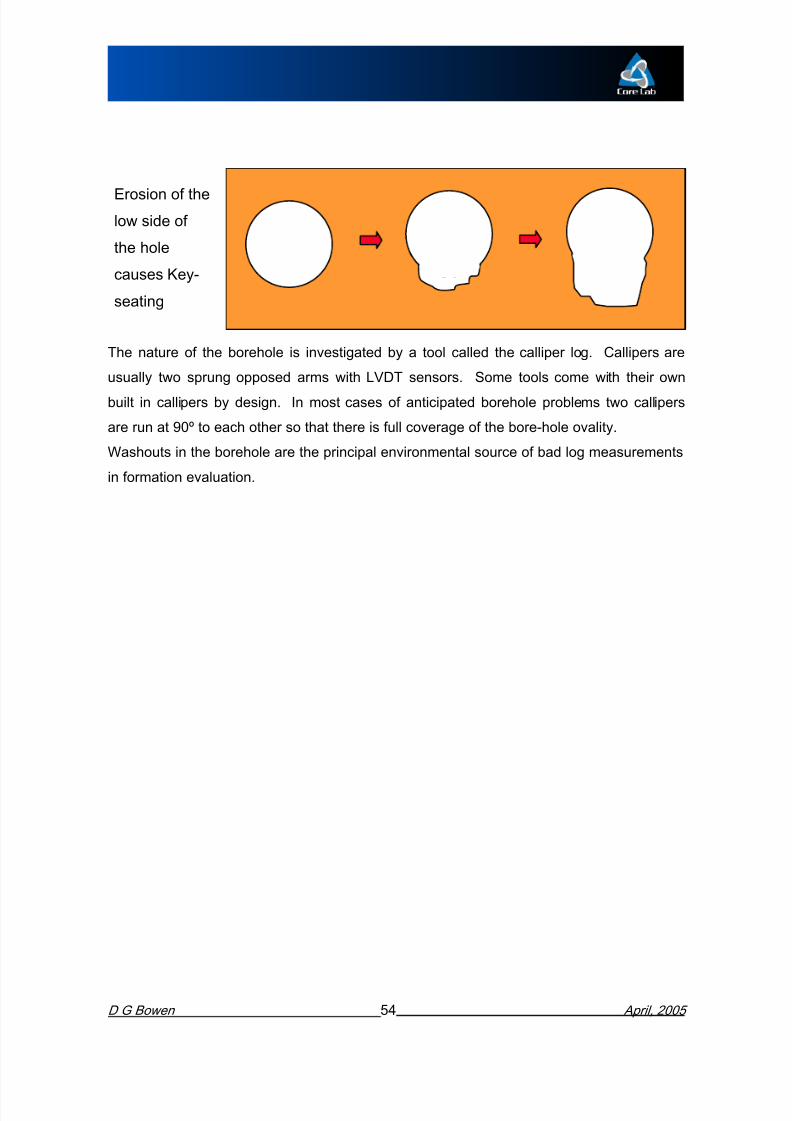
The nature of the borehole is investigated by a tool called the calliper log. Callipers are
usually two sprung opposed arms with LVDT sensors. Some tools come with their own
built in callipers by design. In most cases of anticipated borehole problems two callipers
are run at 90º to each other so that there is full coverage of the bore-hole ovality.Washouts in the borehole are the principal environmental source of bad log measurements
in formation evaluation.
Erosion of the
low side of
the hole
causes Key-
seating
8/10/2019 Formation Evaluation and Petrophysics Mr D. G. Bowen
http://slidepdf.com/reader/full/formation-evaluation-and-petrophysics-mr-d-g-bowen 61/225
Chapter 2Section 2
Lithology Logs
8/10/2019 Formation Evaluation and Petrophysics Mr D. G. Bowen
http://slidepdf.com/reader/full/formation-evaluation-and-petrophysics-mr-d-g-bowen 62/225
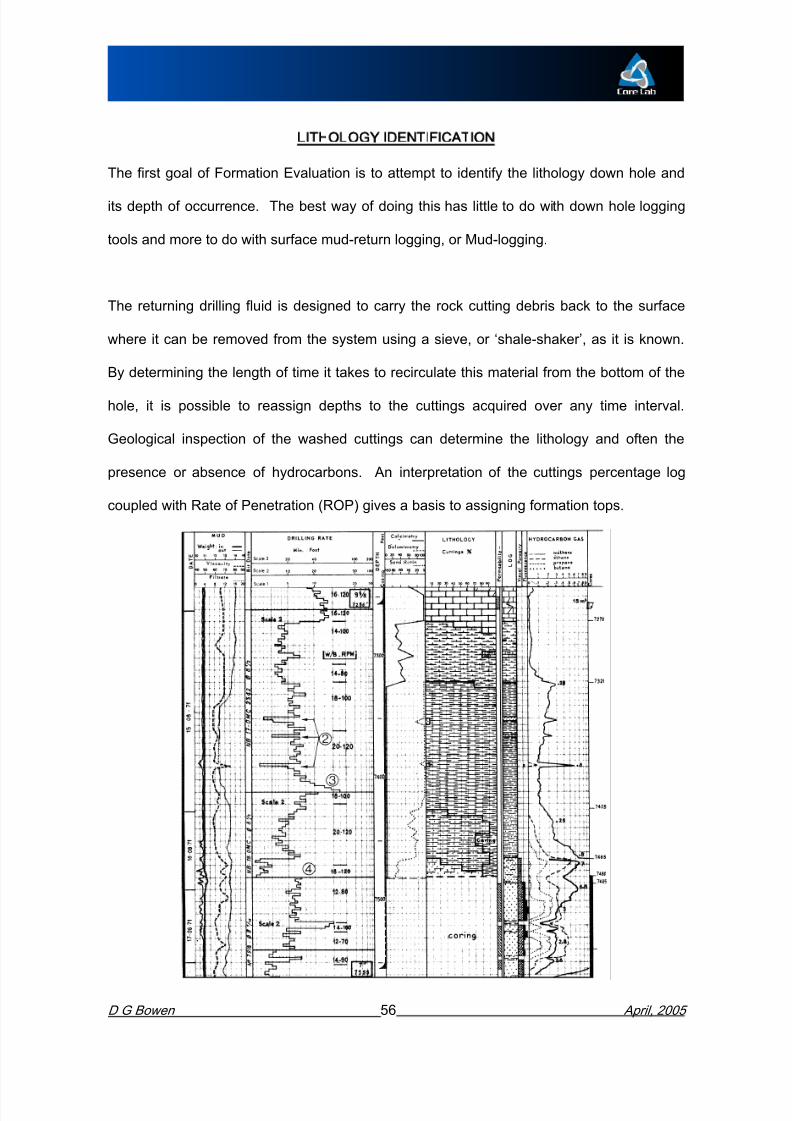
LITHOLOGY IDENTIFICATION
The first goal of Formation Evaluation is to attempt to identify the lithology down hole and
its depth of occurrence. The best way of doing this has little to do with down hole logging
tools and more to do with surface mud-return logging, or Mud-logging.
The returning drilling fluid is designed to carry the rock cutting debris back to the surface
where it can be removed from the system using a sieve, or ‘shale-shaker’, as it is known.
By determining the length of time it takes to recirculate this material from the bottom of the
hole, it is possible to reassign depths to the cuttings acquired over any time interval.
Geological inspection of the washed cuttings can determine the lithology and often the
presence or absence of hydrocarbons. An interpretation of the cuttings percentage log
coupled with Rate of Penetration (ROP) gives a basis to assigning formation tops.
8/10/2019 Formation Evaluation and Petrophysics Mr D. G. Bowen
http://slidepdf.com/reader/full/formation-evaluation-and-petrophysics-mr-d-g-bowen 63/225
8/10/2019 Formation Evaluation and Petrophysics Mr D. G. Bowen
http://slidepdf.com/reader/full/formation-evaluation-and-petrophysics-mr-d-g-bowen 64/225
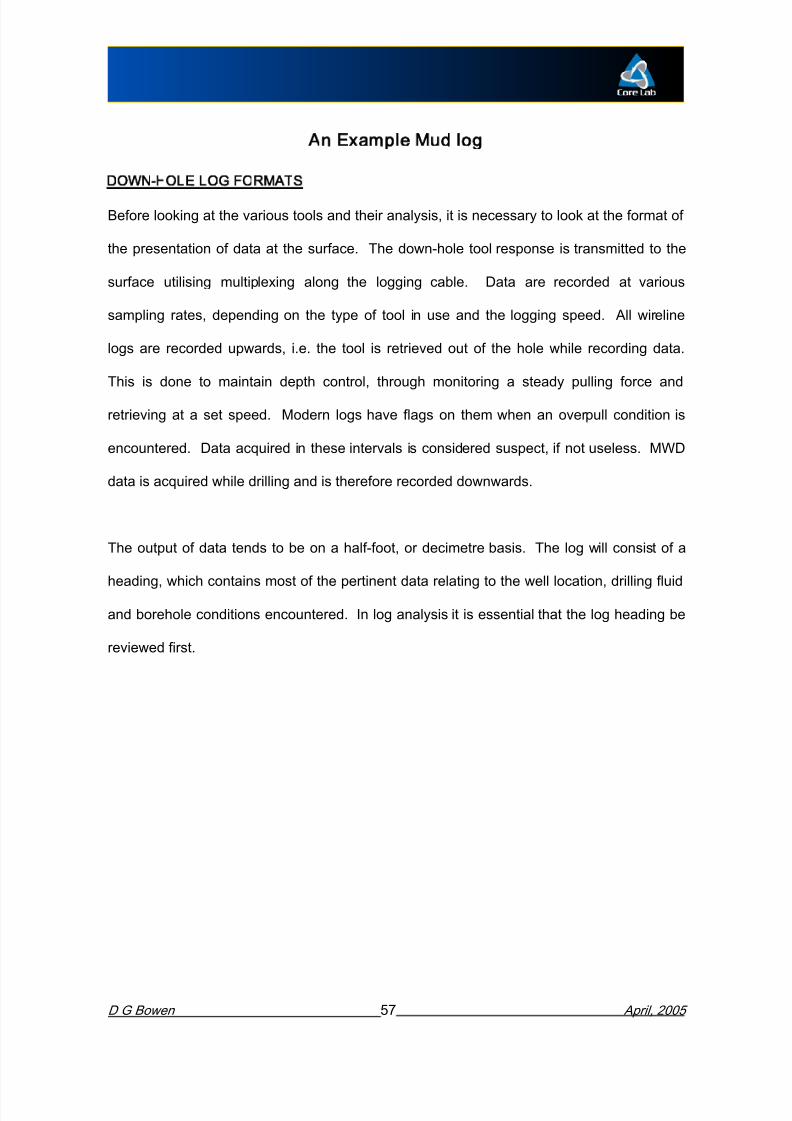
Typical Header Data
8/10/2019 Formation Evaluation and Petrophysics Mr D. G. Bowen
http://slidepdf.com/reader/full/formation-evaluation-and-petrophysics-mr-d-g-bowen 65/225
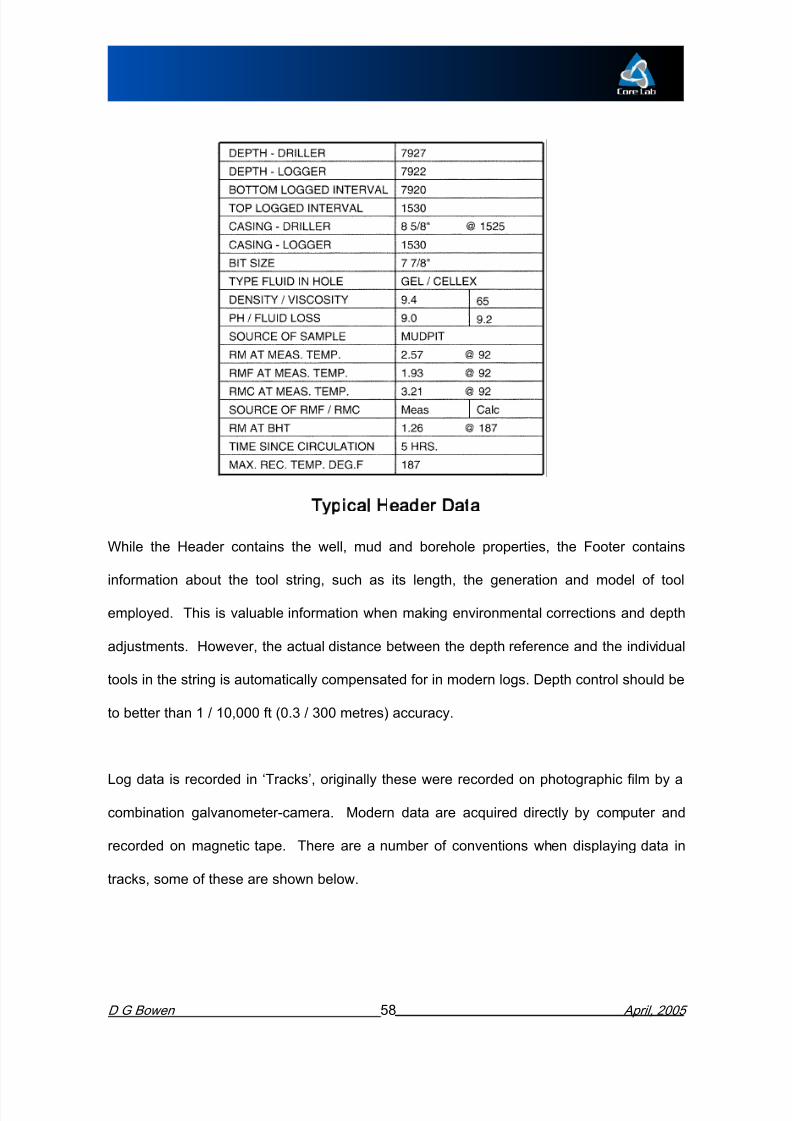
Some Log Track Formats
When viewing a log, careful attention should be paid to the scales used and the number of
units per division. In modern computer based analysis, this becomes less of a problem asthe scale parameters are part of the data file.
The downhole log responses to be considered in lithology identification should be the

8/10/2019 Formation Evaluation and Petrophysics Mr D. G. Bowen
http://slidepdf.com/reader/full/formation-evaluation-and-petrophysics-mr-d-g-bowen 66/225
STUDY GUIDE QUESTIONS ON THE GAMMA-RAY LOGS
1) What three (3) major radioactive elements does the gamma ray tool respond to?
2) What type of activity (high, medium, or low) do carbonates, sands, and shales
typically exhibit?
3) How does an increase in clay content affect the gamma ray response?
4) What are the units on the gamma ray log and how is it calibrated?
5) Is the tool zeroed?
8/10/2019 Formation Evaluation and Petrophysics Mr D. G. Bowen
http://slidepdf.com/reader/full/formation-evaluation-and-petrophysics-mr-d-g-bowen 67/225

8/10/2019 Formation Evaluation and Petrophysics Mr D. G. Bowen
http://slidepdf.com/reader/full/formation-evaluation-and-petrophysics-mr-d-g-bowen 68/225
8/10/2019 Formation Evaluation and Petrophysics Mr D. G. Bowen
http://slidepdf.com/reader/full/formation-evaluation-and-petrophysics-mr-d-g-bowen 69/225
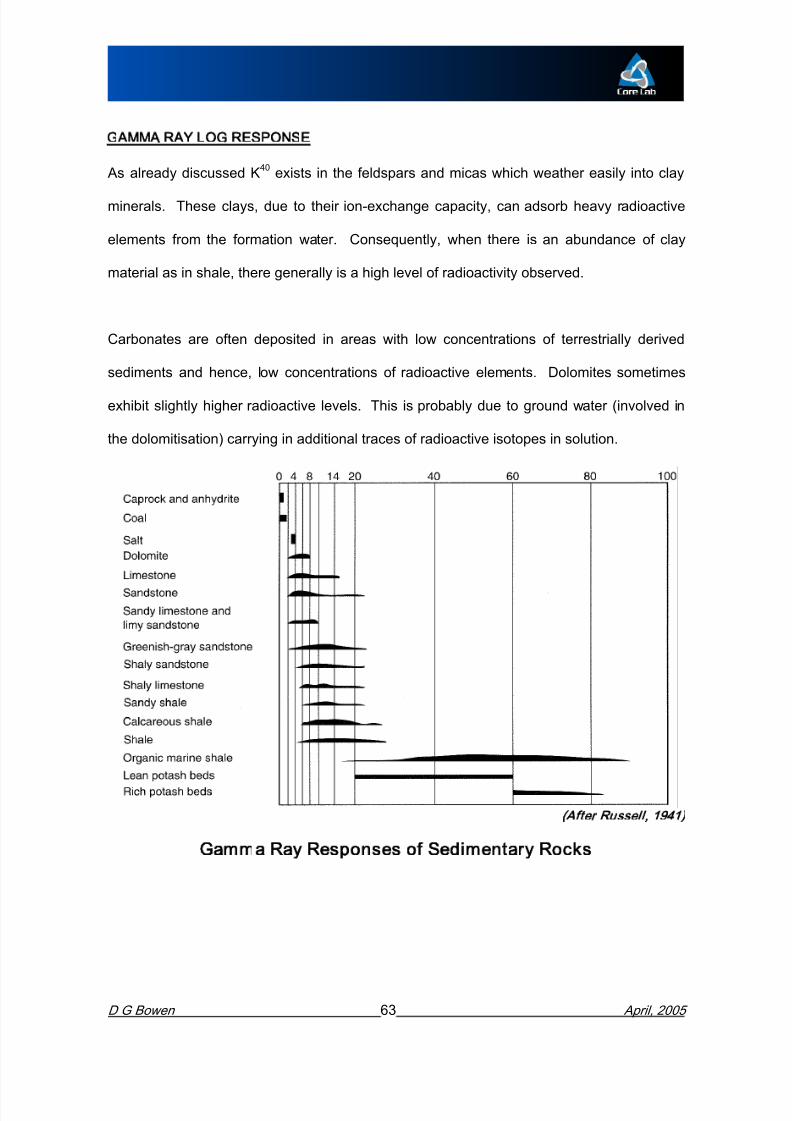
GAMMA RAY LOG RESPONSE
As already discussed K 40 exists in the feldspars and micas which weather easily into clay
minerals. These clays, due to their ion-exchange capacity, can adsorb heavy radioactive
elements from the formation water. Consequently, when there is an abundance of clay
material as in shale, there generally is a high level of radioactivity observed.
Carbonates are often deposited in areas with low concentrations of terrestrially derived
sediments and hence, low concentrations of radioactive elements. Dolomites sometimes
exhibit slightly higher radioactive levels. This is probably due to ground water (involved in
the dolomitisation) carrying in additional traces of radioactive isotopes in solution.

8/10/2019 Formation Evaluation and Petrophysics Mr D. G. Bowen
http://slidepdf.com/reader/full/formation-evaluation-and-petrophysics-mr-d-g-bowen 70/225
Approximately ninety percent (90%)of the gamma rays detected at the tool are emitted
from the first six inches of the formation. Gamma rays can be detected through cementand casing, so the tool works in cased holes; the total counts however, will be low. The
mud also absorbs gamma rays (the denser the mud, the greater the effect), so
environmental corrections need to be made to obtain a true value for the formation
radioactivity. Corrections need to be made for the borehole diameter and mud density.
Baker Atlas charts 3-1 - 3-12 and Schlumberger GR-1 , and GR-2
8/10/2019 Formation Evaluation and Petrophysics Mr D. G. Bowen
http://slidepdf.com/reader/full/formation-evaluation-and-petrophysics-mr-d-g-bowen 71/225
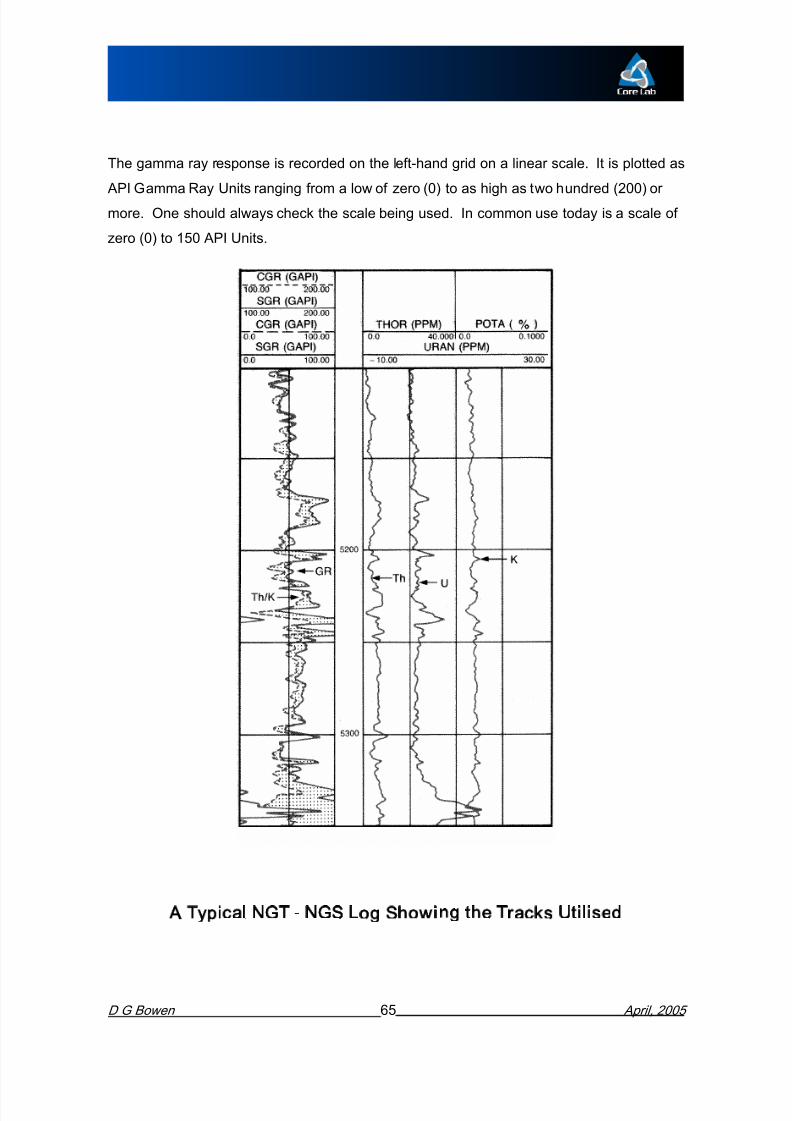
The gamma ray response is recorded on the left-hand grid on a linear scale. It is plotted as API Gamma Ray Units ranging from a low of zero (0) to as high as two hundred (200) or
more. One should always check the scale being used. In common use today is a scale of
zero (0) to 150 API Units.
8/10/2019 Formation Evaluation and Petrophysics Mr D. G. Bowen
http://slidepdf.com/reader/full/formation-evaluation-and-petrophysics-mr-d-g-bowen 72/225

8/10/2019 Formation Evaluation and Petrophysics Mr D. G. Bowen
http://slidepdf.com/reader/full/formation-evaluation-and-petrophysics-mr-d-g-bowen 73/225
SUMMARY SHEET OF THE GAMMA RAY LOG
· The tool detects gamma rays primarily emitted from Potassium, Thorium, and Uranium.
· Limestone exhibits low gamma activity and dolomites sometimes exhibit slightly higher
levels than limestone. Sandstone is usually somewhat higher than the carbonates, and
increases in activity as clay (shaliness) content increases. Shale has high gamma rayactivity.
· The log is reported on the left-hand track linear grid in API Gamma Ray Units. Spectral
data fill tracks 2 and 3
· The tool is calibrated in an API test pit and later zeroed at the well site. The scales
used vary and can start at zero (0) or any value higher, i.e. 30.
· An advantage over the SP is the gamma ray tool can be used in oil base mud, gas or
th d ti b h l fl id It i l d i d h l

8/10/2019 Formation Evaluation and Petrophysics Mr D. G. Bowen
http://slidepdf.com/reader/full/formation-evaluation-and-petrophysics-mr-d-g-bowen 74/225
STUDY GUIDE QUESTIONS ON THE SP LOG
1) How is a spontaneous potential generated:
2) a. How is the SP measured?
b. Does it require a particular type of mud?
3) How is the SP zeroed?
4) Can the SP be used in defining bed thickness? If so, how?
5) What three (3) major factors control the SP’s magnitude and direction?
6) What are three (3) minor factors?
7) When will a static spontaneous potential (SSP) be developed?

8/10/2019 Formation Evaluation and Petrophysics Mr D. G. Bowen
http://slidepdf.com/reader/full/formation-evaluation-and-petrophysics-mr-d-g-bowen 75/225

8/10/2019 Formation Evaluation and Petrophysics Mr D. G. Bowen
http://slidepdf.com/reader/full/formation-evaluation-and-petrophysics-mr-d-g-bowen 76/225
8/10/2019 Formation Evaluation and Petrophysics Mr D. G. Bowen
http://slidepdf.com/reader/full/formation-evaluation-and-petrophysics-mr-d-g-bowen 77/225
concentrated solution as they pass from the more concentrated (which becomes more
positive). This flow is equivalent to a conventional current flow in the reverse direction.This current is thus created by an electromotive force known as the liquid-junction potential
(E1), which is about one-fifth of the membrane potential. In the borehole this scenario
occurs at the interface of the uninvaded zone and the flushed zone.
The current created flows in the same direction as the one created by the shale potential.
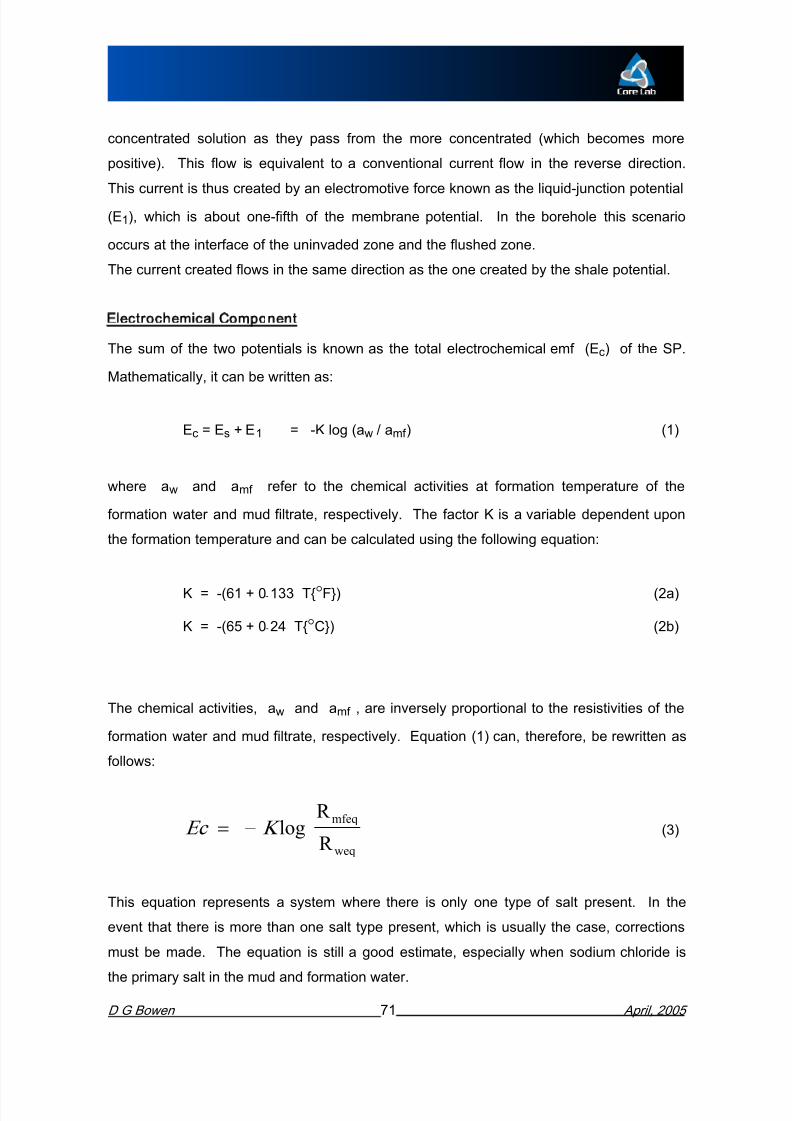
Electrochemical Component
The sum of the two potentials is known as the total electrochemical emf (Ec) of the SP.
Mathematically, it can be written as:
Ec = Es + E1 = -K log (aw / amf ) (1)
where a w and a mf refer to the chemical activities at formation temperature of the
formation water and mud filtrate, respectively. The factor K is a variable dependent upon
the formation temperature and can be calculated using the following equation:

8/10/2019 Formation Evaluation and Petrophysics Mr D. G. Bowen
http://slidepdf.com/reader/full/formation-evaluation-and-petrophysics-mr-d-g-bowen 78/225

8/10/2019 Formation Evaluation and Petrophysics Mr D. G. Bowen
http://slidepdf.com/reader/full/formation-evaluation-and-petrophysics-mr-d-g-bowen 79/225
8/10/2019 Formation Evaluation and Petrophysics Mr D. G. Bowen
http://slidepdf.com/reader/full/formation-evaluation-and-petrophysics-mr-d-g-bowen 80/225
MEASURING SP
To measure the spontaneous potential created in the borehole a potential measuringdevice containing one electrode is lowered to the bottom of the hole. As the device is
raised, the changes in potential with respect to a ground electrode at the surface are
recorded. So, the SP curve represents changes in potential with respect to depth.
Consequently, there is no zero line, only what is known as a shale base line.
Shales of uniform age and the same salinity pore water, seem to create a uniform potential,
hence the shale base line can be easily determined. It is from this line that the SP
deflections are measured whether they are excursions to the right (+mv) or the left (-mv).
THE SP CURVE
In the case where the formation water is saltier than the mud or mud filtrate (Rw < Rmf );
the resulting SP is negative with an excursion to the left. This is typical of older formations
where the salinity of the formation water may reach saturation values. The curve is
symmetrical about the bed centre and the bed boundaries are picked at the inflection
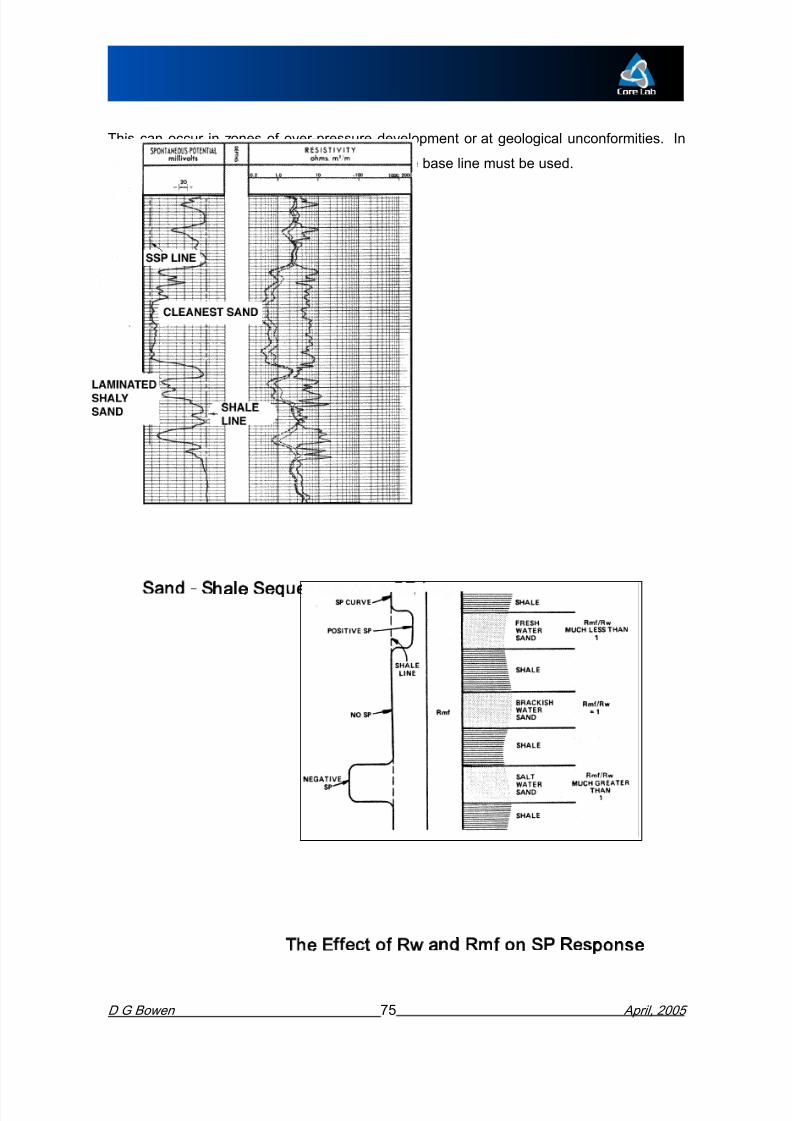
8/10/2019 Formation Evaluation and Petrophysics Mr D. G. Bowen
http://slidepdf.com/reader/full/formation-evaluation-and-petrophysics-mr-d-g-bowen 81/225
This can occur in zones of over-pressure development or at geological unconformities. In
determining the value of the SP, the proper shale base line must be used.

8/10/2019 Formation Evaluation and Petrophysics Mr D. G. Bowen
http://slidepdf.com/reader/full/formation-evaluation-and-petrophysics-mr-d-g-bowen 82/225
8/10/2019 Formation Evaluation and Petrophysics Mr D. G. Bowen
http://slidepdf.com/reader/full/formation-evaluation-and-petrophysics-mr-d-g-bowen 83/225
Other Factors Affecting the SP
The SP is also influenced by the shaliness of the formation. The shale reduces thepotential change for the bed; hence a lower SP value is observed than if it were clean.
This is known as an ASP or PSP (actual or pseudo spontaneous potential). A qualitative
indicator of the bed’s shaliness is:
1- a , where a = ASPSSP
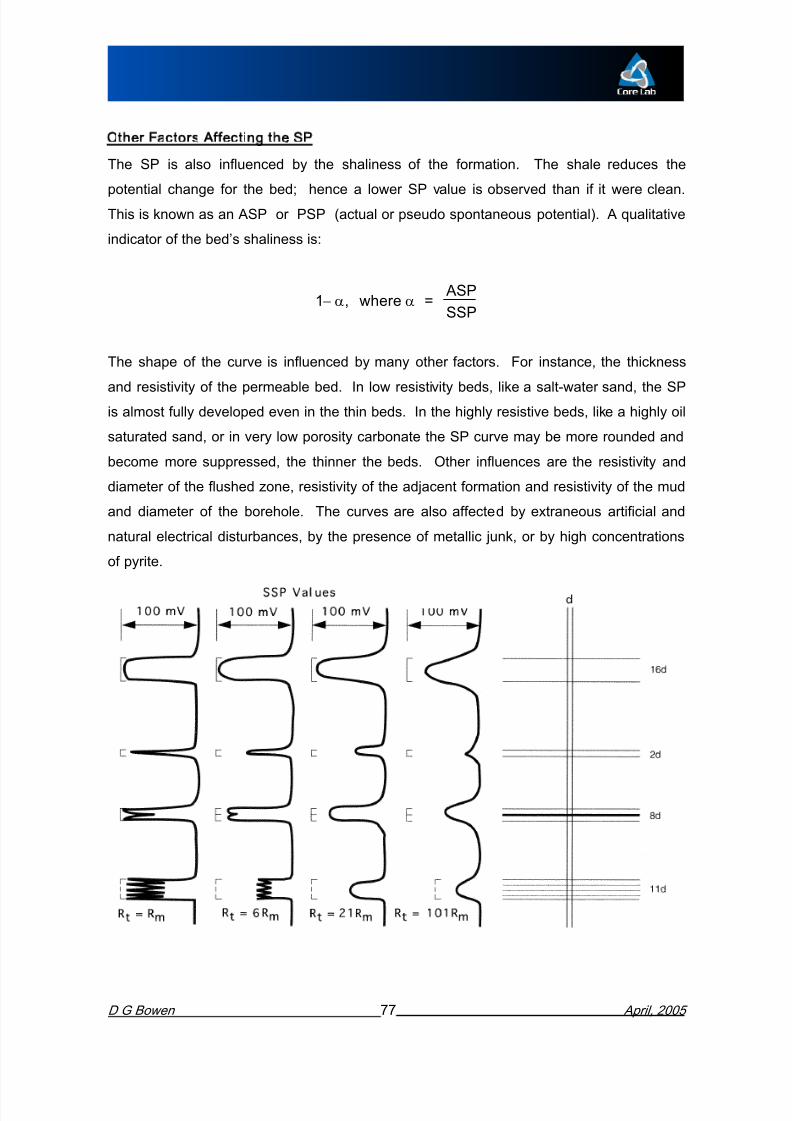
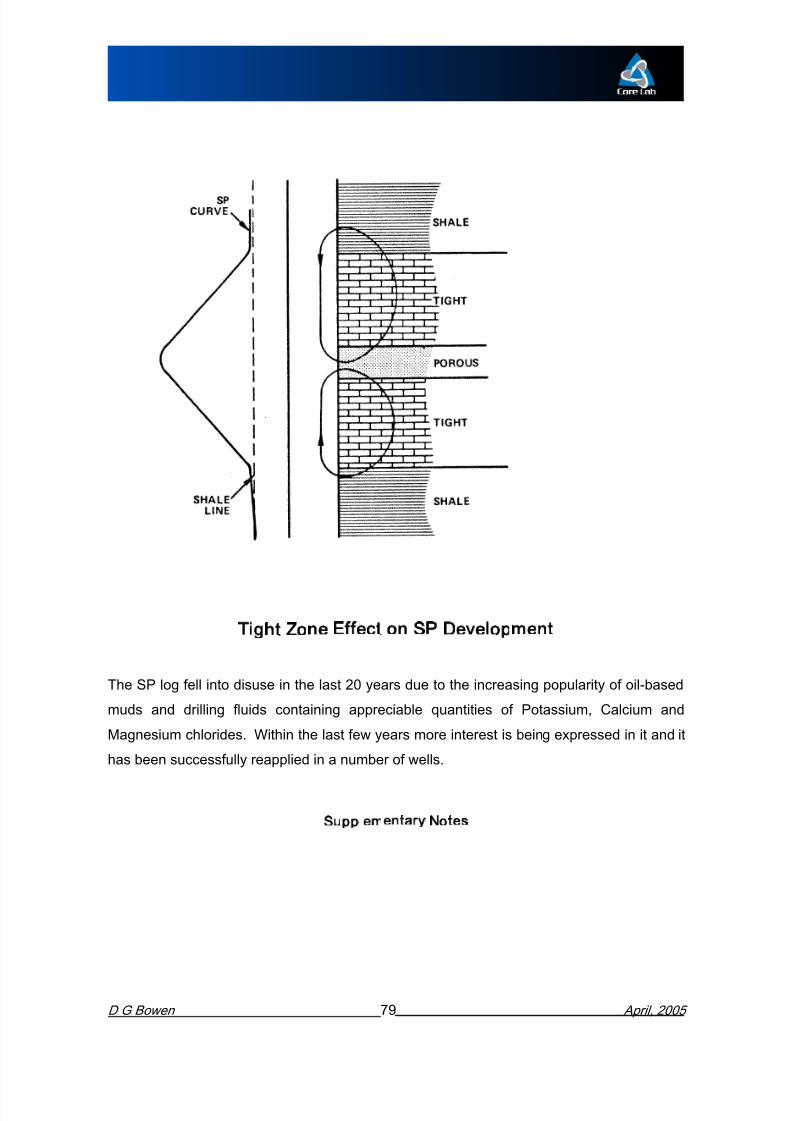
The shape of the curve is influenced by many other factors. For instance, the thickness
and resistivity of the permeable bed. In low resistivity beds, like a salt-water sand, the SP
is almost fully developed even in the thin beds. In the highly resistive beds, like a highly oil
saturated sand, or in very low porosity carbonate the SP curve may be more rounded andbecome more suppressed, the thinner the beds. Other influences are the resistivity and
diameter of the flushed zone, resistivity of the adjacent formation and resistivity of the mud
and diameter of the borehole. The curves are also affected by extraneous artificial and
natural electrical disturbances by the presence of metallic junk or by high concentrations

8/10/2019 Formation Evaluation and Petrophysics Mr D. G. Bowen
http://slidepdf.com/reader/full/formation-evaluation-and-petrophysics-mr-d-g-bowen 84/225
The Effect of R t/R m on The SP
USES OF THE SP
The SP curve is used as a correlating tool, to help identify lithology, and, in some areas, to
help determine depositional environment. The inflection points define the bed boundaries;
therefore, the bed thickness can also be determined. Beds having the slightest
permeability are detected by a build-up of the SP when there is a salinity contrast. If a bed
is shaly, the shaliness can be qualitatively determined.
If the resistivity of the formation water is unknown, the SP curve can often be used to
calculate Rw . The Rw can only be determined from a clean, thick permeable bed,
although corrections can be made for thickness and other factors. The equation for a thick,
non-shaly bed is:
SSP = - (61 + .133 T ) logR
R0 (F)
mfeq
weq
8/10/2019 Formation Evaluation and Petrophysics Mr D. G. Bowen
http://slidepdf.com/reader/full/formation-evaluation-and-petrophysics-mr-d-g-bowen 85/225

8/10/2019 Formation Evaluation and Petrophysics Mr D. G. Bowen
http://slidepdf.com/reader/full/formation-evaluation-and-petrophysics-mr-d-g-bowen 86/225

8/10/2019 Formation Evaluation and Petrophysics Mr D. G. Bowen
http://slidepdf.com/reader/full/formation-evaluation-and-petrophysics-mr-d-g-bowen 87/225
SUMMARY SHEET OF THE SP LOG
· SP is generated by the diffusion of ions through two solutions of different salinities
separated by a shale membrane and a liquid-junction membrane.
· SP is measured by recording the change in potential between an electrode being pulled
up hole in a sonde, and a grounded electrode at the surface. A conductive mud isrequired.
· There is no set zero line; however, there is a shale base line from which the SSP or
ASP is measured.
· The inflection points of the SP curve represent the bed boundaries.
· The magnitude and direction of the SP curve is controlled by three major factors:
1) Salinity of the mud filtrate, Rmf

8/10/2019 Formation Evaluation and Petrophysics Mr D. G. Bowen
http://slidepdf.com/reader/full/formation-evaluation-and-petrophysics-mr-d-g-bowen 88/225
SUMMARY SHEET OF THE SP LOG (Continued)
· Conditions under which the borehole is not the dominant resistance:
1) Very thin sand or shale beds
2) Highly resistive beds
3) Very deep filtrate invasion or excessively enlarged borehole4) Low resistivity muds
· Direction of Deflection
ConditionNegative (to left) Rmf > Rw (Salty Formation Water)
Positive (to right) Rmf < Rw (Fresh Formation
Water)
No deflection R f = R
8/10/2019 Formation Evaluation and Petrophysics Mr D. G. Bowen
http://slidepdf.com/reader/full/formation-evaluation-and-petrophysics-mr-d-g-bowen 89/225
6) Calculate Rw via the equation
SSP = - (61 + .133T) logR
Rmfeq
weq
Chapter 2

8/10/2019 Formation Evaluation and Petrophysics Mr D. G. Bowen
http://slidepdf.com/reader/full/formation-evaluation-and-petrophysics-mr-d-g-bowen 90/225
p
Section 3
Porosity Logs
STUDY GUIDE QUESTIONS ON THE ACOUSTIC LOGS

8/10/2019 Formation Evaluation and Petrophysics Mr D. G. Bowen
http://slidepdf.com/reader/full/formation-evaluation-and-petrophysics-mr-d-g-bowen 91/225
1. What two types of waves are generated by the acoustic tool?
2. Which wave is used in porosity calculation?
3. Does it matter what is filling the borehole, i.e., gas or water-base mud?
4. What is cycle skipping? Where can it happen?
5. How far in does the tool read? What is the spacing between the transmitter and the
receiver in a typical BHC mode?
6. How does velocity relate to transit time?
7. What is the equation for porosity?
8/10/2019 Formation Evaluation and Petrophysics Mr D. G. Bowen
http://slidepdf.com/reader/full/formation-evaluation-and-petrophysics-mr-d-g-bowen 92/225
ACOUSTIC LOGS
INTRODUCTION

8/10/2019 Formation Evaluation and Petrophysics Mr D. G. Bowen
http://slidepdf.com/reader/full/formation-evaluation-and-petrophysics-mr-d-g-bowen 93/225
INTRODUCTION
The passing of acoustic waves through the subsurface has been used for a long time to
help detect subsurface structures. This idea was then applied to reading acoustic
velocities versus depth in a borehole. The acoustic readings were extended to include
calculation of primary and secondary porosity as well as lithology determination.
BASIC ACOUSTIC TOOL PRINCIPLES
Two waves are set off when an acoustic wave is generated. These are a compressional
(P-wave) and the shear (S-wave). The P-wave runs parallel to the direction of
propagation and travels faster than any other wave type. This compressional wave is
referred to as a first arrival wave. The shear-wave moves perpendicular to the direction of
propagation. Shear waves can be transmitted through solids, but not liquids or gases. A
transducer in the downhole tool, produces acoustic wave pulses at a rate of 10 to 20 timesper second. The pulses travel through the borehole fluid, and are reflected and transmitted
into the formation at the borehole formation interface. They travel along the formation
parallel to the borehole, creating secondary waves, Stoneley Waves, which emit energy
back into the borehole. A receiver spaced some distance (i.e. 1-3 feet) below the
The Array Sonic was developed in the mid 1980s, when new piezo-electric transponders
made it possible to detect both P waves and the shear (S) waves The Array tool has a

8/10/2019 Formation Evaluation and Petrophysics Mr D. G. Bowen
http://slidepdf.com/reader/full/formation-evaluation-and-petrophysics-mr-d-g-bowen 94/225
made it possible to detect both P waves and the shear (S) waves. The Array tool has a
number of modes in which it can acquire data. The entire acoustic wave-form can be
captured. In a fast formation the toll can detect P, S and Stoneley waves. In a slow
formation the Stoneley waves can help derive the equivalent S wave velocity.
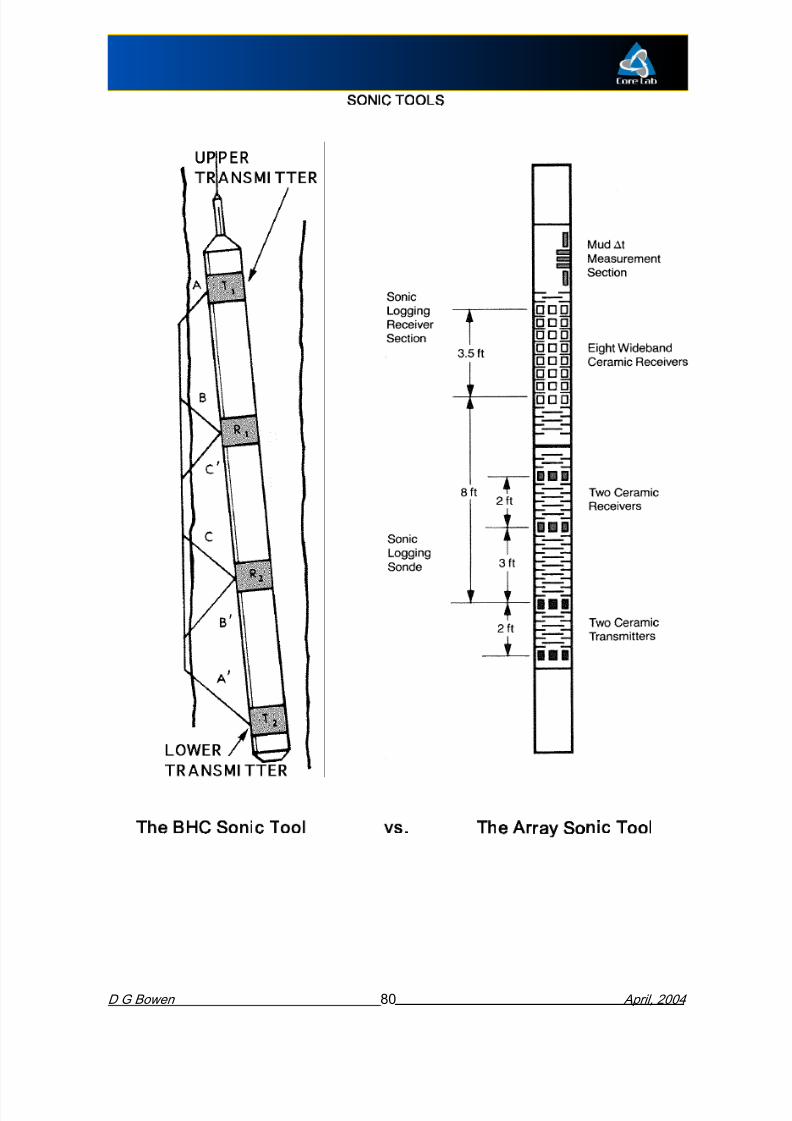
The Array can be run as a short spaced, 3 - 5 foot and a long-spaced 5 - 7, 8 - 10 & 10 - 12
foot depth-derived borehole compensated sonic log in open hole, and as a 3 foot CBL and
5 foot VDL in cased hole. The log is capable of providing 6 inch vertical resolution of thinbed transit times. It automatically compensates for cycle skipping and deletes all skipped
values.
From the wave-train analysis, using slowness-time coherence and a semblance algorithm,
arrivals that are coherent across all 8 detectors provide the basis of transit times for each
waveform, P, S, and Stoneley. This data can be used in rock mechanical evaluations of
the borehole stress regime and to create synthetic seismograms.
THE DIPOLE SONIC IMAGER
The DSI tool represents an improvement on some of the qualities of the Array Sonic
8/10/2019 Formation Evaluation and Petrophysics Mr D. G. Bowen
http://slidepdf.com/reader/full/formation-evaluation-and-petrophysics-mr-d-g-bowen 95/225
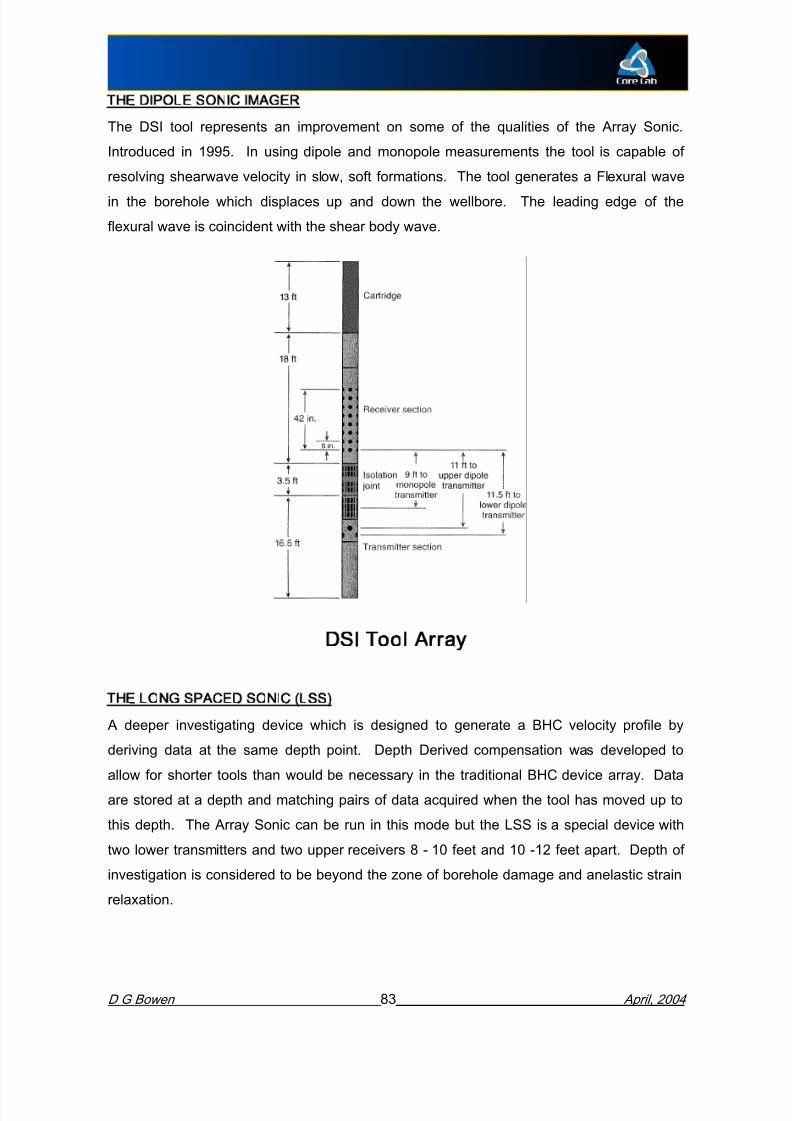
The DSI tool represents an improvement on some of the qualities of the Array Sonic.
Introduced in 1995. In using dipole and monopole measurements the tool is capable of
resolving shearwave velocity in slow, soft formations. The tool generates a Flexural wave
in the borehole which displaces up and down the wellbore. The leading edge of the
flexural wave is coincident with the shear body wave.

8/10/2019 Formation Evaluation and Petrophysics Mr D. G. Bowen
http://slidepdf.com/reader/full/formation-evaluation-and-petrophysics-mr-d-g-bowen 96/225
LSS V C i l BHC S i M d f O i
8/10/2019 Formation Evaluation and Petrophysics Mr D. G. Bowen
http://slidepdf.com/reader/full/formation-evaluation-and-petrophysics-mr-d-g-bowen 97/225
EFFECT OF MATRIX TRANSIT TIME
8/10/2019 Formation Evaluation and Petrophysics Mr D. G. Bowen
http://slidepdf.com/reader/full/formation-evaluation-and-petrophysics-mr-d-g-bowen 98/225
The type of matrix which the sonic wave travels through is very important. Sandstones,
limestones, and dolomites all have different matrix transit times ( Dtm ). Average Dtm valuesare available in logging company manuals to be used in Wyllie’s “time-average” equation,
however, it is rare a formation is composed of one mineral or rock type. Often impurities
such as calcite in sandstone, anhydrite in dolomite, etc. are found; these alter the matrix
transit time. If the actual lithology is known, perhaps a transit time could be estimated.
However, the best way to determine the formation’s matrix travel time is to measure Dtm ina laboratory on a representative core sample. Remember, the average times in the logging
manuals are just that, averages. They do not take into account the variability introduced by
changes in pore geometry, cementation, compaction, or complex lithologies.
EFFECT OF VUGS AND FRACTURES
When a sonic P wave is transmitted, it will take the quickest path to the receiver. It
therefore never sees secondary isolated vuggy or fracture porosity. The acoustic logs
generally do not detect secondary porosity. As a rule of thumb, the amount of secondary
porosity can be estimated by subtracting the sonic porosity from a total porosity (neutron or
effectively average the two logs’ responses; a percentage of the two rock types present (if
the matrix pair known, i.e., limestone, sandstone) plus porosity can be read. Some types
8/10/2019 Formation Evaluation and Petrophysics Mr D. G. Bowen
http://slidepdf.com/reader/full/formation-evaluation-and-petrophysics-mr-d-g-bowen 99/225
p , , , ) p p y yp
of formation or lithologies can be identified by the magnitude of the Dt reading. For
example,
an acoustic log being run through salt or anhydrite will show high transit times. This can be
a tip-off that these minerals are present. Because of the varied effects of lithologies on the
acoustic log, another empirical porosity equation has been proposed.
EMPIRICAL RAYMER-HUNT-GARDNER EQUATION Because of the non-rigorous nature of the Wyllie time average equation and errors
introduced by the selection of improper matrix, or fluid, velocities, this empirical equation
has gained favour,
sonic f = C
×
Dt log - Dtma ( )
Dt log,
where the empirical constant, C, has a range from 0.624 to 0.7. Currently the value 0.67
has the highest appropriateness. When gas is encountered the value of C should be 0.6.
The equation has the most applicability in fairly good porosity sandstones
100 = transit time in compactedh l m /ft
8/10/2019 Formation Evaluation and Petrophysics Mr D. G. Bowen
http://slidepdf.com/reader/full/formation-evaluation-and-petrophysics-mr-d-g-bowen 100/225
shale, msec/ft
The compaction coefficient varies from a value of 0.8 which is used for Mesozoic shales toa high of 1.2 in the US Gulf Coast and SE Asia. If c or Cp is unknown, Cp can be
determined using Shlumberger chart Por-3 via cross-plots of density and acoustic logs in
adjacent clean, water sands or with a neutron-acoustic log cross-plot in shaly water sands.
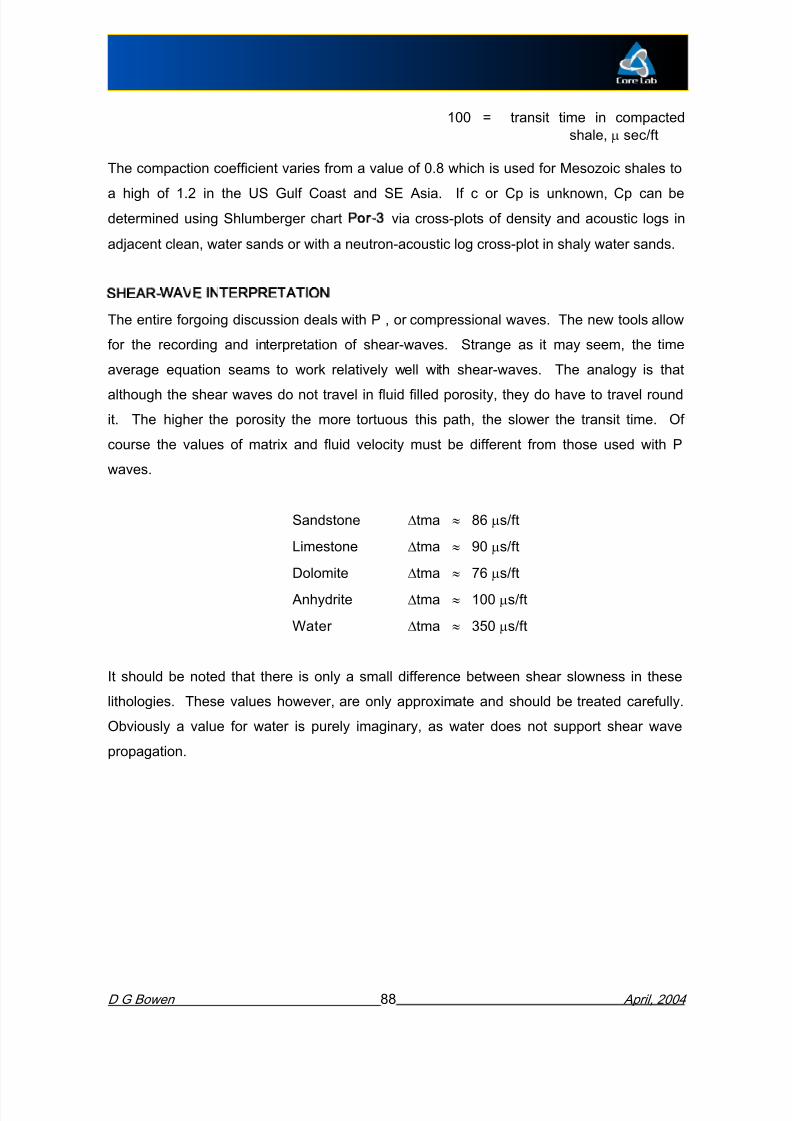
SHEAR-WAVE INTERPRETATION The entire forgoing discussion deals with P , or compressional waves. The new tools allow
for the recording and interpretation of shear-waves. Strange as it may seem, the time
average equation seams to work relatively well with shear-waves. The analogy is that
although the shear waves do not travel in fluid filled porosity, they do have to travel round
it. The higher the porosity the more tortuous this path, the slower the transit time. Of
course the values of matrix and fluid velocity must be different from those used with P
waves.
Sandstone Dtma » 86 ms/ft

8/10/2019 Formation Evaluation and Petrophysics Mr D. G. Bowen
http://slidepdf.com/reader/full/formation-evaluation-and-petrophysics-mr-d-g-bowen 101/225
SUMMARY SHEET OF THE ACOUSTIC LOG
· The three waves of importance produced downhole are the compressional (P-wave)
which arrives first, the Shear (S-wave) and the Stoneley Wave .
· The acoustic log records the first arrival wave, P-wave as the porosity signal.
· For the tools to work, there must be a liquid in the borehole. This transmits the wave
from the tool to the formation.
· Cycle skip occurs in the BHC when the second receiver does not receive the initialwave and is tripped by arrival of a later wave. Consequently, an erroneously long
transit time is measured. This can occur in gas saturated formations, fractured
formations, unconsolidated formations or rugose boreholes.
8/10/2019 Formation Evaluation and Petrophysics Mr D. G. Bowen
http://slidepdf.com/reader/full/formation-evaluation-and-petrophysics-mr-d-g-bowen 102/225
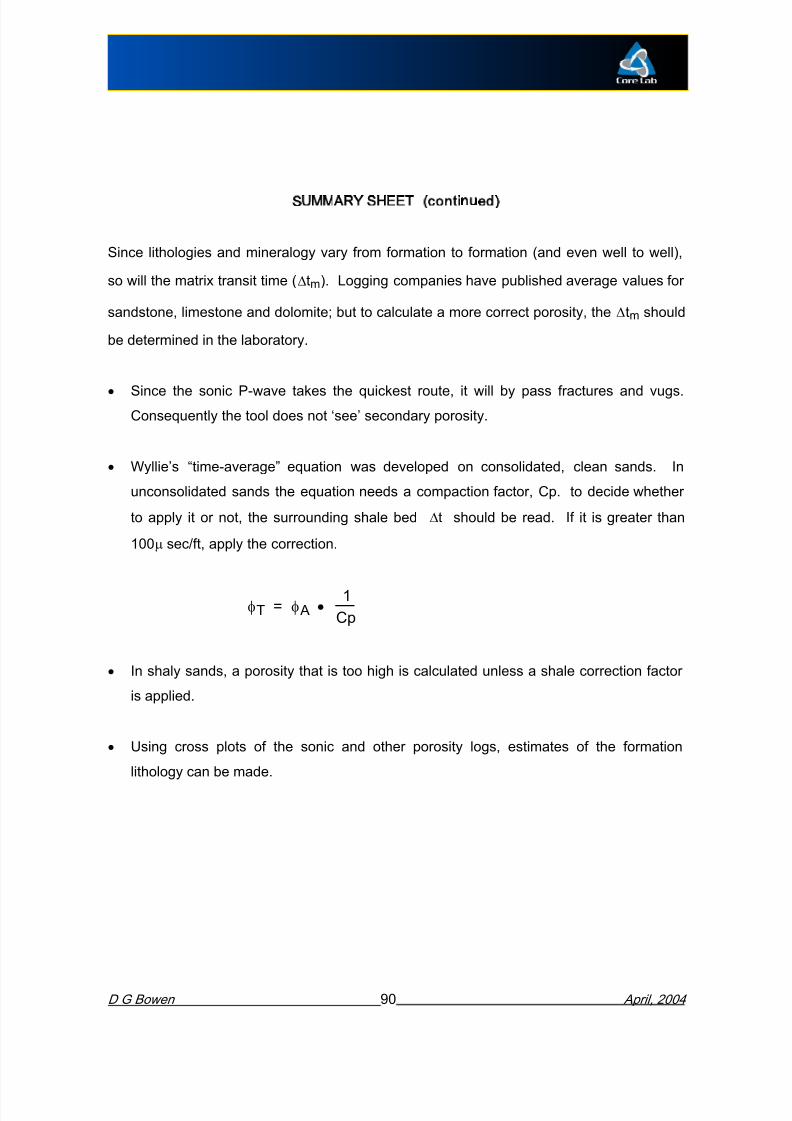
SUMMARY SHEET cont inued)
Since lithologies and mineralogy vary from formation to formation (and even well to well),
so will the matrix transit time ( Dtm ). Logging companies have published average values for
sandstone, limestone and dolomite; but to calculate a more correct porosity, the Dtm should
be determined in the laboratory.
· Since the sonic P-wave takes the quickest route, it will by pass fractures and vugs.
Consequently the tool does not ‘see’ secondary porosity.
· Wyllie’s “time-average” equation was developed on consolidated, clean sands. In
unconsolidated sands the equation needs a compaction factor, Cp. to decide whether
to apply it or not, the surrounding shale bed Dt should be read. If it is greater than
STUDY GUIDE QUESTIONS ON THE DENSITY LOG

8/10/2019 Formation Evaluation and Petrophysics Mr D. G. Bowen
http://slidepdf.com/reader/full/formation-evaluation-and-petrophysics-mr-d-g-bowen 103/225
1) What does the density log measure?
2) Is it a pad device?
3) What is the equation for porosity using the density log?
4) If a grain density too high is used, will a porosity that is too high, or too low be
calculated?
5) If the fluid density is not corrected in a gas zone, will a porosity too high or too low becalculated?
THE DENSITY LOG

8/10/2019 Formation Evaluation and Petrophysics Mr D. G. Bowen
http://slidepdf.com/reader/full/formation-evaluation-and-petrophysics-mr-d-g-bowen 104/225

8/10/2019 Formation Evaluation and Petrophysics Mr D. G. Bowen
http://slidepdf.com/reader/full/formation-evaluation-and-petrophysics-mr-d-g-bowen 105/225
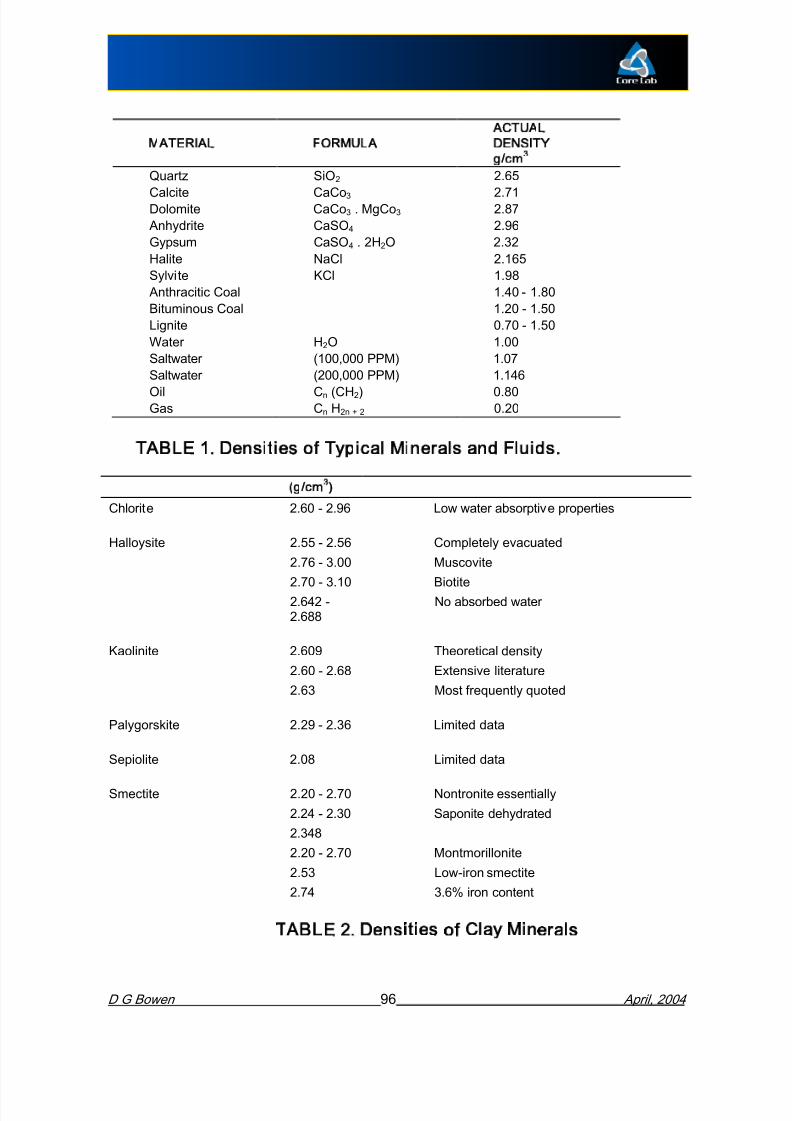
Quartz 1.806
Magnetite 22.080
8/10/2019 Formation Evaluation and Petrophysics Mr D. G. Bowen
http://slidepdf.com/reader/full/formation-evaluation-and-petrophysics-mr-d-g-bowen 106/225
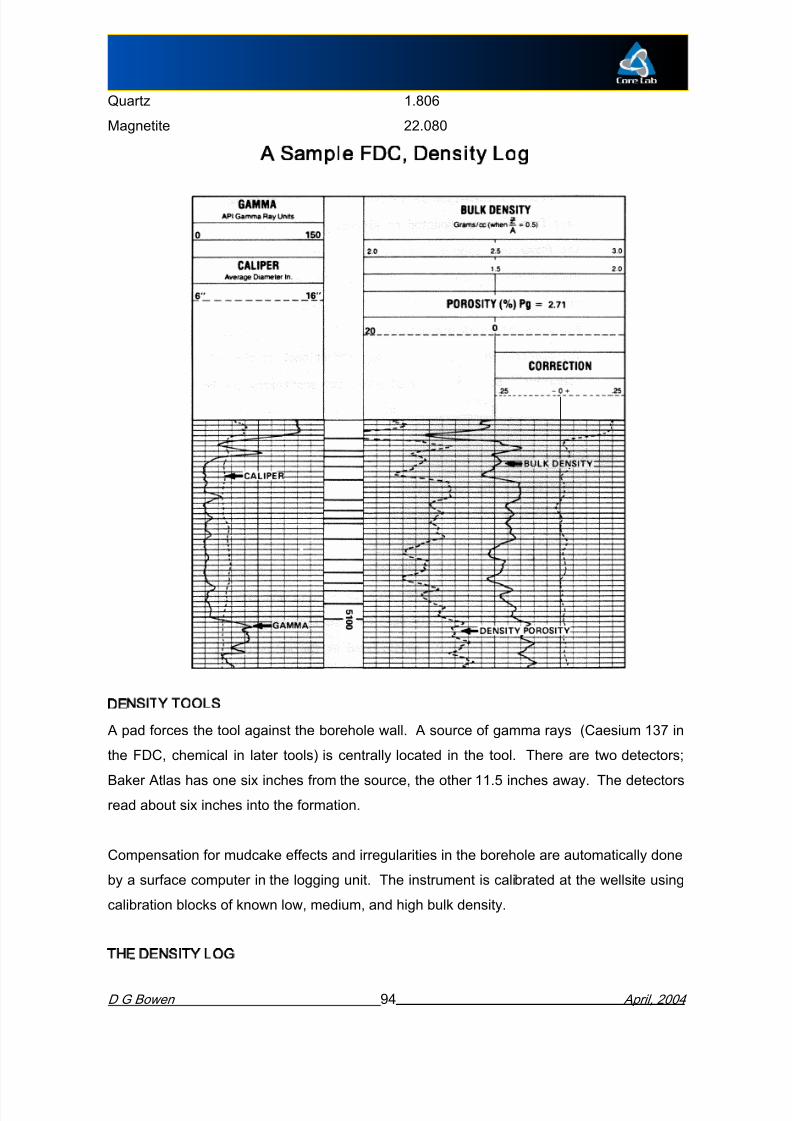
A Sample FDC, Density Log
The bulk density is reported on the far right-hand grid on a linear scale. If the grain density
and fluid density are known, porosity can be plotted. The corrections made for mudcake
8/10/2019 Formation Evaluation and Petrophysics Mr D. G. Bowen
http://slidepdf.com/reader/full/formation-evaluation-and-petrophysics-mr-d-g-bowen 107/225
and borehole effects are also printed along side the density log, but use a different scale.
When a LDL tool is used there is and additional Pe curve on the log (PEF). This is
calibrated in Pe units , or Barns/ electron and is usually on scale of 1 - 10.
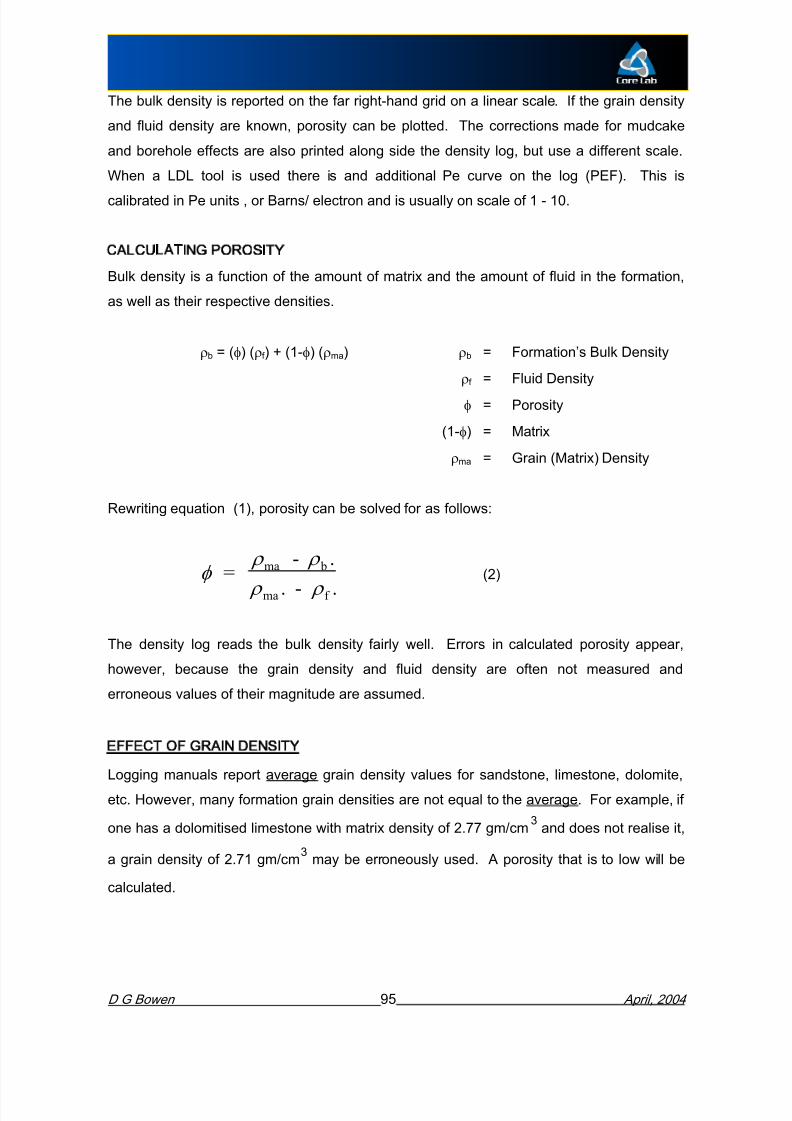
CALCULATING POROSITY
Bulk density is a function of the amount of matrix and the amount of fluid in the formation,
as well as their respective densities.
r b = (f ) (r f ) + (1-f ) (r ma ) r b = Formation’s Bulk Density
r f = Fluid Density
f = Porosity
(1-f ) = Matrix r ma = Grain (Matrix) Density
Rewriting equation (1), porosity can be solved for as follows:
8/10/2019 Formation Evaluation and Petrophysics Mr D. G. Bowen
http://slidepdf.com/reader/full/formation-evaluation-and-petrophysics-mr-d-g-bowen 108/225

8/10/2019 Formation Evaluation and Petrophysics Mr D. G. Bowen
http://slidepdf.com/reader/full/formation-evaluation-and-petrophysics-mr-d-g-bowen 109/225
If the neutron porosity is available, Baker Atlas presents the following equation to get a true
porosity in a gas zone:
8/10/2019 Formation Evaluation and Petrophysics Mr D. G. Bowen
http://slidepdf.com/reader/full/formation-evaluation-and-petrophysics-mr-d-g-bowen 110/225
f = GD - BD + fGD
N
EFFECT OF SHALE
The presence of shale can affect the calculated porosity. The density of shale can vary
from a low of 2.20 gm/cm3
to as high as 2.85 gm/cm3
. However, when the density of theshale is close to 2.65 gm/cm 3, the tool works well. Consequently, in that case, porosity
calculated in shaly sands would be reliable. Quite often, though, the shale densities are
lower-especially at shallower depths. If this is not accounted for, a porosity that is too high
will be calculated. The effect of the shale also depends on whether it is dispersed or exists
as laminations. Dispersed shale typically has lower densities than the surrounding shalebeds. To correct for the effect of shale, two somewhat elaborate equations have been
developed to represent dispersed shale and laminated shale. These will not be discussed
at this time; however, there is a q factor used that is derived using sonic and density
porosity.
EFFECT OF PRESSURE
Increase in depth usually means increase in compaction which causes increase in the bulk

8/10/2019 Formation Evaluation and Petrophysics Mr D. G. Bowen
http://slidepdf.com/reader/full/formation-evaluation-and-petrophysics-mr-d-g-bowen 111/225
density of shales. This trend, however, is reversed in overpressured zones.
Abnormally high formation pressures are sometimes created due to a sealing off of the
formation and excess water is prevented from escaping. This results in high fluid pressure
which can exceed normal formation pressure. Shales in contact with over pressured
formations contain excess water, are under-compacted, and their bulk densities are lower
than normal. Consequently, the density log can be helpful in predicting the approach to
overpressured zones.
Supplementary Notes
SUMMARY SHEET OF THE DENSITY LOG
8/10/2019 Formation Evaluation and Petrophysics Mr D. G. Bowen
http://slidepdf.com/reader/full/formation-evaluation-and-petrophysics-mr-d-g-bowen 112/225
· A source centrally located on the tool emits gamma rays into the formation. As the
gamma rays enter, they are slowed down and scattered or absorbed. The intensity of
the gamma rays near the detector is recorded.
· As porosity decreases, which means the denser the formation, an increase in gamma
rays scattering and absorption occurs; therefore fewer gamma rays are detected. So
the amount of scattering or absorption relates to the formation density which relates
to porosity.
· The tool is pressed up against the formation by a pad.
· f = r ma - r b
r ma - r f
· The rule of thumb is: If a grain density that is too high is used, a porosity that is too
· In a sand containing sodium montmorillonite the average grain density probably
should be lowered. Otherwise, a porosity that is too high will be calculated.

8/10/2019 Formation Evaluation and Petrophysics Mr D. G. Bowen
http://slidepdf.com/reader/full/formation-evaluation-and-petrophysics-mr-d-g-bowen 113/225
· The q factor is used in different shaly sand water saturation equations and also is
used as a permeability indicator:
q = f S - f D f S
· Typically as depth increases so will bulk density. In the overpressured zones,
however, the bulk density of the shales are much lower than expected due to excess
water trapped in the minute pores. This reversal in the trend, if recorded and noticed
earlier enough, can be used to predict abnormally high pressured zones.
STUDY GUIDE QUESTIONS ON THE NEUTRON LOGS
8/10/2019 Formation Evaluation and Petrophysics Mr D. G. Bowen
http://slidepdf.com/reader/full/formation-evaluation-and-petrophysics-mr-d-g-bowen 114/225
1. Generally, how does the neutron log sense porosity?
2. Name the three basic types of neutron logs?
3. Which logs require liquid? Which logs can be run in cased holes?
4. How are the neutron tools calibrated?
5. How are the neutron logs presented?
NEUTRON LOG
INTRODUCTION
8/10/2019 Formation Evaluation and Petrophysics Mr D. G. Bowen
http://slidepdf.com/reader/full/formation-evaluation-and-petrophysics-mr-d-g-bowen 115/225
INTRODUCTION
Neutrons emitted from a radioactive source are categorised into three general groups
according to their energy:
1. High energy neutrons, which are fast neutrons
2. Medium energy neutrons, which are epithermal neutrons
3. Low energy neutrons, which are thermal neutrons
The logging industry has different tools which respond to different types of these neutrons.
PRINCIPLE
Neutrons are continuously emitted from a source mounted on a down hole tool or device,
often known as a ‘sonde’. These neutrons collide in the formation and lose energy. They
lose the most energy when a nucleus of equal mass is struck. Neutrons have almost equal
mass to protons and only one nucleus consists of a single proton, hydrogen.
Consequently, the amount of neutrons slowed down depends mostly upon the amount of
present; therefore, more hydrogen is present meaning a higher porosity. This tool is not
used anymore.
8/10/2019 Formation Evaluation and Petrophysics Mr D. G. Bowen
http://slidepdf.com/reader/full/formation-evaluation-and-petrophysics-mr-d-g-bowen 116/225
The Sidewall Neutron (SNP) is a pad device which detects epithermal neutrons. It has a
detector 16 inches from the source on a pad, which is pressed up against the borehole
wall. The tool can be run in liquid or air-filled uncased holes. The SNP takes the API count
rates, automatically corrects for any borehole irregularities, and then prints the reading in
limestone porosity units. The log senses more than one foot into the formation (depending
upon the hydrogen content) and vertically averages about every 1 1/2 feet. This tool workswell in complex lithologies. The advantages of the SNP over the GNT are: 1) borehole
effects are minimised, 2) most corrections required are automatically performed, 3)
sensing epithermal neutrons avoids effects of strong thermal neutron absorbers, such as
chlorine and Boron. However, this tool is only rarely used these days.
The Compensated Neutron Log (CNL) has a strong (16 Curie) neutron source and will
detect the amount of thermal neutrons not yet captured by the formation. Two detectors
sufficiently spaced apart (1-2 feet) sense the thermal neutron concentration. The readings
are ratioed, corrections automatically applied, and a compensated porosity curve is
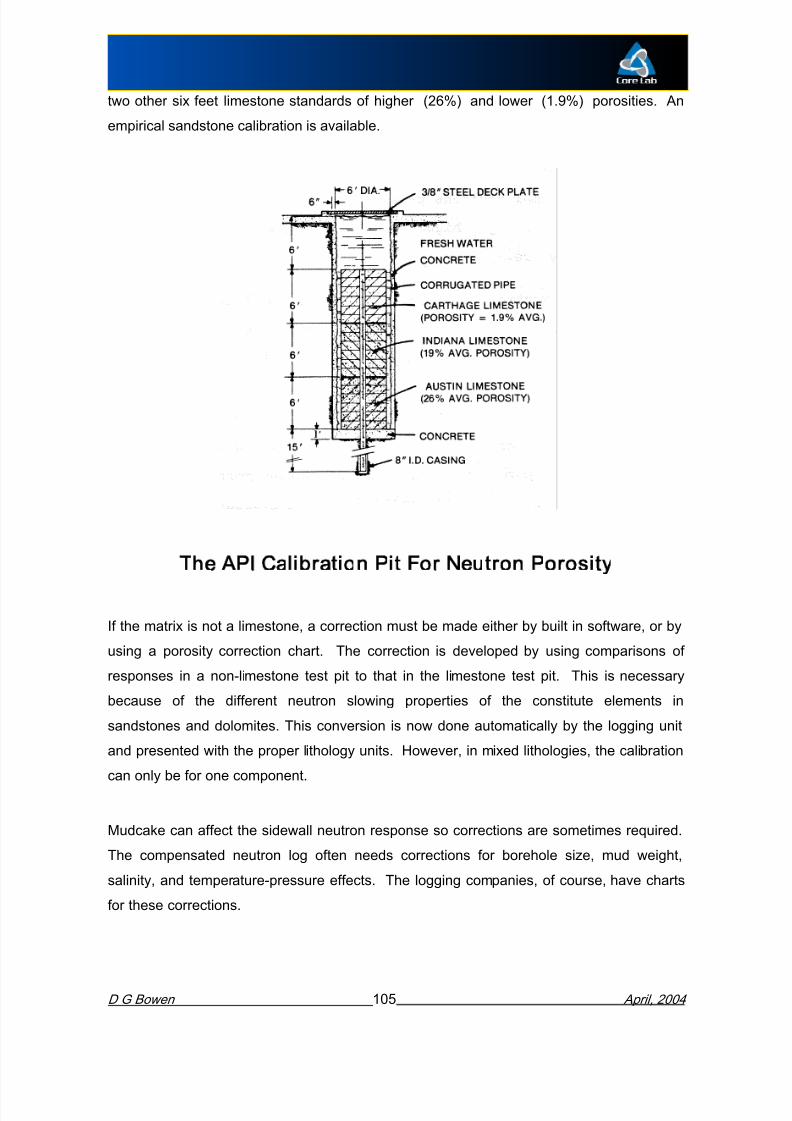
two other six feet limestone standards of higher (26%) and lower (1.9%) porosities. An
empirical sandstone calibration is available.
8/10/2019 Formation Evaluation and Petrophysics Mr D. G. Bowen
http://slidepdf.com/reader/full/formation-evaluation-and-petrophysics-mr-d-g-bowen 117/225
8/10/2019 Formation Evaluation and Petrophysics Mr D. G. Bowen
http://slidepdf.com/reader/full/formation-evaluation-and-petrophysics-mr-d-g-bowen 118/225
A Neutron Densi ty Log Example
8/10/2019 Formation Evaluation and Petrophysics Mr D. G. Bowen
http://slidepdf.com/reader/full/formation-evaluation-and-petrophysics-mr-d-g-bowen 119/225
INTERPRETATION The neutron log is used to identify porous formations and determine their porosity,
distinguish gas from oil or water zones, and when used with other logs, help identify the
lithology. The log works well in carbonates because the clay content is usually low and it
has very good resolution in the lower rang of porosities typically encountered in a
carbonate.
Effects of Hydrocarbons
The tool response depends upon how much hydrogen is present; this is known as the
hydrogen index. The hydrogen index of fresh water is 1.0. Most oils have a hydrogen
index close to one, except light oils and gas; they have lower values due to a lower
hydrogen content. Consequently, the log estimates too low of a porosity in zones
containing gas or light oil. As will be mentioned next, this can be masked by the presence
of adsorbed water in clays.

8/10/2019 Formation Evaluation and Petrophysics Mr D. G. Bowen
http://slidepdf.com/reader/full/formation-evaluation-and-petrophysics-mr-d-g-bowen 120/225

8/10/2019 Formation Evaluation and Petrophysics Mr D. G. Bowen
http://slidepdf.com/reader/full/formation-evaluation-and-petrophysics-mr-d-g-bowen 121/225
GEOCHEMICAL LOGS
GEOCHEMICAL TOOLS GLT)

8/10/2019 Formation Evaluation and Petrophysics Mr D. G. Bowen
http://slidepdf.com/reader/full/formation-evaluation-and-petrophysics-mr-d-g-bowen 122/225
GEOCHEMICAL TOOLS, GLT)
By combining Neutron sources of different energy and the spectral gamma response, it has
become possible to derive the elemental contribution to the activated gamma ray energy
emitted from the formation. At present 12 elements can be derived from their spectra,
these are; aluminium, calcium, chlorine, gadolinium, hydrogen, iron, potassium, silicon,
sulphur, thorium , titanium ,and uranium.
A chemical ‘cook-book’ is applied, assuming that the elements are present as their oxides
and that the oxides concentrations in weight percent sum to unity. Aluminium is derived
from delayed neutron activation analysis, using a californium - 252 source, potassium ,
thorium and uranium are inferred from the relative abundance of their radio-isotopes,
detected by the passive NGS/NGT. The other elements are spectrally derived from thegamma decay after a burst of 14 MeV neutrons. Magnesium concentrations can be
inferred from the measured P e , when compared to a derived P e from the elemental
analysis. Carbon concentrations can also be derived from the carbon-oxygen ratios
d b b i l i lli i ili i h RST i
SUMMARY ON THE NEUTRON LOG

8/10/2019 Formation Evaluation and Petrophysics Mr D. G. Bowen
http://slidepdf.com/reader/full/formation-evaluation-and-petrophysics-mr-d-g-bowen 123/225
· The neutron tool emits neutrons which are slowed down and captured. Different tools
sense wither the amount of neutrons present or the gamma rays emitted after
collision. The quantity detected is dependent upon the amount of hydrogen present.
The amount of hydrogen is dependent upon how much liquid-filled porosity is in the
formation.
· The four main tools are:
GNT - The old conventional neutron log which senses thermal neutrons
SNP - The Sidewall Neutron Log, which is a pad device, can be run in
either liquid or air-filled holes, but it can only be run in uncasedholes.
CNL - The Compensated Neutron Log has two detectors that average
the responses which corrects for borehole irregularities. It has a deep
equivalent porosity calculated in the logging unit’s computer and then plotted on a
linear scale.

8/10/2019 Formation Evaluation and Petrophysics Mr D. G. Bowen
http://slidepdf.com/reader/full/formation-evaluation-and-petrophysics-mr-d-g-bowen 124/225
SUMMARY ON THE NEUTRON LOG continued)
· The neutron log senses porosity fairly well in totally liquid-filled (i.e., not gas or light
oil) formations. Due to less hydrogen present in gas zones, the neutron logs read
low.
· This anomalous behaviour can be easily detected when a density-neutron log tool is
run and the data is plotted on the same scale. The neutron log will skirt to the right
and the density log will skirt to the left. When they meet again marks the gas-liquid
contact.
· There are different methods, to obtain a porosity corrected for the gas effect. Two
popular methods are:

8/10/2019 Formation Evaluation and Petrophysics Mr D. G. Bowen
http://slidepdf.com/reader/full/formation-evaluation-and-petrophysics-mr-d-g-bowen 125/225
NUCLEAR MAGNETIC RESONANCE, NMR
NMR, or Nuclear Magnetic Resonance was first investigated as a petrophysics tool by
‘Turk’ Timur, at Chevron research, in 1954. However, despite good bench-top apparatus,
which enclosed the sample in a magnetic field, the inverse problem of the field beingenclosed by the sample proved much more difficult to deal with. The earliest down-hole
tools were introduced in 1960 and were not really a success, being phased out of service in
the 1980’s. However, recent advances in the quality of signal generators and detectors
and the use pulse sequences have resulted in a new generation of tools that are, in the
1990s, the most popular in the business.
The NMR Principle
Many nuclei of atoms have a magnetic moment and they
behave like miniature spinning magnets in the earth’s
the field, the precessing nuclei begin to dephase, i.e. precess at slightly different
frequencies. As they lose their synchronisation the signal generated decays. The decay
time is called T 2 and is petrophysically very important
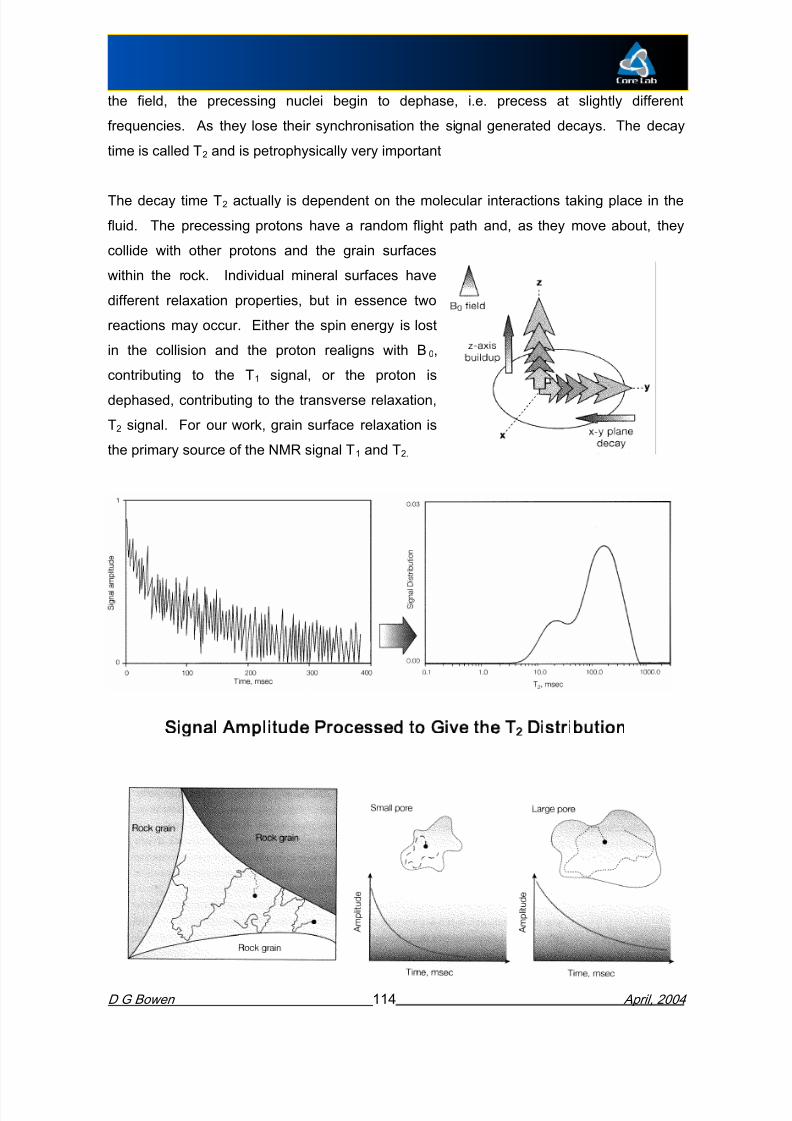
8/10/2019 Formation Evaluation and Petrophysics Mr D. G. Bowen
http://slidepdf.com/reader/full/formation-evaluation-and-petrophysics-mr-d-g-bowen 126/225
The decay time T 2 actually is dependent on the molecular interactions taking place in the
fluid. The precessing protons have a random flight path and, as they move about, they
collide with other protons and the grain surfaces
within the rock. Individual mineral surfaces have
different relaxation properties, but in essence two
reactions may occur. Either the spin energy is lost
in the collision and the proton realigns with B 0,
contributing to the T 1 signal, or the proton is
dephased, contributing to the transverse relaxation,
T2 signal. For our work, grain surface relaxation is
the primary source of the NMR signal T 1 and T 2.
Grain Surface Relaxation and Pore Size Dist ribution

8/10/2019 Formation Evaluation and Petrophysics Mr D. G. Bowen
http://slidepdf.com/reader/full/formation-evaluation-and-petrophysics-mr-d-g-bowen 127/225
As a clear relationship exists between the T2 distribution and the pore-size distribution
there are some corollaries with other petrophysical properties.

8/10/2019 Formation Evaluation and Petrophysics Mr D. G. Bowen
http://slidepdf.com/reader/full/formation-evaluation-and-petrophysics-mr-d-g-bowen 128/225
NMR Permeability The relationship between pore size distributions and permeability was investigated by
Burdine in 1953. Following from his work Purcell and others also related capillary held
water saturation to permeability. Kenyon (1988) and Prammer (1994) have proposed
models. The latter of these is called the Timur/Coates formula. The formulae are;
k = a f 4 ( ,log T 2 )2
, (Kenyon),
where k is the permeability in millidarcies, f is the fractional porosity, a is a formation
dependent constant, typically 4 mD/(ms) 2 for Sandstone and 0.4 mD/(ms) 2 for carbonates,
and
k = ¢a f 4 FFI
BFV èç ø÷2
, (Timur/Coates’)
where FFI is the free fluid index, or moveable fluid volume, and BFV is the bound fluid
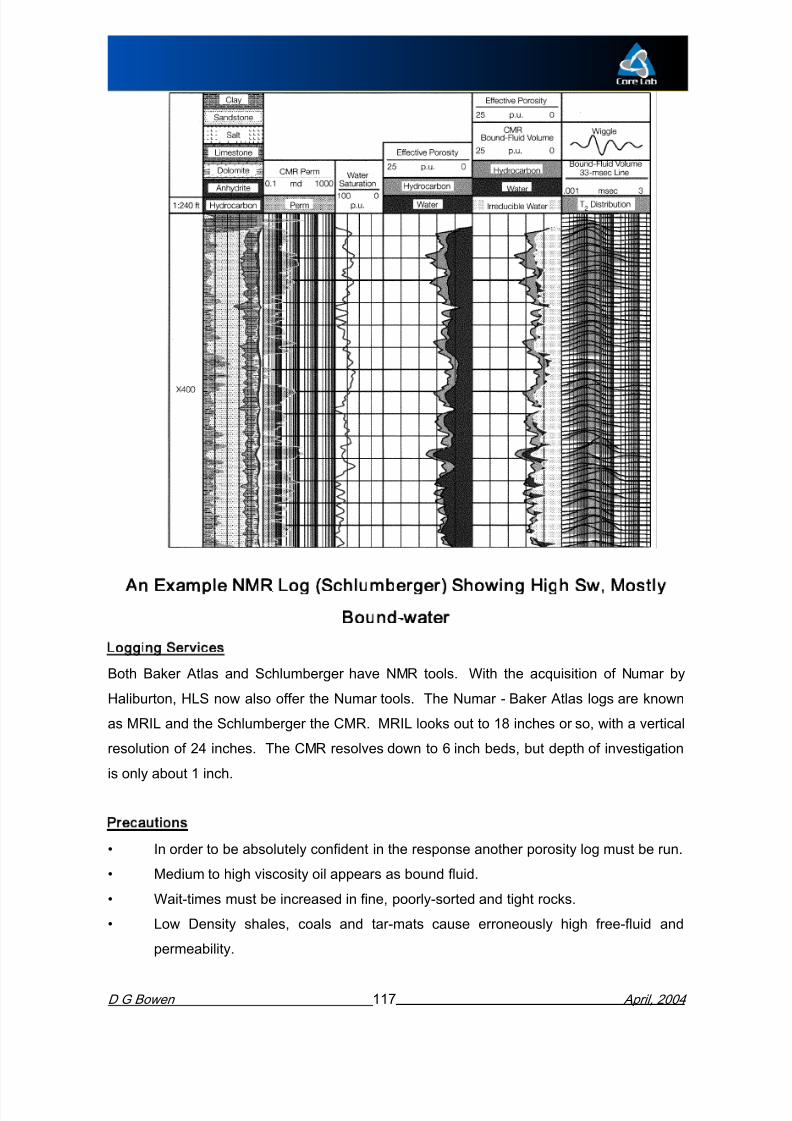
8/10/2019 Formation Evaluation and Petrophysics Mr D. G. Bowen
http://slidepdf.com/reader/full/formation-evaluation-and-petrophysics-mr-d-g-bowen 129/225
Chapter 2
Section 4

8/10/2019 Formation Evaluation and Petrophysics Mr D. G. Bowen
http://slidepdf.com/reader/full/formation-evaluation-and-petrophysics-mr-d-g-bowen 130/225
Resist ivi ty and Saturation Logs
STUDY GUIDE QUESTIONS ON
CONVENTIONAL ELECTRIC ES) LOGS

8/10/2019 Formation Evaluation and Petrophysics Mr D. G. Bowen
http://slidepdf.com/reader/full/formation-evaluation-and-petrophysics-mr-d-g-bowen 131/225
1) What is the principle of the conventional electric log?
2) Can this tool be run with any fluid in the borehole?
3) What are the typical spacings for the two normal devices? And for the lateral
device?
4) What is the depth of investigation for each tool?
5) Are both curves symmetrical about the bed’s centre?
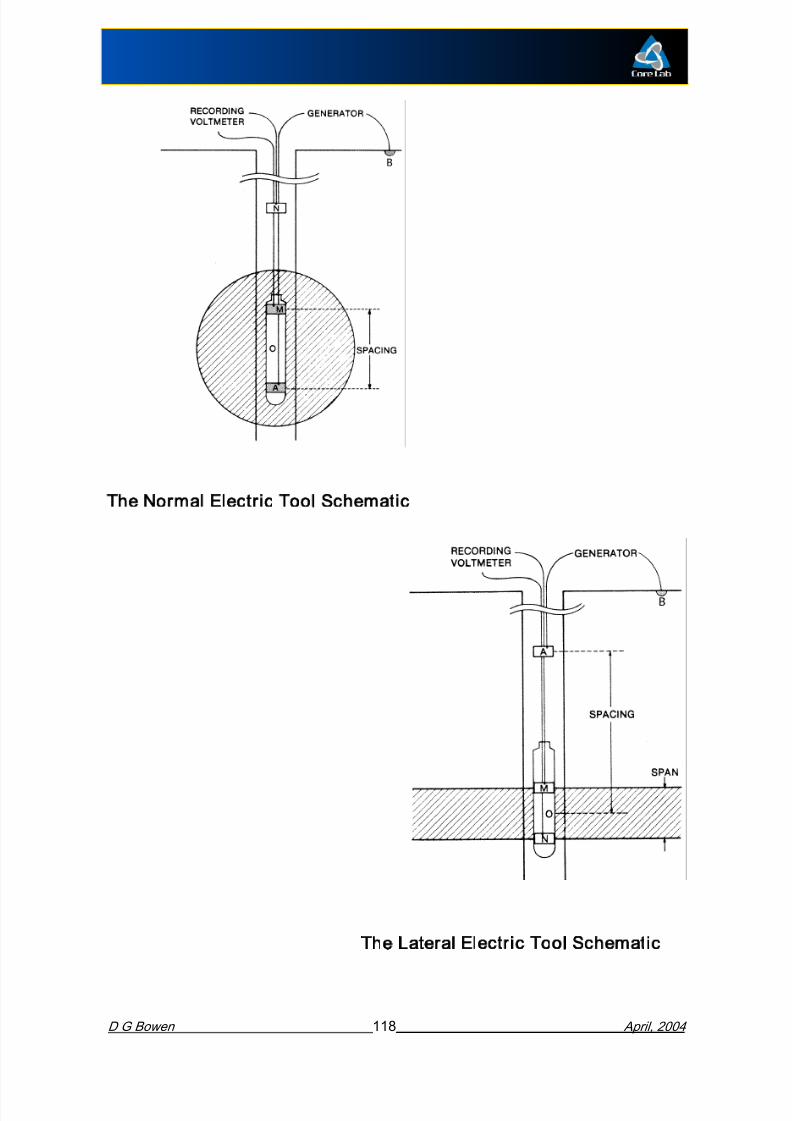
8/10/2019 Formation Evaluation and Petrophysics Mr D. G. Bowen
http://slidepdf.com/reader/full/formation-evaluation-and-petrophysics-mr-d-g-bowen 132/225
The Normal Electric Tool Schematic
OLD CONVENTIONAL ELECTRIC LOGS
INTRODUCTION
In 1927, two French brothers introduced a new logging method called “electric coring”.

8/10/2019 Formation Evaluation and Petrophysics Mr D. G. Bowen
http://slidepdf.com/reader/full/formation-evaluation-and-petrophysics-mr-d-g-bowen 133/225
Their three-electrode device, which measure resistivity at closely spaced intervals in the
well, was tested the next four years in Venezuela, Russia, Rumania, and Oklahoma.
During this time, the natural spontaneous potential was discovered and the SP tool
created. Electric logging boomed and made its entrance into California in 1932 and the
Gulf Coast in 1933.
In the 1950’s, these electric survey (ES) logs started to become obsolete in the West,however, there are thousands of these electric logs still in old files and they were used
successfully in the former Soviet Block. Accurate interpretation from these logs is often
difficult, but relatively good estimates of resistivity can be made. Newer logs are easier to
read and can detect thin beds more easily. The induction log, introduced in the 50’s,
utilised one or more of these conventional electric logs as a shallow investigation device.
For these reasons, a short discussion on conventional electric logs is warranted.
RESISTIVITY LOGGING DEVICES
The basic principle of a conventional electric log is that a current is passed through a
FACTORS AFFECTING MEASUREMENT
Many factors affect the reading of a conventional electric log. The equation and
relationships are most correct in homogeneous, uniform material. Since the material

8/10/2019 Formation Evaluation and Petrophysics Mr D. G. Bowen
http://slidepdf.com/reader/full/formation-evaluation-and-petrophysics-mr-d-g-bowen 134/225
surrounding the electrode system is not uniform, the logs read only an apparent resistivity.Other factors which affect the log readings are:
1) Hole diameter - d
2) Mud resistivity - R m
3) Bed thickness
4) Resistivity of surrounding bed - R s
5) Resistivity of invaded zone - R i
6) True resistivity of zone - R t
7) Diameter of invaded zone - d i
Conventional Electric Log Presentation
The log is presented starting with the third track The scale is linear and often goes from 0-

8/10/2019 Formation Evaluation and Petrophysics Mr D. G. Bowen
http://slidepdf.com/reader/full/formation-evaluation-and-petrophysics-mr-d-g-bowen 135/225
Normal Log Responses in Both Resistive Left)
and Conduct ive Right) Beds
Lateral Device Responses
Reading the lateral curve takes experience.
Si th l h b l t l b l t

8/10/2019 Formation Evaluation and Petrophysics Mr D. G. Bowen
http://slidepdf.com/reader/full/formation-evaluation-and-petrophysics-mr-d-g-bowen 136/225
Since the log has become completely obsolete, adiscussion on the lateral log responses will not
be presented. By viewing the Figure opposite,
one can see how the curve is not symmetrical
about the bed centre and no sharp changes at
bed boundaries. The curve is distorted by
adjacent beds and thin beds. To read the
apparent resistivity (R a ) the reading should be
taken near the bottom of the curve. The truest
reading of resistivity is achieved if the formation
is at least forty feet thick.
SUMMARY OF CONVENTIONAL ELECTRIC LOGS
· Basically, the principle of the conventional electric log is: A current is generated
b t t l t d d th t ti l diff b t t th i d

8/10/2019 Formation Evaluation and Petrophysics Mr D. G. Bowen
http://slidepdf.com/reader/full/formation-evaluation-and-petrophysics-mr-d-g-bowen 137/225
between two electrodes and the potential difference between two others is measured.This potential difference can be related to the resistivity of the surrounding material.
The change in the potential difference, (resistivity), is plotted versus depth. A well is
logged starting from the deepest point first.
· There must be conductive fluid in the borehole for the tool to function properly. So this
tool does not work in oil or air-filled holes.
· The spacings for the two normal devices typically are 16” and 64”. The lateral device
typically has an 18’ 8” spacing.
· The normal device can see about twice its spacing into the formation. The lateral
device has a depth of investigation close to 19’. It averages about 3’ of formation
resistivity.

8/10/2019 Formation Evaluation and Petrophysics Mr D. G. Bowen
http://slidepdf.com/reader/full/formation-evaluation-and-petrophysics-mr-d-g-bowen 138/225
STUDY GUIDE QUESTIONS ON THE
FOCUSED CURRENT ELECTRIC LOGS

8/10/2019 Formation Evaluation and Petrophysics Mr D. G. Bowen
http://slidepdf.com/reader/full/formation-evaluation-and-petrophysics-mr-d-g-bowen 139/225
1) Different companies have different names for the logs they develop.
Name five major focused logs and how far into the formation they see
(i.e. shallow, medium, deep?).
2) What is the advantage of the DLL over LL7 or LL3?
3) What type of scale are the logs now typically plotted upon? Why is this
advantageous?
Focused and Non-focused Current Flow
Compared

8/10/2019 Formation Evaluation and Petrophysics Mr D. G. Bowen
http://slidepdf.com/reader/full/formation-evaluation-and-petrophysics-mr-d-g-bowen 140/225
FOCUSED CURRENT ELECTRIC LOGS
INTRODUCTION
The conventional electric log allows the current to seek the paths of least resistance. The
tool works best in conductive formations for it will lose current into the mud column in the

8/10/2019 Formation Evaluation and Petrophysics Mr D. G. Bowen
http://slidepdf.com/reader/full/formation-evaluation-and-petrophysics-mr-d-g-bowen 141/225
tool works best in conductive formations for it will lose current into the mud column in thepresence of resistive formations. Consequently, conventional electric logs do not work well
in salty muds or in highly resistive formations such as tight carbonates.
Focused current electric logs, developed in the early 1950’s, focus the emitted current into
a thin lateral sheet which minimises adjacent bed and borehole effects. This allows a truer
resistivity to be measured in thin beds, when a conductive mud is present, and in highly
resistive formations.
TYPES OF DEVICES
Schlumberger developed two deep reading logs, the Laterolog 7 (LL7) and the Laterolog 3
(LL3). (HLS had a Guard Log similar to LL3 and Atlas had a Laterolog with two designs,
multi-electrode and guard.) In the design of the LL7, a constant current is passed through
a central electrode. Three pairs of electrodes prevent the current from flowing up or down
the mud column and focus a 32 inch sheet of current into the formation. As the tool is

8/10/2019 Formation Evaluation and Petrophysics Mr D. G. Bowen
http://slidepdf.com/reader/full/formation-evaluation-and-petrophysics-mr-d-g-bowen 142/225
The device consists of twelve. lateral electrodes arrayed azimuthally around the tool and
the relevant focusing electrodes. Borehole effects are compensated for using the shallow
investigation readings to determine the stand-off of the device in a horizontal wellbore.
Tool eccentricity can be seen in the results. Some data show that the depth of

8/10/2019 Formation Evaluation and Petrophysics Mr D. G. Bowen
http://slidepdf.com/reader/full/formation-evaluation-and-petrophysics-mr-d-g-bowen 143/225
Tool eccentricity can be seen in the results. Some data show that the depth ofinvestigation of the ARI can be as deep as the LLd. Thin beds and fractures may also be
analysed using output from the ARI.
SCALES
Originally linear scales were used for the laterologs. With the advent of the Dual Induction
tool, a logarithmic scale was used and this has now been adopted for the laterologs and
SFLU. The logarithmic scale allows for more detailed quantitative work in the low resistivity

8/10/2019 Formation Evaluation and Petrophysics Mr D. G. Bowen
http://slidepdf.com/reader/full/formation-evaluation-and-petrophysics-mr-d-g-bowen 144/225
g q yrange plus it allows a quick-look evaluation of a zone.
ENVIRONMENTAL FACTORS AFFECTING THE LATEROLOGS
Each laterolog is affected differently by
the borehole mud, the invaded zone, and
adjacent beds. Consequently, there are
correction charts for these effects
depending upon what tool is used. There
is a “Delaware Effect” seen in laterologs
when a zone is overlain by a thick non-conductive bed, i.e., anhydrite or salt.
This is similar to the “Groningen Effect” In
the “Delaware Effect”, if the B and N
The LL3 gives better vertical resolution than the LL7, but is more greatly affected by the
invaded zone. For deeper investigation (i.e., truer Rt), but not as sharp vertical resolution,
the LL7 can be utilised. For a clear invasion profile and to determine an accurate Rt, the
Dual Laterolog should be used. It is useful in high resistivity contrasts, and in low resistivity

8/10/2019 Formation Evaluation and Petrophysics Mr D. G. Bowen
http://slidepdf.com/reader/full/formation-evaluation-and-petrophysics-mr-d-g-bowen 145/225
g g y , ydrilling muds. Vertical resolution is about two feet.
So, focusing electrodes confine the current into a sheet which allows good vertical
resolution of the beds. It also minimises the effects of conductive borehole fluids and
adjacent beds. The truest resistivity is read in the uninvaded zone (LL7, LL3, LLd) when
Rmf < Rw, invasion is not deep, the borehole not severely washed out, and the bed is
thicker than the sheet of current. The laterologs should be considered when the following
conditions exist:
1) Rmf / Rw < 4
2) Rxo < Rt3) Rt / Rxo < 50
Supplementary Notes
SUMMARY SHEET ON FOCUSED CURRENT ELECTRIC LOGS
The Five Major tools were:
1) Laterolog 7 (LL7) - 3 pairs of guard electrodes (and one central electrode)
focus a 32 inch sheet of current looking deep into the

8/10/2019 Formation Evaluation and Petrophysics Mr D. G. Bowen
http://slidepdf.com/reader/full/formation-evaluation-and-petrophysics-mr-d-g-bowen 146/225
gformation (Ra » Rt)
2) Laterolog 3 (LL3) - 1 pair of guard electrodes focuses the current into a 12
inch sheet and reads deep into the formation. It gives
better better vertical resolution than LL7 and is less influenced
by the borehole or adjacent beds. However, the invaded zone
does affect the resistivity reading more than it does with
the LL7.
3) Laterolog 8 (LL8) - Similar design to LL7, but instead focuses a 14 inch sheet
of currents which allows for very sharp detail and goodvertical resolution of beds. It has only a shallow depth of
investigation.
STUDY GUIDE QUESTIONS ON
CONTACT LOGS

8/10/2019 Formation Evaluation and Petrophysics Mr D. G. Bowen
http://slidepdf.com/reader/full/formation-evaluation-and-petrophysics-mr-d-g-bowen 147/225
1) Name the two basic types of contact logs.
2) Where are the electrodes found?
3) What is the depth of investigation for the contact logs (shallow, medium, deep)?
4) Does the microlog work well in conductive mud and hard formations?
A Typical Contact Logging Tool:
Atlas’ Minilog

8/10/2019 Formation Evaluation and Petrophysics Mr D. G. Bowen
http://slidepdf.com/reader/full/formation-evaluation-and-petrophysics-mr-d-g-bowen 148/225
Contact Logs are pad devices which have very short spaced electrodes in a pad which is
pressed up against the borehole wall. Just as with the ES logs, there are two types of
contact logs, non-focused and focused. The non-focused contact log was first developed
to establish porosity data in the flushed zone, but because it was not focused, the accuracy
of the measurement was questionable The focused contact log gives a better

8/10/2019 Formation Evaluation and Petrophysics Mr D. G. Bowen
http://slidepdf.com/reader/full/formation-evaluation-and-petrophysics-mr-d-g-bowen 149/225
of the measurement was questionable. The focused contact log gives a better
determination of porosity, more detailed bed definition, and a more reliable Rxo reading
than the non-focused. Some of the non-focused logs are still run, therefore, a discussion
on both types follows.
NON-FOCUSED CONTACT LOGS
These logs fall under different names depending upon the logging company, i.e., microlog
(Schlumberger), minilog (Atlas) and contact log (Haliburton, HLS). Their purpose is to
read the resistivity in the flushed zone (Rxo), obtain a detailed bed definition and show
where zones of permeability exist from mud-cake build-up. If Rxo could be determined,
Rmf was known, and the Archie or Humble relationship assumed, porosity could becalculated.
Rxo= F =
a (1)
F = Formation Factor

8/10/2019 Formation Evaluation and Petrophysics Mr D. G. Bowen
http://slidepdf.com/reader/full/formation-evaluation-and-petrophysics-mr-d-g-bowen 150/225
MICROLOG MINILOG, ETC.)
Three electrodes are spaced one inch apart in a rubber pad which is pressed against the
borehole wall. A one inch spaced micro-inverse (1 1/2 inch on the minilog) and a two-inch
spaced micro-normal are recorded. The depth of investigation is shallow (4 inches) and isgreatly affected by the mudcake resistivity and flushed zone resistivity

8/10/2019 Formation Evaluation and Petrophysics Mr D. G. Bowen
http://slidepdf.com/reader/full/formation-evaluation-and-petrophysics-mr-d-g-bowen 151/225
greatly affected by the mudcake resistivity and flushed zone resistivity.
Other factors which affect the resistivity are: not enough or excessive mudcake thickness,
too shallow invasion, presence of residual oil in the flushed zone, or a rugose borehole
which does not allow the pad to conform to the wall of the borehole. Charts are available
to correct these conditions to yield an approximate Rxo. The non-focused contact logs
work best if porosity is greater than 15%, mudcake thickness is 1/2 inch or less, and fresh
mud is in the borehole.
The log is presented on a linear scale. The one-inch spaced log (micro-inverse) is
represented by a solid line and the two-inch spaced log (micro-normal) is recorded as adotted line. The two-inch spaced log reads deeper than the one-inch so it is less
influenced by the mudcake. When the two readings separate, it indicates a mudcake has
built-up and therefore a permeable formation is present.

8/10/2019 Formation Evaluation and Petrophysics Mr D. G. Bowen
http://slidepdf.com/reader/full/formation-evaluation-and-petrophysics-mr-d-g-bowen 152/225
Microlaterolog Electrode Array and Current Sheet
FOCUSED CONTACT LOGS
Focused contact logs were developed to overcome many of the borehole or formation
diti hi h ff t d th f d t t l g Th f i g ll th l g t b

8/10/2019 Formation Evaluation and Petrophysics Mr D. G. Bowen
http://slidepdf.com/reader/full/formation-evaluation-and-petrophysics-mr-d-g-bowen 153/225
SUMMARY SHEET ON THE CONTACT LOGS
· The two basic types of contact logs are focused and non-focused.

8/10/2019 Formation Evaluation and Petrophysics Mr D. G. Bowen
http://slidepdf.com/reader/full/formation-evaluation-and-petrophysics-mr-d-g-bowen 154/225
The two basic types of contact logs are focused and non focused.
· It is a pad device with the electrodes found in the pad. Their spacing is very short.
· The contact logs see only a few inches into the formation so they read an Rxo.
· The microlaterolog has a similar design as the laterolog, but the spacing is very short.
Consequently its depth of investigation is only a few inches. The current is focused intothe formation and therefore overcomes the effects of conductive muds and resistive
formations if the mudcake stays less than 3/8 inch thick.
STUDY GUIDE QUESTIONS ON THE INDUCTION LOG
1) Why was the induction log invented? Is it a focusing tool?

8/10/2019 Formation Evaluation and Petrophysics Mr D. G. Bowen
http://slidepdf.com/reader/full/formation-evaluation-and-petrophysics-mr-d-g-bowen 155/225
2) Name three types of induction logs and on what type of scale they are printed.
3) Does bed thickness affect the log response? Explain.
4) In terms of effects from invasion, what condition limits best apply to the induction
log?
INDUCTION LOGS

8/10/2019 Formation Evaluation and Petrophysics Mr D. G. Bowen
http://slidepdf.com/reader/full/formation-evaluation-and-petrophysics-mr-d-g-bowen 156/225
INDUCTION LOG PRINCIPLES
The induction tool has several transmitter and receiver coils which are wound coaxially on a
supporting insulated sonde. The distance between coils (the spacing) is typically from 28-
40 inches. The transmitter creates an alternating current of constant intensity and high
frequency which induces eddy currents into the formation. These currents create their own

8/10/2019 Formation Evaluation and Petrophysics Mr D. G. Bowen
http://slidepdf.com/reader/full/formation-evaluation-and-petrophysics-mr-d-g-bowen 157/225
magnetic field which induces a current back in the receiver that is proportional to the
formation conductivity.
The tool performs well in oil-base mud or air-filled holes; i.e., non-conductive fluids. It will
work in moderately conductive mud, as long as the fluid does not become too salty, the
formation too resistive, or the borehole too large.
TYPES OF INDUCTION LOGS
Logging companies have trade names for their different types of tools. The particular type
used will be given on the log heading. Below are summaries of a few of the log types nowin use:
1) Induction Log
• 6FF40, Schlumberger’s 6 fully focused coils with a 40” spacing. Can be run with a
• A deep induction log, like the 6FF40 which will give an Rt, and a Spherically Focused
Log which gives an Rxo, both in track 3.
• A Sonic log detailing the porosity in track 4
• Plus an SP curve with a calculated Rwa curve
(Rwa = Rt×2 f ) in track 1

8/10/2019 Formation Evaluation and Petrophysics Mr D. G. Bowen
http://slidepdf.com/reader/full/formation-evaluation-and-petrophysics-mr-d-g-bowen 158/225
(Rwa = Rt × f ) in track 1
• This was a popular tool, i.e., in the US Gulf Coast, because all of the measurements
are taken during one logging run
• Atlas had an Induction-Acoustilog combination and HLS had an Induction-Acoustic
Velocity log combination
4) The Phasor Induction SFL
• This new tool (1987) replaces the older devices and consists of a deep induction ,
IDPH, a medium induction, IMPH and a SFL tool. A SP electrode is also included. Its
main advantage over the older tools is in signal processing. It can operate at 10, 20and 40 KHz and the signal is analysed for the in phase and quadrature components.
This allows vertical resolution to be much better than its predecessors and it can
resolve 2 ft beds with full bed shoulder correction. 3 Vertical resolutions are

8/10/2019 Formation Evaluation and Petrophysics Mr D. G. Bowen
http://slidepdf.com/reader/full/formation-evaluation-and-petrophysics-mr-d-g-bowen 159/225
The logarithmic scale for the induction log from the ISF/SONIC tool in track 3 is only two
decades because track 4 is occupied by the sonic log. The scale for transit time is linear
as it is for the Rwa and SP in track 1.

8/10/2019 Formation Evaluation and Petrophysics Mr D. G. Bowen
http://slidepdf.com/reader/full/formation-evaluation-and-petrophysics-mr-d-g-bowen 160/225
The order of correction is: Borehole, then bed-thickness, then invasion. The following is a
brief highlight of each of these factors.
Skin Effect
In conductive formations, the induction log induces strong secondary currents. The

8/10/2019 Formation Evaluation and Petrophysics Mr D. G. Bowen
http://slidepdf.com/reader/full/formation-evaluation-and-petrophysics-mr-d-g-bowen 161/225
magnetic field generated by these induces additional emf’s which interfere and reduce the
conductivity reading recorded at the receiver. This is known as skin effect; however,
modern logs automatically correct for this. In resistive beds, the effect is negligible.
Borehole Size
The size of the borehole can affect the induction log’s response. The borehole effect
increases as the hole diameter increases. This is typically corrected through use of the
geometric factor. There still may be some uncertainty in this factor, which may cause a
significant error in highly resistive zones. Use Chart Rcor-4 for Schlumberger and 6-1 - 6-5
for Atlas to make corrections
Adjacent Beds
The resistivity of adjacent beds affect the measured value in beds thinner than the vertical
signal is contributed by each zone. Knowing this, a more accurate resistivity can be
determined which takes into account the responses in the borehole, adjacent beds, and the
invaded zone.
Invasion Effects

8/10/2019 Formation Evaluation and Petrophysics Mr D. G. Bowen
http://slidepdf.com/reader/full/formation-evaluation-and-petrophysics-mr-d-g-bowen 162/225
The effect of invasion increases as the invasion diameter increases and as resistivity
contrast increases. The invasion effect also becomes greater as the resistivity of the
formation becomes greater than that of the invaded zone. For the best results, formation
resistivity (Rt) should be less than 2.5 times that of the flushed zone (Rxo) and the
diameter of invasion be less than 100 inches for the ILd and 200 inches for the IDPH. So,
the induction log works better in a fresh-water, resistive mud than a salty, conductive mud.
In a system where the filtrate is more resistive than the Rw, an annulus of formation water
may be flushed ahead of the filtrate. This results in a ring of more conductivity around the
invaded zone and before the virgin formation. Annulus effects the Induction logs, mostlythe IM but some times the ID and can suppress Rt. The Annulus will dissipate with time.
Though very resistive beds do not require corrections other than just mentioned, it should
SUMMARY SHEET ON THE INDUCTION LOGS
· The induction log was developed to run in non-conductive muds such as oil because
the electric logs could not work in them. It focuses its current in a 28-40” spacing that
allows it to measure the formation’s conductivity with minimal effects from secondary

8/10/2019 Formation Evaluation and Petrophysics Mr D. G. Bowen
http://slidepdf.com/reader/full/formation-evaluation-and-petrophysics-mr-d-g-bowen 163/225
media.
· Five types of tools are:
1. The Induction Log which is run with a short normal and SP; it has conductivity on
a linear scale in track 4 and a reciprocated resistivity linear scale on track 3.
2. The Dual Induction Log which has a deep, medium, and short focused tool plus
an SP; the resistivity curves are printed on a four decade logarithmic scale starting at
0.2 ohm-m finishing at 2000 ohm-m.
3. The ISF/SONIC Log which has a short normal and deep induction log curve
printed on a two decade logarithmic scale in track 3. Track 4 has the transit time printedon a linear scale.
4. The Phasor Induction Log, which has better resolution due to X and R signals
being used in deconvolution. It has a deep and medium device and 8/6, 3/3 or 2/2 feet
keeps the error less than 20%. The Phasor only has 0.75% uncertainty in zeroing and
can be read to 7.5 % accuracy in the same range. · The induction log was designed and works best in non-conductive fluids. This covers
fresh water mud, oil-base mud, or gas filled holes. It will work in moderately conductive
fluids as long as the borehole does not become too large, the formation too resistive, or

8/10/2019 Formation Evaluation and Petrophysics Mr D. G. Bowen
http://slidepdf.com/reader/full/formation-evaluation-and-petrophysics-mr-d-g-bowen 164/225
the fluid too salty.
THE ELECTROMAGNETIC PROPAGATION TOOL, EPT
The Electrical impedance of the formation considered so far has always been based upon

8/10/2019 Formation Evaluation and Petrophysics Mr D. G. Bowen
http://slidepdf.com/reader/full/formation-evaluation-and-petrophysics-mr-d-g-bowen 165/225
the assumption that conduction follows Ohm’s Law.
V = IR
Where V is the voltage, I the current in amps and R the resistance in ohms.
In a strictly direct current (DC) we might be able to make that assumption, however, all the
electrical measurements we have studied so far are alternating current (AC). There is a
contribution to impedance that is non-ohmic. Impedance losses may be due to heating,
capacitance and phase-angle. Hence, measurements of electrical resistance andcomputed resistivity will all be frequency dependent. This means different resistivities
measured in the same zone can both be “right”.
e is the dielectric constant
and C is the conductivity.
Therefore, a measurement of a and b can yield the dielectric constant and conductivity in
the medium in which the waves are propagating.

8/10/2019 Formation Evaluation and Petrophysics Mr D. G. Bowen
http://slidepdf.com/reader/full/formation-evaluation-and-petrophysics-mr-d-g-bowen 166/225
There are a number of ways of computing the desired parameters. The complex Refractive
Index Method, Complex Time Average Method, Loss-less Propagation Time Method and
the currently most popular Weight-Average Effective Medium equation. These are
described in the logging company manuals and the reader is directed to them for a fuller
treatment of the subject.
The EPT tools are used in resistive formations where Rw is moderately high and the mud is
fresh or oil-based. Because of the good contrast between the dielectric constants of oil
and water, it is a good hydrocarbon discriminator. In water sands the porosity can be
computed from a weighted time average equation;
EPT f = t po - t pma
t - t

8/10/2019 Formation Evaluation and Petrophysics Mr D. G. Bowen
http://slidepdf.com/reader/full/formation-evaluation-and-petrophysics-mr-d-g-bowen 167/225
Chapter 3
Section 1

8/10/2019 Formation Evaluation and Petrophysics Mr D. G. Bowen
http://slidepdf.com/reader/full/formation-evaluation-and-petrophysics-mr-d-g-bowen 168/225
Formation Evaluation Log Analysis
GUIDE TO LOG ANALYSIS PROBLEM SOLUTIONS
1. What is purpose of the analysis; i.e., what is required to be known?
2. What data are available or given?
A Logs what type?

8/10/2019 Formation Evaluation and Petrophysics Mr D. G. Bowen
http://slidepdf.com/reader/full/formation-evaluation-and-petrophysics-mr-d-g-bowen 169/225
A. Logs - what type?
B. Formation water - R w, salinity, compute from SP/EPT/Rwa
C. Mud data.
D. Temperature - surface and bottom hole.
E. Cementation factor (m) - saturation exponent (n).
F. Log calibration data - Dtma ; r f ; r ma ; Dtf .
3. Determine temperature of zone of interest and convert all temperature sensitive
data to the formation temperature (R w, Rm , Rmc ).
4. Set up a table showing the data needed as a function of depth (or interval), such
that all log readings or calculations can be kept in logical order.
HOW TO START
We want to work in an ordered approach, realising each parameter as we go. We need
lithology, porosity, water saturation (Sw) and some estimate of permeability. The first step
is to realise the data we will need for each interpretation.
LITHOLOGYANDPOROSITY

8/10/2019 Formation Evaluation and Petrophysics Mr D. G. Bowen
http://slidepdf.com/reader/full/formation-evaluation-and-petrophysics-mr-d-g-bowen 170/225
LITHOLOGY AND POROSITY
We cannot calculate a correct porosity, nor Sw, without a good interpretation of lithology.
Throughout this course we have looked at various forms of evidence for the lithology.
Prima-facie evidence comes in the form of cores, sidewall-cores, and mud-logs, all of which
ground-truth any interpretation of down-hole logs. No log analyst worth having will ignorethis evidence. However, we don’t always have this evidence and even if we do, lithological
analysis of down-hole logs extends our knowledge to the uncored sections of the well.
We need to get estimates of lithology to determine the matrix characteristics essential to
calculating a valid porosity. These are
r ma , f N ma , Dt ma , tpl ma
MINERAL MIXTURES
More commonly, we are confronted with a formation that is a mixed mineral lithology.
Fortunately, because the physical responses of the porosity logs are different to different
mineral and fluid combinations in the formation. This means that cross-plots of the tool
responses will be quite useful in identifying the presence of various component parts of the
mixture. The most basic and fundamental cross-plots are the Neutron-Density, Density

8/10/2019 Formation Evaluation and Petrophysics Mr D. G. Bowen
http://slidepdf.com/reader/full/formation-evaluation-and-petrophysics-mr-d-g-bowen 171/225
mixture. The most basic and fundamental cross plots are the Neutron Density, Density
Sonic and the Neutron Sonic.
NEUTRON DENSITY
Charts CP-1a-f and CP-22-24 deal with the various different tools responses for FDC, LDL
and the SNP, CNL, CDN and ADN tools. Simply select the chart that represents the tool
string run. The neutron device should always be on the ‘X’ axis and the bulk density, or
density porosity on the ‘Y’ axis.
In an example case, given the response of the two logging devices we can determine a
binary mixture of mineralogy. However more than a mixture of two components will pull the
data in differing, or reinforcing directions. It then becomes difficult to determine the
lithology. This is particularly true when clays, and/or shale are present, and also gypsum.
For the components, sandstone, limestone, dolomite and anhydrite the plot works well at
correcting porosity. However, in multi-component systems, anther plot is needed.

8/10/2019 Formation Evaluation and Petrophysics Mr D. G. Bowen
http://slidepdf.com/reader/full/formation-evaluation-and-petrophysics-mr-d-g-bowen 172/225
g p y , p y , p
THE M - N PLOT
The ‘m’ - ‘n’ plot combines all three basic porosity tools’ responses. The idea is to minimise
the effect of porosity on the lithology determination by dividing one porosity response intoanother.
M =Dt fl - Dt
r b - r fl ×0.01 and N =
f Nfl - f N
r b - r fl.
The fluid characteristics can be approximated as
Fresh Mud Salty Mud r 1 0 1 1
M-N Plot in 3D Showing the Visualisation From The Fluid Point
While the N - D and M - N plots are extremely useful, it is obvious that the data may array
in 2D because of the influence of another parameter. For example the following 2D and
3D N -D plots show that coherent data in 3 D may look very scattered when viewed in 2D.

8/10/2019 Formation Evaluation and Petrophysics Mr D. G. Bowen
http://slidepdf.com/reader/full/formation-evaluation-and-petrophysics-mr-d-g-bowen 173/225
2D and 3D Representations of the Same Data From a Palaeozoic
Carbonate-Shale-Sandstone Sequence
Data can be estimated from the chart CP-14 and plotted on the chart CP-15 to identify the
matrix components.
THE r maa VERSUS U maa PLOT
This triangular plot allows us to estimate the lithology in terms of percentages for an
admixture of three minerals.

8/10/2019 Formation Evaluation and Petrophysics Mr D. G. Bowen
http://slidepdf.com/reader/full/formation-evaluation-and-petrophysics-mr-d-g-bowen 174/225
r maa = r b - r fl f ta ( N - D )
1 - f ta. and U maa =
U - U fl f ta (N - D )
1 - f ta ( N - D )
.
We can approximate U from P e , where U = P e x r e , or use chart CP-20 and
r e = r b + 0.1883
1.0704, or simplify this by making U = P e x r b.
The mud filtrate should provide the fluid values as the tools have shallow depths of
investigation. Hence, for fresh mud r fl = 1.0 g/cm 3 and U fl = 0.40 B/cm 3, and for salty mud,
r fl = 1.1 g/cm 3 and U fl = 1.36 B/cm 3.

8/10/2019 Formation Evaluation and Petrophysics Mr D. G. Bowen
http://slidepdf.com/reader/full/formation-evaluation-and-petrophysics-mr-d-g-bowen 175/225
Rw AND Sw FROM LOGS
The purpose of the forgoing section was to provide us with accurate estimates of lithology
and porosity in order that we may then proceed to make good estimates of the saturation
and volume of hydrocarbons in our reservoir. This section will dwell upon the various
methods to achieve this goal.

8/10/2019 Formation Evaluation and Petrophysics Mr D. G. Bowen
http://slidepdf.com/reader/full/formation-evaluation-and-petrophysics-mr-d-g-bowen 176/225
Rw
Most serious petrophysicists will smile wryly when you mention Rw. Of all the logging
parameters it would appear to be the simplest to both understand and to characterise.Unfortunately this is often not the case. Geochemical studies of pore waters have shown
that in many cases the Rw of formation water varies both horizontally and vertically. In the
case of some hyper-saline fields in the US with postulated dynamic aquifers the Rw varies
by as much as a factor of 3 across the field. In SE Asia it is quite common for the pore-
water in the hydrocarbon leg of a reservoir to have widely different salinity to the underlyingwater, due to pervasive meteoric water invasion since the reservoirs received their charge.
There are a few simple aspects to bear in mind when considering the effect of Rw. In the
while going from 8,000 ppm to 10,000 ppm results in a change of 0.13 from 0.73 - 0.6 Wm.
This represents a six-fold increase in sensitivity of the multiplier.
Rw APPROACHES
The simplest way to establish Rw is from a book, or catalogue of previously measured
values in a basin. This has a drawback in that the precision of your entire analysis is

8/10/2019 Formation Evaluation and Petrophysics Mr D. G. Bowen
http://slidepdf.com/reader/full/formation-evaluation-and-petrophysics-mr-d-g-bowen 177/225
dependent upon this parameter. Rw is o t a constant in nature
Commonly the Rw is measured on a recovered formation water sample. This is not always
a good analysis. Because the water has been drawn to the wellbore it will have lostpressure and temperature which can change the solubility of some of the component salts
and these may be lost through precipitation. Further, the water may be contaminated in the
wellbore.
Nearly all formation water analyses show iron present in appreciable quantities. This is
more often than not, a contaminant introduced by the casing and pipe in the wellbore.
Formation pH may be quite low, however, most waters are oxygenated in recovery and
display pH values closer to 7.0. This again can change the solubility of components.
Rw is found by entering R we into Schlumberger Chart SP-2
This approach only works in clean water sands, so must be performed on an adjacent
formation to the hydrocarbon zone, with all the assumptions that entails. Beware of
unconformities or faults juxtaposing completely dissimilar formations.

8/10/2019 Formation Evaluation and Petrophysics Mr D. G. Bowen
http://slidepdf.com/reader/full/formation-evaluation-and-petrophysics-mr-d-g-bowen 178/225
There are corrections available for beds thinner than 10 feet, and their Rt, adjacent shale
Rs, Rxo and d i, borehole diameter, d h, and mud Rm, all from charts SP-3 and SP-4 .
Rw FROM Rwa
Rwa is the apparent Rw of a formation. The formation may contain filtrate and
hydrocarbons, but we can assume an Archie relationship and solve the equation for Rw.
Obviously in a water-sand Rwa would be the actual formation Rw. Rwa is defined as,
Rwa = RtF
,
The first pair of sandstone equations is based upon a relationship first reported for samples
from the US Gulf Coast by researchers at Humble Oil and Refining Co., soon to be merged
into Exxon Corporation. As such they are known as the Humble formulae. In clean water
bearing formations, Rt = Ro = F ×Rw and Rwa = Rw.
It should be apparent that when Rwa deviates to higher values in a zone of known constant

8/10/2019 Formation Evaluation and Petrophysics Mr D. G. Bowen
http://slidepdf.com/reader/full/formation-evaluation-and-petrophysics-mr-d-g-bowen 179/225
Rw, there is a strong indication that hydrocarbons are present. This led to Schlumberger
producing a Rwa log as a hydrocarbon indicator log.
THE RATIO METHOD The forgoing estimates of Rw all rely on the formation properties remaining constant in the
zones of interest. By this we mean the ‘a’ and ‘m’ values are constant even if porosity
varies. In many formations there is a progressive change in diagenesis, which results in ‘m’
varying. In advanced petrophysics ‘m’ becomes a variable that is porosity and shaliness
dependent, but that is outwith the current scope of this course. What we need is a Rw
method that does not rely on F. The approach used is the Ratio Method.
In the invaded zone, which is measured by one of the medium investigation devices,
RiRt
= Rmf ×K
Rw = constant =
RiRt ë
ê ûúS =100%,
showing the ratio Ri/Rt is a constant if Rmf, Rw and K remain constant in the zone of
interest. Hilchie (1989) reports that this is commonly the case. So we can solve the
equation for Rw.

8/10/2019 Formation Evaluation and Petrophysics Mr D. G. Bowen
http://slidepdf.com/reader/full/formation-evaluation-and-petrophysics-mr-d-g-bowen 180/225
It should be obvious that once a water point is established, this method can be used to
establish saturation in hydrocarbon bearing zones. Tixier (1949) described this as the
“Rocky Mountain Technique”
Sw =
RiRt èç ø÷
Ri
Rt
é
ëê
ù
ûúSw =100%
This has been used with some success in variable pore-geometry. A later variant of this
d d h d ‘ 0 d f
WATER SATURATION DETERMINATION
So far we have seen that some of the methods used to establish Rw can be extended to
derive water saturation, Sw. To a disinterested observer it may seem peculiar that we
devote a lot of time and effort to establishing water saturation , when what we want is the
hydrocarbon saturation. This little anomaly stems from the fact that the main tools used to

8/10/2019 Formation Evaluation and Petrophysics Mr D. G. Bowen
http://slidepdf.com/reader/full/formation-evaluation-and-petrophysics-mr-d-g-bowen 181/225
establish hydrocarbon saturation are the resistivity logs. Electrical current flows in the
water not the oil, hence we work-out the water saturation, which when subtracted from
unity gives us the hydrocarbon saturation.
Almost all water saturation equations are derivatives of the Archie equation,
Sw = F × Rw
Rt
n and F = a
f m ,
In order to calculate good data we need to know the values of the parameters for F. These
may be available from core analysis data, suitably corrected for shaliness and net
overburden. Conversely we can use graphical methods such as the Pickett Plot.
and at 100% Sw this simplifies further to become,
log Rt = -m log f + log (a Rw),
which is the equation of a straight line in log-log co-ordinates, of the form Y = mx + b. This
means if we plot Rt versus f on a log-log plot, we should get a straight line as long as ‘m’ is

8/10/2019 Formation Evaluation and Petrophysics Mr D. G. Bowen
http://slidepdf.com/reader/full/formation-evaluation-and-petrophysics-mr-d-g-bowen 182/225
constant. The slope of this line will be ‘m’ and the intersection the product ‘a x Rw’. Where
‘a’ equals unity, the intersection is Rw.
Lines of various Sw can be plotted and the array of data about them inspected for its value
and quality. The slope of each line is determined by the Archie parameters and the Sw.
The 0 porosity value is the intercept of the Ro line at 100% Sw.

8/10/2019 Formation Evaluation and Petrophysics Mr D. G. Bowen
http://slidepdf.com/reader/full/formation-evaluation-and-petrophysics-mr-d-g-bowen 183/225
BVWi AND BUCKLES NUMBERS
In 1965 Buckles first proposed that the relationship that Swi. f product was constant and
that this could be plotted as a hyperbolic function on a graph of f versus Swi. The value of
this constant, ‘c’, is actually the water saturation expressed as a volume fraction of the bulk
volume of the rock, or BVWi. As a plotting device we can linearise this relationship with

8/10/2019 Formation Evaluation and Petrophysics Mr D. G. Bowen
http://slidepdf.com/reader/full/formation-evaluation-and-petrophysics-mr-d-g-bowen 184/225
base-ten logarithms to provide,
log Swi = log c - log f .
We can apply the Archie equation to this and rearrange, solving for log Rt;
log Rt = log (a × Rw) - ‘n’ log c - (n-m) log f .
This equation describes a line on a Pickett plot with a slope (n-m) and an intersection with
the water line at a value of f where Swi = 100%. When ‘m’ = ‘n’ the line should be parallel
to the porosity axis. When ‘n’ < ‘m’ it should slope to the left and when ‘n’ > ‘m’ it should

8/10/2019 Formation Evaluation and Petrophysics Mr D. G. Bowen
http://slidepdf.com/reader/full/formation-evaluation-and-petrophysics-mr-d-g-bowen 185/225
where, I GR is a Gamma-ray shale index. This is then plotted on a graph of I GR versus V CL,
or Vsh .

8/10/2019 Formation Evaluation and Petrophysics Mr D. G. Bowen
http://slidepdf.com/reader/full/formation-evaluation-and-petrophysics-mr-d-g-bowen 186/225
SP
We saw earlier that the SP could be attenuated by the presence of shale. From this
response a normalised SP V sh has been developed,
Vsh £ SSP - ASPSSP
and also Vsh £1 - ASPSSP
.

8/10/2019 Formation Evaluation and Petrophysics Mr D. G. Bowen
http://slidepdf.com/reader/full/formation-evaluation-and-petrophysics-mr-d-g-bowen 187/225
This value of V sh is considered an upper limit of effective shale. This is useful because if
the Gamma-ray, or other methods predict a higher V sh , something else is affecting their
response, not effective shale. Note that the usual bed thickness rules apply to the shalybed as well as a clean one.
Density P e Response
We saw how the LDL allows us to determine U maa and U, the photoelectric absorbtion
volumetric index. From an assumption of an effective medium response function, and
since,
U » r b x P e
Neutron - Density Cross-plot
As well as using the N - D cross-plot to estimate lithology and porosity it has real value as a
Vsh predictor. It cannot discriminate whether the shale is effective or not (i.e. has an active
effect on the resistivity response). The shale effectiveness depends on its type and
location in the formation. Disseminated shale (clays) have the strongest effect, followed by
laminated shales.

8/10/2019 Formation Evaluation and Petrophysics Mr D. G. Bowen
http://slidepdf.com/reader/full/formation-evaluation-and-petrophysics-mr-d-g-bowen 188/225
resistivity suppression will still affect the shale point. This may cause the over estimation of
Vsh for use in shaly sand equations. The second important distinction is that the shale point
is truly 100% shale and not a dirty silt. V sh . Once again poor selection of the shale point will
lead to the choice of a too high. Measurements of CEC and clay content on cores can help
solve both these problems.

8/10/2019 Formation Evaluation and Petrophysics Mr D. G. Bowen
http://slidepdf.com/reader/full/formation-evaluation-and-petrophysics-mr-d-g-bowen 189/225
Neutron
f Nclean = f N - f Nsh ×Vsh
1 - Vsh
Density

8/10/2019 Formation Evaluation and Petrophysics Mr D. G. Bowen
http://slidepdf.com/reader/full/formation-evaluation-and-petrophysics-mr-d-g-bowen 190/225
r bclean = r b - r sh ×Vsh
1 - Vsh
Sonic
Dtclean =Dt - Dtsh ×Vsh
1 - Vsh
SHALERESISTIVITY

8/10/2019 Formation Evaluation and Petrophysics Mr D. G. Bowen
http://slidepdf.com/reader/full/formation-evaluation-and-petrophysics-mr-d-g-bowen 191/225
DISPERSED SHALES
More often than not, the formation shaliness consists of dispersed clay, with or without
laminations. A fundamental problem is shown in the work of Hoyer and Spann, Waxman
and Smits and Brown in 1988. The excess conductivity introduced by the presence of clay
with a CEC does not cover the entire problem. for independent of the CEC, the shale
present will affect the cementation exponent, ‘m’ through it micro porosity. In fact the more
shale there is the higher the true m. In our discussion in earlier chapters we did not

8/10/2019 Formation Evaluation and Petrophysics Mr D. G. Bowen
http://slidepdf.com/reader/full/formation-evaluation-and-petrophysics-mr-d-g-bowen 192/225
g p
investigate this problem in any depth. Before we consider it we must review the alternative
dispersed clay models.
Simandoux
The Simandoux equation was an attempt to provide a solution that could be achieved
graphically or by computer. It is a Total Shale Equation and has the form
aSw 2
+ bSw = Rt -1
,
Which is a quadratic equation that transforms as follows when ‘m’ and ‘n’ both equal 2,
where RoaRw
m = f
.
The Indonesian Equation
As its name implies, after the opening up of Indonesia to oil exploration after 1945, it
became quickly apparent that the simple Archie relationships would not work in the shaly

8/10/2019 Formation Evaluation and Petrophysics Mr D. G. Bowen
http://slidepdf.com/reader/full/formation-evaluation-and-petrophysics-mr-d-g-bowen 193/225
sands of the Mahakam Delta and Sumatra. If the Archie ‘m’ and ‘n’ equals 2 are
appropriate then the following form can be applied,
Sw = 1
VshRt Rsh
+ Rt
F ×Rw
,
However, this is a simplification and the correct form is as follows
1 = f m 2 ×Sw
n 2
+ Vsh 1-
Vsh
2 æèç
ö ø÷
Waxman Smits and Thomas
Although generally known as Waxman Smits equations, the current forms owe a lot to the
work of E C Thomas. The concepts here were also investigated by Hoyer and Spann. The
idea is to derive a shale conduction term that corrects for the suppression of resistivity.
The equation was developed from observations of laboratory experiments and through
measurements of the CEC of shale bearing samples.

8/10/2019 Formation Evaluation and Petrophysics Mr D. G. Bowen
http://slidepdf.com/reader/full/formation-evaluation-and-petrophysics-mr-d-g-bowen 194/225
The CEC was evaluated either by wet chemical titration with ammonia ions (NH 3+), Barium
ions (Ba 2+), Membrane potential measurements or multiple Rw saturation and Ro
determination. CEC measured by wet chemistry was determined in terms of 100g ofmaterial. This is related to pore space by the following equation,
Qv = CEC (1 - f ) r ma
100f,
Where Qv is the quantity of cation exchanging material per ml of pore-space.
The Waxman Smits equation is,
BCw C = - -æ
èç ö ø÷
æèç
ö ø÷
é
ëê
ù
ûú 1 06
0 013004625. exp
..@
, in terms of conductance
1æ ö÷l
1 + RwBQv
çç
÷÷

8/10/2019 Formation Evaluation and Petrophysics Mr D. G. Bowen
http://slidepdf.com/reader/full/formation-evaluation-and-petrophysics-mr-d-g-bowen 195/225
n * = ln Sw èç ø÷ln
Q
RI 1 + RwBQV
Sw æèç
ö ø÷è
ççç ø
÷÷÷
If there is an advantage of the Waxman Smits equation it is that when Qv is zero, the
equation simplifies to the Archie equation. The principle disadvantage of the equation is
that it relies upon a large database of measurements of CEC on core material. This has
made it unattractive to the average user. It also can only be solved iteratively.
The Dual Water Model
This equation started off as an attempt to advance the Waxman Smits model Clavier et al
While no one is certain which of the alternative physical models is correct there is no doubt
that the bound water layer can act like an electrolyte in a capacitor and increase the
impedance between the pore-water ionic conduction and the clay-bound ionic conduction
through dielectric effects.
This occurs as the anions are excluded from the bound water system. The cations become
complexed in a zone of decreasing salinity. Some research also suggests that the bound

8/10/2019 Formation Evaluation and Petrophysics Mr D. G. Bowen
http://slidepdf.com/reader/full/formation-evaluation-and-petrophysics-mr-d-g-bowen 196/225
water becomes more dense taking on a semi-crystalline structure. Whatever the case, we
should adapt our shaly sand models accordingly
The Dual Water model then treats clays as a complex of clay and surface water. The rest
of the pore water is the far-water. The amount of bound water actually depends on the
surface area of the clay. Some research has shown that clay CEC is actually proportional
to the surface area of the clay and less dependent upon its bulk chemistry. This is simply
because any surface chemistry is bound to have yields dependent upon the amount of
surface available to react upon. The surface area of 1g of montmorillonite is approximately
1 x 10 12 the surface area of an equivalent mass of quartz.
e = (1-S wb )× t = Effective Porosity.
Sw = Free water
Effective Porosity =
Swt - Swb ( )×f t 1 - Swb ( )×f t
,
and therefore,
( )

8/10/2019 Formation Evaluation and Petrophysics Mr D. G. Bowen
http://slidepdf.com/reader/full/formation-evaluation-and-petrophysics-mr-d-g-bowen 197/225
Sw = Swt - Swb ( ) 1 - Swb ( ) ,
To solve the equations for a reservoir rock, we need to look at the equivalent of an
Archie relationship,
Sw = aRw m
f tm
Rtn ,
Where f t and Rw m replace their corresponding values. Rw m is defined as the equivalent
Dual Water Model R wb From R sh and t

8/10/2019 Formation Evaluation and Petrophysics Mr D. G. Bowen
http://slidepdf.com/reader/full/formation-evaluation-and-petrophysics-mr-d-g-bowen 198/225

8/10/2019 Formation Evaluation and Petrophysics Mr D. G. Bowen
http://slidepdf.com/reader/full/formation-evaluation-and-petrophysics-mr-d-g-bowen 199/225
STEP BY STEP APPROACH TO Sw
1) Select a valid and representative log reading.
2) Make all the appropriate environmental corrections - in the right order, borehole, bed,invasion.

8/10/2019 Formation Evaluation and Petrophysics Mr D. G. Bowen
http://slidepdf.com/reader/full/formation-evaluation-and-petrophysics-mr-d-g-bowen 200/225
3) Determine V sh and make necessary corrections to porosity.
4) Correct for hydrocarbon density. Use chart CP-9 to obtain f1
and Df to be summed to
find f . For this correction a S hyd is needed from the near wellbore. Conversely you can
use f = f 1(1 - 0.10 r hyd), with r hyd determined from chart CP-10.
5) Solve for Sw using the appropriate choice of shaly-sand equation.
Modern computer programs have most of the common algorithms pre-programmed for use.
PERMEABILITY PREDICTION
If we accept that all the models we have encountered so far will give us a value for the
amount of hydrocarbons in place, then the only remaining thing to determine is how fast willwe be able to produce them. In other words, what will be the rate of return on this project,
or well.

8/10/2019 Formation Evaluation and Petrophysics Mr D. G. Bowen
http://slidepdf.com/reader/full/formation-evaluation-and-petrophysics-mr-d-g-bowen 201/225
We saw in Chapter 1 that most core data will be plotted as porosity versus log permeability.
Where this provides a good trend with little scatter and the core represents all of the range
in permeability, and lithology in the reservoir, then a normal practise would be to build a
core - log porosity transform, so that permeability values may be allocated to down-hole log
data. While this is the simplest approach we could make, it is fraught with potential errors.
Core porosity and permeability data need to be under simulated net overburden. The data
need to have sampled the range in variability of the properties of the reservoir. By this we
mean that the specimen volume and sampling frequency must satisfy the requirements of
support and stationarity within the bounding limits of statistical analysis. Often one foot
This equation was formulated for straight capillary tubes and it has become common to
replace r with the Leverett (1941) mean-hydraulic radius (k/ f )0.5 . It should not be surprising
that this implies some inverse proportionality between k and Pc, and that Sw is some
function of Pc.
From the above relationships we would expect to see Sw vary with height above a free
water level, where buoyant forces = zero, and vary inversely with Pc. If the changes in
h h d l h ld b bl

8/10/2019 Formation Evaluation and Petrophysics Mr D. G. Bowen
http://slidepdf.com/reader/full/formation-evaluation-and-petrophysics-mr-d-g-bowen 202/225
pore geometry within the zone are systematic and proportional we should be able to see a
family of Pc curves that represent the poorest to best quality rock.
An Array of Pc Curves
Demonstrating Sw vs. Height
It should be blatantly obvious that if we can correlate K with Sw we can turn the relationship
round and use Sw to predict k. Petrophysicists have been doing this since the 1940s.
From the Young Laplace equation and the above figures we can imply that,
k a = C ×f bSwi

8/10/2019 Formation Evaluation and Petrophysics Mr D. G. Bowen
http://slidepdf.com/reader/full/formation-evaluation-and-petrophysics-mr-d-g-bowen 203/225
Which is the general form of the Wyllie and Rose expression first postulated in 1950,
where a, b and C are parameters depending upon the grain-size, sorting fluid saturation
and diagenesis in any particular sandstone reservoir. Reported values vary as follows: a =0.5, b = 2.25 - 3.00 and C varies from 100 to 250. Oil with a r hyd of 0.8 gives a value of
250 while gas gives 100.
We should be aware the permeability measured in the lab is a true darcy permeability.
This is known a ‘specific permeability”. In the wellbore we have more than one fluid phase
competing for pore space. The result is that the permeability we estimate is an “effective
permeability”, i.e. the permeability of one fluid phase at less than 100% saturation of that
phase.
RESISTIVITY GRADIENTS
The capillary profile leads to a transition zone between 100% Sw and the Swi. This will
create a gradient between Ro and Rt. If we express this per foot of depth then we can
relate this to the overall permeability of the zone with,
k = C DR DD
× 1 Ro
æèç
ö ø÷× 2.3
r w - r h
æèçç
ö ø÷÷
2
,

8/10/2019 Formation Evaluation and Petrophysics Mr D. G. Bowen
http://slidepdf.com/reader/full/formation-evaluation-and-petrophysics-mr-d-g-bowen 204/225
w h
Where C is a constant around 20, and DR and DD are the change in resistivity and the
change in corresponding depth.
MICRO - RESITIVITY CORRELATION
In recent years the relationship first presented by Gus Archie, between Formation Factor
and permeability has been the focus of new investigation. The focus of this work has been
on adequately describing the permeability variation so that it can be validly upscaled to
compare with Rxo and F.
NMR
In the section dealing with NMR in chapter 2 we saw how the Timur equation could be used
to predict permeability from NMR data.
k = ¢a f 4 FFIBFV è
ç ø÷2, (Timur/Coates’)

8/10/2019 Formation Evaluation and Petrophysics Mr D. G. Bowen
http://slidepdf.com/reader/full/formation-evaluation-and-petrophysics-mr-d-g-bowen 205/225
This is the most popular approach today, once calibrated against core data.
FORMATION TESTERS Perhaps the most important current tool for validating permeability is the formation tester.
The original tools were the FT and FIT, which simple pushed a probe, surrounded by a
seal, against the well-bore and opened a valve to fluid flow. The acquired sample was
brought to the surface to test it for the presence of hydrocarbons.
Each sample was in its self a miniature well test. In the original tools there was provision
for two Amerada type pressure recorders. However, their poor resolution made decent
analysis near impossible until the advent of modern quartz and digital strain gauge
Once a decent hydrostatic column is established a degree of confidence can be applied to
the formation pressure data. The plot of pressure may show that there is more than one
fluid gradient down-hole. This is good news as the likelihood is that the lower gradient is
hydrocarbon.
This technique of identifying the fluid contact is known
as “Gradient Intercept” and is very valuable,
particularly in gas reservoirs Unfortunately in oils the
Gradient 1

8/10/2019 Formation Evaluation and Petrophysics Mr D. G. Bowen
http://slidepdf.com/reader/full/formation-evaluation-and-petrophysics-mr-d-g-bowen 206/225
particularly in gas reservoirs. Unfortunately, in oils the
gradients may not be different enough to give any
depth precision.
The fluid gradient may have spurious data points for a
large variety of reasons, such as reservoir
heterogeneity, over-pressure etc. One example is
when the mud column supercharges a low permeability
zone such that the hydrostatic pressure does not bleed
away.
PRESSURE
Gradient 2
Super-charged
mis the viscosity of the fluid
r p is the effective probe radius
r e is the outer radius of investigation of the flowing field
kd is the effective permeability.
We can simplify the equation because r p is very small with respect to r e and solve it for
permeability,

8/10/2019 Formation Evaluation and Petrophysics Mr D. G. Bowen
http://slidepdf.com/reader/full/formation-evaluation-and-petrophysics-mr-d-g-bowen 207/225
kd = C m q
2p r p DP
, .
Because the geometrical terms are all to do with the probe and packer sizes under pseudo-
hemispherical flow, they can be grouped as a probe constant and the equation simplifies
to;
kd = c × m q DP
.
Chapter 4

8/10/2019 Formation Evaluation and Petrophysics Mr D. G. Bowen
http://slidepdf.com/reader/full/formation-evaluation-and-petrophysics-mr-d-g-bowen 208/225
Reviews
FORMATION EVALUATION AND LOGGING - REVIEW
I. Review cross section of hole for thorough understanding of flush zones,terminology.
Note: Low porosity zones flush deeply and may be badly invaded. A given volumeof H2O is required to build the mud cake and stop filtrate loss. A given watervolume in low porosity invades deeply, while high porosity zones often have shallowinvasion.

8/10/2019 Formation Evaluation and Petrophysics Mr D. G. Bowen
http://slidepdf.com/reader/full/formation-evaluation-and-petrophysics-mr-d-g-bowen 209/225
II. Review numerous example logs.
A. Spontaneous Self Potential (SP) recorded in left track in millivolts perdivision: Note scale used.
1. SP is caused by natural electrical current flow from mud to porousbed to shale to mud, and requires conductive fluid
2. Used for correlation, bed thickness determination, calculation of R w,and shale estimate in certain cases.
3. Influenced by shaliness (suppresses), R w, bed thickness (thin bedssuppress) laminations high resistivity (suppresses) lack of
C. Conductivity (units are millimhos):
1. Review induction principle and sonde design in Schlumberger and Atlas documents.
2 The 6FF40 (6 = coils FF = fully focused) signifies 4 focusing 1

8/10/2019 Formation Evaluation and Petrophysics Mr D. G. Bowen
http://slidepdf.com/reader/full/formation-evaluation-and-petrophysics-mr-d-g-bowen 210/225
2. The 6FF40 (6 = coils, FF = fully focused) signifies 4 focusing, 1transmitting, and 1 receiving coil, with 40” spacing betweentransmitting and receiving coil.
3. The tool indicates horizontal conductance and reads approximately8-10 feet deep. Most of signal comes from large “do-nut” areabeyond normal zone of invasion.
4. It emphasizes conductive beds and tends to skip over resistive bedsless than 2-4’ thick.
5. Requires 6’ thickness in a resistive bed to read R t, but only about 3’in conductive bed.
6. Frequent scale changes are used and the curve often goes off scale,but scale is linear.
2. Sand, lime, dolomite, or any other normal mineral (as well as oil andgas) have infinitely high resistivity and it is only the presence of thewater that gives conductance or lower resistivity.
3. Log calculations for % S w from resistivity requires knowledge of R w ,R t , porosity, formation factor, and saturation exponent.
F. Microlog - Rarely ever used now for porosity; employs two short spacednormal electrodes with 1” and 2” spacing.

8/10/2019 Formation Evaluation and Petrophysics Mr D. G. Bowen
http://slidepdf.com/reader/full/formation-evaluation-and-petrophysics-mr-d-g-bowen 211/225
1. Requires good wall contact. (See Atlas Log Review p. 5-1)
2. Cannot work without invasion.
3. Very erroneous if flushed zone (Rxo) disappears by gravity drainagein high permeability zones.
G. Caliper log - Indicates washouts and presence of mud cake in porous and
permeable zones.
1. Sometimes used to count effecttive net thickness.
3. Requires knowledge of both matrix and fluid travel time.
4. Does not require wall contact as does other pad type devices.
5. Assumes 100% liquid saturation in zone of investigation.
6. Hydration water associated with clay and shale included same aspore water and hence reads high (total) porosity.
7. Requires compaction correction when adjacent shales read > 100micro seconds/foot

8/10/2019 Formation Evaluation and Petrophysics Mr D. G. Bowen
http://slidepdf.com/reader/full/formation-evaluation-and-petrophysics-mr-d-g-bowen 212/225
micro - seconds/foot.
8. Instrument records first sound wave arrival and will “cycle skip” bymissing first wave, if it is weak, such as commonly occurs with gassaturation, poor tool sensitivity selection, poorly compacted shalesand sometimes with fractures.
9. Sonic porosity is high in shaley sands and this results in a low S w
calculated value; hence tool is optimistic in shaley sands.
10. In high porosity hydrocarbon bearing formations with shallow invasionthe log porosity value will be too high and should be multiplied by 0.9in oil and 0.7 in gas formations for approximate connection.
B Density log:
5. Requires wall contact. Bore-hole compensated tool “corrects” forhole irregularities and cake density. (Note amount of correctionused, as this is frequently a source of tool error).
6. If obviously high porosity values are indicated, gas saturation isprobably present within the zone of investigation and a very large
correction is required where corrected porosity equals .6 or .7 ofnon-corrected porosity. However, rather than make such largecorrections, log analysts usually go to nearest “comparable” watersand to get porosity and assume both sands have same porosity.

8/10/2019 Formation Evaluation and Petrophysics Mr D. G. Bowen
http://slidepdf.com/reader/full/formation-evaluation-and-petrophysics-mr-d-g-bowen 213/225
7. Density log porosity is lower than sonic porosity in shaley sands, butre Calculated S w will be higher than S w value calculated fromsonic. (Geologists therefore usually prefer the optimistic sonic withits lower S w calculation).
8. Bulk density value read from Density log should be equal to oursaturated sample density value.
9. Combination Sonic and Density porosity allows calculation forshaliness or Q factor:
Q = f s - f D f s
a. Q factor is used in Schlumberger’s calculation of empiricalb ll d f

8/10/2019 Formation Evaluation and Petrophysics Mr D. G. Bowen
http://slidepdf.com/reader/full/formation-evaluation-and-petrophysics-mr-d-g-bowen 214/225

8/10/2019 Formation Evaluation and Petrophysics Mr D. G. Bowen
http://slidepdf.com/reader/full/formation-evaluation-and-petrophysics-mr-d-g-bowen 215/225
FORMATION DENSITY VS POROSITY - Sch Chart POR-5 r ma = Grain Density
r b = Bulk Density (From Density Log)
r f = Fluid Density (1.0 fresh mud; 1.1 salt water mud)
f = Porosity
f = r ma - r b
r - r f

8/10/2019 Formation Evaluation and Petrophysics Mr D. G. Bowen
http://slidepdf.com/reader/full/formation-evaluation-and-petrophysics-mr-d-g-bowen 216/225
r ma r f
COMMON GRAIN DENSITY VALUES:Sandstone - 2.65
Limestone - 2.71
Dolomite - 2.87
ACOUSTIC OR SONIC LOG VS POROSITY Sch Chart POR-3 Dt = Travel time reading from log
Dtma = Travel time of matrix

8/10/2019 Formation Evaluation and Petrophysics Mr D. G. Bowen
http://slidepdf.com/reader/full/formation-evaluation-and-petrophysics-mr-d-g-bowen 217/225
Commonly Used Values Dtma Dtf -Dtma
Sandstone 51.0 138.055.5 133.5
Limestone 47.6 141.4
Dolomite 43.5 145.5
WATER SATURATION (Ratio Method) (Clean Formations Only) Sch Chart SW 2

8/10/2019 Formation Evaluation and Petrophysics Mr D. G. Bowen
http://slidepdf.com/reader/full/formation-evaluation-and-petrophysics-mr-d-g-bowen 218/225
WATER SATURATION (Ratio Method) (Clean Formations Only) Sch Chart SW-2
R xo
R t= Resistivity of flushed zone over Resistivity of unflushed zone
(This ratio is usually derived from Sch Chart Rint-2 or D A Chart 4-4)
Rmf = Resistivity of mud filtrate at formation temperature
Rw = Resistivity of formation water at formation temperature
S w = Water Saturation
.625 = Exponent (This value remains constant) S w =R xo / R tRmf / Rw
æèç
ö ø÷
.625
WATER SATURATION (Archie Method) (Clean Formation) Sch Nomogram SW 1
Ro = Resistivity of uninvaded formation when 100% saturated with water
R t = Resistivity of uninvaded formation
F = Formation Factor
Rw = Resistivity of formation water at formation temperatureS w = Water saturation of uninvaded formation
Rwa = Apparent resistivity of formation water

8/10/2019 Formation Evaluation and Petrophysics Mr D. G. Bowen
http://slidepdf.com/reader/full/formation-evaluation-and-petrophysics-mr-d-g-bowen 219/225
Rwa =RtF S
w
=RwR wa
n
When 100% water saturated then:
Rw =RoF
or F =RoRw
or
S w =
Ro
Rtn
SUMMARY OF OFTEN USED FORMULAS
Formation Temperature:BHT - MST
TD
= GG BHT - [(TD - FD) GG] = FT
Resistivity vs Temperature: R 2 = R 1T1 + 6.77T2 + 6.77
æèç ö
ø÷

8/10/2019 Formation Evaluation and Petrophysics Mr D. G. Bowen
http://slidepdf.com/reader/full/formation-evaluation-and-petrophysics-mr-d-g-bowen 220/225
Rw & Rwe vs SSP: SSP = -K c logRmfe
R we
æ
èç ö
ø÷ Rwe =
R mfe
R mfeR we
æèç ö
ø÷
Formation Factor vs Porosity: F =a
f m
Density Porosity: f = r ma - r b r ma - r f

8/10/2019 Formation Evaluation and Petrophysics Mr D. G. Bowen
http://slidepdf.com/reader/full/formation-evaluation-and-petrophysics-mr-d-g-bowen 221/225
FE/1
FORMATION EVALUATION - LOGGING TOOL SUMMARY
LoggingTool Use Basic Principles
Borehole Conditions(Most Favorable)
Major Factors Affecting Measurements
SP(pontaneous-
Potential)
LithologyCorrelation
BedBoundaries
Rw
Measures potential differencebetween a shale-sand or shale-carbonate due to the difference inion concentration of the boreholefluids and formation waters.(normally run with electric orinduction log)
Open hole using fresh water mud.(mud must be conductive)
· Salt mud (low R mf ) · Fresh Formation Water (high R w) · Shaliness · Thin beds · Deep invasion or enlarged
boreholeHigh R t (high HydrocarbonSaturation or dense zone)
CONVENTIONALELECTRIC
(Normal andLateral)
CorrelationBed
BoundariesR t
Measures potential differencebetween two points due to electriccurrent introduced into borehole.Potential difference is proportionalto the apparent formation resistivity(current allowed to seek path ofleast resistance)
Open hole using fresh water mud.(mud must be conductive)
· Mud resistivity (low R m) · Hole diameter (large d) · Invaded zone resistivity (low R i) · Invaded zone diameter (large D i) · R t (high)R s (low)

8/10/2019 Formation Evaluation and Petrophysics Mr D. G. Bowen
http://slidepdf.com/reader/full/formation-evaluation-and-petrophysics-mr-d-g-bowen 222/225
D Bowen 2000 208
least resistance)FOCUSEDCURRENTELECTRIC
(Laterolog)
CorrelationBed
Boundaries
R t
Same as conventional electric log.Introduced current is focused intoformation for better bed resolution
and deeper investigation in highresistivity zones.
Open hole using salt based mud.(Rmf < Rw)
· Borehole washout (large d) · Depth of invasion (large D i) · Fresh water mud (high R mf )
INDUCTION R t A.C. current in transmitter coilinduces eddy currents in formation.Eddy currents induce a potential inreceiver coil which is proportional toformation conductivity.
Open hole using conductive ornon-conductive muds (or gasfilled boreholes)
· Borehole effects generallynegligible
· Adjacent bed effects negligibleexcept for resistive beds less than5’ thick and conductive beds lessthan 3’ thick
Di > 30” Fresh mud preferable(R i > R t)
FE/1
LOGGING TOOL SUMMARY Page 2
LoggingTool Use Basic Principles
Borehole Conditions(Most Favorable)
Major Factors Affecting Measurements
CONTACTTYPE(Microlog)
BedBoundariesRxo
Rxos
Pad type device. Introduces electriccurrent into formation and measurespotential difference between twopoints. Potential difference isproportional to resistivity. (caliperusually run with tool)
Open hole using fresh water mud.(thickness of mud cakes < 1/2”)
· Mud cake thickness >1/2” · Salt based mud · Borehole washout · Quality control (logging speed,
mud properties and BHT) · Porosity < 15%
FOCUSEDCONTACTTYPE (Micro-Laterolog)
BedBoundariesRxo
Rxos
Same as contact type log. Electriccurrent is focused into formation
Open hole using fresh or salt mud · Mud cake thickness >1/4” (usecorrection charts)
· Borehole washout
ACOUSTIC(Sonic)
f Transmitter emits high frequencysound pulses. Travel time for pulset h t i i d
Open hole using conductive ornon-conductive mud. (cannot use
· Shaliness · Borehole irregularities

8/10/2019 Formation Evaluation and Petrophysics Mr D. G. Bowen
http://slidepdf.com/reader/full/formation-evaluation-and-petrophysics-mr-d-g-bowen 223/225
D Bowen 2000 209
to reach two receivers is measured.Porosity is a function of difference intravel time between these tworeceivers. (BHC uses 2 transmittersand 4 receivers)
in gas filled borehole) · Gas in mud or formation (cycleskipping)
· Vulgar porosity
· Fractures (cycle skipping)GAMMA RAY Correlation
LithologyDepthControl(cased hole)
Measures natural radioactivity offormations. Shales have highradioactivity.
Open or cased hole. · Time constant · Logging speed · Borehole size and fluid (can
reduce measurement) · Casing and cement (reducesmeasurement) ·
FE/1
LOGGING TOOL SUMMARY Page 3
LoggingTool Use Basic Principles
Borehole Conditions(Most Favorable)
Major Factors Affecting Measurements
NEUTRON fCorrelationDepthControl(cased holes)GasRecognition
Formation is bombarded withneutrons. Neutrons are capturedmainly by hydrogen. Neutrondetector 1’ to 2’ from sourcemeasures neutron count rate. Countrate related to amount of hydrogen information and ideally to porosity.(includes pad type - SNP)
Open or cased hole (only casedhole porosity tool)
· Gas in borehole or formation · Casing and tubing (reduces countrate)
· Logging speed - Time Constant · Source-Detector spacing · Borehole size
DENSITY fCorrelationGasRecognition
Gamma rays are directed intoformation. Gamma rays areattenuated and scattered byformation elements. Detectormeasures gamma ray count.F i d i i f i f
Open hole using conductive ornon-conductive mud (or gas filledboreholes)
· Borehole irregularities · Gas in formation

8/10/2019 Formation Evaluation and Petrophysics Mr D. G. Bowen
http://slidepdf.com/reader/full/formation-evaluation-and-petrophysics-mr-d-g-bowen 224/225
D Bowen 2000 210
Formation density is a function ofcount rate and density is related toporosity. (pad type device and BHC)
NEUTRONDECAY (TDTNLL)
OWCGWCGOCS w
Neutron source emits high energyneutrons into formation. Neutronsare slowed primarily by hydrogenand captured mainly by chlorine.Capture causes gamma rays to beemitted which are a function of theslow neutrons present. Detectormeasures gamma ray count at 2times and this is related to totalformation capture cross section.Formation capture cross section isrelated to f and S w.
Cased hole · Formation water salinity(> 20,000 ppm chlorid) · Perforated intervals (use lowinvasion mud) · Borehole size changes · Casing size and weight changes · Cement · Shaliness
FE/1

8/10/2019 Formation Evaluation and Petrophysics Mr D. G. Bowen
http://slidepdf.com/reader/full/formation-evaluation-and-petrophysics-mr-d-g-bowen 225/225
D Bowen 2000 211