Characterization of Seafood Proteins Causing Allergic Diseases
Upload
envicon-medical-srlCategory
view
202download
0
What is New in Pediatric Allergic Diseases 2015
Attilio BonerUniversity ofVerona, Italy
Diagnosis
Food Allergy
Atopic Dermatitis
Allergic Asthma
Allergic Rhinitis
Anaphylaxis
Urticaria & Angioedema
Risk & Protective factors
Burden

The predictive value of allergen skin prick tests and IgEtests at pre-school age: The PACT study
Dorthea RA, PAI 2014;25:691–698
Background•Sensitization toward allergens, as determined by SPTs or sIgE, is a predictor for the later presence of allergy-related disease (atopic eczema, allergic rhinoconjuctivitis and asthma).
•However, it is not known whether SPT or sIgE should be the preferred test.•The aim of this study was to compare the predictive ability of SPT and sIgE when performed in a general population of 2-yr-old children.

longitudinal population-based study of children aged2–6 yr
SPTs and sIgE for 9 common allergens performed at 2 yr
allergy related disease evaluated by clinical examination and questionnaire at 2 and 6 yr of age (n = 199)
40 –
30 –
20 –
10 –
.010.6%
21.1%
% children aging 2 yrs with
(+) SPTs (+) sIgE
The predictive value of allergen skin prick tests and IgEtests at pre-school age: The PACT study
Dorthea RA, PAI 2014;25:691–698

OR for subsequent allergic diseaseby age 6 yrs
7.0 –
6.0 –
5.0 –
4.0 –
3.0 –
2.0 –
1.0 –
0.0
6.5
4.1
(+) SPTs (+) sIgE
The predictive value of allergen skin prick tests and IgEtests at pre-school age: The PACT study
Dorthea RA, PAI 2014;25:691–698
longitudinal population-based study of children aged2–6 yr
SPTs and sIgE for 9 common allergens performed at 2 yr
allergy related disease evaluated by clinical examination and questionnaire at 2 and 6 yr of age (n = 199)
Sensitization at 2 yr may be
useful predictors of allergy-related
diseaselater in childhood

OR for subsequent allergic diseaseby age 6 yrs
7.0 –
6.0 –
5.0 –
4.0 –
3.0 –
2.0 –
1.0 –
0.0
6.5
4.1
(+) SPTs (+) sIgE
The predictive value of allergen skin prick tests and IgEtests at pre-school age: The PACT study
Dorthea RA, PAI 2014;25:691–698
longitudinal population-based study of children aged2–6 yr
SPTs and sIgE for 9 common allergens performed at 2 yr
allergy related disease evaluated by clinical examination and questionnaire at 2 and 6 yr of age (n = 199)
Receiver operating characteristic analysis showed that SPT and sIgE had comparable predictive ability for
atopic eczema, asthma or any allergy-related disease, but sIgE had
better ability to predict later allergic rhinoconjunctivitis.
ns

Disagreement between skin prick test and specific IgEin young children Schoos A. M. M. Allergy 2015;70:41
389 children from the Copenhagen Prospective Study on Asthma in Childhood
SPTs and sIgE levels assessed simultaneously for 16 common inhalant and food allergens at age ½, 1½, 4, and 6 years
Inhalant allergens: changes in prevalence over time

Inhalant allergens: changes in prevalence over time
Disagreement between skin prick test and specific IgEin young children Schoos A. M. M. Allergy 2015;70:41
The prevalence of inhalant allergen sensitization increased during childhood diagnosed by both sIgE levels (p<0.0001) and SPT results (p<0.0001)

Inhalant allergens, agreement between SPT and sIgE. The numbers in the figure are
absolute numbers
Disagreement between skin prick test and specific IgEin young children Schoos A. M. M. Allergy 2015;70:41
389 children from the Copenhagen Prospective Study on Asthma in Childhood
SPTs and sIgE levels assessed simultaneously for 16 common inhalant and food allergens at age ½, 1½, 4, and 6 years

Food allergens: changes in prevalence over time
Disagreement between skin prick test and specific IgEin young children Schoos A. M. M. Allergy 2015;70:41
389 children from the Copenhagen Prospective Study on Asthma in Childhood
SPTs and sIgE levels assessed simultaneously for 16 common inhalant and food allergens at age ½, 1½, 4, and 6 years

The Prevalence of food sensitization increased during childhood when diagnosed from sIgE (p<0.0001), but decreased when diagnosed from SPT (p=0.05)
Food allergens: changes in prevalence over time
Disagreement between skin prick test and specific IgEin young children Schoos A. M. M. Allergy 2015;70:41

Food allerges, agreement betweenSPT and SIgE.
The numbers in the figure are absolute numbers
Disagreement between skin prick test and specific IgEin young children Schoos A. M. M. Allergy 2015;70:41
389 children from the Copenhagen Prospective Study on Asthma in Childhood
SPTs and sIgE levels assessed simultaneously for 16 common inhalant and food allergens at age ½, 1½, 4, and 6 years
Overall, the agreement between SPT and sIgE
levels was poor to moderate(all κ-coefficients≤0.60)
and decreased from moderate to slight for food allergens by increasing age
(κ-coefficients: 0.46)

1) We observed that the agreement between SPT and sIgE levels for diagnosing inhalant and food allergen sensitization during preschool age was at best moderate with a striking decrease in agreement with age for food sensitization
2) Increasing the cutoff level of sIgE to 1.0 kUA/l had no noteworthy effect on agreement
3) The pattern observed for sensitization to food allergens measured by sIgE, with increasing prevalence with age, suggests this does not reflect clinical food allergy
4) Some commercial SPT extracts do not contain all the components of the foods, which may result in a higher sensitization prevalence using sIgE levels compared to SPT
Disagreement between skin prick test and specific IgEin young children Schoos A. M. M. Allergy 2015;70:41

5) In addition, cross-reactivity between inhalant and food allergens could add to the disagreement, for example, cross-reactivity between Bet v 1 in birch and Ara h8 in peanut would result in a higher prevalence of positive sIgE measurements for peanut compared to SPT, if the SPT extract does not contain Ara h8
6) An alternative explanation for the disagreeing test results might be that the immune response is different in the skin and in the blood
7) The disagreement between SPT and sIgE results emphasizes the importance of careful interpretation of test results based on assessment method, clinical history, age of the child, and the type of allergen tested for.
Disagreement between skin prick test and specific IgEin young children Schoos A. M. M. Allergy 2015;70:41
SPTs may underestimate the prevalenceof mite, dog, grass, and birch allergy.

The effect of component-resolved diagnosis on specific immunotherapy prescription in children with hay fever.
Stringari G, J Allergy Clin Immunol 2014;134:75-81
Background:
Sensitization to profilins and other cross-reacting molecules might hinder proper specific immunotherapy (SIT) prescription in polysensitized patients with pollen-related allergic rhinitis (AR).
In these patients, component-resolved diagnosis (CRD) might modify SIT prescription by improving the identification of the disease-eliciting pollen sources.
The effect of component-resolved diagnosis on specific immunotherapy prescription in children with hay fever.
Stringari G, J Allergy Clin Immunol 2014;134:75-81
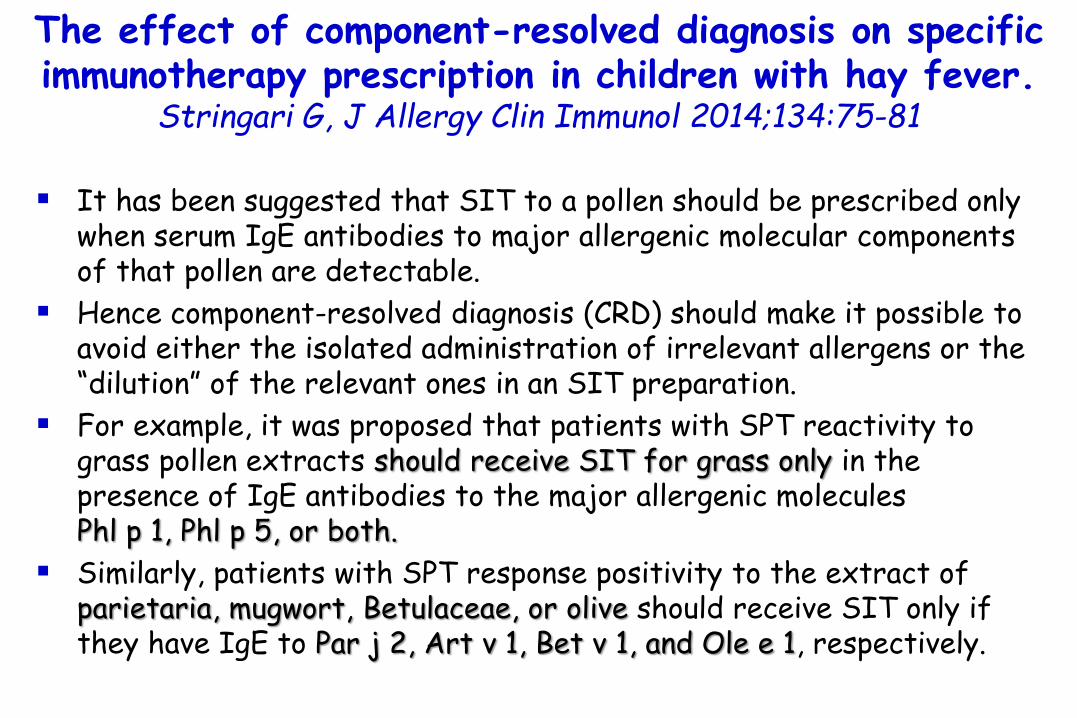
It has been suggested that SIT to a pollen should be prescribed only when serum IgE antibodies to major allergenic molecular components of that pollen are detectable.
Hence component-resolved diagnosis (CRD) should make it possible to avoid either the isolated administration of irrelevant allergens or the “dilution” of the relevant ones in an SIT preparation.
For example, it was proposed that patients with SPT reactivity to grass pollen extracts should receive SIT for grass only in the presence of IgE antibodies to the major allergenic molecules Phl p 1, Phl p 5, or both.
Similarly, patients with SPT response positivity to the extract of parietaria, mugwort, Betulaceae, or olive should receive SIT only if they have IgE to Par j 2, Art v 1, Bet v 1, and Ole e 1, respectively.

The effect of component-resolved diagnosis on specific immunotherapy prescription in children with hay fever.
Stringari G, J Allergy Clin Immunol 2014;134:75-81
No IgE to the respective major allergens was detected in significant proportions of patients with supposed clinically relevant
sensitization to
69%60%
30%
Betulaceae Parietaria
70 –
60 –
50 –
40 –
30 –
20 –
10 –
00
Mugwort
artemisia
Children (n = 651) with moderate-to-severe pollen-related AR recruited 16 Italian outpatient clinics.
SPT to grass, Betulaceae, cypress, mugwort, olive, parietaria.
IgE to Phl p 1, Phl p 5, Bet v 1, Cup a 1, Art v 1, Ole e 1, Par j 2, and Phl p 12 (profilin) by ImmunoCAP.
(-) Art v 1
(-) Bet v 1
(-) Par j 2

The effect of component-resolved diagnosis on specific immunotherapy prescription in children with hay fever.
Stringari G, J Allergy Clin Immunol 2014;134:75-81
28%
15%10%
Cypress Grass
30 –
20 –
10 –
00
Olive
No IgE to the respective major allergens was detected in significant proportions of patients with supposed clinically relevant
sensitization to
(-) Ole e 1
(-) Cup a 1
(-) Phl p 1(-) Phl p 5
Children (n = 651) with moderate-to-severe pollen-related AR recruited 16 Italian outpatient clinics.
SPT to grass, Betulaceae, cypress, mugwort, olive, parietaria.
IgE to Phl p 1, Phl p 5, Bet v 1, Cup a 1, Art v 1, Ole e 1, Par j 2, and Phl p 12 (profilin) by ImmunoCAP.

Children (n = 651) with moderate-to-severe pollen-related AR recruited 16 Italian outpatient clinics.
SPT to grass, Betulaceae, cypress, mugwort, olive, parietaria.
IgE to Phl p 1, Phl p 5, Bet v 1, Cup a 1, Art v 1, Ole e 1, Par j 2, and Phl p 12 (profilin) by ImmunoCAP.
The effect of component-resolved diagnosis on specific immunotherapy prescription in children with hay fever.
Stringari G, J Allergy Clin Immunol 2014;134:75-81
28%
15%10%
Cypress Grass
30 –
20 –
10 –
00
Olive
No IgE to the respective major allergens was detected in significant proportions of patients with supposed clinically relevant
sensitization to
(-) Ole e 1
(-) Cup a 1
(-) Phl p 1(-) Phl p 5
IgE to panallergens: profilins (Phl p 12),polcalcins, or both
could justify 173 (37%) of 464
of these SPT reactions.

European American
The effect of component-resolved diagnosis on specific immunotherapy prescription in children with hay fever.
Stringari G, J Allergy Clin Immunol 2014;134:75-81
42%48% 47%
50 –
40 –
30 –
20 –
10 –
00
% of SIT prescription that was changed after component resolved
diagnosis according to
Approach
Opinion of the 14 local pediatric
allergists
Children (n = 651) with moderate-to-severe pollen-related AR recruited 16 Italian outpatient clinics.
SPT to grass, Betulaceae, cypress, mugwort, olive, parietaria.
IgE to Phl p 1, Phl p 5, Bet v 1, Cup a 1, Art v 1, Ole e 1, Par j 2, and Phl p 12 (profilin) by ImmunoCAP.

Children (n = 651) with moderate-to-severe pollen-related AR recruited 16 Italian outpatient clinics.
SPT to grass, Betulaceae, cypress, mugwort, olive, parietaria.
IgE to Phl p 1, Phl p 5, Bet v 1, Cup a 1, Art v 1, Ole e 1, Par j 2, and Phl p 12 (profilin) by ImmunoCAP.
European American
The effect of component-resolved diagnosis on specific immunotherapy prescription in children with hay fever.
Stringari G, J Allergy Clin Immunol 2014;134:75-81
42%48% 47%
50 –
40 –
30 –
20 –
10 –
00
% of SIT prescription that was changed after component resolved
diagnosis according to
Approach
Opinion of the 14 local pediatric
allergists
In children with pollen-related AR, applying CRD leads
to changes in a large proportion of SIT prescriptions as opposed to relying on clinical history and SPT alone.

The effect of component-resolved diagnosis on specific immunotherapy prescription in children with hay fever.
Stringari G, J Allergy Clin Immunol 2014;134:75-81
Criteria for SIT prescription
A. European Monosensitization or Not more than 3polysensitization
B. American Monosensitization or As many as the clinically polysensitization relevant sensitization
C. Monoallergenic Monosensitization or Only 1polysensitization
D. Monosensitization Monosensitization Only 1
Model Patient's clinicallyrelevant sensitization
Number of allergenicextracts

The effect of component-resolved diagnosis on specific immunotherapy prescription in children with hay fever.
Stringari G, J Allergy Clin Immunol 2014;134:75-81
In the European model, when 4 or more clinically relevant sensitizations were detected, the 3 most relevant allergens were selected on the basis of the opinion of the locally recruiting doctor.
In the American model the number of allergenic sources to be mixed was unlimited.
In the monoallergenic model only the most important allergenic source was allowed.

Factors augmenting allergic reactions Niggemann B, Allergy 2014;69:1582
Augmenting factors may explain why certain conditions lead to anaphylaxis.
Augmenting factors may exhibit 3 effects: 1) lowering the threshold, 2) increasing the severity, and 3) reversing acquired clinical tolerance.
Common augmenting factors are
•physical exercise, •menstruation, •NSAIDs, •alcohol, •body temperature, •acute infections, •antacids.

Therapeutic options may address causative, preventive, pragmatic, or symptomatic considerations:
• avoid the eliciting food • take an antihistamine before any situation with a possible
risk of augmentation • separate food and sport (at least for 2 h)• carry an adrenaline autoinjector at all times
Factors augmenting allergic reactions Niggemann B, Allergy 2014;69:1582

Proposal for a new terminology of risk factors for anaphylactic reactions
Factors augmenting allergic reactions Niggemann B, Allergy 2014;69:1582

Different effects of augmenting factors
(A) Lowering the threshold(B) Increasing severity(C) Reversing acquired clinical tolerance
Factors augmenting allergic reactions Niggemann B, Allergy 2014;69:1582

Possible interacting mechanisms of augmentation
Factors augmenting allergic reactions Niggemann B, Allergy 2014;69:1582

Misuse of medical devices: a persistent problem in self-management of asthma and allergic disease
Bonds Ann Allergy 2015;114:74
A. Asthma is likewise a critically important disease.
B. Up to 92% of asthmatic patients incorrectly use inhalers.
C. Even among medical personnel, rates of correct use are suboptimal.
D. This misuse translates into reduced clinical efficacy of therapy.

% MDI users demonstratingperfect technique
7%
The mostcommonly missed step was exhaling to functional residual capacity or residual volume before actuating the canister (66% of imperfect users failed to perform this step).
20 –
15 –
10 –
05 –
00
Misuse of medical devices: a persistent problem in self-management of asthma and allergic disease
Bonds Ann Allergy 2015;114:74
Factors associatedwith incorrect use of metered-dose inhalers (MDIs) and epinephrine autoinjectors.
102 patients using epinephrine and 44 patients using MDIs with spacers from adult and pediatric clinics.

Misuse of medical devices: a persistent problem in self-management of asthma and allergic disease
Bonds Ann Allergy 2015;114:74
Device technique standards: MDI

Errors in metered-dose inhaler technique demonstration.
Misuse of medical devices: a persistent problem in self-management of asthma and allergic disease
Bonds Ann Allergy 2015;114:74
(C) Number of steps performed incorrectly by patients with a MDI
(D) Frequency with which each step was performed incorrectly (MDI).

1) Anaphylaxis is a concerning disorder because of its life-threatening potential and increasing incidence.
2) It is well established that intramuscular epinephrine is a life-saving therapy in anaphylaxis; however, patients frequently do not understand how to self-administer the medication.
3) The problem of incorrect epinephrine autoinjectoruse is documented in the literature with rates of correct use as low as 22%.
4) This misuse has been documented in cases of fatal anaphylaxis.
Misuse of medical devices: a persistent problem in self-management of asthma and allergic disease
Bonds Ann Allergy 2015;114:74

Factors associatedwith incorrect use of metered-dose inhalers (MDIs) and epinephrine autoinjectors.
102 patients using epinephrine and 44 patients using MDIs with spacers from adult and pediatric clinics.
% patients used the epinephrineautoinjector properly
20 –
15 –
10 –
05 –
00
16%The most common error was not holding the unit in place for ≥ 10 seconds after triggering.
This error was done by 76% of patients.
Misuse of medical devices: a persistent problem in self-management of asthma and allergic disease
Bonds Ann Allergy 2015;114:74

Misuse of medical devices: a persistent problem in self-management of asthma and allergic disease
Bonds Ann Allergy 2015;114:74
Device technique standards: EpiPen

Errors in technique demonstration.
Misuse of medical devices: a persistent problem in self-management of asthma and allergic disease
Bonds Ann Allergy 2015;114:74
(A) Number of steps performed incorrectly by patients with epinephrine autoinjector.
(B) Frequency with which each step was performed incorrectly(epinephrine autoinjector).

What is New in Pediatric Allergic Diseases 2015
Attilio BonerUniversity ofVerona, Italy
Diagnosis
Food Allergy
Atopic Dermatitis
Allergic Asthma
Allergic Rhinitis
Anaphylaxis
Urticaria & Angioedema
Risk & Protective factors
Burden

Peanut allergens are rapidly transferred in human breast milk and can prevent sensitization in mice
Bernard H., Allergy 2014; 69: 888
Ara h6 is detected as soon as 10 min after
peanut ingestion, with peak values observed within the first hour
after ingestion.
The transfer is long-lasting, small
quantities of peanut allergens being detected
over a 24-h period
Human breast milk was collected from 2 non-atopic peanut-tolerant mothers before and at different time points after ingestion of 30 g of commercial roasted peanut
Ara h6, Ara h6 immune complexes, and the IgE binding capacity of breast milk samples were measured using specific immunoassays
Human breast milk obtained before or after peanut ingestion was administered intragastricallyto BALB/c mice, and mice were further experimentally sensitized

Peanut allergens are rapidly transferred in human breast milk and can prevent sensitization in mice
Bernard H., Allergy 2014; 69: 888
Human breast milk was collected from 2 non-atopic peanut-tolerant mothers before and at different time points after ingestion of 30 g of commercial roasted peanut
Ara h6, Ara h6 immune complexes, and the IgE binding capacity of breast milk samples were measured using specific immunoassays
Human breast milk obtained before or after peanut ingestion was administered intragastricallyto BALB/c mice, and mice were further experimentally sensitized
Peanut allergens
transferred in milk are IgEreactive and can induce an
allergic reaction in vitro
Ara h6 is detected as soon as 10 min after
peanut ingestion, with peak values observed within the first hour
after ingestion.
The transfer is long-lasting, small
quantities of peanut allergens being detected
over a 24-h period

Ara h6 is rapidly excreted in human breast milk
Peanut allergens are rapidly transferred in human breast milk and can prevent sensitization in mice
Bernard H., Allergy 2014; 69: 888
Human breast milk was collected from 2 non-atopic peanut-tolerant mothers before and at different time points after ingestion of 30 g of commercial roasted peanut
Ara h6, Ara h6 immune complexes, and the IgE binding capacity of breast milk samples were measured using specific immunoassays
Human breast milk obtained before or after peanut ingestion was administered intragastricallyto BALB/c mice, and mice were further experimentally sensitized
24 hrs12 hrs10 min

However, administration of
human breast milk to young mice, notably
before weaning, does not lead to
sensitization, but instead to
partial oral tolerance
Peanut allergens are rapidly transferred in human breast milk and can prevent sensitization in mice
Bernard H., Allergy 2014; 69: 888
Human breast milk was collected from 2 non-atopic peanut-tolerant mothers before and at different time points after ingestion of 30 g of commercial roasted peanut
Ara h6, Ara h6 immune complexes, and the IgE binding capacity of breast milk samples were measured using specific immunoassays
Human breast milk obtained before or after peanut ingestion was administered intragastricallyto BALB/c mice, and mice were further experimentally sensitized

Randomized Trial of Peanut Consumptionin Infants at Risk for Peanut Allergy
Du Toit G, N Engl J Med 2014;372:803-13
640 infants, aged between 4 and 11 months, with severe eczema, egg allergy, or both.
Randomly assigned to:
dietary peanut consumption or
dietary peanut avoidance.
Randomly stratified into 2 studycohorts on the basis of the resultsof a skin prick test for peanut allergy:
no measurable wheal
a wheal measuring1 to 4 mm in diameter.
20 –
15 –
10 –
05 –
00Avoidance
GroupConsumption
Group
p<0.00117.2%
3.2%
Prevalence of peanut allergy(+OFC) at 60 months of age
in the whole cohort.±

±
Randomized Trial of Peanut Consumptionin Infants at Risk for Peanut Allergy
Du Toit G, N Engl J Med 2014;372:803-13
640 infants, aged between 4 and 11 months, with severe eczema, egg allergy, or both.
Randomly assigned to:
dietary peanut consumption or
dietary peanut avoidance.
Randomly stratified into 2 studycohorts on the basis of the resultsof a skin prick test for peanut allergy:
no measurable wheal
a wheal measuring1 to 4 mm in diameter.
20 –
15 –
10 –
05 –
00Avoidance
GroupConsumption
Group
p<0.00117.2%
3.2%
Increases in levels of peanut-specific IgG4 antibody
occurred predominantlyin the consumption group.
A greater percentage of participants
in the avoidance group hadelevated titres of
peanut-sIgE.
sIgEsIgG4
Prevalence of peanut allergy(+OFC) at 60 months of age
in the whole cohort.

Randomized Trial of Peanut Consumptionin Infants at Risk for Peanut Allergy
Du Toit G, N Engl J Med 2014;372:803-13
Prevalence of peanut allergy (+OFC) at 60 months of age
in the (+) SPT cohort.
40 –
30 –
20 –
10 –
0Avoidance
GroupConsumption
Group
p=0.00435.3%
10.6%
640 infants, aged between 4 and 11 months, with severe eczema, egg allergy, or both.
Randomly assigned to:
dietary peanut consumption or
dietary peanut avoidance.
Randomly stratified into 2 studycohorts on the basis of the resultsof a skin prick test for peanut allergy:
no measurable wheal
a wheal measuring1 to 4 mm in diameter.
±

Randomized Trial of Peanut Consumptionin Infants at Risk for Peanut Allergy
Du Toit G, N Engl J Med 2014;372:803-13
40 –
30 –
20 –
10 –
0Avoidance
GroupConsumption
Group
p<0.001
13.7% 1.9%
Prevalence of peanut allergy (+OFC) at 60 months of age
in the (-) SPT cohort.
640 infants, aged between 4 and 11 months, with severe eczema, egg allergy, or both.
Randomly assigned to:
dietary peanut consumption or
dietary peanut avoidance.
Randomly stratified into 2 studycohorts on the basis of the resultsof a skin prick test for peanut allergy:
no measurable wheal
a wheal measuring1 to 4 mm in diameter.
±

±
Randomized Trial of Peanut Consumptionin Infants at Risk for Peanut Allergy
Du Toit G, N Engl J Med 2014;372:803-13
40 –
30 –
20 –
10 –
0Avoidance
GroupConsumption
Group
p<0.001
13.7% 1.9%
640 infants, aged between 4 and 11 months, with severe eczema, egg allergy, or both.
Randomly assigned to:
dietary peanut consumption or
dietary peanut avoidance.
Randomly stratified into 2 studycohorts on the basis of the resultsof a skin prick test for peanut allergy:
no measurable wheal
a wheal measuring1 to 4 mm in diameter.
Early introduction of peanutssignificantly decreasedthe frequency of the
development of peanut allergyamong children at high risk
for this allergyand modulated immune responses to peanuts.
Prevalence of peanut allergy (+OFC) at 60 months of age
in the (-) SPT cohort.

Tolerance to egg proteins in egg-sensitized infants without previous consumption Alvaro M, Allergy 2014;69:1350
Background:
•Egg-sensitized infants who have never eaten egg may react at first ingestion.
•We sought to determine the association between skin prick test (SPT) and sIgE to egg proteins (EP) and oral food challenge (OFC) outcomes to find cut-off points which can diagnose egg allergy.
±

Patient classification relating SPT and outcomes after OFC
Tolerance to egg proteins in egg-sensitized infants without previous consumption Alvaro M, Allergy 2014;69:1350
154 infants up to 18 months, with cow’s milk allergy (CMA) and/or atopic dermatitis (AD) without previous egg consumption
Skin prick test (SPT) to egg proteins (EP) were performed. If it was positive, sIgE was performed
If positive SPT and/or sIgE(n = 94), oral food challenge (OFC) performed between 12 and 18 months
±

±Patient classification relating SPT and outcomes after OFC
Tolerance to egg proteins in egg-sensitized infants without previous consumption Alvaro M, Allergy 2014;69:1350
154 infants up to 18 months, with cow’s milk allergy (CMA) and/or atopic dermatitis (AD) without previous egg consumption
Skin prick test (SPT) to egg proteins (EP) were performed. If it was positive, sIgE was performed
If positive SPT and/or sIgE(n = 94), oral food challenge (OFC) performed between 12 and 18 months
Egg white (EW) and ovalbumin
(OVA) sIgE have the best area
under the curve (AUC)

Sensitized infants
but “cooked egg tolerant”
154 infants up to 18 months, with cow’s milk allergy (CMA) and/or atopic dermatitis (AD) without previous egg consumption
Skin prick test (SPT) to egg proteins (EP) were performed. If it was positive, sIgE was performed
If positive SPT and/or sIgE(n = 94), oral food challenge (OFC) performed between 12 and 18 months
Tolerance to egg proteins in egg-sensitized infants without previous consumption Alvaro M, Allergy 2014;69:1350
±

±
Sensitized infants
but “cooked egg tolerant”
154 infants up to 18 months, with cow’s milk allergy (CMA) and/or atopic dermatitis (AD) without previous egg consumption
Skin prick test (SPT) to egg proteins (EP) were performed. If it was positive, sIgE was performed
If positive SPT and/or sIgE(n = 94), oral food challenge (OFC) performed between 12 and 18 months
Tolerance to egg proteins in egg-sensitized infants without previous consumption Alvaro M, Allergy 2014;69:1350
In egg-sensitized infants with egg white (EW)
SPT ≥8mm and/or EW sIgE ≥8.36 KU/l,
egg diagnostic oral food challenge (OFC) can be
avoided as there is 94% probability of resulting positive

±
Sensitized infants
but “cooked egg tolerant”
154 infants up to 18 months, with cow’s milk allergy (CMA) and/or atopic dermatitis (AD) without previous egg consumption
Skin prick test (SPT) to egg proteins (EP) were performed. If it was positive, sIgE was performed
If positive SPT and/or sIgE(n = 94), oral food challenge (OFC) performed between 12 and 18 months
Tolerance to egg proteins in egg-sensitized infants without previous consumption Alvaro M, Allergy 2014;69:1350
In the other patients, oral food challenge (OFC)
should be performed safely and early to avoid unnecessary diets

Predicting Outcomes of Oral Food Challenges by Using the Allergen-Specific IgE–Total IgE Ratio
Gupta RS, J Allergy Clin Immunol Pract 2014;2:300-5
Background Although allergists typically use allergen-specific IgE (sIgE) levels or
skin prick test wheal sizes to identify food allergens that may provoke IgE-mediated food-induced allergic reactions, both tests have high rates of false positivity and mislabel patients who are tolerant as allergic to the food allergen.
Objective To examine the accuracy of the ratio of sIgE to total IgE (“Ratio”) in
predicting the outcome of challenges performed to confirm the development of tolerance.
Ratio = (sIgE/tIgE) × 100

Predicting Outcomes of Oral Food Challenges by Using the Allergen-Specific IgE–Total IgE Ratio
Gupta RS, J Allergy Clin Immunol Pract 2014;2:300-5
Children diagnosed with food allergy.
Oral food challenge.
The Ratio was calculated by using the following formula: Ratio = (sIgE/tIgE) × 100.
sIgE to total IgE (“Ratio”) %
0.49%
1.5 –
1.0 –
0.5 –
00
1.48%
(-) (+)
FOOD CHALLENGE

Predicting Outcomes of Oral Food Challenges by Using the Allergen-Specific IgE–Total IgE Ratio
Gupta RS, J Allergy Clin Immunol Pract 2014;2:300-5
Children diagnosed with food allergy.
Oral food challenge.
The Ratio was calculated by using the following formula: Ratio = (sIgE/tIgE) × 100.
sIgE to total IgE (“Ratio”) %
0.49%
1.5 –
1.0 –
0.5 –
00
1.48%
FOOD CHALLENGE
The Ratio was significantly more accurate than sIgEalone in predicting challenge outcome
(Ratio 0.69 vs sIgEalone 0.55; P =0.03 ).
(-) (+)

Predicting Outcomes of Oral Food Challenges by Using the Allergen-Specific IgE–Total IgE Ratio
Gupta RS, J Allergy Clin Immunol Pract 2014;2:300-5
Median Ratio (sIgE/tIgE) stratified by outcome of oral food challenge
“Less persistent FA” refers to milk, egg, wheat, and soy as a group (red); “more persistent FA” refers to peanut, tree nuts, shellfish, and seeds as a group (blue).
Ratio = (sIgE/tIgE) × 100

Ratio = (sIgE/tIgE) × 100
Predicting Outcomes of Oral Food Challenges by Using the Allergen-Specific IgE–Total IgE Ratio
Gupta RS, J Allergy Clin Immunol Pract 2014;2:300-5
Median Ratio (sIgE/tIgE) stratified by outcome of oral food challenge
“Less persistent FA” refers to milk, egg, wheat, and soy as a group (red); “more persistent FA” refers to peanut, tree nuts, shellfish, and seeds as a group (blue).
The Ratio for participants who failed their OFC was higher than the Ratio for
those who passed, especially for more persistent allergens
(eg, peanut and tree nuts).

Differences in empowerment and quality of life among parents of children with food allergy
Warren C, Ann Allergy Asthma Immunol, 2015;114:117-25
Psychological empowermenthas been defined as “a process through which people gain greater control over decisions and actions affecting their health.”
Psychological empowerment is believed to facilitate the appropriation of medical knowledge and reinforce psychosocial skills, thus increasing self-efficacy with regard to disease and treatment-related behaviors.
876 families of children with food allergy.
Food allergy defined by stringent criteria.
Parental empowerment and Food Allergy-Related Quality Of Life (FAQOL) assessed by the adapted Family Empowerment and FAQOL-Parental Burden scales.

Differences in empowerment and quality of life among parents of children with food allergy
Warren C, Ann Allergy Asthma Immunol, 2015;114:117-25
876 families of children with food allergy.
Food allergy defined by stringent criteria.
Parental empowerment and Food Allergy-Related Quality Of Life (FAQOL) assessed by the adapted Family Empowerment and FAQOL-Parental Burden scales.
Mothers reported greater empowerment (p < .001) and lower FAQOL (p < .001) compared with fathers.
Greater effects on FAQOL were seen for milk and egg compared with other food allergies.

Differences in empowerment and quality of life among parents of children with food allergy
Warren C, Ann Allergy Asthma Immunol, 2015;114:117-25
876 families of children with food allergy.
Food allergy defined by stringent criteria.
Parental empowerment and Food Allergy-Related Quality Of Life (FAQOL) assessed by the adapted Family Empowerment and FAQOL-Parental Burden scales.
Although parents of children with food
allergy might be empowered to care
for their child, they continue to
experience impaired FAQOL owing to fears of allergen exposure beyond their control.
Mothers reported greater empowerment (p < .001) and lower FAQOL (p < .001) compared with fathers.
Greater effects on FAQOL were seen for milk and egg compared with other food allergies.

305 caregiver quality of life (QoL) of children allergic to milk, egg, peanut, or tree nut.
Comparison of mean quality of life (QoL) scores for each allergen and the
overall study population. Increased scores indicate worse QoL.
What affects quality of life among caregivers of food-allergic children?Howe Ann Allergy 2014;113:69
p=0.001
p<0.0001

305 caregiver quality of life (QoL) of children allergic to milk, egg, peanut, or tree nut.
What affects quality of life among caregivers of food-allergic children?Howe Ann Allergy 2014;113:69
p=0.001
p<0.0001Milk or egg allergy and an income < $50,000 was associated with
worse QoL.
Comparison of mean quality of life (QoL) scores for each allergen and the
overall study population. Increased scores indicate worse QoL.

305 caregiver quality of life (QoL) of children allergic to milk, egg, peanut, or tree nut.
What affects quality of life among caregivers of food-allergic children?Howe Ann Allergy 2014;113:69
Multiple food allergies(p=0.007), accurate reaction perception
(-0.37, p=0.04), eczema(+0.49, p=0.004), and
caregiver report that the child had anaphylaxis
(+0.48, p=0.02) were significantly
associated with worse QoL score.
p=0.001
p<0.0001
Comparison of mean quality of life (QoL) scores for each allergen and the
overall study population. Increased scores indicate worse QoL.

1. Food protein-induced enterocolitis syndrome (FPIES) is a pediatric non-immunoglobulin E (IgE)-mediated allergic disorder triggered by the ingestion of food, whether solid or liquid.
2. Up to 65% of patients with FPIES react to cow’s milk and soy; however, FPIES also can be caused by a wide variety of solid foods in up to 25% of these patients with soy and milk FPIES.
3. FPIES usually presents within the first 6 to 12 months of life with some nonspecific symptoms along a spectrum of severity: repeated debilitating vomiting is typical and often accompanied by diarrhea, and in more severe cases hypotension can develop, manifesting as signs of shock.
Clinical presentation and referral characteristics of food protein-induced enterocolitis syndrome
in the United KingdomLudman Ann Allergy 2014;113:290
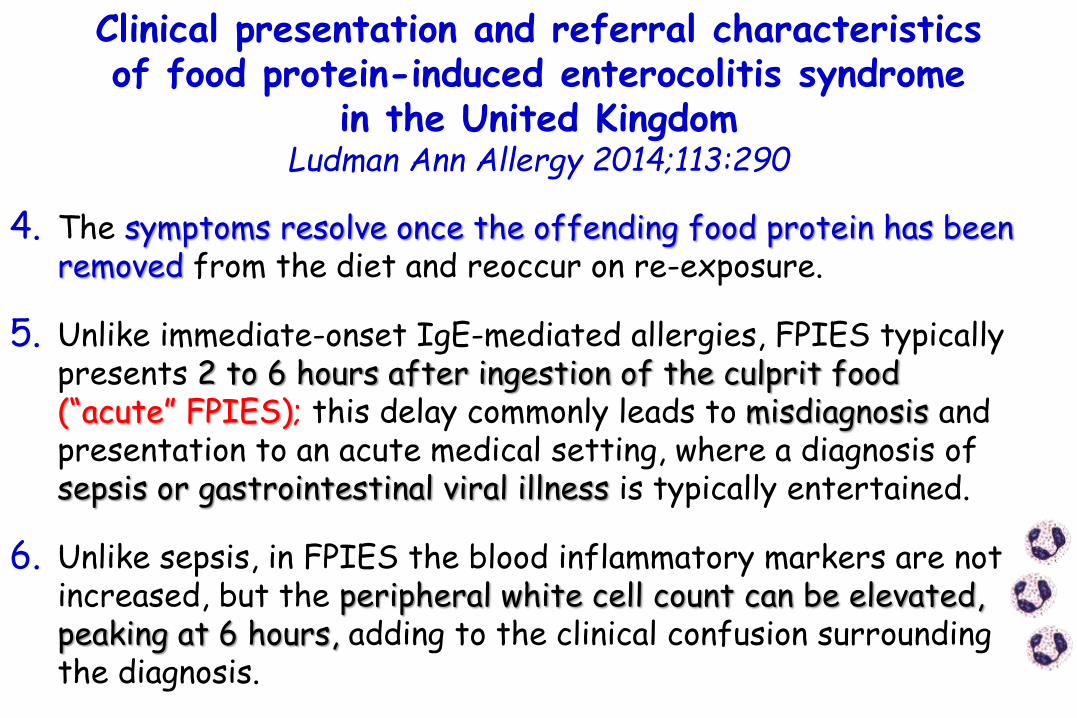
4. The symptoms resolve once the offending food protein has been removed from the diet and reoccur on re-exposure.
5. Unlike immediate-onset IgE-mediated allergies, FPIES typically presents 2 to 6 hours after ingestion of the culprit food (“acute” FPIES); this delay commonly leads to misdiagnosis and presentation to an acute medical setting, where a diagnosis of sepsis or gastrointestinal viral illness is typically entertained.
6. Unlike sepsis, in FPIES the blood inflammatory markers are not increased, but the peripheral white cell count can be elevated, peaking at 6 hours, adding to the clinical confusion surrounding the diagnosis.
Clinical presentation and referral characteristics of food protein-induced enterocolitis syndrome
in the United KingdomLudman Ann Allergy 2014;113:290

7. The diagnosis of FPIES is made on clinical grounds.
8. FPIES also can present with a subacute or chronic presentation (“chronic” FPIES) that manifests as intermittent vomiting, diarrhea, faltering growth, and sometimes dehydration.
9. This subacute or chronic presentation has been attributed to continuous exposure to the food trigger, such as cow’s milk or soy formula.
Clinical presentation and referral characteristics of food protein-induced enterocolitis syndrome
in the United KingdomLudman Ann Allergy 2014;113:290

54 patients with FPIES presenting over a 3-year period (2010-2013) in a tertiary pediatric allergy clinic in London.
Presenting symptoms.
Average age of onset at 8 months.
They initially presented to medical professionals other than an allergist or gastroenterologist.
Clinical presentation and referral characteristics of food protein-induced enterocolitis syndrome
in the United KingdomLudman Ann Allergy 2014;113:290

The most frequentpresenting symptom was vomiting followed by signs suggesting shock or hypotension and diarrhea.
Differential diagnoses included gastroenteritis, sepsis, and surgical abnormalities.
Clinical presentation and referral characteristics of food protein-induced enterocolitis syndrome
in the United KingdomLudman Ann Allergy 2014;113:290
54 patients with FPIES presenting over a 3-year period (2010-2013) in a tertiary pediatric allergy clinic in London.
Presenting symptoms.

The main eliciting foods were:
1) cow’s milk,
2) fish,
3) egg,
4) soy,
5) wheat.
Clinical presentation and referral characteristics of food protein-induced enterocolitis syndrome
in the United KingdomLudman Ann Allergy 2014;113:290
54 patients with FPIES presenting over a 3-year period (2010-2013) in a tertiary pediatric allergy clinic in London.
Presenting symptoms.

Diagnostic criteria of food protein-induced enterocolitis syndrome
Van Sickle Gastroenterology. 1985;88:1915.Leonard Curr Opin Pediatr. 2012;24:739.
Clinical presentation and referral characteristics of food protein-induced enterocolitis syndrome
in the United KingdomLudman Ann Allergy 2014;113:290

Health practitioners seen by patients with food protein-induced enterocolitis syndrome
Clinical presentation and referral characteristics of food protein-induced enterocolitis syndrome
in the United KingdomLudman Ann Allergy 2014;113:290

Symptoms elicited from patient history
aIncludes melena, malodourous stools, pale stools, and sticky stools.
Clinical presentation and referral characteristics of food protein-induced enterocolitis syndrome
in the United KingdomLudman Ann Allergy 2014;113:290

Clinical features and resolution of food protein-induced enterocolitis syndrome: 10-year experience.Caubet JC, J Allergy Clin Immunol 2014;134:382-9
Food protein-inducedenterocolitis syndrome(FPIES).
160 subjects 6 months to 45 years of age with FPIES prospectively recruited for oral food challenges (OFCs).
The diagnosis of FPIES was based on Powell's clinical criteria:
1) exposure to the incriminated food elicits repetitive vomiting, diarrhea, or both within 4 hours without any other cause for the symptoms;
2) symptoms are limited to the gastrointestinal tract;
3) avoidance of the offending protein from the diet results in resolution of symptoms;
4) a standardized OFC or isolated re-exposure elicits the typical symptoms.

Clinical features and resolution of food protein-induced enterocolitis syndrome: 10-year experience.Caubet JC, J Allergy Clin Immunol 2014;134:382-9
OFCs were performed after a minimum of 12 months after the most recent FPIES reaction to a specific food.
A peripheral intravenous line was placed before the OFC.
Subjects were given from 0.06 g up to 0.6 g of food protein per kilogram of body weight (usually 0.3 g of protein/kg body weight; maximum, 3 g of protein) in 3 equal doses over a 45-minute period and remained under observation for 4 to 8 hours after the ingestion of the challenge food.
Food protein-inducedenterocolitis syndrome(FPIES).
160 subjects 6 months to 45 years of age with FPIES prospectively recruited for oral food challenges (OFCs).

Clinical features and resolution of food protein-induced enterocolitis syndrome: 10-year experience.Caubet JC, J Allergy Clin Immunol 2014;134:382-9
FPIES food triggers (number of patients)
65% reacted to 1 food, 26% reacted to 2 foods, 9% reacted to ≥ 3 foods
Food protein-inducedenterocolitis syndrome(FPIES).
160 subjects 6 months to 4.5 years of age with FPIES prospectively recruited for oral food challenges (OFCs).

Clinical features and resolution of food protein-induced enterocolitis syndrome: 10-year experience.Caubet JC, J Allergy Clin Immunol 2014;134:382-9
24%25 –
20 –
15 –
10 –
05 –
00
% of subjects that in the follow-up developed sIgE
to the food inducing FPIES Food protein-induced
enterocolitis syndrome(FPIES).
160 subjects 6 months to 4.5 years of age with FPIES prospectively recruited for oral food challenges (OFCs).
sIgE

Clinical features and resolution of food protein-induced enterocolitis syndrome: 10-year experience.Caubet JC, J Allergy Clin Immunol 2014;134:382-9
4.7years
7.0 –
6.0 –
5.0 –
4.0 –
3.0 –
2.0 –
1.0 –
0.0
4years
5.1years
6.7years
Rice
Median age (years) when tollerancewas established (no FPIES)
Oat Soy Milk in ptswith no sIgE
for milk
Food protein-inducedenterocolitis syndrome(FPIES).
160 subjects 6 months to 4.5 years of age with FPIES prospectively recruited for oral food challenges (OFCs).

(years) Median age when tollerancewas established (no FPIES)
Clinical features and resolution of food protein-induced enterocolitis syndrome: 10-year experience.Caubet JC, J Allergy Clin Immunol 2014;134:382-9
4.7years
7.0 –
6.0 –
5.0 –
4.0 –
3.0 –
2.0 –
1.0 –
0.0
4years
6.7years
Rice Oat Soy Milk in ptswith no sIgE
for milk
Whereas none of the subjects with detectable milk-specific IgE became tolerant to milk during the study (P=0.003).
Food protein-inducedenterocolitis syndrome(FPIES).
160 subjects 6 months to 4.5 years of age with FPIES prospectively recruited for oral food challenges (OFCs).
5.1years

(years) Median age when tollerancewas established (no FPIES)
Clinical features and resolution of food protein-induced enterocolitis syndrome: 10-year experience.Caubet JC, J Allergy Clin Immunol 2014;134:382-9
4.7years
7.0 –
6.0 –
5.0 –
4.0 –
3.0 –
2.0 –
1.0 –
0.0
4years
6.7years
Rice Oat Soy Milk in ptswith no sIgE
for milk
Whereas none of the subjects with detectable milk-specific IgE became tolerant to milk during the study (P=0.003).
Food protein-inducedenterocolitis syndrome(FPIES).
160 subjects 6 months to 45 years of age with FPIES prospectively recruited for oral food challenges (OFCs).
5.1years
FPIES typically resolves by age 5 years.
Milk FPIES, especially with detectable
food-specific IgE, can have a protracted course and eventually transition to acute
reactions.

A retrospective study.
211 pediatric patients with eosinophilic esophagitis(EoE).
Skin prick testing (SPT), atopy patch testing (APT).
Pediatric eosinophilic esophagitis: the Vanderbilt experience
Chadha Ann Allergy 2014;113:445
Younger patients showed greater sensitization to foods by SPT and APT. The most common foods identified by SPT were peanut, egg, and soy. The most common foods identified by APT were potato, pork, and wheat.
Older patients with EoEshowed greater aeroallergen sensitization; the most common allergens were pollens and dust mite.

Age distribution of presenting symptoms of eosinophilic esophagitis
Pediatric eosinophilic esophagitis: the Vanderbilt experience
Chadha Ann Allergy 2014;113:445
A retrospective study.
211 pediatric patients with eosinophilic esophagitis(EoE).
Skin prick testing (SPT), atopy patch testing (APT).

% subjects with (+) reaction to
80 –
70 –
60 –
50 –
40 –
30 –
20 –
10 –
00
65%
SPTs
77%
APTsto foods
Pediatric eosinophilic esophagitis: the Vanderbilt experience
Chadha Ann Allergy 2014;113:445
A retrospective study.
211 pediatric patients with eosinophilic esophagitis(EoE).
Skin prick testing (SPT), atopy patch testing (APT).
The impact of dietary therapy on clinical and biologic parameters of pediatric patients with eosinophilic
esophagitis Colson D, JACIP 2014;2: 587-93
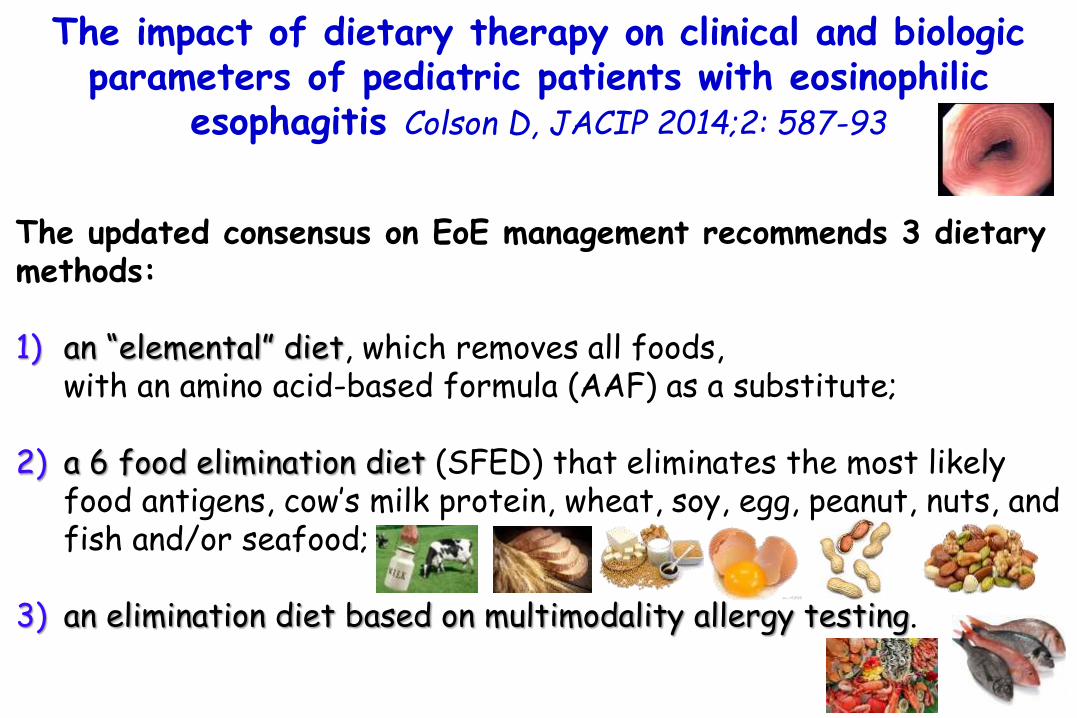
The updated consensus on EoE management recommends 3 dietary methods:
1) an “elemental” diet, which removes all foods, with an amino acid-based formula (AAF) as a substitute;
2) a 6 food elimination diet (SFED) that eliminates the most likely food antigens, cow’s milk protein, wheat, soy, egg, peanut, nuts, and fish and/or seafood;
3) an elimination diet based on multimodality allergy testing.

The impact of dietary therapy on clinical and biologic parameters of pediatric patients with eosinophilic
esophagitis Colson D, JACIP 2014;2: 587-93
The updated consensus on EoE management recommends 3 dietary methods:
1) an “elemental” diet, which removes all foods, with an amino acid-based formula (AAF) as a substitute;
2) a 6 food elimination diet (SFED) that eliminates the most likely food antigens, cow’s milk protein, wheat, soy, egg, peanut, nuts, and fish and/or seafood;
3) an elimination diet based on multimodality allergy testing.
The modified SFED combined SFED with the elimination of the foods that elicited a positive SPT
and/or APT.

The impact of dietary therapy on clinical and biologic parameters of pediatric patients with eosinophilic
esophagitis Colson D, JACIP 2014;2: 587-93
2.2%
111 ch. with eosinophilic esophagitis(median age of 77.7 months)
retrospective study in childrenwith EoE after a 2-month dietarytherapy(6-food elimination diet, avoidance of the 6 mostcommon allergenic foods, plus avoidance of those eliciting(+) SPTs, plus amino-acid formula as replacement for diary products)
% children with dietary therapy
2.2%
60 –
50 –
40 –
30 –
20 –
10 –
0
7.46%
47.4%
59.3%
Normal endoscopicappearance
Complete remission<5 eosinophils/esophagealHPF and disappearance
of symptoms
Post-diet bloodeosinophils counts
decreased in absolutenumbers
(P < 0.0001)

The impact of dietary therapy on clinical and biologic parameters of pediatric patients with eosinophilic
esophagitis Colson D, JACIP 2014;2: 587-93
2.2%
111 ch. with eosinophilic esophagitis(median age of 77.7 months)
retrospective study in childrenwith EoE after a 2-month dietarytherapy(6-food elimination diet, avoidance of the 6 mostcommon allergenic foods, plus avoidance of those eliciting(+) SPTs, plus amino-acid formula as replacement for diary products)
% children with dietary therapy
2.2%
60 –
50 –
40 –
30 –
20 –
10 –
0
7.46%
47.4%
59.3%
Normal endoscopicappearance
Complete remission<5 eosinophils/esophagealHPF and disappearance
of symptoms
The nutritional status of children with EoEwas mildly affected
and not worsened by the
2-month dietary therapy

The impact of dietary therapy on clinical and biologic parameters of pediatric patients with eosinophilic
esophagitis Colson D, JACIP 2014;2: 587-93
2.2%
111 ch. with eosinophilic esophagitis(median age of 77.7 months)
retrospective study in childrenwith EoE after a 2-month dietarytherapy(6-food elimination diet, avoidance of the 6 mostcommon allergenic foods, plus avoidance of those eliciting(+) SPTs, plus amino-acid formula as replacement for diary products)
% children with dietary therapy
2.2%
60 –
50 –
40 –
30 –
20 –
10 –
0
7.46%
47.4%
59.3%
Normal endoscopicappearance
Complete remission<5 eosinophils/esophagealHPF and disappearance
of symptoms
Dietary therapywith an amino-acid
formula asa replacement for dairy products is
nutritionally adaptedto the treatment
of EoE

An amino-acid formula was prescribed as a replacement for dairyproducts, Neocate or Nutramigen AA. The recommended daily consumption of AAF was 500 mL or more, basedon the French pediatric feeding guidelines, which accounted for ≥30% oftotal caloric intake.
At the end of the 2-month period, the families reported whether or notthe child had followed the diet.
Children were then prescribed a progressive reintroduction of eliminatedfoods, 1 every 3 months, starting with foods for which they had testednegative
The impact of dietary therapy on clinical and biologic parameters of pediatric patients with eosinophilic
esophagitis Colson D, JACIP 2014;2: 587-93

15 studies.
Children undergoing peanut, milk, and egg oral immunotherapy(OIT).
Relation between eosinophilic esophagitis and oral immunotherapy for food allergy:
a systematic review with meta-analysisLucendo Ann Allergy 2014;113:624
Prevalence ofeosinophilic esophagitis
after OIT3.0 –
2.5 –
2.0 –
1.5 –
1.0 –
0.5 –
0.0
2.7%

15 studies.
Children undergoing peanut, milk, and egg oral immunotherapy(OIT).
Relation between eosinophilic esophagitis and oral immunotherapy for food allergy:
a systematic review with meta-analysisLucendo Ann Allergy 2014;113:624
Prevalence ofeosinophilic esophagitis
after OIT3.0 –
2.5 –
2.0 –
1.5 –
1.0 –
0.5 –
0.0
2.7%Eosinophilicesophagitis
often resolvedafter OIT
discontinuation.

Is It Food Allergy or Frey Syndrome?Betul Buyuktiryaki MD, JACI P 2015;3:269–270
a 6-month-old boy with recurrent unilateral erythematous eruptionon his face after feeding
symptoms were triggered by yoghurt, carrots, and fruit (apples, pears, oranges) a few minutes after masticationand would resolve spontaneously within 15 to 30 minutes
the rash always appeared in the same area without pruritus, swelling, respiratory, or gastrointestinal symptoms
the child experienced the same manifestation with each newly added solid foodafter chewing
prick-to-prick tests and specific IgE levels were negative.

Is It Food Allergy or Frey Syndrome?Betul Buyuktiryaki MD, JACI P 2015;3:269–270
an open challenge test with yoghurt and pear on different occasions resulted in flushingwithin a few minutes, which extended from the right cheek across the preauricular and temporal region to the forehead scalp with no sweating and disappeared over 20 minutes.

Is It Food Allergy or Frey Syndrome?Betul Buyuktiryaki MD, JACI P 2015;3:269–270
A: flushing on the left cheek after an open challenge test with cucumber at 12 months of age
B: flushing on the right cheek after an open challenge test with lemon at 12 months of age

Is It Food Allergy or Frey Syndrome?Betul Buyuktiryaki MD, JACI P 2015;3:269–270
The child received a diagnosis of Frey syndrome, which is commonly misinterpreted as a food allergy.
Frey syndrome, otherwise named auriculotemporal nerve (ATN) syndrome, is characterized by unilateral (rarely bilateral) recurrent episodes of flushing and sweating over the parotid area after gustatory stimulus.
The syndrome most often occurs in adults after parotid surgery and very uncommon in children. Because the disease often exhibits spontaneous resolution within a few years in children, no treatment is recommended.
It has been proposed that a perinatal birth trauma during delivery may be a possible reason for damage to the auriculotemporal nerve.
Although the majority of patients have flushing in the preauricular region compatible with the cutaneous distribution of ATN, the reaction of our patient expanded from the cheeks to the middle of the forehead.

Is It Food Allergy or Frey Syndrome?Betul Buyuktiryaki MD, JACI P 2015;3:269–270
The symptoms of Frey's syndrome are redness and sweating on the cheek area adjacent to the ear (see focal hyperhidrosis). They can appear when the affected person eats, sees, dreams, thinks about or talks about certain kinds of food which produce strong salivation.
Observing sweating in the region after eating a lemon wedge may be diagnostic.
Signs and symptoms include erythema (redness/flushing) and sweating in the cutaneousdistribution of the auriculotemporal nerve, usually in response to gustatory stimuli.
There is sometimes pain in the same area, often of a burning nature.
Between attacks of pain there is sometimes numbness or other alterred sensations (anesthesia or paresthesia).
This is sometimes termed "gustatory neuralgia".

Milk allergy is associated with decreased growthin US children.
Robbins KA, J Allergy Clin Immunol 2014;134:1466-68
Anthropometricmeasurements and dietary intake of calcium, vitamin D, total calories, protein, and fat between children with and without reported food allergy by using National Health and Nutrition Examination Survey (NHANES).
6189 children aged 2 to 17 years.
6.3%
% children withreported food allergy
10 –
09 –
08 –
07 –
06 –
05 –
04 –
03 –
02 –
01 –
00

Milk allergy is associated with decreased growthin US children.
Robbins KA, J Allergy Clin Immunol 2014;134:1466-68
Anthropometricmeasurements and dietary intake of calcium, vitamin D, total calories, protein, and fat between children with and without reported food allergy by using National Health and Nutrition Examination Survey (NHANES).
6189 children aged 2 to 17 years.
Weighted box plots of anthropometric features for children aged 2 to 17 years comparing children with
milk allergy versus those without milk allergy
(kg)/age (cm)/age (Kg/m2)/age
Mean weight, height, and BMI percentiles were significantly lower in those with
milk allergy

212
350 –
300 –
250 –
200 –
150 –
100 –
050 –
000
Mean total daily vitamin Dintake (D2+D3 [IU])
YES NO
Milk allergy
YES NO
Milk allergy is associated with decreased growthin US children.
Robbins KA, J Allergy Clin Immunol 2014;134:1466-68
Mean total daily calcium intake (mg)
Milk allergy
308802
1047p<0.001
p=0.053
1100 –
1000 –
0900 –
0800 –
0700 –
0600 –
0500 –
0400 –
0300 –
0200 –
0100 –
0000

Food allergies affect growth in childrenHobbs CB, J Allergy Clin Immunol Pract 2015;3:133-134
Weight for length and BMI percentile of 4 groups of children
245 children with real or perceived food allergy (RPFA) (mean age 4.1 ± 2.9 yrs).
Healthy and diseased controls as patients with celiac disease (CD) or cystic fibrosis (CF).

Food allergies affect growth in childrenHobbs CB, J Allergy Clin Immunol Pract 2015;3:133-134
245 children with real or perceived food allergy (RPFA) (mean age 4.1 ± 2.9 yrs).
Healthy and diseased controls as patients with celiac disease (CD) or cystic fibrosis (CF).
Children < 2 yrs with real or perceived food allergy (RPFA) had significantly lower WFL percentiles, and those ≥ 2 yrs had
significantly lower BMI percentiles, compared to
healthy controls .
The adverse impact of RPFA on WFL was less than that of CD or CF.
Weight for length and BMI percentile of 4 groups of children

Food allergies affect growth in childrenHobbs CB, J Allergy Clin Immunol Pract 2015;3:133-134
245 children with real or perceived food allergy (RPFA) (mean age 4.1 ± 2.9 yrs).
Healthy and diseased controls as patients with celiac disease (CD) or cystic fibrosis (CF).
Growth percentiles per number of food allergies
Compared with those with 1 or 2 RFPAs
children with> 2 RFPAs had
significantly lower mean weight p<0.001.

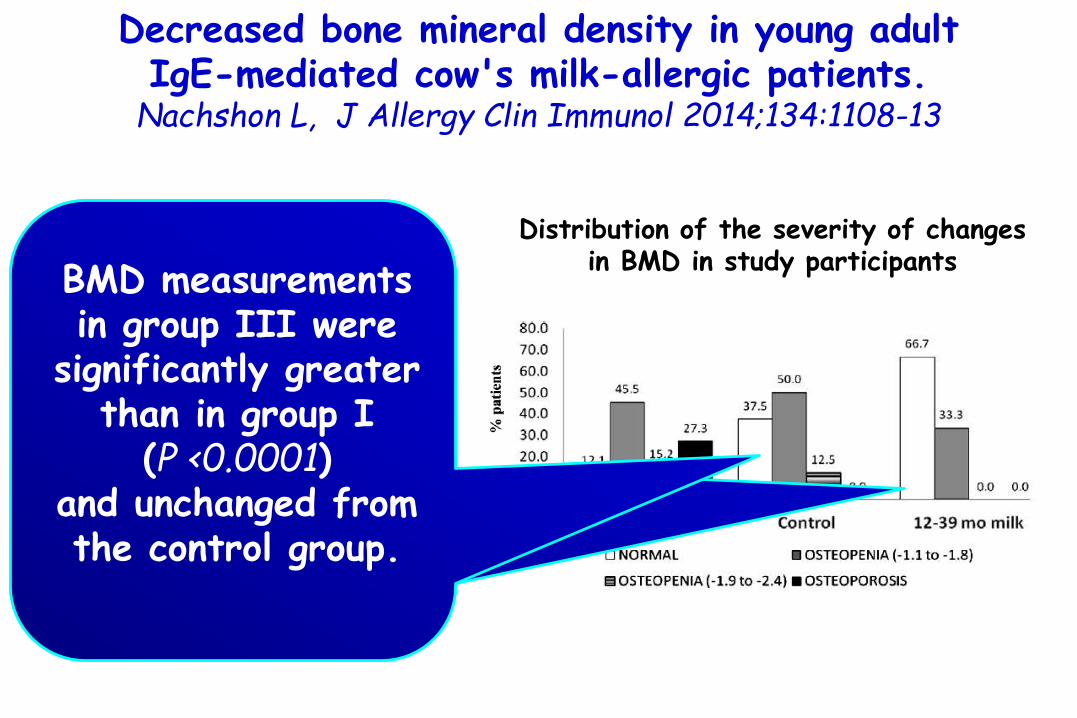
Decreased bone mineral density in young adult IgE-mediated cow's milk-allergic patients.
Nachshon L, J Allergy Clin Immunol 2014;134:1108-13
Densitometric measurements.
Postpubertal patients diagnosed with IgE-CMA (group I, n = 33)
Without IgE-CMA (control group II, n = 24).
IgE-CMA patients who after desensitization consumed milk for 12 to 39 months before analysis (group III, n = 12).
Distribution of the severity of changes in BMD in study participants

Decreased bone mineral density in young adult IgE-mediated cow's milk-allergic patients.
Nachshon L, J Allergy Clin Immunol 2014;134:1108-13
Participants' demographic characteristics
For continuous variables, data are presented as mean ± SD (median) and for categorical variables data are presented as N (%). No statistical differences were noted between any of the comparisons. H/W, Hours per week.

Decreased bone mineral density in young adult IgE-mediated cow's milk-allergic patients.
Nachshon L, J Allergy Clin Immunol 2014;134:1108-13
Densitometric measurements.
Postpubertal patients diagnosed with IgE-CMA (group I, n = 33)
Without IgE-CMA (control group II, n = 24).
IgE-CMA patients who after desensitization consumed milk for 12 to 39 months before analysis (group III, n = 12).
Distribution of the severity of changes in BMD in study participants
Densitometricmeasurements of IgE-CMA patients were significantly
lower than of those in the control group
(P < 0.0001).

Decreased bone mineral density in young adult IgE-mediated cow's milk-allergic patients.
Nachshon L, J Allergy Clin Immunol 2014;134:1108-13
Densitometric measurements.
Postpubertal patients diagnosed with IgE-CMA (group I, n = 33)
Without IgE-CMA (control group II, n = 24).
IgE-CMA patients who after desensitization consumed milk for 12 to 39 months before analysis (group III, n = 12).
Distribution of the severity of changes in BMD in study participants IgE-CMA patients had a
severely reduced intake of calcium than did controls (335 vs 768; P <0.0001). In addition, phosphorus intake was significantly
lower in IgE-CMA patients than in controls (1004 vs 1295; P <0.0131)
Decreased bone mineral density in young adult IgE-mediated cow's milk-allergic patients.
Nachshon L, J Allergy Clin Immunol 2014;134:1108-13
Densitometric measurements.
Postpubertal patients diagnosed with IgE-CMA (group I, n = 33)
Without IgE-CMA (control group II, n = 24).
IgE-CMA patients who after desensitization consumed milk for 12 to 39 months before analysis (group III, n = 12).
Distribution of the severity of changes in BMD in study participants
BMD measurements in group III were
significantly greater than in group I
(P <0.0001) and unchanged from the control group.

Decreased bone mineral density in young adult IgE-mediated cow's milk-allergic patients.
Nachshon L, J Allergy Clin Immunol 2014;134:1108-13
1) Even postpuberty, changes in the dietary habits of these patients, at least by the introduction of dairy products, may indeed be successful in reversing their risk for osteoporosis.
2) Milk provides a high concentration of bioavailable calcium; in contrast, only 5% of the calcium in spinach is absorbed.
3) Working in concert with calcium intake, vitamin D, among its pleiotropicactions, influences calcium absorption. In our study, the average vitamin D levels were similar between patients and controls. However, we noted a relatively high number of patients with suboptimal vitamin D levels.

Decreased bone mineral density in young adult IgE-mediated cow's milk-allergic patients.
Nachshon L, J Allergy Clin Immunol 2014;134:1108-13
Conclusions:
Patients with IgE-CMA have a significant risk of reduced BMD and early osteoporosis, which appears to be reversible on milk desensitization.
Adequate calcium intake is not achieved while on a nondairy diet, requiring investigation into optimal nutritional protocols for these patients.

Recommended calcium intake*
BSACI guideline for the diagnosis and management of cow’s milk allergy Luyt D, CEA 2014;44:642-672

Calcium content in selected foods
BSACI guideline for the diagnosis and management of cow’s milk allergy Luyt D, CEA 2014;44:642-672

Calcium content in selected foods
BSACI guideline for the diagnosis and management of cow’s milk allergy Luyt D, CEA 2014;44:642-672

Home reintroduction should not be attempted if any of the following features are present
BSACI guideline for the diagnosis and management of cow’s milk allergy Luyt D, CEA 2014;44:642-672
1) Previous cow’s milk allergy symptoms that significantly affected breathing [cough, wheezing, or swelling of the throat, for example cough, stridor, or choking sensation or throat tightness (in older children)], the gut (i.e. severe vomiting or diarrhoea),or the circulation (faintness, floppiness or shock)2) A less severe reaction with only trace exposure3) Regular asthma preventative inhaler treatment and/or poorly controlled asthma.4) Multiple or complex allergy5) No significant reduction in SPT wheal diameter/sIgE level since diagnosis6) High sIgE levels without history of any prior milk exposure (e.g. exclusively breastfed or hypoallergenic formula fed infants withsevere eczema)7) Parents who are unable to comprehend or adhere to the protocol
8) Children with any of these features should undergo a supervised challenge in hospital. 9) In children at highest risk, a supervised baked milk challenge is preferable

Classification of cow’s-milk-containing foods (‘Milk ladder’)
BSACI guideline for the diagnosis and management of cow’s milk allergy Luyt D, CEA 2014;44:642-672
UHT ultra-heat treatmentsterilizes food by heating it above 135°C

What is New in Pediatric Allergic Diseases 2015
Attilio BonerUniversity ofVerona, Italy
Diagnosis
Food Allergy
Atopic Dermatitis
Allergic Asthma
Allergic Rhinitis
Anaphylaxis
Urticaria & Angioedema
Risk & Protective factors
Burden

124 neonates at high risk for atopic dermatitis.
Parents in the intervention arm were instructed to apply full-body emollient therapy at least once per day starting within 3 weeks of birth.
Parents in the control arm were asked to use no emollients.
Incidence of atopic dermatitis at 6 months.
Emollient enhancement of the skin barrier from birth offers effective atopic dermatitis preventionSimpson EL, J Allergy Clin Immunol 2014;134:818-23
with the use of daily emollient
0.50
1.0 –
0.5 –
0.0
RR of atopic dermatitis denvelopment
at 6 months of age

124 neonates at high risk for atopic dermatitis.
Parents in the intervention arm were instructed to apply full-body emollient therapy at least once per day starting within 3 weeks of birth.
Parents in the control arm were asked to use no emollients.
Incidence of atopic dermatitis at 6 months.
Emollient enhancement of the skin barrier from birth offers effective atopic dermatitis preventionSimpson EL, J Allergy Clin Immunol 2014;134:818-23
with the use of daily emollient
0.50
1.0 –
0.5 –
0.0
There were no emollient-related adverse events
RR of atopic dermatitis denvelopment
at 6 months of age

Emollient enhancement of the skin barrier from birth offers effective atopic dermatitis preventionSimpson EL, J Allergy Clin Immunol 2014;134:818-23
Skin barrierprotection
might preventatopic
dermatitisdevelopment.
FLG, Filaggrin.

In the United Kingdom emollient choices were sunflower seed oil (William Hodgson and Co, Congleton, United Kingdom), DoublebaseGel (Dermal Laboratories, Hitchin, United Kingdom), and liquid paraffin 50% in white soft paraffin.
In the United States parents were offered the same sunflower seed oil as used in the United Kingdom, Cetaphil Cream (GaldermaLaboratories, Fort Worth, Tex), or Aquaphor Healing Ointment (Beiersdorf, Chester, Ohio).
We used sunflower seed oil with a high ratio of linoleic/oleic acid to optimize the positive skin barrier effects.Danby S.G. et al Pediatr Dermatol. 2013;30:42–50.
Emollient enhancement of the skin barrier from birth offers effective atopic dermatitis preventionSimpson EL, J Allergy Clin Immunol 2014;134:818-23

Application of moisturizer to neonates prevents development of atopic dermatitis
Horimukai K, J Allergy Clin Immunol 2014;134:824-30
Emulsion-type moisturizer applied daily during the first 32 weeks of life to 59 of 118 neonates at high risk for AD (based on having a parent or sibling with AD).
Onset of AD (eczematous symptoms lasting >4 weeks) and eczema (lasting >2 weeks).
Cumulative incidence of (AD/eczema) at week 32 of life.
Serum levels of allergen-specific IgE.
Proportions of infants who did not have AD/eczema during the first 32 weeks of life
-32% p=0.012

Emulsion-type moisturizer applied daily during the first 32 weeks of life to 59 of 118 neonates at high risk for AD (based on having a parent or sibling with AD).
Onset of AD (eczematous symptoms lasting >4 weeks) and eczema (lasting >2 weeks).
Cumulative incidence of (AD/eczema) at week 32 of life.
Serum levels of allergen-specific IgE.
Application of moisturizer to neonates prevents development of atopic dermatitis
Horimukai K, J Allergy Clin Immunol 2014;134:824-30
Proportions of infants who did not have AD/eczema during the first 32 weeks of life
Approximately 32% fewer neonates who
received the moisturizer had AD/eczema by
week 32 than control subjects (P = 0.012)
-32% p=0.012

Application of moisturizer to neonates prevents development of atopic dermatitis
Horimukai K, J Allergy Clin Immunol 2014;134:824-30
in infants who had AD/eczema
2.863.0 –
2.5 –
2.0 –
1.5 –
1.0 –
0.5 –
0.0
OR for sensitization Emulsion-type moisturizer
applied daily during the first 32 weeks of life to 59 of 118 neonates at high risk for AD (based on having a parent or sibling with AD).
Onset of AD (eczematous symptoms lasting >4 weeks) and eczema (lasting >2 weeks).
Cumulative incidence of (AD/eczema) at week 32 of life.
Serum levels of allergen-specific IgE.

Emulsion-type moisturizer applied daily during the first 32 weeks of life to 59 of 118 neonates at high risk for AD (based on having a parent or sibling with AD).
Onset of AD (eczematous symptoms lasting >4 weeks) and eczema (lasting >2 weeks).
Cumulative incidence of (AD/eczema) at week 32 of life.
Serum levels of allergen-specific IgE.
Application of moisturizer to neonates prevents development of atopic dermatitis
Horimukai K, J Allergy Clin Immunol 2014;134:824-30
in infants who had AD/eczema
2.863.0 –
2.5 –
2.0 –
1.5 –
1.0 –
0.5 –
0.0
We did not show a statistically significant effect of emollient on allergic sensitization based on the level of IgE antibody against
egg white at 0.34 kUA/L
OR for sensitization

Emulsion-type moisturizer applied daily during the first 32 weeks of life to 59 of 118 neonates at high risk for AD (based on having a parent or sibling with AD).
Onset of AD (eczematous symptoms lasting >4 weeks) and eczema (lasting >2 weeks).
Cumulative incidence of (AD/eczema) at week 32 of life.
Serum levels of allergen-specific IgE.
Application of moisturizer to neonates prevents development of atopic dermatitis
Horimukai K, J Allergy Clin Immunol 2014;134:824-30
in infants who had AD/eczema
2.863.0 –
2.5 –
2.0 –
1.5 –
1.0 –
0.5 –
0.0
Daily application of moisturizer during the first 32 weeks of life reduces the risk of
AD/eczema in infants. Allergic sensitization during
this time period is associated with the
presence of eczematous skin but not with moisturizer use.
OR for sensitization

Application of moisturizer to neonates prevents development of atopic dermatitis
Horimukai K, J Allergy Clin Immunol 2014;134:824-30
Allergic sensitization at week 32
Emulsion-type moisturizer applied daily during the first 32 weeks of life to 59 of 118 neonates at high risk for AD (based on having a parent or sibling with AD).
Onset of AD (eczematous symptoms lasting >4 weeks) and eczema (lasting >2 weeks).
Cumulative incidence of (AD/eczema) at week 32 of life.
Serum levels of allergen-specific IgE.

Application of moisturizer to neonates prevents development of atopic dermatitis
Horimukai K, J Allergy Clin Immunol 2014;134:824-30
Numbers of Infants with AD/eczema and allergic sensitization at week 32
Emulsion-type moisturizer applied daily during the first 32 weeks of life to 59 of 118 neonates at high risk for AD (based on having a parent or sibling with AD).
Onset of AD (eczematous symptoms lasting >4 weeks) and eczema (lasting >2 weeks).
Cumulative incidence of (AD/eczema) at week 32 of life.
Serum levels of allergen-specific IgE.

Application of moisturizer to neonates prevents development of atopic dermatitis
Horimukai K, J Allergy Clin Immunol 2014;134:824-30
In our study we were not able to show the significant effect of emollient on the prevention of allergic sensitization based on the level of IgE antibody against egg white; similar proportions of infants were sensitized in the intervention and control groups.
However, we showed that a higher proportion of infants with AD/eczema had allergic sensitization based on serum concentrations of anti–egg white IgE compared with infants without AD/eczema.
Collectively, these findings indicate that the presence of eczematous skin, rather than a lack of emollient use, induces or promotes sensitization to allergens, such as egg white, during the first 8 months of life.

Natural history of allergic sensitization in infants with early-onset atopic dermatitis: results from ORCA Study
Just J, PAI 2014;25:668–673
229 infants with activeatopic dermatitis (AD)
follow up at age 6 yrs
sIgEs
40 –
30 –
20 –
10 –
.0
26.2%
37.1%
% infants with baseline
elevated bloodeosinophilia
(eosinophil blood count ≥470 eosinophils/mm3)
elevatedtotal IgE
(serum IgElevel ≥45 kU/L)

Natural history of allergic sensitization in infants with early-onset atopic dermatitis: results from ORCA Study
Just J, PAI 2014;25:668–673
% children with sIgE to
baseline
58%
34%
67%
17%
70 –
60 –
50 –
40 –
30 –
20 –
10 –
0
food allergens inhaled allergens
baseline6 yrs 6 yrs
229 infants with activeatopic dermatitis (AD)
follow up at age 6 yrs
sIgEs

Natural history of allergic sensitization in infants with early-onset atopic dermatitis: results from ORCA Study
Just J, PAI 2014;25:668–673
OR for developing sensitization to inhaled allergens at 6 yr
4.0 –
3.0 –
2.0 –
1.0 –
0.0
3.72
initial multiple sensitizations to food allergens
(≥ 2 allergens)
229 infants with activeatopic dermatitis (AD)
follow up at age 6 yrs
sIgEs
In the early-onset AD phenotype,
multiple sensitization to food allergens
conveys a higher risk of sensitization to
inhaled allergens than single sensitization

Atopic dermatitis increases the effect of exposure to peanut antigen in dust on peanut sensitization and likely
peanut allergy.Brough HA, J Allergy Clin Immunol 2015; 135:164-70
Background History and severity of atopic dermatitis (AD) are risk factors for
peanut allergy. Recent evidence suggests that children can become sensitized to food allergens through an impaired skin barrier.
Household peanut consumption, which correlates strongly with peanut protein levels in household dust, is a risk factor for peanut allergy.
Objective We sought to assess whether environmental peanut exposure (EPE) is
a risk for peanut sensitization and allergy and whether markers of an impaired skin barrier modify this risk.

Peanut protein in household dust(in micrograms per gram).
History and severity of AD, peanut sensitization, and likely allergy (peanut-specific IgE, ≥5 kUA/mL).
with an increase in 4 log2
environmental peanut exposure
(EPE) units OR for
Peanut SPT sensitization
Likely peanutallergy
2.5 –
2.0 –
1.5 –
1.0 –
0.5 –
0.0
1.712.10
p=0.01 p<0.01
sIgE ≥5 kUA/mL
Atopic dermatitis increases the effect of exposure to peanut antigen in dust on peanut sensitization and likely
peanut allergy.Brough HA, J Allergy Clin Immunol 2015; 135:164-70
The effect of EPE on peanut SPT sensitization was augmented in children
with a history of AD (OR, 1.97 P <0.01) and
augmented even further in children with a history of
severe AD (OR, 2.41 P <0.01)

Peanut protein in household dust(in micrograms per gram).
History and severity of AD, peanut sensitization, and likely allergy (peanut-specific IgE, ≥5 kUA/mL).
with an increase in 4 log2
environmental peanut exposure
(EPE) units OR for
Peanut SPT sensitization
Likely peanutallergy
2.5 –
2.0 –
1.5 –
1.0 –
0.5 –
0.0
1.712.10
p=0.01 p<0.01
sIgE ≥5 kUA/mL
Atopic dermatitis increases the effect of exposure to peanut antigen in dust on peanut sensitization and likely
peanut allergy.Brough HA, J Allergy Clin Immunol 2015; 135:164-70
The effect was also augmented in children with
a history of AD
OR 2.34 P < 0.01

Predictive probability for the effect of environmental peanut exposure (EPE)
(displayed in log2 [microgram per gram] units and untransformed [microgram per gram] units) for peanut SPT sensitization (PS)
Predictive probability for the effect of EPE (displayed in log2 [microgram per gram] units
and untransformed [microgram per gram] units) for likely peanut allergy (PA)
Atopic dermatitis increases the effect of exposure to peanut antigen in dust on peanut sensitization and likely
peanut allergy.Brough HA, J Allergy Clin Immunol 2015; 135:164-70

Epidemiological link between wheat allergy and exposureto hydrolyzed wheat protein in facial soap
Fukutomi Y, Allergy 2014;69:1405
Background:
Recent studies have highlighted the importance of extra-intestinal routes of sensitization to food-related allergens as the cause of epidemics of food allergy.
Instances of Japanese women developing food allergy to wheat after exposure to hydrolyzed wheat protein (HWP) present in facial soap have been reported.
However, the epidemiologic impact of these ingredients as a cause of food allergy has not been well studied.

Case–control study of Japanese women aged 20 – 54 years with self - reported wheat allergy (WA) (cases, n = 157) and controls (n = 449)
OR for food allergy to wheat
3 –
2 –
1 -
0 -
2.6
current use of an hydrolyzedwheat protein (HWP)-containing facial soap
Epidemiological link between wheat allergy and exposureto hydrolyzed wheat protein in facial soap
Fukutomi Y, Allergy 2014;69:1405

Case–control study of Japanese women aged 20 – 54 years with self - reported wheat allergy (WA) (cases, n = 157) and controls (n = 449)
3 –
2 –
1 -
0 -
2.6
current use of an hydrolyzedwheat protein (HWP)-containing facial soap
This study implicates a possible role of
contact exposure to food-derived protein hydrolysates as a risk factor for the development of food allergy manifesting itself as anaphylaxis
OR for food allergy to wheat
Epidemiological link between wheat allergy and exposureto hydrolyzed wheat protein in facial soap
Fukutomi Y, Allergy 2014;69:1405

Randomized trial of vitamin D supplementation for winter-related atopic dermatitis in children
Camargo CA Jr, J Allergy Clin Immunol 2014;134:831-5
104 Mongolian children with winter-related AD (age 2 to 17 years).
AD score 10 to 72 using the Eczema Area and Severity Index (EASI).
Oral cholecalciferol(1000 IU/day) versus placebo for 1 month.
Improvement in EASI score mean after 1 month
-6.5
-3.3
Vitamin D Placebo
p=0.04
-.-0
-1.0 –
-2.0 –
-3.0 –
-4.0 –
-5.0 –
-6.0 –
-7.0 –

Randomized trial of vitamin D supplementation for winter-related atopic dermatitis in children
Camargo CA Jr, J Allergy Clin Immunol 2014;134:831-5
104 Mongolian children with winter-related AD (age 2 to 17 years).
AD score 10 to 72 using the Eczema Area and Severity Index (EASI).
Oral cholecalciferol(1000 IU/day) versus placebo for 1 month.
-6.5
-3.3
Vitamin D Placebo
p=0.04
-.-0
-1.0 –
-2.0 –
-3.0 –
-4.0 –
-5.0 –
-6.0 –
-7.0 –
The AD improvement from vitamin D supplementationhas strong biologicalplausibility :
Importance of vitamin D for epidermal barrier function.
Production of the antimicrobial peptide cathelicidin.
Improvement in EASI score mean after 1 month

Lower vitamin D status is closely correlated with eczema of the head and neck.
Noh S, J Allergy Clin Immunol 2014;133:1767-69
82 patients with AD, 38 asthmatic patients, and 49 healthy controlsubjects (HCs).
25-hydroxyvitamin D.
Mean serum 25-hydroxyvitamin D (25[OH]VitaminD) concentrations

Lower vitamin D status is closely correlated with eczema of the head and neck.
Noh S, J Allergy Clin Immunol 2014;133:1767-69
82 patients with AD, 38 asthmatic patients, and 49 healthy controlsubjects (HCs).
25-hydroxyvitamin D.
Mean serum 25-hydroxyvitamin D (25[OH]VitaminD) concentrations
Patients with AD have much lower 25 (OH) VitaminDconcentrations than
HCs (P <0.001)
or asthmatic patients (P =0.001).

Lower vitamin D status is closely correlated with eczema of the head and neck.
Noh S, J Allergy Clin Immunol 2014;133:1767-69
The correlation study showed a statistically significant negative correlation between the 25(OH) Vitamin D concentration and eczema involvement of:
the total area and the head and neck area

In this study there were much lower VitD levels in patients with AD than in asthmatic patients or HCs.
In our data VitD levels were significantly inversely associated with eczema area rather than with severity of AD.
Even in asthmatic patients, in whom the skin is unaffected by inflammation, there were no significantly lower VitD levels compared with those seen in HCs in our study.
We herein propose that patients with AD have lower serum VitD levels because VitD production in the skin is impaired as a result of cutaneousinflammation.
Because the head and neck type of AD is frequently sensitized to Malassezia species yeasts, the possibility that metabolites of colonizing Malassezia species in the head and neck might be modified by UV and cause alteration in VitD metabolism should be further studied.
Lower vitamin D status is closely correlated with eczema of the head and neck.
Noh S, J Allergy Clin Immunol 2014;133:1767-69

Association between childhood atopic dermatitis,malnutrition, and low bone mineral density:
A US population-based studySilverberg JI, Pediatr Allergy Immunol. 2015;26:54-61
3049 children (8–19 yrs) from the 2005–2006 National Health and Nutrition Examination Survey.
Questionnaire, dual energy X-ray absorptiometry, and blood samples.
Atopic Dermatitis was associated with:
• higher odds of 25-OH vitamin D deficiency OR = 4.81
• lower bone mineral density (BMD) Z-score and

Association between childhood atopic dermatitis,malnutrition, and low bone mineral density:
A US population-based studySilverberg JI, Pediatr Allergy Immunol. 2015;26:54-61
low BMD in AD appear to be related to malnutrition as judged by low BMI and albumin levels.
Malnutrition may be related to avoidance diets in AD patients with suspected food allergies or perceived exacerbation of their skin disease by foods.
Diets that avoid milk products and other essential foods may result in severe malnutrition.
AD was associated with vitamin D deficiency, which is consistent with previous studies that found correlations between AD severity and vitamin D levels.
It may be that vitamin D levels are decreased secondary to food avoidance and malnutrition, rather than inflammation per se.

52 homes of patients with AD.
Water damage by thermal assessments using an infrared camera.
% homes with water damage
60 –
50 –
40 –
30 –
20 –
10 –
0
59.6%
Infrared camera-proven water-damaged homes are associated with the severity of atopic dermatitis
in children Seo Ann Allergy 2014;113:565

52 homes of patients with AD.
Water damage by thermal assessments using an infrared camera.
% homes with water damage
60 –
50 –
40 –
30 –
20 –
10 –
0
59.6%
Infrared camera-proven water-damaged homes are associated with the severity of atopic dermatitis
in children Seo Ann Allergy 2014;113:565
Concentrations ofairborne mold were
significantly higher in water-damaged homes
than in undamaged homes (p=0.0013).

Photographs of a home with water damage. Photographs of same areas taken
by the infrared camera, showing water damage (darker areas)
52 homes of patients with AD.
Water damage by thermal assessments using an infrared camera.
Infrared camera-proven water-damaged homes are associated with the severity of atopic dermatitis
in children Seo Ann Allergy 2014;113:565

OR for moderate to severe Atopic Dermatitis
in water-damaged homes
14.515 –
10 –
05 –
00
p=0.0025
52 homes of patients with AD.
Water damage by thermal assessments using an infrared camera.
Infrared camera-proven water-damaged homes are associated with the severity of atopic dermatitis
in children Seo Ann Allergy 2014;113:565

Background:
National and international AD guidelines address AD care in a stepwise fashion.
Wet wrap therapy (WWT) is a therapeutic intervention for moderate-to-severe AD.
Wet Wrap Therapy in Children with Moderate to SevereAtopic Dermatitis in a Multidisciplinary Treatment Program
Nicol NH, JAllergy Clin Immunol Pract 2014;2:400

Objective:
This cohort study evaluated the effectiveness of WWT as part of a multidisciplinary AD treatment program to improve disease severity.
Patients treated in this unique outpatient program had moderate-to-severe AD and had multiple therapies that failed.
Wet Wrap Therapy in Children with Moderate to SevereAtopic Dermatitis in a Multidisciplinary Treatment Program
Nicol NH, JAllergy Clin Immunol Pract 2014;2:400

Severity of the AD by -Scoring Atopic Dermatitis (SCORAD)
-AD Quickscore (ADQ).
Severity classifications are determined from SCORAD index scores: -mild (<25)-moderate (25-49)-severe (>50).
ADQ was scored at admission, discharge, and 1 monthafter discharge from the Atopic Dermatitis Program.
72 children with a mean age of 4.6 ± 3.12 yrs
SCORAD at admission and at discharge
Wet Wrap Therapy in Children with Moderate to SevereAtopic Dermatitis in a Multidisciplinary Treatment Program
Nicol NH, JAllergy Clin Immunol Pract 2014;2:400

72 children with a mean age of 4.6 ± 3.12 yrs
SCORAD at admission and at discharge
mean SCORAD score
admission
60 –
50 –
40 –
30 –
20 –
10 –
0
49.7
14.8
discharge
P<0.001
Wet Wrap Therapy in Children with Moderate to SevereAtopic Dermatitis in a Multidisciplinary Treatment Program
Nicol NH, JAllergy Clin Immunol Pract 2014;2:400
None of these patients required
systemic immunosoppressive
therapy

Bendaggio Umido Tecnica

WWT protocol
Wet Wrap Therapy in Children with Moderate to SevereAtopic Dermatitis in a Multidisciplinary Treatment Program
Nicol NH, JAllergy Clin Immunol Pract 2014;2:400

WWT protocol
Wet Wrap Therapy in Children with Moderate to SevereAtopic Dermatitis in a Multidisciplinary Treatment Program
Nicol NH, JAllergy Clin Immunol Pract 2014;2:400

WWT protocol
Wet Wrap Therapy in Children with Moderate to SevereAtopic Dermatitis in a Multidisciplinary Treatment Program
Nicol NH, JAllergy Clin Immunol Pract 2014;2:400

SCORAD on admission (blue bars) and at discharge (red bars)
P < 0.001
Mean ADQ (Atopic Dermatitis Quickscore-black)
vs SCORAD (red)
Wet Wrap Therapy in Children with Moderate to SevereAtopic Dermatitis in a Multidisciplinary Treatment Program
Nicol NH, JAllergy Clin Immunol Pract 2014;2:400

SCORAD on admission (blue bars) and at discharge (red bars)
P < 0.001
Mean ADQ (Atopic Dermatitis Quickscore-black)
vs SCORAD (red)
Patient were treated with WWT for a minimum of
2 days and for a maximum of 16 days, with the mean stay of 7.5 days
Wet Wrap Therapy in Children with Moderate to SevereAtopic Dermatitis in a Multidisciplinary Treatment Program
Nicol NH, JAllergy Clin Immunol Pract 2014;2:400

Are the concepts of induction of remission and treatment of subclinical inflammation in atopic dermatitis clinically
useful? Tang TS, J Allergy Clin Immunol 2014;133:1615-25
Background Atopic dermatitis (AD) treatment is often initiated by symptoms or visible
erythema. The role of induction of remission or treatment of inflammation that is not
visible is unclear.Objective
We investigated whether 1) the notion of subclinical inflammation is scientifically sound, 2) treatment corrects subclinical inflammation, 3) different strategies for initial clearance of AD affect long-term disease
control.Methods
We conducted a systematic review based on searching.

26 studies
Are the concepts of induction of remission and treatment of subclinical inflammation in atopic dermatitis clinically
useful? Tang TS, J Allergy Clin Immunol 2014;133:1615-25
20 of 26 included studies presented evidence of subclinical inflammation, with a continuum of changes in skin barrier dysfunction, the proinflammatory cytokine milieu,
and
lymphocytic infiltration from normal-appearing skin to post-treatment lesional skin to active skin lesions in patients with AD.

Are the concepts of induction of remission and treatment of subclinical inflammation in atopic dermatitis clinically
useful? Tang TS, J Allergy Clin Immunol 2014;133:1615-25
26 studies
Failure to achieve control of AD symptoms with initial therapy was associated with
a higher risk of relapse in 14 randomized controlled trials with fluticasone: risk ratio, 1.31; with tacrolimus: risk ratio, 1.36).

Are the concepts of induction of remission and treatment of subclinical inflammation in atopic dermatitis clinically
useful? Tang TS, J Allergy Clin Immunol 2014;133:1615-25
26 studies
3 trials on systemic therapy/phototherapy suggested that induction of remission resulted in
long-term remission without maintenance therapy in approximately 15% of patients.
Induction of remission followed by maintenance therapy might prove to be an integral part of a disease-modifying
strategy for treating atopic diseases.

Are the concepts of induction of remission and treatment of subclinical inflammation in atopic dermatitis clinically
useful? Tang TS, J Allergy Clin Immunol 2014;133:1615-25
Putative diagram (top) illustrating what might currently happen when the initial induction of remission treatment period (started at point A) ceases once signs and symptoms have reduced (clinical remission or point B) as opposed to what might happen (bottom) if initial induction of remission extended to clear subclinical disease (subclinical remission or point C). Each induction of remission period is followed by maintenance or proactive treatment, requiring 2 consecutive days of treatment per week to previously active sites (points D).

What is New in Pediatric Allergic Diseases 2015
Attilio BonerUniversity ofVerona, Italy
Diagnosis
Food Allergy
Atopic Dermatitis
Allergic Asthma
Allergic Rhinitis
Anaphylaxis
Urticaria & Angioedema
Risk & Protective factors
Burden

Optimum predictors of childhood asthma: persistent wheeze or the Asthma Predictive Index?
Amin P, J Allergy Clin Immunol Pract 2014;2:709-15
The Asthma Predictive Index (API) is a validated clinical model for childhood asthma originally developed with the Tucson Children's Respiratory Study.
In this study, parents were asked whether their child had chest wheezing or whistling and to indicate on a Likert scale (1 to 5, from “very rarely” to “on most days”) how frequently the child had wheezed; early frequent “wheezers” were defined as children with a score ≥ 3.
This API used major (ie, parental asthma and eczema) and minorclinical criteria (ie, allergic rhinitis, wheezing apart from colds and peripheral eosinophilia) to predict asthma later in childhood (ie, age 6 and older) in age 3 early frequent “wheezers. Castro-Rodriguez, J.A. et al. Am J Respi Crit Care Med. 2000; 162: 1403–1406

Optimum predictors of childhood asthma: persistent wheeze or the Asthma Predictive Index?
Amin P, J Allergy Clin Immunol Pract 2014;2:709-15
A similar index, the modified API (mAPI) (herein defined as the “University of Cincinnati API or ucAPI) was developed by Guilbert et al. in the Prevention of Asthma in Kids (PEAK) trial in 2004.Guilbert, T.W. Et al. Control Clin Trials. 2004;25:286–310
The mAPI uses criteria similar to that of the API to predict childhood asthma, albeit early frequent wheezing was defined as ≥ 4 wheezing episodes per year during the first 3 years. The major criteria of the mAPI added a third criterion of allergic sensitization to ≥ 1 aeroallergen and replaced physician-diagnosed allergic rhinitis in the minor criteria of the original API with allergic sensitization to milk, egg, or peanuts.

Optimum predictors of childhood asthma: persistent wheeze or the Asthma Predictive Index?
Amin P, J Allergy Clin Immunol Pract 2014;2:709-15
defined as the “University of Cincinnati API (ucAPI)
A positive ucAPI at age 3 in our study was defined as having ≥ 2 episodes of wheezing in the previous 12 months at the age 3, and 1 of the 3 major criteria
(parental asthma, allergic sensitization to 1 or more aeroallergens, or a history of eczema) or 2 of the 3 minor criteria (wheezing without a cold, physician-diagnosed allergic rhinitis,
or allergic sensitization to milk or egg).

Optimum predictors of childhood asthma: persistent wheeze or the Asthma Predictive Index?
Amin P, J Allergy Clin Immunol Pract 2014;2:709-15
Cincinnati Childhood Allergy and Air Pollution Study.
A high-risk prospective birth cohort (n=589).
modified API (mAPI) (herein defined as the “University of Cincinnati API (ucAPI)
17.5%
20 –
15 –
10 –
05 –
. 0
% children with asthmaat age 7 years

Positive ucAPI
Optimum predictors of childhood asthma: persistent wheeze or the Asthma Predictive Index?
Amin P, J Allergy Clin Immunol Pract 2014;2:709-15
13.3
p<0.01
9.8
p<0.01
10.4
p<0.01 5.4
Persistent wheezing
Allergicpersistentwheezing
Nonallergicpersistentwheezing
15 –
10 –
05 –
01 –
at age 3 yrs
p<0.01
OR for asthma at age 7 years Cincinnati Childhood
Allergy and Air Pollution Study.
A high-risk prospective birth cohort (n=589).
modified API (mAPI) (herein defined as the “University of Cincinnati API (ucAPI)

Cincinnati Childhood Allergy and Air Pollution Study.
A high-risk prospective birth cohort (n=589).
modified API (mAPI) (herein defined as the “University of Cincinnati API (ucAPI)
Positive ucAPI
Optimum predictors of childhood asthma: persistent wheeze or the Asthma Predictive Index?
Amin P, J Allergy Clin Immunol Pract 2014;2:709-15
13.3
p<0.01
9.8
p<0.01
10.4
p<0.01 5.4
Persistent wheezing
Allergicpersistentwheezing
Nonallergicpersistentwheezing
15 –
10 –
05 –
01 –
at age 3 yrs
p<0.01
Both a positive ucAPIand persistent wheeze
at age 3 were associated with
objectively confirmed asthma at age 7;
however, the highest risk was associated
with ucAPI.
OR for asthma at age 7 years

Full blood count parameters for the detection of asthma inflammatory phenotypes Zhang X.Y, CEA 2014;44:1137-45
Background: In asthma, the airway inflammatory phenotype influencesclinical characteristics and treatment response. Although induced sputum is the gold standard test for phenotypingasthma, a more accessible method is needed for clinical practice.
Objective: To investigate whether white blood cell counts and/or their derived ratios can predict sputum eosinophilsor neutrophils in uncontrolled asthma.

164 treated butuncontrolled asthmaticpatients
sputum induction and blood collection
7 –
6 –
5 –
4 –
3 –
2 –
1 –
00
1.7%
5.3% 5.5%
1.9%
Mean % blood eosinophils in
p<0.008
Neutrophilicasthma
Eosinophilicasthma
Mixedgranulocytic
asthma
Paucigranulocytic
asthma
sputum
Full blood count parameters for the detection of asthma inflammatory phenotypes Zhang X.Y, CEA 2014;44:1137-45
≥3%.≥61%.
There was a significant positive
relationship betweenblood eosinophil
parameters and the percentage of
sputum eosinophilcount.

164 treated butuncontrolled asthmaticpatients
sputum induction and blood collection
7 –
6 –
5 –
4 –
3 –
2 –
1 –
00
1.7%
5.3% 5.5%
1.9%
Mean % blood eosinophils in
p<0.008
Neutrophilicasthma
Eosinophilicasthma
Mixedgranulocytic
asthma
Paucigranulocytic
asthma
sputum
Full blood count parameters for the detection of asthma inflammatory phenotypes Zhang X.Y, CEA 2014;44:1137-45
≥3%.≥61%.
The optimum cut-point for blood
eosinophil percentagewas 2.7%,
and this yielded a sensitivity of 92.2%
and a specificityof 75.8% foreosinophilic
asthma

164 treated butuncontrolled asthmaticpatients
sputum induction and blood collection
7 –
6 –
5 –
4 –
3 –
2 –
1 –
00
1.7%
5.3% 5.5%
1.9%
Mean % blood eosinophils in
p<0.008
Neutrophilicasthma
Eosinophilicasthma
Mixedgranulocytic
asthma
Paucigranulocytic
asthma
sputum
Full blood count parameters for the detection of asthma inflammatory phenotypes Zhang X.Y, CEA 2014;44:1137-45
≥3%.≥61%.
Blood eosinophil countscan accurately predicteosinophilic asthma in
patients with persistent uncontrolled
asthma despitetreatment

164 treated butuncontrolled asthmaticpatients
sputum induction and blood collection
7 –
6 –
5 –
4 –
3 –
2 –
1 –
00
1.7%
5.3% 5.5%
1.9%
Mean % blood eosinophils in
p<0.008
Neutrophilicasthma
Eosinophilicasthma
Mixedgranulocytic
asthma
Paucigranulocytic
asthma
sputum
Full blood count parameters for the detection of asthma inflammatory phenotypes Zhang X.Y, CEA 2014;44:1137-45
≥3%.≥61%.
Blood neutrophilparameters
are poor surrogatesfor the proportion
of sputumneutrophils

High blood eosinophil counts predict sputum eosinophiliain patients with severe asthma
Fowler SJ, J Allergy Clin Immunol 2015; 135:822-23
Cutoffs to define sputum eosinophilia of ≥ 2% and blood eosinophilia of ≥ 0.3 × 10⁹ cells/L (300/mm3) = (300/µL) were chosen.
The upper limit of the normal range for sputum eosinophil counts in the healthy (nonasthmatic) population is 1.9% or less, and therefore 2% seems appropriate, especially where most patients are already treated corticosteroids.
For blood eosinophil counts, a higher cutoff of normality of greater than 0.45 × 10⁹ cells/L (450/mm3) = (450/µL) is more commonly used.

High blood eosinophil counts predict sputum eosinophiliain patients with severe asthma
Fowler SJ, J Allergy Clin Immunol 2015; 135:822-23
Data from patients attending the Manchester Severe Asthma Service between 2006 and 2013.
All patients were receiving at least 1000 μg/d inhaled beclomethasonewith or without 5 mg of oral prednisone and with or without intramuscular triamcinolone.
Sputum either as a spontaneous sample or induced by using hypertonic saline.
A venous blood sample.

High blood eosinophil counts predict sputum eosinophiliain patients with severe asthma
Fowler SJ, J Allergy Clin Immunol 2015; 135:822-23
R = 0.493p < 0.001
Blood eosinophils (× 109 cells/L) against % sputum eosinophils, with cutoffs shown for sputum eosinophilia of ≥ 2% (dashed line)and blood eosinophil counts of ≥ 0.15 × 10⁹ cells/L (dotted line), ≥ 0.3 × 10⁹ cells/L (dashed line), > 0.45 × 10⁹ cells/L (solid line).
≥ 2% sputum
≥150 µl ≥300 µl >450 µl blood eosinophils
>450 µl eosinophilic
asthma≈

Blood eosinophil cutoff (× 109 cells/L)
≥0.15 ≥0.30 >0.45
Sensitivity (true +) 77.6 59.7 49.3
Specificity (true -) 53.3 84.4 97.0
Positive predictive value 45.2 65.6 89.2
Negative predictive value 82.8 80.9 79.4
Performance characteristics (percentages) for prediction of at least 2% sputum eosinophilia in patients with moderate and severe asthma by using
blood eosinophil count cutoffs of 0.15, 0.3, and 0.45 × 10⁹ cells/L
High blood eosinophil counts predict sputum eosinophiliain patients with severe asthma
Fowler SJ, J Allergy Clin Immunol 2015; 135:822-23
using a cutoff of 0.45/ 109 cells/L for blood eosinophilia can
usefully predict airway eosinophilia in patients
with severe asthma receiving high
levels of treatment.Lower cutoffs are not
useful.

% with an asthma attack in the previous year60 –
50 –
40 –
30 –
20 –
10 –
00
54%
children
High blood eosinophil count is associated with more frequent asthma attacks in asthma patients
Tran Ann Allergy 2014;113:19
52%
adults
Data from the National Health and Nutrition Examination Survey (NHANES) survey of the US general population.
Patients with asthma identified on self-report or parental report.
Blood eosinophil count using 200, 300, or 400 cells/µL (mm3) as cutoffs.

% children with an asthma attack in the previous year
70 –
60 –
50 –
40 –
30 –
20 –
10 –
00
56.3%
>200
High blood eosinophil count is associated with more frequent asthma attacks in asthma patients
Tran Ann Allergy 2014;113:19
60.0% 62.2%
>300 >400Blood eosinophil level (cells/µL)
OR=1.1 OR=1.35 OR=1.65
Data from the National Health and Nutrition Examination Survey (NHANES) survey of the US general population.
Patients with asthma identified on self-report or parental report.
Blood eosinophil count using 200, 300, or 400 cells/µL (mm3) as cutoffs.

Data from the National Health and Nutrition Examination Survey (NHANES) survey of the US general population.
Patients with asthma identified on self-report or parental report.
Blood eosinophil count using 200, 300, or 400 cells/µL (mm3) as cutoffs.
% children with an asthma attack in the previous year
70 –
60 –
50 –
40 –
30 –
20 –
10 –
00
56.3%
>200
High blood eosinophil count is associated with more frequent asthma attacks in asthma patients
Tran Ann Allergy 2014;113:19
60.0% 62.2%
>300 >400Blood eosinophil level (cells/µL)
OR=1.1 OR=1.35 OR=1.65
Higher blood eosinophil counts
were associated with more asthma attacks
in children butnot in adults.

The association of blood eosinophil counts to future asthma exacerbations in children with persistent asthma
Zeiger RS, JACI P 2015;3:283–287
29%
62%
32.7%
70 –
60 –
50 –
40 –
30 –
20 –
10 –
0
% children with
1 asthmaexacerbation
2 asthmaexacerbations
ED visit or hospitalization
a retrospective studyfrom a large medical care organization
blood eosinophil levels in 333 children with persistent asthma
blood eosinophil counts using cutoff points of 150/mm3, 200/mm3, 300/mm3, and 400/mm3
Exacerbations wasdefined as asthma outpatient visits
requiring systemic corticosteroid dispensingor asthma emergency
department (ED) visits or
hospitalizations.

The association of blood eosinophil counts to future asthma exacerbations in children with persistent asthma
Zeiger RS, JACI P 2015;3:283–287
0.53
1.0 –
0.5 –
0.0
0.82
asthma exacerbations(events per person-year)
< 300 mm3 ≥ 300 mm3
blood eosinophil count
p=0.01
a retrospective studyfrom a large medical care organization
blood eosinophil levels in 333 children with persistent asthma
blood eosinophil counts using cutoff points of 150/mm3, 200/mm3, 300/mm3, and 400/mm3
Knowledge of blood eosinophil counts may
encourage physicians to target and treat patients with elevated eosinophil
counts, even if the patients do not have a history of
exacerbations.

The association of blood eosinophil counts to future asthma exacerbations in children with persistent asthma
Zeiger RS, JACI P 2015;3:283–287
eosinophils ≥ 300/mm3
in 2010
RR for an asthma exacerbation in 2011
2.0 –
1.0 –
0.0
1.52
a retrospective studyfrom a large medical care organization
blood eosinophil levels in 333 children with persistent asthma
blood eosinophil counts using cutoff points of 150/mm3, 200/mm3, 300/mm3, and 400/mm3

The association of blood eosinophil counts to future asthma exacerbations in children with persistent asthma
Zeiger RS, JACI P 2015;3:283–287
Other variables selected associated with an increase in asthma exacerbations were:
1) a history of asthma exacerbations in 2010 (p<0.001)
2) decreasing age (p=0.01)
3) Global Initiative for Asthma (GINA) step-care levels 4 and 5 vs step-care levels 1 and 2 (p=0.04)
4) 7 or more short-acting β2-agonist (SABA) canisters dispensed (p=0.05)
5) Asian vs non-Hispanic white ethnicity (p=0.03)
6) Hispanic vs non-Hispanic white ethnicity (p=0.03)

Importance of concomitant local and systemic eosinophiliain uncontrolled asthma Schleich FN, ERJ 2014;44:97–108
508 asthmatics with successful sputum induction
blood and sputum eosinophils by breaking down the population into 4 groups according to blood (≥400 cells per mm3) and sputum (≥3%) eosinophils
Asthma Control Questionnaire (ACQ) and exacerbation rate
50 –
40 –
30 –
20 –
10 –
07%
19%
49%
25%
% patients with
Blood eosinophils/mm3
Sputum eosinophils
< 400< 3%
< 400> 3%
≥ 400< 3%
≥ 400≥ 3%

Importance of concomitant local and systemic eosinophiliain uncontrolled asthma Schleich FN, ERJ 2014;44:97–108
508 asthmatics with successful sputum induction
blood and sputum eosinophils by breaking down the population into 4 groups according to blood (≥400 cells per mm3) and sputum (≥3%) eosinophils
Asthma Control Questionnaire (ACQ) and exacerbation rate
Blood eosinophils/mm3
Sputum eosinophils
n° exacerbations per person per year
2.0 –
1.5 –
1.0 –
0.5 –
….0 0.420.93p<0.05 0.59
1.5p<0.001
< 400< 3%
< 400> 3%
≥ 400< 3%
≥ 400≥ 3%

Retrospective cohort: functional characteristics, asthma control and quality of life of asthmatics (n=508) according to blood and sputum eosinophil count
Importance of concomitant local and systemic eosinophiliain uncontrolled asthma Schleich FN, ERJ 2014;44:97–108

Retrospective cohort: functional characteristics, asthma control and quality of life of asthmatics (n=508) according to blood and sputum eosinophil count
Importance of concomitant local and systemic eosinophiliain uncontrolled asthma Schleich FN, ERJ 2014;44:97–108
The group with concordant systemic and airway eosinophilia (19%) showed - remarkable male predominance, and
- had the lowest airway calibre, asthma control and quality of life, and - the highest bronchial hyperresponsiveness, FeNO and exacerbation rate.

FEV1: forced expiratory volume in 1’’FVC: forced vital capacity BHR: bronchial hyperresponsivenessFeNO: exhaled nitric oxide fractionQoL: quality of life
Demographic, functional and inflammatory characteristics of patients according to their local and systemic eosinophil count
Importance of concomitant local and systemic eosinophiliain uncontrolled asthma Schleich FN, ERJ 2014;44:97–108

Exhaled nitric oxide fraction(FeNO) levels according to
the presence and/or absence of
blood (≥ 400/mm3) and sputum eosinophilia (≥ 3%)
Importance of concomitant local and systemic eosinophiliain uncontrolled asthma Schleich FN, ERJ 2014;44:97–108

Allergens on desktop surfaces in preschools andelementary schools of urban children with asthma
Kanchongkittiphon W., Allergy 2014; 69: 960
36 wiped samples from desktop surfaces were collected from preschools and schools
Samples were analyzed for detectable levels of common aeroallergens
Mouse
97.2%
80.6%
Cat
77.8%
DogAllergens
100 –
90 –
80 –
70 –
60 –
50 –
40 –
30 –
20 –
10 –
0 -
% (+) samples for:

Scatter plot of detectable table wipe and vacuumed floor dust samples from both preschools and elementary schools for
Allergens on desktop surfaces in preschools andelementary schools of urban children with asthma
Kanchongkittiphon W., Allergy 2014; 69: 960
r = 0.407, P = 0.168r = 0.721, P = 0.0001

Effects of dietary induced weight loss on exercise-induced bronchoconstriction in overweight and obese children Van Leeuwen JC, Pediatr Pulmonol. 2014;49:1155-1161
% reduction after diet period-00
-1 –
-2 –
-3 –
p<0.01
-2.6%
p<0.01
-1.5%
Weight
Kg/m2 (BMI)
20 asthmatic children aged 8–18 yrs with exercise-induced bronchoconstriction and moderate to severe overweight.
Diet based on healthy daily intake for 6 weeks.
Before and after the diet period an exercise challenge test in cold air.

Effects of dietary induced weight loss on exercise-induced bronchoconstriction in overweight and obese children Van Leeuwen JC, Pediatr Pulmonol. 2014;49:1155-1161
40 -
30 -
20 –
10 -
0.0 After
30.6%
21.8%
BeforeDiet period
Δ FEV1 post exercise
p<0.01 20 asthmatic children aged 8–18 yrs with exercise-induced bronchoconstriction and moderate to severe overweight.
Diet based on healthy daily intake for 6 weeks.
Before and after the diet period an exercise challenge test in cold air.

Effects of dietary induced weight loss on exercise-induced bronchoconstriction in overweight and obese children Van Leeuwen JC, Pediatr Pulmonol. 2014;49:1155-1161
Relation between reductionin BMI z-score and reduction
in % exercise induced fall in FEV1
R=0.53p=0.03
20 asthmatic children aged 8–18 yrs with exercise-induced bronchoconstriction and moderate to severe overweight.
Diet based on healthy daily intake for 6 weeks.
Before and after the diet period an exercise challenge test in cold air.

Prevalence of exercise-induced bronchoconstrictionand exercise-induced laryngeal obstruction in a general adolescent population. Johansson H, Thorax 2015;70:57–63.
Background Exercise-induced respiratory symptoms are common
among adolescents.
Exercise is a known stimulus for transient narrowing of the airways, such as:exercise-induced bronchoconstriction (EIB) and exercise induced laryngeal obstruction (EILO).
Our aim was to investigate the prevalence of EIB and EILO in a general population of adolescents.

Prevalence of exercise-induced bronchoconstrictionand exercise-induced laryngeal obstruction in a general adolescent population. Johansson H, Thorax 2015;70:57–63.
146 adolescents (99 with self-reported exercise-induced dyspnoeaand 47 without this condition)
Treadmill exercise tests
Continuous laryngoscopy during exercise.
Bronchoconstriction
20 –
15 –
10 –
5 –
0
% children with
5.7%
19.2%
Laryngeal obstruction
EXERCISE INDUCED

146 adolescents (99 with self-reported exercise-induced dyspnoeaand 47 without this condition)
Treadmill exercise tests
Continuous laryngoscopy during exercise.
Prevalence of exercise-induced bronchoconstrictionand exercise-induced laryngeal obstruction in a general adolescent population. Johansson H, Thorax 2015;70:57–63.
% adolescent with self reportedexercise-induced dyspnoea with
40 –
30 –
20 –
10 –
0.0 6% 4%
39.8%
Exercise-inducedbronchoconstriction
Exercise inducedlaryngeal
obstruction
Bothconditions
Both EIB and EILO are common causes of
exercise-induced dyspnoea
in adolescents.
EILO is equallycommon among girls and boys and can coexist with EIB.

Lesson of the month: rowing-induced laryngeal obstruction: a novel cause of exertional dyspnoea: characterised by
direct laryngoscopy. Panchasara B, Thorax 2015;70:95–97.
Exercise-induced laryngeal obstruction (EILO) is a key differential diagnosis for unexplained dyspnoea inathletes.
The gold standard means for diagnosis of EILO is direct laryngoscopy, performed continuously, while an athlete undertakes the specific sport that precipitates their symptoms
Continuous laryngoscopy during exercise performed on a rowing ergometer.

Lesson of the month: rowing-induced laryngeal obstruction: a novel cause of exertional dyspnoea: characterised by
direct laryngoscopy. Panchasara B, Thorax 2015;70:95–97.
Exercise-induced laryngeal obstruction (EILO) is a key differential diagnosis for unexplained dyspnoea inathletes.
The gold standard means for diagnosis of EILO is direct laryngoscopy, performed continuously, while an athlete undertakes the specific sport that precipitates their symptoms
Image stills of laryngealaperture taken during inspiration in the first patient; (A) rest, (B) moderate intensity
exercise—slight internal rotation of arytaenoidstructures,
(C) peak exercise—partial occlusion of the larynx at the level of the supraglottiswith abnormal adduction and medial rotation of supraglottic structures with tethering of aryepiglotticfolds.

Not all wheeze is asthma: time for patients to exercise their rights. Editorial Hull JH. Thorax 2015;70:7–8.
It is now over a century since Sir William Osler first highlighted the fact that not all breathlessness and wheeze is caused by asthma; with a description that in some,… ‘the laryngeal muscle can spasm during periods of stress’ and as such act to mimicbronchoconstriction.
Osler W. Hysteria. In: The principles and practice of medicine. New York: Appleton, 1902:1087–1100.
In this study is exercise-induced laryngeal obstruction (EILO) the larynx can transiently narrow during intense exercise, typically secondary to an antero-medial ‘in-folding’ of the supraglottic or arytenoid structures.

The key mechanism(s) underlying the development of EILO remain to be determined; however, undoubtedly the forces and pressure changes that are manifest across the larynx during intense exercise hyperpnoea play a key role in promoting in-folding of vulnerable laryngeal structures.
Continuous laryngoscopy during exercise involves placement of a fibreopticlaryngoscope on specialist headgear, in order to allow continuous recorded visualisation of the larynx, throughout an intense exercise bout. This permits a ‘real-time’ assessment of laryngeal movement and thus delineates any propensity to inappropriate closure.
Not all wheeze is asthma: time for patients to exercise their rights. Editorial Hull JH. Thorax 2015;70:7–8.

130 individuals aged 10 to 50 yrs who lived in Tehran.
A 24-week period.
Both groups received asthma controllers (budesonide or budesonide plus formoterol).
The intervention group received vitamin D supplementation (100,000-U bolus intramuscularly plus 50,000 U orally weekly).
The effects of vitamin D supplementation on airway functions in mild to moderate persistent asthma
Arshi Ann Allergy 2014;113:404
Vitamin D changes (ng/mL)during study in each group

FEV1 changes during the study in each group
The effects of vitamin D supplementation on airway functions in mild to moderate persistent asthma
Arshi Ann Allergy 2014;113:404
130 individuals aged 10 to 50 yrs who lived in Tehran.
A 24-week period.
Both groups received asthma controllers (budesonide or budesonide plus formoterol).
The intervention group received vitamin D supplementation (100,000-U bolus intramuscularly plus 50,000 U orally weekly).
P<0.001

FEV1 changes during the study in each group
The effects of vitamin D supplementation on airway functions in mild to moderate persistent asthma
Arshi Ann Allergy 2014;113:404
130 individuals aged 10 to 50 yrs who lived in Tehran.
A 24-week period.
Both groups received asthma controllers (budesonide or budesonide plus formoterol).
The intervention group received vitamin D supplementation (100,000-U bolus intramuscularly plus 50,000 U orally weekly).
A significantimprovement was seen in the intervention group in
the last 16 weeks, and FEV1 was significantly
better in the intervention group than the other group after 24 weeks
(p<0.001).
P<0.001
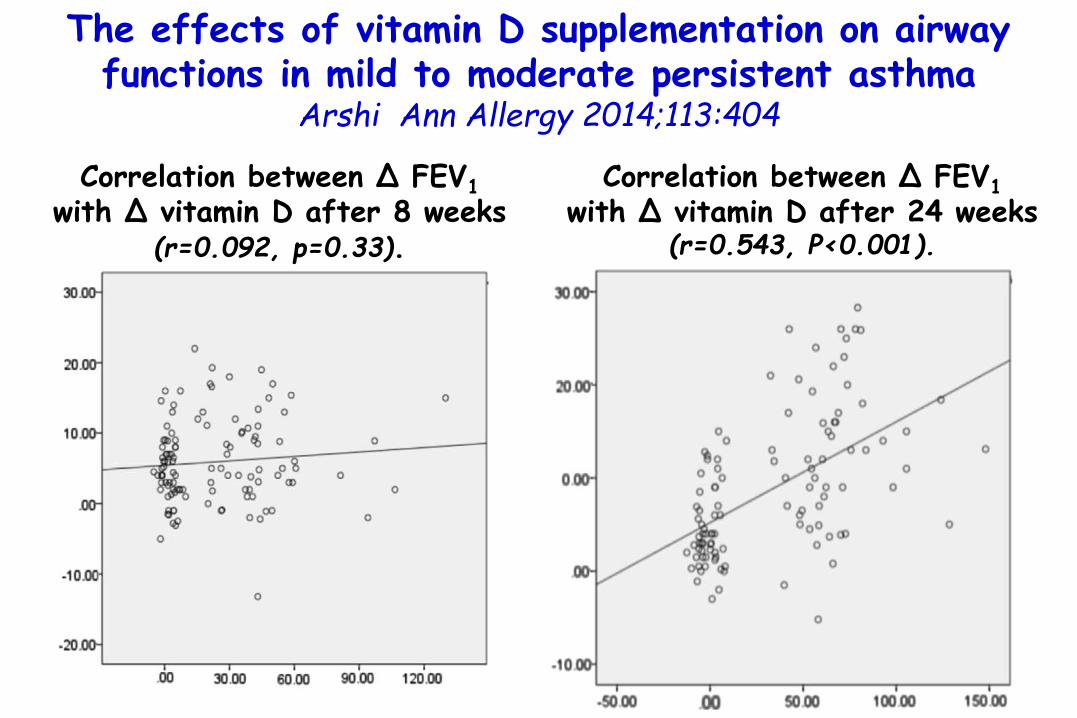
Correlation between Δ FEV1
with Δ vitamin D after 8 weeks (r=0.092, p=0.33).
Correlation between Δ FEV1
with Δ vitamin D after 24 weeks (r=0.543, P<0.001).
The effects of vitamin D supplementation on airway functions in mild to moderate persistent asthma
Arshi Ann Allergy 2014;113:404

1.56
RR for exacerbations requiring OCS
in children with 25-OH-VitD levels
<20 ng/mL vs ≥20 ng/mL
2.0 –
1.5 –
1.0 –
0.5 –
0.0
The association between vitamin D status and the rate of exacerbations requiring oral corticosteroids in preschool
children with recurrent wheezing.Beigelman A, J Allergy Clin Immunol 2014;133:1489-92
264 children (12-53 mo) with a history of recurrent severe wheezing.
All participants had risk factors for future asthma, as evidenced by a positive modified Asthma Predictive Index.
p=0.035

Evaluation of Efficacy of Curcumin as an Add-on therapy in Patients of Bronchial Asthma.
Abidi A, J Clin Diagn Res. 2014;8(8):HC19-24.
60 patients of mild to moderate asthma with bronchodilator reversibility test with ≥15% improvement FEV1.
Group A - Receiving standard therapy for bronchial asthma for 30d (n=30) and Group B - Receiving standard therapy for bronchial asthma + Curcumin500mg BD daily for 30d (n=30).
curcumin capsules help in improving the airway obstruction which was evident by significant improvement in the mean FEV1 values.
There was also significant reduction in the eosinophil%

47 asthmatic children (moderate-severe GINA Guidelines) (12.01 ± 3.1 years)
admitted to Istituto Pio XII, Misurina
Supplementation for 1 mo with a mixture of nutraceuticals (n=15) or placebo (n=32)
FeNO expressed as median values
9%
Anti-oxidants supplementation reduces FeNOin children with asthma. Boccaccino A, Piacentini G. in press
ns
P=0.03
18 16
19
11

Sleep duration, sleep hygiene and insomnia in adolescents with asthma Meltzer L, JACIP 2014;2: 562-69
298Adolescents (48% with asthma) fromthe general community
On-line survey
the Children’s Report of Sleep Patterns, and the Insomnia Severity Index.
2.2%
50 –
40 –
30 –
20 –
10 –
0
7.46%
44%
% adolescentes reporting
insufficient weekday sleep
31%
Severeasthma
Noasthma

2.2%
% of adolescents who met criteria for insufficient (<7 h), borderline (7-9 h), and optimal (>9 h) sleep duration on weekdays.
Sleep duration, sleep hygiene and insomnia in adolescents with asthma Meltzer L, JACIP 2014;2: 562-69
298Adolescents (48% with asthma) fromthe general community
On-line survey
the Children’s Report of Sleep Patterns, and the Insomnia Severity Index.

2.2%
Frequency of reporting no insomnia(ISI score 0 to 7), subthreshold clinical
insomnia (ISI score 8 to 14), or moderate-severe clinical insomnia (ISI score ≥15).
298Adolescents (48% with asthma) fromthe general community
On-line survey
the Children’s Report of Sleep Patterns, and the Insomnia Severity Index.
Sleep duration, sleep hygiene and insomnia in adolescents with asthma Meltzer L, JACIP 2014;2: 562-69
Many adolescentswith severe asthma
regularly obtaininsufficient sleep, have poor sleephygiene, and
experience clinicallysignificant insomnia

298Adolescents (48% with asthma) fromthe general community
On-line survey
the Children’s Report of Sleep Patterns, and the Insomnia Severity Index.
2.2%
Frequency of reporting no insomnia(ISI score 0 to 7), subthreshold clinical
insomnia (ISI score 8 to 14), or moderate-severe clinical insomnia (ISI score ≥15).
It is importantto ask adolescents with
asthma about sleepduration, sleep
hygiene, and insomniabecause there are
effective interventionsthat can improve
sleep for these youths
Sleep duration, sleep hygiene and insomnia in adolescents with asthma Meltzer L, JACIP 2014;2: 562-69

2.2%
The Children’s Report of Sleep Patterns is a 52-item self-report measure of sleepthat includes modules for sleep patterns, sleep hygiene, sleep disturbances, and daytime sleepiness *
* Meltzer L, The Children’s Report of Sleep Patterns: Sleepiness Scale: a self-report measure for school-aged children. Sleep Med 2012;13:385-9.
* Meltzer L, The Children’s Report of Sleep Patterns (CRSP): a self-report measure of sleep forschool-aged children. J Clin Sleep Med 2013;9:235-45.
• The sleep hygiene indices included Caffeine Use, Stimulating Activities in the Hour Before Bed (eg, video games), Electronics Use at Sleep Onset (eg, television), Sleep Location (ie, falling asleep or waking up somewhere other thanthe child’s bed), and Negative Bedtime Cognitions (eg, worries about the next daythat prevent sleep onset).
• Higher scores indicate poorer sleep hygiene and more daytime sleepiness.
• Categories of insufficient sleep duration (<7 hours), borderline sleep duration (7-9 hours),optimal sleep duration (>9 hours)
Children’s report of sleep patterns
Sleep duration, sleep hygiene and insomnia in adolescents with asthma Meltzer L, JACIP 2014;2: 562-69

2.2%
The Insomnia Severity Index (ISI) has 7 items that evaluatethe severity of insomnia symptoms (eg, difficulties initiating and maintaining sleep) and the consequences of sleep problems and/or disruptions*
* Bastien CH, Validation of the insomnia severity index as an outcome measure forinsomnia research. Sleep Med 2001;2:297-307.
Cut off scores have been established to identify insomnia severity
• no clinically significant insomnia [ISI score of 0-7],• subthreshold clinically significant insomnia [ISI score of 8-14], • clinically significant insomniae moderate/severe [ISI score ≥ 15]
Insomnia severity index
Sleep duration, sleep hygiene and insomnia in adolescents with asthma Meltzer L, JACIP 2014;2: 562-69

What is New in Pediatric Allergic Diseases 2015
Attilio BonerUniversity ofVerona, Italy
Diagnosis
Food Allergy
Atopic Dermatitis
Allergic Asthma
Allergic Rhinitis
Anaphylaxis
Urticaria & Angioedema
Risk & Protective factors
Burden

Exercise-induced bronchospasm related to different phenotypes of rhinitis without asthma in primary
schoolchildren: the French Six Cities StudyCaillaud D, CEA 2014;44:858-866
7781 schoolchildren (mean age of 10 years)
EIB test and SPTs
Score for allergic rhinitis (SFAR) ≥7 as a marker of ‘past-year allergic rhinitis’
Self-completed questionnaire for the Score For Allergic Rhinitis (SFAR)

4 –
3 –
2 –
1 –
0
% children with (+) EIB (ΔPEFR ≥15%)
3.33%
Exercise-induced bronchospasm related to different phenotypes of rhinitis without asthma in primary
schoolchildren: the French Six Cities StudyCaillaud D, CEA 2014;44:858-866
7781 schoolchildren (mean age of 10 years)
EIB test and SPTs
Score for allergic rhinitis (SFAR) ≥7 as a marker of ‘past-year allergic rhinitis’

2.51
EVER HAY FEVER
OR for (+) EIB including asthmatics3.0 –
2.0 –
1.0 –
0.0
2.622.99
p<0.0001 p<0.0001p<0.0001
PAST-YEAR RHINOCONJUNCTIVITIS
SFAR≥7
Exercise-induced bronchospasm related to different phenotypes of rhinitis without asthma in primary
schoolchildren: the French Six Cities StudyCaillaud D, CEA 2014;44:858-866
7781 schoolchildren (mean age of 10 years)
EIB test and SPTs
Score for allergic rhinitis (SFAR) ≥7 as a marker of ‘past-year allergic rhinitis’

1.56
EVER HAY FEVER
OR for (+) EIB excluding asthmatics3.0 –
2.0 –
1.0 –
0.0
1.841.97
PAST-YEAR RHINOCONJUNCTIVITIS
SFAR≥7
Exercise-induced bronchospasm related to different phenotypes of rhinitis without asthma in primary
schoolchildren: the French Six Cities StudyCaillaud D, CEA 2014;44:858-866
7781 schoolchildren (mean age of 10 years)
EIB test and SPTs
Score for allergic rhinitis (SFAR) ≥7 as a marker of ‘past-year allergic rhinitis’
EIB is associated with rhinitis phenotypes in the absence of asthma

Exhaled nitric oxide in children with allergic rhinitis: A potential biomarker of asthma development
Di Cara G., Pediatr Allergy Immunol. 2015;26:85-87
109 (mean age 8.4 yr) children with AR.
5 yr of follow-up.
SPTs, spirometry, and FeNO.
N° of children developing asthmaduring 5 yrs follow up
˂20
30 –
20 –
10 –
0.0 20-35 ˃35
Baseline FeNO ppb
0 0
21(19.2%)

Exhaled nitric oxide in children with allergic rhinitis: A potential biomarker of asthma development
Di Cara G., Pediatr Allergy Immunol. 2015;26:85-87
109 (mean age 8.4 yr) children with AR.
5 yr of follow-up.
SPTs, spirometry, and FeNO.
N° of children developing asthmaduring 5 yrs follow up
˂20
30 –
20 –
10 –
0.0 20-35 ˃35
Baseline FeNO ppb
0 0
Only children with high
baseline FeNO values,developed asthma,
documented by asthmasymptom occurrence
(i.e. dyspnoea, wheezing, and cough after respiratory infection and/or exercise and exposure to
allergen) and lung function assessment,
mainly concerningreversibility.
21(19.2%)

Rhinitis as a risk factor for depressive mood in pre-adolescents: a new approach to this relationship
Audino P. Pediatr Allergy Immunol. 2014;25:360-5
40 –
20 –
0
% subjects with
Rhinitis
1283 subjectsaged 10–13 yrs
Questionnairerelevant tosocioeconomicstatus (HCI)
Test fordepression and anxiety
16.0%13.6%
7.7%
33.4%
Depressive mood
Anxious mood
Both depressive and anxious
mood

11.2%
17.7%20 –
15 -
10 –
5 -
0
Likelihood of being depressed
NO YESRHINITIS
Rhinitis as a risk factor for depressive mood in pre-adolescents: a new approach to this relationship
Audino P. Pediatr Allergy Immunol. 2014;25:360-5
1283 subjectsaged 10–13 yrs
Questionnairerelevant tosocioeconomicstatus (HCI)
Test fordepression and anxiety
Moreover, a direct effect of low socioeconomic
status on depressive mood
was shown(p < 0.0001)

Growth Velocity Reduced with Once-Daily FluticasoneFuroate Nasal Spray in Prepubescent Children with
Perennial Allergic RhinitisLaurie A.L., J Allergy Clin Immunol Pract. 2014;2:421
5.46 cm/yr
FFNS Placebo
Mean growth velocity during treatment
6 –
4 –
2 –
0 -
Children aging 5-8.5 yrs
treated continuously for 1 year with fluticasone furoatenasal spray (FFNS) 110 mcg once daily (n=186) and placebo (n=187) nasal spray
Nasal symptom assessments as measure of adherence.
5.19 cm/yr
- 27 mm

Growth Velocity Reduced with Once-Daily FluticasoneFuroate Nasal Spray in Prepubescent Children with
Perennial Allergic RhinitisLaurie A.L., J Allergy Clin Immunol Pract. 2014;2:421
5.46 cm/yr
FFNS Placebo
Mean growth velocity during treatment
6 –
4 –
2 –
0 -
Children aging 5-8.5 yrs
treated continuously for 1 year with fluticasone furoatenasal spray (FFNS) 110 mcg once daily (n=186) and placebo (n=187) nasal spray
Nasal symptom assessments as measure of adherence.
5.19 cm/yr
Once-daily tratment with FFNS resulted in a small reduction
in growth mean difference -0.270 cm/y
Clinicians will need to balance the reduction in growth observed with FFNS to its potential for
clinical benefit
24-hour urinary cortisol excretion levels remained within the
normal range for both treatment groups
- 27 mm

Histogram of growth velocity (c/y) during the treatment period
Growth Velocity Reduced with Once-Daily FluticasoneFuroate Nasal Spray in Prepubescent Children with
Perennial Allergic RhinitisLaurie A.L., J Allergy Clin Immunol Pract. 2014;2:421

PLACEBO FFNS
- 00.0-
-0.5-
- -1.0-
-1.5-
-0.99
-1.23%
-1.23
Mean changefrom baseline TNSS
Growth Velocity Reduced with Once-Daily FluticasoneFuroate Nasal Spray in Prepubescent Children with
Perennial Allergic RhinitisLaurie A.L., J Allergy Clin Immunol Pract. 2014;2:421
Children aging 5-8.5 yrs
treated continuously for 1 year with fluticasone furoatenasal spray (FFNS) 110 mcg once daily (n=186) and placebo (n=187) nasal spray
Nasal symptom assessments as measure of adherence.

What is New in Pediatric Allergic Diseases 2015
Attilio BonerUniversity ofVerona, Italy
Diagnosis
Food Allergy
Atopic Dermatitis
Allergic Asthma
Allergic Rhinitis
Anaphylaxis
Urticaria & Angioedema
Risk & Protective factors
Burden

1) Chlorhexidine is one of the most effective disinfectants
2) It is widely used in both healthcare and private households, and exposure to chlorhexidine is almost inevitable
3) Immediate-type chlorhexidine allergy has increased
4) Several recent case series indicate that allergic reactions to chlorhexidine may lead to anaphylactic shock or even cardiac arrest
5) The allergy is easily overlooked because chlorhexidine is often not suspected as the allergen
Standardized testing with chlorhexidine in perioperative allergy – a large single-centre evaluation
Opstrup M, Allergy 2014;69:1390

sIgE (Immunocap®; Phadia AB), histamine release test (HR), SPT (5 mg/mL) and intradermal test (0.002 mg/mL) (IDT)
Positivity criteria: • sIgE >0.35 kUA/l• HR class 1–12• SPT mean wheal diameter ≥3 mm• IDT mean wheal diameter ≥ 2x the
diameter of negative control
228 patients with suspectedperioperative allergic reactions
10 –
5 -
0 -
9.6% (22/228)
% patients who met the definition of allergy to
chlorhexidine
Standardized testing with chlorhexidine in perioperative allergy – a large single-centre evaluation
Opstrup M, Allergy 2014;69:1390

Test results compared with allergy status to chlorhexidine
Standardized testing with chlorhexidine in perioperative allergy – a large single-centre evaluation
Opstrup M, Allergy 2014;69:1390

Estimated sensitivity and specificity were as follows: 1) sIgE (sensitivity 100% and specificity 97%), 2) HR (sensitivity 55% and specificity 99%), 3) SPT (sensitivity 95% and specificity 97%) and 4) IDT (sensitivity 68% and specificity 100%).
Using our definition of chlorhexidine allergy, the highest combined estimated sensitivity and specificity was found for
sIgE and SPT.
Standardized testing with chlorhexidine in perioperative allergy – a large single-centre evaluation
Opstrup M, Allergy 2014;69:1390
Sensitivity (true positive rate), Specificity ( true negative rate)
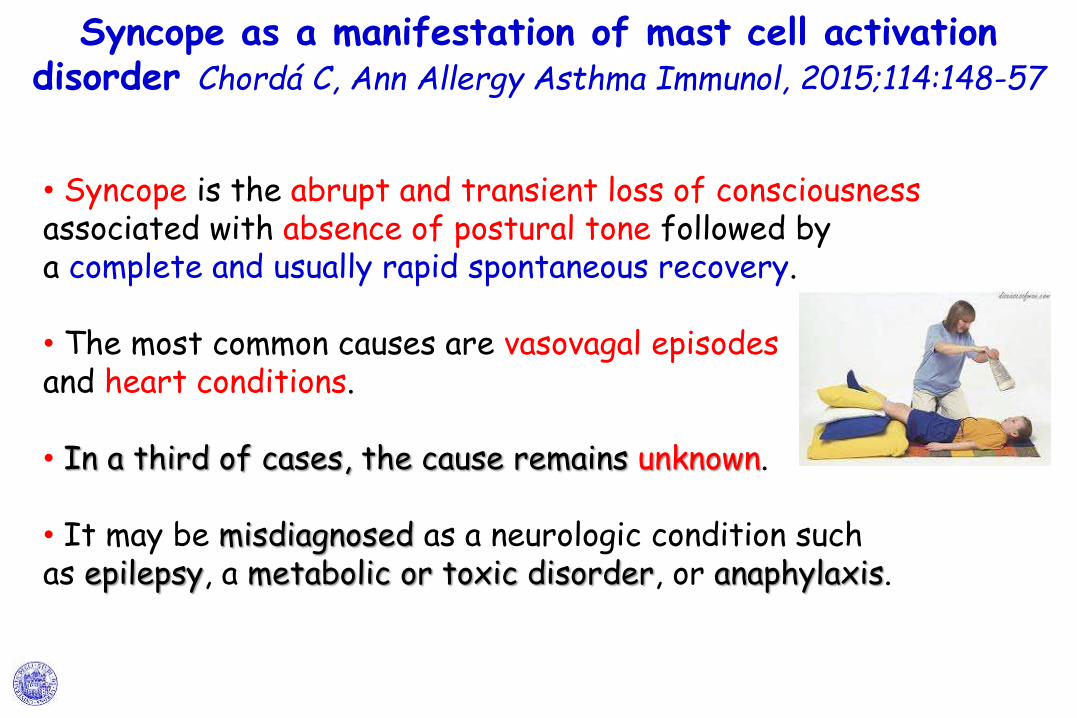
Syncope as a manifestation of mast cell activation disorder Chordá C, Ann Allergy Asthma Immunol, 2015;114:148-57
• Syncope is the abrupt and transient loss of consciousnessassociated with absence of postural tone followed by a complete and usually rapid spontaneous recovery.
• The most common causes are vasovagal episodesand heart conditions.
• In a third of cases, the cause remains unknown.
• It may be misdiagnosed as a neurologic condition such as epilepsy, a metabolic or toxic disorder, or anaphylaxis.

Syncope as a manifestation of mast cell activation disorder Chordá C, Ann Allergy Asthma Immunol, 2015;114:148-57
• Tryptase blood levels (the reference range is < 11.4 ng/mL) increase after 30 minutes and remain high for 6 hours, with peak values between 1 and 2 hours after the initiation of the reaction.
• A high blood level of tryptase obtained after an anaphylactic reaction must be controlled by a baseline determination.
• The finding of persistent high levels of tryptase is very suggestive of mast cell activation disorders (MCADs).

Syncope as a manifestation of mast cell activation disorder Chordá C, Ann Allergy Asthma Immunol, 2015;114:148-57
A 42-year-old, white man developed a sudden episode facial cyanosis, blurred vision, and loss of consciousness with absence of postural tone, hypotension (blood pressure, 89/52 mm Hg), tachycardia (142 bpm), hypersalivation, and urine incontinence.
• He reported having repeated similar episodes for the last 5 years.
• Repeated baseline tryptase determinations ranged from 23.7 to 25.9 μg/L.
• The bone marrow aspiration revealed a high percentage of basophils (13%), 11% showing atypical morphologic findings (spindle-shaped) and positive for toluidine blue staining.
a case of MCAD in a patient with recurrent episodes of syncope, without skin lesions but showing mast cell infiltration.
Because in this case the diagnosis of MCAD was suggested by the finding
of a high level of baseline serum tryptase after recurrent episodes of syncope,
we proposed the inclusion of tryptase levels in the evaluation of recurrent episodes of syncope.

What is New in Pediatric Allergic Diseases 2015
Attilio BonerUniversity ofVerona, Italy
Diagnosis
Food Allergy
Atopic Dermatitis
Allergic Asthma
Allergic Rhinitis
Anaphylaxis
Urticaria & Angioedema
Risk & Protective factors
Burden

Challenge-proven aspirin hypersensitivity in children with chronic spontaneous urticaria Cavkaytar O, Allergy 2015;70:153
1) The frequency of hypersensitivity reactions to NSAID is estimated to be:
0.3% in the general population,
0.55% in children with recurrent urticaria and angioedema,
4% in children with asthma and allergic rhinitis, and
68.2% in children with a history of NSAID hypersensitivityreferred to a tertiary health center for allergic diseases

Challenge-proven aspirin hypersensitivity in children with chronic spontaneous urticaria Cavkaytar O, Allergy 2015;70:153
2) Nonsteroidal anti-inflammatory drug hypersensitivity is classified as:
immunologically mediated (non-cross-reactive) or
non-immunologically mediated (cross-reactive)
3) NSAID-exacerbated cutaneous disease is defined as a subgroup of nonimmunologically mediated NSAID hypersensitivity

81 children with a history of chronic spontaneous urticarial
The daily or almost daily (>4 days a week) presence of urticaria was defined as ‘chronic persistent urticaria(CPU)’, while the presence of urticaria for 2–4 days a week was defined as ‘chronic recurrent urticaria’ (CRU)
Provocation tests with aspirin
Aspirin was administered at four exponentially increasing doses(27, 44, 117, 312 mg) until the cumulative dose of 10 mg/kg (the usual pediatric dose for pain or fever) or the maximum dose of 500 mg was reached.
Challenge-proven aspirin hypersensitivity in children with chronic spontaneous urticaria Cavkaytar O, Allergy 2015;70:153

The oral provocation test was recorded as (+) if one of the following clinical reactions took place:
unequivocal worsening of urticaria(defined as pruritic and erythematous areas raised over normal skin)
apparent angioedema (defined as swelling of the skin and/or external mucosa)
a minimum 15% decrease in FEV1 on spirometry
extracutaneous symptoms and signs (rhinorrhea, nasal congestion, conjunctivitis, or bronchospasm)
Challenge-proven aspirin hypersensitivity in children with chronic spontaneous urticaria Cavkaytar O, Allergy 2015;70:153

30 –
20 –
10 –
0.0
24%
10%
chronic persistent urticaria
chronic recurrent urticaria
Challenge-proven aspirin hypersensitivity in children with chronic spontaneous urticaria Cavkaytar O, Allergy 2015;70:153
% of children with(+) challenge
81 children with a history of chronic spontaneous urticaria(CSU)
The daily or almost daily (>4 days a week) presence of urticaria was defined as ‘chronic persistent urticaria(CPU)’, while the presence of urticaria for 2–4 days a week was defined as ‘chronic recurrent urticaria’ (CRU)
Provocation tests with aspirin

30 –
20 –
10 –
0.0
24%
10%
Challenge-proven aspirin hypersensitivity in children with chronic spontaneous urticaria Cavkaytar O, Allergy 2015;70:153
% of children with(+) challenge
81 children with a history of chronic spontaneous urticaria
The daily or almost daily (>4 days a week) presence of urticaria was defined as ‘chronic persistent urticaria(CPU)’, while the presence of urticaria for 2–4 days a week was defined as ‘chronic recurrent urticaria’ (CRU)
Provocation tests with aspirin
Aspirin hypersensitivity
rate was 26.5% in patients <12 years of age
chronic persistent urticaria
chronic recurrent urticaria

30 –
20 –
10 –
0.0
24%
10%
Challenge-proven aspirin hypersensitivity in children with chronic spontaneous urticaria Cavkaytar O, Allergy 2015;70:153
% of children with(+) challenge
81 children with a history of chronic spontaneous urticarial
The daily or almost daily (>4 days a week) presence of urticaria was defined as ‘chronic persistent urticaria(CPU)’, while the presence of urticaria for 2–4 days a week was defined as ‘chronic recurrent urticaria’ (CRU)
Provocation tests with aspirin
All of the 15 aspirin-hypersensitive patients (aged between 6.6 and
17.4 years), except for 3, experienced an
unequivocal angioedemaof the
lips as a positive reaction chronic
persistent urticaria
chronic recurrent urticaria

Conclusions: Nearly a quarter of children and adolescents with chronic spontaneous urticaria were hypersensitive to aspirin.
For children with chronic urticaria, determination of NSAID hypersensitivity in a well-controlled clinical setting will help to avoid severe drug hypersensitivity reactions.
Challenge-proven aspirin hypersensitivity in children with chronic spontaneous urticaria Cavkaytar O, Allergy 2015;70:153

Therapy of chronic urticaria: a simple, modern approachKaplan Ann Allergy 2014;112:419
1) The term chronic, as opposed to acute, indicates that urticaria is present for more than 6 weeks, whereas acute urticaria ceases (remits) in less than 6 weeks regardless of cause.
2) Most acute urticaria caused by food allergy, drug reactions, or interrcurrent viral illnesses are gone within this period (6 weeks), assuming the offending substance is identified and/or eliminated.
3) This definition of chronic includes physical urticaria, such as cold urticaria, cholinergic urticaria, and dermatographism, where symptoms can be present for months or years.

Therapy of chronic urticaria: a simple, modern approachKaplan Ann Allergy 2014;112:419
Omalizumab (300 mg monthly) has been found to have considerable efficacy in phase 2 and phase 3 trials in which more than 900 patients have been studied.
A response rate of 65% is seen in patients resistant to antihistamines as well as to histamine2 blockers and leukotrieneantagonists, and 40% of patients are completely free of hives as long as therapy is continued.
Only cyclosporine can match this response rate (excluding steroids), but the adverse effect profile (blood pressure and renal function) is substantial by comparison.
The mechanism by which omalizumab works in chronic spontaneousurticaria is not clear because the response rate is unrelated to the autoimmune profile and can occur rapidly (ie, within a few days).

Therapy of chronic urticaria: a simple, modern approachKaplan Ann Allergy 2014;112:419

Therapy of chronic urticaria: a simple, modern approachKaplan Ann Allergy 2014;112:419

Treatment of Chronic Urticaria in Children with Antihistamines and Cyclosporine
Lisa Neverman, J Allergy Clin Immunol Pract. 2014;2:434
BACKGROUND:
Chronic idiopathic urticaria, daily hives that last >6 weeks, can be resistant to antihistamines, even when higher than conventional doses (4X) are used. Other pharmacologic agents have been associated with inconsistent benefit.
OBJECTIVE: We examined the relationship of clinical characteristics and the presence of autoimmune antibodies to antihistamine resistance in children. We further examined the efficacy and safety of cyclosporine in children whose urticaria was resistant to antihistamine.

46 children with chronic idiopathic urticaria
Patients antihistamine resistant treated with cyclosporine (3 mg/kg/die: 2 morning and evening)
1) Cyclosporine serum concentrations prior to the morning dose were monitored when no doses were missed for at least 3 days. This was done approximately 2 weeks after initiation of cyclosporine.
2) If serum concentrations < 125 ng/mL and urticariapersisted, then doses adjusted up in 25-mg twice-daily increments but kept below 200 ng/mL(serum concentrations to suppress transplantation rejections are generally > 300 ng/mL).
Treatment of Chronic Urticaria in Children with Antihistamines and Cyclosporine
Lisa Neverman, J Allergy Clin Immunol Pract. 2014;2:434

3) Serum urea nitrogen and creatininelevels also were monitored at regular intervals, at least every 4 weeks and more often after a dose increase.
4) Blood pressures were measured at each clinic visit, at least every 3 months.
5) Cyclosporine would be reduced once urticaria was effectively suppressed for a period of 1 to 3 months, depending on the prior duration of CU.
Treatment of Chronic Urticaria in Children with Antihistamines and Cyclosporine
Lisa Neverman, J Allergy Clin Immunol Pract. 2014;2:434
46 children with chronic idiopathic urticaria
Patients antihistamine resistant treated with cyclosporine (3 mg/kg/die: 2 morning and evening)

40 -
30 –
20 –
10 –
0
% of patients who wereantihistaminic resistant
35%(16/46)
Treatment of Chronic Urticaria in Children with Antihistamines and Cyclosporine
Lisa Neverman, J Allergy Clin Immunol Pract. 2014;2:434
46 children with chronic idiopathic urticaria
Patients antihistamine resistant treated with cyclosporine (3 mg/kg/die: 2 morning and evening)
Antihistamine resistance was defined as failure to
effectively suppress urticaria to the extent that the patient was no longer troubled by daily
hives when using hydroxyzine at a dose of at least 75 mg or 20 mg of cetirizine twice daily
for adolescents(scaled down for smaller
children)

Median age (years)
Resistant Responsive
Antihistamine
14 –
12 –
10 –
8 –
6 –
4 –
2 –
0 -
6.0
12.5
P=0.0001
Treatment of Chronic Urticaria in Children with Antihistamines and Cyclosporine
Lisa Neverman, J Allergy Clin Immunol Pract. 2014;2:434
46 children with chronic idiopathic urticaria
Patients antihistamine resistant treated with cyclosporine (3 mg/kg/die:2 morning and evening)

All the 16 patients who wereantihistamine resistantwere treated withcyclosporine 3 mg/kg/d with half given morningand evening.
All experienced complete resolution of urticaria
at times that ranged from2 days to 3 months(median, 7 days).
Treatment of Chronic Urticaria in Children with Antihistamines and Cyclosporine
Lisa Neverman, J Allergy Clin Immunol Pract. 2014;2:434
46 children with chronic idiopathic urticaria
Patients antihistamine resistant treated with cyclosporine (3 mg/kg/die:2 morning and evening)

Relapses responsive torepeated cyclosporineoccurred in 5 of the patients after 1 week to 15 months(median, 6 months).
Adverse effects werenot seen in thesepatients.
Treatment of Chronic Urticaria in Children with Antihistamines and Cyclosporine
Lisa Neverman, J Allergy Clin Immunol Pract. 2014;2:434
46 children with chronic idiopathic urticaria
Patients antihistamine resistant treated with cyclosporine (3 mg/kg/die:2 morning and evening)
Our data were consistent with
efficacy and safety of ciclosporine for chronic urticaria
in children when even high doses of
antihistamines are ineffective

Serum cyclosporine levels measured at the time of resolution ranged from 66 to 227 ng/mL, with a median level of 94.5ng/mL.
After resolution of urticaria was documented, all the patients eventually underwent a gradual taper of cyclosporine.
If urticaria recurred during that gradual reduction of dosage, the lowest dose effective at complete urticarial suppression was resumedand maintained for a time.
Treatment of Chronic Urticaria in Children with Antihistamines and Cyclosporine
Lisa Neverman, J Allergy Clin Immunol Pract. 2014;2:434

The total duration of cyclosporine treatment ranged from 2 to 17 months, with a median duration of 5.5 months.
5 of the 16 patients treated with cyclosporine (31.3%) experienced a relapse of urticaria after cyclosporine was discontinued.
All 5 of the patients responded to resumption of cyclosporine.
There was no significant association between autoimmune antibodies and antihistamine resistance.
Treatment of Chronic Urticaria in Children with Antihistamines and Cyclosporine
Lisa Neverman, J Allergy Clin Immunol Pract. 2014;2:434

What is New in Pediatric Allergic Diseases 2015
Attilio BonerUniversity ofVerona, Italy
Diagnosis
Food Allergy
Atopic Dermatitis
Allergic Asthma
Allergic Rhinitis
Anaphylaxis
Urticaria & Angioedema
Risk & Protective factors
Burden

Relationship between prenatal antibiotic use and asthma in at-risk children
Lapin B, Ann Allergy Asthma Immunol 2015; 114:203-7
295 families at risk for asthma.
A physician asthma diagnosis by year 3.
35.0%103/295
40 –
30 –
20 –
10 –
00
% mothers using antibioticsduring pregnancy

Relationship between prenatal antibiotic use and asthma in at-risk children
Lapin B, Ann Allergy Asthma Immunol 2015; 114:203-7
295 families at risk for asthma.
A physician asthma diagnosis by year 3.
3.13.0 –
2.0 –
1.0 –
00
In children whose mothers usedantibiotics during pregnancy OR for
1.8
WheezingAsthma
by age 3
Analyses of the effects of timing of prenatal
antibiotic use on asthma and wheezing showed the
relation remained consistent for antibiotic use later in pregnancy, but the outcomes were not associated with antibiotic use in the
first trimester.

Relationship between prenatal antibiotic use and asthma in at-risk children
Lapin B, Ann Allergy Asthma Immunol 2015; 114:203-7
295 families at risk for asthma.
A physician asthma diagnosis by year 3.
3.13.0 –
2.0 –
1.0 –
00
In children whose mothers usedantibiotics during pregnancy OR for
1.8
WheezingAsthma
by age 3
Modification of microbial load could
be occurring prenatally,
affecting the maturation of the infant immune system and increasing
a child's risk for developing asthma.

Combined effects of prenatal medication use and delivery type are associated with eczema at age 2 years
Wegienka G, CEA 2014;45:660–668
Background
Separately, prenatal antibiotics and Caesarian delivery have been found to be associated with increased risk of allergic diseases. It is not clear whether these factors may modify the effect of each other.
Objective
To assess whether the associations between delivery types and eczema, sensitization and total IgE at age 2 years were modified by maternal use of prenatal medications.

Combined effects of prenatal medication use and delivery type are associated with eczema at age 2 years
Wegienka G, CEA 2014;45:660–668
birth cohort
delivery mode
medications throughout entire pregnancy
eczema, sensitizationat age 2 years
0.77
1.0 –
0.5 –
0.0 vaginally vs c-section
born children
RR for eczema by age 2 yrs

Combined effects of prenatal medication use and delivery type are associated with eczema at age 2 years
Wegienka G, CEA 2014;45:660–668
1.0 –
0.5 –
0.0
0.810.69
RR for eczema by age 2 yrs
no yes
born vaginally to a mother who use systemic antibiotics
birth cohort
delivery mode
medications throughout entire pregnancy
eczema, sensitizationat age 2 years

Combined effects of prenatal medication use and delivery type are associated with eczema at age 2 years
Wegienka G, CEA 2014;45:660–668
1.0 –
0.5 –
0.0
0.850.87
RR for sensitizationby age 2 yrs
birth cohort
delivery mode
medications throughout entire pregnancy
eczema, sensitizationat age 2 years
no yes
born vaginally to a mother who use systemic antibiotics

Combined effects of prenatal medication use and delivery type are associated with eczema at age 2 years
Wegienka G, CEA 2014;45:660–668
Conclusions
children born vaginally had lower risk of eczema and sensitization compared with those born via c-section
however, the protective association with eczema may be slightly weakened when mothers took systemic antibiotics or vaginally applied medicationsduring pregnancy

Consequences of antibiotics and infections in infancy: bugs, drugs, and wheezing
Ong Ann Allergy 2014;112:441
Antibiotic exposure during the first year of life and the development of asthma up to the age of 7 yrs.
A cohort of62,576 children.
In children with antibiotic use in the first year of life OR for
2.02.0 –
1.5 –
1.0 –
0.5 –
0.0
development of
p<0.001
1.6
p<0.001
persistent whezzing
transient whezzing
A dose-response effect was observed.

Consequences of antibiotics and infections in infancy: bugs, drugs, and wheezing
Ong Ann Allergy 2014;112:441
In children with ≥5 antibiotic courses in the 1st year OR for
1.92.0 –
1.5 –
1.0 –
0.5 –
0.0
p<0.001
Development of Persistent Wheezing
Antibiotic exposure during the first year of life and the development of asthma up to the age of 7 yrs.
A cohort of62,576 children.

Consequences of antibiotics and infections in infancy: bugs, drugs, and wheezing
Ong Ann Allergy 2014;112:441
Conclusion:
Antibiotic use in the first year life is associated with an increased risk of early-onset childhood asthma that began before 3 years of age.
The apparent effect has a clear dose response.
Heightened caution about avoiding unnecessary use of antibiotics in infants is warranted.

Neonatal hyperbilirubinemia and childhood allergic diseases: a systematic review
Das RR, Pediatr Allergy Immunol. 2015;26:2-11
A link between neonatal hyperbilirubinemia (NNH) and/or neonatal phototherapy (NPT) and childhood allergic diseases.
7 studies (n = 101,499).
Asthma
In infants with neonatalhyperbilirubinemia OR for
6.0 -
5.0 -
4.0 –
3.0 –
2.0 –
1.0 –
0.0 Allergic rhinitis
4.26
5.73

Neonatal hyperbilirubinemia and childhood allergic diseases: a systematic review
Das RR, Pediatr Allergy Immunol. 2015;26:2-11
Asthma
In children with neonatalphototherapy OR for
4.0 –
3.0 –
2.0 –
1.0 –
0.0 Allergic rhinitis
3.813.0
A link between neonatal hyperbilirubinemia (NNH) and/or neonatal phototherapy (NPT) and childhood allergic diseases.
7 studies (n = 101,499).

Traffic pollution is associated with early childhood aeroallergen sensitization
Codispoti C, Ann Allergy Asthma Immunol, 2015;114:126-33
634 infants born to aeroallergen sensitized parents
evaluated annually with SPTs to 15 aeroallergens.
At 4 years of age, Allergic Rhinitis (AR) defined as ≥ 1 (+) SPTs and sneezing and a runny nose without a cold.
Prevalence of allergic rhinitis, aeroallergen sensitization, and rhinitis
during the first 4 years
allergic rhinitis
rhinitis
aeroallergen sensitization
A positive trend was observed for high diesel exhaust particle(DEP) exposure and
aeroallergen sensitization at 2 and 3 years of age (odds ratio, 1.40; and
odds ratio, 1.35).

Traffic pollution is associated with early childhood aeroallergen sensitization
Codispoti C, Ann Allergy Asthma Immunol, 2015;114:126-33
634 infants born to aeroallergen sensitized parents
evaluated annually with SPTs to 15 aeroallergens.
At 4 years of age, Allergic Rhinitis (AR) defined as ≥ 1 (+) SPTs and sneezing and a runny nose without a cold.
Prevalence of allergic rhinitis, aeroallergen sensitization, and rhinitis
during the first 4 years
allergic rhinitis
rhinitis
aeroallergen sensitization
DEP exposure enhances the risk
of early aeroallergen sensitization.

Does air pollution really cause allergy? Peden D. B, CEA 2014;45:3-5
1. There is robust evidence that air pollutants can exacerbateresponse to allergens to which persons already sensitized.
2. Residential location near heavily trafficked intersections wasassociated with increased IgE levels in children.
3. Early life exposure to traffic-related air particulates, tobaccosmoke and other pollutants enhance risk for allergen sensitization.
4. Exposure to diesel exhaust particles (DEPs) has been shown to promote IgE responses to neoantigens.

5. Oxidative stress induced by diesel exhaustparticles has been linked to the ability of theseagents to induce a primary IgE response to subsequently encountered allergen which isinhibited by thiol antioxidants and induction of phase II antioxidant enzymes by consumptionof sulforaphane-rich preparations *
* Heber D, Sulforaphane-rich broccoli sprout extract attenuates nasal allergicresponse to diesel exhaust particles. Food Funct 2014; 5:35–41.
Does air pollution really cause allergy? Peden D. B, CEA 2014;45:3-5

Environmental changes could enhance the biological effect of Hop J pollens on human airway epithelial cells
Lee SI, J Allergy Clin Immunol 2014;134:470
Urbanization has increased atmospheric temperatures and carbon dioxide concentrations, which affect the characteristics of plant pollens.
Japanese hop (Hop J) is considered a principle allergenic plant during the autumn in Asian countries.
Inhaled pollens can contribute to respiratory allergy symptoms by releasing
several kinds of proteases that cause airway epithelium impairment and
oxidases that induce the production of reactive oxygen species (ROS)
in airway epithelial cells.
Pollens can facilitate the penetration of allergens through a disrupted
epithelial barrier and augment allergic airway inflammation
luppolo

Environmental changes could enhance the biological effect of Hop J pollens on human airway epithelial cells
Lee SI, J Allergy Clin Immunol 2014;134:470
collected Hop J pollens in 1998 and 2009 and prepared 2 pollen extracts (the 98 and 09 extracts).
Airborne Hop J pollen count and period of pollination has steadily increased over the last 10 years along with the average atmospheric temperature (0.07°C higher in 2000s than in 1990s in Suwon) and CO2 concentration (21.8 ppm higher in 2009 than in 1999).
Transepithelial permeability of Calu-3 cells induced by the 2 pollen extracts

Environmental changes could enhance the biological effect of Hop J pollens on human airway epithelial cells
Lee SI, J Allergy Clin Immunol 2014;134:470
Occludin degradations induced by Hop J pollen extracts. Visualized
by immunocytochemistry
ROS production induced by the 98 and 09 extracts

Dietary Lipids
There is a close relation between allergens and lipids, with more than half of major allergens being lipid binding.
Fatty acids comprise a hydrophilic carboxyl (COOH) group attached to a hydrophobic linear hydrocarbon chain and are categorized according to their number of carbons as short-chain (<6 carbons), medium-chain (6-12 carbons), or long-chain (>12 carbons) fatty acids.
Fats that are liquid at room temperature are called oils.
Most foods, including peanuts, egg, and milk, contain predominantlylong-chain fatty acids.
An evolutionary perspective on intestinal lymphatic fat absorption, the industrialization of food, and allergy
Miller Ann Allergy 2014;113:339

Dietary Lipids
There is an important distinction between the absorption of long-chain fats and the absorption of other food products.
Digested proteins, carbohydrates, and short- and medium-chain triglycerides (ester derived from glycerol and three fatty acids.)
are primarily absorbed into the portal circulation, passing through the liver and then rapidly into the systemic circulation.
An evolutionary perspective on intestinal lymphatic fat absorption, the industrialization of food, and allergy
Miller Ann Allergy 2014;113:339
Example of an unsaturated fat triglyceride. Left part:glycerol, right part from top to bottom:palmitic acid,oleic acid, alpha-linolenic acid.

Dietary Lipids
In contrast, long-chain triglycerides* are absorbed into the lacteals and formed into lipoproteins such as chylomicrons, which then spend approximately 4 hours in contact with the mesenteric immune system before reaching the systemic circulation (into the right subclavian vein) through the thoracic duct.
An evolutionary perspective on intestinal lymphatic fat absorption, the industrialization of food, and allergy
Miller Ann Allergy 2014;113:339
* intralymphatic, rather than hepatic portal, absorption

Isoprostanes and Phytoprostanes-the Ingestion ofPlant-Derived Inflammatory Mediators
Isoprostanes are inflammatory mediators formed by the non-enzymatic peroxidation of arachidonic acid.
Plants lack arachidonic acid, but contain 18-carbon linoleic and α-linoleic acids, the peroxidation of which yields the plant analogs of the isoprostanes, the phytoprostanes.
High concentrations of free and esterified phytoprostanes form in vegetable oils by auto-oxidation.
Phytoprostane levels in opened bottles of room-temperature vegetable oil increase 10- to 20-fold over 18 days, despite the absence of rancidity.
An evolutionary perspective on intestinal lymphatic fat absorption, the industrialization of food, and allergy
Miller Ann Allergy 2014;113:339

The “Refining” of Plant Oils
These oils were not part of the human evolutionary diet, in which foods were consumed whole.
Industrialization has allowed oils to be separated from seeds, nuts, and other plant parts by mechanical extraction.
The per-capita intake of these oils has increased steadily in the past century, and approximately exponentially since 1950, to more than 50 lb (~25 Kg) per person yearly, a trend increased by the awareness of the negative health effects of solid hydrogenated trans-fatty acids.
An evolutionary perspective on intestinal lymphatic fat absorption, the industrialization of food, and allergy
Miller Ann Allergy 2014;113:339
Natural environments, ancestral diets, and microbial ecology: is there a modern"paleo-deficit disorder"? Logan AC, J Physiol Anthropol. 2015;34(1):9.

US per-capita availability of salad and cooking oils, 1909 through 2010.
An evolutionary perspective on intestinal lymphatic fat absorption, the industrialization of food, and allergy
Miller Ann Allergy 2014;113:339
1 lb = 453.5 gr

The “Refining” of Plant Oils
Approximately 25% of dietary essential fatty acids are now ingested as refined oils rather than in whole foods.
This has led to a dramatic change in the ratio of proinflammatoryω-6 to ω-3 fatty acids, from approximately 2:1 in the ancestral diet to approximately 20:1 in the current Western diet.
Perhaps equally important, however, is the presence in vegetable oils of high levels of TH2-inducing phytoprostanes.
An evolutionary perspective on intestinal lymphatic fat absorption, the industrialization of food, and allergy
Miller Ann Allergy 2014;113:339

Homogenization of Bovine Milk
Natural cow’s milk is 3.8% fat by weight, a suspension of fat globules in water.
These fat globules comprise triglycerides surrounded by a membrane of phospholipids and protein.
Homogenization forces the milk under pressure through extremely narrow tubes, producing a decrease in the average fat globule diameter from 3.3 to 0.4 µ, with a 600-fold increase in the total number of fat globules, and an almost 10-fold increase in their total surface area.
Homogenization increases allergenicity in murine models.
An evolutionary perspective on intestinal lymphatic fat absorption, the industrialization of food, and allergy
Miller Ann Allergy 2014;113:339

Intramuscular Fat in Beef Graded by the US Department of Agriculture
Cattle are ruminants (ie, natural grass feeders).
However, modern feedlot cattle are confined and fed grain rather than grass, resulting in meat with an abnormally high ω-6 to ω-3 ratio and with fat within the muscle tissue.
An evolutionary perspective on intestinal lymphatic fat absorption, the industrialization of food, and allergy
Miller Ann Allergy 2014;113:339

Intramuscular Fat in Beef Graded by the US Department of Agriculture
Commins et al described urticaria or anaphylaxis occurring 4 hours after the ingestion of beef or other mammalian meat in patients with IgE antibodies to the carbohydrate allergen “alpha-gal.” This 4-hour interval correlates with the time course of intralymphatic passage of absorbed fats from the lacteals to the systemic circulation, suggesting that the alpha-gal was absorbed as a glycolipid.
Anecdotal reports have suggested that at least some patients with alpha-gal allergy can tolerate wild venison meat.
An evolutionary perspective on intestinal lymphatic fat absorption, the industrialization of food, and allergy
Miller Ann Allergy 2014;113:339

Possible Implications
The separation of vegetables and seeds into oils, which are excessively absorbed and which auto-oxidize and spontaneously produce phytoprostanes that have been shown to skew towards TH2;
the homogenization of cow’s milk into abnormally small particles with abnormal surface proteins and increased allergenicity;
the mechanical degradation of peanuts into oil-rich and excessively absorbed peanut butter; and the change in meat from lean game into “marbled” feedlot beef have the potential to increase allergic sensitization.
An evolutionary perspective on intestinal lymphatic fat absorption, the industrialization of food, and allergy
Miller Ann Allergy 2014;113:339

Cow's milk allergy and the association between fatty acids and childhood asthma risk
Lumia M, J Allergy Clin Immunol 2014;134:488-90
A prospective birth cohort study started in 1994, in which all infants born in 3 university hospitals in Finland (Turku, Tampere, and Oulu) were screened.
Nonfasting serum samples obtained annually at the ages of 1 to 5 years.
1) In children with reported cow's milk allergy, the serum proportions of oleic acid, Linoleic acid, α-linolenic acid, and total n-6 PUFAs were higher and all other serum fatty acid proportions were lower compared with those seen in children without reported (CMA).
2) A higher proportion of EicosaPenthaenoicAcid (Ώ-3)was associated with a decreased risk of asthma.
Changes in serum FA composition might predispose to CMA and subsequently to
asthma because these diseases are within the same
spectrum.

1,354 mother-child pairs.
Maternal intake during pregnancy assessed with a validated diet history questionnaire.
Wheeze and eczema.
In mother with higher maternal intake of total dairy products
during pregnancy OR for
1.0 –
0.5 –
0.0
0.64
infantile eczema (between extreme quartile)
Maternal consumption of dairy products, calcium, and vitamin D during pregnancy and infantile allergic disorders
Miyake Ann Allergy 2014;113:82

1,354 mother-child pairs.
Maternal intake during pregnancy assessed with a validated diet history questionnaire.
Wheeze and eczema.
1.0 –
0.5 –
0.0
0.44
Maternal consumption of dairy products, calcium, and vitamin D during pregnancy and infantile allergic disorders
Miyake Ann Allergy 2014;113:82
physician-diagnosedinfantile asthma
In mother with higher maternal intake of cheese during pregnancy
OR for

OR for physician-diagnosedinfantile atopic eczema
1.0 –
0.5 –
0.0
0.49
yogurt
Maternal consumption of dairy products, calcium, and vitamin D during pregnancy and infantile allergic disorders
Miyake Ann Allergy 2014;113:82
0.44
calcium
high quartile ofmaternal intake of
1,354 mother-child pairs.
Maternal intake during pregnancy was assessed with a validated diet history questionnaire.
Wheeze and eczema.
Maternal intakeof vitamin D during
pregnancy was significantly positively
associated with infantile eczema
(adjusted ORbetween extreme
quartiles, 1.63)

Consumption of unprocessed cow's milk protects infants from common respiratory infections.
Loss G, J Allergy Clin Immunol 2015; 135:56-62
In children consuming raw milk consumption
vs ultra-heat treated milk OR for
0.77
Respiratory tract infections
Otitis Fever
0.14
0.69
in the 1st year of life
983 infants from rural areas in Austria, Finland, France, Germany, and Switzerland.
Consumption of different types of cow's milk.
Occurrence of rhinitis, respiratory tract infections, otitis, and fever.
C-reactive protein levels at 12 months.
1.0 –
0.5 –
0.0
Boiled farm milk showed similar but
weaker associations.

Consumption of unprocessed cow's milk protects infants from common respiratory infections.
Loss G, J Allergy Clin Immunol 2015; 135:56-62
Mutually adjusted effect of milk consumption during week 8 to 53 on hsCRP levels at age 1. Geometric means ratios (black circles) and 95%
CI (bars) adjusted for center, sex, older siblings, and contact with stable during first year of life.
983 infants from rural areas in Austria, Finland, France, Germany, and Switzerland.
Consumption of different types of cow's milk.
Occurrence of rhinitis, respiratory tract infections, otitis, and fever.
C-reactive protein levels at 12 months.
Raw farm milk consumption was
inversely associated with
C-reactive protein levels at
12 months.

Consumption of unprocessed cow's milk protects infants from common respiratory infections.
Loss G, J Allergy Clin Immunol 2015; 135:56-62
Adjusted associations of milk consumption and infections

Consumption of unprocessed cow's milk protects infants from common respiratory infections.
Loss G, J Allergy Clin Immunol 2015; 135:56-62
Conclusions
Early life consumption of raw cow's milk reduced the risk of manifest respiratory infections and fever by about 30%.
If the health hazards of raw milk could be overcome, the public health impact of minimally processed but pathogen-free milk might be enormous, given the high prevalence of respiratory infections in the first year of life and the associated direct and indirect costs.
The price humankind had to pay for the advantages of cow's milk was the risk of serious infections that can be transmitted by raw milk, such as tuberculosis, brucellosis, listeriosis, or enterohemorrhagicEscherichia coli causing hemolytic-uremic syndrome.
By the introduction of pasteurization and other industrial processing techniques, the critical issue of milk-borne infections has effectively been solved.
The procedures in industrial milk treatment include centrifugation; fat separation; homogenisation; and heat treatment, which comprisesprimarily pasteurization and UHT.
Consumption of unprocessed cow's milk protects infants from common respiratory infections.
Loss G, J Allergy Clin Immunol 2015; 135:56-62

Green areas around homes reduce atopic sensitization in children. Ruokolainen L. Allergy 2015;70:195
4 study cohorts from Finland and Estonia (n = 1044) children and adolescents aged 0.5–20 years
sIgE inhalant allergens
Proportion of 5 land-use types in the landscape around the home:
1) forest, 2) agricultural land, 3) built areas, 4) wetlands, 5) water bodies.
Forest and agricultural land within 2–5 km from the home was inversely and significantly associated with atopic sensitization.
This relationship was observed for children ≥ 6 yrs.
Relative abundance of Proteobacteria on the skin of healthy individuals is associated with the land-use gradient.
The amount of green environment
(forest and agricultural land)
around homes was inversely associated
with the risk of atopic sensitization in children

Green areas around homes reduce atopic sensitization in children. Ruokolainen L. Allergy 2015;70:195
4 study cohorts from Finland and Estonia (n = 1044) children and adolescents aged 0.5–20 years
sIgE inhalant allergens
Proportion of 5 land-use types in the landscape around the home:
1) forest, 2) agricultural land, 3) built areas, 4) wetlands, 5) water bodies.
Relative abundance ofProteobacteria on the skin of
healthy individuals is associatedwith the land-use gradient

Green areas around homes reduce atopic sensitization in children. Ruokolainen L. Allergy 2015;70:195
4 study cohorts from Finland and Estonia (n = 1044) children and adolescents aged 0.5–20 years
sIgE inhalant allergens
Proportion of 5 land-use types in the landscape around the home:
1) forest, 2) agricultural land, 3) built areas, 4) wetlands, 5) water bodies.
Relative abundance ofProteobacteria on the skin of
healthy individuals is associatedwith the land-use gradientThe environmental
effect may be mediated via the
effect of environmental
microbiota on the commensal microbiota
influencingimmunotolerance

What is New in Pediatric Allergic Diseases 2015
Attilio BonerUniversity ofVerona, Italy
Diagnosis
Food Allergy
Atopic Dermatitis
Allergic Asthma
Allergic Rhinitis
Anaphylaxis
Urticaria & Angioedema
Risk & Protective factors
Burden

Risks for infection in patients with asthma (or other atopic conditions): is asthma more than a chronic airway
disease? Juhn YJ, J Allergy Clin Immunol 2014;134:247-57
Gram-positive bacteria Significantly increased risk of
invasive pneumococcal disease (IPD) and pneumococcal pneumonia in patients with asthma compared with those without asthma (11% to 17% of the population-attributable risk).
Both adults and children with atopic dermatitis, allergic rhinitis, or both had increased risk of serious pneumococcal (adjusted OR 2.13 ).
Asthmatic patients had an increased risk of S aureus colonization, as measured by using nasal swabs.
G+ G-

Risks for infection in patients with asthma (or other atopic conditions): is asthma more than a chronic airway
disease? Juhn YJ, J Allergy Clin Immunol 2014;134:247-57
Gram-negative bacteria
Significantly increased risk of Bordetella pertussis infection among children and adults with versus those without asthma(adjusted OR, 1.73).
A significantly increased risk of community-acquired Escherichia coli bloodstream infection (BSI) in persons with asthma.
Viral infections
Asthmatic children had a significantly higher risk of infection with 2009 novel H1N1 influenza than nonasthmatic children (OR, 4.0 ) and more severe H1N1 infection (risk of hospitalization)among those with than without asthma (OR, 2.31 ).

Risks for infection in patients with asthma (or other atopic conditions): is asthma more than a chronic airway
disease? Juhn YJ, J Allergy Clin Immunol 2014;134:247-57
Reactivation of latent viral infection
Asthma led to a significantly increased risk of herpes zoster in children (adjusted OR, 2.09 ).
The presence of sensitization against aeroallergens or food allergens was also associated with an increased risk of herpes zoster infection (matched OR, 3.00 ).

Prevalence of at least 1 allergic disease
30 –
25 –
20 –
15 –
10 –
0
Association between childhood allergic disease, psychological comorbidity, and injury requiring medical
attention Garg Ann Allergy 2014;112:525
Data from the 2007 to 2008 National Survey of Children’s Health.
27,556 children 0 to 5 years old.
29.4%• 6.6% with
asthma,
• 15.0% with eczema,
• 11.6% with hay fever,
• 6.1% with food allergy.

In children with allergic disorders OR for7 –
6 –
5 –
4 –
3 –
2 –
1 –
0
2.93
4.75
6.035.54
2.972.49
1.89
at least 1 comorbid
psychiatric and behavioral
disorder
ADHD depression anxiety conduct/ oppositional
defiantdisorder
learningdelay
autism/ Asperger disorder
Association between childhood allergic disease, psychological comorbidity, and injury requiring medical
attention Garg Ann Allergy 2014;112:525
Children with at least 1 allergic disorder had higher odds of sustaining injuries
even after controlling for comorbid psychiatric disorders.
Continuanoa farsi male

A. The association between allergic and psychiatric disorders, including ADHD, conduct disorder, depression, and anxiety, has recently been increasingly recognized.
B. Multiple mechanisms underlying this association have been proposed, including sleep deprivation and chronic inflammation.
Yaghmaie J Allergy Clin Immunol 2013;131:428Chang Allergy Asthma Immunol Res 2013;5:315Slattery J Allergy Clin Immunol 2011;128:668
Chen J Child Psychol Psychiatry. 2013;54:1208Slattery J Psychiatr Res. 2011;45:788
Infante J Clin Psychiatry. 2007;68:1419
Association between childhood allergic disease, psychological comorbidity, and injury requiring medical
attention Garg Ann Allergy 2014;112:525

C. Sleep disturbances accompanying allergic disorders may predispose to psychiatric disorders and strengthen the association between allergic disorders and mental healthconditions.
D. Yaghmaie et al suggested that the association between allergic and psychiatric disorders is secondary to the wide-ranging effects of inflammation, because eczema, depression, and anxiety are characterized by an increase in proinflammatory cytokines.
Slattery J Allergy Clin Immunol 2011;128:668Romanos J Epidemiol Community Health 2010;64:269
Yaghmaie J Allergy Clin Immunol 2013;131:428
Association between childhood allergic disease, psychological comorbidity, and injury requiring medical
attention Garg Ann Allergy 2014;112:525

Current intakeheavier alcohol
2.0 –
1.5 –
1.0 –
0.5 –
0.0
1.28
Ever smoking 100 cigarettes
in their lifetime
1.32 1.16
Current smoking history with significantly
younger age of onset
Drinking 12 or more alcoholic
beverages annually
In adults whit eczema OR for
Data for 27,157 and 34,525 adults from the 2010 and 2012 National Health Interview Survey.
Eczema and cardiovascular risk factors in 2 US adult population studies
Silverberg JI, J Allergy Clin Immunol 2015;135:721-28
1.58

2.0 –
1.5 –
1.0 –
0.5 –
0.0
1.54
0.79
1.48
Data for 27,157 and 34,525 adults from the 2010 and 2012 National Health Interview Survey.
Eczema and cardiovascular risk factors in 2 US adult population studies
Silverberg JI, J Allergy Clin Immunol 2015;135:721-28
1.71
Daily vigorousactivity
BMI ≥ 35 Lifetimeprediabetes
Hypertension
In adults whit eczema OR for

2.0 –
1.5 –
1.0 –
0.5 –
0.0
1.54
0.79
1.48
Data for 27,157 and 34,525 adults from the 2010 and 2012 National Health Interview Survey.
Eczema and cardiovascular risk factors in 2 US adult population studies
Silverberg JI, J Allergy Clin Immunol 2015;135:721-28
1.71
Daily vigorousactivity
BMI ≥ 35 Lifetimeprediabetes
Hypertension
In adults whit eczema OR forThere were significant interactions between eczema and sleep disturbances such fatigue, daytime
sleepiness, or insomnia and high cholesterol than eczema alone.

2.0 –
1.5 –
1.0 –
0.5 –
0.0
1.54
0.79
1.48
Data for 27,157 and 34,525 adults from the 2010 and 2012 National Health Interview Survey.
Eczema and cardiovascular risk factors in 2 US adult population studies
Silverberg JI, J Allergy Clin Immunol 2015;135:721-28
1.71
Daily vigorousactivity
BMI ≥ 35 Lifetimeprediabetes
Hypertension
In adults whit eczema OR forEczema in adults is a marker for
cardiovascular risk, emphasizing the
importance of behavioral modification and perhaps
more aggressive interventions to better manage
eczema.

Atopy and cause-specific mortalitySkaaby T, CEA 2014;44:1361-70
It has been proposed that atopymay have effects on risk of cardiovascular disease and cancer
4849 individuals from 5 Danishpopulation-based cohorts
atopy defined as (+) serum-sIgEagainst inhalant allergens
1776 person died duringfollow-up.
The mortality riskfor atopics vs.
non-atopics was:
for all-cause mortality
(HR = 1.03)(ns)
Th2

In atopic subjects OR dying for
2 –
1 –
0
2.26
1.75
mental and behaviouraldisorders
diseases of the nervous
system
diseases of the digestive
system
Atopy and cause-specific mortalitySkaaby T, CEA 2014;44:1361-70
Th2
1.36

In atopic subjects OR dying for
2 –
1 –
0
2.26
1.75
mental and behaviouraldisorders
diseases of the nervous
system
diseases of the digestive
system
Atopy and cause-specific mortalitySkaaby T, CEA 2014;44:1361-70
Th2
1.36
The co-morbidity of atopic and mentaldisorders like depression and dementia may
be explained by shared inflammatorypathways such as higher levels of pro-
inflammatory cytokines

In atopic subjects OR dying for
2 –
1 –
0
2.26
1.75
mental and behaviouraldisorders
diseases of the nervous
system
diseases of the digestive
system
Atopy and cause-specific mortalitySkaaby T, CEA 2014;44:1361-70
Th2
1.36
The observed higher risk of dying from liver disease in particular may have several explanations:
1. As alcohol consumption increases serum total IgE, it may increase the risk of being classified as beingatopic.
2. Alcohol-related diseases are a large part of deaths caused by mental and behavioural disorders

The association between asthma and allergic disease and mortality: a 30-year follow-up study
Savage JH, J Allergy Clin Immunol 2014;133:1484-86
Data from the first National Health and Nutrition Examination Survey Epidemiologic Follow-up Study (NHEFS)
a US-based full cohortof 14,407 subjects aged 25 to 74 in 1971-1975.
Asthmaand
respiratory mortality
2.22
2.5 –
2.0 –
1.5 –
1.0 –
0.5 –
00
1.23
In subjects with a historyof asthma OR for
All-causemortality
Excess respiratory mortality risk was largely explained by lung function abnormalities.

The association between asthma and allergic disease and mortality: a 30-year follow-up study
Savage JH, J Allergy Clin Immunol 2014;133:1484-86
Data from the first National Health and Nutrition Examination Survey Epidemiologic Follow-up Study (NHEFS)
a US-based full cohortof 14,407 subjects aged 25 to 74 in 1971-1975.
Asthmaand
respiratory mortality
2.22
2.5 –
2.0 –
1.5 –
1.0 –
0.5 –
00
1.23
In subjects with a historyof asthma OR for
All-causemortality
Oxidativestress?

Asthma, airflow limitation and mortality risk in the general population Huang S, ERJ 2015;45:338-346
2121 adult participants in the population-based Tucson Epidemiological Study
At enrolment (1972–1973), participants completedquestionnaires and lung function tests
Categorised into 4 groups based on the combination of airflow limitation (AL; FEV1/FVC <70%) and physician-confirmed asthmaat baseline
2.14
AL+/asthma+ group compared with the AL-/asthma- group
HR for mortality
3.0 –
2.0 –
1.0 –
0.0

Asthma, airflow limitation and mortality risk in the general population Huang S, ERJ 2015;45:338-346
1.09
AL-/asthma+
HR for mortality
3.0 –
2.0 –
1.0 –
0.0
AL+/asthma-
1.34
compared with the AL-/asthma- group
2121 adult participants in the population-based Tucson Epidemiological Study
At enrolment (1972–1973), participants completedquestionnaires and lung function tests
Categorised into 4 groups based on the combination of airflow limitation (AL; FEV1/FVC <70%) and physician-confirmed asthmaat baseline
Subjects with concomitant airflow
limitation and asthma had an increased
risk of dying, which was mainly related to their baseline lung function deficits

Asthma, airflow limitation and mortality risk in the general population Huang S, ERJ 2015;45:338-346
Survival curves for mortality bychronic obstructive pulmonary disease
Forced expiratory volume in 1 s (FEV1)/forced vital capacity (FVC) <70%
FEV1/FVC less than the lower limit of normal

The association between lung function and arterial stiffness in young childhood
Eising J, ERJ 2014;44:530-532
• Several studies have shown that reduced lung function is a risk factor for cardiovascular morbidity and mortality
• Precursors for cardiovascular diseases, like hypertension and arterial stiffness, are also associated with lower lung function
• Recent findings support the hypothesis that a common pathway exists between a decline in lung function and, subsequently, the development of arterial stiffness or hypertension

The association between lung function and arterial stiffness in young childhood
Eising J, ERJ 2014;44:530-532
Children of an ongoing birth cohort
At the ages of 5 (n=553) and 8 years (n=230)
Spirometry, ultrasonography of the a. carotis communis
Both a lower distensibility and a higher elastic modulus indicate a stiffer artery
The association between impaired lung function and increased arterial stiffness, as described in adulthood, is not present in childhood,
but
probably emerges later in life.

“Grazie per la vostra attenzione alla storia che vi ha raccontato mio nonno.”
Mia Charlize Powell
“Preferisco sciare con mio nonno perché lui obbedisce
e il maestro no!”

18° FORMAT Verona 6-7/05/2016