(Form M. On the basis of a principal components
32
ED 103 709 AUTHOR TITLE INSTITUTION, SPONS AGENCY REPORT NO PUB DATE NOTE EDRS PRICE DESCRIPTORS IDENTIFIERS DOCUMENT RESUME CE 003 332 McCormick, Ernest J.; And Others The Derivation of Job Compensation Index Values froM the Position Analysis Questionnaire (PAQ). Report No. 6. Purdue Univ., Lafayette, Ind. Occupational Research Center. Office of Naval Research, Washington, D.C. Personnel and Training Research Programs Office. TR-6 Sep 74 32p.; For other PAQ documents, see CE 003 3301 MF-$0.76 HC-$1.95 PLUS POSTAGE *Job Analysis; Multiple Regression Analysis; *Predictive Validity; Questionnaires; Research; *Research Methodology; *Salaries; Tables (Data); *Wages PAQ; *Position Analysis Questionnaire ABSTRACT The study deals with the job component method of establishing compensation rates. The basic job analysis questionnaire used in the study was the Position Analysis Questionnaire (PAQ) (Form M. On the basis of a principal components analysis of PAQ data for a large sample (2,688) of jobs, a number of principal components (job dimensions) were identified. Scores on these dimensions, and the ratings on the original individual elements of the PAQ, were used in a multiple regression procedure for predicting the actual compensation rates of the jobs in the sample. The results of the analyses generally supported previous related research to the effect that compensation rates for jobs might be established on the basis of quantitative job analysis from a structured job analysis procedure, but the level of prediction of compensation rates was not as high in the present study as it was in a previous parallel study. This can be attributed in part to the volatile nature of wages and salaries in the time period of data collection, and to the fact that the sample covered a wide variety of jobs from many industries and different geographical areas. It is still felt that the basic approach is valide. (Author/AG)
Transcript of (Form M. On the basis of a principal components
ED 103 709
AUTHORTITLE
INSTITUTION,
SPONS AGENCY
REPORT NOPUB DATENOTE
EDRS PRICEDESCRIPTORS
IDENTIFIERS
DOCUMENT RESUME
CE 003 332
McCormick, Ernest J.; And OthersThe Derivation of Job Compensation Index Values froMthe Position Analysis Questionnaire (PAQ). Report No.6.Purdue Univ., Lafayette, Ind. Occupational ResearchCenter.Office of Naval Research, Washington, D.C. Personneland Training Research Programs Office.TR-6Sep 7432p.; For other PAQ documents, see CE 003 3301
MF-$0.76 HC-$1.95 PLUS POSTAGE*Job Analysis; Multiple Regression Analysis;*Predictive Validity; Questionnaires; Research;*Research Methodology; *Salaries; Tables (Data);*WagesPAQ; *Position Analysis Questionnaire
ABSTRACTThe study deals with the job component method of
establishing compensation rates. The basic job analysis questionnaireused in the study was the Position Analysis Questionnaire (PAQ) (Form
M. On the basis of a principal components analysis of PAQ data for alarge sample (2,688) of jobs, a number of principal components (jobdimensions) were identified. Scores on these dimensions, and theratings on the original individual elements of the PAQ, were used in
a multiple regression procedure for predicting the actualcompensation rates of the jobs in the sample. The results of theanalyses generally supported previous related research to the effectthat compensation rates for jobs might be established on the basis ofquantitative job analysis from a structured job analysis procedure,but the level of prediction of compensation rates was not as high inthe present study as it was in a previous parallel study. This can beattributed in part to the volatile nature of wages and salaries inthe time period of data collection, and to the fact that the samplecovered a wide variety of jobs from many industries and differentgeographical areas. It is still felt that the basic approach is
valide. (Author/AG)

I No
P.. 4t1.341
U S DEPARTMENTOF HEALTH.EDUCATIONS
WELFARENATIONAL INSTITUTEOFEDUCATIONTHIS 00CUMENT
HAS BEEN REPROOUCED EXACY As RECEIVED
kOAATHE PERSON
OR ORGANIZAION 1+1GIN
A TiNGPOINTS 01
vIEW OTt OPINIONSSTATED
C)0 NOTCE SSA1t11 Y P/tr
SENT oil iCiAL NA f !Min( INS TITulf 01EDUCATION
1,051710N01+ POI r

OPPNIMMINI111111.-
THE DERIVATION OF JOB COMPENSATION INDEX VALUES
FROM FORM B OF THE POSITION ANALYSIS QUESTIONNAIRE (PAQ)
Ernest J. McCormick,
Angelo S. De Nisi
and
Lloyd D. Marquardt
Occupatidnal Research CenterDepartment of Psychological Sciences
Purdue UniversityWest Lafayette, Indiana 47907
Prepared for: Contractor:Personnel and Training Research Programs Purdue Research FoundationPsychological Sciences Division Ernest J. McCormickOffice of Naval Research Principal Investigator
Contract No. N00014-67-A0226-0016Contract Authority Identification Number, NR 151-331
Report No. 6,
August 1974
Approved for public release; distribution unlimited.Reproduction in whole or in part is permittedfor any purpose of the United States Government
3

UnclassifiedSECURITY CLASSIFICATION OF THIS PAGE Mon Data Ontrd)
ii
r
REPORT DOCUMENTATION PAGEREAD INSTRUCTIONS
BEFORE COMPLETING FORM
REPORT NUMBER
-C e . Z-60 ,,* I
2. GOVT ACCESSION NO. 3. RECIPIENT'S CATALOG NUMBER
4. TITLE (and SubI111 .
,.....
S. TYPE OF REPORT B PERIOD COVERED
THE DERIVATION OF JOB COMPENSATION INDEX VALUES
FROM THE POSITION ANALYSIS QUESTIONNAIRE (PAQ)Technical Report
6. PERFORMING ORG, REPORT NUMBER
7. AUTHOR() Bs CONTRACT OR GRANT NUMBER()
Ernest J. McCormick, Angelo S. DeNisi,and
Lloyd D. Marquardt N000014-67-A-0026-0016
9, PERFORMING ORGANIZATION NAME AND ADDRESS 10. PROGRAM ELEMENT, PROJECT, TASK
Occupational Research CenterAREA a WORK UNIT NUMBERS
Department of Psychological sciences NR 151-331
Purdue University, West Lafayette, IN 47907
1 I, CONTROLLING OFFICE NAME AND ADDRESSPersonnel and Training Research'Programs September, 1974
Office of Naval Research 13, NUMBER ')F PAGES
Arlington, Virginia 22217
14, MONITORING AGENCY NAME 5 ADDRESS(it Wilmot from Controlling 011ie) 15. SECURITY CLASS, (of ehl tipott)
104 DECLASSIFICATION/DOWNGRADINGSCHEDULE
......,Is. DISTRIBUTION STATEMENT (0( Ws /Won)
Approved for public release; distribution unliiited. Reproduction in
whole or in part is permitted for any purpose of the United States
Government.
17. DISTRIBUTION STATEMENT (of Ms bltect mined In Block 20, It Moroni horn Root)
......
111, SUPPLEMENTARY NOTES
Not applicable
19, KEY WORDS (Continue on syto old. It mecum, and Identity by block number)
Job analysis, Job description, Job evaluation, Wage and salary administration
Position Analysis Questionnaire (PAQ), Job variables, Job dimensions
20. ABSTRACT (Continuo on term. let If mammy dond Identity by block numbed
This study deals with what is called the job component method of establishing
compensation rates. This method is predicated upon the use of a structured
job analysis procedure that proVides the basis for quantifying various
components of jobs, and the subsequent use of such data as the direct basis
for deriving an index of the "compensation" value of any given job in re-
lation to the compensation rates for a large and varied sample of jobs. The
basic job analysis, questionnaire used in the study was the Position Analysis
DD I JA"N yS 1413 EDITION or I NOV SS IS OSSOLSYN
S/N 0102601066011S.
4SECUINTYCLASICATTh*Wit)NIMPAOSOMonbilit niNotO
Unclassified
..mmuRIT'l CLASSIFICATION OF THIS PAGE(Whon Data gnterprt)
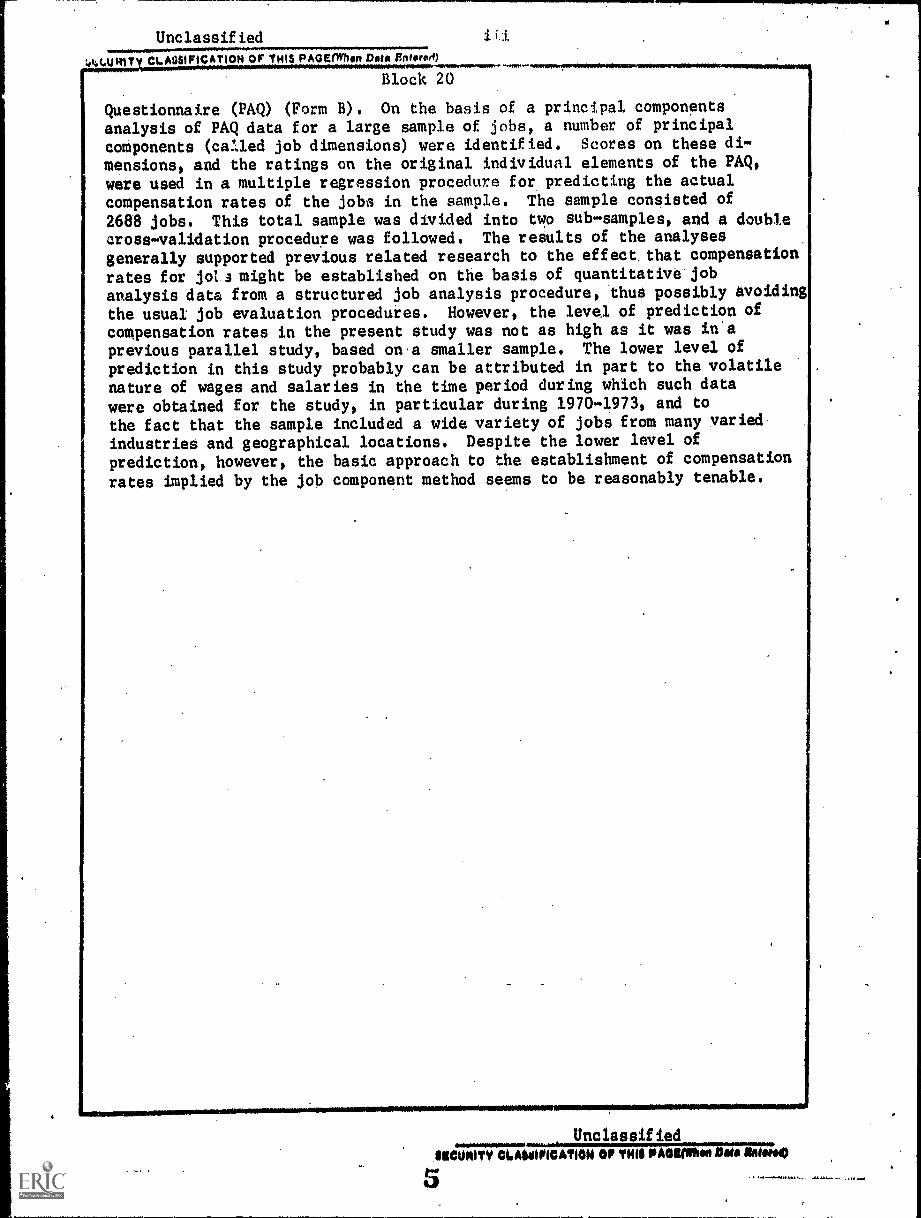
Block 20
Questionnaire (FAQ) (Form 8) . On the basis of a principal componentsanalysis of PAQ data for a large sample of jobs, a number of principalcomponents (called job dimensions) were identified. Scores on these di-
mensions, and the ratings on the original individual elements of the FAQ,were used in a multiple regression procedure for predicting the actual
compensation rates of the jobs in the sample. The sample consisted of
2688 jobs. This total sample was divided into two sub-samples, and a doublecross-validation procedure was followed. The results of the analysesgenerally supported previous related research to the effect. that compensation
rates for jot.3 might be established on the basis of quantitative'job
analysis data from a structured job analysis procedure, thus possibly avoiding
the usual job evaluation procedures. However, the level of prediction ofcompensation rates in the present study was not as high as it was in'aprevious parallel study, based on.a smaller sample. The lower level of
prediction in this study probably can be attributed in part to the volatilenature of wages and salaries in the time period during which such data
were obtained for the study, in particular during 1970-1973, and to
the fact that the sample included a wide variety of jobs from many varied
industries and geographical locations. Despite the lower level of
prediction, however, the basic approach to the establishment of compensation
rates implied by the job component method seems to be reasonably tenable.
UnclassifiedSICUNITY OLANOPICATION OP THIS PAOION40 bNm 1141A0
5

INTRODUCTION
TABLE OF CONTENTS
Page
1
Purpose of Present Study 2
PROCEDURES 2
Sample of Jobs 3
Compensation Data for Jobs 3.
PAQ-based Data Used as Predictors 5
Analysis Procedures 6
RESULTS 7
DISCUSSION
REFERENCES 13.
APPENDIX 14
a
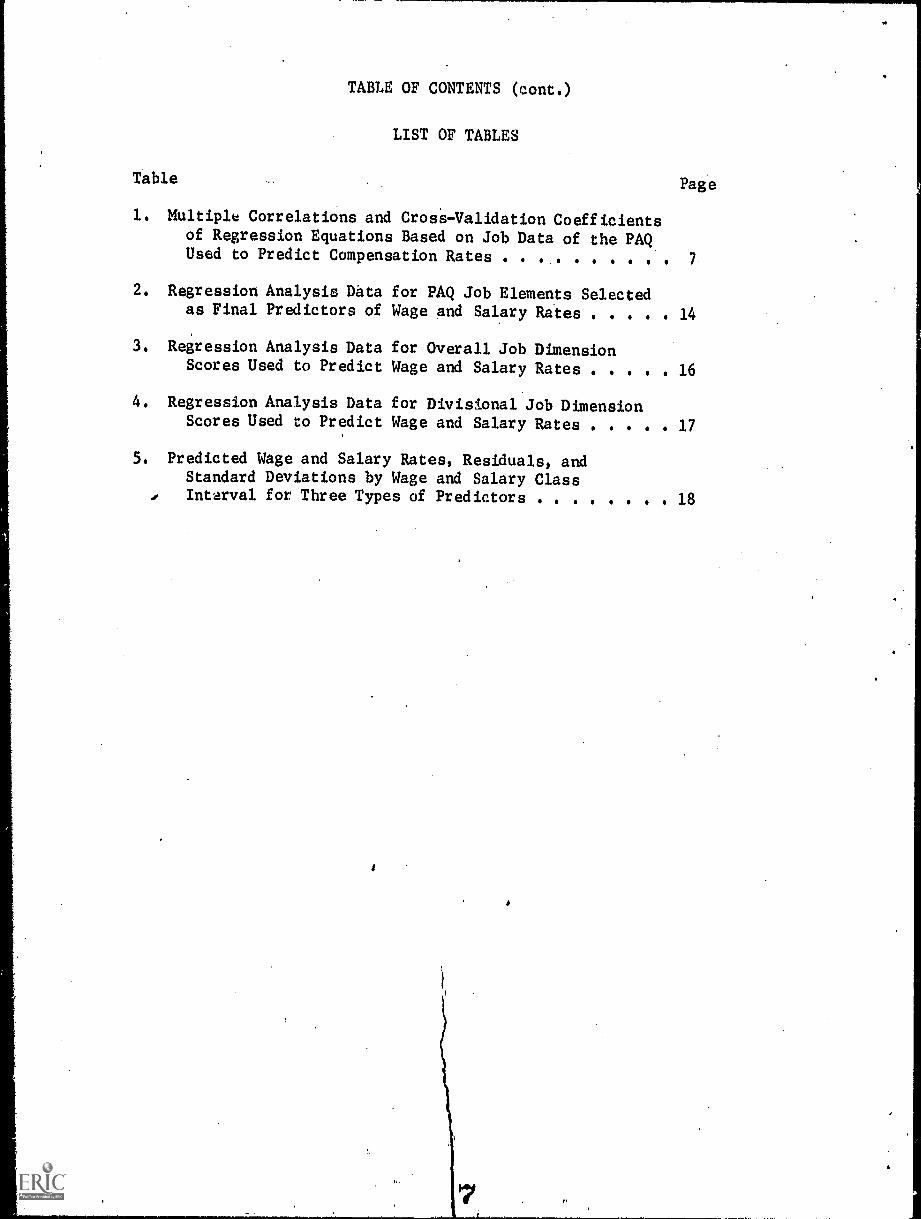
TABLE OF CONTENTS (cont.)
LIST OF TABLES
Table Page
1. Multiple Correlations and Cross-Validation Coefficientsof Regression Equations Based on Job Data of the PAQUsed to Predict Compensation Rates 7
2. Regression Analysis Data for PAQ Job Elements Selected
14as Final Predictors of Wage and Salary Rates
3. Regression Analysis Data for Overall Job DimensionScores Used to Predict Wage and Salary Rates 16
4. Regression Analysis Data for Divisional Job DimensionScores Used to Predict Wage and Salary Rates 17
5. Predicted Wage and Salary Rates, Residuals, andStandard Deviations by Wage and Salary Class
. Interval for Three Types of Predictors 18
INTRODUCTION
The conventional method for establishing compensation rates forjobs ,is by the use of job evaluation procedures. This typically in-volves the following phases: the selection or development of a jobevaluation system; the preparation of a job description for each job;the evaluation of each job with the job evaluation system; using thejob description for the job; the carrying out of a wage or salarysurvey to obtain information on going rates for certain key jobs; thedevelopment of ac orgainzation wage or salary curve that reflects apolicy-determined relationship between job evaluation values (usuallypoint values) and compensation rates to be paid; and the applicationof the. relationships shown by that curve to specific jobs.
One of the objectives of such a procedure is of course that ofproviding a systematic basis for establishing differential compen-,sation rates for jobs within the organization in question that re-flect reasonably "true" differences between and among the jobs in theorganization. Another objective is that of establishing an overalllevel of compensation rates for jobs in the organization at somepolicy-determined relationship with respect to compensation levels inthe labor market in question. In these processes the job evaluationsystem that is used is intended to provide the basis for ordering jobsalong a scale of relative values. These values .presumably would re-flect similarities and differences between and among jobs in terms oftotal values. The actual evaluation of jobs with the system in ques-tion typically requires the making of judgements or evaluation aboutjobs on the basis of the job descriptions that are available.
The Job Component Method of Establishing Compensation Rates
Since job data serve essentially as the basis for the establishmentof compensation rates, it would seem that one might be able to use jobdata directly for this purpose, without the need for the interveningevaluation process, or, for that matter, for a job evaluation system assuch. To do this one would need to carry out the following processes:(1) develop a structured job analysis procedure which would providethe basis for quantifying various components of jobs; (2) use thisprocedure for analyzing and quantifying a sample of jobs; (3) obtain in-formation on the compensation rates applicable to those jobs; (4) id-entify by regression analysis the job components and their respectivestatistical weights that give the highest multiple correlation withthe criterion of compensation rates; and (5) apply that regressionequation to jobs for which compensation rates are to be established.Such a procedure might be called a job component.,method of establishingcompensation rates.
Previous Tr -out of Job Com onent Method
This basic scheme was carried out with a sample of jobs with en-couraging results (Mecham and McCormick, Report No. 3, June 1969).

2
That study involved the use of a structured job analysis questionnairecalled the Position Analysis Questionnaire (PAQ),1 The PAQ form usedin that study (Form A) consisted of 189 job elements that generallyprovided for characterizing the human behaviors in jobs, what aresometimes referred to as "worker-oriented" job activities (McCormick,1959). In the use of the PAQ each job element ie rated in terms ofits relevance to the job using an appropriate rating scale such as iim7.portance, time spent, etc. The PAQ had been subjected to principalcomponents analysis, with 32 components having been identified (McCormick,Jeanneret, and Mecham, 1972). These components, referred to as jobdimensions, provide the basis for deriving job dimension scores.
In the previous study with the PAQ ( Mecham and McCormick, ReportNo. 3, June 1969) job dimension scores and ratings on certain of thejob elements of the PAQ were used as predictors of compensation ratesfor a sample of 340 jobs. A double cross-validation procedure was used.In general terms, the multiple correlations and cross-validationcoefficients generally were in the mid- and upper 80's, thus suggestingsubstantial promise for the job component method of establishing com-pensation rates.
Pose of Present Study
The intent of the present study was that of further testing thejob component method with a larger sample of jobs, toward the possibleend of establishing a more solid statistical base for establishing com-pensation rates with this procedure. In the current study a subsequentform of the PAQ, Form B, was used. (This form substantially parallelsForm A, but there are some modest differences in the job elements andrating scales used).
PROCEDURES
The basic procedures followed in the study consisted of: theselection of a sample of jobs for which PAQ analyses were availableand for which compensation data were available; the derivation of jobdimension scores for the sample jobs; and the use of regression analysisusing the job dimension scores for the sample jobs as predictors oftheir compensation rates.
1. The Position Analysis Questionnaire (PAQ) is copyrighted by thePurdue Research Foundation. The PAQ and related materials areavailable through the University Bookstore, 360 State Street,West Lafayette, Indiana 47907
9
3
kaaltAAta
The sample of jobs was drawn from a pool of 8000 jobs for whichPAQ analyses were available, More specifically, it was drawn from asample of 3700 jobs which had been selected from the 80000 for use ina principle components analysis (Marquardt and McCormick, Report No. 4,June 1974). That sample of 3700 had been drawn to be roughly repres-sentative of the employment by major occupational categories of theUnited States labor force. The analyses came from about 125 differentorganizations in a wide varKety of industries and from many geo-graphical locations.
The sample selected for the present study included all those jobs.within that sample for which sutiable compenstion data had been re-ported at the time of the PAQ analyses. Such data were available for2762 jobs. 'This sample was reduced to 2688, however, by the elimi-nation of 74 "outlying" jobs with high and low compensation rates, asdiscussed below.
Compensation Data for Jobs
The PAQ provides for compensation data for Jobe to be reported interms of whatever methods are actually used, such as salary, hourlywages, commissions, tips, etc. When methods other than hourly wageswere used, the data were to be reported as averages for the most con-venient time period, such as weekly, monthly, or yearly. When severalpeople might be on the same job, on which there might be some in-dividual differences in compensation, the employing organizations wereasked to report the median compensation rate for the job. When thiswas reported it was used in the study.
Because of the different time bases for which the compensationdata had been reported the data were converted to a common metric ofdollars per month, this value being computed as follows for the variousreporting time periods:
Reporting period
Hourly wage', 173.000
Weekly 4.333
Monthly 1.000
Yearly .083
10

The computations were based on the rationale that employees usuallywork a 40 hour week and receive pay during vacations. While thisassumption would not be universally valid, it was considered to be themost appropriate assumption to.make.
Most of the PAQ analyses and compensation data had been obtainedduring 1973. However, data for some jobs had been obtained during 1970,1971, and_ 1972. This time difference in reporting compensation pre-sented a potentially complicating problem because of typical increasesin earnings due to inflationary tendencies. As it turned out, a goodshare of the compenSation data reported in 1970, 1971 and 1972 hadbeen reported by a limited number of organizations, each of which hadcovered a number of jobs. In the case of the jobs in some of theseorganizations it was possible to obtain from the organizations com-pensation data for the jobs in question, up-dated to 1973. For variousreasons it was not possible to obtain such up-dated information fromcertain organizations, as for example because of personnel or organi-zational changes that had removed the previous content "personnel."Further, in some cases the jobs had been eliminated or changed duringthe interviening years. Also, there were scattered jobs in a numberof organizations for which it was not considered to be feasible to tryto obtain up-dated compensation data. In most such instances only onejob, or only a few jobs, had been analyzed by the organizations.
In the case of jobs for which 1970, 1971 and 1972 earnings hadbeen r sported, but for which 1973 up-data were not available, the re-ported compensation data were up-dated by constants that were consideredto reflict the typical annual increases in wages and salaries. For thispurpose data from certain federal government reports were used, in part-icular two reports from the Bureau of Labor Statistics (1973 a and 1973 b)and two from the Department of Commerce (1974 a and 1974 b). The aver-age annual increase given in the these reports were quite similar forany given year and for various occu ',ational categories. For purpose ofmaking adjustments, "average" values of the various reported averagesweredervied, these being as follows, along with the correction factorused to derive the up-dated values:
Year AY25.2321LIE0212 Correction factor.to 1973
1972 5.98%
1971 11.83% 1.1183
1970 17.325% 1.17325

5
These corrections were made for 1438 jobs. It is realized thatthese adjustments would not necessarily represent actual increases inthe compensation rates for the jobs in question, but it was considereddesirable to apply these "average" adjustments in order to retainthese jobs in the sample, assuming that the specific adjustments somade would approcimate increases for jobs of the types in questions.Of the sample of 2762 jobs initially selected 74 were eliminated asbeing "outlying" cases in particular those with monthly compensationrates below $326.00 and above $1,450.00. These were eliminated afteran initial division of the total sample into two subsamples revealednoticably different standard deviations in the compensation criterionfor the two samples. In other words, chance allocations of these few"outlying" cases to one subsample or the other seemed to have a dis-preportional effect on the standard deviations of the two sampleswhich in turn, could affect the subsequent analyses.
For each of the 2688 jobs included in the sample, then, therewas a criterion of dollars per, month that was used in the subse-quent phases of the study. .
PAQy based Data Used as Predictors
As indicated above, the jobs included in the sample were those forwhich PAQ analyses were available. Three types of PAQ-based data wereused as possible predictors of the criterion values of compensationrates per month. Two of these types of data consisted of job dimensionscores for the job dimensions previously derived from a series of prin-ciple components analyses of PAQ data (Marquardt and McCormick, ReportNo. 4, June 1974). In that study one set of 30 job dimensions wasderived from the principle components analysis of the job elements withineach of the six divisions of the PAQ, using the sample of 3700 jobsmentioned above. These are referred to as "divisional" job dimensions.The other set of dimensions (of which there were 14) was based on theprinciple components analysis of the same sample lobs in which mostof the job elements were pooled together. These are referred to asthe "overall" or "general". (G) dimensions. The third set of PAQ-baseddata used as predictors consisited of the ratings for the jobs on the
r'llements themselves. There are a total of 187 items in form B of thePAQ, but not all of these were used, since it was considered desirableto restrict somewhat the number of job elements used in this analysisin order to keep the ratio of the number of predictors to the numberof jobs within some reasonable bounds. A few items are of a write-innature and would not be amenable to this analysis in any event. There.
are a number of dichotomous items in the PAQ which were also omitted.(This decision was based on a study of the distributions of the re-sponses to these items in tha sample., Due to the nature of the items,the distributions were highly irregular and highly skewed, and it wasfeared that these items could disproportionately affect the results).
6
Eliminating these items still left a number that was considered toolarge to be used in a multilple regression analysis because of theanalysis. As a further step in reducting the number of predictors, acorrelation of the ratings on each item with the criterion values ofcompensation rates was calculated across all jobs. In turn, the itemswith the lowest correlations were eliminated, leaving a pool of 99 items,and these were used in the subsequent analyses.
Thus, for each of the 3700 jobs there were the following sets ofpredictors:
1. Job dimension scores on 30 divisional job dimensions2. Job dimension scores on 14 overall or
job dimensionsgeneral- (G)
3. Ratings on each of 99 job elements of the PAQ
Analysis Procedures
Since a double cross-validation procedure was to be used, the totalsample 2688 jobs.was divided into two subsamples (A and B), each con-t,
sisting of 1344 jobs. This was done by first ordering. the 2688 jobsiti terms of this compensation index, and then selecting jobs alter-nately for the two samples, in effect taking the lst, 3rd, 5th, etc.for one sample, and the 2nd, 4th, 6th, etc. for the other sample. Themean compensation rates for jobs in these two samples, and their stan-dard deviations, are given below:
Sample ASample B
Mean Standard deviation744.6317 218.3092745.0618 218.58CA
A step-wise regression analysis was carried out for each sample(A and B), and a regression equation was derived for each sample foreach of the three types of predictors. The regression equation for agiven predictor based on sample A was then applied to the jobs insample B, and vice versa. In addition, a regression analysis wascarried out with the total sample (A45).
As a final step, the data for the total sample (A41) was usedfor presenting a comparison between predicted compensation rates andactual compensation rates, th:1 being carried out for the predictedrates based on all three types of predictors. This was done by de-riving the residuals (actual rate - predicted rate = residual), anddividing them into fifty-dollar class intervals. The results are pre-sented graphically, along with the actual standard deviation of the
class intervals, and a generalized expected standard deviation ofthe actual compensation rates.

.." I.,
7
RESULTS
The results are summarized in Table 1, this showing the multiplecorrelations and the cross-validation coefficients for the three setsof predictors. (The regression requations are given in the Appendixas Tables 2,3, and 4. Tables in the Appendix gives the residuals).Graphic representations of the relationship for each of the sets ofpredictions between the predicted compensation rates and the actualrates are given in figures 1, 2, and 3.
Table 1
Multiple Correlations and Cross-Validation Coefficients ofRegression Equations Based on Job Data of the PAQ
Used to Predict Compensation Rates
oromomravorarrommo......Mon.mob
Type ofPredictor A B A-1-B A on B
10111WOMMIMMI
B on A
Overall Dimensions .65493 .65396 .64746 .6407 .6449
Divisional Dimensions .69931 .69484 .68921 .6726 .6753
Raw Data .70149 .69161 .68207 .6364 .6450
DISCUSSION
The multiple correlation and cross-validation coefficients shownin Table 1 are generally around .64, these being relatively respectablecoefficients. However, they are of an order of magnitude below thosereported in the preceding study (Mecham and McCormick, Report No. 3,June 1969), those coefficients being in the mid- to upper - 80's.Although it had been hoped that the present study would result in sub-stantially the same level of prediction, the economic changes thattook place during the time period in which the data were obtainedraised doubts as to whether that same level of prediction would beachieved.
The time period during the data-collections phase--from 1970through 1971.-was one of marked inflation) especially 1973 duringwhich most of the data were obtained. During such periods all pricelevels and earnings do not increase evenly, but rather increase ir-regularly, some jumping ahead of others) and some following an erratic
8
leap-frog pattern of movement. This very volatile wage and salary sit-uation could cause the compensation rates for individual jobs obtainedat any given time during such a period to be higher, or lower, relative to all other jobs than would be the case during a period of moreeconomics stability. (During a period of economic stability the'com-pensation rates for individual jobs presumably would tend to "settledown" at levels relative to other jobs that would reflect the normalsupply and demand factors for people to perform the various jobs). Itis the considered opinion of the investigators that this volatilenature of wages and salaries during the data-collection phase did infact significantly alter the relative positions of some jobs on thecompensation scale from what they would have been under more "normal"economic conditions.
The test of the basic hypothesis (that compensation rates can bepredicted from job-related data) would of course be dependent uponhaving criterion values (i.e., compensation rates) that represent"appropriate" values for the jobs. To the extent that the relativepositions of jobs on the compensation scale are the consequence of thefortuitous timing of increments during an inflationary period, theprediction of such rates would of course be adversely affected.
As a somewhat related matter, it will be recalled that the com-pensation data that were obtained during 1970, 1971 and 1972 wereadjusted upwards by values that reflected "average" increases inearnings during these years. Although this adjustment was consideredto be desirable, it is of course possible that its across-the-boardnature may have resulted in some misalignment ofjobs on the com-pensation scale.
Another factor that needs to be taken into account in evaluatingthe results is the variety of jobs included, these having come fromabout 125 different organizations in.a wide variety of industries andgeographical locations. The sample included jobs from various privateindustries (manufacturing, utilities, trade, service, communications,etc.) and from certain' government organizations (federal and local).It is of course generally recognized that earnings do vary by in-dustry and geographical location. In this regard, the correspondingdata for the previous study (Mecham and McCormick, Report No. 3, 1969)for the 340 jobs came from a samller number of organizations, and thusmight not have reflected as.wide a variability in compensation ratesacross industries (and possibly across geographical locations) aswas represented in the present study.
Thus, although the results of this study were somewhat lowerthan those of the previous study, it is reasonable to attribute thisin large part to the consequence of the combination of industrialand geographical variability in compensation rates and of the vola-tile nature of wages and salaries during the data collection period.
1.5

These influences on the criterion values would not invalidate the basicconcept involved in the study--that compensation rates can be predicatedon quantitative job analysis data. But the results do suggest thatthe statistical analyses directed toward such estimation might well bebased on the jobs within more restricted contexts (such as those withina single organization or "class" of organizations, or within a givenlabor market, or within some geographical area). In this regard, forexample, similar analyses in the case of individual organizations haveresulted in correlations between predicted job values and actual com-pensation rates as high as .93 and .94, this lending credence to suchan approach.
In order to explore the possibility that the prediction of ratesof compensation might be greater within individual organizations, thePAQ's for five organizations were examined, in particular organizations'fpr which a fairly large number of PAQ's had been prepared. In thecase of four of these organizations there was an obvious restriction ofrange of compensation rates. There was only one for which the range ofcompensation rates was reasonably wide, this being a utility companyfor which there was 312 jobs. In this particular instance the correlationbetween predicted rates and actual rates was .79. Similar correlationswere also run in the case of the other 4 organizations but, as expected,'the correlations in these instances were somewhat lower, ranging from.61 to .67. The correlation of .79 in the case of the utility companyfor which there was a reasonable range of rates Lends some support tothe hypothesis that prediction of rates of pay 'lithin restricted contextscan be based on a structured job analysis procedure.
With respect to the results of the present study, there was noappreciable difference in the predictiveness of the three types ofPAQ-based data, i.e., the divisional job dimensions, the general (G)dimension's, or the specific job elements. Thus, it would seem thatthe various ways of statistically "combining" the PAQ-based data areequally effective.
1500
1400
1300
00rq 1200Orq
1100
0
0O 1000
0
3
.7000
44
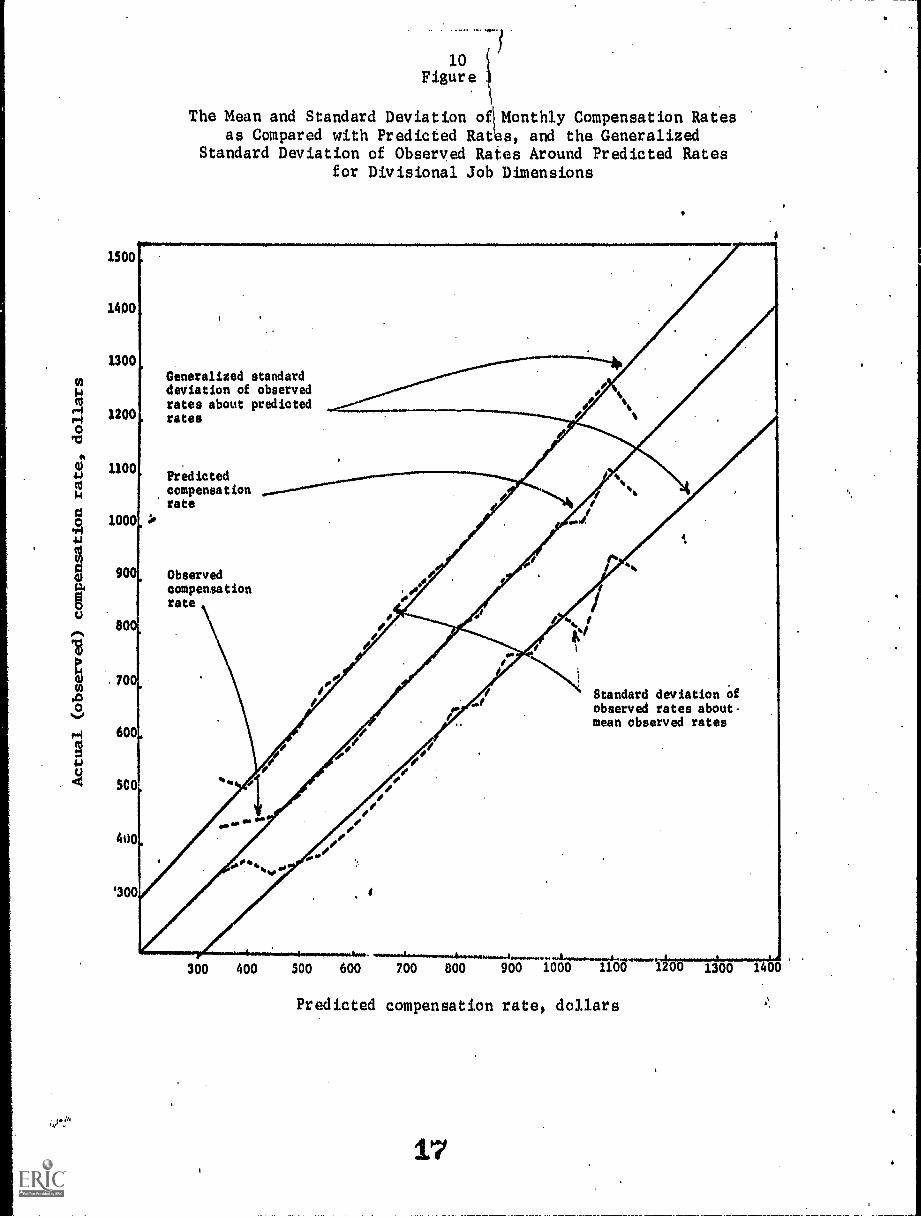
10Figure
The Mean and Standard Deviation of Monthly Compensation Ratesas Compared with Predicted Rat s, and the Generalized
Standard Deviation of Observed Rates Around Predicted Ratesfor Divisional Job Dimensions
Generalized standarddeViation of observedrates about predictedrates
Predictedcompensationrate
900. Observedcompensationrate
800
4.110.MIVOINIIINOMIMIIIIMISINIM
O t1
%1
600,
500,
400.
'300
300 400
Standard deviation ofobserved rates about-mean observed rates
300 600 700 800 900 1000 1100 1.4b-r-7161-7:411
Predicted compensation rate, dollars

11
Figure 2
The Mean and Standard Deviation of Monthly Compensation Ratesas Compared with Predicted Rates, and the Generalized
Standard Deviation of Observed Rates Around PredictedRatesfor Overall Job Dimensions
1500 _
1400,
1300
0 Generalized standardS6 deviation of observed
"4 .1200. rates about predicted-i rates0
a; 11004.6 Predicted0$.4
1000
80 900C40 Observed
compensation
800 rate
700
0
-i 600Cd
4.6
500
compensation rate .
II
.
0
0
oso Standard devia%ion of,
a 1°observed rates abouto
400
30
Oa
t.
300 400 500. 600 700 800 900 1000 11100 1200 ,14----i76-4.6I.
...--..... 1
Predicted compensation rate, dollark,..
1s '

1500
1400
1300
0r4 12000.4
pc,
14
0,4141
004
450
r4
4.1
500
1100.
1000
900
800
700
600
12
Figure 3The Mean and Standard Deviation of Monthly Compensation Rates
as Compared with Predicted Rates, and the GeneralizedStandard Deviation of Observed Rates Around Predicted Rates
for Job Elements
Generalized standarddeviation of observedrates about predictedrates
Predicted
compensation. rate
Observedcompensationrate.
4,0pIf Si
II#
if
.400
300
300 400 500 600 700 800 900 1000 1100 1200
Standaredeviation ofobserved rates aboutmean observed rates
.4
Predicted compeusation rate, dollars
19
1300 1400

13
REFERENCES
Marquardt, L. D. and McCormick, E. J. The job dimensions underlyingthe job elements of the Position Analysis Questionnaire (PAQ)(Form 8). Occupational Research Center, Purdue University, June,1974. (Prepared for Office of Naval Research under contractNo. N00014-67-A-0226-0016, Report No. 4).
McCormick, E. J. Application of job analysis to indirect validity.Personnel Psychology, 1959, 12, 402-213.
McCormick, E. J., Jeanneret, P. R., and Mecham, R. C. A study of job
characteristics and job dimensions as based on the PositionAnalysis Questionnaire (PAQ). LairaullE2112Lay02212faMonograph, 1972, 56, 347-368.
Mecham, R. J., McCormick, E. J. The use in job evaluation of jobelements and job dimensions based on the Position AnalysisQuestionnaire. Occupational Research Center, Purdue University,1969. (Prepared for Office of Naval Research under contractNonr-1100(28), Report No. 3).
1.1. S. Bureau of Labor Statistics, Survey of
Administrative Technical and Clerical. P. Bulletin 1764,1973, (a).
U. S. Bureau of Labor Statistics LEmlo et....matataIdEarnins, 20(1),
February, 1973 (b).
U. S. Department of Commerce Economic Indicators. January 1974, (a).
U. S. Department of Commerce Economic Indicators. June 1974, (b).
4
20

AvilENDIX
21

15
Table 2
Regression Analysis Data for PAQ Job Elements Selectedas Final Predictors of Wage and Salary Rates
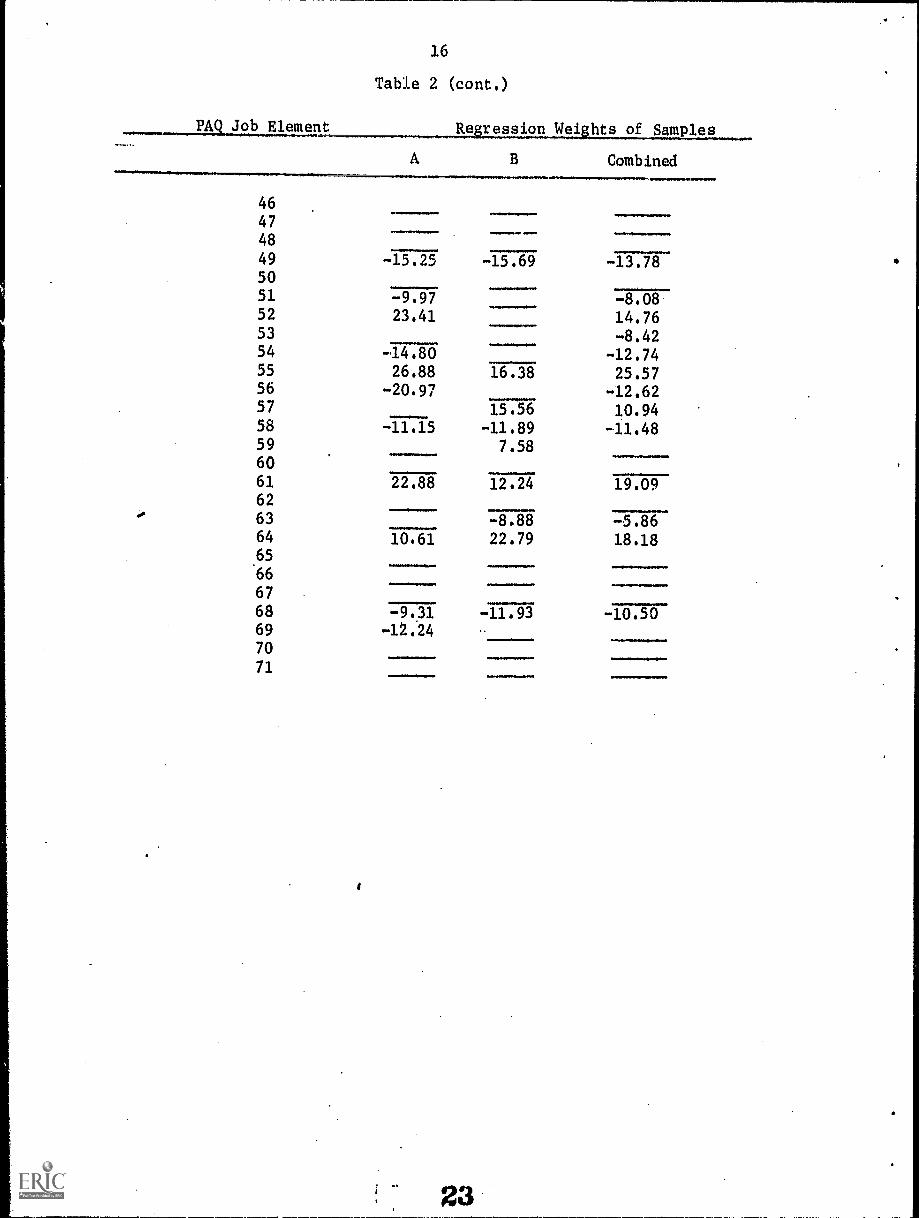
PAQ Job ElementRe r es sion Wei hts of Sam les
A B Combined
1
2
3
4
5
6
7
8
9
14.2314.84
-7.06
8.3621.05
-9.54
26.57
-13.50
01111Menwl
-9.48 -15.29 12.03
10
11 1.91.011
*.ey.12 -16.07 -8.04
13 8.29 6.86
14.11
15
16
17 10.20 8.78 8.84
18 9.74
19 5.56vairewM0are
20 -12.17 -6.31
21 5.96
22 18.59 11.11
23 21.28 18,20 20.71
24 8.89
25 -7.98 -9.44
26
274.0
28moo. Nordommimo 01
29
30 29.76 30.63 28.28
31
32 -16.74 -11.61 -12.11
33
34
11.11...
35
.36
40100.11011.14.41141 saaM04.0.00.
.IIMea.1011111/0111MM
9.5737
38
Om. Ogam
39 -8.59 -13.98 -12,55
40 4.96 11.84 9.60
41
42 -14.70 -7.57 ,40.42
43 01.01,..11,111MIOM000111.11..
11111.01008MMIM44MIOMAWIMMIMOG MMIIM.00 .1145
22
16
Table 2 (cont.)
ML191112JuDt Regression Weights of Samples
464748
495051
52
53
54
55
56
57
58
596061
62
6364
65
.66
67
6869
70
71
A
1114MIONIIIIIIM.
-15.25 -15.69
-9.9723.41
-14.8026.88
-20.97
-11.15
22.88
-8.8810.61 22.79
16.38
15.56-11.89
7.58
12.24
B Combined
....1111 1./.48/.."06/0/0 /10 "/*/
00MM
111.11Irma& 4110
-13.78
-8.0814.76-8.42
-12.7425.57
-12.62
10.94-11.48
10....101101M
19.09
-5.8618.18
01.10/610IMMINPOII.e.a-9.31 -11.93 -10.50-12.24
11.11.....111.M..
23

17
Table 3
Regression Analysi.s Data for Overall Job DimensionScores Used to Predict Wage and Salary Rates
Dimension Regression Weights for Sample
A B Combined
1. 118.98 123.37 120.88
2. 14.24 15.99 16.44
3. 17.75
4. 62.88 67.92 65.57
5. -20.69 -19.73 -19.57
6. 36.97 42.64 38.88
7. 19.30
8.
9.
10. 22.73 24.69 22.88
11. 54.51 56.50 55.40
12.111.411.1111M111.018410.1.110.111 orm.....111
13. -21.05 -28.25 -23.63
14. 41.59 22.34 32.22

18
Table 4
Regression Analysis Data for Divisional Job DimensionScores Used to Predict Wage and Salary Rates
Divisional Job Dimension Rey ression Weights of Samples
A B Combined
1 -10.012 -20.08 -9.793 6.73 27.36 19.314 12.885 -11.85 -12.696 95.32 81.59 86.697 20.78 13.10 16.278
9 -13.181011 -28.87 -10.24 -20.4412
13 -11.3614 -14.09 -19.08 -14.1515 -38.20 -72.51 -61.1616 11.85 33.24 24.3117 9.34 9.93 10.2018 14.2619 10.05 6.20 8.4920 -10.182].
2223 12.5024
0.1.11.4.01.16.00
25 -13.46 -44.00 -27.5826 -25.41 -29.93 -28.0827 29.97 26.78 28.1128 58.70 38.50 48.5829 11.03 12.01 13.0330
01.1.40011
25
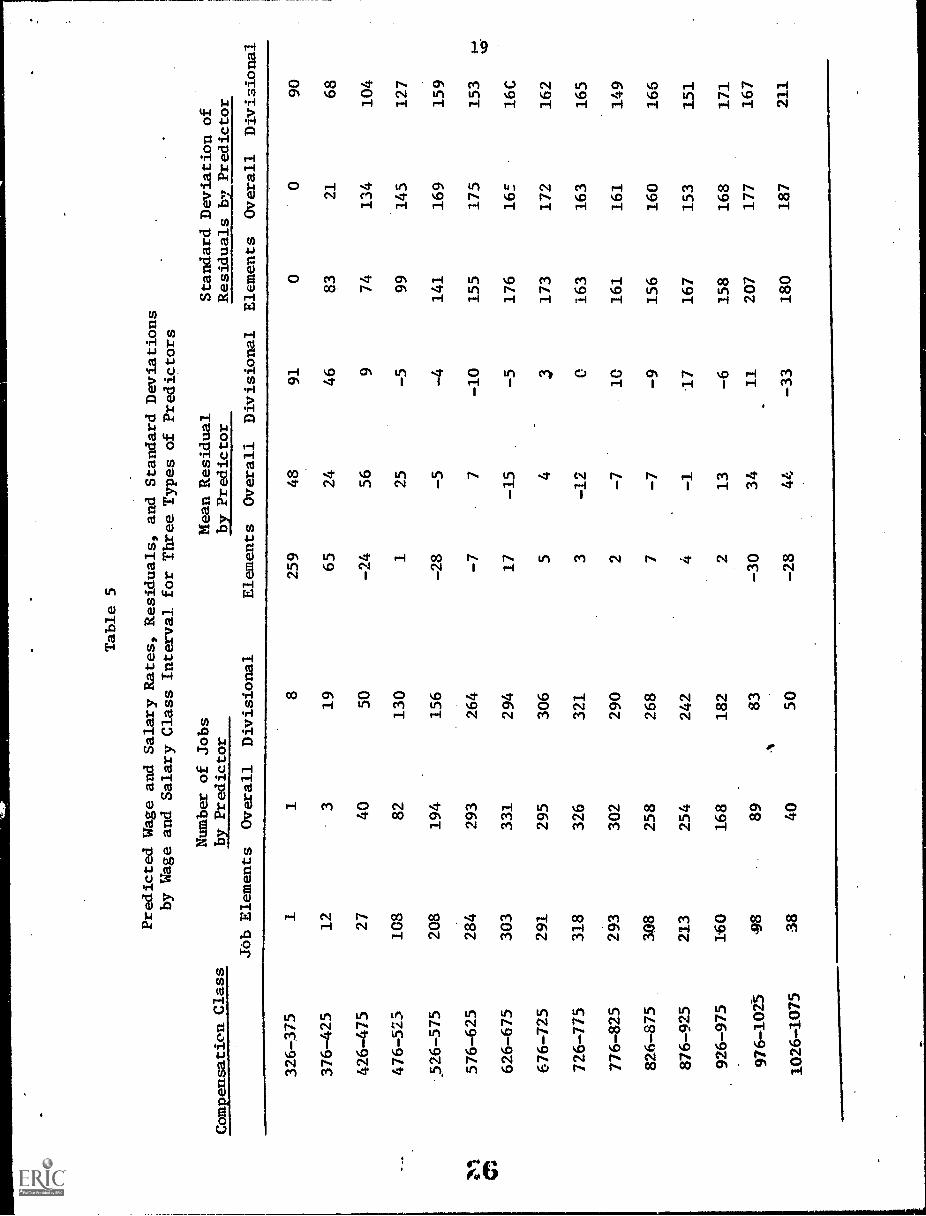
Table 5
Predicted Wage and Salary Rates, Residuals, and Standard Deviations
by Wage and Salary Class Interval for Three Types of Predictors
Compensation Class.
JOb Elements
Number of Jobs
by Predictor
Mean Residual
by Predictor
Standard Deviation of
Residuals by Predictor
Overall
Divisional
Elements
Overall
Divisional
Elements Overall Divisional
326-375
11
8259
48
91
00
90
376-425
12
-
319
65
24
46
83
21
68
426-475
27
40
50
-24
56
974
134
104
476-525
108
82
130
125
-5
99
145
127
.526-575
208
194
156
-28
-5
-4
141
169
159
576-625
284
293
264
-7
7-10
155
175
153
1--.
UY
626-675
303
331
294
17
-15
-5
176
165
16C
676-725
291
295
306
54
3173
172
162
726-775
318
326
321
3-12
0163
163
165
776-825
293
302
290
2-7
10
161
161
149
826-875
308
258
268
7-7
-9
156
160
166
876-925
213
254
242
4-1
17
167
153
151
926-975
160
168
182
213
-6
158
168
171
976-1025
98
89
83
-30
34
11
207
177
167
1026-1075
38
40
50
-28
44
-33
180
187
211
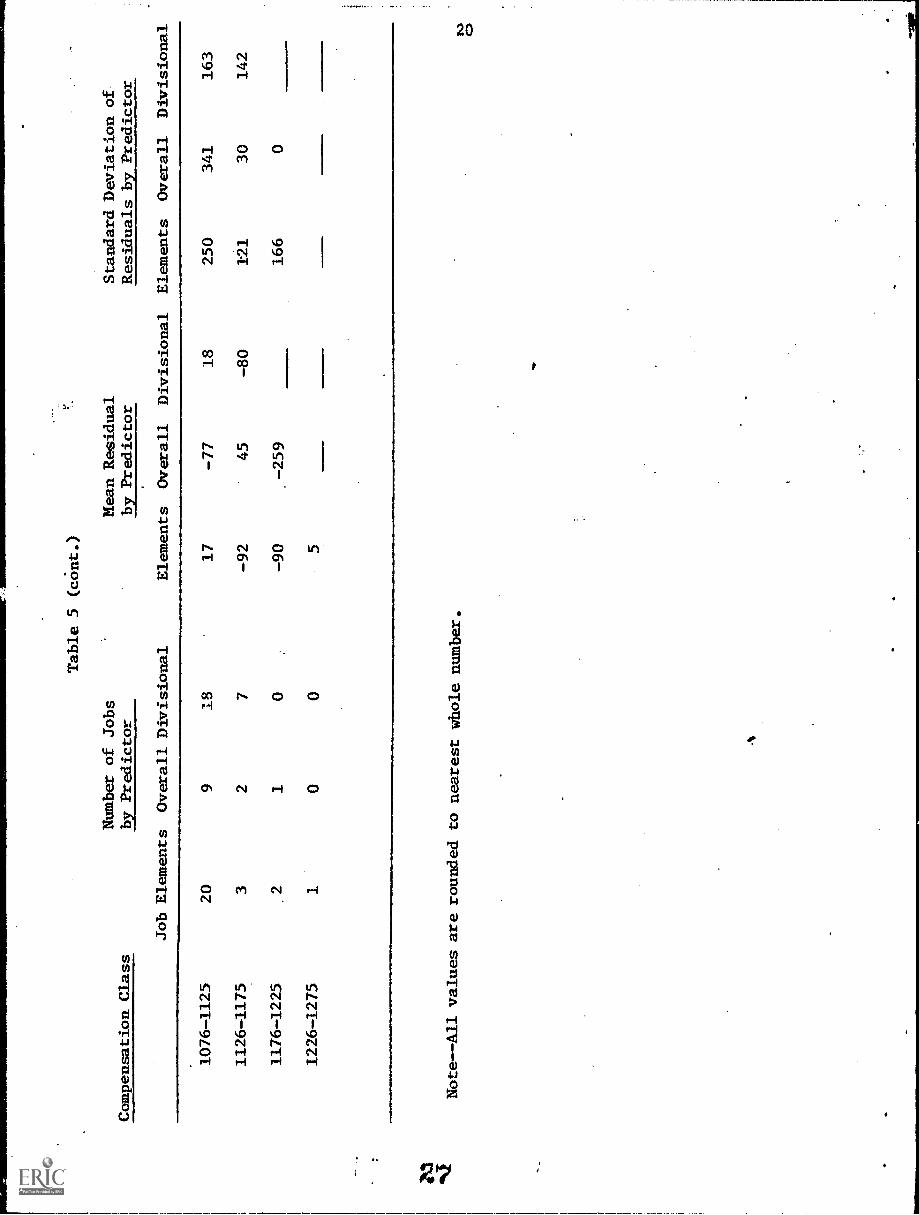
Table 5 (cont.)
Number of Jobs
Compensation Class
by Predictor
Mean Residual
Standard Deviation of
by Predictor
Residuals by Predictor
Job Elements
Overall Divisional
Elements
Overall
Divisional
Elements
Overall
Divisional
1076-1125
1126-1175
1176-1225
1226-1275
20 3 2 1
9 2 1 0
18 7 0 0
17
-92
-90 5
-77
45
-259
18
-80
250
121
166
341
30 0
163
142
NoteAll values are rounded to nearest whole number.
I\ 3

DISTRIBUTION LIST
Navy.
4 Dr. Marshall J. Farr, DirectorPersonnel and Training Research ProgramsOffice of Naval Research (Code 458)Arlington, VA 22217
1 ONR Branch Office495 Summer StreetBoston, MA 02210ATTN: E.E. Gloye
1 ONR Branch Office1030 East Green StreetPasadena, CA 91101ATTN: E.E. Gloye
1 ONR Branch Office536 South Clark StreetChicago, IL 60605ATTN: M.A. Bertin
6 DirectorNaval Research LaboratoryCode 2627Washington, DC 20390
12 Defense Documentation CenterCameron Station, Building 55010 Duke StreetAlexandria, VA 22314
1 Special Assistant for ManpowerOASN (M&RA)
Pentagon, Room 4E794Washington, DC 20350
a
1 LCDR Charles J. Theisen, Jr., MSC, USN4024Naval Air Development CenterWarminster, PA 18974
1 Chief of Naval ReserveCode 3055New Orleans, LA 70146
1 Dr. Harold R. BooherNaval Air Systems CommandNAVAIR 04A4Washington, DC 20361
1 Dr. Lee MillerNaval Air Systems CommandAIR-413EWashington, DC 20361
1 CAPT John F. Riley, USNCommanding OfficerU.S. Naval Amphibious SchoolCoronado, CA 92155
1 CAPT Ouida C. Upchurch, USNProgram Coordinator
Bureau of Medicine & Surgery(Code 71G)Washington, DC 20372
1 Chief
Bureau of Medicine & SurgeryResearch Division (Code 713)Washington,'DC 20372
1 ChairmanBehavioral Science DepartmentNaval Command & Management DivisionU.S. Naval AcademyLuce HallAnnapolis, 41D 21402
1 Chief of Naval Education & TrainingNaval Air StationPensacola, FL 32508ATTN: CAPT Bruce Stone, USN
1 Mr. Arnold Rubinstein
Naval Material Command (NAVMAT 03424)Room 820, Cxystal Plaza 4 #6Washington, DC 20360
1 Commanding OfficerNaval Medical Neuropsychiatric
Research UnitSan Diego, CA 92152
1 Director, Navy Occupational TaskAnalysis Program (NOTAP)
Navy Personnel Program SupportActivity
Building 1304, Bolling AFBWashington, DC 20336

1 Dr. Richard J. NiehausOffice of Civilian Manpower ManagementCode 06AWashington, DC 20390
1 Department of the NavyOffice of Civilian Manpower ManagementCode 263Washington, DC 20390
1 Superintendent
Naval Postgraduate SchoolMonterey, CA 93940ATTN: Library (Code 2124)
1 Commander, Navy Recruiting Command4015 Wilson BoulevardArlington, VA 22203ATTN: Code 015
1 Mr. George N. GraineNaval Ship Systems Command-SHIPS "047C12Washington, DC 20362
1 Chief of Naval Technical Training
Naval Air Station Memphis (75)Millington, TN 38054ATTN: Dr. Norman J. Kerr
1 Dr. Withal L. MalayPrincipal Civilian Advisor
for Education & TrainingNaval Training Command, Code 01APensacola, FL 32508
1 Dr. Alfred F. Smode, Staff ConsultantTraining Analysis & Evaluation GroupNaval Training Equipment CenterCode N-00TOrlando, FL 32813
1 Dr. Hanns H. WolffTechnical Director (Code N-2)Naval Training Equipment CenterOrlando, FL 32813
1 Chief of Naval Training SupportCode N-21Building 45Naval Air StationPensacola, P1 32508
1 CDR Richard L. Martin, USNFighter Squadron 124NAS Miramar, CA 92145
1 Mr. Charles Hodges.Navy Personnel R&D CenterSan Diego, CA 92152
5 Navy Personnel R&D CenterSan Diego, CA 92152ATTN: Code 10
Army,
1 HeadquartersU.S. Army Administration CenterPersonnel Administration Combat
Development ActivityATCP-HROFt. Benjamin Harrison, IN 46249
1 Director of ResearchU.S. Army Armor Human Research UnitBuilding 2422 Morade StreetFort Knox, KY 40121ATTN: Library
1 CommandantUnited States Army Infdn..ry SchoolATTN: ATSH-DETFort Benning, GA 31905
1 Deputy CommanderU.S. Army Institute of Administration.Fort Benjamin Harrison, IN 46216ATTN: VA
1 Dr. Stanley L. Cohen.U.S. Army Research Institute1300 Wilson BoulevardArlington, VA 22209
1 Dr. Ralph Dusei
U.S. Army Research Institute1300 Wilson BoulevardArlington, VA 22209
1 Mr. Edmund F. FuchsU.S. Army Research Institute1300 Wilson BoulevardArlington, VA 22209

1 Dr. J.E. Uhlaner, Technical DirectorU.S. Army Research Institute1300 Wilson BoulevardArlington, VA 22209
HQ USAREUR & 7th ArmyODCSOPS
USAREUR Director of GEDAPO New York 09403
Air Force
1 Research Branch (AF/DPXYR)Pentagon, Room 5C428Washington, DC 20330
1 AFHRL/DOJNStop #63Lackland AFB, TX 78236
1 Dr. Robert A. Bottenberg (AFHRL/SM)Stop #63Lackland AFB, TX 78236
1 Dr. Martin Rockway (AFHRL/TT)Lowry AFBColorado 80230
1 AFOSR/NL1400 Wilson BoulevardArlington, VA 22209
1 CommandantUSAF School of Aerospace MedicineAeromedical Library (SUL-4)Brooks AFB, TX 78235
1 Dr. Sylvia R. Mayer (MCIT)Headquarters Electronic Systems DivisionLG Hanscom FieldBedford, MA 01730
Marine Corps
1 Mr. E.A. DoverManpower Measurement Unit (Code MPI)Arlington Annex, Room 2413Arlington VA 20380
, .o . gfi4iik,411144.V4118111111k
1 Commandant of the Marine CorpsHeadquarters, U.S. Marine CorpsCode MPI-20Washington, DC 20380
1 Director, Office of Manpower UtilizationHeadquarters, Marine Corps (Code MPU)MCB (Building 2009)Quantico, VA 22134
1 Dr. A.L. SlafkoskyScientific Advisor (Code RD-1)Headquarterb, U.S. Marine CorpsWashington, DC 20380
Coast Guard
1 Mr. Joseph J. Cowan, ChiefPsychological Research Branch (G-P-1162)U.S. Coast Guard HeadquartersWashington, DC 20590
Other DOD
1 Lt. Col. Henry L. Taylor,USAFMilitary Assistant for Human ResourcesOAD (E&I,S) ODDR&EPentagon, Room 3D129Washington, DC 20301
1 Col. Austin W. KiblerAdvanced Research Projects Agency'Human Resources Research Office .
1400 Wilson BouleftrdArlington, VA 22209
1 Mr. Thomas C: O'SullivanAdvanced Research Projects AgencyHuman Resources Research Office1400 Wilson BoulevardArlington, VA 22209
Other Government
1 Dr. Lorraine D*16'Personnel Research and Development
CenterU.S. Civil Service Commission1900 E. Street, N.W.Washington, DC 20415..
4,

1 Dr. William Gorham, DirectorPersonnel Research and Development
CenterU.S. Civil Service Commission1900 E. Street, N.W.Washington, DC 20415
1 Dr. Vern Urry
Personnel Research and DevelopmentCenter
U.S. Civil Service Commission1900 E. Street, N.W.
Washington, DC 2040.5
Miscellaneous
1 Dr. John AnnettThe Open UniversityMilton KeynesBuckinghamshireENGLAND
1 Dr. Richard C. AtkinsonStanford UniversityDepartment of PsychologyStanford, CA 94305
Dr. Gerald V. BarrettUniversity of AkronDepartment of PsychologyAkron, OH ,44325
1 Dr. Bernard M. CassUniversity of RochesterManagement Research CenterRochester, NY 14627
1 Mr. Kenneth M. BrombergManager - Washington OperationsInformation Concepts, Inc.1701 North Fort Myer DriveArlington, VA 22209
1 Mr. Aichael W. crownOperations Research, Inc.1400 Spring Street.Silver Spring, HD 20910
1 Century Research Corporation4113 Lee HighwayArlington, VA 22207
1 Dr. Kenneth E. ClarkUniversity of'RochesterWiese of Arts & SciencesRiver Campus StationRochester, NY 14627
1 Dr. H. Peter DachlerUniversity of MarylandDepartment of ..'sychology
College Park, MD 20742
1 Dr. Rene' V. DawisUniversity of MinnesotaDepartment of Psychology .
Minneapolis, MN 55455
1 Dr. Norman R. DixonRoom 170
190 Lothrop StreetPittsburgh, PA 15260
1 Dr. Robert DubinUniversity of CaliforniaGraduate School of AdministrationIrvine, CA 92664
1 Dr. Marvin D. DunnetteUniversity of MinnesotaDepartment of PsychologyMinneapolis, MN 55455
1 ERIC
Processing and Reference Facility4833 Rugby AvenueBethesda, MD 20014
1 Dr. Victor FieldsMontgomery CollegeDepartment of PsychologyRockville, MD 20850
1 Dr. Edwin A. FleishmanAmerican Institutes for ResearchFoxhall Square3301 New Mexico Avenue, N.W.Washington, DC 20016
1 Dr. Robert Glaser, DirectorUniversity of PittsburghLearning research & Development
CenterPittsburgh, PA 15213

5
1 Dr. Gloria L. GraceSystem Develpment Corporation2500 Colorado AvenueSanta Monica, CA 90406
1 Mr. Harry H. HarmanEducational Testing ServicePrinceton, NJ 08540
1 Dr. Richard S. HatchDecision Systems Associates, Inc.
11428 Rockville PikeRockville, MD 20852
1 Dr. M.D. HavronHuman Sciences Research, Inc.7710 Old Spring House RoadWest Gate Industrial ParkMcLean, VA 22101
1 HumRRODivision No. 5, Air DefenseP.O. Box 428Fort Rucker, IL 36360
1 Dr. Lawrence B. JohnsonLawrence Johnson & Associates, Inc.200 S. Street, N.W., Suite 502
Washington, DC 20009
1 Dr. kobert R. Mackie
,Human Factors Research, Inc.6780 Cortona DriveSanta Barbara Research ParkGoleta, CA 93017
1 Mr. Edmond Marks405 Old MainPennsylvania State University
University Park, PA 16802
1 Mr. Luigi Petrullo2431 North Edgewood Street
Arlington, VA 22207
1 Dr. Diane M. Ransey-KleeR-K Research & System Design
3947 Ridgemont Drive.Malibu, CA 90265
1 Dr. Joseph W. RigneyUniversity of Southern CaliforniaBehavioral Technology Laboratories3717 South GrandLos Angeles, CA 90007
1 Dr. Leonard L. Rosenbaum, ChairmanMontgomery CollegeDepartment of PsychologyRockville, MD 20850
1 Dr. George E. RowlandRowland and Company, Inc.P.O. Box 61.Haddonfield, NJ 08033
1 Dr. Arthur I. SiegelApplied Psychological Services404 East Lancaster AvenueWayne, PA 19087
1 Dr. C. Harold Stone1428 Virginia AvenueGlendale, CA 91202
1 Dr. David J. WeissUniversity of MinnesotaDepartment of PsychologyMinneapolis, MN 55455