
Form 6-K REPORT OF FOREIGN PRIVATE ISSUER PURSUANT TO … · Form 6-K REPORT OF FOREIGN PRIVATE...
139
UNITED STATES SECURITIES AND EXCHANGE COMMISSION Washington, D.C. 20549 Form 6-K REPORT OF FOREIGN PRIVATE ISSUER PURSUANT TO RULE 13a-16 OR 15d-16 UNDER THE SECURITIES EXCHANGE ACT OF 1934 For the month of July 2014 Commission File Number 1-15242 DEUTSCHE BANK CORPORATION (Translation of Registrant’s Name Into English) Deutsche Bank Aktiengesellschaft Taunusanlage 12 60325 Frankfurt am Main Germany (Address of Principal Executive Office) Indicate by check mark whether the registrant files or will file annual reports under cover of Form 20-F or Form 40-F: Form 20-F Form 40-F Indicate by check mark whether the registrant is submitting the Form 6-K in paper as permitted by Regulation S-T Rule 101(b)(1): Indicate by check mark whether the registrant is submitting the Form 6-K in paper as permitted by Regulation S-T Rule 101(b)(7):
Transcript of Form 6-K REPORT OF FOREIGN PRIVATE ISSUER PURSUANT TO … · Form 6-K REPORT OF FOREIGN PRIVATE...

UNITED STATES SECURITIES AND EXCHANGE COMMISSION
Washington, D.C. 20549
Form 6-K
REPORT OF FOREIGN PRIVATE ISSUER PURSUANT TO RULE 13a-16 OR 15d-16
UNDER THE SECURITIES EXCHANGE ACT OF 1934
For the month of July 2014
Commission File Number 1-15242
DEUTSCHE BANK CORPORATION (Translation of Registrant’s Name Into English)
Deutsche Bank Aktiengesellschaft Taunusanlage 12
60325 Frankfurt am Main Germany
(Address of Principal Executive Office)
Indicate by check mark whether the registrant files or will file annual reports under cover of Form 20-F or Form 40-F: Form 20-F ⌧ Form 40-F �
Indicate by check mark whether the registrant is submitting the Form 6-K in paper as permitted by Regulation S-T Rule 101(b)(1): �
Indicate by check mark whether the registrant is submitting the Form 6-K in paper as permitted by Regulation S-T Rule 101(b)(7): �

Explanatory note
This Report on Form 6-K contains the following exhibits. This Report on Form 6-K and the exhibits hereto are hereby incorporated by reference into Registration Statement No. 333-184193 of Deutsche Bank AG, except that the “Outlook” subsection of the “Management Report” section of the Interim Report (contained in Exhibit 99.1) is not so incorporated by reference.
Exhibit 99.1: The following sections of Deutsche Bank AG’s Interim Report as of June 30, 2014: “The Group at a Glance”, “Management Report”, the unaudited financial statements and “Other Information (unaudited)”.
Exhibit 99.2: Capitalization table of Deutsche Bank AG as of June 30, 2014.
Exhibit 99.3: Statement re: Computation of Ratio of Earnings to Fixed Charges of Deutsche Bank AG for the periods ended June 30, 2014, December 31, 2013, December 31, 2012, December 31, 2011, December 31, 2010 and December 31, 2009 (also incorporated as Exhibit 12.6 to Registration Statement No. 333-184193 of Deutsche Bank AG).
Exhibit 99.4: English Translation of Articles of Association of Deutsche Bank AG in conformity with the resolution of the Chairman’s Committee of the Supervisory Board on June 5, 2014 and the resolutions of the Annual General Meeting on May 22, 2014 (also incorporated as Exhibit 4.19 into Registration Statement No. 333-184193 of Deutsche Bank AG).
Forward-looking statements contain risks
This report contains forward-looking statements. Forward-looking statements are statements that are not historical facts; they include statements about our beliefs and expectations. Any statement in this report that states our intentions, beliefs, expectations or predictions (and the assumptions underlying them) is a forward-looking statement. These statements are based on plans, estimates and projections as they are currently available to the management of Deutsche Bank. Forward-looking statements therefore speak only as of the date they are made, and we undertake no obligation to update publicly any of them in light of new information or future events.
By their very nature, forward-looking statements involve risks and uncertainties. A number of important factors could therefore cause actual results to differ materially from those contained in any forward-looking statement. Such factors include the conditions in the financial markets in Germany, in Europe, in the United States and elsewhere from which we derive a substantial portion of our trading revenues, potential defaults of borrowers or trading counterparties, the implementation of our strategic initiatives, the reliability of our risk management policies, procedures and methods, and other risks referenced in our filings with the U.S. Securities and Exchange Commission. Such factors are described in detail in our 2013 Annual Report on Form 20-F, which was filed with the SEC on March 20, 2014, on pages 11 through 25 under the heading “Risk Factors.” Copies of this document are readily available upon request or can be downloaded from www.deutsche-bank.com/ir.
2

Use of Non-GAAP Financial Measures
This document and other documents we have published or may publish contain non-GAAP financial measures. Non-GAAP financial measures are measures of our historical or future performance, financial position or cash flows that contain adjustments which exclude or include amounts that are included or excluded, as the case may be, from the most directly comparable measure calculated and presented in accordance with IFRS in our financial statements. Examples of our non-GAAP financial measures, and the most directly comparable IFRS financial measures, are as follows:
For descriptions of these non-GAAP financial measures and the adjustments made to the most directly comparable IFRS financial measures to obtain them, please refer to the subsection “Other Information (unaudited)” of Exhibit 99.1 hereto. Additionally, as part of its balance sheet management, Deutsche Bank uses a fully loaded CRR/CRD 4 leverage ratio, which is described in the subsection “Management Report: Risk Report: Balance Sheet Management” of Exhibit 99.1 hereto.
For descriptions of non-GAAP financial measures with respect to earlier period data, please refer to pages 4 and 5 of our 2013 Annual Report on Form 20-F, which also describe where in the 2013 Annual Report on Form 20-F such non-GAAP financial measures are reconciled to the most directly comparable financial measures under IFRS.
3
Non-GAAP Financial Measure Most Directly Comparable IFRS Financial MeasureIBIT attributable to Deutsche Bank shareholders Income (loss) before income taxesAverage active equity Average shareholders’ equityPre-tax return on average active equity Pre-tax return on average shareholders’ equityPost-tax return on average active equity Post-tax return on average shareholders’ equityTangible book value Total shareholders’ equity (book value)Adjusted cost base Noninterest expensesIBIT attributable to Deutsche Bank shareholders (adjusted)
Income (loss) before income taxes
Cost-income ratio (adjusted)
Cost-income ratio (ratio of Noninterest expenses to Net Revenues)
Post-tax return on average active equity based on IBIT (adjusted)
Post-tax return on average shareholders’ equity
Pursuant to the requirements of the Securities Exchange Act of 1934, the registrant has duly caused this report to be signed on its behalf by the undersigned, thereunto duly authorized.
4
DEUTSCHE BANK AKTIENGESELLSCHAFTDate: July 29, 2014
By: /s/ Karin Dohm Name: Karin Dohm Title: Managing Director
By: /s/ Mathias Otto Name: Mathias Otto
Title: Managing Director and Senior Counsel

Exhibit 99.1
Deutsche Bank
The Group at a glance
The reconciliation of average active equity and related ratios is provided in the section “Other Information” of this Interim Report.
Due to rounding, numbers presented throughout this document may not add up precisely to the totals provided and percentages may not precisely reflect the absolute figures.
Deutsche Bank Interim Report as of June 30, 2014
Six months ended Jun 30, 2014 Jun 30, 2013 Share price at period end €€ 25.70 €€ 30.67 1
Share price high €€ 38.15 €€ 36.94 1
Share price low €€ 25.47 €€ 28.05 1
Basic earnings per share 2 €€ 1.20 €€ 1.96
Diluted earnings per share 2 €€ 1.17 €€ 1.90
Average shares outstanding, in m., basic 2 1,097 1,015
Average shares outstanding, in m., diluted 2 1,127 1,046
Pre-tax return on average shareholders’ equity 9.1 % 11.5 %
Pre-tax return on average active equity 9.2 % 11.6 %
Post-tax return on average shareholders’ equity 4.6 % 7.1 %
Post-tax return on average active equity 4.7 % 7.2 %
Cost/income ratio 3 81.0 % 77.1 %
Compensation ratio 4 39.0 % 38.3 %
Noncompensation ratio 5 42.0 % 38.7 %
in €€ m. Total net revenues 16,253 17,606
Provision for credit losses 496 828
Total noninterest expenses 13,159 13,572
Income before income taxes 2,597 3,206
Net income 1,341 1,995
in €€ bn. (unless stated otherwise) Jun 30, 2014 Dec 31, 2013 Total assets 1,665 1,611
Total shareholders’ equity 64.7 54.7
Book value per basic share outstanding €€ 46.62 €€ 50.80 2
Tangible book value per basic share outstanding €€ 36.45 €€ 37.87 2
Common Equity Tier 1 capital ratio 6 14.7 % 12.8 %
Tier 1 capital ratio 6 15.5 % 16.9 %
Number Branches 2,840 2,907
Thereof: in Germany 1,862 1,924
Employees (full-time equivalent) 96,733 98,254 Thereof: in Germany 45,442 46,377
1 To reflect the capital increase 2014, the historical share prices until and including June 5, 2014 (last trading day cum rights) have been adjusted with retroactive effectby multiplication with the correcting factor of 0.9538 (R-Factor).
2 All periods have been adjusted in order to reflect the effect of the bonus component of subscription rights issued in June 2014 in connection with the capital increase. 3 Total noninterest expenses as a percentage of total net interest income before provision for credit losses plus noninterest income. 4 Compensation and benefits as a percentage of total net interest income before provision for credit losses plus noninterest income. 5 Noncompensation noninterest expenses, which are defined as total noninterest expenses less compensation and benefits, as a percentage of total net interest income
before provision for credit losses plus noninterest income. 6 Capital ratios for June 30, 2014 are based upon transitional rules of the CRR/CRD 4 capital framework; prior periods are based upon Basel 2.5 rules excluding
transitional items pursuant to section 64h (3) of the German Banking Act. The capital ratios relate the respective capital to risk-weighted assets for credit, market andoperational risk.

Deutsche Bank Content 1Interim Report as of June 30, 2014

Management Report
Operating and Financial Review
Economic Environment
In the second quarter of 2014, global economic growth is projected to have picked up pace due to a greater economic momentum, not only in industrialized economies, but also in emerging market and developing countries. In the seven biggest industrialized countries, growth is expected to have risen to around 2 % on an annualized basis in the second quarter of 2014 in comparison to about stagnation in the first quarter.
The eurozone economy appears to have continued to grow moderately in the second quarter of 2014, representing the fifth consecutive quarter of positive growth following six quarters of contraction in which the eurozone economy shrank by nearly 1.5 %. Growth of the German economy is estimated to have slowed in the second quarter 2014, primarily due to a weather-related decline in the construction sector. In contrast, growth in the U.S. and Canada should have significantly recovered in the second quarter of 2014, after growth in the first quarter of 2014 had noticeably weakened due to adverse weather conditions. In the United Kingdom, growth is likely to have clearly risen. In Japan, however, the increase in value-added tax, which came into effect in April 2014, is expected to have significantly impacted growth, with the result that the Japanese economy probably shrank noticeably in the second quarter 2014.
For China’s economy the expectation is that growth was somewhat stronger in the second quarter 2014, driven to some extent by increased fiscal and monetary policy stimuli, whereas in Russia the results of the purchasing manager survey indicate a decline in economic activity in the same period.
For the Banking Industry, overall, the second quarter 2014 was characterized by a further gradual improvement in European financial markets. In lending business with corporate clients, the rate of decline in volumes slowed again. Loans to private households again fell slightly in comparison to the prior year. Sustained solid growth in private sector deposits helped to further reduce the credit overhang compared with the funding base. Germany again recorded an above-average development with corporate lending by and large on the same level as a year ago and retail loans have grown, driven by an increase in mortgages. Overall, confidence within the banks in the euro area and investor trust clearly continued to grow as total assets showed signs of stabilization in the second quarter 2014. Moreover, banks became more active in the bond market and borrowed more than in the two extraordinarily weak second quarters of 2012 and 2013 together. In addition, a number of banks strengthened their capital bases by issuing new shares.
In the U.S., on aggregate, lending growth remained high. That said, the rate of expansion of loans to companies, which had been the key driver to date, slowed considerably and the volume of residential mortgages remained stagnant. By contrast, growth accelerated in other categories, such as consumer loans and commercial mortgages. The recent sharp increase in deposits lost a bit of momentum.
In investment banking, origination volumes in the fixed-income segment recorded a moderate increase compared with previous year. However, debt trading posted a significant decline from what had already been a fairly weak level. On the equities side, issuance activity in the second quarter 2014 was very strong but trading volumes, again, were lower than in 2013. Finally, in the merger & acquisition business, the upward momentum increased and the quarter ended with one of the best results of all time: announced transactions reached a value of more than U.S.$ 1 trillion, a threshold that was last exceeded in 2006/07 and, prior to that, during the new economy bubble in 2000. Overall, in the underwriting and advisory business, European banks succeeded in winning back market share from their U.S. competitors in the first half of 2014, following losses last year.
Deutsche Bank Management Report 2Interim Report as of June 30, 2014 Operating and Financial Review
Economic Environment

In asset management, too, banks profited from new record highs of key equity indices such as the Dow Jones and the Dax, the leading German index, which broke the 10,000 barrier for the first time in June. Following major central banks’ announcements to maintain a sustained low-interest rate environment, the risk appetite of many investors is likely to have risen further.
With regard to changes in financial supervision and regulation, the focus in the second quarter of 2014 in Europe was on the adoption of the Single Resolution Mechanism (SRM) as part of the Banking Union, the adoption of the Bank Recovery and Resolution Directive (BRRD) and the European Central Bank’s Asset Quality Review in the run up to its assumption of the role of single supervisor for the euro area’s leading banks. In the U.S., further legal disputes, in some cases very costly, between the supervisory authorities and banks mainly dominated the headlines.
Deutsche Bank Performance
In May 2014, Deutsche Bank announced a package of measures to reinforce our commitment to the Strategy 2015+ targets. We have strengthened our capital base and have continued to implement the cultural and cost initiatives laid out in Strategy 2015+.
The key financial results for the Group in the first six months 2014 can be summarized as follows:
The financial Key Performance Indicators (KPIs) of the Group for the first six months are detailed in the table below:
Deutsche Bank Management Report 3Interim Report as of June 30, 2014 Operating and Financial Review
Deutsche Bank Performance
— Group net revenues were €€ 16.3 billion in the first six months 2014, down 8 % versus the first six months 2013; — Income before income taxes was €€ 2.6 billion, down 19 % as compared to the first six months 2013; — Net income decreased to €€ 1.3 billion in the first six months 2014, compared to €€ 2.0 billion in the first six
months 2013;
— Capital Requirements Regulation/Capital Requirements Directive 4 (CRR/CRD 4) fully loaded Common EquityTier 1 capital ratio was 11.5 % at the end of the first six months 2014;
— Fully loaded CRR/CRD 4 leverage ratio was 3.4 % at the end of the first six months 2014; — CRR/CRD 4 fully loaded risk-weighted assets were €€ 399 billion as of June 30, 2014.
Group Key Performance Indicators Jun 30, 2014 Jun 30, 2013 Post-tax return on average active equity (reported) 1 4.7 % 7.2 %
Post-tax return on average active equity (adjusted) 2 7.3 % 10.2 %
Cost/income ratio (reported) 3 81.0 % 77.1 %
Cost/income ratio (adjusted) 4 72.1 % 67.8 %
Cost savings 5 €€ 2.6 bn €€ 1.1 bn
Costs to achieve savings 6 €€ 2.4 bn €€ 1.1 bn
CRR/CRD 4 fully loaded Common Equity Tier 1 ratio 7 11.5 % 10.0 %
Fully loaded CRR/CRD 4 leverage ratio 8 3.4 %
1 Based on Net Income attributable to Deutsche Bank shareholders. 2 Based on Net Income attributable to Deutsche Bank shareholders, as adjusted for litigation, CtA, impairment of goodwill and intangible assets, other severances and
CRR/CRD4 Credit Valuation Adjustment (CVA)/Debt Valuation Adjustment (DVA)/Funding Valuation Adjustment (FVA). For further information, please refer to “Other Information: Non-GAAP Financial Measures” of this report.
3 Total noninterest expenses as a percentage of total net interest income before provision for credit losses plus noninterest income. 4 Based on noninterest expenses, adjusted for litigation, CtA, impairment of goodwill and intangible assets, policyholder benefits and claims, other severances and other
divisional specific cost one-offs; divided by reported revenues. For further information, please refer to “Other Information: Non-GAAP Financial Measures” of this report. 5 Cost savings resulting from the implementation of the OpEx program. 6 Costs to achieve (CtA) savings are costs which are directly required for the realisation of savings in the OpEx program. 7 The CRR/CRD 4 fully loaded Common Equity Tier 1 ratio represents our calculation of our Common Equity Tier 1 ratio without taking into account the transitional
provisions of CRR/CRD 4. Further detail on the calculation of this ratio is provided in the Risk Report. 8 The fully loaded CRR/CRD 4 leverage ratio represents our calculation following the publication of CRR/CRD 4 on June 27, 2013 as amended. Further detail on the
calculation of this ratio is provided in the Risk Report.

Consolidated Results of Operations
2014 to 2013 Three Months Comparison Results in the second quarter 2014 reflect a solid performance. Higher revenues in Deutsche Asset & Wealth Management (DeAWM) were offset by reduced net revenues from the Non-Core Operations Unit (NCOU), Private & Business Clients (PBC) and Corporate Banking & Securities (CB&S). Results in Global Transaction Banking (GTB) were substantially unchanged. Lower client investment activity exacerbated by continued low interest rates, lower portfolio revenues reflecting our de-risking strategy and a highly competitive environment are reflected in decreased revenues across most businesses. We made further progress in our Operational Excellence (OpEx) program, which focuses in 2014 on more complex initiatives. Cost reductions from the ongoing implementation of OpEx allowed us to counterbalance higher costs caused by increased regulatory requirements, and enabled us to continue to invest in integrating platforms and process enhancements.
Our net revenues in the second quarter 2014 decreased by 4 %, or €€ 355 million to €€ 7.9 billion, compared to €€ 8.2 billion in the second quarter 2013. In CB&S, revenues were €€ 3.5 billion, down €€ 46 million, or 1 %, versus the second quarter 2013. This was mainly attributable to Sales & Trading (equities), where revenues were down by €€ 88 million, or 11 %, resulting from weaker market volumes and challenging market conditions. PBC revenues were €€ 2.4 billion in the second quarter 2014, down €€ 81 million, or 3 %, compared to the second quarter 2013. The decrease was primarily driven by non-recurring items related to Postbank that occurred in the second quarter 2013. Revenues in GTB of €€ 1.0 billion were stable compared to the second quarter 2013. DeAWM revenues increased by €€ 93 million, or 9 %, to €€ 1.1 billion, versus the second quarter 2013, reflecting mark-to-market movements of policyholder positions in Abbey Life, largely offset in noninterest expenses. Excluding the impact of Abbey Life, revenues were unchanged from the prior year period. Revenues in the NCOU were negative €€ 44 million, a decrease by €€ 322 million in the second quarter 2014, mainly due to the realisation of €€ 314 million in accumulated losses triggered by the restructuring of Maher Terminals’ debt financing.
Provision for credit losses was €€ 250 million in the second quarter 2014, a decrease of €€ 224 million, or 47 %, compared to the same period 2013. This reduction primarily results from lower provisioning in NCOU, the ongoing good quality of the German retail market portfolio and the non-recurrence of the large single items recorded in our Core businesses in the second quarter 2013.
Noninterest expenses were €€ 6.7 billion in the second quarter, down €€ 257 million, or 4 %, compared to the second quarter 2013. Compensation and benefits, which amounted to €€ 3.0 billion, were down €€ 212 million, or 7 %, compared to the second quarter 2013. This primarily reflects lower performance related compensation, mainly in CB&S. General and administrative expenses of €€ 3.6 billion were stable compared to the second quarter 2013. The cost base was further reduced by the deconsolidation of BHF-BANK and benefits from the ongoing implementation of our OpEx program. However, in the second quarter 2014, similar to the prior quarter,
Deutsche Bank Management Report 4Interim Report as of June 30, 2014 Operating and Financial Review
Consolidated Results of Operations
Three months ended Six months ended in €€ m. (unless stated otherwise)
Jun 30, 2014
Jun 30, 2013
Absolute Change
Change in %
Jun 30, 2014
Jun 30, 2013
Absolute Change
Change in %
Net revenues:
Thereof:
CB&S 3,532 3,579 (46) (1) 7,608 8,126 (518) (6)
PBC 2,367 2,448 (81) (3) 4,843 4,833 10 0
GTB 1,035 1,036 (1) 0 2,062 2,070 (8) 0
DeAWM 1,134 1,041 93 9 2,201 2,285 (84) (4)
NCOU (44) 279 (322) N/M 30 719 (689) (96)
Total net revenues 7,860 8,215 (355) (4) 16,253 17,606 (1,353) (8)
Provision for credit losses 250 473 (224) (47) 496 828 (332) (40)
Noninterest expenses 6,693 6,950 (257) (4) 13,159 13,572 (413) (3)
Income before income taxes 917 792 126 16 2,597 3,206 (609) (19)
Income tax expense (benefit) 679 457 222 49 1,256 1,211 45 4
Net income 238 335 (97) (29) 1,341 1,995 (654) (33)
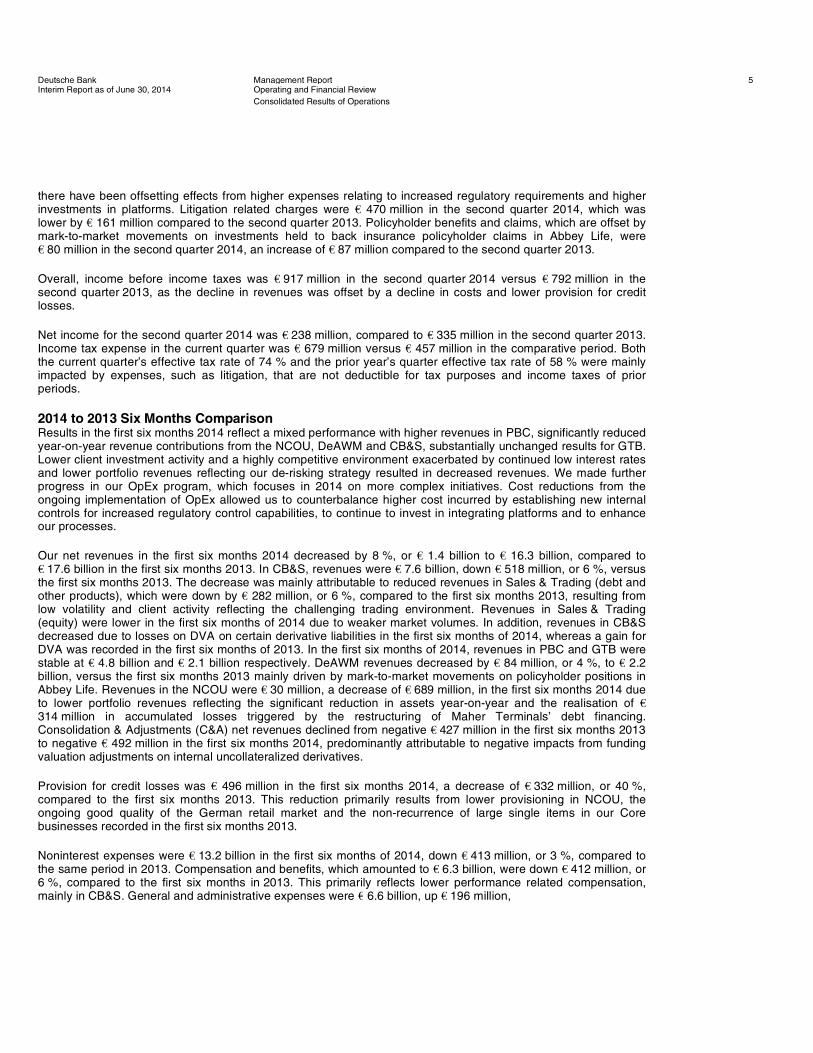
there have been offsetting effects from higher expenses relating to increased regulatory requirements and higher investments in platforms. Litigation related charges were €€ 470 million in the second quarter 2014, which was lower by €€ 161 million compared to the second quarter 2013. Policyholder benefits and claims, which are offset by mark-to-market movements on investments held to back insurance policyholder claims in Abbey Life, were €€ 80 million in the second quarter 2014, an increase of €€ 87 million compared to the second quarter 2013.
Overall, income before income taxes was €€ 917 million in the second quarter 2014 versus €€ 792 million in the second quarter 2013, as the decline in revenues was offset by a decline in costs and lower provision for credit losses.
Net income for the second quarter 2014 was €€ 238 million, compared to €€ 335 million in the second quarter 2013. Income tax expense in the current quarter was €€ 679 million versus €€ 457 million in the comparative period. Both the current quarter’s effective tax rate of 74 % and the prior year’s quarter effective tax rate of 58 % were mainly impacted by expenses, such as litigation, that are not deductible for tax purposes and income taxes of prior periods.
2014 to 2013 Six Months Comparison Results in the first six months 2014 reflect a mixed performance with higher revenues in PBC, significantly reduced year-on-year revenue contributions from the NCOU, DeAWM and CB&S, substantially unchanged results for GTB. Lower client investment activity and a highly competitive environment exacerbated by continued low interest rates and lower portfolio revenues reflecting our de-risking strategy resulted in decreased revenues. We made further progress in our OpEx program, which focuses in 2014 on more complex initiatives. Cost reductions from the ongoing implementation of OpEx allowed us to counterbalance higher cost incurred by establishing new internal controls for increased regulatory control capabilities, to continue to invest in integrating platforms and to enhance our processes.
Our net revenues in the first six months 2014 decreased by 8 %, or €€ 1.4 billion to €€ 16.3 billion, compared to €€ 17.6 billion in the first six months 2013. In CB&S, revenues were €€ 7.6 billion, down €€ 518 million, or 6 %, versus the first six months 2013. The decrease was mainly attributable to reduced revenues in Sales & Trading (debt and other products), which were down by €€ 282 million, or 6 %, compared to the first six months 2013, resulting from low volatility and client activity reflecting the challenging trading environment. Revenues in Sales & Trading (equity) were lower in the first six months of 2014 due to weaker market volumes. In addition, revenues in CB&S decreased due to losses on DVA on certain derivative liabilities in the first six months of 2014, whereas a gain for DVA was recorded in the first six months of 2013. In the first six months of 2014, revenues in PBC and GTB were stable at €€ 4.8 billion and €€ 2.1 billion respectively. DeAWM revenues decreased by €€ 84 million, or 4 %, to €€ 2.2 billion, versus the first six months 2013 mainly driven by mark-to-market movements on policyholder positions in Abbey Life. Revenues in the NCOU were €€ 30 million, a decrease of €€ 689 million, in the first six months 2014 due to lower portfolio revenues reflecting the significant reduction in assets year-on-year and the realisation of €€ 314 million in accumulated losses triggered by the restructuring of Maher Terminals’ debt financing. Consolidation & Adjustments (C&A) net revenues declined from negative €€ 427 million in the first six months 2013 to negative €€ 492 million in the first six months 2014, predominantly attributable to negative impacts from funding valuation adjustments on internal uncollateralized derivatives.
Provision for credit losses was €€ 496 million in the first six months 2014, a decrease of €€ 332 million, or 40 %, compared to the first six months 2013. This reduction primarily results from lower provisioning in NCOU, the ongoing good quality of the German retail market and the non-recurrence of large single items in our Core businesses recorded in the first six months 2013.
Noninterest expenses were €€ 13.2 billion in the first six months of 2014, down €€ 413 million, or 3 %, compared to the same period in 2013. Compensation and benefits, which amounted to €€ 6.3 billion, were down €€ 412 million, or 6 %, compared to the first six months in 2013. This primarily reflects lower performance related compensation, mainly in CB&S. General and administrative expenses were €€ 6.6 billion, up €€ 196 million,
Deutsche Bank Management Report 5Interim Report as of June 30, 2014 Operating and Financial Review
Consolidated Results of Operations

or 3 %, compared to the first half 2013. In the first six months of 2014 cost-to-achieve for our OpEx program increased, as planned. Expenses relating to regulatory requirements and for investments in platforms were higher than in the comparison period. Litigation-related charges of €€ 470 million in the first six months of 2014 were €€ 292 million below the same period in the last year. In addition, the cost base was further reduced by savings from our OpEx program and the deconsolidation of BHF-BANK. Policyholder benefits and claims, which are offset by mark-to-market movements on investments held to back insurance policyholder claims in Abbey Life, were €€ 132 million in the first half of 2014, a decrease of €€ 53 million compared to 2013.
Overall, income before income taxes was €€ 2.6 billion in the first six months 2014 versus €€ 3.2 billion in the first six months 2013, mainly driven by lower revenues.
Net income for the first six months 2014 was €€ 1.3 billion, compared to €€ 2.0 billion in the first six months 2013. Income tax expense in the first six months was €€ 1.3 billion versus €€ 1.2 billion in the first six months of 2013. The effective tax rate of 48 % in the first six months of 2014 was mainly impacted by expenses, such as litigation, that are not deductible for tax purposes and income taxes of prior periods. The effective tax rate in the comparative period was 38 %.
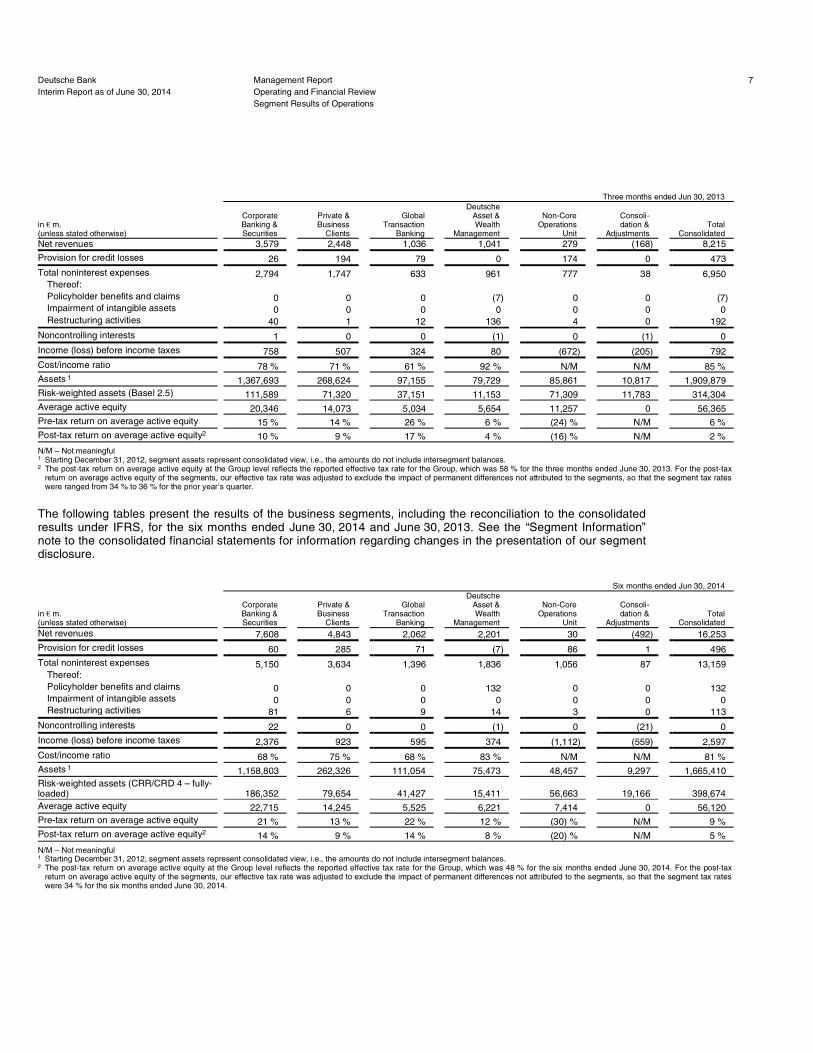
Segment Results of Operations
The following tables present the results of the business segments, including the reconciliation to the consolidated results under IFRS, for the three months ended June 30, 2014 and June 30, 2013. See the “Segment Information” note to the consolidated financial statements for information regarding changes in the presentation of our segment disclosure.
N/M – Not meaningful
Deutsche Bank Management Report 6Interim Report as of June 30, 2014 Operating and Financial Review
Segment Results of Operations
Three months ended Jun 30, 2014
in €€ m. (unless stated otherwise)
Corporate Banking &
Securities
Private & Business
Clients
Global Transaction
Banking
Deutsche Asset & Wealth
Management
Non-Core Operations
Unit
Consoli- dation &
Adjustments Total
Consolidated Net revenues 3,532 2,367 1,035 1,134 (44) (164) 7,860
Provision for credit losses 44 145 47 (6) 19 0 250
Total noninterest expenses 2,603 1,819 759 936 517 59 6,693 Thereof: Policyholder benefits and claims 0 0 0 80 0 0 80 Impairment of intangible assets 0 0 0 0 0 0 0 Restructuring activities 37 3 6 10 1 0 57
Noncontrolling interests 1 0 0 0 0 (1) 0
Income (loss) before income taxes 885 403 228 204 (580) (223) 917
Cost/income ratio 74% 77 % 73 % 83 % N/M N/M 85 %
Assets 1 1,158,803 262,326 111,054 75,473 48,457 9,297 1,665,410
Risk-weighted assets (CRR/CRD 4 – fully-loaded) 186,352 79,654 41,427 15,411 56,663 19,166 398,674
Average active equity 24,045 14,224 5,638 6,260 7,254 0 57,422
Pre-tax return on average active equity 15 % 11 % 16 % 13 % (32) % N/M 6 %
Post-tax return on average active equity2 9 % 7 % 10 % 8 % (21) % N/M 2 %
1 Starting December 31, 2012, segment assets represent consolidated view, i.e., the amounts do not include intersegment balances. 2 The post-tax return on average active equity at the Group level reflects the reported effective tax rate for the Group, which was 74 % for the three months ended June 30, 2014. For the post-tax
return on average active equity of the segments, our effective tax rate was adjusted to exclude the impact of permanent differences not attributed to the segments, so that the segment tax rates were ranged from 35 % to 36 % for the current quarter.
N/M – Not meaningful
The following tables present the results of the business segments, including the reconciliation to the consolidated results under IFRS, for the six months ended June 30, 2014 and June 30, 2013. See the “Segment Information” note to the consolidated financial statements for information regarding changes in the presentation of our segment disclosure.
N/M – Not meaningful
Deutsche Bank Management Report 7Interim Report as of June 30, 2014 Operating and Financial Review
Segment Results of Operations
Three months ended Jun 30, 2013
in €€ m. (unless stated otherwise)
Corporate Banking &
Securities
Private & Business
Clients
Global Transaction
Banking
Deutsche Asset & Wealth
Management
Non-Core Operations
Unit
Consoli- dation &
Adjustments Total
Consolidated Net revenues 3,579 2,448 1,036 1,041 279 (168) 8,215
Provision for credit losses 26 194 79 0 174 0 473
Total noninterest expenses 2,794 1,747 633 961 777 38 6,950 Thereof: Policyholder benefits and claims 0 0 0 (7) 0 0 (7) Impairment of intangible assets 0 0 0 0 0 0 0 Restructuring activities 40 1 12 136 4 0 192
Noncontrolling interests 1 0 0 (1) 0 (1) 0
Income (loss) before income taxes 758 507 324 80 (672) (205) 792
Cost/income ratio 78 % 71 % 61 % 92 % N/M N/M 85 %
Assets 1 1,367,693 268,624 97,155 79,729 85,861 10,817 1,909,879
Risk-weighted assets (Basel 2.5) 111,589 71,320 37,151 11,153 71,309 11,783 314,304
Average active equity 20,346 14,073 5,034 5,654 11,257 0 56,365
Pre-tax return on average active equity 15 % 14 % 26 % 6 % (24) % N/M 6 %
Post-tax return on average active equity2 10 % 9 % 17 % 4 % (16) % N/M 2 %
1 Starting December 31, 2012, segment assets represent consolidated view, i.e., the amounts do not include intersegment balances. 2 The post-tax return on average active equity at the Group level reflects the reported effective tax rate for the Group, which was 58 % for the three months ended June 30, 2013. For the post-tax
return on average active equity of the segments, our effective tax rate was adjusted to exclude the impact of permanent differences not attributed to the segments, so that the segment tax rates were ranged from 34 % to 36 % for the prior year’s quarter.
Six months ended Jun 30, 2014
in €€ m. (unless stated otherwise)
Corporate Banking &
Securities
Private & Business
Clients
Global Transaction
Banking
Deutsche Asset & Wealth
Management
Non-Core Operations
Unit
Consoli- dation &
Adjustments Total
Consolidated Net revenues 7,608 4,843 2,062 2,201 30 (492) 16,253
Provision for credit losses 60 285 71 (7) 86 1 496
Total noninterest expenses 5,150 3,634 1,396 1,836 1,056 87 13,159 Thereof: Policyholder benefits and claims 0 0 0 132 0 0 132 Impairment of intangible assets 0 0 0 0 0 0 0 Restructuring activities 81 6 9 14 3 0 113
Noncontrolling interests 22 0 0 (1) 0 (21) 0
Income (loss) before income taxes 2,376 923 595 374 (1,112) (559) 2,597
Cost/income ratio 68 % 75 % 68 % 83 % N/M N/M 81 %
Assets 1 1,158,803 262,326 111,054 75,473 48,457 9,297 1,665,410
Risk-weighted assets (CRR/CRD 4 – fully-loaded) 186,352 79,654 41,427 15,411 56,663 19,166 398,674
Average active equity 22,715 14,245 5,525 6,221 7,414 0 56,120
Pre-tax return on average active equity 21 % 13 % 22 % 12 % (30) % N/M 9 %
Post-tax return on average active equity2 14 % 9 % 14 % 8 % (20) % N/M 5 %
1 Starting December 31, 2012, segment assets represent consolidated view, i.e., the amounts do not include intersegment balances. 2 The post-tax return on average active equity at the Group level reflects the reported effective tax rate for the Group, which was 48 % for the six months ended June 30, 2014. For the post-tax
return on average active equity of the segments, our effective tax rate was adjusted to exclude the impact of permanent differences not attributed to the segments, so that the segment tax rates were 34 % for the six months ended June 30, 2014.

N/M – Not meaningful
Corporate Divisions
Corporate Banking & Securities Corporate Division (CB&S)
N/M – Not meaningful
Deutsche Bank Management Report 8Interim Report as of June 30, 2014 Operating and Financial Review
Corporate Divisions
Six months ended Jun 30, 2013
in €€ m. (unless stated otherwise)
Corporate Banking &
Securities
Private & Business
Clients
Global Transaction
Banking
Deutsche Asset & Wealth
Management
Non-Core Operations
Unit
Consoli- dation &
Adjustments Total
Consolidated Net revenues 8,126 4,833 2,070 2,285 719 (427) 17,606
Provision for credit losses 77 305 172 13 261 0 828
Total noninterest expenses 5,372 3,538 1,256 1,972 1,390 44 13,572 Thereof: Policyholder benefits and claims 0 0 0 185 0 0 185 Impairment of intangible assets 0 0 0 0 0 0 0 Restructuring activities 81 2 14 143 17 0 257
Noncontrolling interests 11 0 0 0 (1) (10) 0
Income (loss) before income taxes 2,666 990 642 300 (931) (460) 3,206
Cost/income ratio 66 % 73 % 61 % 86 % 193 % N/M 77 %
Assets 1 1,367,693 268,624 97,155 79,729 85,861 10,817 1,909,879
Risk-weighted assets (Basel 2.5) 111,589 71,320 37,151 11,153 71,309 11,783 314,304
Average active equity 19,659 13,672 4,809 5,590 11,393 0 55,122
Pre-tax return on average active equity 27 % 14 % 27 % 11 % (16) % N/M 12 %
Post-tax return on average active equity2 18 % 10 % 18 % 7 % (11) % N/M 7 %
1 Starting December 31, 2012, segment assets represent consolidated view, i.e., the amounts do not include intersegment balances. 2 The post-tax return on average active equity at the Group level reflects the reported effective tax rate for the Group, which was 38 % for the six months ended June 30, 2013. For the post-tax
return on average active equity of the segments, our effective tax rate was adjusted to exclude the impact of permanent differences not attributed to the segments, so that the segment tax rates were 34 % for the six months ended June 30, 2013.
Three months ended Six months ended in €€ m. (unless stated otherwise)
Jun 30, 2014
Jun 30, 2013
Absolute Change
Change in %
Jun 30, 2014
Jun 30, 2013
Absolute Change
Change in %
Net revenues:
Sales & Trading (debt and other products) 1,826 1,823 3 0 4,259 4,540 (282) (6)
Sales & Trading (equity) 698 787 (88) (11) 1,471 1,553 (82) (5)
Origination (debt) 416 417 0 0 774 870 (96) (11)
Origination (equity) 265 204 61 30 425 356 69 19
Advisory 130 116 15 13 237 185 52 28
Loan products 255 296 (42) (14) 509 546 (37) (7)
Other products (58) (64) 6 (9) (67) 75 (142) N/M
Total net revenues 3,532 3,579 (46) (1) 7,608 8,126 (518) (6)
Provision for credit losses 44 26 18 70 60 77 (17) (22)
Total noninterest expenses 2,603 2,794 (191) (7) 5,150 5,372 (221) (4) Thereof: Restructuring activities 37 40 (3) (8) 81 81 0 (1) Impairment of intangible assets 0 0 0 N/M 0 0 0 N/M
Noncontrolling interests 1 1 (1) (55) 22 11 11 100
Income before income taxes 885 758 127 17 2,376 2,666 (290) (11)
Post-tax return on average active equity (adjusted) 1 15 % 17 % 17 % 22 %
1 Based on Net Income (loss) after income taxes attributable to Deutsche Bank shareholders, as adjusted for litigation, CtA, impairment of goodwill and intangible assets, other severances and CVA / DVA / FVA. For further information, please refer to “Other Information: Non-GAAP Financial Measures” of this report.

2014 to 2013 Three Months Comparison CB&S reported solid revenues in the current quarter despite continued low volatility, client activity and a challenging market environment.
The second quarter 2014 net revenues were €€ 3.5 billion, a decrease of €€ 46 million or 1 % from the €€ 3.6 billion in the second quarter 2013. Net revenues included valuation adjustments relating to CVA, DVA and FVA totalling a loss of €€ 114 million (second quarter 2013: a loss of €€ 88 million).
Sales & Trading (debt and other products) net revenues were €€ 1.8 billion in the second quarter 2014, in line with the second quarter 2013. Revenues in Foreign Exchange were significantly lower than the prior year quarter due to lower volatility and reduced client activity. Revenues in Rates were lower than the prior year quarter driven by lower client activity. Revenues in RMBS and Flow Credit were significantly higher than the prior year quarter due to a challenging market environment in the prior year quarter. Revenues in Distressed Products were higher than the prior year quarter notably in the Europe region. Revenues in Credit Solutions were higher than the prior year quarter primarily driven by stronger market conditions. Revenues in Global Liquidity Management and Emerging Markets were both in line with the prior year quarter. Sales & Trading (debt and other products) net revenues included a mark-to-market loss of €€ 43 million (second quarter 2013: a loss of €€ 31 million) related to mitigating hedges for CRR/CRD 4 risk-weighted assets (RWA) arising on CVA.
Sales & Trading (equity) generated net revenues of €€ 698 million in the second quarter 2014, a decrease of €€ 88 million, or 11 %, compared to the second quarter 2013. Equity Trading revenues were lower than the prior year quarter driven by weaker market volumes. Equity Derivatives revenues were lower than the prior year quarter due to challenging market conditions. Prime Finance revenues were in line with the prior year quarter.
Origination and Advisory generated net revenues of €€ 811 million in the second quarter 2014, an increase of €€ 75 million, or 10 %, compared to the second quarter 2013. Revenues in Equity Origination were significantly higher than the prior year quarter driven by strong deal flow notably in the Europe region. Revenues in Advisory were higher than the prior year quarter reflecting increased market share. Debt Origination revenues were in line with the prior year quarter.
Loan products net revenues were €€ 255 million in the second quarter 2014, a decrease of €€ 42 million, or 14 %, compared to the second quarter 2013 reflecting lower revenues from lending related activity.
Net revenues from Other products were a loss of €€ 58 million in the second quarter 2014, in line with the second quarter 2013. Net revenues from other products included a loss of €€ 64 million (second quarter 2013: a loss of €€ 58 million) related to the impact of a DVA on certain derivative liabilities.
In provision for credit losses, CB&S recorded a net charge of €€ 44 million in the second quarter 2014, compared to a net charge of €€ 26 million in the second quarter 2013, due to increased provision taken in the Shipping portfolio.
Noninterest expenses decreased by €€ 191 million, or 7 % compared to the second quarter of 2013. The decrease is mainly due to lower performance based compensation and litigation charges, partly offset by the ongoing implementation of the Operational Excellence (OpEx) program and regulatory driven costs.
Second quarter 2014 income before income taxes was €€ 885 million, up €€ 127 million compared to the prior year quarter, mainly driven by a decrease in noninterest expenses. Adjusted post-tax return on average active equity of 15 % was lower versus 17 % in the prior year quarter, mainly due to higher average active equity in 2014 which offset an increase in adjusted income before income taxes.
Deutsche Bank Management Report 9Interim Report as of June 30, 2014 Operating and Financial Review
Corporate Divisions

2014 to 2013 Six Months Comparison CB&S reported solid revenues in the first half 2014 despite low volatility, client activity and a challenging market environment
The first half 2014 net revenues were €€ 7.6 billion, a decrease of €€ 518 million or 6 % from the €€ 8.1 billion in the first half 2013. Net revenues included valuation adjustments relating to CVA, DVA and FVA totalling a loss of €€ 106 million (first half 2013: a gain of €€ 49 million).
Sales & Trading (debt and other products) net revenues were €€ 4.3 billion in the first six months of 2014, a decrease of €€ 282 million from the first six months of 2013. Revenues in Foreign Exchange were significantly lower than the first six months of 2013 due to lower volatility and reduced client activity reflecting a challenging trading environment. Revenues in Global Liquidity Management were lower than the first six months of 2013 driven by a smaller portfolio and a one-off gain in the first six months of 2013. Revenues in Distressed Products were significantly higher than the first six months of 2013 notably in the Europe region. Revenues in RMBS were significantly higher than the first six months of 2013, as a challenging market environment in the first six months of the prior year was not repeated. Revenues were in line with the first six months of 2013 in Rates, Flow Credit, Credit Solutions and Emerging Markets. Sales & Trading (debt and other products) net revenues included a mark-to-market loss of €€ 15 million (first six months of 2013: a loss of €€ 16 million) related to mitigating hedges for CRR/ CRD 4 risk-weighted assets (RWA) arising on CVA and an FVA gain of €€ 17 million (first six months of 2013: nil).
Sales & Trading (equity) generated net revenues of €€ 1.5 billion in the first six months of 2014, a decrease of €€ 82 million from the first six months of 2013. Equity Trading revenues were lower than the first six months of 2013 driven by weaker market volumes. Equity Derivatives revenues were lower than the first six months of 2013 due to challenging market conditions. Prime Finance revenues were in line with the first six months of 2013.
Origination and Advisory generated net revenues of €€ 1.4 billion in the first six months of 2014, in line with the first six months of 2013. Revenues in Equity Origination were higher than the first six months of 2013 driven by strong deal flow notably in Europe region. Revenues in Advisory were higher than the first six months of 2013 reflecting increased market share. Debt Origination revenues were lower than first six months of 2013 driven by reduced issuance levels.
Loan products net revenues were €€ 509 million in the first six months of 2014, in line with the first six months of 2013 reflecting stable revenues from lending related activity.
Net revenues from Other products were €€ 67 million loss in the first six months of 2014, a decrease of €€ 142 million from the first six months of 2013. Net revenues from Other products included a loss of €€ 108 million (first six months of 2013: a gain of €€ 65 million) related to the impact of a DVA on certain derivative liabilities.
In provision for credit losses, CB&S recorded a net charge of €€ 60 million in the first six months of 2014, compared to a net charge of €€ 77 million in the first six months of 2013, due to decreased provisions taken in the Leveraged Finance portfolios.
Noninterest expenses decreased by €€ 221 million, or 4 % compared to the first six months of 2013. The decrease is mainly due to lower performance based compensation and litigation charges, partly offset by the ongoing implementation of the OpEx program and regulatory driven costs.
Deutsche Bank Management Report 10Interim Report as of June 30, 2014 Operating and Financial Review
Corporate Divisions

Income before income taxes was €€ 2.4 billion in the first half 2014, which was down €€ 290 million compared to first half 2013 result, as lower revenues were partially offset by a decrease in noninterest expenses. Adjusted post- tax return on average active equity was 17 % which is lower compared to 22 % in the same period in 2013, due to higher average active equity and a decrease in adjusted income before income taxes in the second quarter 2014.
Private & Business Clients Corporate Division (PBC)
N/M – Not meaningful
2014 to 2013 Three Months Comparison PBC performance continues to be affected by the low interest rate environment. In addition several specific items have impacted the results of the second quarters of both 2014 and 2013. In the current period, charges for loan processing fees triggered by a change in German legal practice in May 2014 had a negative impact. In the second quarter last year, several specific items had a material positive effect on income before income taxes. These included a partial release of a provision related to the Hua Xia Bank credit card cooperation as well as a partial release of loan loss allowances and certain positive one-off effects related to Postbank. Apart from this PBC’s result remained fairly stable compared to the prior year period.
Second quarter 2014 net revenues in PBC decreased by €€ 81 million, or 3 %, to €€ 2.4 billion, compared to the prior year quarter. The decrease in Other product revenues of €€ 100 million, or 53 %, was primarily driven by the aforementioned Postbank-related specific one-off items in the second quarter last year. Higher credit revenues of €€ 35 million, or 4 %, compared to the second quarter 2013 showed good growth momentum, reflecting
Deutsche Bank Management Report 11Interim Report as of June 30, 2014 Operating and Financial Review
Corporate Divisions
Three months ended Six months ended in €€ m. (unless stated otherwise)
Jun 30, 2014
Jun 30, 2013
Absolute Change
Change in %
Jun 30, 2014
Jun 30, 2013
Absolute Change
Change in %
Net revenues:
Global credit products 873 838 35 4 1,737 1,694 43 3
Deposits 748 757 (8) (1) 1,506 1,520 (14) (1)
Payments, cards & account products 247 252 (5) (2) 494 507 (13) (3)
Investment & insurance products 308 305 3 1 656 623 33 5
Postal and supplementary Postbank Services 104 108 (5) (4) 208 216 (8) (4)
Other products 88 188 (100) (53) 241 273 (31) (11)
Total net revenues 2,367 2,448 (81) (3) 4,843 4,833 10 0
Provision for credit losses 145 194 (49) (25) 285 305 (20) (6)
Total noninterest expenses 1,819 1,747 72 4 3,634 3,538 96 3 Thereof: Impairment of intangible assets 0 0 0 N/M 0 0 0 N/M
Noncontrolling interests 0 0 0 N/M 0 0 0 N/M
Income before income taxes 403 507 (104) (21) 923 990 (67) (7)
Breakdown of PBC by business
Private & Commercial Banking:
Net revenues 925 924 1 0 1,955 1,856 99 5
Provision for credit losses 19 36 (18) (49) 39 40 (1) (3)
Noninterest expenses 812 761 50 7 1,618 1,572 46 3
Income before income taxes 95 126 (32) (25) 298 244 54 22
Advisory Banking International:
Net revenues 538 528 11 2 1,070 1,035 35 3
Provision for credit losses 63 61 1 2 129 117 13 11
Noninterest expenses 312 262 49 19 648 553 95 17
Income before income taxes 164 204 (40) (20) 292 365 (73) (20)
Postbank: 1
Net revenues 904 997 (93) (9) 1,818 1,942 (124) (6)
Provision for credit losses 64 96 (32) (34) 117 148 (31) (21)
Noninterest expenses 696 723 (28) (4) 1,368 1,413 (45) (3)
Noncontrolling interests 0 0 0 N/M 0 0 0 N/M
Income before income taxes 145 177 (33) (18) 333 381 (48) (13)
1 Contains the major core business activities of Postbank AG as well as BHW and norisbank.

an increase in loan volumes and improved loan margins. Revenues from investments & insurance products increased slightly by €€ 3 million, or 1 %, reflecting a continuous increase on a year on year basis. Revenues from Deposit products declined slightly by €€ 8 million, or 1 %, compared to last year’s second quarter showing the success of PBC’s actions taken to mitigate the continued very challenging interest rate environment in Europe. Net revenues from Postal and supplementary Postbank Services declined by €€ 5 million, or 4 %, compared to the second quarter 2013, reflecting usual revenue fluctuations. The slight decrease in net revenues from Payments, cards & accounts by €€ 5 million, or 2 %, compared to the second quarter 2013 was caused by changes in regulatory requirements regarding payment fees.
Provision for credit losses decreased significantly by €€ 49 million, or 25 %, compared to the second quarter 2013 benefitting from the quality of PBC’s loan book in a benign economic environment in Germany. In the prior year, an additional credit of €€ 46 million was recorded in other interest income representing a partial release of loan loss allowances in Postbank as well as increases in the credit quality of Postbank loans recorded at fair value on initial consolidation by the Group.
Noninterest expenses increased by €€ 72 million, or 4 %, to €€ 1.8 billion, compared to the second quarter 2013. The cost increase is primarily driven by the aforementioned change in German legal practice in 2014 as well as by the above mentioned release of a provision related to the Hua Xia Bank credit card cooperation in second quarter last year. Excluding these specific items noninterest expenses showed a stable trend between current and prior year quarters. Incremental savings from efficiency measures and lower cost-to-achieve, both parts of our OpEx program, were offset by higher infrastructure expenses primarily reflecting increased regulatory requirements.
Income before income taxes decreased by €€ 104 million, or 21 %, compared to the second quarter 2013, mainly driven by specific items as mentioned above.
Invested assets increased by €€ 2 billion compared to March 31, 2014, mainly due to market appreciation and inflows primarily in securities.
2014 to 2013 Six Months Comparison PBC performance continues to be affected by the low interest rate environment. In addition, several specific items impacted the results of the first half years of both 2014 and 2013. The first quarter of 2014 was impacted by a subsequent gain in Private & Commercial Banking related to a business sale closed in a prior period. The second quarter of 2014 included charges for loan processing fees triggered by a change in German legal practice in May 2014. The first half of last year benefitted from a partial release of a provision related to the Hua Xia Bank credit card cooperation and a partial release of loan loss allowances in Postbank.
Net revenues in PBC increased by €€ 10 million, versus the first six months of 2013. Growth in revenues from Credit products of €€ 43 million, or 3 %, compared to the first half of 2013 was driven by increase in loan volumes and improved loan margins. Higher revenues from Investment & insurance products of €€ 33 million, or 5 %, compared to the first six months of prior year reflected an improved contribution of all business units showing good progress versus the first half of 2013. Net revenues from Other products decreased by €€ 31 million, or 11 %, compared to the first six months of 2013. The first half of 2014 included the above mentioned gain from a business sale closed in a prior period. This was more than offset, however, by decreased revenues related to Postbank nonoperating activities as well as a change in the accounting treatment of certain product-related expenses. Additionally, the first half of 2013 was positively impacted by a partial release of loan loss allowances in Postbank (reflected in Other product revenues as allowances were created prior to consolidation). Net revenues from Deposits decreased by €€ 14 million, or 1 %, compared to the first half of 2013, as a result of de-leveraging mainly in Postbank. Net revenues from Payments, cards & accounts decreased slightly by €€ 13 million, or 3 %, compared to the prior year period mainly caused by changes in regulatory requirements regarding payment fees. Net revenues from Postal and supplementary Postbank Services declined by €€ 8 million, or 4 %, compared to the first six months of 2013, reflecting usual revenue fluctuations.
Deutsche Bank Management Report 12Interim Report as of June 30, 2014 Operating and Financial Review
Corporate Divisions
Provision for credit losses decreased by €€ 20 million, or 6 %, versus the first half of 2013, benefitting from a favorable environment in Germany. In the prior year, an additional credit of €€ 60 million was recorded in other interest income representing a partial release of loan loss allowances in Postbank as well as increases in the credit quality of Postbank loans recorded at fair value on initial consolidation by the Group.
Noninterest expenses increased by €€ 96 million, or 3 %, compared to the first six months of 2013. The prior year period benefited from a release of a provision related to the Hua Xia Bank credit card cooperation whereas the current period had a negative impact related to the aforementioned change in German legal practice. Lower CtA were compensated by higher infrastructure expenses primarily due to increased regulatory requirements.
Income before income taxes decreased by €€ 67 million, or 7 %, compared to the first half of 2013, mainly driven by specific items as mentioned above.
Invested assets increased by €€ 4 billion versus December 31, 2013, due to €€ 2 billion net inflows, mainly in securities and additional market appreciation.
Global Transaction Banking Corporate Division (GTB)
N/M – Not meaningful
2014 to 2013 Three Months Comparison In the second quarter 2014, the challenging conditions in some GTB markets persisted with ongoing low interest rates, a highly competitive environment as well as difficult geopolitical circumstances. Income before income taxes was significantly impacted by a litigation-related charge.
In this environment, GTB’s net revenues showed a high resiliency and were stable compared to the prior year quarter. The second quarter 2013 included a gain from the sale of Deutsche Card Services. In Trade Finance as well as Trust & Securities Services, revenues increased due to strong volume growth. Revenues in Cash Management developed solidly in the aforementioned low interest rate environment.
Provision for credit losses was €€ 47 million in the second quarter 2014, compared to €€ 79 million in the second quarter 2013. The decrease is attributable to the non-recurrence of a single client credit event in Trade Finance that occurred in 2013.
Noninterest expenses increased by €€ 126 million, or 20 %, compared to the prior year quarter. This was primarily due to a litigation-related charge. Furthermore, investments in platforms to enable business growth and higher expenses to comply with regulatory requirements contributed to the increase. The second quarter 2014 included cost-to-achieve related to the OpEx program of €€ 32 million versus €€ 23 million in the second quarter 2013.
Income before income taxes decreased by €€ 95 million, or 29 %, compared to the second quarter 2013 due to a litigation-related charge.
Deutsche Bank Management Report 13Interim Report as of June 30, 2014 Operating and Financial Review
Corporate Divisions
Three months ended Six months ended in €€ m. (unless stated otherwise)
Jun 30, 2014
Jun 30, 2013
Absolute Change
Change in %
Jun 30, 2014
Jun 30, 2013
Absolute Change
Change in %
Net revenues:
Transaction services 1,035 1,036 (1) 0 2,062 2,070 (8) 0 Total net revenues 1,035 1,036 (1) 0 2,062 2,070 (8) 0
Provision for credit losses 47 79 (32) (41) 71 172 (101) (59)
Total noninterest expenses 759 633 126 20 1,396 1,256 140 11 Thereof: Restructuring activities 6 12 (5) (46) 9 14 (5) (36) Impairment of intangible assets 0 0 0 N/M 0 0 0 N/M
Noncontrolling interests 0 0 0 N/M 0 0 0 N/M
Income before income taxes 228 324 (95) (29) 595 642 (46) (7)

2014 to 2013 Six Months Comparison As mentioned above, the market environment remained challenging in the first six months 2014 with low interest rates, a competitive environment and difficult geopolitical conditions in some GTB markets. The first six months 2014 included a litigation-related charge.
Compared to the prior year period, net revenues decreased only marginally by €€ 8 million. The first six months 2014 included a gain on the sale of registrar services GmbH, while in the prior year period a gain from the sale of Deutsche Card Services was recorded. Revenues in Trade Finance benefitted from growing volumes. In Trust & Securities Services, revenues showed a solid development supported by strong volumes. Cash Management increasingly came under pressure, suffering from ongoing low interest rates.
Provision for credit losses was €€ 71 million in the first six months 2014, compared to €€ 172 million in the first six months 2013. The decrease is primarily attributable to the non-recurrence of a single client credit event in Trade Finance that occurred in 2013.
Noninterest expenses increased by €€ 140 million, or 11 %, compared to the prior year period. As mentioned above, the increase reflects a litigation related charge, investments in platforms to enable business growth as well as increased expenses to comply with regulatory requirements. Cost-to-achieve related to the OpEx program increased by €€ 21 million versus 2013.
Income before income taxes decreased by €€ 46 million, or 7 %, compared to the first six months 2013 due to a litigation-related charge more than offsetting lower provision for credit losses.
Deutsche Asset & Wealth Management Corporate Division (DeAWM)
N/M – Not meaningful
2014 to 2013 Three Months Comparison In the second quarter of 2014 DeAWM continued to benefit from higher equity markets as seen by increased management fees and other recurring revenues, driven by higher assets under management in comparison to the second quarter of 2013. DeAWM saw progression in the growth of its credit loan portfolio, with revenues and margins increasing while credit losses remain comparatively low. A fall in performance fees and reduced market volatility during the quarter have made conditions more challenging, with reduced client activity impacting trading revenues. Additionally, the prolonged low interest rate environment continued to challenge deposit revenue margins. DeAWM’s initiative to improve its operating and technology platform continued to deliver cost efficiencies.
Deutsche Bank Management Report 14Interim Report as of June 30, 2014 Operating and Financial Review
Corporate Divisions
Three months ended Six months ended in €€ m. (unless stated otherwise)
Jun 30, 2014
Jun 30, 2013
Absolute Change
Change in %
Jun 30, 2014
Jun 30, 2013
Absolute Change
Change in %
Net revenues:
Management Fees and other recurring revenues 642 596 46 8 1,255 1,192 63 5
Performance and trans. fees and other non recurring revenues 159 210 (51) (24) 343 417 (74) (18)
Net Interest Income 155 125 30 24 308 263 45 17
Other product revenues 98 123 (25) (20) 165 217 (52) (24)
Mark-to-market movements on policyholder positions in Abbey Life 80 (13) 93 N/M 130 196 (66) (34)
Total net revenues 1,134 1,041 93 9 2,201 2,285 (84) (4)
Provision for credit losses (6) 0 (7) N/M (7) 13 (20) N/M
Total noninterest expenses 936 961 (25) (3) 1,836 1,972 (137) (7) Thereof: Policyholder benefits and claims 80 (7) 87 N/M 132 185 (53) (29) Restructuring activities 10 136 (126) (93) 14 143 (129) (90) Impairment of intangible assets 0 0 0 N/M 0 0 0 N/M
Noncontrolling interests 0 (1) 0 (55) (1) 0 (1) N/M
Income before income taxes 204 80 124 154 374 300 74 25

In DeAWM, net revenues were €€ 1.1 billion in the second quarter 2014, an increase of €€ 93 million, or 9 %, compared to the second quarter 2013 mainly comprising of mark-to-market movements on policy holder positions in Abbey Life, largely offset by higher policyholder benefits and claims within non interest expenses.
Management Fees and other recurring revenues increased by €€ 46 million, or 8 %, due to an increase in the average assets under management for the quarter following positive flow and market effects. Performance and transaction fees and other non-recurring revenues were down €€ 51 million, or 24 % driven by lower performance fees in alternatives and active asset management, and lower transaction revenues from capital markets and foreign exchange products for private clients. Net interest income increased by €€ 30 million, or 24 %, due to increased lending volume and improved lending margins in the second quarter of 2014. Other product revenues decreased compared to the second quarter 2013 by €€ 25 million, or 20 % mainly due to reduced net gains on fair value changes. Mark-to-market movements on policyholder positions in Abbey Life increased by €€ 93 million, versus second quarter 2013.
Provision for credit losses decreased by €€ 7 million compared to the second quarter 2013 mainly resulting from lower specific client lending provisions and recovery of prior losses in the second quarter 2014.
Noninterest expenses of €€ 936 million in the second quarter 2014 decreased by €€ 25 million, or 3 %, compared to the second quarter 2013 driven by lower costs-to-achieve related to OpEx offset by higher policyholder benefits and claims and litigation.
Income before income taxes was €€ 204 million in the second quarter 2014, an increase of €€ 124 million, or 154 %, compared to the second quarter 2013. This reflects decreased cost-to-achieve related to OpEx and reduced costs following continued progress on integration.
In the second quarter 2014, invested assets were €€ 955 billion as of June 30¸ 2014, an increase of €€ 21 billion versus March 31, 2014, mainly driven by market appreciation of €€ 16 billion and inflows of €€ 11 billion. Net inflows of €€ 11 billion were recorded across all products, with strong flows in both retail and institutional business.
2014 to 2013 Six Months Comparison In the first six months of 2014 DeAWM continued to benefit from higher equity markets whilst seeing progression in the growth of its credit loan portfolio. This has been offset by lower performance fees and reduced client activity which have impacted trading revenue. Costs excluding restructuring activities and insurance policyholder claims in Abbey Life have been positively impacted by ongoing OpEx measures.
In DeAWM net revenues in the first six months of 2014 decreased by €€ 84 million, or 4 %, compared to the first six months of 2013. Management Fees and other recurring revenues increased by €€ 63 million, or 5 %, due to an increase of the average assets under management driven by positive flow and market effect. Performance and transaction fees and other non-recurring revenues were down €€ 74 million, or 18 % driven by lower performance fees in alternatives and lower transaction revenues from capital markets and foreign exchange products for private clients. Net interest income increased by €€ 45 million, or 17 %, due to increased lending volume and improved lending margins. Other product revenues decreased compared to the first six months of 2013 by €€ 52 million, or 24 % mainly due to reduced net gains on fair value changes. Mark-to-market movements on policyholder positions in Abbey Life decreased by €€ 66 million, or 34 % versus first six months of 2013.
Deutsche Bank Management Report 15Interim Report as of June 30, 2014 Operating and Financial Review
Corporate Divisions
Provision for credit losses decreased by €€ 20 million compared to the first six months of 2013 mainly resulting from lower specific client lending provisions and recovery of prior losses in the second quarter 2014.
Noninterest expenses of €€ 1.8 billion in the six months of 2014 decreased by €€ 137 million, or 7 %, compared to the first six months 2013 driven by lower policyholder benefits and lower costs-to-achieve related to OpEx.
Income before income taxes was €€ 374 million in the first six months of 2014, an increase of €€ 74 million, or 25 %, compared to the first six months of 2013, mainly due to lower interest expenses.
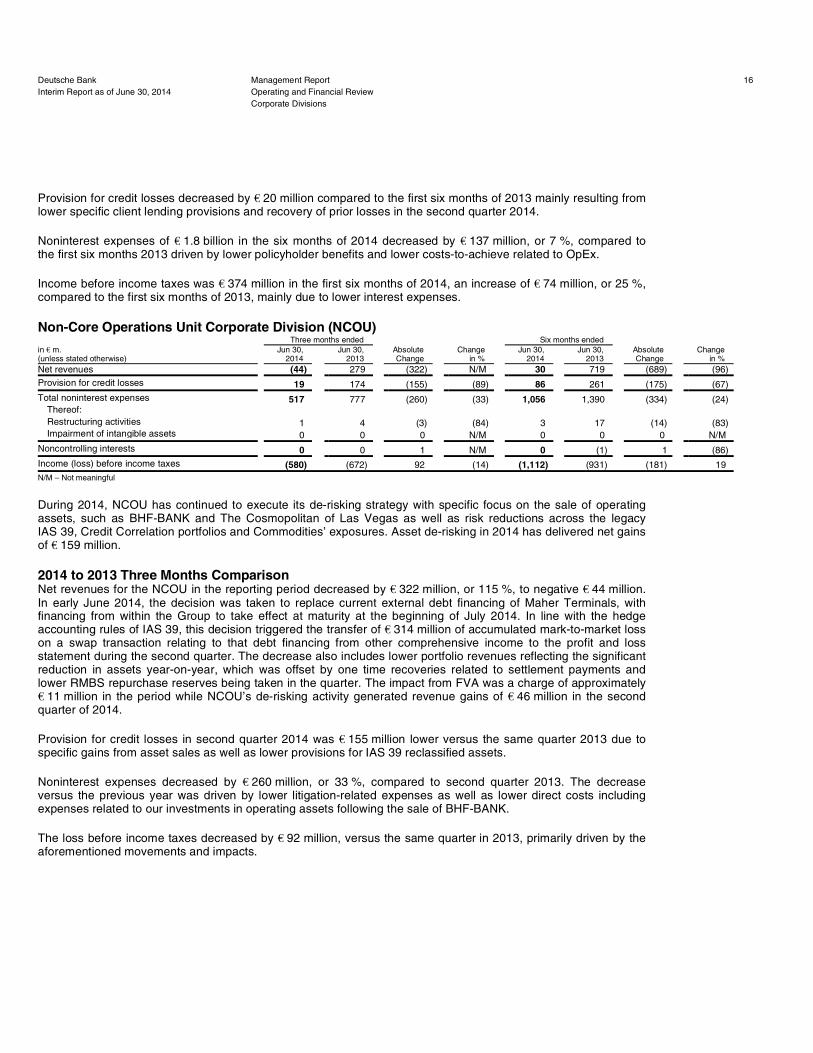
Non-Core Operations Unit Corporate Division (NCOU)
N/M – Not meaningful
During 2014, NCOU has continued to execute its de-risking strategy with specific focus on the sale of operating assets, such as BHF-BANK and The Cosmopolitan of Las Vegas as well as risk reductions across the legacy IAS 39, Credit Correlation portfolios and Commodities’ exposures. Asset de-risking in 2014 has delivered net gains of €€ 159 million.
2014 to 2013 Three Months Comparison Net revenues for the NCOU in the reporting period decreased by €€ 322 million, or 115 %, to negative €€ 44 million. In early June 2014, the decision was taken to replace current external debt financing of Maher Terminals, with financing from within the Group to take effect at maturity at the beginning of July 2014. In line with the hedge accounting rules of IAS 39, this decision triggered the transfer of €€ 314 million of accumulated mark-to-market loss on a swap transaction relating to that debt financing from other comprehensive income to the profit and loss statement during the second quarter. The decrease also includes lower portfolio revenues reflecting the significant reduction in assets year-on-year, which was offset by one time recoveries related to settlement payments and lower RMBS repurchase reserves being taken in the quarter. The impact from FVA was a charge of approximately €€ 11 million in the period while NCOU’s de-risking activity generated revenue gains of €€ 46 million in the second quarter of 2014.
Provision for credit losses in second quarter 2014 was €€ 155 million lower versus the same quarter 2013 due to specific gains from asset sales as well as lower provisions for IAS 39 reclassified assets.
Noninterest expenses decreased by €€ 260 million, or 33 %, compared to second quarter 2013. The decrease versus the previous year was driven by lower litigation-related expenses as well as lower direct costs including expenses related to our investments in operating assets following the sale of BHF-BANK.
The loss before income taxes decreased by €€ 92 million, versus the same quarter in 2013, primarily driven by the aforementioned movements and impacts.
Deutsche Bank Management Report 16Interim Report as of June 30, 2014 Operating and Financial Review
Corporate Divisions
Three months ended Six months ended in €€ m. (unless stated otherwise)
Jun 30, 2014
Jun 30, 2013
Absolute Change
Change in %
Jun 30, 2014
Jun 30, 2013
Absolute Change
Change in %
Net revenues (44) 279 (322) N/M 30 719 (689) (96)
Provision for credit losses 19 174 (155) (89) 86 261 (175) (67)
Total noninterest expenses 517 777 (260) (33) 1,056 1,390 (334) (24) Thereof: Restructuring activities 1 4 (3) (84) 3 17 (14) (83) Impairment of intangible assets 0 0 0 N/M 0 0 0 N/M
Noncontrolling interests 0 0 1 N/M 0 (1) 1 (86)
Income (loss) before income taxes (580) (672) 92 (14) (1,112) (931) (181) 19

2014 to 2013 Six Months Comparison Net revenues in the NCOU were €€ 689 million, or 96 %, lower in the first half 2014 compared to the first half of 2013 primarily due to lower portfolio revenues reflecting the significant reduction in assets year-on-year. In early June 2014, the decision was taken to replace current external debt financing of Maher Terminals, with financing from within the Group. In line with the hedge accounting rules of IAS 39, this decision triggered the transfer of €€ 314 million of accumulated mark-to-market loss on a swap transaction relating to that debt financing from other comprehensive income to the profit and loss statement during the second quarter. The impact from FVA was a net release of approximately €€ 21 million in the period versus no impact in the first six months of 2013.
Provision for credit losses for the first six months of 2014 was down €€ 175 million, or 67 % compared to the first six months of 2013, predominantly driven by lower credit losses for IAS 39 reclassified assets and a specific gain from asset sales realised in the second quarter.
Noninterest expenses for the first six months of 2014 were €€ 1.1 billion, a decrease of €€ 334 million or 24 % when compared to the same period in 2013, mainly driven by lower litigation-related expenses as well as the positive cost impacts from execution of our de-risking strategy, such as lower expenses related to our investments in operating assets following the sale of BHF-BANK. This was partly offset by an impairment of €€ 57 million taken in the current year.
The loss before income taxes increased by €€ 181 million versus the first half of the prior year, with each period having been impacted by a number of different factors as described above.
Consolidation & Adjustments (C&A)
N/M – Not meaningful
2014 to 2013 Three Months Comparison Loss before income taxes in C&A was €€ 223 million in the second quarter 2014, compared to a loss of €€ 205 million in the prior year quarter. This development was predominantly attributable to negative €€ 26 million of FVA in the second quarter 2014 on internal uncollateralized derivatives between Treasury and CB&S. In addition, higher costs related to regulatory requirements also contributed to the higher loss before income taxes. Valuation & timing differences remained virtually unchanged compared to the second quarter 2013.
2014 to 2013 Six Months Comparison Loss before income taxes in C&A was €€ 559 million in the first half 2014, compared to a loss of €€ 460 million in the prior year first half. This development was predominantly attributable to negative €€ 120 million of FVA in the first half 2014 on internal uncollateralized derivatives between Treasury and CB&S. Additionally, valuation & timing differences were negative €€ 146 million in the first half 2014 compared to negative €€ 168 million for the first half 2013, due to effects related to shifts of the euro and U.S. dollar interest rate curves and widened credit spreads.
Deutsche Bank Management Report 17Interim Report as of June 30, 2014 Operating and Financial Review
Corporate Divisions
Three months ended Six months ended in €€ m. (unless stated otherwise)
Jun 30, 2014
Jun 30, 2013
Absolute Change
Change in %
Jun 30, 2014
Jun 30, 2013
Absolute Change
Change in %
Net revenues (164) (168) 3 (2) (492) (427) (65) 15
Provision for credit losses 0 0 0 N/M 1 0 1 N/M
Noninterest expenses 59 38 21 56 87 44 44 100
Noncontrolling interests (1) (1) 0 21 (21) (10) (11) 104
Income (loss) before income taxes (223) (205) (18) 9 (559) (460) (98) 21

Financial Position
Movements in Assets The overall increase of €€ 54 billion (or 3 %) as of June 30, 2014, compared to December 31, 2013, was primarily driven by a €€ 56 billion growth in brokerage and securities related receivables, following the seasonality pattern we typically observe of lower year-end levels versus higher volumes over the course of the year.
Loans increased by €€ 11 billion, with exposure increases in CB&S and GTB partly being offset by managed reductions in our NCOU.
Cash and due from banks as well as interest-earning deposits with banks increased in the same period by €€ 4 billion and €€ 6 billion, respectively. This was primarily driven by deposit growth and proceeds from our recent equity issuances.
These increases were partially offset by a €€ 20 billion reduction in positive market values from derivative financial instruments during the same period, primarily related to foreign exchange and equity products.
Foreign exchange rate movements (included in the figures above), in particular the strengthening of the Pound Sterling, the US dollar, the Japanese yen and the Australian dollar versus the euro, contributed €€ 12 billion to the increase of our balance sheet in the first six months of 2014.
Deutsche Bank Management Report 18Interim Report as of June 30, 2014 Operating and Financial Review
Financial Position
in €€ m. (unless stated otherwise) Jun 30, 2014 Dec 31, 2013
Absolute Change
Change in %
Cash and due from banks 21,096 17,155 3,942 23
Interest-earning deposits with banks 84,076 77,984 6,092 8
Central bank funds sold, securities purchased under resale agreements and securities borrowed 53,974 48,232 5,742 12
Trading assets 210,991 210,070 921 0
Positive market values from derivative financial instruments 484,769 504,590 (19,821) (4)
Financial assets designated at fair value through profit or loss 176,139 184,597 (8,457) (5) Thereof: Securities purchased under resale agreements 108,945 116,764 (7,819) (7) Securities borrowed 32,932 32,485 447 1
Loans 387,901 376,582 11,319 3
Brokerage and securities related receivables 138,815 83,185 55,630 67
Remaining assets 107,648 109,006 (1,358) (1)
Total assets 1,665,410 1,611,400 54,010 3
Deposits 537,309 527,750 9,559 2
Central bank funds purchased, securities sold under repurchase agreements and securities loaned 17,383 15,686 1,697 11
Trading liabilities 51,989 55,804 (3,815) (7)
Negative market values from derivative financial instruments 471,922 483,428 (11,507) (2)
Financial liabilities designated at fair value through profit or loss 97,561 90,104 7,456 8 Thereof: Securities sold under repurchase agreements 79,971 73,642 6,329 9 Securities loaned 1,897 1,249 647 52
Other short-term borrowings 56,623 59,767 (3,144) (5)
Long-term debt 140,536 133,082 7,453 6
Brokerage and securities related payables 161,365 118,992 42,373 36
Remaining liabilities 62,323 71,821 (9,497) (13)
Total liabilities 1,597,009 1,556,434 40,575 3
Total equity 68,401 54,966 13,434 24

Movements in Liabilities As of June 30, 2014, total liabilities increased by €€ 41 billion (or 3 %) compared to year-end 2013.
Brokerage and securities related payables were up €€ 42 billion compared to December 31, 2013, while negative market values from derivative financial instruments declined by €€ 12 billion, primarily due to the same reasons driving the movements in brokerage and securities related receivables and positive market values from derivative financial instruments as outlined above.
Deposits were up by €€ 10 billion, driven by increases in our funding through transaction banking and, to a lesser extent, unsecured wholesale.
Central bank funds purchased, securities sold under repurchase agreements and securities loaned, under both accrual and fair value accounting, have increased by €€ 9 billion in total, primarily stemming from increased client activity and term secured financing of CB&S inventory.
Long-term debt increased by €€ 7 billion, primarily from higher funding activities which exceeded the amount of debt that matured in the first half of the year.
Liquidity Liquidity reserves amounted to €€ 199 billion as of June 30, 2014 (compared with €€ 196 billion as of December 31, 2013), which generated a positive liquidity stress result as of June 30, 2014 (under the combined scenario).
Equity Total equity as of June 30, 2014 increased by €€ 13.4 billion compared to December 31, 2013. The main factors contributing to this development were a capital increase of €€ 8.5 billion from the issuance of 359.8 million new common shares in June 2014 and the issuance of new additional equity components (Additional Tier 1 securities, treated as equity according to IFRS) of €€ 3.5 billion on May 20, 2014. Further contributing to the increase were net income attributable to Deutsche Bank shareholders of €€ 1.3 billion and unrealized net gains on financial assets available for sale of €€ 496 million, which mainly resulted from improved market prices of debt securities from European issuers. Partly offsetting were cash dividends paid to Deutsche Bank shareholders of €€ 765 million.
Regulatory Capital Starting January 1, 2014, the calculation of our regulatory capital and capital ratios incorporates the capital requirements following the Capital Requirements Regulation and Capital Requirements Directive 4, subject to certain transitional rules. Therefore when referring to the results according to the transitional rules we use the term “CRR/CRD 4”. When referring to the results according to the full application of the final envisaged framework we use the term “CRR/CRD 4 fully loaded”. In some cases, CRR/CRD 4 left in place unchanged transitional rules that had been adopted in earlier capital adequacy frameworks through Basel 2.5 regarding the risk weighting of certain categories of assets. These include rules permitting the grandfathering of equity investments at a risk-weight of 100 % and allowing the selection of the greater position of long and short positions as the basis for measurement in the Market Risk Standardized Approach rather than the sum of both long and short positions. In these cases, our CRR/CRD 4 methodology assumes that the impact of the expiration of these transitional rules will be mitigated through sales of the underlying assets or other measures prior to the expiration of the grandfathering provisions.
Tier 1 capital according to CRR/CRD 4 as of June 30, 2014 was €€ 62.3 billion, €€ 10.6 billion higher than at the end of 2013, resulting in a CRR/CRD 4 Tier 1 capital ratio of 15.5 % as of June 30, 2014, up from 14.6 % at December 31, 2013. Common Equity Tier 1 capital according to CRR/CRD 4 increased in the first six months of 2014 by €€ 7.1 billion to €€ 58.8 billion, resulting in a CRR/CRD 4 Common Equity Tier 1 capital ratio of 14.7 % as of June 30, 2014, compared with 14.6 % at the end of 2013.
Deutsche Bank Management Report 19Interim Report as of June 30, 2014 Operating and Financial Review
Financial Position

The increase in our Tier 1 capital in the first half of 2014 resulted mainly from a capital increase from authorized capital against cash contributions with gross proceeds of €€ 8.5 billion and the placement of CRR/CRD 4 compliant Additional Tier 1 Notes (the “AT1 Notes”) with an equivalent value of €€ 3.5 billion, both transactions completed in the second quarter of 2014. Our net income attributable to Deutsche Bank Shareholders of €€ 1.3 billion in the first half of 2014, decreased by our dividend accrual of €€ 541 million, also contributed to the increase. These increases were partially offset by the derecognition of a further 10 % of our Legacy Hybrid Tier 1 instruments that are being phased out during the transitional period with a value of €€ 1.3 billion per year. We saw further negative impacts on our Tier 1 capital and Common Equity Tier 1 capital as a result of capital deductions that are being phased in at a rate of 20 % per year, including a deduction of deferred tax assets of €€ 528 million and a deduction of defined benefit pension fund assets of €€ 151 million. These amounts were not deducted at year-end 2013. Common Equity Tier 1 capital and Tier 1 capital were also negatively impacted by an adjustment made to an asset in the NCOU.
Our fully loaded CRR/CRD 4 Tier 1 capital as of June 30, 2014 was €€ 49.4 billion, €€ 15.4 billion higher than at year end 2013, resulting in a fully loaded CRR/CRD 4 Tier 1 capital ratio of 12.4 % as of June 30, 2014, up from 9.7 % at December 31, 2013. Our fully loaded CRR/CRD 4 Common Equity Tier 1 capital increased in the first six months of 2014 by €€ 12.0 billion to €€ 46.0 billion, resulting in a fully loaded CRR/CRD 4 Common Equity Tier 1 capital ratio of 11.5 % as of June 30, 2014, compared with 9.7 % at the end of 2013.
The main increasing impact on Tier 1 capital came from the two capital issuance transactions in the first half of 2014 with a total volume of €€ 12.0 billion, therein €€ 8.5 billion in Common Equity Tier 1 capital. The increasing effects from the authorized capital issuance had in addition a boosting effect on our Common Equity Tier 1 capital related thresholds resulting in a decrease of threshold dependent deductions.
Risk-weighted assets according to CRR/CRD 4 were €€ 401 billion as of June 30, 2014, €€ 101 billion (33.6 %) higher than at the end of 2013 according to Basel 2.5 rules, largely reflecting the impact of the CRR/CRD 4 framework as well as technical impacts from the aforementioned capital increases. Risk-weighted assets for credit risk increased in the first half 2014 by €€ 39.5 billion, mainly driven by the implementation of the CRR/CRD 4 framework. Additionally, the new calculation of risk-weighted assets for the CVA according to the CRR/CRD 4 framework added €€ 21.3 billion to the overall increase. Risk-weighted assets for market risk increased by €€ 32.7 billion mainly driven by the inclusion of former capital deduction items for higher risk securitization position into the risk-weighted asset calculation according to the CRR/CRD 4 framework. The overall RWA increase of €€ 7.3 billion for operational risk was mainly driven by our proactive, early recognition of enhancements to our Advanced Measurement Approach (AMA) model which led to additional RWA of €€ 7.7 billion. The increase was partly offset by loss profile changes (€€ 241 million reduction) and acquisitions and disposals due to the integration of DB Investment Services into our AMA model as of the first half of the year 2014 resulting in a RWA reduction of €€ 109 million.
Amendments to IAS 39 and IFRS 7, “Reclassification of Financial Assets” As of June 30, 2014 and December 31, 2013 the carrying value of reclassified assets was €€ 7.9 billion and €€ 8.6 billion, respectively, compared with a fair value of €€ 7.8 billion and €€ 8.2 billion as of June 30, 2014 and December 31, 2013, respectively. These assets are held in the NCOU.
Please refer to the note “Amendments to IAS 39 and IFRS 7, “Reclassification of Financial Assets”” for additional information on these assets and on the impact of their reclassification.
Deutsche Bank Management Report 20Interim Report as of June 30, 2014 Operating and Financial Review
Financial Position

Exposure to Monoline Insurers The following is an update on the development of protection purchased from monoline insurers.
Monoline exposure related to U.S. residential mortgages
Other Monoline exposure
Related Party Transactions
We have business relationships with a number of companies in which we own significant equity interests. We also have business relationships with a number of companies where members of our Management Board hold positions on boards of directors or non-executive boards. Our business relationships with these companies cover many of the financial services we provide to our clients generally. For more detailed information, please refer to the section “Other Financial Information” of this Interim Report.
Deutsche Bank Management Report 21Interim Report as of June 30, 2014 Operating and Financial Review
Related Party Transactions
Jun 30, 2014 Dec 31, 2013
in €€ m. Notional amount
Value prior to CVA 1 CVA 1
Fair value after CVA 1
Notional amount
Value prior to CVA 1 CVA 1
Fair value after CVA 1
AA Monolines: 2 Other subprime 86 23 (4) 20 94 29 (5) 23 Alt-A 2,148 716 (83) 633 2,256 768 (105) 663
Total AA Monolines 3 2,235 740 (87) 653 2,350 797 (110) 686
1 For monolines with actively traded CDS, the Credit Valuation Adjustment (CVA) is calculated using a full CDS-based valuation model. For monolines without actively traded CDS, a model-based approach is used with various input factors, including relevant market driven default probabilities, the likelihood of an event (either a restructuring or an insolvency), an assessment of any potentialsettlement in the event of a restructuring, and recovery rates in the event of either restructuring or insolvency. The monolines CVA methodology is reviewed on a quarterly basis by management.
2 Ratings are the lowest of Standard & Poor’s, Moody’s or our own internal credit ratings. 3 A portion of the mark-to-market monoline exposure has been mitigated with CDS protection arranged with other market counterparties and other economic hedge activity.
Jun 30, 2014 Dec 31, 2013
in €€ m. Notional amount
Value prior to CVA 1 CVA 1
Fair value after CVA 1
Notional amount
Value prior to CVA 1 CVA 1
Fair value after CVA 1
AA Monolines: 2 TPS-CLO 1,286 257 (32) 225 1,512 298 (41) 257 CMBS 923 (2) 0 (2) 1,030 (3) 0 (3) Student loans 286 0 0 0 285 0 0 0 Other 458 54 (6) 48 511 69 (7) 62
Total AA Monolines 2,952 308 (37) 271 3,338 364 (48) 316
Non Investment-Grade Monolines: 2
TPS-CLO 323 64 (9) 56 353 67 (8) 58 CMBS 1,339 (2) 0 (2) 1,444 7 0 6 Corporate single name/Corporate CDO 24 4 0 4 0 0 0 0 Student loans 607 55 (4) 51 604 116 (11) 105 Other 718 94 (31) 63 827 90 (31) 60
Total Non Investment-Grade Monolines 3,012 216 (44) 172 3,228 280 (50) 229
Total 3,4 5,965 524 (81) 443 6,566 644 (98) 545
1 For monolines with actively traded CDS, the Credit Valuation Adjustment (CVA) is calculated using a full CDS-based valuation model. For monolines without actively traded CDS, a model-based approach is used with various input factors, including relevant market driven default probabilities, the likelihood of an event (either a restructuring or an insolvency), an assessment of any potentialsettlement in the event of a restructuring, and recovery rates in the event of either restructuring or insolvency. The monolines CVA methodology is reviewed on a quarterly basis by management.
2 Ratings are the lowest of Standard & Poor’s, Moody’s or our own internal credit ratings. 3 Excludes counterparty exposure to monoline insurers that relates to wrapped bonds of €€ 18 million as of June 30, 2014, and €€ 15 million as of December 31, 2013, which represents an estimate of
the potential mark-downs of wrapped assets in the event of monoline defaults. 4 A portion of the mark-to-market monoline exposure has been mitigated with CDS protection arranged with other market counterparties and other economic hedge activity.

Management and Supervisory Board
Effective July 1, 2014, Louise M. Parent was named a member of the Supervisory Board of Deutsche Bank AG. She succeeds Suzanne Labarge, who decided to step down from the Supervisory Board with effect from June 30, 2014. Suzanne Labarge had been on Deutsche Bank’s Supervisory Board since 2008. The appointment of Louise M. Parent is based on a proposal by the Supervisory Board’s Nomination Committee. In line with statutory regulations, she was appointed by the court as Suzanne Labarge’s successor for the period until the next General Meeting. Louise M. Parent was Executive Vice President and General Counsel at American Express from 1993 to 2013. As an attorney, she has more than thirty years of experience in the financial sector and legal field.
Events after the Reporting Period
After the reporting date no material events occurred which had a significant impact on our results of operations, financial position and net assets.
Deutsche Bank Management Report 22Interim Report as of June 30, 2014 Operating and Financial Review
Events after the Reporting Period

Outlook
The following section should be read in conjunction with the Outlook section in the Management Report provided in the Financial Report 2013 that outlined our expectations for 2014 and 2015.
The Global Economy
Driven by a significant upturn in the U.S. economy, we expect global economic growth to accelerate to 3.2 % this year and to reach nearly 4 % next year. In 2015, growth will probably therefore be above the average for the past ten years. The extreme weather conditions in the U.S. in the first quarter 2014 led to a significant decline in economic output, over the course of the rest of the year we expect strong growth rates, resulting in a prospective rise of 1.9 % in real GDP in the U.S. In 2015 growth should accelerate to around 3.5 %.
The eurozone is expected to retain its moderate growth, supported by the continuation of expansive monetary policies and somewhat less restrictive fiscal policies, with projected to grow by 1.1 % in 2014. In 2015, we expect a growth rate of 1.5 %. Among the large eurozone countries, Germany should see the strongest expansion, driven by growth in the domestic economy of 1.8 % in 2014 and 2.0 % in 2015. The economic recovery in the United Kingdom is likely to continue this year, and the economy should grow by 3.1 %. Next year however, growth there will probably slow down to 2.5 %, which is about the average for the past ten years. The expansive approach taken in Japan’s fiscal and monetary policies provided a strong boost to its economy. However, the value added tax increase carried out in April, probably had a significant temporary negative impact on consumer spending, with a decline in growth in the second quarter. In 2014, the Japanese economy will grow by an estimated annualized average of 1.2 %. For 2015, we expect a slight recovery in economic growth to 1.5 %. In industrialized countries, we project overall growth accelerating to 1.7 % in 2014 and continuing to rise to 2.5 % in 2015.
We expect growth in emerging market and developing countries to only rise marginally, to 4.7 % in 2014 and 5.2 % in 2015. This moderate growth in emerging market and developing countries is due in particular to the economic slowdown in Brazil, where the economy is projected to expand in 2014 and 2015 by only 1.2 %. The Russian economy is also expected to expand more slowly this year. Here we project growth of only 0.8 % in 2014, picking up to 2.4 % in 2015. Economic growth in China, at 7.8 % in 2014, should be marginally above last year’s level and is expected to rise moderately, to 8.0 % in 2015. Among the BRIC countries, India is the only country we expect to experience a strong acceleration in growth, namely to 5.8 % in 2014, with a further increase to 6.1 % in 2015.
There are various geopolitical risks that could have an impact on our projections. A deterioration of the Ukraine crisis, which could lead to a spiral of sanctions from Western countries and Russia’s reactions, poses a risk to the development of the European economy, in particular if there is a restriction or even a discontinuation of Russia’s oil and natural gas deliveries. Furthermore, there is the risk that conflicts in the Middle East, above all in Iraq, could lead to a significant rise in oil prices and hence dampen the global economic activity.
Deutsche Bank Management Report 23Interim Report as of June 30, 2014 Outlook
The Global Economy

The Banking Industry
In Europe, the lending and deposit business with the private sector is expected to stabilize further over the next twelve months. The decline in lending to companies in the eurozone looks set to gradually come to an end, but significant growth is not expected yet. Retail lending, particularly mortgages, will probably see growth in Germany, among other places, while the market contraction in some of the countries hit hardest by the crisis in recent years could get progressively slower. The moderate expansion in deposit volumes is likely to continue, driven by rising incomes and corporate profits and in spite of the low-interest rate environment.
In the U.S., lending growth should find a broader base and no longer be predominantly driven by traditional corporate loans. A recovery in the mortgage business seems possible, as well as a stronger expansion in consumer loans and commercial real estate loans. On the deposit side, the pace of growth could continue to slow.
In core investment banking, the prospects are very good, especially in the Merger & Acquisition (M&A) business. Given the sustained economic recovery, high corporate liquidity reserves and the very positive performance of equity markets, firms’ willingness to pursue M&A deals may rise. The issuance of debt and equity as well as the syndicated loan business should profit from this development. At the same time, trading volumes and therefore bank revenues could suffer from a lack of client activity if volatility in financial markets stays low.
Against this backdrop, the outlook for asset management is also mixed. On the one hand, the favorable capital market environment and the rise in stock prices are supporting revenues from the management of client funds and are creating incentives for increased investment in higher-risk asset classes that also offer potentially higher returns. On the other hand, the asset turnover in investor portfolios tends to fall in markets that are largely calm and favorable so that trading intensity also decreases – and with it the banks’ commission income.
In general, European banks should succeed in increasing their bottom-line profitability over the next twelve months, from an extraordinarily low level. Nonetheless, legal disputes, which often involve extensive litigation charges and other costs, will probably continue to have a significant impact on banks’ overall performance.
With regard to the regulatory and supervisory system for the banking industry, the next few quarters will focus on the completion of the ECB/EBA Asset Quality Review and Stress Test for the major banks in the euro area, followed in November 2014 by the ECB taking over banking supervision as part of the Single Supervisory Mechanism (SSM). In addition, the beginning of 2015 will see the Bank Recovery and Resolution Directive (BRRD) and the Single Resolution Mechanism (SRM) take effect. Furthermore, once the new European Commission has taken office in autumn, legislative action is expected for example with regard to the so-called bank structure reform and the financial transaction tax. In the U.S., the authorities may pass further regulations to implement the Dodd-Frank Act. Moreover, reforms tackling housing finance, money market funds and the repo market, among others, remain on the agenda.
The Deutsche Bank Group
In 2012, Strategy 2015+ was announced and five levers were identified as key to Deutsche Bank in order to achieve our vision. These levers are; Capital, Clients, Costs, Culture and Competencies. Additionally, several financial targets were announced by the Group to highlight our financial objectives of Strategy 2015+. Since then we have progressed in our move towards our Strategy 2015+ aspirations. However, macroeconomic and market conditions and the regulatory environment have remained much more challenging than originally anticipated in 2012. In particular, low interest rates, increased regulatory and litigation costs, and margin pressures have made it more challenging to meet some of our Strategy 2015+ targets under the original timelines.
Deutsche Bank Management Report 24Interim Report as of June 30, 2014 Outlook
The Deutsche Bank Group

In May 2014, we announced a series of measures to build up our capital strength, enhance our competitiveness and invest in our client franchises. To achieve this, we increased our capital to improve our capital ratios and also to provide a buffer against future regulatory uncertainty and potential macroeconomic headwinds. In this context, we have reaffirmed our commitment to Strategy 2015+ and have updated our financial aspirations which can be found in the table below. The aspirations reflect the completion of the capital increase with proceeds of €€ 8.5 billion, including an ex-rights issue of €€ 1.7 billion placed with an anchor investor and a fully underwritten rights issue raising €€ 6.8 billion of new equity, along with the planned issuance of approximately €€ 5 billion of CRR/CRD 4 compliant Additional Tier 1 capital by the end of 2015 (€€ 3.5 billion of which already took place in May 2014).
Our updated aspirations are based on a number of key assumptions. We have assumed that new regulations, such as the CRD 4 and EBA guidance, will be implemented in line with our expectations, that global gross domestic product growth will stabilize in the range of 2 % to 4 % per annum over the relevant period, that there will be no major increases in interest rates before 2016 in the markets in which we operate and that central bank intervention in the U.S. financial markets will continue to recede.
While we recalibrated our financial ambitions, we remain committed to Strategy 2015+.
The completion of the capital increase is a substantial and integral part of our updated aspirations. With our increased CRR/CRD 4 fully loaded Common Equity Tier 1 capital position we are confident that we can face upcoming regulatory challenges and still have a substantial buffer. Additionally, the capital will allow us to expand our risk-weighted assets selectively while boosting our fully loaded CRR/CRD 4 Leverage Ratio target.
Through the Operational Excellence (OpEx) program we continue to target annual cost savings of €€ 4.5 billion by 2015 and to achieve an adjusted Cost/Income ratio of 65 % in 2015. We expect higher cost for regulatory compliance through our investments in new control capabilities, platform integration and process enhancements as well as through strengthening our regulatory framework. We are committed to counterbalance the effects of incremental investments in regulatory compliance through the ongoing Operational Excellence (OpEx) program, cost discipline and management action and we expect to remain on track towards our Strategy 2015+ aspiration.
In May 2014, in addition to reaffirming Strategy 2015+, we also reconfirmed our aspiration to be the leading client-centric global universal bank. Several investments have been announced to support this aim. We are accelerating a focused investment in the U.S. market where we see opportunities to boost our market share. We will be launching accelerated investments in digital banking across Europe as we see significant opportunities with the digitalization of retail banking whether it is growth in electronic trading, the rise of mobile payments or the shift from branch banking to online banking. We will also commit additional resources to our multi-
Deutsche Bank Management Report 25Interim Report as of June 30, 2014 Outlook
The Deutsche Bank Group
Group Key Performance Indicators 1 Jun 30, 2014 Target for 2015 Target for 2016 Post-tax return on average active equity 2 (adjusted) 7.3 % ~ (adjusted) 12 % ~ 12 %
Cost/income ratio (adjusted) 72.1 % ~ (adjusted) 65 % ~ 65 %
Cost savings 3 €€ 2.6 bn per annum €€ 4.5 bn per annum €€ 4.5 bn per annum
Costs to achieve savings 4 €€ 2.4 bn €€ 4 bn €€ 4 bn
CRR/CRD 4 fully loaded Common Equity Tier 1 ratio 5 11.5 % Greater than 10 % Greater than 10 %
Fully loaded CRR/CRD 4 Leverage Ratio 6 3.4 % 3.5 % 3.5 %
1 The adjusted and reported Post-tax return on average active equity, the adjusted and reported Cost/Income ratio, and the adjusted CRR/CRD 4 Leverage Ratio presentedin the table above are non-GAAP financial measures. Descriptions of these non-GAAP financial measures and the adjustments made to the most directly comparablefinancial measures under IFRS or CRR/CRD 4, can be found in “Other Information: Non-GAAP Financial Measures” of this report.
2 Assuming a Group tax rate between 30 % and 35 %. 3 Cost savings (gross) resulting from the implementation of the OpEx program. 4 Costs to achieve (CtA) savings are costs which are directly required for the realisation of savings in the OpEx program. 5 The CRR/CRD 4 fully loaded Common Equity Tier 1 ratio represents our calculation of our Common Equity Tier 1 ratio without taking into account the transitional
provisions of CRR/CRD 4. Further detail on the calculation of this ratio is provided in the Risk Report. 6 The fully loaded CRR/CRD 4 Leverage Ratio represents our calculation following the publication of CRR/CRD 4 on June 27, 2013 as amended. Further detail on the
calculation of this ratio is provided in the Risk Report.

national corporation coverage efforts. The growth of private wealth in the emerging markets is a huge opportunity for us, particularly in Asia. To capture this opportunity, we will leverage our existing product offering and geographic footprint and expand our relationship manager numbers in key markets by 15 % over the next three years.
Our values and beliefs lie at the heart of our goal of long-term cultural change. They guide our behaviors with clients, shareholders, colleagues and the communities we serve. A new ‘Living the Values’ award has been implemented to enable recognition of employees who exemplify our values and beliefs in their day to day activities. This and other initiatives including bank-wide training programs will continue our drive to embed cultural change and will enable the continuous improvement of our processes and platforms by embracing new and better ways of operating.
Our outlook and performance expectations are based on various economic and operational assumptions. Positive market movements, competitor withdrawals and the implementation of our Strategy 2015+ program, which set the client in the center of our activities and ensure strict cost discipline, may enable us to increase revenues, restrict costs, enhance customer satisfaction, increase margins, enhance capital positions and expand market share beyond our assumed levels and therefore provide further opportunities for growth for the Group.
However, the ability to meet our revised aspirations is based on a number of key assumptions regarding the future economic environment, the regulatory landscape, and anticipated interest rates and central bank action. A reignition of the European sovereign debt crisis, weakness in global, regional and national economic conditions, regulatory changes that may further increase our costs or restrict our activities, or further tightening of margins’ could also negatively affect our ability to implement our strategy or realize the benefits from it. Additionally, due to the nature of our business, we are involved in litigation, arbitration and regulatory proceedings and investigations in Germany and in a number of jurisdictions outside Germany, especially in the U.S. and in the United Kingdom. Such matters are subject to many uncertainties. Although we have resolved a number of important legal matters and made significant progress on others, we continue to expect the litigation and regulatory environment to remain very challenging.
The Business Segments
Corporate Banking & Securities (CB&S) in line with the investment banking industry continued to face a challenging environment in the first half of 2014. Despite a slightly more positive market outlook for the second half of the year, the industry will continue to face headwinds from changing regulations, pressure on resources, ongoing emerging market uncertainty and the gradual withdrawal of central bank support for the global economy. We will continue to consolidate our strengths through ongoing platform investments and dynamically allocating resources across the portfolio. In 2014, we are broadly on track to deliver on our updated Strategy 2015+ objective of an adjusted post-tax return on average active equity of 13 % to 15 %, but challenges and uncertainties remain.
For Private & Business Clients (PBC) the overall macroeconomic outlook for countries in which we operate has improved in 2014, but is expected to continue to be challenging going forward. Our aim is to strengthen our core German credit business by further expanding margins, whilst maintaining strict risk discipline and carefully optimizing capital use. A near-term relief from the low interest rate environment is not expected and might continue to impact our deposit revenues. The development of investment product revenues is particularly dependent on movements in the European macro-economic environment and the recovery of customer confidence in Germany. We will continue to focus on realizing potential from our Private & Commercial Banking business unit by leveraging our integrated commercial banking coverage model for small and mid-sized corporate clients, a joint venture between PBC and GTB. Additionally we are looking to further strengthen our advi-
Deutsche Bank Management Report 26Interim Report as of June 30, 2014 Outlook
The Business Segments
sory banking business in other important European markets, and optimize the benefits generated from our growth investments in key Asian countries. Furthermore we plan to invest approximately €€ 200 million over the next three years to improve digital capabilities in Germany and Europe. The ongoing integration of Postbank will enable us to realize additional synergies and cost savings. The quarterly cost-to-achieve costs for the Postbank integration and other measures of our OpEx program are variable dependent on the milestones of individual projects. For the full year, however, cost-to-achieve are expected to be in line with initial targets. In 2015 we expect to achieve our updated Strategy 2015+ objective of generating income before income taxes of €€ 2.5 billion to €€ 3 billion, once the full benefits from Postbank integration are achieved.
In Global Transaction Banking (GTB), difficult market conditions with low interest rate levels, a highly competitive environment and geopolitical challenges will continue to impact our performance. Furthermore, cost-to-achieve related to the OpEx program as well as other expenses in relation to the execution of our Strategy 2015+ may adversely impact the 2014 performance. However, volume growth in trade finance and cash management transactions may offset these potentially negative factors. For 2015, we anticipate a notable increase in profitability with an income before income taxes target of €€ 1.6 billion to €€ 1.8 billion as growth initiatives should start to yield results.
Deutsche Asset & Wealth Management (DeAWM) continues to make progress toward its 2015+ aspirations. We will further expand our offering in order to provide clients with a full range of investment products and customized solutions. In asset management, this includes new products based on active, passive, systematic, liquid alternative and real asset investment strategies. In wealth management, a strategic focus of the division remains expanding services to ultra high net worth clients worldwide. We will also further develop our relationships with CB&S, PBC and GTB to expand the distribution of our products and explore additional joint initiatives to better serve our clients. We will continue to execute our investment program for our operational and technology platform, with the goal of generating efficiencies and upgrading systems to enhance the client experience. Our financial performance will depend in part on the successful execution of these initiatives but we expect to remain on track to deliver our Strategy 2015+ aspiration of €€ 1.7 billion of income before income taxes by the end of next year.
The strategy and mandate of Non-Core Operations Unit (NCOU) are aligned with the Bank’s overall objectives and concentrate on de-risking activity as well as balance sheet reduction. The aim is to free up capital, reduce balance sheet size as measured under CRD 4 and protect shareholder value by reducing risks from remaining assets and business activities. In addition there is focus on resolving high-profile contingent risks and reducing the underlying cost base of the NCOU division as de-risking progress. Challenges remain for the successful execution of our de-risking strategy. The NCOU includes significant investments in individual companies and carries other assets that are not part of our core business. These investments and assets are exposed to the opportunities and risks arising from changes in the economic environment and market conditions. Such changes may make the associated timeline for de-risking activity less certain and may also impact future results. The pace of de-risking is expected to slow as the portfolio reduces in size, while this will also lead to lower portfolio revenues and a heightened sensitivity to volatility in risk-weighted asset calculations. Our de-risking strategy remains focused on a combination of impacts with capital, leverage, risk reduction, and associated IBIT being the main considerations. In addition to the uncertainty, which arises from the NCOU de-risking strategy, we also expect that the litigation environment will continue to be challenging.
Deutsche Bank Management Report 27Interim Report as of June 30, 2014 Outlook
The Business Segments

Risk Report
Introduction
Risk Management Framework The wide variety of our businesses requires us to identify, measure, aggregate and manage our risks effectively, and to allocate our capital among our businesses appropriately. We operate as an integrated group through our divisions, business units and infrastructure functions. We manage risk and capital through a framework of principles, organizational structures and monitoring processes that are closely aligned with the activities of the divisions and business units. Further information about our risk management framework, which has remained principally unchanged since year-end 2013, can be found in our Financial Report 2013.
Basel 3 and CRR/CRD 4 In the European Union, the new Basel 3 capital framework was implemented by the “Regulation (EU) No 575/2013 on prudential requirements for credit institutions and investment firms” as amended (Capital Requirements Regulation, or “CRR”), and the “Directive 2013/36/EU on access to the activity of credit institutions and the prudential supervision of credit institutions and investment firms” as amended (Capital Requirements Directive 4, or “CRD 4”) published on June 27, 2013. The CRR/CRD 4 framework replaced the laws implementing the international capital adequacy standards as recommended by the Basel Committee on Banking Supervision, commonly referred to as Basel 2 and Basel 2.5. In order to create a single “rulebook” for credit institutions and investment firms in the European Union, the CRR was made directly applicable to them, which eliminated the need for national implementing legislation with respect to the regulatory areas covered by it. As a result, the German Banking Act (KWG) was amended to remove all provisions that have been supplanted by the CRR. Newly effective provisions governing regulatory capital requirements, the assessment of counterparty risk and securitizations, and many other regulations relevant for Deutsche Bank are now located in the CRR. In addition, the CRD 4 was implemented into German law by means of further amendments to the German Banking Act (KWG) and the German Solvency Regulation (SolvV) and accompanying regulations. Jointly, these laws and regulations represent the new regulatory framework applicable in Germany to, among other things, capital, leverage and liquidity as well as Pillar 3 disclosures.
The new regulatory framework became effective on January 1, 2014, subject to certain transitional rules. Therefore when referring to the results according to the transitional rules we use the term “CRR/CRD 4”. When referring to our results according to the full application of the final envisaged framework (and thus without consideration of applicable transitional methodology), we use the term “CRR/CRD 4 fully loaded”. In some cases, CRR/CRD 4 left in place unchanged transitional rules that had been adopted in earlier capital adequacy frameworks through Basel 2.5 regarding the risk weighting of certain categories of assets. These include rules permitting the grandfathering of equity investments at a risk-weight of 100 % and allowing the selection of the greater position of long and short positions as the basis for measurement in the Market Risk Standardized Approach rather than the sum of both long and short positions. In these cases, our CRR/CRD 4 methodology assumes that the impact of the expiration of these transitional rules will be mitigated through sales of the underlying assets or other measures prior to the expiration of the grandfathering provisions.
The new minimum capital ratios are being phased in until 2015. Most regulatory adjustments (i.e., capital deductions and regulatory filters) are being phased in through 2018. Capital instruments that no longer qualify under the new rules are being phased out through 2022. New capital buffer requirements are being phased in by 2019. Although they are subject to supervisory reporting starting from 2014, binding minimum requirements for short-term liquidity will be introduced in 2015 and a standard for longer term liquidity is expected to become effective in 2018. The introduction of a binding leverage ratio is expected from 2018 following disclosure of the ratio starting in 2015.
Deutsche Bank Management Report 28Interim Report as of June 30, 2014 Risk Report
Introduction

In addition to tightening capital requirements the CRR/CRD 4 framework also changed some of the nomenclatures relating to capital adequacy and regulatory capital, such as the use of the term Common Equity Tier 1 in place of the term Core Tier 1.
As there are still some interpretation uncertainties with regard to the CRR/CRD 4 rules and some of the related binding Technical Standards are not yet finally available, we will continue to refine our assumptions and models as our and the industry’s understanding and interpretation of the rules evolve. In this light, our CRR/CRD 4 measures may differ from our earlier expectations, and as our competitors’ assumptions and estimates regarding such implementation may also vary, our CRR/CRD 4 measures may not be comparable with similarly labeled measures used by our competitors.
Scope of Consolidation The following risk disclosures providing quantitative information are presented in accordance with International Financial Reporting Standards (IFRS). Consequently, the disclosure is generally based on the IFRS principles of valuation and consolidation. However, for a few disclosures, regulatory principles of consolidation are relevant and differ from those applied for our financial statements. These principles were not materially affected by the new CRR/CRD 4 framework and are described in more detail in our Financial Report 2013. Where the regulatory relevant scope is used, this is explicitly stated.
Overall Risk Assessment
Key risk categories for us include credit risk, market risk, operational risk (including legal risk), business risk (including tax and strategic risk), reputational risk, liquidity risk, model risk and compliance risk (in accordance with MaRisk). We manage the identification, assessment and mitigation of top and emerging risks through an internal governance process and risk management tools and processes. Our approach for identification and impact assessment aims to ensure that we mitigate the impact of these risks on our financial results, long term strategic goals, and reputation.
As part of our regular risk and cross-risk analysis, sensitivities of the key portfolio risks are reviewed using a bottom-up risk assessment and a top-down macro-economic scenario analysis, which includes geopolitical considerations. This two-pronged approach allows us to capture not only risks that have an impact across our risk inventories and business divisions but also those that are relevant only to specific portfolios.
Current portfolio-wide risks on which we continue to focus include: the potential re-escalation of the European sovereign debt crisis, the impact of US tapering on Emerging Market economies, broader credit/market risk trends and the potential risk of a geopolitical shock. These risks have been a consistent focus throughout recent quarters. The assessment of the potential impacts of these risks is made through integration into our group-wide stress tests which assess our ability to absorb these events should they occur. The results of these tests showed that we currently have adequate capital and liquidity reserves to absorb the impact of these risks if they were to materialize in line with the stress tests’ parameters.
In addition, we review potential first and second order impacts of the events between Russia and Ukraine on our portfolios in response to recent geopolitical developments.
The first six months of 2014 continued to see a persistence of the global trends seen in 2013, including the increased regulation of the financial services industry which continues and which we view as likely to persist through the coming years. We are focused on identifying potential regulatory changes and assessing the possible impacts on our business model and processes.
Deutsche Bank Management Report 29Interim Report as of June 30, 2014 Risk Report
Overall Risk Assessment

Risk Profile
Our mix of various business activities results in diverse risk taking by our business divisions. We measure the key risks inherent in their respective business models through the undiversified Total Economic Capital metric, which mirrors each business division’s risk profile before taking into account cross-risk effects at the Group level.
Risk Profile of our Business Divisions as measured by total Economic Capital
Corporate Banking & Securities’ (CB&S) risk profile is dominated by its trading in support of origination, structuring and market making activities, which gives rise to market risk and credit risk. Further credit risks originate from exposures to corporates and financial institutions. Under CB&S’ current business model, the remainder is derived from operational risks and business risk, primarily from potential legal and earnings volatility risks, respectively.
In contrast to this, Private & Business Clients’ (PBC) risk profile is comprised of credit risk from retail, small and medium-sized enterprises (SMEs) lending as well as nontrading market risk from investment risk, modeling of client deposits and credit spread risk.
Global Transaction Banking’s (GTB) focus on trade finance implies that the vast majority of its risk originates from credit risk with a small portion from market risk mainly in relation to derivative positions.
The main risk driver of Deutsche Asset & Wealth Management’s (DeAWM) business are guarantees on investment funds, which we report as nontrading market risk. Otherwise DeAWM’s advisory and commission focused business attracts primarily operational risk.
Deutsche Bank Management Report 30Interim Report as of June 30, 2014 Risk Report
Risk Profile
Jun 30, 2014
Corporate Banking & Securities
Private & Business
Clients
Global Transaction
Banking
Deutsche Asset & Wealth
Management
Non-Core Operations
Unit
Consoli- dation &
Adjustments Total in % (unless stated otherwise) in €€ m. in % Credit Risk 16 12 7 1 3 0 11,923 40
Market Risk 21 10 1 5 3 8 14,456 48
Operational Risk 10 4 0 2 5 0 6,385 22
Diversification Benefit (10) (3) (1) (2) (3) 0 (5,730) (19)
Business Risk 8 0 0 0 2 0 3,004 10
Total EC in €€ m. 13,410 6,786 2,267 2,096 3,024 2,456 30,038 100 In % 45 23 8 7 10 8 100 0
Dec 31, 2013
Corporate Banking & Securities
Private & Business
Clients
Global Transaction
Banking
Deutsche Asset & Wealth
Management
Non-Core Operations
Unit
Consoli- dation &
Adjustments Total in % (unless stated otherwise) in €€ m. in % Credit Risk 17 14 7 1 5 0 12,013 44
Market Risk 17 11 1 6 6 7 12,738 47
Operational Risk 9 3 0 2 5 0 5,253 19
Diversification Benefit (7) (3) (1) (2) (4) 0 (4,515) (17)
Business Risk 5 0 0 0 1 0 1,682 6
Total EC in €€ m. 11,181 6,671 2,033 2,010 3,566 1,710 27,171 100 In % 41 25 7 7 13 6 100 0
The Non-Core Operations Unit (NCOU) portfolio includes activities that are non-core to the Bank’s strategy; assets materially affected by business, environment, legal or regulatory changes; assets earmarked for de-risking; assets suitable for separation; assets with significant capital absorption but low returns; and assets exposed to legal risks. NCOU’s risk profile covers risks across the entire range of our operations comprising credit risks and also market and operational risks (including legal risks) targeted where possible for accelerated de-risking.
Risk Management Executive Summary
Credit Risk Summary
Market Risk Summary
Deutsche Bank Management Report 31Interim Report as of June 30, 2014 Risk Report
Risk Management Executive Summary
— After a slow-down in the first quarter of 2014, global growth is accelerating supported by a strong rebound in the US and more modest acceleration in China. Geopolitical risks remain elevated with tensions between Russiaand the West in relation to the Ukraine reaching new highs and pockets of heightened stress in the Middle East.The economic and financial market impact of these events remains predominantly localized and potentialimpacts on the credit portfolio are being monitored closely. We currently expect no material credit losses as aresult of those events. Credit exposure to Russia based on a country of domicile principle is €€ 6.1 billion as of June 30, 2014, focused on sovereigns, majority government owned banks as well as corporates in strategicallyimportant industry sectors. The increase of €€ 0.3 billion in credit exposures compared with December 31, 2013is mostly collateralised. Credit exposure to Ukraine is relatively small at €€ 0.5 billion as of June 30, 2014.
— Provision for credit losses was €€ 496 million in the first six months 2014, a decrease of €€ 332 million, or 40 %, compared to the first six months 2013. This reduction primarily results from lower provisions in NCOU, ongoinggood performance of the German retail market and the non-recurrence of large single items in our Core business recorded in the first six months 2013.
— Our corporate credit loan exposure increased by 5 % or €€ 9.8 billion in the first six months of 2014, mainly in investment grade rating classes.
— The portion of our corporate credit portfolio book carrying an investment-grade rating amounted to 72 % at June 30, 2014, marginally higher compared with December 31, 2013.
— The economic capital usage for credit risk slightly decreased by €€ 0.1 billion to €€ 11.9 billion as of June 30, 2014, compared with €€ 12.0 billion at year-end 2013. This was mainly driven by operational modelimprovements in 2014 partly offset by increased exposure, primarily in GTB.
— The nontrading market risk economic capital usage increased to €€ 9.0 billion as of June 30, 2014, compared with €€ 8.5 billion at year-end 2013. This was largely driven by additional structural foreign exchange risk arisingfrom our issuance of Additional Tier 1 notes on May 20, 2014 denominated in US dollars and Pound Sterling.
— The economic capital usage for trading market risk totalled €€ 5.4 billion as of June 30, 2014, compared with €€ 4.2 billion at year-end 2013. This was mainly driven by increased exposures in the fair value banking bookand in securitization.
— The average value-at-risk for the first six months of 2014 was €€ 55 million and increased slightly by €€ 2 million compared with the full year 2013. There has been an increase in interest rate risk partly offset by reductions incredit spread and commodities risk. Overall value-at-risk has increased due to a reduction in diversificationbenefit due to a change in the portfolio composition.

Operational Risk Summary
Liquidity Risk Summary
Capital Management Summary
Balance Sheet Management Summary
Credit Risk
Credit Exposure Classifications We classify our credit exposure under two broad headings: corporate credit exposure and consumer credit exposure.
Deutsche Bank Management Report 32Interim Report as of June 30, 2014 Risk Report
Credit Risk
— The economic capital usage for operational risk increased by €€ 1.1 billion to €€ 6.4 billion as of June 30, 2014, compared to year-end 2013.
— The increase was mainly driven by a proactive recognition of the impact of model enhancements to ourAdvanced Measurement Approach (AMA) model.
— While our dialogue with BaFin on these model enhancements is on-going, management has decided to recognise the impact of these model changes where they will lead to an increase in capital requirement overour models that have been previously approved by the BaFin.
— Liquidity reserves amounted to €€ 199 billion as of June 30, 2014 (compared with €€ 196 billion as of December 31, 2013). We maintained a positive liquidity stress result as of June 30, 2014 (under the combinedscenario).
— Our initial issuance plan of €€ 20 billion was completed in May 2014 and was subsequently increased to €€ 30-35 billion. Capital markets issuance activities in the first six months of 2014 amounted to €€ 24.8 billion.
— 66 % of our overall funding came from the funding sources we categorize as the most stable including capitalmarkets issuance and equity, retail and transaction banking deposits.
— The CRR/CRD 4 Common Equity Tier 1 capital ratio was 14.7 % as of June 30, 2014, compared with 14.6 % atyear-end 2013.
— Risk-weighted assets according to CRR/CRD 4 increased by €€ 101 billion to €€ 401 billion as of June 30, 2014, compared with €€ 300 billion according to Basel 2.5 at year-end 2013, largely reflecting the impact of the CRR/CRD 4 framework.
— The internal capital adequacy ratio increased to 179 % as of June 30, 2014, compared with 167 % as ofDecember 31, 2013.
— The CRR/CRD 4 fully loaded Common Equity Tier 1 ratio was 11.5 % as of June 30, 2014, compared with9.7 % at year-end 2013.
— Our leverage ratio calculated as the ratio of total assets under IFRS to total equity under IFRS was 24 as ofJune 30, 2014, down compared with 29 at year end 2013.
— As of June 30, 2014, our fully loaded CRR/CRD 4 leverage ratio, which is a non-GAAP financial measure, was 3.4 %, compared with 2.4 % as of December 31, 2013, taking into account a fully loaded Tier 1 capital of€€ 49.4 billion over an applicable exposure measure of €€ 1,447 billion (€€ 34.0 billion and €€ 1,445 billion as of December 31, 2013, respectively).
— Our consumer credit exposure consists of our smaller-balance standardized homogeneous loans, primarily inGermany, Italy and Spain. It includes personal loans, residential and nonresidential mortgage loans, overdraftsand loans to self-employed and small business customers of our private and retail businesses.
— Our corporate credit exposure consists of all exposures not defined as consumer credit exposure.
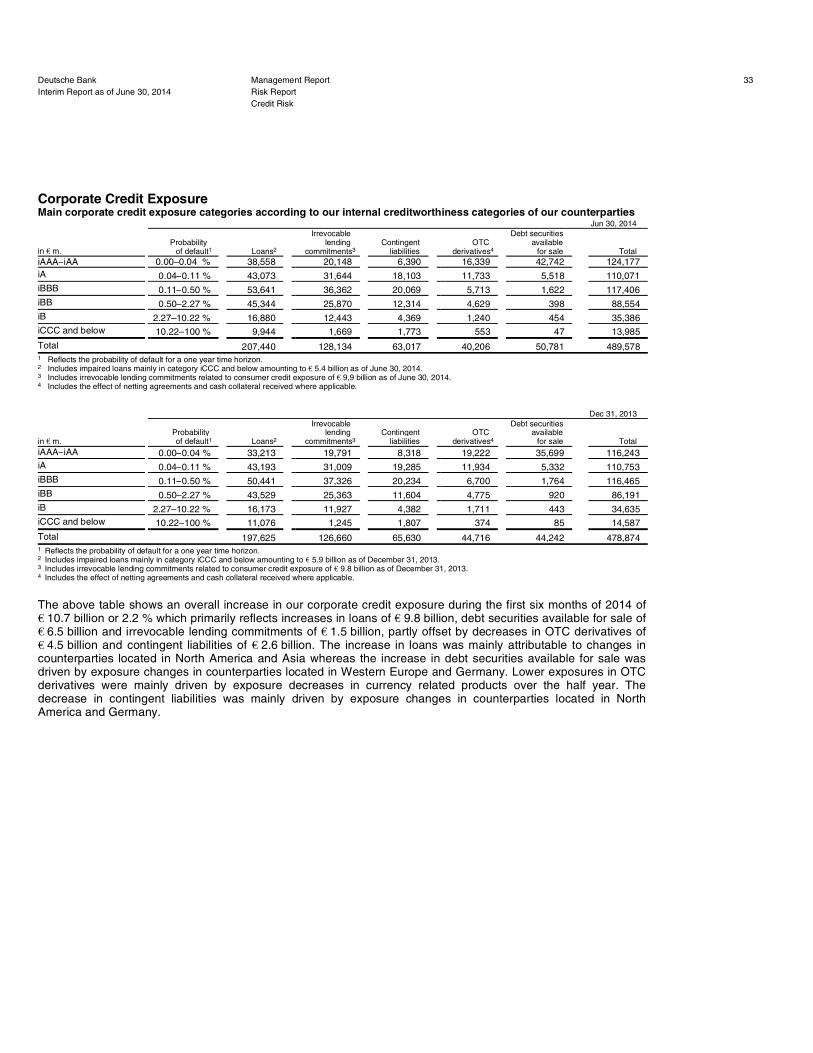
Corporate Credit Exposure Main corporate credit exposure categories according to our internal creditworthiness categories of our counterparties
The above table shows an overall increase in our corporate credit exposure during the first six months of 2014 of €€ 10.7 billion or 2.2 % which primarily reflects increases in loans of €€ 9.8 billion, debt securities available for sale of €€ 6.5 billion and irrevocable lending commitments of €€ 1.5 billion, partly offset by decreases in OTC derivatives of €€ 4.5 billion and contingent liabilities of €€ 2.6 billion. The increase in loans was mainly attributable to changes in counterparties located in North America and Asia whereas the increase in debt securities available for sale was driven by exposure changes in counterparties located in Western Europe and Germany. Lower exposures in OTC derivatives were mainly driven by exposure decreases in currency related products over the half year. The decrease in contingent liabilities was mainly driven by exposure changes in counterparties located in North America and Germany.
Deutsche Bank Management Report 33Interim Report as of June 30, 2014 Risk Report
Credit Risk
Jun 30, 2014
in €€ m. Probability
of default1 Loans2
Irrevocable lending
commitments3 Contingent
liabilities OTC
derivatives4
Debt securities available
for sale Total iAAA–iAA 0.00–0.04 % 38,558 20,148 6,390 16,339 42,742 124,177
iA 0.04–0.11 % 43,073 31,644 18,103 11,733 5,518 110,071
iBBB 0.11–0.50 % 53,641 36,362 20,069 5,713 1,622 117,406
iBB 0.50–2.27 % 45,344 25,870 12,314 4,629 398 88,554
iB 2.27–10.22 % 16,880 12,443 4,369 1,240 454 35,386
iCCC and below 10.22–100 % 9,944 1,669 1,773 553 47 13,985
Total 207,440 128,134 63,017 40,206 50,781 489,578
1 Reflects the probability of default for a one year time horizon. 2 Includes impaired loans mainly in category iCCC and below amounting to €€ 5.4 billion as of June 30, 2014. 3 Includes irrevocable lending commitments related to consumer credit exposure of €€ 9,9 billion as of June 30, 2014. 4 Includes the effect of netting agreements and cash collateral received where applicable.
Dec 31, 2013
in €€ m. Probability of default1 Loans2
Irrevocable lending
commitments3 Contingent
liabilities OTC
derivatives4
Debt securities available
for sale Total iAAA–iAA 0.00–0.04 % 33,213 19,791 8,318 19,222 35,699 116,243
iA 0.04–0.11 % 43,193 31,009 19,285 11,934 5,332 110,753
iBBB 0.11–0.50 % 50,441 37,326 20,234 6,700 1,764 116,465
iBB 0.50–2.27 % 43,529 25,363 11,604 4,775 920 86,191
iB 2.27–10.22 % 16,173 11,927 4,382 1,711 443 34,635
iCCC and below 10.22–100 % 11,076 1,245 1,807 374 85 14,587
Total 197,625 126,660 65,630 44,716 44,242 478,874
1 Reflects the probability of default for a one year time horizon. 2 Includes impaired loans mainly in category iCCC and below amounting to €€ 5.9 billion as of December 31, 2013. 3 Includes irrevocable lending commitments related to consumer credit exposure of €€ 9.8 billion as of December 31, 2013. 4 Includes the effect of netting agreements and cash collateral received where applicable.

Consumer Credit Exposure In our consumer credit exposure we monitor consumer loan delinquencies in terms of loans that are 90 days or more past due and net credit costs, which are the annualized net provisions charged after recoveries.
Consumer Credit Exposure
The volume of our consumer credit exposure increased from year-end 2013 to June 30, 2014 by €€ 1.1 billion, or 0.6 %, mainly driven by mortgage lending in Germany which increased by €€ 952 million. Outside Germany, the consumer credit exposure in India increased by €€ 127 million and in Poland by €€ 122 million.
The increase in the 90 days or more past due ratio in the consumer and small business financing in Germany was driven by increased overdue volumes of Postbank portfolio. The increase in the ratio of consumer and small business financing outside Germany is mainly driven by the macroeconomic development in Southern Europe.
The slight increase of net credit costs as a percentage of total exposure in Germany compared to last year is driven by a higher positive effect from non-performing loan sales in the first half year 2013 compared to the first half year 2014.
Credit Risk Exposure to certain Eurozone Countries Certain eurozone countries are presented within the tables below due to heightened concerns relating to sovereign risk caused by the wider European sovereign debt crisis. This heightened risk is driven by a number of factors impacting the associated sovereign including high public debt levels and/or large deficits, poor economic fundamentals and outlook (including low gross domestic product growth, weak competitiveness, high unemployment and political uncertainty). Some of these countries have accepted “bail out” packages. Funding conditions and overall financial stability have improved over the past 18 months with bond yields returning, in most cases, to sustainable levels and capital outflows having partly reversed and weaker countries having regained access to the capital markets. Ireland and Portugal have both exited their bailouts without precautionary credit lines. Some of these countries have exited recession and all are expected to return to positive growth over the course of 2014.
Deutsche Bank Management Report 34Interim Report as of June 30, 2014 Risk Report
Credit Risk
Total exposure
in €€ m. 90 days or more past due as a % of total exposure1
Net credit costs as a % of total exposure
Jun 30, 2014 Dec 31, 2013 Jun 30, 2014 Dec 31, 2013 Jun 30, 2014 Dec 31, 2013 Consumer credit exposure Germany 146,921 145,929 1.23 1.23 0.25 0.23
Consumer and small business financing 20,818 20,778 3.96 3.81 1.16 1.04 Mortgage lending 126,103 125,151 0.78 0.81 0.10 0.10
Consumer credit exposure outside Germany 38,756 38,616 5.76 5.38 0.73 0.76
Consumer and small business financing 12,147 12,307 12.12 11.34 1.73 1.75 Mortgage lending 26,609 26,309 2.85 2.60 0.28 0.29
Total consumer credit exposure2 185,677 184,545 2.17 2.10 0.35 0.34
1 Retrospective as per December 31, 2013, the 90 days or more past due volume of Postbank Consumer Credit Exposure Germany was restated by €€ 626 million (or 0.43 % of total Consumer Credit Exposure in Germany) erroneously not included in prior disclosure.
2 Includes impaired loans amounting to €€ 4.6 billion as of June 30, 2014 and €€ 4.2 billion as of December 31, 2013.

For the presentation of our exposure to these certain eurozone countries we apply two general concepts as follows:
Net credit risk exposure with certain eurozone countries – Risk Management View
Net credit risk exposure with certain eurozone countries increased by €€ 50 million since year-end 2013. This was mainly driven by increases of trading positions across Sovereign and diversified Corporates in Portugal and Italy mostly offset by lower Sovereign positions in Spain.
Our above exposure is principally highly diversified, low risk retail portfolios and small and medium enterprises in Italy and Spain, as well as stronger corporate and diversified mid-cap clients. Our financial institutions exposure is predominantly geared towards larger banks in Spain and Italy, typically collateralised. Sovereign exposure is moderate and principally in Italy and Spain.
The following tables, which are based on the “country of domicile” view, present our gross position, the included amount thereof of undrawn exposure and our net exposure to these eurozone countries. The gross exposure reflects our net credit risk exposure grossed up for net credit derivative protection purchased with underlying reference assets domiciled in one of these countries, guarantees received and collateral. Such collateral is particularly held with respect to our retail portfolio, but also for financial institutions predominantly based on derivative margining arrangements, as well as for corporates. In addition the amounts also reflect the allowance for credit losses. In some cases, our counterparties’ ability to draw undrawn commitments is limited by terms included in the specific contractual documentation. Net credit exposures are presented after effects of collateral held, guarantees received and further risk mitigation, but excluding net notional amounts of credit
Deutsche Bank Management Report 35Interim Report as of June 30, 2014 Risk Report
Credit Risk
— In our “risk management” view, we consider the domicile of the group parent, thereby reflecting the one obligorprinciple. All facilities to a group of borrowers which are linked to each other (e.g., by one entity holding amajority of the voting rights or capital of another) are consolidated under one obligor. This group of borrowers isusually allocated to the country of domicile of the respective parent company. As an example, a loan to acounterparty in Spain is Spanish risk as per a domicile view but considered a German risk, from a riskmanagement perspective, if the respective counterparty is linked to a parent company domiciled in Germanyfollowing the above-mentioned one obligor principle. In this risk management view we also consider derivative netting and present exposures net of hedges and collateral. The collateral valuations follow the same approachand principles as outlined in our Financial Report 2013. Also, in our risk management view, we classifyexposure to special purpose entities based on the domicile of the underlying assets as opposed to the domicileof the special purpose entities. Additional considerations apply for structured products. If, for example, astructured note is issued by a special purpose entity domiciled in Ireland, it will be considered an Irish risk in a“country of domicile” view, but if the underlying assets collateralizing the structured note are German mortgageloans, then the exposure would be included as German risk in the “risk management” view.
— In our “country of domicile” view we aggregate credit risk exposures to counterparties by allocating them to thedomicile of the primary counterparty, irrespective of any link to other counterparties, or in relation to creditdefault swaps underlying reference assets from these eurozone countries. Hence we also includecounterparties whose group parent is located outside of these countries and exposures to special purposeentities whose underlying assets are from entities domiciled in other countries.
in €€ m. Jun 30, 2014 Dec 31, 2013 Greece 492 466
Ireland 518 455
Italy 15,895 15,419
Portugal 1,336 708
Spain 8,744 9,886
Total 26,984 26,935

derivatives for protection sold/(bought). The provided gross and net exposures to certain eurozone countries do not include credit derivative tranches and credit derivatives in relation to our correlation business which, by design, is structured to be credit risk neutral. Additionally the tranche and correlated nature of these positions do not allow a meaningful disaggregated notional presentation by country, e.g., as identical notional exposures represent different levels of risk for different tranche levels.
Gross position, included undrawn exposure and net exposure to certain eurozone countries – Country of Domicile View
Total net exposure to the above selected eurozone countries increased by €€ 2.7 billion in the first six months of 2014 mainly driven by increased corporate and financial institutions portfolios in Spain and Ireland partly offset by the sovereign exposure reductions in Spain and Italy.
Aggregate net credit risk exposure to certain eurozone countries by type of financial instrument
Deutsche Bank Management Report 36Interim Report as of June 30, 2014 Risk Report
Credit Risk
Sovereign Financial Institutions Corporates Retail Other Total1
in €€ m. Jun 30,
2014 Dec 31,
2013 Jun 30,
2014 Dec 31,
2013 Jun 30,
2014 Dec 31,
2013 Jun 30,
2014 Dec 31,
2013 Jun 30,
2014 Dec 31,
2013 Jun 30,
2014 Dec 31,
2013 Greece
Gross 84 52 634 605 1,371 1,338 8 9 32 0 2,129 2,004 Undrawn 0 0 23 18 99 101 2 3 0 0 125 122
Net 72 52 74 23 69 214 3 3 32 0 251 291
Ireland Gross 693 765 873 721 7,141 6,177 45 48 1,9402 1,9582 10,691 9,669
Undrawn 0 0 48 6 2,223 1,680 2 1 2642 3582 2,537 2,045 Net 84 175 533 438 5,385 4,537 7 9 1,9302 1,9512 7,939 7,110
Italy Gross 4,656 1,900 5,245 5,232 9,020 8,400 19,586 19,650 1,311 648 39,818 35,830
Undrawn 0 0 868 955 3,215 3,407 209 190 2 2 4,294 4,554 Net 1,192 1,374 2,764 2,500 6,689 6,529 7,461 6,994 1,201 572 19,306 17,969
Portugal Gross 185 38 315 257 1,136 1,392 2,013 2,163 163 78 3,811 3,928
Undrawn 0 0 37 36 112 172 8 28 0 0 157 237 Net 185 25 262 222 517 849 227 282 163 78 1,353 1,456
Spain Gross 527 1,473 3,006 3,349 9,650 9,288 10,643 10,721 771 637 24,598 25,468
Undrawn 3 4 868 662 4,233 3,321 507 521 4 3 5,615 4,510 Net 429 1,452 2,663 2,389 7,340 6,436 2,400 2,060 719 502 13,551 12,839
Total gross 6,145 4,228 10,072 10,164 28,318 26,595 32,294 32,591 4,216 3,321 81,047 76,899 Total undrawn 3 4 1,845 1,677 9,882 8,680 727 743 270 364 12,727 11,468
Total net3 1,962 3,078 6,296 5,572 20,000 18,566 10,098 9,347 4,044 3,103 42,400 39,666
1 Approximately 55 % of the overall exposure will mature within the next 5 years. 2 Other exposures to Ireland include exposures to counterparties where the domicile of the group parent is located outside of Ireland as well as exposures to special purpose entities whose
underlying assets are from entities domiciled in other countries. 3 Total net exposure excludes credit valuation reserves for derivatives amounting to €€ 101 million as of June 30, 2014 and €€ 136 million as of December 31, 2013.
Jun 30, 2014
Financial assets
carried at amortized cost
Financial assets measured at
fair value Financial instruments
at fair value through profit or loss
in €€ m.
Loans before loan
loss allowance
Loans after loan
loss allowance Other1
Financial assets available
for sale2 Derivatives Other Total3 Greece 112 86 88 0 36 62 273
Ireland 1,705 1,696 3,022 301 783 2,011 7,813
Italy 11,686 10,643 3,883 733 3,786 3,008 22,053
Portugal 429 380 356 23 103 712 1,575
Spain 5,720 5,718 4,229 864 488 1,468 12,767
Total 19,653 18,524 11,578 1,920 5,197 7,262 44,481
1 Primarily includes contingent liabilities and undrawn lending commitments. 2 Excludes equities and other equity interests. 3 After loan loss allowances.

For our credit derivative exposure with these eurozone countries we present the notional amounts for protection sold and protection bought on a gross level as well as the resulting net notional position and its fair value. For a more detailed description of our usage of credit derivatives to manage credit risk see the respective risk sections of our Financial Report 2013.
Credit derivative exposure with underlying assets domiciled in certain eurozone countries
Sovereign Credit Risk Exposure to certain eurozone countries The amounts below reflect a net “country of domicile view” of our sovereign exposure.
Sovereign credit risk exposure to certain eurozone Countries
The increase in sovereign credit exposure compared with year-end 2013 mainly reflects movements from market making activities. The increase in Italy is primarily attributable to an increase in our sovereign debt exposures, which was partially offset by higher purchased credit protection. The decrease of our exposure to Spain primarily reflects exposure changes in debt securities related to the levels of market making and loans. The increase in Portugal is mainly attributable to debt exposures.
The above mentioned direct sovereign exposure included the carrying value of loans held at amortized cost to sovereigns which, as of June 30, 2014, amounted to €€ 312 million for Italy and €€ 598 million for Spain and, as of December 31, 2013 amounted to €€ 726 million for Italy and €€ 649 million for Spain.
Deutsche Bank Management Report 37Interim Report as of June 30, 2014 Risk Report
Credit Risk
Dec 31, 2013
Financial assets
carried at amortized cost
Financial assets measured at
fair value Financial instruments
at fair value through profit or loss
in €€ m.
Loans before loan
loss allowance
Loans after loan
loss allowance Other1
Financial assets available
for sale2 Derivatives Other Total3 Greece 240 207 15 5 7 69 302
Ireland 1,342 1,332 2,840 502 800 1,518 6,993
Italy 10,678 9,735 4,143 875 3,559 (176) 18,136
Portugal 686 640 400 34 94 538 1,706
Spain 6,214 5,460 3,386 1,015 510 1,483 11,853
Total 19,159 17,373 10,784 2,431 4,970 3,432 38,990
1 Primarily includes contingent liabilities and undrawn lending commitments. 2 Excludes equities and other equity interests. 3 After loan loss allowances.
Jun 30, 2014 Dec 31, 2013
in €€ m. Protection
sold Protection
bought
Net protection
sold/(bought) Net
fair value Protection
sold Protection
bought
Net protection
sold/(bought) Net
fair value Greece 1,173 (1,196) (22) 0 1,260 (1,271) (11) (1)
Ireland 5,779 (5,654) 126 (1) 7,438 (7,321) 117 0
Italy 49,150 (51,896) (2,746) 73 60,203 (60,370) (167) 100
Portugal 7,418 (7,640) (222) 2 10,183 (10,432) (250) 7
Spain 22,248 (21,464) 784 2 28,452 (27,466) 986 (4)
Total 85,768 (87,850) (2,081) 76 107,536 (106,860) 675 101
Jun 30, 2014 Dec 31, 2013
in €€ m.
Direct Sovereign
exposure1
Net Notional of CDS
referencing sovereign debt
Net sovereign exposure
Memo Item: Net fair value
of CDS referencing
sovereign debt2
Direct Sovereign
exposure1
Net Notional of CDS
referencing sovereign debt
Net sovereign exposure
Memo Item: Net fair value
of CDS referencing
sovereign debt2 Greece 84 (12) 72 1 52 0 52 2
Ireland (28) 111 84 (1) 61 114 175 0
Italy 4,598 (3,406) 1,192 71 1,861 (487) 1,374 116
Portugal 182 3 185 1 38 (12) 25 4
Spain 527 (98) 429 (3) 1,193 259 1,452 (4)
Total 5,363 (3,401) 1,962 70 3,205 (126) 3,078 118
1 Includes sovereign debt classified as financial assets/liabilities at fair value through profit or loss, available for sale and loans carried at amortized cost. 2 The amounts reflect the net fair value in relation to default swaps referencing sovereign debt of the respective country representing the counterparty credit risk.

Asset Quality
This section describes the asset quality of our loans. All loans, where known information about possible credit problems of borrowers causes our management to have serious doubts as to the collectability of the borrower’s contractual obligations, are included in this section.
Overview of performing, renegotiated, past due and impaired loans by customer groups
Impaired Loans Credit Risk Management regularly assesses at each balance sheet date whether there is objective evidence that a loan or group of loans is impaired. A loan or group of loans is impaired and impairment losses are incurred if:
Credit Risk Management’s loss assessments are subject to regular review in collaboration with Group Finance. The results of this review are reported to and approved by an oversight committee comprised of Group Finance and Risk senior management.
Impairment Loss and Allowance for Loan Losses If there is evidence of impairment the impairment loss is generally calculated on the basis of discounted expected cash flows using the original effective interest rate of the loan. If the terms of a loan are renegotiated or otherwise modified because of financial difficulties of the borrower without qualifying for a derecognition of the loan, the impairment loss is measured using the original effective interest rate before modification of terms. We reduce the carrying amount of the impaired loan by the use of an allowance account and recognize the amount of the loss in the consolidated statement of income as a component of the provision for credit losses. We record increases to our allowance for loan losses as an increase of the provision for loan losses in our income statement. Charge-offs reduce our allowance while recoveries, if any, are credited to the allowance account. If we determine that we no longer require allowances which we have previously established, we decrease our allowance and record the amount as a reduction of the provision for loan losses in our income statement. When it is considered that there is no realistic prospect of recovery and all collateral has been realized or transferred to us, the loan and any associated allowance for loan losses is charged off (i.e., the loan and the related allowance for loan losses are removed from the balance sheet).
Deutsche Bank Management Report 38Interim Report as of June 30, 2014 Risk Report
Asset Quality
Jun 30, 2014 Dec 31, 20131
in €€ m. Corporate
loans Consumer
loans Total Corporate
loans Consumer
loans Total Loans neither past due, nor renegotiated or impaired 198,605 176,328 374,934 190,021 175,483 365,504
Past due loans, neither renegotiated nor impaired 2,9402 4,383 7,323 1,293 4,446 5,739
Loans renegotiated, but not impaired 448 379 827 389 395 784
Impaired loans 5,447 4,586 10,033 5,922 4,221 10,143
Total 207,440 185,677 393,117 197,625 184,545 382,170
1 Amounts for December 31, 2013, were adjusted for past due loans, neither renegotiated nor impaired by €€ 303 million and for loans renegotiated, but not impaired by€€ 112 million erroneously not included in prior disclosure.
2 Increase of €€ 1.647 million due to a number of single items mainly in North America as well as Western Europe (excluding Germany).
— there is objective evidence of impairment as a result of a loss event that occurred after the initial recognition ofthe asset and up to the balance sheet date (“a loss event”). When making our assessment we consider information on such events that is reasonably available up to the date the financial statements are authorizedfor issuance in line with the requirements of IAS 10;
— the loss event had an impact on the estimated future cash flows of the financial asset or the group of financialassets, and
— a reliable estimate of the loss amount can be made at each reporting date.
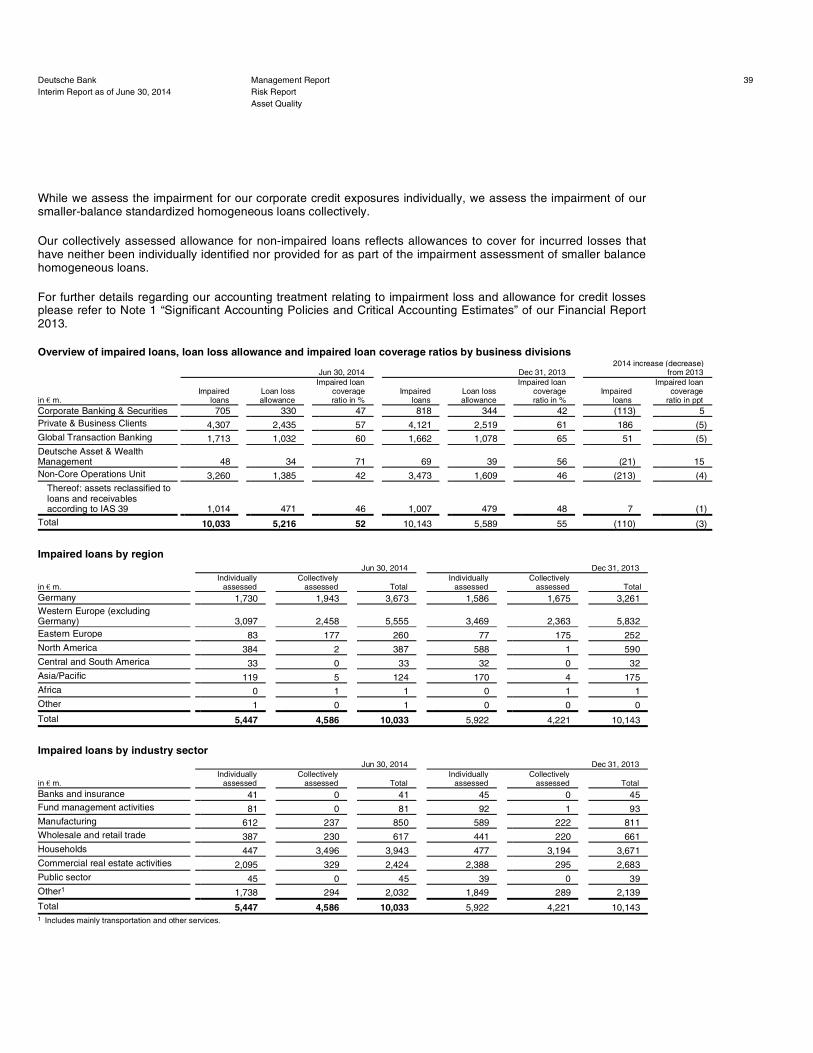
While we assess the impairment for our corporate credit exposures individually, we assess the impairment of our smaller-balance standardized homogeneous loans collectively.
Our collectively assessed allowance for non-impaired loans reflects allowances to cover for incurred losses that have neither been individually identified nor provided for as part of the impairment assessment of smaller balance homogeneous loans.
For further details regarding our accounting treatment relating to impairment loss and allowance for credit losses please refer to Note 1 “Significant Accounting Policies and Critical Accounting Estimates” of our Financial Report 2013.
Overview of impaired loans, loan loss allowance and impaired loan coverage ratios by business divisions
Impaired loans by region
Impaired loans by industry sector
Deutsche Bank Management Report 39Interim Report as of June 30, 2014 Risk Report
Asset Quality
Jun 30, 2014 Dec 31, 2013 2014 increase (decrease)
from 2013
in €€ m. Impaired
loans Loan loss
allowance
Impaired loan coverage ratio in %
Impaired loans
Loan loss allowance
Impaired loan coverage ratio in %
Impaired loans
Impaired loan coverage
ratio in ppt Corporate Banking & Securities 705 330 47 818 344 42 (113) 5
Private & Business Clients 4,307 2,435 57 4,121 2,519 61 186 (5)
Global Transaction Banking 1,713 1,032 60 1,662 1,078 65 51 (5)
Deutsche Asset & Wealth Management 48 34 71 69 39 56 (21) 15
Non-Core Operations Unit 3,260 1,385 42 3,473 1,609 46 (213) (4)
Thereof: assets reclassified to loans and receivables according to IAS 39 1,014 471 46 1,007 479 48 7 (1)
Total 10,033 5,216 52 10,143 5,589 55 (110) (3)
Jun 30, 2014 Dec 31, 2013
in €€ m. Individually
assessed Collectively
assessed Total Individually
assessed Collectively
assessed Total Germany 1,730 1,943 3,673 1,586 1,675 3,261
Western Europe (excluding Germany) 3,097 2,458 5,555 3,469 2,363 5,832
Eastern Europe 83 177 260 77 175 252
North America 384 2 387 588 1 590
Central and South America 33 0 33 32 0 32
Asia/Pacific 119 5 124 170 4 175
Africa 0 1 1 0 1 1
Other 1 0 1 0 0 0
Total 5,447 4,586 10,033 5,922 4,221 10,143
Jun 30, 2014 Dec 31, 2013
in €€ m. Individually
assessed Collectively
assessed Total Individually
assessed Collectively
assessed Total Banks and insurance 41 0 41 45 0 45
Fund management activities 81 0 81 92 1 93
Manufacturing 612 237 850 589 222 811
Wholesale and retail trade 387 230 617 441 220 661
Households 447 3,496 3,943 477 3,194 3,671
Commercial real estate activities 2,095 329 2,424 2,388 295 2,683
Public sector 45 0 45 39 0 39
Other1 1,738 294 2,032 1,849 289 2,139
Total 5,447 4,586 10,033 5,922 4,221 10,143
1 Includes mainly transportation and other services.

Development of Impaired Loans
In the first half of 2014 our impaired loans decreased by €€ 110 million or 1.1 % to €€ 10.0 billion as a result of charge-offs of €€ 892 million largely offset by a net increase in impaired loans of €€ 769 million as well as exchange rate movements of €€ 13 million. The overall decrease mainly resulted from a €€ 475 million reduction in individually assessed impaired loans being partially offset by €€ 365 million increase in collectively assessed impaired loans. The reduction in individually assessed impaired loans included several large transactions in commercial real estate activities in Western Europe (excluding Germany) and North America recorded in NCOU. The increase in collectively assessed impaired loans was mainly driven by new defaults in Households recorded in our Private & Business Clients division.
The impaired loan coverage ratio (defined as total on-balance sheet allowances for all loans individually impaired or collectively assessed divided by IFRS impaired loans (excluding collateral)) decreased from 55 % as of year-end 2013, to 52 % which is mainly attributable to an alignment of processes in the first quarter of 2014 at Postbank, which is described further below in the “Movements in the Allowance for Credit Losses” section.
Our impaired loans included €€ 1.0 billion of loans reclassified to loans and receivables in accordance with IAS 39. This position increased by €€ 7 million, which is mainly attributable to one commercial real estate item in Western Europe (excluding Germany).
Deutsche Bank Management Report 40Interim Report as of June 30, 2014 Risk Report
Asset Quality
Six months ended Jun 30, 2014 Full Year 2013
in €€ m. Individually
assessed Collectively
assessed Total Individually
assessed Collectively
assessed Total Balance, beginning of year 5,922 4,221 10,143 6,129 4,206 10,335
Classified as impaired during the year1 1,168 1,433 2,601 4,553 2,939 7,492
Transferred to not impaired during the year1 (813) (835) (1,648) (2,618) (2,134) (4,752)
Charge-offs (662) (230) (892) (730) (485) (1,215)
Disposals of impaired loans (175) (9) (184) (744) (293) (1,037)
Exchange rate and other movements 7 6 13 (669) (12) (680)2
Balance, end of period 5,447 4,586 10,033 5,922 4,221 10,143
1 Includes repayments. 2 Includes consolidated items because the Group obtained control over the structured entity borrowers by total €€ 598 million.

Movements in the Allowance for Credit Losses Our allowance for credit losses is comprised of the allowance for loan losses and the allowance for off-balance sheet positions.
Development of allowance for credit losses
Our allowance for credit losses was €€ 5.5 billion as at June 30, 2014, thereof 96 % or €€ 5.2 billion related to our loan portfolio and 4 % or €€ 238 million to off-balance sheet positions (predominantly loan commitments and guarantees). The allowance for loan losses is attributable 54 % to collectively assessed and 46 % to individually assessed loan losses. The net decrease in our allowance for loan losses of €€ 373 million compared with prior year end results from €€ 824 million of net charge-offs and €€ 23 million other changes, such as accretion on impaired loans and foreign exchange effects, partly offset by additions of €€ 474 million provisions. Our allowance for off-balance sheet positions increased net by €€ 22 million compared with prior year end mainly due to additional provisions.
Provision for credit losses recorded in the first half 2014 decreased by €€ 332 million or 40 % to €€ 496 million compared with the first half 2013. Our overall loan loss provisions decreased by €€ 338 million or 42 % in the first half 2014 compared with the first half 2013. This reduction results from our individually assessed loan portfolio, where provisioning declined by €€ 341 million reflecting lower provisions in NCOU and the non-recurrence of large single items in our Core business recorded in the first six months 2013. Provisions for our collectively assessed portfolio were almost flat compared to the first half of 2013 as provisioning in PBC remained stable, as the improvements caused by the good environment in Germany largely offset the one-off gain in 2013 from the sale of non-performing loan portfolios. Our overall provisions for off-balance sheet positions increased by €€ 6 million compared with previous year’s first half driven by CB&S as a result of higher charges for individually assessed positions.
Net charge-offs increased by €€ 391 million in the first half 2014 compared to the first half 2013 largely driven by the individually assessed loan portfolio at Postbank following an alignment of processes in the first quarter of 2014. These alignments resulted in an adjustment of the level of loan loss allowance for loans recorded at Postbank by €€ 233 million reflecting accelerated write-offs as well as the elimination of previous misclassification of recoveries in the credit quality of Postbank loans, which had been impaired after change of control, as interest income.
Deutsche Bank Management Report 41Interim Report as of June 30, 2014 Risk Report
Asset Quality
Six months ended Jun 30, 2014 Allowance for Loan Losses Allowance for Off-Balance Sheet Positions in €€ m. (unless stated otherwise)
Individually assessed
Collectively assessed Subtotal
Individually assessed
Collectively assessed Subtotal Total
Balance, beginning of year 2,857 2,732 5,589 102 114 216 5,805
Provision for credit losses 191 283 474 13 9 22 496 Thereof: (Gains)/Losses from disposal of impaired loans (40) (4) (44) 0 0 0 (44)
Net charge-offs: (640) (184) (824) 0 0 0 (824) Charge-offs (662) (230) (892) 0 0 0 (892) Recoveries 23 46 69 0 0 0 69
Changes in the group of consolidated companies 0 0 0 0 0 0 0
Exchange rate changes/other (16) (6) (23) 0 1 0 (22)
Balance, end of period 2,392 2,824 5,216 114 124 238 5,454
Changes compared to prior year
Provision for credit losses In €€ m. (341) 3 (338) 7 (1) 6 (332) In % (64) 1 (42) 142 (13) 38 (40)
Net charge-offs In €€ m. (319) (73) (391) 0 0 0 (391) In % 99 66 91 0 0 0 91

Our allowance for loan losses for IAS 39 reclassified assets, which are reported in NCOU, amounted to €€ 471 million as at June 30, 2014, representing 9 % of our total allowance for loan losses, slightly down from the €€ 479 million (9 % of total allowance for loan losses) at year end 2013. The slight reduction in the first six months of 2014 was a result of charge offs of €€ 44 million largely offset by additional provisions for loan losses of €€ 37 million.
Compared to the first half 2013, provision for loan losses for IAS 39 reclassified assets dropped by €€ 98 million to €€ 37 million and net charge offs decreased by €€ 126 million to €€ 44 million in the first six months of 2014. Both reductions result from the non-recurrence of large items in the present year compared to high levels in the comparison period.
Counterparty Credit Risk: Regulatory Assessment
This section provides details on our exposure at default (EAD) and RWA by regulatory defined exposure classes and model approaches, including our securitization positions. The tables presented for the current reporting period are based on the CRR/CRD 4 framework, while the comparative information for year-end 2013 is based on the then prevailing Basel 2.5 framework excluding the transitional adjustment according to section 64h (3) of the German Banking Act as valid through December 31, 2013. Quantitative information presented follows the regulatory scope of consolidation.
We generally apply the advanced internal rating based approach (IRBA) for the majority of our advanced IRBA eligible credit portfolios to calculate the regulatory capital requirements according to the CRR/CRD 4 framework, based on respective approvals received from BaFin. The advanced IRBA is the most sophisticated approach available under the regulatory framework for credit risk allowing us to make use of our internal rating methodologies as well as internal estimates of specific other risk parameters. Moreover, we apply the foundation IRBA for a portion of Postbank’s IRBA eligible credit portfolios, for which Postbank received respective BaFin approvals in recent years. Exposures which we do not treat under the advanced or the foundation IRBA are allocated either to “Other IRBA Exposure” or to the “Standardized Approach”.
Deutsche Bank Management Report 42Interim Report as of June 30, 2014 Risk Report
Counterparty Credit Risk: Regulatory Assessment
Six months ended Jun 30, 2013 Allowance for Loan Losses Allowance for Off-Balance Sheet Positions in €€ m. (unless stated otherwise)
Individually assessed
Collectively assessed Subtotal
Individually assessed
Collectively assessed Subtotal Total
Balance, beginning of year 2,266 2,426 4,692 118 97 215 4,907
Provision for credit losses 532 280 812 5 11 16 828 Thereof: (Gains)/Losses from disposal of impaired loans 4 (43) (39) 0 0 0 (39)
Net charge-offs: (321) (111) (432) 0 0 0 (432) Charge-offs (336) (199) (535) 0 0 0 (535) Recoveries 15 88 103 0 0 0 103
Changes in the group of consolidated companies 0 0 0 0 0 0 0
Exchange rate changes/other (45) (20) (65) 0 0 0 (65)
Balance, end of period 2,432 2,575 5,007 123 108 231 5,237
Changes compared to prior year
Provision for credit losses In €€ m. 83 (14) 69 17 9 26 95 In % 18 (5) 9 (144) 444 (260) 13
Net charge-offs In €€ m. 44 24 68 0 0 0 68 In % (12) (18) (14) 0 0 0 (14)

We have always met the regulatory minimum requirements with regard to the respective coverage ratio thresholds as calculated by EAD and RWA according to Section 10 SolvV applicable since January 1, 2014 and Section 67 SolvV applicable through December 31, 2013, respectively. Nevertheless, because institutions are urged to apply the advanced IRBA as comprehensively as possible, we continue our efforts to further enhance our respective coverage ratio. For a few remaining advanced IRBA eligible portfolios temporarily assigned to the standardized approach, an implementation plan and approval schedule have been set up and agreed with the competent authorities, the BaFin and the Bundesbank.
The BaFin approvals obtained as a result of the advanced IRBA audit processes for our counterparty credit exposures excluding Postbank allow the usage of 68 internally developed rating systems for regulatory capital calculation purposes. Postbank’s approvals, excluding PB Capital Corporation, obtained from the BaFin as a result of its IRBA audit processes for the counterparty credit exposures allow the usage of 13 internally developed rating systems for regulatory capital calculation purposes.
The line item “Other exposures” contains predominantly collective investment undertakings, equity exposures and non-credit obligations treated under other internal rating based approaches as well as remaining exposures classes for the standardized approach which do not fall under central governments, institutions, corporates or retail.
EAD and RWA according to the model approaches applied to our credit risk portfolios
Deutsche Bank Management Report 43Interim Report as of June 30, 2014 Risk Report
Counterparty Credit Risk: Regulatory Assessment
Jun 30, 2014 CRR/CRD 4
Advanced IRBA Foundation IRBA Other IRBA Standardized Approach Total
in €€ m. EAD RWA EAD RWA EAD RWA EAD RWA EAD RWA
Capital Require-
ments Central governments 107,774 4,408 0 0 0 0 74,838 222 182,612 4,631 370
Institutions 70,864 14,718 1 2 1,599 1,981 28,837 794 101,302 17,495 1,400
Corporates 277,210 96,024 5,741 2,019 9,554 6,277 23,207 15,640 315,712 119,959 9,597
Retail exposures secured by real estate property 154,062 24,320 0 0 0 0 0 0 154,062 24,320 1,946
Qualifying revolving retail exposures 4,450 558 0 0 0 0 0 0 4,450 558 45
Other retail exposures 32,941 12,876 0 0 0 0 12,972 7,919 45,913 20,795 1,664
Other exposures 2,613 6,533 0 0 7,607 21,016 26,305 11,003 36,525 38,551 3,084
Securitizations 49,240 13,173 0 0 0 0 2,066 2,229 51,306 15,402 1,232
Total 699,155 172,611 5,742 2,021 18,760 29,274 168,226 37,807 891,883 241,712 19,337
Thereof: counterparty credit risk from 128,903 37,382 161 117 574 1,125 37,804 2,645 167,442 41,269 3,302
Derivatives 74,954 33,467 161 117 574 1,125 34,074 2,520 109,763 37,228 2,978
Securities financing transactions 53,949 3,915 0 0 0 0 3,730 126 57,680 4,041 323

The movements in EAD in the exposure class “central governments” in the advanced IRBA resulted from higher positions in interest earning deposits with central banks.
The increase in EAD in the exposure class “institutions” within the advanced IRBA predominantly results from the transfer of the Postbank Large Cap Corporates / Financial Institutions portfolio and corresponds with the decrease in the exposure class “institutions” within the foundation IRBA. Furthermore the increase in RWA was primarily driven by growth in CB&S.
The increase in EAD and RWA in the exposure class “institutions” within the standardized approach mainly relates to central counterparties which are newly introduced into the RWA calculation according to the CRR/CRD 4 framework.
Overall we saw in the advanced IRBA an increase in EAD and RWA within the exposure class “corporate”, mainly resulting from growing business in CB&S and GTB and to a lesser extent also from above mentioned portfolio switch in the Postbank portfolio.
The decrease in EAD and RWA in the exposure class “retail exposures secured by real estate property” within the standardized approach is mainly a result of a re-design of the regulatory defined exposure class segmentation following the CRR/CRD 4 framework where this exposure has been entirely allocated to the exposure class “other retail exposures”.
The increase in EAD and RWA within the exposure class “other exposures” across all model approaches mainly results from components like deferred tax assets and financial sector entities newly considered within the RWA calculation as introduced by the CRR/CRD 4 framework.
The movement in the first six months of 2014 in the securitisation segment is driven by the CRR/CRD 4 framework where positions formerly being deducted from the capital, which now have to be included into RWA.
Deutsche Bank Management Report 44Interim Report as of June 30, 2014 Risk Report
Counterparty Credit Risk: Regulatory Assessment
Dec 31, 2013
Basel 2.5 Advanced IRBA Foundation IRBA Other IRBA Standardized Approach Total
in €€ m. EAD RWA EAD RWA EAD RWA EAD RWA EAD RWA
Capital Require-
ments Central governments 92,354 4,353 8 2 0 0 75,706 213 168,068 4,569 366
Institutions 60,912 9,175 5,592 1,320 0 0 4,976 198 71,481 10,693 855
Corporates 264,751 81,397 7,396 4,880 10,169 6,067 23,248 15,235 305,564 107,578 8,606
Retail exposures secured by real estate property 153,271 22,523 0 0 0 0 5,173 2,275 158,443 24,799 1,984
Qualifying revolving retail exposures 4,537 621 0 0 0 0 0 0 4,537 621 50
Other retail exposures 33,082 13,990 0 0 0 0 8,593 5,982 41,675 19,972 1,598
Other exposures 0 0 0 0 7,958 10,424 25,287 14,507 33,245 24,931 1,994
Securitizations 49,368 7,834 0 0 0 0 2,175 1,222 51,543 9,057 725
Total 658,273 139,894 12,997 6,202 18,127 16,490 145,159 39,633 834,557 202,219 16,178
Thereof: counterparty credit risk from 122,455 28,265 317 193 414 394 9,571 1,833 132,757 30,684 2,455
Derivatives 75,738 25,900 317 193 414 394 8,630 1,806 85,099 28,292 2,263
Securities financing transactions 46,716 2,365 0 0 0 0 941 27 47,657 2,392 191

Internal Ratings and Probability of Defaults All internal ratings and scorings are based on a uniform master scale, which assigns each rating or scoring result to the default probability determined for that class.
Internal ratings and their PD ranges
Advanced IRBA Exposure with Corporates The table below shows our advanced IRBA exposures with Corporates, including portfolios from Postbank. The presentation excludes counterparty credit risk exposures from derivatives and securities financing transactions (SFT). The exposures are distributed on our internal rating scale, showing also the probability of default (PD) range for each grade. Our internal ratings correspond to the respective external Standard & Poor’s rating equivalents. The EAD net is presented in conjunction with exposures-weighted average PD and loss given default (LGD), the RWA and the average risk weight (RW). The information is shown after credit risk mitigation obtained in the form of financial, physical and other collateral as well as guarantees and credit derivatives. The effect of double default, to the extent applicable to exposures outside of Postbank is considered in the average risk weight. It implies that for a guaranteed exposure a loss only occurs if the primary obligor and the guarantor fail to meet their obligations at the same time.
Deutsche Bank Management Report 45Interim Report as of June 30, 2014 Risk Report
Counterparty Credit Risk: Regulatory Assessment
Internal rating PD range in %1 iAAA > 0.00 ≤ 0.01
iAA+ > 0.01 ≤ 0.02
iAA > 0.02 ≤ 0.03
iAA– > 0.03 ≤ 0.04
iA+ > 0.04 ≤ 0.05
iA > 0.05 ≤ 0.07
iA– > 0.07 ≤ 0.11
iBBB+ > 0.11 ≤ 0.18
iBBB > 0.18 ≤ 0.30
iBBB– > 0.30 ≤ 0.50
iBB+ > 0.50 ≤ 0.83
iBB > 0.83 ≤ 1.37
iBB– > 1.37 ≤ 2.27
iB+ > 2.27 ≤ 3.75
iB > 3.75 ≤ 6.19
iB– > 6.19 ≤ 10.22
iCCC+ > 10.22 ≤ 16.87
iCCC > 16.87 ≤ 27.84
iCCC– > 27.84 ≤ 99.99
Default 100.00
1 Reflects the probability of default for a one year time horizon.

EAD net for Advanced IRBA Credit Exposures by PD Grade with Corporates (excluding derivatives and SFTs)
The majority of these exposures are assigned to investment-grade customers. The exposures in the lowest rating class are predominantly collateralized.
EAD levels increased over the reporting period, mainly in the second quarter 2014, primarily based on growth in CB&S and GTB. An additional contribution resulted from the transfer of Postbank Large Cap Corporates/Financial Institutions portfolio from Foundation IRBA to Advanced IRBA.
Foundation IRBA Exposure with Corporates The table below shows our foundation IRBA exposures with Corporates. It excludes counterparty credit risk exposures from derivatives and SFT. The exposure is distributed on our internal rating scale, showing also the PD range for each grade. The internal ratings correspond to the respective external Standard & Poor’s rating equivalents. The EAD net is presented in conjunction with risk-weighted assets calculated and the average RW. The information is shown after credit risk mitigation obtained in the form of financial, physical and other collateral as well as guarantees and credit derivatives.
Deutsche Bank Management Report 46Interim Report as of June 30, 2014 Risk Report
Counterparty Credit Risk: Regulatory Assessment
in €€ m. (unless stated otherwise)
Jun 30, 2014 CRR/CRD 4
Dec 31, 2013 Basel 2.5
Internal rating EAD net
Average PD in %1
Average LGD in % RWA
Average RW in %
EL/EAD in % EAD net
Average PD in %1
Average LGD in % RWA
Average RW in %
EL/EAD in %
iAAA 4,058 0.03 21.22 229 5.64 0.01 3,084 0.03 24.81 196 6.35 0.01
iAA+ 6,183 0.03 22.60 392 6.34 0.01 5,448 0.03 19.67 286 5.25 0.01
iAA 7,667 0.03 19.37 439 5.73 0.01 7,555 0.03 18.29 420 5.56 0.01
iAA– 10,941 0.04 33.83 1,572 14.36 0.01 11,213 0.04 31.29 922 8.22 0.01
iA+ 11,169 0.05 30.17 1,533 13.72 0.01 11,167 0.05 28.56 1,293 11.58 0.01
iA 16,730 0.07 31.30 2,855 17.06 0.02 14,927 0.07 31.28 2,349 15.73 0.02
iA– 18,387 0.09 38.12 4,515 24.56 0.03 17,690 0.09 35.62 3,705 20.95 0.03
iBBB+ 20,424 0.14 35.24 6,033 29.54 0.05 18,121 0.14 31.90 4,512 24.90 0.04
iBBB 18,494 0.23 31.27 6,087 32.91 0.07 18,145 0.23 32.54 5,984 32.98 0.07
iBBB– 18,376 0.39 32.28 8,129 44.23 0.12 16,884 0.39 31.05 6,885 40.78 0.11
iBB+ 11,759 0.64 30.78 5,788 49.22 0.18 9,958 0.64 32.21 5,436 54.60 0.20
iBB 11,980 1.07 26.94 6,588 54.99 0.27 11,819 1.07 28.10 6,835 57.83 0.30
iBB– 11,869 1.76 29.99 7,756 65.35 0.51 9,062 1.76 24.59 5,625 62.07 0.43
iB+ 7,552 2.92 22.10 5,018 66.45 0.63 6,452 2.92 19.94 3,969 61.51 0.84
iB 6,264 4.81 22.80 5,289 84.43 1.09 5,167 4.79 21.45 3,948 76.42 1.02
iB– 3,480 7.94 21.33 3,291 94.57 1.72 3,935 7.94 15.90 2,664 67.71 1.26
iCCC+ 1,243 13.00 22.27 1,316 105.82 2.59 1,140 13.00 14.58 809 70.94 1.89
iCCC 706 21.94 19.98 827 117.14 4.47 738 21.95 23.77 1,035 140.38 5.19
iCCC– 888 31.00 15.47 561 63.22 3.36 802 31.00 12.15 569 70.92 3.77
Default 9,109 100.00 24.73 2,030 22.28 N/M 9,975 100.00 25.77 2,405 24.11 N/M
Total 197,282 5.63 29.92 70,248 35.61 0.24 183,284 6.44 28.70 59,847 32.65 0.23
1 Higher average PD in % than defined for the internal rating scales iAAA and iAA+ results for Corporates exposure subject to a PD floor of 3 basis points.
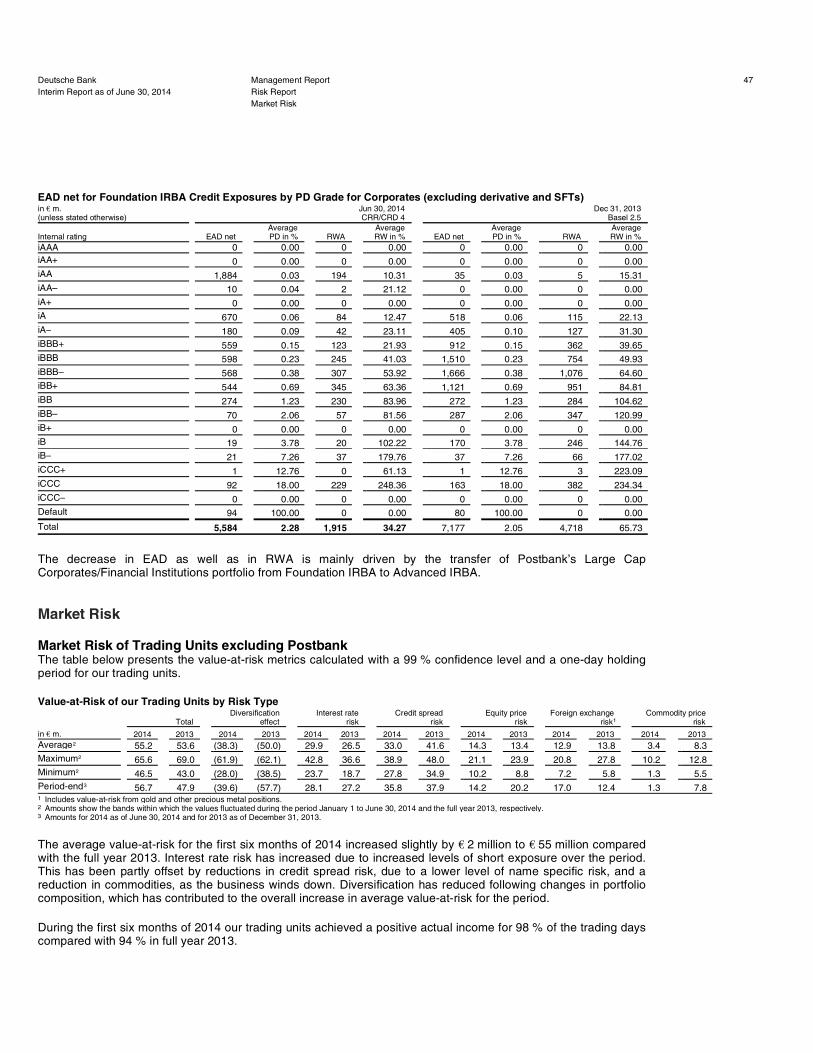
EAD net for Foundation IRBA Credit Exposures by PD Grade for Corporates (excluding derivative and SFTs)
The decrease in EAD as well as in RWA is mainly driven by the transfer of Postbank’s Large Cap Corporates/Financial Institutions portfolio from Foundation IRBA to Advanced IRBA.
Market Risk
Market Risk of Trading Units excluding Postbank The table below presents the value-at-risk metrics calculated with a 99 % confidence level and a one-day holding period for our trading units.
Value-at-Risk of our Trading Units by Risk Type
The average value-at-risk for the first six months of 2014 increased slightly by €€ 2 million to €€ 55 million compared with the full year 2013. Interest rate risk has increased due to increased levels of short exposure over the period. This has been partly offset by reductions in credit spread risk, due to a lower level of name specific risk, and a reduction in commodities, as the business winds down. Diversification has reduced following changes in portfolio composition, which has contributed to the overall increase in average value-at-risk for the period.
During the first six months of 2014 our trading units achieved a positive actual income for 98 % of the trading days compared with 94 % in full year 2013.
Deutsche Bank Management Report 47Interim Report as of June 30, 2014 Risk Report
Market Risk
in €€ m. (unless stated otherwise)
Jun 30, 2014 CRR/CRD 4
Dec 31, 2013 Basel 2.5
Internal rating EAD net Average
PD in % RWA Average
RW in % EAD net Average
PD in % RWA Average
RW in % iAAA 0 0.00 0 0.00 0 0.00 0 0.00
iAA+ 0 0.00 0 0.00 0 0.00 0 0.00
iAA 1,884 0.03 194 10.31 35 0.03 5 15.31
iAA– 10 0.04 2 21.12 0 0.00 0 0.00
iA+ 0 0.00 0 0.00 0 0.00 0 0.00
iA 670 0.06 84 12.47 518 0.06 115 22.13
iA– 180 0.09 42 23.11 405 0.10 127 31.30
iBBB+ 559 0.15 123 21.93 912 0.15 362 39.65
iBBB 598 0.23 245 41.03 1,510 0.23 754 49.93
iBBB– 568 0.38 307 53.92 1,666 0.38 1,076 64.60
iBB+ 544 0.69 345 63.36 1,121 0.69 951 84.81
iBB 274 1.23 230 83.96 272 1.23 284 104.62
iBB– 70 2.06 57 81.56 287 2.06 347 120.99
iB+ 0 0.00 0 0.00 0 0.00 0 0.00
iB 19 3.78 20 102.22 170 3.78 246 144.76
iB– 21 7.26 37 179.76 37 7.26 66 177.02
iCCC+ 1 12.76 0 61.13 1 12.76 3 223.09
iCCC 92 18.00 229 248.36 163 18.00 382 234.34
iCCC– 0 0.00 0 0.00 0 0.00 0 0.00
Default 94 100.00 0 0.00 80 100.00 0 0.00
Total 5,584 2.28 1,915 34.27 7,177 2.05 4,718 65.73
Total Diversification
effect Interest rate
risk Credit spread
risk Equity price
risk Foreign exchange
risk1 Commodity price
risk in €€ m. 2014 2013 2014 2013 2014 2013 2014 2013 2014 2013 2014 2013 2014 2013 Average 2 55.2 53.6 (38.3) (50.0) 29.9 26.5 33.0 41.6 14.3 13.4 12.9 13.8 3.4 8.3
Maximum 2 65.6 69.0 (61.9) (62.1) 42.8 36.6 38.9 48.0 21.1 23.9 20.8 27.8 10.2 12.8
Minimum 2 46.5 43.0 (28.0) (38.5) 23.7 18.7 27.8 34.9 10.2 8.8 7.2 5.8 1.3 5.5
Period-end 3 56.7 47.9 (39.6) (57.7) 28.1 27.2 35.8 37.9 14.2 20.2 17.0 12.4 1.3 7.8
1 Includes value-at-risk from gold and other precious metal positions. 2 Amounts show the bands within which the values fluctuated during the period January 1 to June 30, 2014 and the full year 2013, respectively. 3 Amounts for 2014 as of June 30, 2014 and for 2013 as of December 31, 2013.

Regulatory Trading Market Risk Measures In trading market risk the comprehensive risk measure and market risk standardized approach were partially impacted by the introduction of the new CRR/CRD 4 framework which is detailed in the respective sections.
Stressed Value-at-Risk The following table shows the stressed value-at-risk (with a 99 % confidence level and a one-day holding period) for our trading units.
Stressed Value-at-Risk by Risk Type
The average stressed value-at-risk for the first six months of 2014 was €€ 106 million and decreased by €€ 8 million compared with the full year 2013. The stressed value-at risk has reduced during the first half of 2014 most notably resulting from lower equity risk due to carrying greater downside protection, with some additional reductions resulting from foreign exchange risk and commodities price risk. Similar to value-at-risk there has been an increase in interest rate risk following increased short interest rate exposure and reduced average diversification due to changes in the composition of the portfolio.
Incremental Risk Charge For regulatory reporting purposes, the incremental risk charge for the respective reporting dates represents the higher of the spot value at the reporting dates and the value of the preceding 12-week average calculation. The incremental risk charge presented for the reporting dates below is the spot value and the average, maximum and minimum values calculated for the 12-week period preceding these reporting dates.
Incremental Risk Charge of Trading Units (with a 99.9 % confidence level and one-year capital horizon)
The incremental risk charge as at the end of the first six months of 2014 was €€ 1.3 billion and increased by €€ 341 million (34 %) compared with year end 2013. The 12-week average incremental risk charge for the first six months of 2014 was €€ 1.3 billion and thus €€ 338 million (35 %) higher compared with the average for the 12-week period preceding December 31, 2013. The increase was driven by a higher level of single name sovereign exposures and to a lesser extent from a methodology update.
Comprehensive Risk Measure For regulatory reporting purposes, the comprehensive risk measure for the respective reporting dates represents the highest of the spot value at the reporting dates, their preceding 12-week average calculation, and the floor, where the floor is equal to 8 % of the equivalent capital charge under the securitization framework. The comprehensive risk measure presented for the reporting dates below is the spot value and the average, maximum and minimum values calculated for the 12-week period preceding these reporting dates.
Deutsche Bank Management Report 48Interim Report as of June 30, 2014 Risk Report
Market Risk
Total Diversification
effect Interest rate
risk Credit spread
risk Equity price
risk Foreign exchange
risk1 Commodity price
risk in €€ m. 2014 2013 2014 2013 2014 2013 2014 2013 2014 2013 2014 2013 2014 2013 Average2 106.4 114.0 (119.4) (127.5) 63.9 59.3 117.6 118.1 13.4 19.2 24.0 29.6 7.0 15.2
Maximum2 140.6 169.2 (147.5) (166.8) 85.9 93.1 135.7 149.5 30.3 53.6 44.7 59.2 16.7 37.1
Minimum2 86.2 75.1 (102.3) (105.5) 48.8 44.4 100.7 90.0 5.7 4.3 13.7 12.1 4.0 7.1
Period-end3 109.9 105.5 (140.1) (125.3) 62.4 53.0 130.9 114.4 8.6 27.5 43.3 27.0 4.8 8.9
1 Includes value-at-risk from gold and other precious metal positions. 2 Amounts show the bands within which the values fluctuated during the period January 1 to June 30, 2014 and the full year 2013, respectively. 3 Amounts for 2014 as of June 30, 2014 and for 2013 as of December 31, 2013.
Total Global Finance and
Foreign Exchange Rates and
Credit Trading NCOU Emerging
Markets - Debt Other
in €€ m. 2014 2013 2014 2013 2014 2013 2014 2013 2014 2013 2014 2013 Average1 1,306.6 968.2 133.8 66.9 679.2 505.8 (42.6) (20.6) 271.8 179.5 264.4 236.5
Maximum1 1,415.0 1,044.8 253.4 82.4 822.9 603.4 (11.3) (3.7) 343.4 205.0 457.9 323.9
Minimum1 1,125.7 928.5 25.3 43.5 530.4 414.2 (60.0) (36.6) 203.7 156.1 180.7 185.1
Period-end2 1,336.4 995.6 168.5 82.4 693.4 563.4 (56.6) (3.9) 221.3 168.3 309.7 185.5
1 Amounts show the bands within which the values fluctuated during the 12-weeks preceding June 30, 2014 and December 31, 2013, respectively. 2 Amounts for 2014 as of June 30, 2014 and for 2013 as of December 31, 2013.

Comprehensive Risk Measure of Trading Units (with a 99.9 % confidence level and one-year capital horizon)
The comprehensive risk measure as at the end of the first six months of 2014 was €€ 181 million and decreased by €€ 43 million (19.0 %) compared with year end 2013. The 12-week average of our comprehensive risk measure for the first six months of 2014 was €€ 327 million and thus €€ 11 million (3.4 %) higher compared with the average for the 12-week period preceding December 31, 2013, mainly due to the impact of a higher floor applicable in the calculation under the CRR/CRD 4 framework which has been partly offset by de-risking.
Market Risk Standardized Approach Securitization positions in the trading book, including securitization positions in the correlation trading portfolio which are not eligible for the comprehensive risk measure, are subject to the market risk standardized approach for specific interest rate risk. In the Basel 2.5 framework, exposures that were unrated or rated below BB, were considered as capital deduction items and did not result in RWA. Under the new regulatory CRR/CRD 4 framework, which became effective on January 1, 2014, these exposures can no longer be deducted from capital but are included in the RWA calculation.
As of June 30, 2014, the securitization positions, for which the specific interest rate risk is calculated using the market risk standardized approach, generated capital requirements of €€ 2.5 billion corresponding to risk-weighted assets of €€ 31.6 billion. As of December 31, 2013, applying the CRR/CRD 4 framework these positions would have amounted to capital requirements of €€ 2.0 billion and risk-weighted assets of €€ 24.5 billion. The increase was primarily due to higher inventory levels and cancelled hedges.
Additionally, the capital requirement for investment funds under the market risk standardized approach was €€ 107 million corresponding to risk-weighted assets of €€ 1.3 billion as of June 30, 2014, compared with €€ 78 million and €€ 977 million as of December 31, 2013. The change was due to an increase in exposures in the portfolio.
For nth-to-default credit default swaps the capital requirement remained at €€ 5 million corresponding to risk-weighted assets of €€ 65 million compared with €€ 5 million and €€ 63 million as of December 31, 2013.
The capital requirement for longevity risk under the market risk standardized approach as of June 30, 2014 was €€ 30 million corresponding to risk-weighted assets of €€ 376 million compared with €€ 29 million and €€ 363 million as of December 31, 2013.
Market Risk of Trading Book at Postbank We calculate the Value-at-Risk of Postbank trading book with a 99 % confidence level and a one-day holding period. In line with Postbank’s trading book strategy the value-at-risk as of June 30, 2014 was maintained with €€ 0.1 million at the same level compared with December 31, 2013, and was mainly related to the foreign exchange risk.
Operational Risk
In the first half of 2014 our operational loss profile continued to be driven by legal operational risk losses including legal provisions even as the sum of both decreased compared to year-end 2013. For a more detailed description of our current litigations, please see Section “Other Contingencies” of this Interim Report. Our non-legal operational risk losses declined compared with the year-end 2013. The outlook for rest of year remains
Deutsche Bank Management Report 49Interim Report as of June 30, 2014 Risk Report
Operational Risk
in €€ m. 2014 2013 Average1 326.8 316.0
Maximum1 345.1 359.6
Minimum1 299.1 285.9
Period-end2 181.2 223.8
1 Amounts show the bands within which the values fluctuated during the 12-weeks preceding June 30, 2014 and December 31, 2013. 2 Amounts for 2014 as of June 30, 2014 and figures for 2013 as of December 31, 2013.

cautious, due to the legal and regulatory environment that we believe will continue to affect our business. Our operational risk management fosters a forward looking risk management with regard to monitoring of potential profits and losses, focusing on trend analyses based upon available losses and key risk indicator data.
Economic Capital Usage for Operational Risk by Business Division
The economic capital usage for operational risk as of June 30, 2014 was €€ 6.4 billion, €€ 1.1 billion or 22 %, higher compared to year-end 2013. The increase is mainly driven by a proactive recognition of the impact of model enhancements to our Advanced Measurement Approach (AMA) model, see below. This increase in economic capital is spread across all business divisions.
Operational Risk Framework Development We apply an Advanced Measurement Approach (AMA) for the Operational Risk regulatory capital calculation. The AMA model is subject to a continuous validation and enhancement in an effort to adequately reflect our risk profile. As part of the continuous enhancement and validation of our model we recently submitted model changes to BaFin and are awaiting approval. These model changes include an improved validation and recalibration methodology for insurance recoveries, changes to the modelling of the loss frequency as well as an enhanced scoring mechanism for the key risk indicators in the AMA model.
Further, we have submitted an additional model change request to BaFin to replace our €€ 1 billion safety margin, which we continuously apply since its implementation in 2011. This model change adds increased forward looking aspects to the AMA model. This change will make our model more risk sensitive by including reasonably possible litigation losses in our “Relevant Loss Data”. These reasonably possible litigation losses may result from both ongoing legal matters and new legal matters, which are reviewed quarterly and are based on the judgements of the counsel.
While our dialogue with BaFin on these model enhancements is on-going, management has decided to recognise the impact of these model changes where they will lead to an increase in capital requirement over our models that have previously been approved by BaFin.
Liquidity Risk
Composition of our external funding sources in euro billion and as a percentage of our total external funding sources
Reference: To reconcile to the total balance sheet, add derivatives & settlement balances €€ 558 billion (€€ 524 billion), netting effect for margin & prime brokerage cash balances (shown on a net basis) €€ 56 billion (€€ 50 billion), and other non-funding liabilities €€ 52 billion (€€ 55 billion) for June 30, 2014, and December 31, 2013, respectively.
Deutsche Bank Management Report 50Interim Report as of June 30, 2014 Risk Report
Liquidity Risk
2014 increase (decrease)
from 2013 in €€ m. (unless stated otherwise) Jun 30, 2014 Dec 31, 2013 in €€ m. in % Corporate Banking & Securities 3,095 2,475 620 25
Private & Business Clients 1,055 803 252 31
Global Transaction Banking 133 96 37 39
Deutsche Asset & Wealth Management 742 580 162 28
Non-Core Operations Unit 1,360 1,298 62 5
Total economic capital usage for operational risk 6,385 5,253 1,132 22
in €€ bn. (unless stated otherwise) Jun 30, 2014 Dec 31, 2013 Capital Markets and Equity 202 20% 185 19%
Retail 278 28% 282 29%
Transaction Banking 183 18% 178 18%
Other Customers1 80 8% 97 10%
Unsecured Wholesale 78 8% 73 7%
Secured Funding and Shorts 156 16% 150 15%
Financing Vehicles2 22 2% 19 2%
Total external funding 1,000 100% 984 100%
1 Other Customers includes fiduciary, self-funding structures (e.g. X-markets) and margin/prime brokerage cash balances (shown on a net basis). 2 Includes ABCP conduits.

The increase of capital markets and equity by €€ 17 billion during the first six months of 2014 reflects increased funding activities and the capital increase completed in June 2014. The higher amount of €€ 5 billion in transaction banking, of €€ 6 billion in secured funding and shorts and of €€ 4 billion in unsecured wholesale funding reflected increasing business activity in comparison to low year-end levels. The €€ 17 billion reduction in other customers was largely driven by a lower amount of net cash margin received and a reduction in liabilities relating to customer investments in exchange traded funds.
Our initial funding plan of €€ 20 billion for the full year was achieved in May 2014. The funding plan was increased to €€ 30-35 billion to fund additional business growth after our capital increase and to take advantage of good market conditions. During the first half of 2014, we raised €€ 24.8 billion at an average spread of 47 bps (Additional Tier 1 instruments are excluded from the spread calculation) over the relevant floating index (e.g. Libor), with an average tenor of 4.9 years. The most significant transaction over this period was Deutsche Bank’s inaugural €€ 3.5 billion Additional Tier 1 triple-tranche benchmark issue, split into a €€ 1.75 billion perpetual non-call 8 year tranche with a coupon of 6 %, a U.S.$ 1.25 billion perpetual non-call 6 year tranche with a coupon of 6.25 % and a GBP 0.65 billion perpetual non-call 12 year tranche with a coupon of 7.125 %. For the remainder of the year we intend to source the rest of our requirements through a variety of channels, including issuances targeted at retail investors, private placements with institutional investors and further public benchmark issuances.
Regular stress test analyses aim to ensure that we always hold sufficient cash and liquid assets to close a potential funding gap which could open under a combined scenario comprising idiosyncratic and market related stress. For this purpose we hold liquidity reserves which comprise available cash and cash equivalents, highly liquid securities (includes government, government guaranteed and agency securities) as well as other unencumbered central bank eligible assets. The volume of the liquidity reserves is a function of the expected stress result, both at an aggregate level as well as at an individual currency level. To the extent we receive incremental short-term wholesale liabilities which attract a high stress roll-off, we largely keep the proceeds of such liabilities in cash or highly liquid securities as a stress mitigant. As such, the total volume of liquidity reserves will fluctuate according to the level of short-term wholesale liabilities held, although this has no material impact on our overall liquidity position under stress. Liquidity reserves include only assets that are freely transferable within the group, or can be applied against local entity stress outflows. These reserves are held across major currencies and key locations in which the bank is active. The vast majority of our liquidity reserves are centrally held at our parent level or at our foreign branches. Size and composition are subject to regular senior management review. The haircuts applied reflect our assumption of the actual liquidity value that could be obtained, primarily through secured funding, and take into account the experience observed in secured funding markets at times of stress.
Composition of our liquidity reserves by parent company (including branches) and subsidiaries
Our liquidity reserves increased by €€ 3 billion or 2 % during the first six months of 2014 in comparison to year-end 2013.
Deutsche Bank Management Report 51Interim Report as of June 30, 2014 Risk Report
Liquidity Risk
Jun 30, 2014 Dec 31, 2013 in €€ bn. Carrying Value Liquidity Value Carrying Value Liquidity Value Available cash and cash equivalents (held primarily at central banks) 89 89 78 77
Parent (incl. foreign branches) 78 78 68 67
Subsidiaries 11 11 10 10
Highly liquid securities (includes government, government guaranteed and agency securities) 91 85 95 89
Parent (incl. foreign branches) 68 65 71 67
Subsidiaries 23 20 24 22
Other unencumbered central bank eligible securities 19 13 23 17
Parent (incl. foreign branches) 14 10 17 13
Subsidiaries 4 3 6 4
Total liquidity reserves 199 187 196 183
Parent (incl. foreign branches) 161 154 156 147
Subsidiaries 38 34 41 36

Capital Management
On June 25, 2014, Deutsche Bank AG completed a capital increase from authorized capital against cash contributions with gross proceeds of €€ 8.5 billion. The number of shares of Deutsche Bank AG has increased by 359.8 million, from 1,019.5 million to 1,379.3 million, and includes both the issuance of 59.9 million new shares without subscription rights to an anchor investor, and our fully underwritten public offering of 299.8 million new shares via subscription rights.
Prior to the launch of the fully underwritten rights offering, we issued 59.9 million new shares at a price of €€ 29.20 to Paramount Services Holdings Ltd., an investment vehicle ultimately beneficially owned and controlled by His Excellency Sheikh Hamad Bin Jassim Bin Jabor Al-Thani of Qatar, who intends to remain an anchor investor in Deutsche Bank. The transaction, which we structured as a capital increase excluding subscription rights, was not subject to the registration requirements of the U.S. Securities Act of 1933, and was not offered or sold in the United States. The gross proceeds of this offering were €€ 1.7 billion.
In the fully underwritten public offering with subscription rights, 299.8 million new registered no par value shares (common shares) were issued. The subscription price was €€ 22.50 per share. 99.1 % of the subscription rights were exercised. The remaining new shares that were not subscribed were sold in the market. The gross proceeds from the offering amounted to €€ 6.8 billion.
The 2013 Annual General Meeting granted our Management Board the authority to buy back up to 101.9 million shares before the end of April 2018. Thereof 51.0 million shares can be purchased by using derivatives. These authorizations replaced the authorizations of the 2012 Annual General Meeting. During the period from the 2013 Annual General Meeting until the 2014 Annual General Meeting (May 22, 2014), 31.3 million shares were purchased, of which 9.4 million via derivatives. The shares purchased were used for equity compensation purposes in the same period so that the number of shares held in Treasury from buybacks remained close to zero as of the 2014 Annual General Meeting.
The 2014 Annual General Meeting granted our Management Board the authority to buy back up to 101.9 million shares before the end of April 2019. Thereof 51.0 million shares can be purchased by using derivatives. These authorizations replaced the authorizations of the 2013 Annual General Meeting. We have received approval from the BaFin for the execution of these authorizations as required under new CRR/CRD 4 rules. During the period from the 2014 Annual General Meeting until June 30, 2014, no further shares were purchased. The number of shares held in Treasury from buybacks remained close to zero as of June 30, 2014.
Prior to the capital increase, the authorized capital available to the Management Board was €€ 922 million (360 million shares). With the capital increase, this was reduced to a total face value of €€ 0.6 million (0.2 million shares). In addition, the 2014 Annual General meeting authorized capital with a face value of €€ 256 million (100 million shares). Prior to the 2014 Annual General meeting, the conditional capital available to the Management Board was €€ 691 million (270 million shares). Following an authorization of new conditional capital of €€ 256 million (100 million shares) through a partial replacement of old authorizations, the conditional capital now stands at €€ 486 million (190 million shares). Moreover, the 2014 Annual General meeting authorized the issuance of participatory notes for the purpose of Additional Tier 1 capital.
On May 20, 2014, Deutsche Bank AG issued undated Additional Tier 1 Notes (the “AT1 Notes”), with an equivalent value of €€ 3.5 billion. The transaction is the first step towards reaching the overall targeted volume of approximately €€ 5 billion of CRR/CRD 4 compliant Additional Tier 1 capital which we plan to issue by the end of 2015.
Deutsche Bank Management Report 52Interim Report as of June 30, 2014 Risk Report
Capital Management

The offering consisted of three tranches: a €€ 1.75 billion tranche with a coupon of 6 %, a U.S.$ 1.25 billion tranche with a coupon of 6.25 % and a GBP 650 million tranche with a coupon of 7.125 %. All tranches were priced at an issue price of par (100 %) or greater. The denominations of the individual notes are €€ 100,000, U.S.$ 200,000 and GPB 100,000, respectively.
The AT1 Notes take the form of participatory notes with temporary write-down at a trigger level of 5.125 % phase-in Common Equity Tier 1 capital ratio. The AT1 Notes were issued with attached warrants, excluding shareholders’ pre-emptive rights. This decision is based on the authorization granted by the 2012 Annual General Meeting. Each AT1 Note carries one warrant, entitling the owner to purchase one common share in Deutsche Bank AG. Warrants to subscribe a total of 30,250 shares from all three tranches, which had originally been attached to the notes, were detached by an initial subscriber.
Our legacy Hybrid Tier 1 capital instruments (substantially all noncumulative trust preferred securities) are no longer recognized under CRR/CRD 4 fully-loaded rules mainly because they have no write-down or equity conversion feature. However, they are largely recognized as Additional Tier 1 capital under CRR/CRD 4 transitional provisions, and can still be partially recognized as Tier 2 capital under the CRR/CRD 4 fully-loaded rules. During the transitional phase-out period the maximum recognizable amount of Additional Tier 1 instruments from Basel 2.5 compliant issuances as of December 31, 2012 will be reduced at the beginning of each financial year by 10 % or €€ 1.3 billion, through 2022. For June 30, 2014, this resulted in eligible Additional Tier 1 instruments of €€ 13.5 billion (i.e., €€ 3.5 billion newly issued AT1 Notes plus €€ 10.0 billion of legacy Hybrid Tier 1 instruments recognizable during the transition period), compared with €€ 11.2 billion as of December 31, 2013 under CRR/CRD 4 transitional. Three Hybrid Tier 1 capital instruments with a notional of €€ 1.7 billion and an eligible equivalent amount of €€ 1.6 billion have been called in the first half 2014. €€ 8.9 billion of the legacy Hybrid Tier 1 instruments can still be recognized as Tier 2 capital under the CRR/CRD 4 fully loaded rules.
The Tier 2 instrument types (subordinated debt, profit participation rights, cumulative preferred securities) and the categorization into Upper and Lower Tier 2 capital according to Basel 2.5 no longer apply under CRR/CRD 4. All our former Basel 2.5-compliant Tier 2 capital instrument-types are considered as Tier 2 capital instruments according to CRR/CRD 4.
The total of our Tier 2 capital as of June 30, 2014 recognized during the transition period under CRR/CRD 4 was €€ 5.4 billion. Thereof, €€ 666 million were legacy Hybrid Tier 1 instruments that are counted as Tier 2 capital, representing the excess amount of the outstanding legacy Hybrid Tier 1 instruments above the respective cap during the transitional period (the so called ‘spill-over’). The gross notional value of the Tier 2 capital instruments was €€ 7.4 billion. The difference to the recognizable Tier 2 capital during the transition period under CRR/CRD 4 is mainly due to capital deductions for maturity haircuts, which provide for a straight proportional reduction of the eligible amount of an instrument in the last 5 years before maturity. Since December 31, 2013, thirteen Tier 2 capital instruments with a total notional of €€ 2.2 billion have been called in the first half of 2014.
Deutsche Bank Management Report 53Interim Report as of June 30, 2014 Risk Report
Capital Management

Regulatory Capital
Starting January 1, 2014, the calculation of our regulatory capital is based on the Basel 3 framework as implemented by the “Regulation (EU) No 575/2013 on prudential requirements for credit institutions and investment firms” as amended (Capital Requirements Regulation, or “CRR”), and the “Directive 2013/36/EU on access to the activity of credit institutions and the prudential supervision of credit institutions and investment firms” as amended (Capital Requirements Directive 4, or “CRD 4”) published on June 27, 2013 and implemented into German law by means of further amendments to the German Banking Act (KWG) and the German Solvency Regulation (SolvV) and accompanying regulations. Comparatives for year-end 2013 are provided on a pro forma basis as at that time the preceding Basel 2.5 framework as implemented into European and German law was still applicable. The information in this section as well as in the section “Development of risk-weighted Assets” is based on the regulatory principles of consolidation.
Under the CRR/CRD 4 transitional rules, capital instruments no longer eligible are phased-out while the new rules on regulatory adjustments are phased-in. These provisions are allowed in order to ease the transition for banks to the fully loaded capital rules. The fully loaded CRR/CRD 4 metrics do not take these transitional rules into account, (i.e. all capital instruments no longer eligible are excluded and all new regulatory adjustments are applied). In some cases, CRR/CRD 4 left in place unchanged transitional rules that had been adopted in earlier capital adequacy frameworks through Basel 2.5 regarding the risk weighting of certain categories of assets. These include rules permitting the grandfathering of equity investments at a risk-weight of 100 % and allowing the selection of the greater position of long and short positions as the basis for measurement in the Market Risk Standardized Approach rather than the sum of both long and short positions. In these cases, our CRR/CRD 4 methodology assumes that the impact of the expiration of these transitional rules will be mitigated through sales of the underlying assets or other measures prior to the expiration of the grandfathering provisions.
Summary of Regulatory Capital, RWA and Capital Ratios
Deutsche Bank Management Report 54Interim Report as of June 30, 2014 Risk Report
Regulatory Capital
Jun 30, 2014 Dec 31, 2013
in €€ m. CRR/CRD 4
fully-loaded CRR/CRD 4
Pro forma CRR/CRD 4
fully-loaded Pro forma
CRR/CRD 4 Basel 2.5 Common Equity Tier 1 capital before regulatory adjustments 63,438 63,481 53,846 53,557 53,558
Total regulatory adjustments to Common Equity Tier 1 (CET 1) capital (17,448) (4,665) (19,850) (1,824) (15,024)
Common Equity Tier 1 (CET 1) capital 45,990 58,816 33,995 51,733 38,534
Additional Tier 1 (AT1) capital before regulatory adjustments 3,468 13,956 0 11,741 12,701
Total regulatory adjustments to Additional Tier 1 (AT1) capital1 (19) (10,470) 0 (12,785) (519)
Additional Tier 1 (AT1) capital 3,449 3,485 0 0 12,182
Tier 1 capital (T1 = CET 1 + AT1) 49,440 62,302 33,995 51,733 50,717
Tier 2 (T2) capital before regulatory adjustments 13,144 5,432 14,291 6,085 7,787
Total regulatory adjustments to Tier 2 (T2) capital (32) (405) (107) (906) (3,040)
Tier 2 (T2) capital 13,112 5,026 14,184 5,179 4,747
Total Regulatory capital (TC = T1 + T2) 62,552 67,328 48,179 56,912 55,464
Total risk-weighted assets 398,674 401,211 350,143 355,127 300,369
Capital ratios
Common Equity Tier 1 capital ratio (as a percentage of risk-weighted assets) 11.5 14.7 9.7 14.6 12.8
Tier 1 capital ratio (as a percentage of risk-weighted assets) 12.4 15.5 9.7 14.6 16.9
Total Regulatory capital ratio (as a percentage of risk-weighted assets) 15.7 16.8 13.8 16.0 18.5
1 Qualifying AT1 deductions that exceed AT1 capital are deducted from CET 1 capital (reflected in “Total regulatory adjustments to Common Equity Tier 1 (CET 1) capital”).

Regulatory Capital, RWA and Capital Ratios
Deutsche Bank Management Report 55Interim Report as of June 30, 2014 Risk Report
Regulatory Capital
Jun 30, 2014 Dec 31, 2013
in €€ m. CRR/CRD 4
fully-loaded CRR/CRD 4
Pro forma CRR/CRD 4
fully-loaded Pro forma
CRR/CRD 4 Basel 2.5 Common Equity Tier 1 (CET 1) capital: instruments and reserves
Capital instruments and the related share premium accounts 37,210 37,210 28,789 28,789 28,789 Thereof: Ordinary shares1 37,210 37,210 28,789 28,789 28,789
Retained earnings 27,043 27,043 27,194 27,194 27,195
Accumulated other comprehensive income (1,593) (1,661) (2,039) (2,457) (2,457)
Funds for general banking risk 0 0 0 0 0
Amount of qualifying items referred to in Art. 484 (3) CRR and the related share premium accounts subject to phase out from CET 12 N/M 0 N/M 0 N/M
Public sector capital injections grandfathered until 1 January 2018 N/M N/M N/M N/M N/M
Noncontrolling Interests (amount allowed in consolidated CET 1) 0 111 0 130 130
Independently reviewed interim profits net of any foreseeable charge or dividend 779 779 (98) (98) (98)
Common Equity Tier 1 capital before regulatory adjustments 63,438 63,481 53,846 53,557 53,558
Common Equity Tier 1 capital: regulatory adjustments
Additional value adjustments (negative amount)2 N/M N/M N/M N/M N/M
Intangible assets (net of related tax liabilities) (negative amount) (12,027) (2,405) (11,466) 0 (11,466)
Deferred tax assets that rely on future profitability excluding those arising from temporary differences (net of related tax liabilities where the conditions in Art. 38 (3) CRR are met) (negative amount) (2,090) (418) (2,203) 0 0
Fair value reserves related to gains or losses on cash flow hedges (153) (153) (93) (93) 0
Negative amounts resulting from the calculation of expected loss amounts (723) (149) (987) 0 (430)
Any increase in equity that results from securitized assets (negative amount) 0 0 0 0 0
Gains or losses on liabilities designated at fair value resulting from changes in own credit standing3 (461) (116) (533) 3 (1)
Defined benefit pension fund assets (negative amount) (756) (151) (663) 0 0
Direct, indirect and synthetic holdings by an institution of own CET 1 instruments (negative amount)4 (62) (17) (36) 0 (3)
Holdings of the CET 1 instruments of financial sector entities where those entities have reciprocal cross holdings with the institution designed to inflate artificially the own funds of the institution (negative amount) 0 0 0 0 0
Direct, indirect and synthetic holdings by the institution of the CET 1 instruments of financial sector entities where the institution does not have a significant investment in those entities (amount above the 10 % threshold and net of eligible short positions) (negative amount)5 0 0 0 0 0
Direct, indirect and synthetic holdings by the institution of the CET 1 instruments of financial sector entities where the institution has a significant investment in those entities (amount above 10 % threshold and net of eligible short positions) (negative amount)6 0 0 0 0 (1,589)
Exposure amount of the following items which qualify for a Risk Weight of 1250 %, where the institution opts for the deduction alternative 0 0 0 0 (945)
Thereof: Qualifying holdings outside the financial sector (negative amount) 0 0 0 0 0 Securitization positions (negative amount) 0 0 0 0 (945) Free deliveries (negative amount) 0 0 0 0 0
Deferred tax assets arising from temporary differences (amount above 10 % threshold, net of related tax liabilities where the conditions in Art. 38 (3) CRR are met) (negative amount) (277) (55) (1,667) 0 0
Amount exceeding the 15 % threshold (negative amount) (558) (87) (1,828) 0 0 Thereof: Direct, indirect and synthetic holdings by the institution of the CET 1 instruments of financial sector entities where the institution has a significant investment in those entities (208) (32) (839) 0 0 Deferred tax assets arising from temporary differences (351) (54) (989) 0 0
Losses for the current financial year (negative amount) 0 0 0 0 0
Regulatory adjustments applied to CET 1 capital in respect of amounts subject to pre-CRR treatment: N/M 0 N/M 0 N/M
Regulatory adjustments relating to unrealized gains and losses pursuant to Art. 467 and 468 CRR7 N/M (774) N/M (316) (215)
Amount to be deducted from or added to CET 1 capital with regard to additional filters and deductions required pre CRR8 (340) (340) (374) (374) (374)

Deutsche Bank Management Report 56Interim Report as of June 30, 2014 Risk Report
Regulatory Capital
Jun 30, 2014 Dec 31, 2013
in €€ m. CRR/CRD 4
fully-loaded CRR/CRD 4
Pro forma CRR/CRD 4
fully-loaded Pro forma
CRR/CRD 4 Basel 2.5 Qualifying AT1 deductions that exceed the AT1 capital of the institution (negative amount) 0 0 0 (1,044) 0
Total regulatory adjustments to Common Equity Tier 1 (CET 1) capital (17,448) (4,665) (19,850) (1,824) (15,024)
Common Equity Tier 1 (CET 1) capital 45,990 58,816 33,995 51,733 38,534
Additional Tier 1 (AT1) capital: instruments
Capital instruments and the related share premium accounts 3,468 3,468 0 0 12,701 Thereof: Classified as equity under applicable accounting standards 0 0 0 0 0 Classified as liabilities under applicable accounting standards 0 0 0 0 12,701
Amount of qualifying items referred to in Art. 484 (4) CRR and the related share premium accounts subject to phase out from AT1 N/M 10,488 N/M 11,741 N/M
Public sector capital injections grandfathered until 1 January 2018 N/M N/M N/M N/M N/M
Tier 1 capital included in consolidated AT1 capital issued by subsidiaries and held by third parties 0 0 0 0 0
Thereof: instruments issued by subsidiaries subject to phase out N/M 0 N/M 0 N/M
Additional Tier 1 (AT1) capital before regulatory adjustments 3,468 13,956 0 11,741 12,701
Additional Tier 1 (AT1) capital: regulatory adjustments
Direct, indirect and synthetic holdings by an institution of own AT1 instruments (negative amount)9 (19) (486) 0 (519) (519)
Holdings of the AT1 instruments of financial sector entities where those entities have reciprocal cross holdings with the institution designed to inflate artificially the own funds of the institution (negative amount) 0 0 0 0 0
Direct, indirect and synthetic holdings of the AT1 instruments of financial sector entities where the institution does not have a significant investment in those entities (amount above the 10 % threshold and net of eligible short positions) (negative amount)5 0 0 0 0 0
Direct, indirect and synthetic holdings by the institution of the AT1 instruments of financial sector entities where the institution has a significant investment in those entities (amount above the 10 % threshold net of eligible short positions) (negative amount)6 0 0 0 0 0
Regulatory adjustments applied to AT1 capital in respect of amounts subject to pre-CRR treatment and transitional treatments subject to phase out as prescribed in CRR (i.e., residual amounts) N/M 0 N/M 0 N/M
Residual amounts deducted from AT1 capital with regard to deduction from CET 1 capital during the transitional period pursuant to Art. 472 CRR N/M (9,985) N/M (12,266) N/M
Thereof: Intangible assets N/M (9,622) N/M (11,466) N/M Shortfall of provisions to expected losses N/M (298) N/M (500) N/M Significant investments in the capital of other financial sector entities N/M (64) N/M (299) N/M
Residual amounts deducted from AT1 capital with regard to deduction from Tier 2 (T2) capital during the transitional period pursuant to Art. 475 CRR N/M 0 N/M 0 N/M
Amount to be deducted from or added to AT1 capital with regard to additional filters and deductions required pre CRR N/M 0 N/M 0 N/M
T2 deductions that exceed the T2 capital of the institution (negative amount) 0 0 0 0 0
Total regulatory adjustments to Additional Tier 1 (AT1) capital10 (19) (10,470) 0 (12,785) (519)
Additional Tier 1 (AT1) capital 3,449 3,485 0 0 12,182
Tier 1 capital (T1 = CET 1 + AT1)11 49,440 62,302 33,995 51,733 50,717
Tier 2 (T2) capital: instruments and provisions
Capital instruments and the related share premium accounts12 12,130 2,800 14,291 4,834 7,787
Amount of qualifying items referred to in Art. 484 (5) CRR and the related share premium accounts subject to phase out from T2 N/M 1,223 N/M 1,251 N/M
Public sector capital injections grandfathered until 1 January 2018 N/M N/M N/M N/M N/M
Qualifying own funds instruments included in consolidated T2 capital issued by subsidiaries and held by third parties 1,014 1,409 0 0 0
Thereof: instruments issued by subsidiaries subject to phase out N/M 0 N/M 0 N/M
Credit risk adjustments 0 0 0 0 0
Tier 2 (T2) capital before regulatory adjustments 13,144 5,432 14,291 6,085 7,787

Deutsche Bank Management Report 57Interim Report as of June 30, 2014 Risk Report
Regulatory Capital
Jun 30, 2014 Dec 31, 2013
in €€ m. CRR/CRD 4
fully-loaded CRR/CRD 4
Pro forma CRR/CRD 4
fully-loaded Pro forma
CRR/CRD 4 Basel 2.5 Tier 2 (T2) capital: regulatory adjustments
Direct, indirect and synthetic holdings by an institution of own T2 instruments and subordinated loans (negative amount)9 (32) (43) (107) (107) (75)
Holdings of the T2 instruments and subordinated loans of financial sector entities where those entities have reciprocal cross holdings with the institution designed to inflate artificially the own funds of the institution (negative amount) 0 0 0 0 0
Direct, indirect and synthetic holdings of the T2 instruments and subordinated loans of financial sector entities where the institution does not have a significant investment in those entities (amount above 10 % threshold and net of eligible short positions) (negative amount)5 0 0 0 0 0
Thereof: New holdings not subject to transitional arrangements N/M N/M N/M N/M N/M Holdings existing before 1 January 2013 and subject to transitional arrangements N/M N/M N/M N/M N/M
Direct, indirect and synthetic holdings by the institution of the T2 instruments and subordinated loans of financial sector entities where the institution has a significant investment in those entities (net of eligible short positions) (negative amount)6 0 0 0 0 0
Regulatory adjustments applied to Tier 2 in respect of amounts subject to pre-CRR treatment and transitional treatments subject to phase out as prescribed in CRR (i.e., residual amounts) N/M 0 N/M 0 N/M
Residual amounts deducted from Tier 2 capital with regard to deduction from Common Equity Tier 1 capital during the transitional period pursuant to Art. 472 CRR N/M (363) N/M (799) N/M
Thereof: Shortfall of provisions to expected losses N/M (298) N/M (500) N/M Significant investments in the capital of other financial sector entities N/M (64) N/M (299) N/M
Residual amounts deducted from Tier 2 capital with regard to deduction from Additional Tier 1 capital during the transitional period pursuant to Art. 475 CRR N/M 0 N/M 0 N/M Thereof: Reciprocal cross holdings in AT1 instruments N/M 0 N/M 0 N/M Direct holdings of non significant investments in the capital of other financial sector entities N/M 0 N/M 0 N/M
Amount to be deducted from or added to Additional Tier 2 capital with regard to additional filters and deductions required pre CRR 0 0 0 0 (2,965)
Total regulatory adjustments to Tier 2 (T2) capital (32) (405) (107) (906) (3,040)
Tier 2 (T2) capital 13,112 5,026 14,184 5,179 4,747
Total Regulatory capital (TC = T1 + T2) 62,552 67,328 48,179 56,912 55,464
Risk-weighted assets in respect of amounts subject to pre-CRR treatment and transitional treatments subject to phase out as prescribed in CRR (i.e., residual amounts)13 N/M 0 N/M 0 N/M
Thereof: Items not deducted from CET 1 (CRR residual amounts) N/M 0 N/M 0 N/M Items not deducted from AT1 items (CRR residual amounts) N/M 0 N/M 0 N/M Items not deducted from T2 items (CRR residual amounts) N/M 0 N/M 0 N/M
Thereof: Indirect and synthetic holdings of own T2 instruments N/M 0 N/M 0 N/M Indirect and synthetic holdings of non significant investments in the capital of other financial sector entities N/M 0 N/M 0 N/M Indirect and synthetic holdings of significant investments in the capital of other financial sector entities N/M 0 N/M 0 N/M
Total risk-weighted assets 398,674 401,211 350,143 355,127 300,369 Thereof: Credit Risk 239,175 241,712 219,967 224,951 202,219 Credit Valuation Adjustment (CVA) 21,318 21,318 12,389 12,389 N/M Market Risk 79,988 79,988 66,896 66,896 47,259 Operational Risk 58,193 58,193 50,891 50,891 50,891
Capital ratios and buffers
Common Equity Tier 1 capital ratio (as a percentage of risk-weighted assets) 11.5 14.7 9.7 14.6 12.8
Tier 1 capital ratio (as a percentage of risk-weighted assets) 12.4 15.5 9.7 14.6 16.9
Total Regulatory capital ratio (as a percentage of risk-weighted assets) 15.7 16.8 13.8 16.0 18.5

N/M – Not meaningful
Deutsche Bank Management Report 58Interim Report as of June 30, 2014 Risk Report
Regulatory Capital
Jun 30, 2014 Dec 31, 2013
in €€ m. CRR/CRD 4
fully-loaded CRR/CRD 4
Pro forma CRR/CRD 4
fully-loaded Pro forma
CRR/CRD 4 Basel 2.5 Institution specific buffer requirement (CET 1 requirement in accordance with Art. 92 (1) (a) CRR plus capital conservation and countercyclical buffer requirements, plus systemic risk buffer, plus the systemically important institution buffer (G-SII or O-SII buffer), expressed as a percentage of risk-weighted assets)14 9.0 4.0 9.0 4.0 0.0
Thereof: Capital conservation buffer requirement 2.5 0.0 2.5 0.0 0.0 Countercyclical buffer requirement15 N/M N/M N/M N/M N/M Systemic risk buffer requirement 0.0 0.0 0.0 0.0 0.0 Global Systemically Important Institution (G-SII) or Other Systemically Important Institution (O-SII) buffer16 2.0 0.0 2.0 0.0 0.0
Common Equity Tier 1 capital available to meet buffers (as a percentage of risk-weighted assets)17 5.5 9.2 3.7 9.1 0.0
Amounts below the thresholds for deduction (before risk weighting)
Direct, indirect and synthetic holdings of the capital of financial sector entities where the institution does not have a significant investment in those entities (amount below 10 % threshold and net of eligible short positions)5 3,361 3,361 3,097 3,097 0
Direct, indirect and synthetic holdings by the institution of the CET 1 instruments of financial sector entities where the institution has a significant investment in those entities (amount below 10 % threshold and net of eligible short positions)6 2,567 2,613 2,340 2,580 0
Deferred tax assets arising from temporary differences (amount below 10 % threshold, net of related tax liability where the conditions in Art. 38 (3) CRR are met) 4,332 4,411 2,760 3,044 0
Applicable caps on the inclusion of provisions in Tier 2 capital
Credit risk adjustments included in T2 in respect of exposures subject to standardized approach (prior to the application of the cap) 0 0 0 0 0
Cap on inclusion of credit risk adjustments in T2 under standardized approach 417 417 488 488 0
Credit risk adjustments included in T2 in respect of exposures subject to internal ratings-based approach (prior to the application of the cap) 0 0 0 0 0
Cap for inclusion of credit risk adjustments in T2 under internal ratings-base approach 967 967 984 984 894
Capital instruments subject to phase-out arrangements
Current cap on CET 1 instruments subject to phase out arrangements N/M 0 N/M 0 N/M
Amount excluded from CET 1 due to cap (excess over cap after redemptions and maturities) N/M 0 N/M 0 N/M
Current cap on AT1 instruments subject to phase out arrangements N/M 10,021 N/M 11,273 N/M
Amount excluded from AT1 due to cap (excess over cap after redemptions and maturities) N/M 666 N/M 0 N/M
Current cap on T2 instruments subject to phase out arrangements N/M 2,908 N/M 3,271 N/M
Amount excluded from T2 due to cap (excess over cap after redemptions and maturities) N/M 0 N/M 0 N/M
1 Based on EBA list as referred to in Article 26 (3) of CRR. 2 Final draft technical standard published by EBA is not yet adopted by European Commission. 3 Gains and losses on liabilities of the institution that are valued at fair value that result from changes in the own credit standing of the institution acc. Art. 33 (1) (b) CRR as well as all fair value
gains and losses arising from the institution’s own credit risk related to derivative liabilities acc Art. 33 (1) (c) CRR. 4 Excludes holdings that are already considered in the accounting base of Common Equity. Basel 2.5: amounts in compliance with Basel 2.5-regulations (i.a. only direct holdings). 5 Based on our current interpretation no deduction amount expected. Basel 2.5: amounts in compliance with Basel 2.5-regulations (i.a. only direct holdings and Basel 2.5 threshold). 6 Basel 2.5: amounts in compliance with Basel 2.5-regulations (i.a. only direct holdings and Basel 2.5 threshold). 7 Basel 2.5: amounts in compliance with Basel 2.5-regulations (i.a. prudential filter based on Consolidated Financial Statements Reconciliation Regulation “Konzernabschlussüberleitungs-
verordnung”). 8 Prudential filter for fund for home loans and savings protection (“Fonds zur bauspartechnischen Absicherung”) and for capital effects resulting from non financial at-equity investments. 9 Basel 2.5: amounts in compliance with Basel 2.5-regulations (i.a. only direct holdings). 10 Qualifying AT1 deductions that exceed AT1 capital are deducted from CET 1 capital (reflected in “Total regulatory adjustments to Common Equity Tier 1 (CET 1) capital”). 11Includes silent participations of €€ 19 million as of June 30, 2014 and of €€ 20 million as of December 31, 2013. 12 Amortisation is taken into account. 13 Excludes risk-weighted assets for positions in the trading book which are subject to phase out as prescribed in CRR (i.e., CRR residual amounts) as attributed risk-weighted assets are calculated
on a portfolio basis. 14 Art. 465 (1) (a) CRR requires a minimum Common Equity Tier 1 capital ratio of 4 % for the period from January 1, 2014 to December 31, 2014. Art. 92 (1) (a) CRR requires a minimum Common
Equity Tier 1 capital ratio of 4.5 % excluding additional capital buffer for the years after the aforementioned period. 15 Countercyclical buffer rates not yet available. 16 G-SII buffer as published in November 2013 by Financial Stability Board. 17 Calculated as the CET 1 capital less any CET 1 items used to meet Tier 1 and Total capital requirements.

Reconciliation of shareholders’ equity to regulatory capital
Development of Risk-weighted Assets The tables below provide an overview of risk-weighted assets broken down by model approach and business division. They include the aggregated effects of reallocations between the segments.
For the current reporting date the amounts presented are based on the CRR/CRD 4 framework according to the transitional rules. The amounts for the comparative period are presented on the then prevailing Basel 2.5 framework.
In line with our decision to scale down and discontinue parts of our commodities business, certain portfolios containing discontinued activities were aggregated under the Special Commodities Group (SCG), which has been subsequently transferred from CB&S to NCOU in the first quarter of 2014. The amounts for credit, market and operational risk RWA for the comparative period have been restated including related effects from reallocations between the segments, accordingly.
Deutsche Bank Management Report 59Interim Report as of June 30, 2014 Risk Report
Regulatory Capital
Jun 30, 2014 Dec 31, 2013
in €€ m. CRR/CRD 4
fully-loaded CRR/CRD 4
Pro forma CRR/CRD 4
fully-loaded Pro forma
CRR/CRD 4 Basel 2.5 Total shareholders’ equity per accounting balance sheet 64,686 64,686 54,719 54,719 54,719 Deconsolidation / Consolidation of entities (707) (707) (110) (110) (110)
Thereof: Additional paid-in capital (11) (11) (12) (12) (12) Retained earnings (764) (764) (516) (516) (516) Accumulated other comprehensive income, net of tax 68 68 418 418 418
Total shareholders’ equity per regulatory balance sheet 63,979 63,979 54,609 54,609 54,609
Noncontrolling interest based on transitional rules 0 111 0 130 130 Dividend accrual (541) (541) (765) (765) (765) Reversal of deconsolidation/consolidation of accumulated other comprehensive income, net of tax, during transitional period 0 (68) 0 (418) (418) Other 0 0 0 0 0
Common Equity Tier 1 (CET 1) capital before regulatory adjustments 63,438 63,481 53,846 53,557 53,558

Risk-weighted Assets by Model Approach and Business Division
Deutsche Bank Management Report 60Interim Report as of June 30, 2014 Risk Report
Regulatory Capital
Jun 30, 2014 CRR/CRD 4
in €€ m.
Corporate Banking &
Securities
Private & Business
Clients
Global Transaction
Banking
Deutsche Asset & Wealth
Management
Non-Core Operations
Unit
Consolidation & Adjustments
and Other Total Credit Risk 80,489 70,367 40,083 6,346 22,839 21,588 241,712
Segmental reallocation (529) 659 1,967 314 172 (2,583) 0
Advanced IRBA 71,408 52,408 30,957 2,878 13,412 1,547 172,611 Central Governments 3,239 57 873 1 51 188 4,408 Institutions 9,428 1,780 2,625 82 764 39 14,718 Corporates 50,836 8,269 26,284 2,391 7,039 1,204 96,024 Retail 120 36,633 28 110 864 0 37,755 Other 7,785 5,669 1,148 294 4,693 116 19,706
Foundation IRBA 0 2,021 0 0 0 0 2,021 Central Governments 0 0 0 0 0 0 0 Institutions 0 2 0 0 0 0 2 Corporates 0 2,019 0 0 0 0 2,019 Retail 0 0 0 0 0 0 0 Other 0 0 0 0 0 0 0
Other IRBA 4,942 7,597 91 624 2,604 13,416 29,274 Central Governments 0 0 0 0 0 0 0 Institutions 327 295 0 0 0 1,358 1,981 Corporates 1,893 4,197 67 0 121 0 6,277 Retail 0 0 0 0 0 0 0 Other 2,722 3,105 24 624 2,483 12,058 21,016
Standardized Approach 4,668 7,681 7,068 2,530 6,652 9,208 37,807 Central Governments 11 88 45 2 60 17 222 Institutions 516 121 110 8 7 32 794 Corporates 3,340 1,753 5,903 963 2,773 908 15,640 Retail 12 4,621 845 43 2,376 22 7,919 Other 789 1,098 166 1,514 1,436 8,229 13,232
Credit Valuation Adjustment (CVA) 17,060 453 10 394 3,400 0 21,318 Internal Model Approach 17,035 304 10 393 3,325 0 21,066 Standardized Approach 25 150 0 1 75 0 251
Market Risk 61,876 162 234 3,067 14,649 0 79,988 Internal Model Approach 37,351 0 234 1,730 7,178 0 46,493 Standardized Approach 24,525 162 0 1,336 7,471 0 33,495
Operational Risk 26,940 8,764 1,102 5,609 15,778 0 58,193 Advanced measurement approach 26,940 8,764 1,102 5,609 15,778 0 58,193
Total 186,365 79,746 41,429 15,416 56,666 21,589 401,211

The development of risk-weighted assets in the first half of 2014 was mainly impacted by the application of the new solvency rules under the CRR/CRD 4 framework, reflecting an increase in credit and market risk as well as introducing the new credit valuation adjustment charge.
The tables below provide an analysis of key drivers for risk-weighted asset movements observed for credit, market and operational risk in the reporting period. The comparative numbers for 2013 are presented on a Basel 2.5 basis and the current reporting period also starts the Basel 2.5 values at the beginning of the year. The end of period amounts are then based upon CRR/CRD 4 transitional rules. The changes in RWA due to the application of the new solvency rules under the CRR/CRD 4 framework are included in the methodology and policy category.
Deutsche Bank Management Report 61Interim Report as of June 30, 2014 Risk Report
Regulatory Capital
Dec 31, 2013
Basel 2.5
in €€ m.
Corporate Banking & Securities
Private & Business
Clients
Global Transaction
Banking
Deutsche Asset & Wealth
Management
Non-Core Operations
Unit
Consolidation & Adjustments
and Other Total Credit Risk 58,952 65,909 35,418 5,809 25,298 10,832 202,219
Segmental reallocation (850) 553 1,912 259 277 (2,152) 0
Advanced IRBA 53,598 42,651 26,140 2,589 14,104 813 139,894 Central Governments 2,922 90 896 5 258 181 4,353 Institutions 5,401 803 1,921 80 959 12 9,175 Corporates 40,970 5,638 22,378 2,398 9,394 620 81,397 Retail 124 35,844 33 106 1,027 0 37,134 Other 4,181 276 911 0 2,466 0 7,834
Foundation IRBA 0 5,937 0 0 264 0 6,202 Central Governments 0 0 0 0 2 0 2 Institutions 0 1,059 0 0 261 0 1,320 Corporates 0 4,879 0 0 1 0 4,880 Retail 0 0 0 0 0 0 0 Other 0 0 0 0 0 0 0
Other IRBA 2,330 8,046 87 440 3,163 2,424 16,490 Central Governments 0 0 0 0 0 0 0 Institutions 0 0 0 0 0 0 0 Corporates 1,367 4,630 67 0 2 0 6,067 Retail 0 0 0 0 0 0 0 Other 963 3,415 20 440 3,161 2,424 10,424
Standardized Approach 3,874 8,722 7,279 2,521 7,489 9,748 39,633 Central Governments 61 73 39 0 40 0 213 Institutions 28 116 12 8 32 1 198 Corporates 2,868 2,004 6,106 937 2,850 470 15,235 Retail 10 4,654 916 49 2,627 0 8,257 Other 906 1,876 206 1,526 1,941 9,275 15,729
Market Risk 33,435 128 562 2,085 11,050 0 47,259 Internal Model Approach 28,118 0 562 1,102 9,930 0 39,712 Standardized Approach 5,317 128 0 983 1,120 0 7,547
Operational Risk 22,342 6,964 832 4,659 16,095 0 50,891 Advanced measurement approach 22,342 6,964 832 4,659 16,095 0 50,891
Total 114,729 73,001 36,811 12,553 52,443 10,832 300,369

Development of Risk-weighted Assets for Credit Risk
The category “Book size” considers organic changes in our portfolio size and composition. “Book quality” mainly represents the effects from portfolio rating migrations, loss given default, model parameter re-calibrations as well as collateral coverage activities. Model refinements and advanced model roll out are included in “Model updates”. RWA movements resulting from external, regulatory-driven changes, e.g. applying new regulations, are considered in the “Methodology and policy” section. “Acquisition and disposals” is reserved to show significant exposure movements which can be clearly assigned to new businesses and disposal-related activities. Changes that cannot be attributed to the above categories are reflected in the category “Other”.
The increase in RWA for credit risk by €€ 39.5 billion or 19.5 % since December 31, 2013 is significantly determined by the introduction of the new CRR/CRD 4 regulatory framework. This effect is shown in the “Methodology and policy” category. The RWA change in the category “Model updates” represents the impact of a more restrictive application of the maturity capping which allows the bank to use a maturity of 1 year when calculating the credit risk RWA for derivatives depending on the market risk model applied for the Credit Valuation Adjustment (CVA) RWA. The increase in the category “Book size” predominantly shows the extended activities in our core business partially offset by reduction efforts resulting from de-risking activities in our non-core business. The decrease in the category “Acquisition and Disposals” primarily shows the impact of the sale of BHF-BANK in the first quarter 2014. The increase in the category “Other” mainly reflects effects on RWA in relation to applying the 10/15 % threshold rule subsequent to our share capital increase in the second quarter 2014.
On a fully loaded basis movements in RWA for credit risk in 2014 are quite comparable to the movements under the transitional rules mainly reflecting the introduction of the new CRR/CRD 4 regulatory framework. As of June 30, 2014, fully loaded RWA amounted to €€ 239.2 billion with the €€ 2.5 billion lower level compared with the RWA under transitional rules mainly attributable to lower RWA from our pension fund assets.
Development of Risk-weighted Assets for Credit Valuation Adjustment Based on the new CRR/CRD 4 regulatory framework, we are required to calculate RWA using the CVA which takes into account the credit quality of our counterparties. RWA for CVA covers the risk of mark-to-market losses on the expected counterparty risk in connection with OTC derivative exposures. We calculate the majority of the CVA based on our own internal model as approved by the BaFin. As of June 30, 2014, the RWA for CVA amounted to €€ 21.3 billion, representing an increase of €€ 8.9 billion (72 %) compared with our pro forma calculation of €€ 12.4 billion for December 31, 2013. The variance is due to changes in our CVA hedging strategy and also underlying portfolio and prevailing market conditions which impacted the expected exposures from the counterparty risk calculation under CVA.
Deutsche Bank Management Report 62Interim Report as of June 30, 2014 Risk Report
Regulatory Capital
Six months ended Jun 30, 2014 CRR/CRD 4
Twelve months ended Dec 31, 2013
Basel 2.5
in €€ m. Counterparty
credit risk
Thereof: derivatives and
repo-style transactions
Counterparty credit risk
Thereof: derivatives and
repo-style transactions
Credit risk RWA balance, beginning of year 202,2191 29,4541 228,952 35,274
Book size 4,428 2,945 (4,516) (2,167) Book quality 1,416 2,104 (9,701) (2,247) Model updates 6,161 6,161 (2,061) 0 Methodology and policy 24,110 297 0 0 Acquisition and disposals (1,711) (62) (5,467) (3) Foreign exchange movements 1,202 370 (4,988) (1,403) Other 3,888 0 0 0
Credit risk RWA balance, end of period 241,712 41,269 202,219 29,454
1 RWA balances beginning of the year 2014 are based on Basel 2.5.

Development of Risk-weighted Assets for Market Risk
The analysis for market risk covers movements in our internal models for value-at-risk, stressed value-at-risk, incremental risk charge and comprehensive risk measure as well as results from the market risk standardized approach, e.g. for trading securitizations and nth-to-default derivatives or trading exposures for Postbank. The market risk RWA movements due to changes in market data levels, volatilities, correlations, liquidity and ratings are included under the market data changes and recalibrations category. Changes to our market risk RWA internal models, such as methodology enhancements or risk scope extensions, are included in the category of model updates. In the methodology and policy category we reflect regulatory driven changes to our market risk RWA models and calculations. Significant new businesses and disposals would be assigned to the line item acquisition and disposals.
The €€ 32.7 billion (69 %) RWA increase for market risk since December 31, 2013 was primarily driven by increases in the category methodology and policy as well as movement in risk levels. There is an €€ 18.6 billion RWA increase for methodology and policy primarily from the Market Risk Standardized Approach for securitizations due to the new regulatory CRR/CRD 4 framework, which became effective on January 1, 2014. In the new framework we assign all retained securitization positions that are unrated or rated below BB a risk weight of 1,250 % to the exposure and these are now included in RWA whereas these exposures were previously considered capital deduction items. Also, under the new framework there is some increase in the floor applied to the comprehensive risk measure for the correlation trading portfolio. There has been an increase from movements in risk levels across a number of measures. The largest increase was due to the Market Risk Standardized Approach for securitizations, but increases were also seen in the incremental risk charge, from an increase in single name exposures and some increase from the value-at-risk and stressed value-at-risk models.
Development of Risk-weighted Assets for Operational Risk
The overall RWA increase of €€ 7.3 billion was mainly driven by our proactive, early recognition of enhancements to our Advanced Measurement Approach (AMA) model which led to additional RWA of €€ 7.7 billion. The increase was partly offset by loss profile changes (€€ 241 million reduction) and Acquisitions and Disposals due to the integration of DB Investment Services into our AMA model as per the first half of the year 2014 resulting in a RWA reduction of €€ 109 million.
Deutsche Bank Management Report 63Interim Report as of June 30, 2014 Risk Report
Regulatory Capital
in €€ m.
Six months ended Jun 30, 2014 CRR/CRD 4
Twelve months ended Dec 31, 2013
Basel 2.5 Market risk RWA balance, beginning of year 47,2591 53,058
Movement in risk levels 12,857 (8,598) Market data changes and recalibrations (625) 1,136 Model updates 679 542 Methodology and policy 19,770 1,200 Acquisitions and disposals (81) 0 Foreign exchange movements 128 (79)
Market risk RWA balance, end of period 79,988 47,259
1 RWA balance beginning of the year 2014 is based on Basel 2.5.
in €€ m.
Six months ended Jun 30, 2014 CRR/CRD 4
Twelve months ended Dec 31, 2013
Basel 2.5 Operational risk RWA balance, beginning of year 50,8911 51,595
Loss profile changes (internal and external) (241) 2,623 Expected loss development (74) (959) Forward looking risk component 75 (515) Model updates 7,651 1,885 Methodology and policy 0 0 Acquisitions and disposals (109) (3,738)
Operational risk RWA balance, end of period 58,193 50,891
1 RWA balance beginning of the year 2014 is based on Basel 2.5.

As an outlook, the embedded impacts from the AMA model enhancements on the other Operational Risk RWA components, specifically on the Expected Loss, will materialize subsequently to the expected BaFin model approval and implementation of the model changes.
Balance Sheet Management
We manage our balance sheet on a Group level and, where applicable, locally in each region. In the allocation of financial resources we favour business portfolios with the highest positive impact on our profitability and shareholder value. We monitor and analyze balance sheet developments and track certain market-observed balance sheet ratios. Based on this we trigger discussion and management action by the Capital and Risk Committee. Following the publication of the CRR/CRD 4 framework on June 27, 2013, we have established a new leverage ratio calculation according to the legally binding framework.
Reconciliation of Exposure Measures used for leverage ratio calculations
Our IFRS leverage ratio calculated as the ratio of total assets under IFRS to total equity under IFRS was 24 as of June 30, 2014, down compared with 29 at the end of 2013.
As of June 30, 2014, our fully loaded CRR/CRD 4 leverage ratio, which is a non-GAAP financial measure, was 3.4 %, compared with 2.4 % as of December 31, 2013, taking into account a fully loaded Tier 1 capital of €€ 49.4 billion over an applicable exposure measure of €€ 1,447 billion (€€ 34.0 billion and €€ 1,445 billion as of December 31, 2013, respectively).
Deutsche Bank Management Report 64Interim Report as of June 30, 2014 Risk Report
Balance Sheet Management
Jun 30,2014 Dec 31, 2013
in €€ bn. (unless stated otherwise)
Total Assets IFRS
CRR/CRD 4 fully loaded
Total Assets IFRS
CRR/CRD 4 pro forma
fully loaded Exposure Measure (spot value at reporting date) 1,665 1,447 1,611 1,445
Total Delta to IFRS (218) (167)
Major exposure components and breakdown of delta to IFRS from:
Derivatives1 489 339 509 373
Delta to IFRS from
Netting (391) (401)
Add-on 241 266
Securities Financing Transactions2 206 45 207 44
Delta to IFRS from
Supervisory Volatility Adjustments Approach3 (161) (163)
Remaining Assets 971 897 896 866
Delta to IFRS from
Pending Settlements Netting (73) (30)
Off-Balance Sheet Exposure 200 199
With 100 % credit conversion factor 185 185
With 50 % credit conversion factor 3 2
With 20 % credit conversion factor 8 8
With 10 % credit conversion factor 4 5
Adjustments4 (33) (38)
Total equity (IFRS) 68.4 55.0
Fully loaded Tier 1 capital 49.4 34.0
IFRS Leverage Ratio (in x) 24.3 29.3
Fully loaded CRR/CRD 4 Leverage Ratio (in %) 3.4 2.4
1 Including derivatives qualifying for hedge accounting. 2 Including Prime Brokerage receivables. 3 Includes regulatory netting, collateral recognition and supervisory haircuts, also for non-cash SFT. 4 Including transition from accounting to regulatory view as well as regulatory adjustments.

The main drivers for the above-shown improvements in the leverage ratios were our aforementioned capital increase, the issuance of CRR/CRD 4 compliant Additional Tier 1 Notes and our net income attributable to Deutsche Bank Shareholders in the first half of 2014, which together increased the respective capital measures.
In light of the introduction of the fully loaded CRR/CRD 4 leverage ratio, we discontinued both the calculation of our adjusted CRR/CRD 4 leverage ratio, which was calculated considering the phase-out methodology to derive an adjusted Tier 1 capital, as well as the adjusted IFRS leverage ratio, which was calculated after applying adjustments to reported total assets and total equity under IFRS.
Overall Risk Position
The table below shows our overall risk position as measured by the economic capital usage calculated for credit, market, operational and business risk for the dates specified. To determine our overall (nonregulatory) risk position, we generally consider diversification benefits across risk types.
Overall risk position as measured by economic capital usage by risk type
As of June 30, 2014, our economic capital usage amounted to €€ 30.0 billion, which was €€ 2.9 billion, or 11 %, above the €€ 27.2 billion economic capital usage as of December 31, 2013.
The economic capital usage for credit risk slightly decreased by €€ 90 million to €€ 11.9 billion as of June 30, 2014. This decrease is mainly driven by operational model improvements partly offset by increased exposure, primarily in GTB.
The economic capital usage for trading market risk increased to €€ 5.4 billion as of June 30, 2014, compared with €€ 4.2 billion at year-end 2013. This was mainly driven by increased exposures in the fair value banking book and in securitization. The nontrading market risk economic capital usage increased by €€ 539 million, largely driven by an increase in structural foreign exchange risk arising from our issuance of AT1 notes denominated in US dollars and Pound Sterling.
The economic capital usage for operational risk increased to €€ 6.4 billion as of June 30, 2014, compared with €€ 5.3 billion at year-end 2013. The increase is mainly driven by our proactive recognition of the impact of model enhancements to our Advanced Measurement Approach (AMA) model. The economic capital continues to include the safety margin applied in our AMA model, which was implemented in 2011 to cover unforeseen legal risks from the recent financial crisis.
Deutsche Bank Management Report 65Interim Report as of June 30, 2014 Risk Report
Overall Risk Position
2014 increase (decrease)
from 2013 in €€ m. (unless stated otherwise) Jun 30, 2014 Dec 31, 2013 in €€ m. in % Credit risk 11,923 12,013 (90) (1)
Market risk 14,456 12,738 1,718 13 Trading market risk 5,376 4,197 1,179 28 Nontrading market risk 9,080 8,541 539 6
Operational risk 6,385 5,253 1,132 22
Diversification benefit across credit, market and operational risk (5,730) (4,515) (1,215) 27
Economic capital usage for credit, market and operational risk 27,034 25,489 1,545 6
Business risk 3,004 1,682 1,322 79
Total economic capital usage 30,038 27,171 2,867 11

Our business risk economic capital methodology captures strategic risk, which also implicitly includes elements of refinancing and reputational risk, and a tax risk component. The business risk economic capital usage totaled €€ 3.0 billion as of June 30, 2014, which is €€ 1.3 billion or 79 % higher than the €€ 1.7 billion economic capital usage as of December 31, 2013. The increase reflected a higher economic capital usage for the strategic risk component driven by adjustments to the strategic plan for 2014.
The diversification effect of the economic capital usage across credit, market, operational risk and strategic risk increased by €€ 1.2 billion, or 27 %, as of June 30, 2014, mainly reflecting the increase in economic capital usage before diversification and a methodology update in the first quarter 2014, which relates among other things to the incorporation of strategic risk into the diversification calculation.
Internal Capital Adequacy
As the primary measure of our Internal Capital Adequacy Assessment Process (ICAAP) we assess our internal capital adequacy based on our “gone concern approach” as the ratio of our total capital supply divided by our total capital demand as shown in the table below. Our capital supply definition is aligned with the CRR/CRD 4 capital framework.
Internal Capital Adequacy
1 Includes deduction of fair value gains on own credit-effect relating to own liabilities designated under the fair value option as well as the debt valuation adjustments. 2 Includes fair value adjustments for assets reclassified in accordance with IAS 39 and for banking book assets where no matched funding is available. 3 Includes noncontrolling interest up to the economic capital requirement for each subsidiary.
A ratio of more than 100 % signifies that the total capital supply is sufficient to cover the capital demand determined by the risk positions. This ratio was 179 % as of June 30, 2014, compared with 167 % as of December 31, 2013. The change of the ratio was driven by increase in capital supply. Shareholders Equity Increased by €€ 10.0 billion mainly driven by the capital increase on June 25, 2014. Hybrid Tier 1 capital instruments increased by €€ 2.0 billion mainly driven by the issuance of Additional Tier 1 Notes on May 20, 2014. Further details are explained in the section “Capital Management”. The increase in capital demand was driven by higher economic capital requirement as explained in the section “Overall Risk Position”.
The above capital adequacy measures apply for the consolidated Group as a whole (including Postbank) and form an integral part of our Risk and Capital Management framework.
Deutsche Bank Management Report 66Interim Report as of June 30, 2014 Risk Report
Internal Capital Adequacy
in €€ m. (unless stated otherwise) Jun 30, 2014 Dec 31, 2013 Capital Supply
Shareholders’ Equity 64,686 54,719 Fair Value gains on own debt and debt valuation adjustments, subject to own credit risk1 (461) (537) Deferred Tax Assets (6,517) (7,071) Fair Value adjustments for financial assets reclassified to loans2 (13) (363) Noncontrolling Interests3 0 0 Hybrid Tier 1 capital instruments 14,137 12,182 Tier 2 capital instruments 7,354 9,689
Capital Supply 79,185 68,619
Capital Demand Economic Capital Requirement 30,038 27,171 Intangible Assets 14,112 13,932
Capital Demand 44,150 41,103
Internal Capital Adequacy Ratio in % 179 167

Deutsche Bank Confirmations 67Interim Report as of June 30, 2014 Responsibility Statement by the Management Board

Deutsche Bank Confirmations 68Interim Report as of June 30, 2014 Review Report

Consolidated Statement of Income (unaudited)
Income Statement
Earnings per Common Share
Deutsche Bank Consolidated Financial Statements 69Interim Report as of June 30, 2014 Consolidated Statement of Income (unaudited)
Three months ended Six months ended in €€ m. Jun 30, 2014 Jun 30, 2013 Jun 30, 2014 Jun 30, 2013 Interest and similar income 6,362 6,656 12,608 13,249
Interest expense 2,696 3,004 5,567 5,948
Net interest income 3,666 3,651 7,041 7,301
Provision for credit losses 250 473 496 828
Net interest income after provision for credit losses 3,417 3,178 6,545 6,474
Commissions and fee income 3,070 3,106 6,108 6,101
Net gains (losses) on financial assets/liabilities at fair value through profit or loss 1,253 1,234 2,870 3,931
Net gains (losses) on financial assets available for sale 24 24 97 133
Net income (loss) from equity method investments 173 105 327 141
Other income (loss) (326) 94 (190) (2)
Total noninterest income 4,194 4,563 9,212 10,305
Compensation and benefits 2,991 3,203 6,339 6,752
General and administrative expenses 3,566 3,561 6,575 6,379
Policyholder benefits and claims 80 (7) 132 185
Impairment of intangible assets 0 0 0 0
Restructuring activities 57 192 113 257
Total noninterest expenses 6,693 6,950 13,159 13,572
Income before income taxes 917 792 2,597 3,206
Income tax expense 679 457 1,256 1,211
Net income 238 335 1,341 1,995
Net income attributable to noncontrolling interests 1 1 21 10
Net income attributable to Deutsche Bank shareholders 237 334 1,320 1,985
Three months ended Six months ended Jun 30, 2014 Jun 30, 2013 Jun 30, 2014 Jun 30, 2013 Earnings per common share:1
Basic €€ 0.21 €€ 0.32 €€ 1.20 €€ 1.96
Diluted €€ 0.21 €€ 0.31 €€ 1.17 €€ 1.90
Number of shares in million:1
Denominator for basic earnings per share – weighted-average shares outstanding 1,121.1 1,046.4 1,097.3 1,015.1
Denominator for diluted earnings per share – adjusted weighted-average shares after assumed conversions 1,149.5 1,075.3 1,127.3 1,045.7
1 The number of average basic and diluted shares outstanding has been adjusted for all periods in order to reflect the effect of the bonus component of subscription rightsissued in June 2014 in connection with the capital increase.
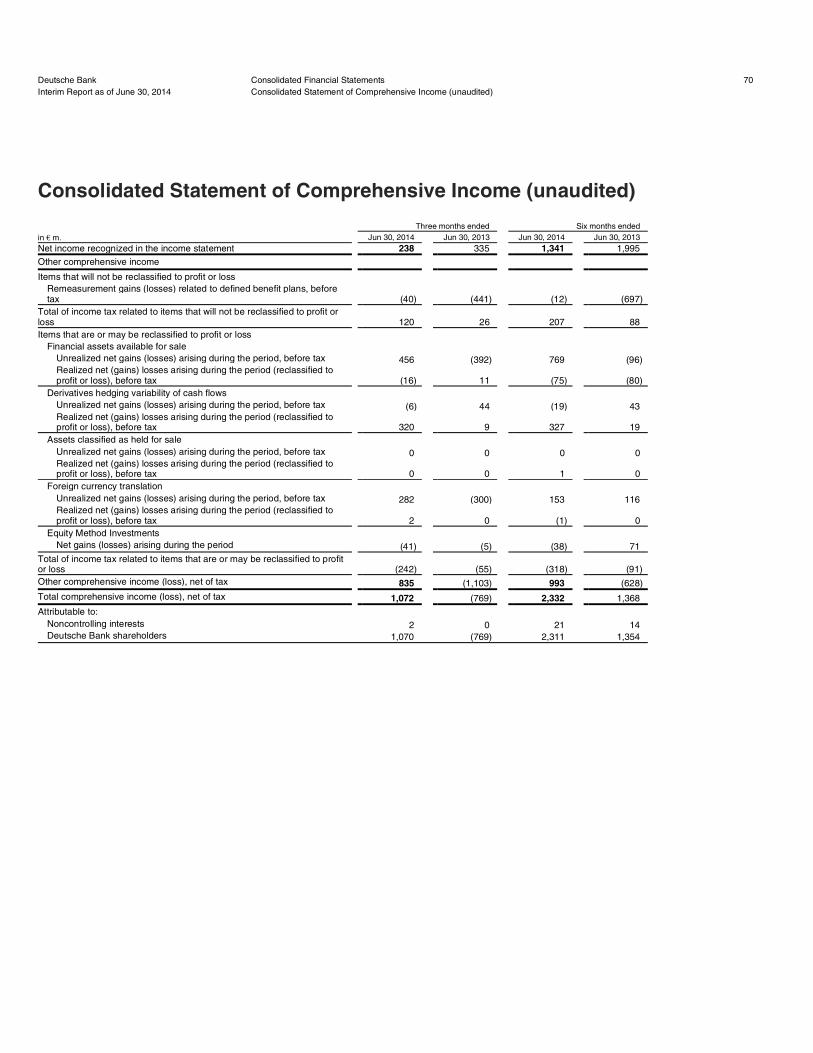
Consolidated Statement of Comprehensive Income (unaudited)
Deutsche Bank Consolidated Financial Statements 70Interim Report as of June 30, 2014 Consolidated Statement of Comprehensive Income (unaudited)
Three months ended Six months ended in €€ m. Jun 30, 2014 Jun 30, 2013 Jun 30, 2014 Jun 30, 2013 Net income recognized in the income statement 238 335 1,341 1,995
Other comprehensive income
Items that will not be reclassified to profit or loss Remeasurement gains (losses) related to defined benefit plans, before tax (40) (441) (12) (697)
Total of income tax related to items that will not be reclassified to profit or loss 120 26 207 88
Items that are or may be reclassified to profit or loss Financial assets available for sale
Unrealized net gains (losses) arising during the period, before tax 456 (392) 769 (96) Realized net (gains) losses arising during the period (reclassified to profit or loss), before tax (16) 11 (75) (80)
Derivatives hedging variability of cash flows Unrealized net gains (losses) arising during the period, before tax (6) 44 (19) 43 Realized net (gains) losses arising during the period (reclassified to profit or loss), before tax 320 9 327 19
Assets classified as held for sale Unrealized net gains (losses) arising during the period, before tax 0 0 0 0 Realized net (gains) losses arising during the period (reclassified to profit or loss), before tax 0 0 1 0
Foreign currency translation Unrealized net gains (losses) arising during the period, before tax 282 (300) 153 116 Realized net (gains) losses arising during the period (reclassified to profit or loss), before tax 2 0 (1) 0
Equity Method Investments Net gains (losses) arising during the period (41) (5) (38) 71
Total of income tax related to items that are or may be reclassified to profit or loss (242) (55) (318) (91)
Other comprehensive income (loss), net of tax 835 (1,103) 993 (628)
Total comprehensive income (loss), net of tax 1,072 (769) 2,332 1,368
Attributable to: Noncontrolling interests 2 0 21 14 Deutsche Bank shareholders 1,070 (769) 2,311 1,354

Consolidated Balance Sheet (unaudited)
Assets
Liabilities and Equity
Deutsche Bank Consolidated Financial Statements 71Interim Report as of June 30, 2014 Consolidated Balance Sheet (unaudited)
in €€ m. Jun 30, 2014 Dec 31, 2013 Cash and due from banks 21,096 17,155
Interest-earning deposits with banks 84,076 77,984
Central bank funds sold and securities purchased under resale agreements 28,827 27,363
Securities borrowed 25,147 20,870
Financial assets at fair value through profit or loss Trading assets 210,991 210,070 Positive market values from derivative financial instruments 484,769 504,590 Financial assets designated at fair value through profit or loss 176,139 184,597
Total financial assets at fair value through profit or loss 871,899 899,257
Financial assets available for sale 55,013 48,326
Equity method investments 3,584 3,581
Loans 387,901 376,582
Property and equipment 2,937 4,420
Goodwill and other intangible assets 14,112 13,932
Other assets 162,628 112,539
Income tax assets1 8,190 9,393
Total assets 1,665,410 1,611,400
in €€ m. Jun 30, 2014 Dec 31, 2013 Deposits 537,309 527,750
Central bank funds purchased and securities sold under repurchase agreements 13,426 13,381
Securities loaned 3,957 2,304
Financial liabilities at fair value through profit or loss Trading liabilities 51,989 55,804 Negative market values from derivative financial instruments 471,922 483,428 Financial liabilities designated at fair value through profit or loss 97,561 90,104 Investment contract liabilities 8,253 8,067
Total financial liabilities at fair value through profit or loss 629,725 637,404
Other short-term borrowings 56,623 59,767
Other liabilities 197,291 163,595
Provisions2 5,184 4,524
Income tax liabilities1 2,842 2,701
Long-term debt 140,536 133,082
Trust preferred securities 10,118 11,926
Obligation to purchase common shares 0 0
Total liabilities 1,597,009 1,556,434
Common shares, no par value, nominal value of €€ 2.56 3,531 2,610
Additional paid-in capital 33,696 26,204
Retained earnings 29,126 28,376
Common shares in treasury, at cost (5) (13)
Equity classified as obligation to purchase common shares 0 0
Accumulated other comprehensive income (loss), net of tax3 (1,661) (2,457)
Total shareholders’ equity 64,686 54,719
Additional equity components4 3,452 0
Noncontrolling interests 263 247
Total equity 68,401 54,966
Total liabilities and equity 1,665,410 1,611,400
1 Income tax assets and income tax liabilities comprise both deferred and current taxes. 2 Included are operational/litigation provisions of €€ 2.5 billion and €€ 2.1 billion as of June 30, 2014 and December 31, 2013, respectively. 3 Excluding remeasurement effects related to defined benefit plans, net of tax. 4 Includes Additional Tier 1 Notes, which constitute unsecured and subordinated notes of Deutsche Bank and are classified as equity in accordance with IFRS.

Consolidated Statement of Changes in Equity (unaudited)
Deutsche Bank Consolidated Financial Statements 72Interim Report as of June 30, 2014 Consolidated Statement of Changes in Equity (unaudited)
in €€ m.
Common shares
(no par value) Additional
paid-in capital Retained
earnings
Common shares
in treasury, at cost
Equity classified as obligation to
purchase common shares
Unrealized net gains (losses)
on financial assets available
for sale, net of applicable tax
and other Balance as of December 31, 2012 2,380 23,776 29,199 (60) 0 468
Total comprehensive income, net of tax2 0 0 1,985 0 0 (123)
Common shares issued 230 2,731 0 0 0 0
Cash dividends paid 0 0 (764) 0 0 0
Remeasurement gains (losses) related to defined benefit plans, net of tax 0 0 (609) 0 0 0
Net change in share awards in the reporting period 0 (94) 0 0 0 0
Treasury shares distributed under share-based compensation plans 0 0 0 541 0 0
Tax benefits related to share-based compensation plans 0 2 0 0 0 0
Additions to Equity classified as obligation to purchase common shares 0 0 0 0 (1) 0
Deductions from Equity classified as obligation to purchase common shares 0 0 0 0 0 0
Option premiums and other effects from options on common shares 0 (49) 0 0 0 0
Purchases of treasury shares 0 0 0 (7,695) 0 0
Sale of treasury shares 0 0 0 7,195 0 0
Net gains (losses) on treasury shares sold 0 (51) 0 0 0 0
Other 0 79 0 0 0 0
Balance as of Jun 30, 2013 2,610 26,394 29,810 (18) (1) 345
Balance as of December 31, 2013 2,610 26,204 28,376 (13) 0 303
Total comprehensive income, net of tax2 0 0 1,320 0 0 496
Common shares issued 921 7,587 0 0 0 0
Cash dividends paid 0 0 (765) 0 0 0
Remeasurement gains (losses) related to defined benefit plans, net of tax 0 0 195 0 0 0
Net change in share awards in the reporting period 0 61 0 0 0 0 Treasury shares distributed under share-based compensation plans 0 0 0 393 0 0
Tax benefits related to share-based compensation plans 0 (32) 0 0 0 0
Additions to Equity classified as obligation to purchase common shares 0 0 0 0 0 0
Deductions from Equity classified as obligation to purchase common shares 0 0 0 0 0 0
Option premiums and other effects from options on common shares 0 (47) 0 0 0 0
Purchases of treasury shares 0 0 0 (5,156) 0 0
Sale of treasury shares 0 0 0 4,771 0 0
Net gains (losses) on treasury shares sold 0 (8) 0 0 0 0
Other3 0 (69) 0 0 0 0
Balance as of Jun 30, 2014 3,531 33,696 29,126 (5) 0 798
1 Includes Additional Tier 1 Notes, which constitute unsecured and subordinated notes of Deutsche Bank and are classified as equity in accordance with IFRS. 2 Excluding remeasurement gains (losses) related to defined benefit plans, net of tax. 3 Includes net proceeds from issuance, repurchase and sale of Additional Equity Components.

Deutsche Bank Consolidated Financial Statements 73Interim Report as of June 30, 2014 Consolidated Statement of Changes in Equity (unaudited)
Unrealized net gains (losses) on derivatives
hedging variability
of cash flows, net of tax
Unrealized net gains (losses)
on assets classified as
held for sale, net of tax
Foreign currency
translation, net of tax
Unrealized net gains (losses)
from equity method
investments
Accumulated other
comprehensive income (loss),
net of tax
Total shareholders’
equity
Additional equity
components1 Noncontrolling
interests Total equity (159) 0 (1,593) (10) (1,294) 54,001 0 239 54,240
24 0 6 71 (22) 1,963 0 14 1,977
0 0 0 0 0 2,961 0 0 2,961
0 0 0 0 0 (764) 0 0 (764)
0 0 0 0 0 (609) 0 0 (609)
0 0 0 0 0 (94) 0 0 (94)
0 0 0 0 0 541 0 0 541
0 0 0 0 0 2 0 0 2
0 0 0 0 0 (1) 0 0 (1)
0 0 0 0 0 0 0 0 0
0 0 0 0 0 (49) 0 0 (49)
0 0 0 0 0 (7,695) 0 0 (7,695)
0 0 0 0 0 7,195 0 0 7,195
0 0 0 0 0 (51) 0 0 (51)
0 0 0 0 0 79 0 3 82
(134) 0 (1,587) 60 (1,316) 57,479 0 256 57,735
(101) 2 (2,713) 53 (2,457) 54,719 0 247 54,966
163 1 175 (38) 796 2,116 0 21 2,137
0 0 0 0 0 8,508 0 0 8,508
0 0 0 0 0 (765) 0 (4) (769)
0 0 0 0 0 195 0 0 195
0 0 0 0 0 61 0 0 61
0 0 0 0 0 393 0 0 393
0 0 0 0 0 (32) 0 0 (32)
0 0 0 0 0 0 0 0 0
0 0 0 0 0 0 0 0 0
0 0 0 0 0 (47) 0 0 (47)
0 0 0 0 0 (5,156) 0 0 (5,156)
0 0 0 0 0 4,771 0 0 4,771
0 0 0 0 0 (8) 0 0 (8)
0 0 0 0 0 (69) 3,452 (2) 3,381
62 3 (2,538) 15 (1,661) 64,686 3,452 263 68,401

Consolidated Statement of Cash Flows (unaudited)
Deutsche Bank Consolidated Financial Statements 74Interim Report as of June 30, 2014 Consolidated Statement of Cash Flows (unaudited)
Six months ended in €€ m. Jun 30, 2014 Jun 30, 2013 Net income 1,341 1,995
Cash flows from operating activities: Adjustments to reconcile net income to net cash provided by (used in) operating activities:
Provision for credit losses 496 828 Restructuring activities 113 257 Gain on sale of financial assets available for sale, equity method investments, and other (174) (184) Deferred income taxes, net 833 598 Impairment, depreciation and other amortization, and accretion 1,158 1,194 Share of net income (loss) from equity method investments (285) (198)
Income adjusted for noncash charges, credits and other items 3,482 4,490
Adjustments for net change in operating assets and liabilities: Interest-earning time deposits with banks (9,120) 23,667 Central bank funds sold, securities purchased under resale agreements, securities borrowed (5,602) (4,613) Financial assets designated at fair value through profit or loss 9,041 (5,292) Loans (10,581) 8,841 Other assets (54,992) (70,022) Deposits 9,006 (22,724) Financial liabilities designated at fair value through profit or loss and investment contract liabilities1 7,396 (12,611) Central bank funds purchased, securities sold under repurchase agreements and securities loaned 1,648 (8,432) Other short-term borrowings (3,254) 1,934 Other liabilities 40,420 71,554 Senior long-term debt2 9,378 (14,072) Trading assets and liabilities, positive and negative market values from derivative financial instruments, net 3,939 20,061 Other, net (642) 1,580
Net cash provided by (used in) operating activities 119 (5,639)
Cash flows from investing activities: Proceeds from:
Sale of financial assets available for sale 7,590 6,281 Maturities of financial assets available for sale 5,156 6,544 Sale of equity method investments 93 54 Sale of property and equipment 14 86
Purchase of: Financial assets available for sale (19,208) (16,196) Equity method investments (9) 0 Property and equipment (229) (243)
Net cash received in (paid for) business combinations/divestitures 333 47 Other, net (294) (287)
Net cash provided by (used in) investing activities (6,554) (3,714)
Cash flows from financing activities: Issuances of subordinated long-term debt 15 1,178 Repayments and extinguishments of subordinated long-term debt (2,115) (1,504) Issuances of trust preferred securities 48 11 Repayments and extinguishments of trust preferred securities (1,676) (3) Common shares issued 8,508 2,961 Purchases of treasury shares (5,156) (7,695) Sale of treasury shares 4,750 7,150 Net proceeds from Additional Equity Components3 3,452 0 Dividends paid to noncontrolling interests (4) 0 Net change in noncontrolling interests 17 13 Cash dividends paid (765) (764)
Net cash provided by (used in) financing activities 7,074 1,347
Net effect of exchange rate changes on cash and cash equivalents 127 (433)
Net increase (decrease) in cash and cash equivalents 766 (8,439) Cash and cash equivalents at beginning of period 56,041 53,321 Cash and cash equivalents at end of period 56,807 44,883
Net cash provided by (used in) operating activities include
Income taxes paid, net (31) 328 Interest paid 6,248 5,923

Interest and dividends received 12,939 13,136
Cash and cash equivalents comprise
Cash and due from banks 21,096 21,195 Interest-earning demand deposits with banks (not included: time deposits of €€ 48,366 million as of June 30, 2014, and €€ 71,804 million as of June 30, 2013) 35,710 23,688
Total 56,806 44,883
1 Included are senior long-term debt issuances of €€ 4,417 million and €€ 4,989 million and repayments and extinguishments of €€ 4,472 million and €€ 7,599 million through June 30, 2014 and June 30, 2013, respectively.
2 Included are issuances of €€ 28,009 million and €€ 17,436 million and repayments and extinguishments of €€ 18,765 million and €€ 27,200 million through June 30, 2014 andJune 30, 2013, respectively.
3 Includes net proceeds from issuance, repurchase and sale of Additional Equity Components.

Basis of Preparation (unaudited)
The accompanying condensed consolidated interim financial statements, which include Deutsche Bank AG and its subsidiaries (collectively the “Group”), are stated in euros, the presentation currency of the Group. They are presented in accordance with the requirements of IAS 34, “Interim Financial Reporting”, and have been prepared in accordance with International Financial Reporting Standards (“IFRS”) as issued by the International Accounting Standards Board (“IASB”) and endorsed by the European Union (“EU”). The Group’s application of IFRS results in no differences between IFRS as issued by the IASB and IFRS as endorsed by the EU.
Some IFRS disclosures incorporated in the Management Report are an integral part of the consolidated interim financial statements. These include the Segmental Results of Operations of the Segmental Information note which is presented in the Operating and Financial Review: Segmental Results of the Management Report. The presentation of this information is in compliance with IAS 34 and IFRS 8, “Operating Segments”.
Deutsche Bank’s condensed consolidated interim financial statements are unaudited and include supplementary disclosures on segment information, income statement, balance sheet and other financial information. They should be read in conjunction with the audited consolidated financial statements of Deutsche Bank for 2013, for which the same accounting policies and critical accounting estimates have been applied with the exception of the newly adopted accounting pronouncements outlined in section “Impact of Changes in Accounting Principles”.
The preparation of financial statements under IFRS requires management to make estimates and assumptions for certain categories of assets and liabilities.
These estimates and assumptions affect the reported amounts of assets and liabilities and disclosure of contingent assets and liabilities at the balance sheet date, and the reported amounts of revenue and expenses during the reporting period. Actual results could differ from management’s estimates and the results reported should not be regarded as necessarily indicative of results that may be expected for the entire year.
Funding Valuation Adjustment
In the fourth quarter 2013, the Group completed the implementation of a valuation methodology for incorporating the market-implied funding costs for uncollateralized derivative positions (commonly referred to as Funding Valuation Adjustment). The implementation of the Funding Valuation Adjustment was in response to growing evidence that term funding is an important component of fair value for uncollateralized derivatives and resulted in a €€ 366 million loss which has been recognized in the fourth quarter 2013 in the Consolidated Statement of Income.
Interest Income and Expense for Securities Borrowed and Loaned and Advisory Fees
In the fourth quarter of 2013, the Group restated comparative information for certain line items in the consolidated statement of income for the years ended December 31, 2012 and 2011 for the effect of errors. These restatements had no impact on net interest income, net revenues, net income or shareholders equity. The following table shows the effect of the errors on the consolidated statement of income for the three and six months ended June 30, 2013.
Deutsche Bank Consolidated Financial Statements 75Interim Report as of June 30, 2014
Basis of Preparation (unaudited) Interest Income and Expense for Securities Borrowed and Loaned and Advisory Fees

Interest Income and Expense on Securities Borrowed and Securities Loaned – Retrospective adjustments were made to restate interest income and expense to more accurately reflect the fees paid/received on securities borrowed/securities loaned transactions. The adjustment resulted in decreases in both interest income and expense but did not have any impact on net interest income, net income or shareholders’ equity.
Advisory Fees – Retrospective adjustments were made to reclassify advisory fees from Net gains/losses on financial assets held at fair value to Commissions and fee income to reflect their nature as service based activity in line with the Group’s accounting policies. The reclassification did not have any impact on net revenues, net income or shareholders’ equity.
Impact of Changes in Accounting Principles (unaudited)
Recently Adopted Accounting Pronouncements
The following are those accounting pronouncements which are relevant to the Group and which have been applied in the preparation of these condensed consolidated interim financial statements.
IAS 32 On January 1, 2014, the Group adopted the amendments to IAS 32, “Offsetting Financial Assets and Financial Liabilities” (“IAS 32 R”). IAS 32 R clarifies (a) the meaning of an entity’s current legally enforceable right of set-off; and (b) when gross settlement systems may be considered equivalent to net settlement. IAS 32 R did not have a material impact on the Group’s consolidated financial statements.
IFRIC 21 On January 1, 2014, the Group adopted IFRIC 21, “Levies”, an interpretation of IAS 37 “Provisions, Contingent Liabilities and Contingent Assets”, which clarifies that an entity recognises a liability for a levy only when the activity that triggers payment, as identified by the relevant legislation, occurs. IFRIC 21 did not have a material impact on the Group’s consolidated financial statements.
Deutsche Bank Consolidated Financial Statements 76Interim Report as of June 30, 2014 Impact of Changes in Accounting Principles (unaudited)
Recently Adopted Accounting Pronouncements
Three months ended Jun 30, 2013
in €€ m. Balance as
reported
Securities borrowed/
securities loaned Advisory fees
Balance adjusted
Interest income 6,835 (180) 0 6,656
Interest expense (3,184) 180 0 (3,004)
Commissions and fee income 3,001 0 105 3,106
Net gains (losses) on financial assets/liabilities held at fair value through profit and loss 1,338 0 (105) 1,234
Six months ended Jun 30, 2013
in €€ m. Balance as
reported
Securities borrowed/ securities
loaned Advisory fees Balance adjusted
Interest income 13,583 (334) 0 13,249
Interest expense (6,282) 334 0 (5,948)
Commissions and fee income 5,851 0 250 6,101
Net gains (losses) on financial assets/liabilities held at fair value through profit and loss 4,181 0 (250) 3,931

New Accounting Pronouncements
Improvements to IFRS 2010-2012 and 2011-2013 Cycles In December 2013, the IASB issued amendments to multiple IFRS standards, which resulted from the IASB’s annual improvement projects for the 2010-2012 and 2011-2013 cycles. They comprise amendments that result in accounting changes for presentation, recognition or measurement purposes as well as terminology or editorial amendments related to a variety of individual IFRS standards. The amendments will be effective for annual periods beginning on or after July 1, 2014, with earlier application permitted. The amendments are not expected to have a material impact on the Group’s consolidated financial statements. The amendments have yet to be endorsed by the EU.
IFRS 9 Classification and Measurement, Impairment and Hedge Accounting In July 2014, the IASB issued IFRS 9, which replaces IAS 39, “Financial Instruments: Recognition and Measurement”. IFRS 9 introduces new requirements for how an entity should classify and measure financial assets and financial liabilities, replaces the current rules for impairment of financial assets and amends the requirements for hedge accounting. IFRS 9 will be effective for annual periods beginning on or after January 1, 2018, with earlier application permitted. The Group is currently assessing the impact of IFRS 9. The standard has yet to be endorsed by the EU.
IFRS 15 Revenue from Contracts with Customers In May 2014, the IASB issued IFRS 15, “Revenue from Contracts with Customers”, which specifies how and when revenue is recognised, but does not impact income recognition related to financial instruments in scope of IFRS 9/ IAS 39. IFRS 15 replaces several other IFRS standards and interpretations that currently govern revenue recognition under IFRS and provides a single, principles based five-step model to be applied to all contracts with customers. The standard also requires entities to provide users of financial statements with more informative and relevant disclosures. IFRS 15 will be effective for annual periods beginning on or after January 1, 2017, with earlier application permitted. The Group is currently assessing the impact of IFRS 15. The standard has yet to be endorsed by the EU.
Segment Information (unaudited)
The following segment information has been prepared in accordance with the “management approach”, which requires presentation of the segments on the basis of the internal management reports of the entity which are regularly reviewed by the chief operating decision maker, which is the Deutsche Bank Management Board, in order to allocate resources to a segment and to assess its financial performance.
Starting first quarter 2014, net interest income as a component of net revenue, income (loss) before income taxes and related ratios is presented on a fully taxable-equivalent basis for U.S. tax-exempt securities for Corporate Banking & Securities (CB&S). This enables management to measure performance of taxable and tax-exempt securities on a comparable basis. This change in presentation resulted in an increase in CB&S net interest income of €€ 14.0 million for second quarter 2014 (€€ 8.0 million for first quarter 2014). This increase is offset in Group Consolidated figures through a reversal in Consolidation & Adjustments (C&A). Prior period comparatives have not been adjusted due to immateriality. The tax rate used in determining the fully taxable-equivalent net interest income in respect of the majority of the US tax-exempt securities is 35 %. US tax-exempt securities held by Non-Core Operations Unit (NCOU) are not being presented on a fully taxable-equivalent basis due to differing approaches in the management of core and non-core activities.
Deutsche Bank Consolidated Financial Statements 77Interim Report as of June 30, 2014
Segment Information (unaudited) New Accounting Pronouncements

Business Segments
The Group’s segment reporting follows the organizational structure as reflected in its internal management reporting systems, which are the basis for assessing the financial performance of the business segments and for allocating resources to the business segments. Generally, restatements due to minor changes in the organizational structure were implemented in the presentation of prior period comparables if they were considered in the Group’s management reporting systems.
During the second quarter 2014, the Group has made the following capital expenditures or divestitures:
In May 2014 we signed an agreement with Blackstone Real Estate Partners VII to sell Nevada Property 1 LLC, the owner of The Cosmopolitan of Las Vegas, a leading resort and casino. Under the transaction, Blackstone Real Estate Partners VII will acquire 100 % of The Cosmopolitan of Las Vegas for U.S.$ 1.73 billion, which will be paid in cash. The transaction is subject to regulatory approvals.
Allocation of Average Active Equity
The total amount of average active equity allocated is determined based on the higher of the Group’s overall economic risk exposure or regulatory capital demand. Starting 2013, the Group refined its allocation of average active equity to the business segments to reflect the further increased regulatory requirements under CRR/CRD 4 and to align the allocation of capital with the communicated capital and return on equity targets. Under the new methodology, the internal demand for regulatory capital is derived based on a Common Equity Tier 1 ratio of 10 % at a Group level and assuming full implementation of CRR/CRD 4 rules. Therefore, the basis for allocation, i.e., risk-weighted assets and certain regulatory capital deduction items, is also on a CRR/CRD 4 fully-loaded basis. As a result, the amount of capital allocated to the segments has increased, predominantly in CB&S and the NCOU. If the Group’s average active equity exceeds the higher of the overall economic risk exposure or the regulatory capital demand, this surplus is assigned to C&A.
Segmental Results of Operations
For the results of the business segments, including the reconciliation to the consolidated results of operations under IFRS, please see “Management Report: Operating and Financial Review: Results of Operations: Segment Results of Operations” of this Interim Report.
Deutsche Bank Consolidated Financial Statements 78Interim Report as of June 30, 2014
Segment Information (unaudited) Segmental Results of Operations
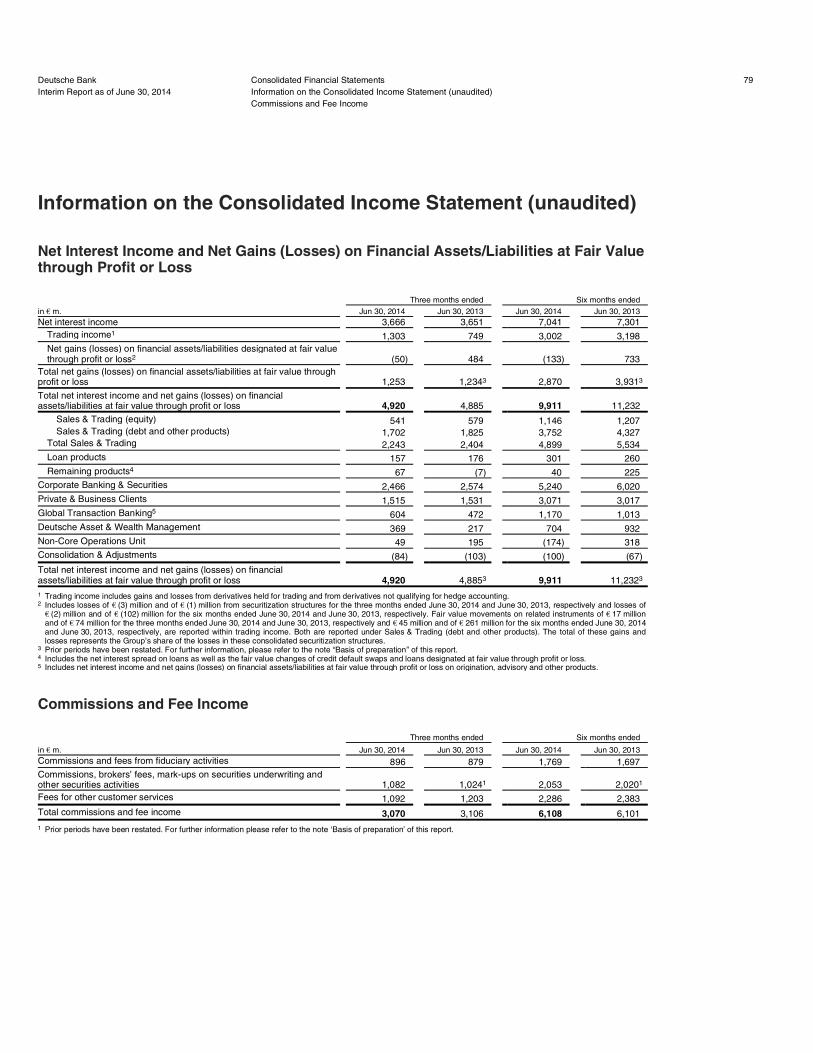
Information on the Consolidated Income Statement (unaudited)
Net Interest Income and Net Gains (Losses) on Financial Assets/Liabilities at Fair Value through Profit or Loss
Commissions and Fee Income
Deutsche Bank Consolidated Financial Statements 79Interim Report as of June 30, 2014 Information on the Consolidated Income Statement (unaudited)
Commissions and Fee Income
Three months ended Six months ended in €€ m. Jun 30, 2014 Jun 30, 2013 Jun 30, 2014 Jun 30, 2013 Net interest income 3,666 3,651 7,041 7,301
Trading income1 1,303 749 3,002 3,198
Net gains (losses) on financial assets/liabilities designated at fair value through profit or loss2 (50) 484 (133) 733
Total net gains (losses) on financial assets/liabilities at fair value through profit or loss 1,253 1,2343 2,870 3,9313
Total net interest income and net gains (losses) on financial assets/liabilities at fair value through profit or loss 4,920 4,885 9,911 11,232
Sales & Trading (equity) 541 579 1,146 1,207 Sales & Trading (debt and other products) 1,702 1,825 3,752 4,327
Total Sales & Trading 2,243 2,404 4,899 5,534
Loan products 157 176 301 260
Remaining products4 67 (7) 40 225
Corporate Banking & Securities 2,466 2,574 5,240 6,020
Private & Business Clients 1,515 1,531 3,071 3,017
Global Transaction Banking5 604 472 1,170 1,013
Deutsche Asset & Wealth Management 369 217 704 932
Non-Core Operations Unit 49 195 (174) 318
Consolidation & Adjustments (84) (103) (100) (67)
Total net interest income and net gains (losses) on financial assets/liabilities at fair value through profit or loss 4,920 4,8853 9,911 11,2323
1 Trading income includes gains and losses from derivatives held for trading and from derivatives not qualifying for hedge accounting. 2 Includes losses of €€ (3) million and of €€ (1) million from securitization structures for the three months ended June 30, 2014 and June 30, 2013, respectively and losses of€€ (2) million and of €€ (102) million for the six months ended June 30, 2014 and June 30, 2013, respectively. Fair value movements on related instruments of €€ 17 million and of €€ 74 million for the three months ended June 30, 2014 and June 30, 2013, respectively and €€ 45 million and of €€ 261 million for the six months ended June 30, 2014and June 30, 2013, respectively, are reported within trading income. Both are reported under Sales & Trading (debt and other products). The total of these gains andlosses represents the Group’s share of the losses in these consolidated securitization structures.
3 Prior periods have been restated. For further information, please refer to the note “Basis of preparation” of this report. 4 Includes the net interest spread on loans as well as the fair value changes of credit default swaps and loans designated at fair value through profit or loss. 5 Includes net interest income and net gains (losses) on financial assets/liabilities at fair value through profit or loss on origination, advisory and other products.
Three months ended Six months ended in €€ m. Jun 30, 2014 Jun 30, 2013 Jun 30, 2014 Jun 30, 2013 Commissions and fees from fiduciary activities 896 879 1,769 1,697
Commissions, brokers’ fees, mark-ups on securities underwriting and other securities activities 1,082 1,0241 2,053 2,0201
Fees for other customer services 1,092 1,203 2,286 2,383
Total commissions and fee income 3,070 3,106 6,108 6,101
1 Prior periods have been restated. For further information please refer to the note ‘Basis of preparation’ of this report.

Pensions and Other Post-Employment Benefits
The Group expects to pay approximately €€ 200 million in regular contributions to its retirement benefit plans in 2014. It is not expected that any plan assets will be returned to the Group during the year ending December 31, 2014.
Discount rate to determine defined benefit obligation
General and Administrative Expenses
Restructuring
The Group aims to enhance its long-term competitiveness through major reductions in costs, duplication and complexity in the years ahead. The Group plans to spend approximately €€ 4.0 billion over a three year period starting 2012 with the aim of achieving full run-rate annual cost savings of €€ 4.5 billion by 2015.
As of June 30, 2014 the Group’s Management Board approved eight phases of restructuring which form part of the planned amount of approximately €€ 4 billion. The restructuring expense is comprised of termination benefits, additional expenses covering the acceleration of deferred compensation awards not yet amortized due to the discontinuation of employment and contract termination costs related to real estate.
Deutsche Bank Consolidated Financial Statements 80Interim Report as of June 30, 2014 Information on the Consolidated Income Statement (unaudited)
Restructuring
Three months ended Six months ended in €€ m. Jun 30, 2014 Jun 30, 2013 Jun 30, 2014 Jun 30, 2013 Service cost 70 66 137 138
Net interest cost (income) 2 3 2 13
Total expenses defined benefit plans 71 69 139 151
Total expenses for defined contribution plans 91 86 199 196
Total expenses for post-employment benefits 162 156 338 346
Employer contributions to mandatory German social security pension plan 54 55 116 115
in % Jun 30, 2014 Dec 31, 2013 Germany 2.8 3.6
UK 4.4 4.5
U.S. 4.2 4.8
Three months ended Six months ended in €€ m. Jun 30, 2014 Jun 30, 2013 Jun 30, 2014 Jun 30, 2013 IT costs 897 725 1,701 1,402
Occupancy, furniture and equipment expenses 454 509 1,006 993
Professional service fees 489 427 940 783
Communication and data services 214 208 427 431
Travel and representation expenses 116 110 211 205
Payment, clearing and custodian services 117 151 233 299
Marketing expenses 70 72 133 146
Consolidated investments 208 213 408 406
Other expenses1 1,001 1,145 1,517 1,714
Total general and administrative expenses 3,566 3,561 6,575 6,379
1 Includes litigation related expenses of €€ 470 million and €€ 630 million for the three months ended June 30, 2014 and June 30, 2013, respectively and litigation relatedexpenses of €€ 470 million and €€ 762 million for the six months ended June 30, 2014 and June 30, 2013, respectively.

Net restructuring expense by division
Net restructuring expense by type
Provisions for restructuring amounted to €€ 155 million and €€ 207 million as of June 30, 2014 and December 31, 2013, respectively. The majority of the current provisions for restructuring are expected to be utilized during 2014.
During the first half year of 2014, 839 (393 in the first quarter and 446 in the second quarter) full-time equivalent (“FTE”) staff were reduced through restructuring.
These reductions were identified within:
Effective Tax Rate
Income tax expense in the current quarter was €€ 679 million versus €€ 457 million in the comparative period. Both the current quarter’s effective tax rate of 74 % and the prior year’s quarter effective tax rate of 58 % were mainly impacted by expenses, such as litigation, that are not deductible for tax purposes and income taxes of prior periods.
Income tax expense in the first six months was €€ 1.3 billion versus €€ 1.2 billion in the first six months of 2013. The effective tax rate of 48 % in the first six months of 2014 was mainly impacted by expenses, such as litigation, that are not deductible for tax purposes and income taxes of prior periods. The effective tax rate in the comparative period was 38 %.
Deutsche Bank Consolidated Financial Statements 81Interim Report as of June 30, 2014 Information on the Consolidated Income Statement (unaudited)
Effective Tax Rate
Three months ended Six months ended in €€ m. Jun 30, 2014 Jun 30, 2013 Jun 30, 2014 Jun 30, 2013 Corporate Banking & Securities (37) (40) (81) (81)
Private & Business Clients (3) (1) (6) (2)
Global Transaction Banking (6) (12) (9) (14)
Deutsche Asset & Wealth Management (10) (136) (14) (143)
Non-Core Operations Unit (1) (4) (3) (17)
Infrastructure/Regional Management 0 0 0 0
Consolidation & Adjustments 0 0 0 0
Total Net Restructuring Charges (57) (192) (113) (257)
Three months ended Six months ended in €€ m. Jun 30, 2014 Jun 30, 2013 Jun 30, 2014 Jun 30, 2013 Restructuring - Staff related (49) (172) (104) (237)
thereof: Termination Payments (39) (153) (84) (172) Retention Acceleration (9) (18) (19) (62) Social Security (1) (2) (1) (3)
Restructuring - Non Staff related1 (8) (20) (9) (20)
Total net restructuring Charges (57) (192) (113) (257)
1 Contract costs, mainly related to real estate and technology.
Six months
ended Jun 30, 2014 Corporate Banking & Securities 163
Private & Business Clients 30
Global Transaction Banking 190
Deutsche Asset & Wealth Management 138
Non-Core Operations Unit 1
Infrastructure/Regional Management 317
Total full-time equivalent staff 839

Information on the Consolidated Balance Sheet (unaudited)
Financial Assets/Liabilities at Fair Value through Profit or Loss
Financial Assets Available for Sale
Deutsche Bank Consolidated Financial Statements 82Interim Report as of June 30, 2014 Information on the Consolidated Balance Sheet (unaudited)
in €€ m. Jun 30, 2014 Dec 31, 2013 Financial assets classified as held for trading:
Trading assets: Trading securities 188,324 187,554 Other trading assets1 22,668 22,516
Total trading assets 210,991 210,070
Positive market values from derivative financial instruments 484,769 504,590
Total financial assets classified as held for trading 695,760 714,660
Financial assets designated at fair value through profit or loss: Securities purchased under resale agreements 108,945 116,764 Securities borrowed 32,932 32,485 Loans 14,693 15,579 Other financial assets designated at fair value through profit or loss 19,569 19,768
Total financial assets designated at fair value through profit or loss 176,139 184,597
Total financial assets at fair value through profit or loss 871,899 899,257
1 Includes traded loans of €€ 18,468 million and €€ 17,787 million as of June 30, 2014 and December 31, 2013, respectively.
in €€ m. Jun 30, 2014 Dec 31, 2013 Financial liabilities classified as held for trading:
Trading liabilities: Trading securities 51,075 54,951 Other trading liabilities 914 853
Total trading liabilities 51,989 55,804
Negative market values from derivative financial instruments 471,922 483,428
Total financial liabilities classified as held for trading 523,911 539,232
Financial liabilities designated at fair value through profit or loss: Securities sold under repurchase agreements 79,971 73,642 Loan commitments 124 193 Long-term debt 9,639 9,342 Other financial liabilities designated at fair value through profit or loss 7,827 6,927
Total financial liabilities designated at fair value through profit or loss 97,561 90,104
Investment contract liabilities1 8,253 8,067
Total financial liabilities at fair value through profit or loss 629,725 637,404
1 These are investment contracts where the policy terms and conditions result in their redemption values equaling fair values.
in €€ m. Jun 30, 2014 Dec 31, 2013 Debt securities 50,782 44,242
Equity securities 1,031 1,076
Other equity interests 769 837
Loans 2,432 2,170
Total financial assets available for sale 55,013 48,326

Amendments to IAS 39 and IFRS 7, “Reclassification of Financial Assets”
Under the amendments to IAS 39 and IFRS 7, issued in October 2008, certain financial assets were reclassified in the second half of 2008 and the first quarter of 2009 from the financial assets at fair value through profit or loss and the available for sale classifications into the loans classification. No reclassifications have been made since the first quarter 2009.
The Group identified assets, eligible under the amendments, for which at the reclassification date it had a clear change of intent and ability to hold for the foreseeable future rather than to exit or trade in the short term. The reclassifications were made at the fair value of the assets at the reclassification date.
Reclassified Financial Assets
Carrying values and fair values by asset type of assets reclassified in 2008 and 2009
All reclassified assets are managed by NCOU and disposal decisions across this portfolio are made by NCOU in accordance with their remit to take de-risking decisions. For the six months ended June 30, 2014, the Group sold reclassified assets with a carrying value of €€ 76 million, resulting in a net gain of €€ 5.6 million.
In addition to sales, the decrease in the carrying value of assets previously classified as trading includes redemptions and maturities of €€ 569 million. The reduction in the carrying value of assets previously classified as available for sale includes redemptions and maturities of €€ 149 million.
Unrealized fair value gains (losses) that would have been recognized in profit or loss and net gains (losses) that would have been recognized in other comprehensive income if the reclassifications had not been made
Deutsche Bank Consolidated Financial Statements 83Interim Report as of June 30, 2014 Information on the Consolidated Balance Sheet (unaudited)
Amendments to IAS 39 and IFRS 7, “Reclassification of Financial Assets”
in €€ bn. (unless stated otherwise)
Trading assets reclassified to
loans
Financial assets available for sale
reclassified to loans
Carrying value at reclassification date 26.6 11.4
Unrealized fair value losses in accumulated other comprehensive income 0.0 (1.1)
Effective interest rates at reclassification date: Upper range 13.1% 9.9% Lower range 2.8% 3.9%
Expected recoverable cash flows at reclassification date 39.6 17.6
Jun 30, 2014 Dec 31, 2013 in €€ m. Carrying value Fair value Carrying value Fair value Trading assets reclassified to loans:
Securitization assets 1,947 2,008 1,985 1,872 Debt securities 980 1,022 1,062 1,068 Loans 1,857 1,580 2,367 2,064
Total trading assets reclassified to loans 4,785 4,611 5,415 5,004
Financial assets available for sale reclassified to loans: Securitization assets 1,848 1,893 1,972 1,955 Debt securities 1,226 1,342 1,220 1,284
Total financial assets available for sale reclassified to loans 3,073 3,235 3,192 3,239
Total financial assets reclassified to loans 7,8581 7,845 8,606 8,243
1 There is an associated effect on the carrying value from effective fair value hedge accounting for interest rate risk to the carrying value of the reclassified assets shown inthe table above. This effect increases carrying value by €€ 87 million and €€ 34 million as at June 30, 2014 and December 31, 2013, respectively.
Three months ended Six months ended in €€ m. Jun 30, 2014 Jun 30, 2013 Jun 30, 2014 Jun 30, 2013 Unrealized fair value gains (losses) on the reclassified trading assets, gross of provisions for credit losses 71 (56) 212 170
Impairment (losses) on the reclassified financial assets available for sale which were impaired (2) 0 (9) 0
Net gains (losses) recognized in other comprehensive income representing additional unrealized fair value gains (losses) on the reclassified financial assets available for sale which were not impaired 69 (42) 142 78

Pre-tax contribution of all reclassified assets to the income statement
Reclassified Financial Assets: Carrying values and fair values by asset class All IAS 39 reclassified assets were transferred into NCOU upon creation of the new division in the fourth quarter of 2012. NCOU has been tasked to accelerate de-risking to reduce total capital demand and total adjusted assets. A number of factors are considered in determining whether and when to sell assets including the income statement, regulatory capital and leverage impacts. The movements in carrying value and fair value are illustrated in the following table:
Carrying values and fair values by asset class reclassification in 2008 and 2009
Financial Instruments carried at Fair Value
Fair Value Hierarchy The financial instruments carried at fair value have been categorized under the three levels of the IFRS fair value hierarchy as follows:
Level 1 – Instruments valued using quoted prices in active markets are instruments where the fair value can be determined directly from prices which are quoted in active, liquid markets and where the instrument observed in the market is representative of that being priced in the Group’s inventory.
These include: high-liquidity treasuries and derivative, equity and cash products traded on high-liquidity exchanges.
Deutsche Bank Consolidated Financial Statements 84Interim Report as of June 30, 2014 Information on the Consolidated Balance Sheet (unaudited)
Financial Instruments carried at Fair Value
Three months ended Six months ended in €€ m. Jun 30, 2014 Jun 30, 2013 Jun 30, 2014 Jun 30, 2013 Interest income1 38 87 76 193
Provision for credit losses (11) (126) (38) (135)
Other income2 5 (20) 5 (159)
Income (loss) before income taxes on reclassified trading assets 32 (59) 43 (100)
Interest income 19 21 38 48
Provision for credit losses 1 0 (5) 0
Other income2 0 (43) 0 (47)
Income (loss) before income taxes on reclassified financial assets available for sale 20 (23) 32 0
1 Significant reduction in interest income driven by accelerated de-risking of former traded assets during 2013. 2 Relates to gains and losses from the sale of reclassified assets.
Jun 30, 2014 Dec 31, 2013
in €€ m. Carrying
value (CV) Fair
value (FV) Unrealized
gains/(losses) Carrying
value (CV) Fair
value (FV) Unrealized
gains/(losses) Securitization assets and debt securities reclassified:
US municipal bonds 2,078 2,239 161 2,155 2,232 77 Student loans ABS 1,271 1,399 128 1,263 1,305 42 CDO/CLO 862 835 (27) 979 938 (41) Covered bond 888 911 23 885 788 (97) Commercial mortgages securities 257 248 (9) 281 260 (21) Residential mortgages ABS 74 75 1 74 71 (3) Other 570 558 (12) 602 585 (17)
Total securitization assets and debt securities reclassified 6,001 6,265 264 6,239 6,179 (60)
Loans reclassified: Commercial mortgages 962 948 (14) 1,463 1,428 (35) Residential mortgages 835 595 (240) 844 598 (246) Other 60 37 (23) 61 38 (22)
Total loans reclassified 1,857 1,580 (276) 2,367 2,064 (303)
Total financial assets reclassified to loans 7,858 7,845 (12) 8,606 8,243 (363)

Level 2 – Instruments valued with valuation techniques using observable market data are instruments where the fair value can be determined by reference to similar instruments trading in active markets, or where a technique is used to derive the valuation but where all inputs to that technique are observable.
These include: many OTC derivatives; many investment-grade listed credit bonds; some CDS; many collateralized debt obligations (“CDO”); and many less-liquid equities.
Level 3 – Instruments valued using valuation techniques using market data which is not directly observable are instruments where the fair value cannot be determined directly by reference to market-observable information, and some other pricing technique must be employed. Instruments classified in this category have an element which is unobservable and which has a significant impact on the fair value.
These include: more-complex OTC derivatives; distressed debt; highly-structured bonds; illiquid asset-backed securities (“ABS”); illiquid CDOs (cash and synthetic); monoline exposures; private equity placements; many commercial real estate (“CRE”) loans; illiquid loans; and some municipal bonds.
Carrying value of the financial instruments held at fair value1
There have been no significant transfers of instruments between level 1 and level 2 of the fair value hierarchy.
Deutsche Bank Consolidated Financial Statements 85Interim Report as of June 30, 2014 Information on the Consolidated Balance Sheet (unaudited)
Financial Instruments carried at Fair Value
Jun 30, 2014 Dec 31, 2013
in €€ m.
Quoted prices in
active market
(Level 1)
Valuation technique
observable parameters
(Level 2)
Valuation technique
unobservable parameters
(Level 3)
Quoted prices in
active market
(Level 1)
Valuation technique
observable parameters
(Level 2)
Valuation technique
unobservable parameters
(Level 3) Financial assets held at fair value:
Trading assets 95,878 578,390 21,492 94,055 598,025 22,580 Trading securities 89,229 91,853 7,241 86,325 94,269 6,960 Positive market values from derivative financial instruments 6,387 469,296 9,085 7,421 486,614 10,556 Other trading assets 262 17,241 5,165 309 17,143 5,065
Financial assets designated at fair value through profit or loss 8,659 164,078 3,401 7,083 174,391 3,123 Financial assets available for sale 31,001 20,409 3,603 23,948 21,049 3,329 Other financial assets at fair value2,3 0 3,6852 0 60 7,3472 1
Total financial assets held at fair value 135,539 766,563 28,496 125,146 800,811 29,033
Financial liabilities held at fair value: Trading liabilities 43,942 473,458 6,510 44,264 486,623 8,345
Trading securities 36,883 14,171 21 36,438 18,490 24 Negative market values from derivative financial instruments 7,012 458,420 6,489 7,815 467,293 8,321 Other trading liabilities 47 866 0 12 841 0
Financial liabilities designated at fair value through profit or loss 1,379 94,154 2,028 197 88,466 1,442 Investment contract liabilities4 0 8,253 0 0 8,067 0 Other financial liabilities at fair value2,3 0 5052 (400)5 4 1,4952 (247)5
Total financial liabilities held at fair value 45,322 576,370 8,138 44,465 584,651 9,539
1 Amounts in this table are generally presented on a gross basis, in line with the Group’s accounting policy regarding offsetting of financial instruments, as described in Note 1 “Significant Accounting Policies and Critical Accounting Estimates” of the Financial Report 2013.
2 Predominantly relates to derivatives qualifying for hedge accounting. 3 Includes assets and liabilities held for sale related to Tilney in 2014 and to BHF-BANK in 2013. 4 These are investment contracts where the policy terms and conditions result in their redemption value equaling fair value. See Note 41 “Insurance and Investment Contracts” of the
Financial Report 2013 for more detail on these contracts. 5 Relates to derivatives which are embedded in contracts where the host contract is held at amortized cost but for which the embedded derivative is separated. The separated embedded
derivatives may have a positive or a negative fair value but have been presented in this table to be consistent with the classification of the host contract. The separated embedded derivatives are held at fair value on a recurring basis and have been split between the fair value hierarchy classifications.

Valuation Techniques The following is an explanation of the valuation techniques used in establishing the fair value of the different types of financial instruments that the Group trades.
Sovereign, Quasi-sovereign and Corporate Debt and Equity Securities: Where there are no recent transactions then fair value may be determined from the last market price adjusted for all changes in risks and information since that date. Where a close proxy instrument is quoted in an active market then fair value is determined by adjusting the proxy value for differences in the risk profile of the instruments. Where close proxies are not available then fair value is estimated using more complex modeling techniques. These techniques include discounted cash flow models using current market rates for credit, interest, liquidity and other risks. For equity securities modeling techniques may also include those based on earnings multiples.
Mortgage- and Other Asset-Backed Securities (MBS/ABS) include residential and commercial MBS and other ABS including CDOs. ABS have specific characteristics as they have different underlying assets and the issuing entities have different capital structures. The complexity increases further where the underlying assets are themselves ABS, as is the case with many of the CDO instruments.
Where no reliable external pricing is available, ABS are valued, where applicable, using either relative value analysis which is performed based on similar transactions observable in the market, or industry-standard valuation models incorporating available observable inputs. The industry standard external models calculate principal and interest payments for a given deal based on assumptions that can be independently price tested. The inputs include prepayment speeds, loss assumptions (timing and severity) and a discount rate (spread, yield or discount margin). These inputs/assumptions are derived from actual transactions, external market research and market indices where appropriate.
Loans: For certain loans fair value may be determined from the market price on a recently occurring transaction adjusted for all changes in risks and information since that transaction date. Where there are no recent market transactions then broker quotes, consensus pricing, proxy instruments or discounted cash flow models are used to determine fair value. Discounted cash flow models incorporate parameter inputs for credit risk, interest rate risk, foreign exchange risk, loss given default estimates and amounts utilized given default, as appropriate. Credit risk, loss given default and utilization given default parameters are determined using information from the loan or CDS markets, where available and appropriate.
Leveraged loans can have transaction-specific characteristics which can limit the relevance of market-observed transactions. Where similar transactions exist for which observable quotes are available from external pricing services then this information is used with appropriate adjustments to reflect the transaction differences. When no similar transactions exist, a discounted cash flow valuation technique is used with credit spreads derived from the appropriate leveraged loan index, incorporating the industry classification, subordination of the loan, and any other relevant information on the loan and loan counterparty.
Over-The-Counter Derivative Financial Instruments: Market standard transactions in liquid trading markets, such as interest rate swaps, foreign exchange forward and option contracts in G7 currencies, and equity swap and option contracts on listed securities or indices are valued using market standard models and quoted parameter inputs. Parameter inputs are obtained from pricing services, consensus pricing services and recently occurring transactions in active markets wherever possible.
Deutsche Bank Interim Report as of June 30, 2014
Consolidated Financial StatementsInformation on the Consolidated Balance Sheet (unaudited) Financial Instruments carried at Fair Value
86

More complex instruments are modeled using more sophisticated modeling techniques specific for the instrument and are calibrated to available market prices. Where the model output value does not calibrate to a relevant market reference then valuation adjustments are made to the model output value to adjust for any difference. In less active markets, data is obtained from less frequent market transactions, broker quotes and through extrapolation and interpolation techniques. Where observable prices or inputs are not available, management judgment is required to determine fair values by assessing other relevant sources of information such as historical data, fundamental analysis of the economics of the transaction and proxy information from similar transactions.
Financial Liabilities Designated at Fair Value through Profit or Loss under the Fair Value Option: The fair value of financial liabilities designated at fair value through profit or loss under the fair value option incorporates all market risk factors including a measure of the Group’s credit risk relevant for that financial liability. The financial liabilities include structured note issuances, structured deposits, and other structured securities issued by consolidated vehicles, which may not be quoted in an active market. The fair value of these financial liabilities is determined by discounting the contractual cash flows using the relevant credit-adjusted yield curve. The market risk parameters are valued consistently to similar instruments held as assets, for example, any derivatives embedded within the structured notes are valued using the same methodology discussed in the “Over-The-Counter Derivative Financial Instruments” section above.
Where the financial liabilities designated at fair value through profit or loss under the fair value option are collateralized, such as securities loaned and securities sold under repurchase agreements, the credit enhancement is factored into the fair valuation of the liability.
Investment Contract Liabilities: Assets which are linked to the investment contract liabilities are owned by the Group. The investment contract obliges the Group to use these assets to settle these liabilities. Therefore, the fair value of investment contract liabilities is determined by the fair value of the underlying assets (i.e., amount payable on surrender of the policies).
Analysis of Financial Instruments with Fair Value Derived from Valuation Techniques Containing Significant Unobservable Parameters (Level 3) Some of the instruments in level 3 of the fair value hierarchy have identical or similar offsetting exposures to the unobservable input. However, according to IFRS they are required to be presented as gross assets and liabilities.
Trading Securities: Certain illiquid emerging market corporate bonds and illiquid highly structured corporate bonds are included in this level of the hierarchy. In addition, some of the holdings of notes issued by securitization entities, commercial and residential MBS, collateralized debt obligation securities and other ABS are reported here. The increase in the period is mainly due to purchases and transfers from level 2 to level 3 partially off-set by sales and transfers out of level 3.
Positive and Negative Market Values from Derivative Instruments categorized in this level of the fair value hierarchy are valued based on one or more significant unobservable parameters. The unobservable parameters may include certain correlations, certain long term volatilities, certain prepayment rates, credit spreads and other transaction-specific parameters.
Deutsche Bank Interim Report as of June 30, 2014
Consolidated Financial StatementsInformation on the Consolidated Balance Sheet (unaudited) Financial Instruments carried at Fair Value
87
Level 3 derivatives include customized CDO derivatives in which the underlying reference pool of corporate assets is not closely comparable to regularly market-traded indices; certain tranched index credit derivatives; certain options where the volatility is unobservable; certain basket options in which the correlations between the referenced underlying assets are unobservable; longer-term interest rate option derivatives; multi-currency foreign exchange derivatives; and certain credit default swaps for which the credit spread is not observable. The decrease in derivative instruments is mainly due to transfers from level 3 to level 2 due to changes in the observability of input parameters used to value these instruments.
Other Trading Instruments classified in level 3 of the fair value hierarchy mainly consist of traded loans valued using valuation models based on one or more significant unobservable parameters. Level 3 loans comprise illiquid leveraged loans and illiquid residential and commercial mortgage loans.
Financial Assets/Liabilities designated at Fair Value through Profit or Loss: Certain corporate loans and structured liabilities which were designated at fair value through profit or loss under the fair value option are categorized in this level of the fair value hierarchy. The corporate loans are valued using valuation techniques which incorporate observable credit spreads, recovery rates and unobservable utilization parameters. Revolving loan facilities are reported in the level 3 of the hierarchy because the utilization in the event of the default parameter is significant and unobservable.
In addition, certain hybrid debt issuances designated at fair value through profit or loss containing embedded derivatives are valued based on significant unobservable parameters. These unobservable parameters include single stock volatility correlations. The increase in liabilities is primarily due to transfers from level 2 into level 3 due to changes in the observability of input parameters used to value these instruments.
Financial Assets Available for Sale include unlisted equity instruments where there is no close proxy and the market is very illiquid. The increase in the period is mainly due to purchases.
Deutsche Bank Interim Report as of June 30, 2014
Consolidated Financial StatementsInformation on the Consolidated Balance Sheet (unaudited) Financial Instruments carried at Fair Value
88

Reconciliation of financial instruments classified in Level 3
Deutsche Bank Interim Report as of June 30, 2014
Consolidated Financial StatementsInformation on the Consolidated Balance Sheet (unaudited) Financial Instruments carried at Fair Value
89
Jun 30, 2014
in €€ m.
Balance, beginning
of year
Changes in the group
of consoli- dated com-
panies
Total gains/
losses1 Purchases Sales Issuances2 Settle- ments3
Transfers into
Level 34
Transfers out of
Level 34
Balance, end of period
Financial assets held at fair value:
Trading securities 6,960 0 120 1,398 (1,120) 0 (242) 1,597 (1,471) 7,241
Positive market values from derivative financial instruments 10,556 0 (245) 0 0 0 (311) 1,715 (2,629) 9,085
Other trading assets 5,065 0 11 1,338 (1,125) 549 (194) 518 (997) 5,165
Financial assets designated at fair value through profit or loss 3,123 0 77 152 (108) 870 (743) 89 (58) 3,401
Financial assets available for sale 3,329 0 575 582 (104) 0 (450) 242 (54) 3,603
Other financial assets at fair value6 1 (1) 0 0 0 0 0 0 0 0
Total financial assets held at fair value 29,033 (1) 207,8 3,470 (2,456) 1,418 (1,940) 4,161 (5,209) 28,496
Financial liabilities held at fair value:
Trading securities 24 0 2 0 0 0 (2) 1 (4) 21
Negative market values from derivative financial instruments 8,321 0 (141) 0 0 0 (283) 826 (2,233) 6,489
Other trading liabilities 0 0 0 0 0 0 0 0 0 0
Financial liabilities designated at fair value through profit or loss 1,442 0 (102) 0 0 62 (25) 684 (33) 2,028
Other financial liabilities at fair value (247) 0 (19) 0 0 0 (36) (3) (95) (400)
Total financial liabilities held at fair value 9,539 0 (261)7,8 0 0 62 (346) 1,507 (2,365) 8,138
1 Total gains and losses predominantly relate to net gains (losses) on financial assets/liabilities at fair value through profit or loss reported in the consolidated statement of income. The balance also includes net gains (losses) on financial assets available for sale reported in the consolidated statement of income and unrealized net gains (losses) on financial assets available for sale and exchange rate changes reported in other comprehensive income, net of tax. Further, certain instruments are hedged with instruments in level 1 or level 2 but the table above does not include the gains and losses on these hedging instruments. Additionally, both observable and unobservable parameters may be used to determine the fair value of an instrument classified within level 3 of the fair value hierarchy; the gains and losses presented below are attributable to movements in both the observable and unobservable parameters.
2 Issuances relate to the cash amount received on the issuance of a liability and the cash amount paid on the primary issuance of a loan to a borrower. 3 Settlements represent cash flows to settle the asset or liability. For debt and loan instruments this includes principal on maturity, principal amortizations and principal repayments. For derivatives
all cash flows are presented in settlements. 4 Transfers in and transfers out of level 3 are related to changes in observability of input parameters. During the period they are recorded at their fair value at the beginning of year. For instruments
transferred into level 3 the table shows the gains and losses and cash flows on the instruments as if they had been transferred at the beginning of the year. Similarly for instruments transferred out of level 3 the table does not show any gains or losses or cash flows on the instruments during the period since the table is presented as if they have been transferred out at the beginning of the year.
5 Total gains and losses on available for sale include a gain of €€ 19 million recognized in other comprehensive income, net of tax, and a gain of €€ 5 million recognized in the income statement presented in net gains (losses) on financial assets available for sale.
6 Represents assets held for sale related to BHF-BANK. 7 This amount includes the effect of exchange rate changes. For total financial assets held at fair value this effect is a gain of €€ 116 million and for total financial liabilities held at fair value this is a
gain of €€ 22 million. The effect of exchange rate changes is reported in other comprehensive income, net of tax. 8 For assets, positive balances represent gains, negative balances represent losses. For liabilities, positive balances represent losses, negative balances represent gains.

Deutsche Bank Interim Report as of June 30, 2014
Consolidated Financial StatementsInformation on the Consolidated Balance Sheet (unaudited) Financial Instruments carried at Fair Value
90
Jun 30,2013
in €€ m.
Balance, beginning
of year
Changes in the group
of consoli- dated com-
panies
Total gains/
losses1 Purchases Sales Issuances2 Settle- ments3
Transfers into
Level 34
Transfers out of
Level 34
Balance, end of period
Financial assets held at fair value:
Trading securities 10,306 0 144 860 (1,896) 0 (543) 671 (2,647) 6,895
Positive market values from derivative financial instruments 15,210 0 (1,648) 0 0 0 (1,610) 2,011 (2,217) 11,747
Other trading assets 4,609 0 125 540 (1,060) 543 (253) 521 (500) 4,525
Financial assets designated at fair value through profit or loss 3,956 0 245 53 (4) 761 (1,645) 151 (236) 3,283
Financial assets available for sale 3,940 (80) 635 425 (221) 0 (352) 384 (341) 3,818
Other financial assets at fair value 0 0 0 0 0 0 0 0 0 0
Total financial assets held at fair value 38,021 (80) (1,070)6,7 1,878 (3,181) 1,304 (4,403) 3,739 (5,941) 30,267
Financial liabilities held at fair value:
Trading securities 318 0 (2) 0 0 0 (1) 19 (264) 69
Negative market values from derivative financial instruments 9,286 0 331 0 0 0 (814) 1,471 (1,478) 8,796
Other trading liabilities 0 0 0 0 0 0 0 0 0 0
Financial liabilities designated at fair value through profit or loss 1,417 0 (69) 0 0 64 (69) 552 (253) 1,643
Other financial liabilities at fair value (176) 0 58 0 0 0 20 (326) (39) (464)
Total financial liabilities held at fair value 10,845 0 3176,7 0 0 64 (864) 1,716 (2,034) 10,043
1 Total gains and losses predominantly relate to net gains (losses) on financial assets/liabilities at fair value through profit or loss reported in the consolidated statement of income. The balance also includes net gains (losses) on financial assets available for sale reported in the consolidated statement of income and unrealized net gains (losses) on financial assets available for sale and exchange rate changes reported in other comprehensive income, net of tax. Further, certain instruments are hedged with instruments in level 1 or level 2 but the table above does not include the gains and losses on these hedging instruments. Additionally, both observable and unobservable parameters may be used to determine the fair value of an instrument classified within level 3 of the fair value hierarchy; the gains and losses presented above are attributable to movements in both the observable and unobservable parameters.
2 Issuances relate to the cash amount received on the issuance of a liability and the cash amount paid on the primary issuance of a loan to a borrower. 3 Settlements represent cash flows to settle the asset or liability. For debt and loan instruments this includes principal on maturity, principal amortizations and principal repayments. For derivatives
all cash flows are presented in settlements. 4 Transfers in and transfers out of level 3 during the period are recorded at their fair value at the beginning of year in the table above. For instruments transferred into level 3 the table shows the
gains and losses and cash flows on the instruments as if they had been transferred at the beginning of the year. Similarly for instruments transferred out of level 3 the table does not show any gains or losses or cash flows on the instruments during the period since the table is presented as if they have been transferred out at the beginning of the year.
5 Total gains and losses on financial assets available for sale include a gain of €€ 15 million recognized in other comprehensive income, net of tax, and a gain of €€ 8 million recognized in the income statement presented in net gains (losses) on financial assets available for sale.
6 This amount includes the effect of exchange rate changes. For total financial assets held at fair value this effect is a loss of €€ 70 million and for total financial liabilities held at fair value this is a loss of €€ 4 million. This predominantly relates to derivatives. The effect of exchange rate changes is reported in other comprehensive income, net of tax.
7 For assets, positive balances represent gains, negative balances represent losses. For liabilities, positive balances represent losses, negative balances represent gains.

Sensitivity Analysis of Unobservable Parameters Where the value of financial instruments is dependent on unobservable parameter inputs, the precise level for these parameters at the balance sheet date might be drawn from a range of reasonably possible alternatives. In preparing the financial statements, appropriate levels for these unobservable input parameters are chosen so that they are consistent with prevailing market evidence and in line with the Group’s approach to valuation control detailed above. Were the Group to have marked the financial instruments concerned using parameter values drawn from the extremes of the ranges of reasonably possible alternatives then as of June 30, 2014 it could have increased fair value by as much as €€ 2.9 billion or decreased fair value by as much as €€ 2.5 billion. As of December 31, 2013 it could have increased fair value by as much as €€ 3.0 billion or decreased fair value by as much as€€ 2.6 billion. In estimating these impacts, the Group either re-valued certain financial instruments using reasonably possible alternative parameter values, or used an approach based on its valuation adjustment methodology for bid/offer spread valuation adjustments. Bid/offer spread valuation adjustments reflect the amount that must be paid in order to close out a holding in an instrument or component risk and as such they reflect factors such as market illiquidity and uncertainty.
This disclosure is intended to illustrate the potential impact of the relative uncertainty in the fair value of financial instruments for which valuation is dependent on unobservable input parameters. However, it is unlikely in practice that all unobservable parameters would be simultaneously at the extremes of their ranges of reasonably possible alternatives. Hence, the estimates disclosed above are likely to be greater than the true uncertainty in fair value at the balance sheet date. Furthermore, the disclosure is not predictive or indicative of future movements in fair value.
For many of the financial instruments considered here, in particular derivatives, unobservable input parameters represent only a subset of the parameters required to price the financial instrument, the remainder being observable. Hence for these instruments the overall impact of moving the unobservable input parameters to the extremes of their ranges might be relatively small compared with the total fair value of the financial instrument. For other instruments, fair value is determined based on the price of the entire instrument, for example, by adjusting the fair value of a reasonable proxy instrument. In addition, all financial instruments are already carried at fair values which are inclusive of valuation adjustments for the cost to close out that instrument and hence already factor in uncertainty as it reflects itself in market pricing. Any negative impact of uncertainty calculated within this disclosure, then, will be over and above that already included in the fair value contained in the financial statements.
Breakdown of the sensitivity analysis by type of instrument1
Deutsche Bank Interim Report as of June 30, 2014
Consolidated Financial StatementsInformation on the Consolidated Balance Sheet (unaudited) Financial Instruments carried at Fair Value
91
Jun 30, 2014 Dec 31, 2013
in €€ m.
Positive fair value movement from using
reasonable possible alternatives
Negative fair value movement from using
reasonable possible alternatives
Positive fair value movement from using
reasonable possible alternatives
Negative fair value movement from using
reasonable possible alternatives
Securities: Debt securities 647 541 643 542
Commercial mortgage-backed securities 36 28 39 32 Mortgage and other asset-backed securities 193 188 233 229 Sovereign and quasi sovereign debt obligations 13 11 6 6 Corporate debt securities and other debt obligations 405 314 365 275
Equity securities 78 103 32 97
Derivatives: Credit 395 438 524 509 Equity 211 135 281 171 Interest related 455 287 405 255 Foreign exchange 7 3 24 6 Other 53 33 83 61
Loans: Loans 871 724 701 619 Loan commitments 12 12 17 17
Other 158 183 255 277
Total 2,888 2,459 2,966 2,554
1 Where the exposure to an unobservable parameter is offset across different instruments then only the net impact is disclosed in the table.

Quantitative Information about the Sensitivity of Significant Unobservable Inputs The behavior of the unobservable parameters on Level 3 fair value measurement is not necessarily independent, and dynamic relationships often exist between both other unobservable parameters, and observable parameters. Such relationships, where material to the fair value of a given instrument, are explicitly captured via correlation parameters, or are otherwise controlled via pricing models or valuation techniques. Frequently, where a valuation technique utilises more than one input, the choice of a certain input will bound the range of possible values for other inputs. In addition, broader market factors (such as interest rates, equity, credit or commodity indices or foreign exchange rates) can also have effects.
The range of values shown below represents the highest and lowest inputs used to value the significant exposures within Level 3. The diversity of financial instruments that make up the disclosure is significant and therefore the ranges of certain parameters can be large. For example, the range of credit spreads on mortgage backed securities represents performing, more liquid positions with lower spreads than the less liquid, non-performing positions which will have higher credit spreads. As Level 3 contains the less liquid fair value instruments, the wide ranges of parameters seen is to be expected, as there is a high degree of pricing differentiation within each exposure type to capture the relevant market dynamics. There follows a brief description of each of the principle parameter types, along with a commentary on significant interrelationships between them.
Credit Parameters are used to assess the credit worthiness of an exposure, by enabling the probability of default and resulting losses of a default to be represented. The credit spread is the primary reflection of credit worthiness, and represents the premium or yield return above the benchmark reference instrument (typically LIBOR, or relevant Treasury Instrument, depending upon the asset being assessed), that a bond holder would require in order to allow for the credit quality difference between that entity and the reference benchmark. Higher credit spreads will indicate lower credit quality, and lead to a lower value for a given bond, or other loan-asset that is to be repaid to the Bank by the borrower. Recovery Rates represent an estimate of the amount a lender would receive in the case of a default of a loan, or a bond holder would receive in the case of default of the bond. Higher recovery rates will give a higher valuation for a given bond position, if other parameters are held constant. Constant Default Rate (CDR) and Constant Prepayment Rate (CPR) allow more complex loan and debt assets to be assessed, as these parameters estimate the ongoing defaults arising on scheduled repayments and coupons, or whether the borrower is making additional (usually voluntary) prepayments. These parameters are particularly relevant when forming a fair value opinion for mortgage or other types of lending, where repayments are delivered by the borrower through time, or where the borrower may pre-pay the loan (seen for example in some residential mortgages). Higher CDR will lead to lower valuation of a given loan or mortgage as the lender will ultimately receive less cash.
Interest rates, credit spreads, inflation rates, foreign exchange rates and equity prices are referenced in some option instruments, or other complex derivatives, where the payoff a holder of the derivative will receive is dependent upon the behavior of these underlying references through time. Volatility parameters describe key attributes of option behavior by enabling the variability of returns of the underlying instrument to be assessed. This volatility is a measure of probability, with higher volatilities denoting higher probabilities of a particular outcome occurring. The underlying references (interest rates, credit spreads etc.) have an effect on the valuation of options, by describing the size of the return that can be expected from the option. Therefore the value of a given option is dependent upon the value of the underlying instrument, and the volatility of that instrument, representing the size of the payoff, and the probability of that payoff occurring. Where volatilities are high, the option holder will see a higher option value as there is greater probability of positive returns. A higher option value will also occur where the payoff described by the option is significant.
Correlations are used to describe influential relationships between underlying references where a derivative or other instrument has more than one underlying reference. Behind some of these relationships, for example commodity correlation and interest rate-foreign exchange correlations, typically lie macroeconomic factors such as the impact of global demand on groups of commodities, or the pricing parity effect of interest rates on foreign exchange rates. More specific relationships can exist between credit references or equity stocks in the case of credit derivatives and equity basket derivatives, for example. Credit correlations are used to estimate
Deutsche Bank Interim Report as of June 30, 2014
Consolidated Financial StatementsInformation on the Consolidated Balance Sheet (unaudited) Financial Instruments carried at Fair Value
92
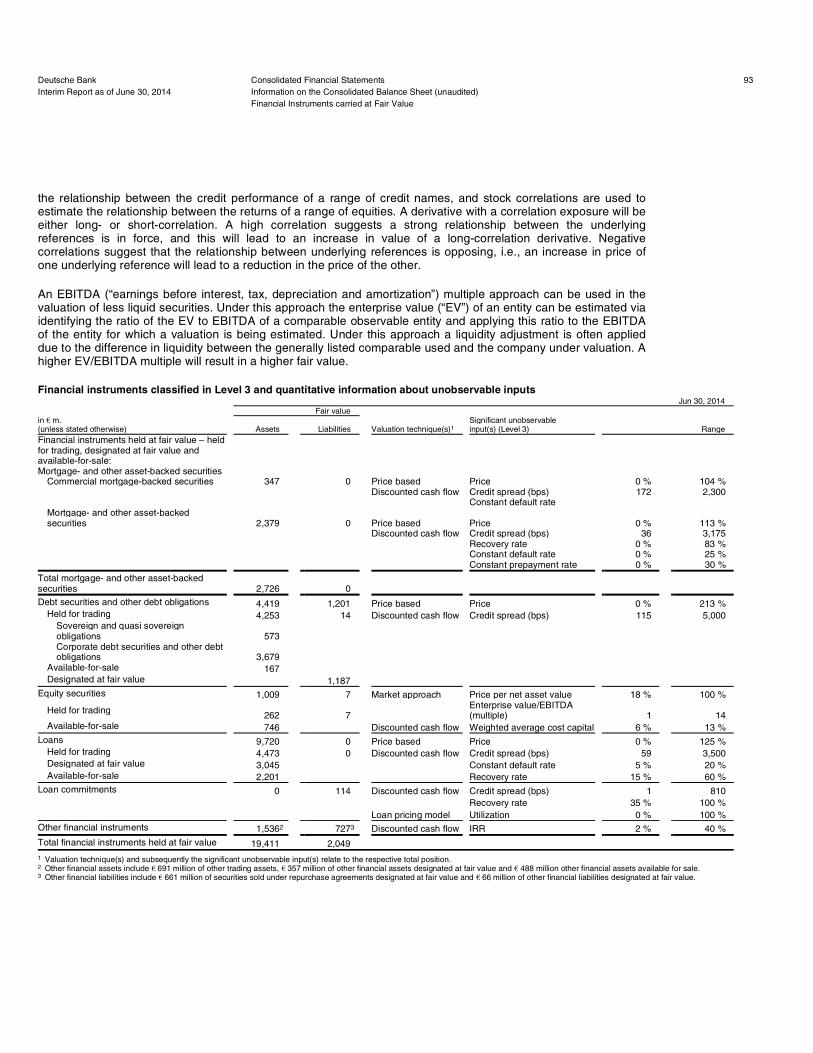
the relationship between the credit performance of a range of credit names, and stock correlations are used to estimate the relationship between the returns of a range of equities. A derivative with a correlation exposure will be either long- or short-correlation. A high correlation suggests a strong relationship between the underlying references is in force, and this will lead to an increase in value of a long-correlation derivative. Negative correlations suggest that the relationship between underlying references is opposing, i.e., an increase in price of one underlying reference will lead to a reduction in the price of the other.
An EBITDA (“earnings before interest, tax, depreciation and amortization”) multiple approach can be used in the valuation of less liquid securities. Under this approach the enterprise value (“EV”) of an entity can be estimated via identifying the ratio of the EV to EBITDA of a comparable observable entity and applying this ratio to the EBITDA of the entity for which a valuation is being estimated. Under this approach a liquidity adjustment is often applied due to the difference in liquidity between the generally listed comparable used and the company under valuation. A higher EV/EBITDA multiple will result in a higher fair value.
Financial instruments classified in Level 3 and quantitative information about unobservable inputs
Deutsche Bank Consolidated Financial Statements 93Interim Report as of June 30, 2014 Information on the Consolidated Balance Sheet (unaudited)
Financial Instruments carried at Fair Value
Jun 30, 2014 Fair value in €€ m. (unless stated otherwise) Assets Liabilities Valuation technique(s)1
Significant unobservableinput(s) (Level 3) Range
Financial instruments held at fair value – held for trading, designated at fair value and available-for-sale: Mortgage- and other asset-backed securities
Commercial mortgage-backed securities 347 0 Price based Price 0 % 104 % Discounted cash flow Credit spread (bps) 172 2,300 Constant default rate
Mortgage- and other asset-backed securities 2,379 0 Price based Price 0 % 113 %
Discounted cash flow Credit spread (bps) 36 3,175 Recovery rate 0 % 83 % Constant default rate 0 % 25 % Constant prepayment rate 0 % 30 %
Total mortgage- and other asset-backed securities 2,726 0
Debt securities and other debt obligations 4,419 1,201 Price based Price 0 % 213 % Held for trading 4,253 14 Discounted cash flow Credit spread (bps) 115 5,000
Sovereign and quasi sovereign obligations 573 Corporate debt securities and other debt obligations 3,679
Available-for-sale 167 Designated at fair value 1,187
Equity securities 1,009 7 Market approach Price per net asset value 18 % 100 %
Held for trading 262 7 Enterprise value/EBITDA (multiple) 1 14
Available-for-sale 746 Discounted cash flow Weighted average cost capital 6 % 13 %
Loans 9,720 0 Price based Price 0 % 125 % Held for trading 4,473 0 Discounted cash flow Credit spread (bps) 59 3,500 Designated at fair value 3,045 Constant default rate 5 % 20 % Available-for-sale 2,201 Recovery rate 15 % 60 %
Loan commitments 0 114 Discounted cash flow Credit spread (bps) 1 810 Recovery rate 35 % 100 % Loan pricing model Utilization 0 % 100 %
Other financial instruments 1,5362 7273 Discounted cash flow IRR 2 % 40 %
Total financial instruments held at fair value 19,411 2,049
1 Valuation technique(s) and subsequently the significant unobservable input(s) relate to the respective total position. 2 Other financial assets include €€ 691 million of other trading assets, €€ 357 million of other financial assets designated at fair value and €€ 488 million other financial assets available for sale. 3 Other financial liabilities include €€ 661 million of securities sold under repurchase agreements designated at fair value and €€ 66 million of other financial liabilities designated at fair value.
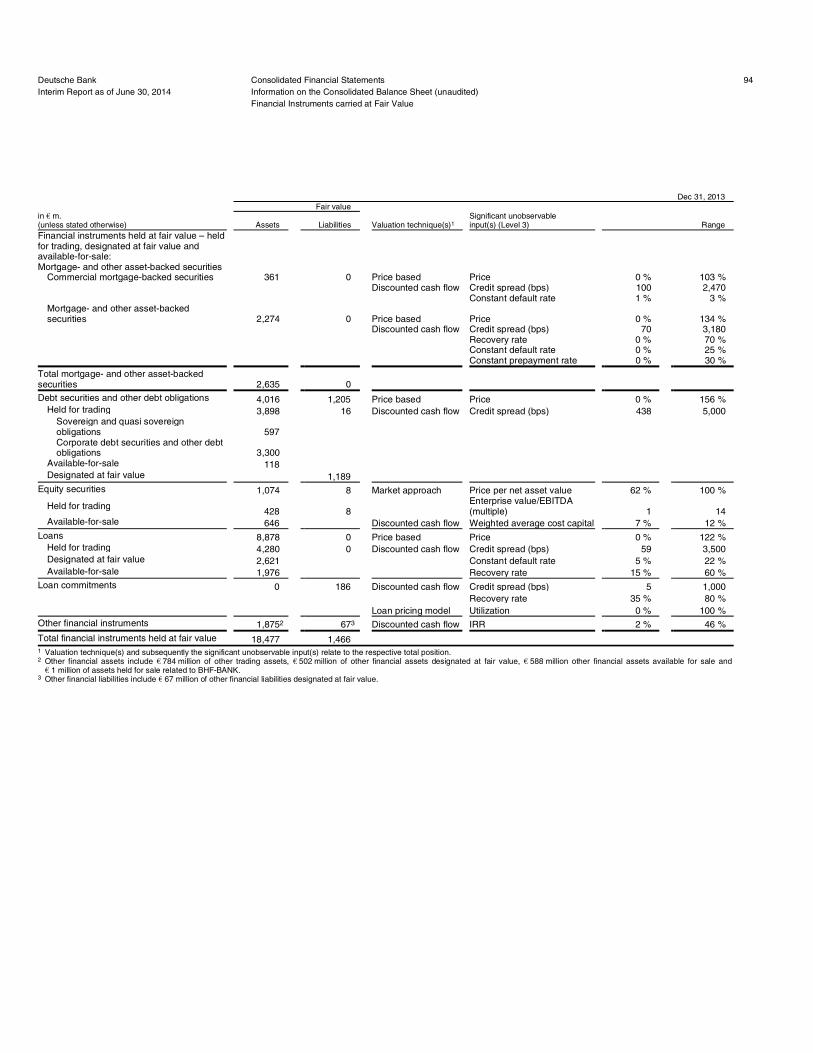
Deutsche Bank Consolidated Financial Statements 94Interim Report as of June 30, 2014 Information on the Consolidated Balance Sheet (unaudited)
Financial Instruments carried at Fair Value
Dec 31, 2013 Fair value in €€ m. (unless stated otherwise) Assets Liabilities Valuation technique(s)1
Significant unobservableinput(s) (Level 3) Range
Financial instruments held at fair value – held for trading, designated at fair value and available-for-sale: Mortgage- and other asset-backed securities
Commercial mortgage-backed securities 361 0 Price based Price 0 % 103 % Discounted cash flow Credit spread (bps) 100 2,470 Constant default rate 1 % 3 %
Mortgage- and other asset-backed securities 2,274 0 Price based Price 0 % 134 %
Discounted cash flow Credit spread (bps) 70 3,180 Recovery rate 0 % 70 % Constant default rate 0 % 25 % Constant prepayment rate 0 % 30 %
Total mortgage- and other asset-backed securities 2,635 0
Debt securities and other debt obligations 4,016 1,205 Price based Price 0 % 156 % Held for trading 3,898 16 Discounted cash flow Credit spread (bps) 438 5,000
Sovereign and quasi sovereign obligations 597 Corporate debt securities and other debt obligations 3,300
Available-for-sale 118 Designated at fair value 1,189
Equity securities 1,074 8 Market approach Price per net asset value 62 % 100 %
Held for trading 428 8 Enterprise value/EBITDA (multiple) 1 14
Available-for-sale 646 Discounted cash flow Weighted average cost capital 7 % 12 %
Loans 8,878 0 Price based Price 0 % 122 % Held for trading 4,280 0 Discounted cash flow Credit spread (bps) 59 3,500 Designated at fair value 2,621 Constant default rate 5 % 22 % Available-for-sale 1,976 Recovery rate 15 % 60 %
Loan commitments 0 186 Discounted cash flow Credit spread (bps) 5 1,000 Recovery rate 35 % 80 % Loan pricing model Utilization 0 % 100 %
Other financial instruments 1,8752 673 Discounted cash flow IRR 2 % 46 %
Total financial instruments held at fair value 18,477 1,466
1 Valuation technique(s) and subsequently the significant unobservable input(s) relate to the respective total position. 2 Other financial assets include €€ 784 million of other trading assets, €€ 502 million of other financial assets designated at fair value, €€ 588 million other financial assets available for sale and €€ 1 million of assets held for sale related to BHF-BANK.
3 Other financial liabilities include €€ 67 million of other financial liabilities designated at fair value.

Deutsche Bank Consolidated Financial Statements 95Interim Report as of June 30, 2014 Information on the Consolidated Balance Sheet (unaudited)
Financial Instruments carried at Fair Value
Jun 30, 2014 Fair value in €€ m. (unless stated otherwise) Assets Liabilities Valuation technique(s)
Significant unobservable input(s) (Level 3) Range
Financial instruments held at fair value: Market values from derivative financial instruments:
Interest rate derivatives 2,547 1,928 Discounted cash flow Swap rate (bps) 1 1,242 Inflation swap rate 0 % 8 % Option pricing model Inflation volatility 0 % 8 % Interest rate volatility 9 % 98 % IR - IR correlation (25) % 100 % Hybrid correlation (77) % 95 %
Credit derivatives 4,023 2,252 Discounted cash flow Credit spread (bps) 2 7,677 Recovery rate 0 % 94 %
Correlation pricing model Credit correlation 13 % 93 %
Equity derivatives 1,023 1,199 Option pricing model Stock volatility 7 % 99 % Index volatility 7 % 84 % Index - index correlation 67 % 91 % Stock - stock correlation 3 % 97 %
FX derivatives 279 364 Option pricing model Volatility 2 % 17 % Other derivatives 1,214 3461 Discounted cash flow Credit spread (bps) 320 1,500
Option pricing model Index volatility 2 % 29 % Commodity correlation (30) % 100 % Commodity forward (€€ /Ton) 69 91
Total market values from derivative financial instruments 9,085 6,089
1 Includes derivatives which are embedded in contracts where the host contract is held at amortized cost but for which the embedded derivative is separated.
Dec 31, 2013
Fair value in €€ m. (unless stated otherwise) Assets Liabilities Valuation technique(s)
Significant unobservable input(s) (Level 3) Range
Financial instruments held at fair value: Market values from derivative financial instruments:
Interest rate derivatives 2,551 2,156 Discounted cash flow Swap rate (bps) 2 1,336 Inflation swap rate 0 % 8 % Option pricing model Inflation volatility 0 % 3 % Interest rate volatility 10 % 95 % IR - IR correlation (2) % 91 % Hybrid correlation (70) % 95 %
Credit derivatives 4,377 2,334 Discounted cash flow Credit spread (bps) 2 4,093 Recovery rate 0 % 75 %
Correlation pricing model Credit correlation 13 % 88 %
Equity derivatives 1,419 1,987 Option pricing model Stock volatility 10 % 100 % Index volatility 11 % 98 % Index - index correlation 62 % 98 % Stock - stock correlation 10 % 97 %
FX derivatives 529 455 Option pricing model Volatility 0 % 30 % Other derivatives 1,680 1,1421 Discounted cash flow Credit spread (bps) 320 1,500
Option pricing model Index volatility 4 % 23 % Commodity correlation (30) % 100 % Commodity forward (€€ /Ton) 97 106
Total market values from derivative financial instruments 10,556 8,074
1 Includes derivatives which are embedded in contracts where the host contract is held at amortized cost but for which the embedded derivative is separated.
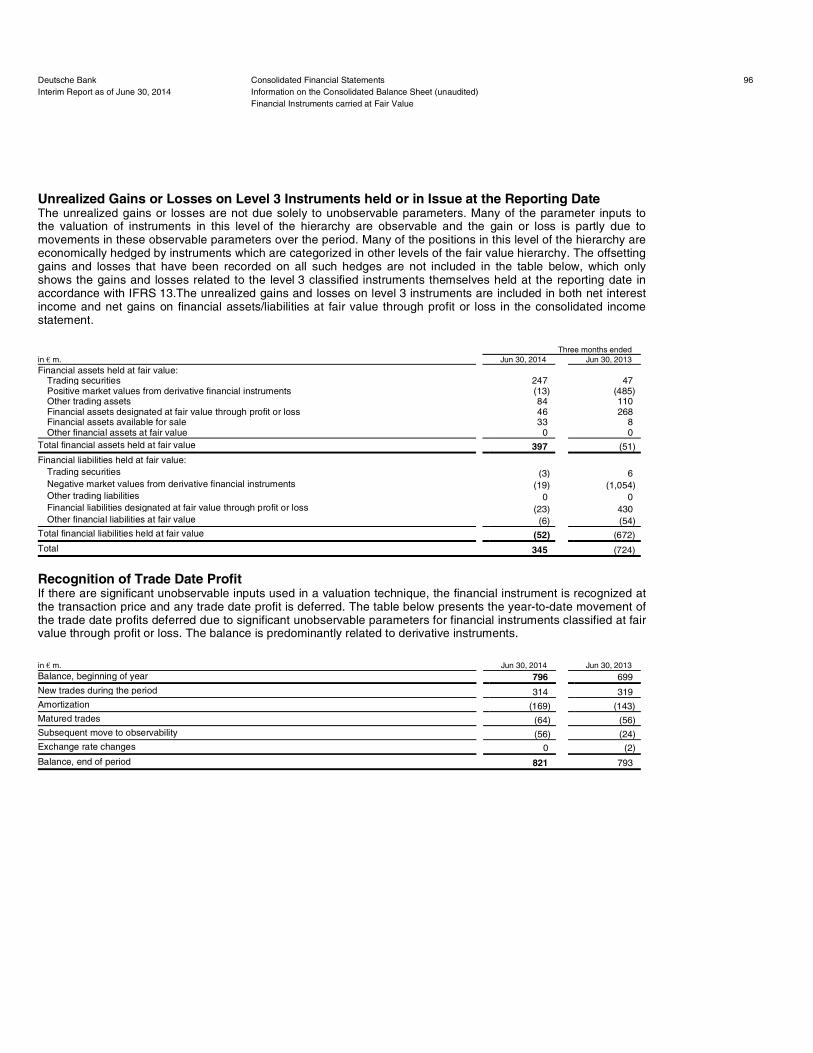
Unrealized Gains or Losses on Level 3 Instruments held or in Issue at the Reporting Date The unrealized gains or losses are not due solely to unobservable parameters. Many of the parameter inputs to the valuation of instruments in this level of the hierarchy are observable and the gain or loss is partly due to movements in these observable parameters over the period. Many of the positions in this level of the hierarchy are economically hedged by instruments which are categorized in other levels of the fair value hierarchy. The offsetting gains and losses that have been recorded on all such hedges are not included in the table below, which only shows the gains and losses related to the level 3 classified instruments themselves held at the reporting date in accordance with IFRS 13.The unrealized gains and losses on level 3 instruments are included in both net interest income and net gains on financial assets/liabilities at fair value through profit or loss in the consolidated income statement.
Recognition of Trade Date Profit If there are significant unobservable inputs used in a valuation technique, the financial instrument is recognized at the transaction price and any trade date profit is deferred. The table below presents the year-to-date movement of the trade date profits deferred due to significant unobservable parameters for financial instruments classified at fair value through profit or loss. The balance is predominantly related to derivative instruments.
Deutsche Bank Consolidated Financial Statements 96Interim Report as of June 30, 2014 Information on the Consolidated Balance Sheet (unaudited)
Financial Instruments carried at Fair Value
Three months ended in €€ m. Jun 30, 2014 Jun 30, 2013 Financial assets held at fair value:
Trading securities 247 47 Positive market values from derivative financial instruments (13) (485) Other trading assets 84 110 Financial assets designated at fair value through profit or loss 46 268 Financial assets available for sale 33 8 Other financial assets at fair value 0 0
Total financial assets held at fair value 397 (51)
Financial liabilities held at fair value: Trading securities (3) 6 Negative market values from derivative financial instruments (19) (1,054) Other trading liabilities 0 0 Financial liabilities designated at fair value through profit or loss (23) 430 Other financial liabilities at fair value (6) (54)
Total financial liabilities held at fair value (52) (672)
Total 345 (724)
in €€ m. Jun 30, 2014 Jun 30, 2013 Balance, beginning of year 796 699
New trades during the period 314 319
Amortization (169) (143)
Matured trades (64) (56)
Subsequent move to observability (56) (24)
Exchange rate changes 0 (2)
Balance, end of period 821 793

Fair Value of Financial Instruments not carried at Fair Value
This section should be read in conjunction with Note 15 “Fair Value of Financial Instruments not carried at Fair Value” of the Group’s Financial Report 2013.
The valuation techniques used to establish fair value for the Group’s financial instruments which are not carried at fair value in the balance sheet are consistent with those outlined in Note 14 “Financial Instruments carried at Fair Value” of the Group’s Financial Report 2013. As described in section “Amendments to IAS 39 and IFRS 7, ‘Reclassification of Financial Assets’”, the Group reclassified certain eligible assets from the trading and available for sale classifications to loans. The Group continues to apply the relevant valuation techniques set out in Note 14 “Financial Instruments carried at Fair Value” of the Group’s Financial Report 2013 to the reclassified assets.
Other financial instruments not carried at fair value are not managed on a fair value basis, for example, retail loans and deposits and credit facilities extended to corporate clients. For these instruments fair values are calculated for disclosure purposes only and do not impact the balance sheet or income statement. Additionally, since the instruments generally do not trade there is significant management judgment required to determine these fair values.
Estimated fair value of financial instruments not carried at fair value on the balance sheet1
Offsetting Financial Assets and Financial Liabilities
The Group is eligible to present certain financial assets and financial liabilities on a net basis on the balance sheet pursuant to criteria described in Note 1 “Significant Accounting Policies and Critical Accounting Estimates: Offsetting Financial Instruments” of the Group’s Financial Report 2013.
The following tables provide information on the impact of offsetting on the consolidated balance sheet, as well as the financial impact of netting for instruments subject to an enforceable master netting arrangement or similar agreement as well as available cash and financial instrument collateral.
Deutsche Bank Consolidated Financial Statements 97Interim Report as of June 30, 2014 Information on the Consolidated Balance Sheet (unaudited)
Offsetting Financial Assets and Financial Liabilities
Jun 30, 2014 Dec 31, 2013 in €€ m. Carrying value Fair value Carrying value Fair value Financial assets:
Cash and due from banks 21,096 21,096 17,155 17,155 Interest-earning deposits with banks 84,076 84,080 77,984 77,985 Central bank funds sold and securities purchased under resale agreements 28,827 28,827 27,363 27,363 Securities borrowed 25,147 25,147 20,870 20,870 Loans 387,901 392,384 376,582 378,085 Other financial assets 146,455 146,454 92,507 92,532
Financial liabilities:
Deposits 537,309 537,013 527,750 527,609 Central bank funds purchased and securities sold under repurchase agreements 13,426 13,427 13,381 13,385 Securities loaned 3,957 3,957 2,304 2,304 Other short-term borrowings 56,623 56,618 59,767 59,763 Other financial liabilities 177,284 177,284 142,649 142,666 Long-term debt 140,536 141,958 133,082 134,359 Trust preferred securities 10,118 11,532 11,926 12,915
1 Amounts generally presented on a gross basis, in line with the Group’s accounting policy regarding offsetting of financial instruments as described in Note 1 “SignificantAccounting Policies and Critical Accounting Estimates” of the Group’s Financial Report 2013.

Assets
Liabilities
Deutsche Bank Consolidated Financial Statements 98Interim Report as of June 30, 2014 Information on the Consolidated Balance Sheet (unaudited)
Offsetting Financial Assets and Financial Liabilities
Jun 30, 2014 Amounts not set off on the balance sheet
in €€ m.
Gross amounts
of financial assets
Gross amounts
set off on the balance
sheet
Net amounts of financial assets pre-
sented on the balance
sheet
Impact of Master Netting
Agreements Cash
collateral
Financial instrument
collateral1 Net amount Central bank funds sold and securities purchased under resale agreements (enforceable) 28,240 (6,927) 21,313 0 0 (21,262) 51 Central bank funds sold and securities purchased under resale agreements (non-enforceable) 7,514 0 7,514 0 0 (6,864) 650
Securities borrowed (enforceable) 12,530 0 12,530 0 0 (12,131) 399 Securities borrowed (non-enforceable) 12,618 0 12,618 0 0 (12,161) 457
Financial assets at fair value through profit or loss Trading assets 212,039 (1,048) 210,991 0 (27) (925) 210,039 Positive market values from derivative financial instruments (enforceable) 650,711 (185,832) 464,878 (397,024) (45,009) (9,700) 13,145 Positive market values from derivative financial instruments (non-enforceable) 19,891 0 19,891 0 0 0 19,891 Financial assets designated at fair value through profit or loss (enforceable) 118,923 (29,099) 89,824 (20,272) (1,042) (63,383) 5,128 Financial assets designated at fair value through profit or loss (non-enforceable) 86,315 0 86,315 0 0 (29,755) 56,560
Total financial assets at fair value through profit or loss 1,087,878 (215,979) 871,899 (417,295) (46,078) (103,764) 304,763
Loans 388,022 (121) 387,901 0 (11,537) (45,091) 331,272
Other assets 187,283 (24,655) 162,628 (47,030) (157) (12) 115,428 Thereof: Positive market values from derivatives qualifying for hedge accounting (enforceable) 9,945 (6,204) 3,741 (3,227) 0 0 514
Remaining assets not subject to netting 189,008 0 189,008 0 (555) (301) 188,152
Total assets 1,913,092 (247,682) 1,665,410 (464,326) (58,327) (201,586) 941,172
1 Excludes real estate and other non-financial instrument collateral.
Jun 30, 2014 Amounts not set off on the balance sheet
in €€ m.
Gross amounts
of financial liabilities
Gross amounts
set off on the balance
sheet
Net amounts of financial
liabilities pre- sented on the
balance sheet
Impact of Master Netting
Agreements Cash
collateral
Financial instrument
collateral Net amount Deposit 537,364 (55) 537,309 0 0 0 537,309
Central bank funds purchased and securities sold under repurchase agreements (enforceable) 15,606 (6,797) 8,809 0 0 (8,654) 155 Central bank funds purchased and securities sold under repurchase agreements (non-enforceable) 4,617 0 4,617 0 0 (4,617) 0
Securities loaned (enforceable) 3,541 0 3,541 0 0 (3,306) 235 Securities loaned (non-enforceable) 416 0 416 0 0 (416) 0
Financial liabilities at fair value through profit or loss Trading liabilities 53,751 (1,762) 51,989 0 0 0 51,989 Negative market values from derivative financial instruments (enforceable) 634,305 (186,107) 448,199 (399,638) (43,803) (4,757) 0 Negative market values from derivative financial instruments (non-enforceable) 23,723 0 23,723 0 0 (7,034) 16,689 Financial liabilities designated at fair value through profit or loss (enforceable) 82,297 (28,143) 54,154 (20,272) 0 (25,870) 8,013 Financial liabilities designated at fair value through profit or loss (non-enforceable) 51,660 0 51,660 0 0 (30,559) 21,101
Total financial liabilities at fair value through profit or loss 845,736 (216,012) 629,725 (419,910) (43,803) (68,220) 97,792
Other liabilities 222,110 (24,819) 197,291 (45,622) 0 0 151,669 Thereof: Negative market values from derivatives qualifying for hedge accounting (enforceable) 6,816 (6,204) 613 (613) 0 0 0
Remaining liabilities not subject to netting 215,302 0 215,302 0 0 0 215,302
Total liabilities 1,844,692 (247,682) 1,597,009 (465,531) (43,803) (85,213) 1,002,462

Assets
Deutsche Bank Consolidated Financial Statements 99Interim Report as of June 30, 2014 Information on the Consolidated Balance Sheet (unaudited)
Offsetting Financial Assets and Financial Liabilities
Dec 31, 2013 Amounts not set off on the balance sheet
in €€ m.
Gross amounts
of financial assets
Gross amounts
set off on the balance
sheet
Net amounts of financial assets pre-
sented on the balance
sheet
Impact of Master Netting
Agreements Cash
collateral
Financial instrument
collateral1 Net amount Central bank funds sold and securities purchased under resale agreements (enforceable) 26,675 (2,390) 24,285 0 0 (24,271) 15 Central bank funds sold and securities purchased under resale agreements (non-enforceable) 3,077 0 3,077 0 0 (830) 2,248
Securities borrowed (enforceable) 11,438 0 11,438 0 0 (11,051) 386 Securities borrowed (non-enforceable) 9,432 0 9,432 0 0 (9,004) 428
Financial assets at fair value through profit or loss Trading assets 211,260 (1,190) 210,070 0 (311) (2,881) 206,878 Positive market values from derivative financial instruments(enforceable) 738,425 (270,584) 467,841 (406,616) (47,470) (10,297) 3,458 Positive market values from derivative financial instruments(non-enforceable) 36,749 0 36,749 0 0 0 36,749 Financial assets designated at fair value through profit or loss (enforceable) 133,122 (19,575) 113,547 (17,121) 0 (84,266) 12,160 Financial assets designated at fair value through profit or loss (non-enforceable) 71,050 0 71,050 0 0 (50,263) 20,787
Total financial assets at fair value through profit or loss 1,190,605 (291,348) 899,257 (423,737) (47,781) (147,706) 280,032
Loans 376,638 (56) 376,582 0 (11,042) (46,899) 318,640
Other assets 128,724 (16,185) 112,539 (43,574) (278) (385) 68,302 Thereof: Positive market values from derivatives qualifying for hedge accounting (enforceable) 9,375 (5,412) 3,963 (3,518) 0 0 445
Remaining assets not subject to netting 174,790 0 174,790 0 0 (755) 174,035
Total assets 1,921,380 (309,979) 1,611,400 (467,311) (59,102) (240,901) 844,087
1 Excludes real estate and other non-financial instrument collateral. Amounts have been adjusted accordingly.
Liabilities
Dec 31, 2013
Amounts not set off on the balance sheet
in €€ m.
Gross amounts
of financial liabilities
Gross amounts
set off on the balance
sheet
Net amounts of financial
liabilities pre- sented on the
balance sheet
Impact of Master Netting
Agreements Cash
collateral
Financial instrument
collateral
Net amount Deposit 527,750 0 527,750 0 0 0 527,750
Central bank funds purchased and securities sold under repurchase agreements (enforceable) 7,098 (2,390) 4,708 0 0 (4,675) 33 Central bank funds purchased and securities sold under repurchase agreements (non-enforceable) 8,673 0 8,673 0 0 (7,080) 1,594
Securities loaned (enforceable) 2,304 0 2,304 0 0 (2,112) 192 Securities loaned (non-enforceable) 0 0 0 0 0 0 0
Financial liabilities at fair value through profit or loss Trading liabilities 57,702 (1,898) 55,804 0 0 0 55,804 Negative market values from derivative financial instruments (enforceable) 721,233 (268,819) 452,414 (411,547) (40,055) (812) 0 Negative market values from derivative financial instruments (non-enforceable) 31,015 0 31,015 0 0 (7,639) 23,376 Financial liabilities designated at fair value through profit or loss (enforceable) 88,021 (18,262) 69,759 (17,121) (588) (49,055) 2,995 Financial liabilities designated at fair value through profit or loss (non-enforceable) 28,413 0 28,413 0 0 (3,890) 24,523
Total financial liabilities at fair value through profit or loss 926,384 (288,980) 637,404 (428,668) (40,644) (61,395) 106,698
Other liabilities 182,204 (18,610) 163,595 (46,058) 0 0 117,537 Thereof: Negative market values from derivatives qualifying for hedge accounting (enforceable) 6,028 (5,412) 616 (616) 0 0 0
Remaining liabilities not subject to netting 212,000 0 212,000 0 0 0 212,000
Total liabilities 1,866,414 (309,979) 1,556,434 (474,725) (40,644) (75,262) 965,803

The column “Gross amounts set off on the balance sheet” discloses the amounts offset in accordance with all the criteria described in Note 1 “Significant Accounting Policies and Critical Accounting Estimates: Offsetting Financial Instruments” of the Group’s Financial Report 2013.
The column “Impact of Master Netting Agreements” discloses the amounts that are subject to master netting agreements but were not offset because they did not meet the net settlement/simultaneous settlement criteria; or because the rights of off-setting are conditional upon the default of the counterparty only. The amounts presented for other assets and other liabilities include cash margin receivables and payables respectively.
The columns “Cash collateral” and “Financial instrument collateral” disclose the cash and financial instrument collateral amounts received or pledged in relation to the total amounts of assets and liabilities, including those that were not offset.
Non-enforceable master netting agreements refer to contracts executed in jurisdictions where the rights of set off may not be upheld under the local bankruptcy laws.
The cash collateral received against the positive market values of derivatives and the cash collateral pledged towards the negative mark-to-market values of derivatives are booked within the “Other liabilities” and “Other assets” balances respectively.
The Cash and Financial instrument collateral amounts disclosed reflect their fair values. The rights of set off relating to the cash and financial instrument collateral are conditional upon the default of the counterparty.
Allowance for Credit Losses
Deutsche Bank Consolidated Financial StatementsInformation on the Consolidated Balance Sheet (unaudited) Allowance for Credit Losses
100Interim Report as of June 30, 2014
Six months ended Jun 30, 2014 Allowance for Loan Losses Allowance for Off-Balance Sheet Positions in €€ m. (unless stated otherwise)
Individually assessed
Collectively assessed Subtotal
Individually assessed
Collectively assessed Subtotal Total
Balance, beginning of year 2,857 2,732 5,589 102 114 216 5,805
Provision for credit losses 191 283 474 13 9 22 496 Thereof: (Gains)/Losses from disposal of impaired loans (40) (4) (44) 0 0 0 (44)
Net charge-offs: (640) (184) (824) 0 0 0 (824) Charge-offs (662) (230) (892) 0 0 0 (892) Recoveries 23 46 69 0 0 0 69
Changes in the group of consolidated companies 0 0 0 0 0 0 0
Exchange rate changes/other (16) (6) (23) 0 1 0 (22)
Balance, end of period 2,392 2,824 5,216 114 124 238 5,454
Changes compared to prior year
Provision for credit losses In €€ m. (341) 3 (338) 7 (1) 6 (332) In % (64) 1 (42) 142 (13) 38 (40)
Net charge-offs In €€ m. (319) (73) (391) 0 0 0 (391) In % 99 66 91 0 0 0 91

Other Assets and Other Liabilities
Other Assets
Deutsche Bank Consolidated Financial StatementsInformation on the Consolidated Balance Sheet (unaudited) Other Assets and Other Liabilities
101Interim Report as of June 30, 2014
Six months ended Jun 30, 2013 Allowance for Loan Losses Allowance for Off-Balance Sheet Positions in €€ m. (unless stated otherwise)
Individually assessed
Collectively assessed Subtotal
Individually assessed
Collectively assessed Subtotal Total
Balance, beginning of year 2,266 2,426 4,692 118 97 215 4,907
Provision for credit losses 532 280 812 5 11 16 828 Thereof: (Gains)/Losses from disposal of impaired loans 4 (43) (39) 0 0 0 (39)
Net charge-offs: (321) (111) (432) 0 0 0 (432) Charge-offs (336) (199) (535) 0 0 0 (535) Recoveries 15 88 103 0 0 0 103
Changes in the group of consolidated companies 0 0 0 0 0 0 0
Exchange rate changes/other (45) (20) (65) 0 0 0 (65)
Balance, end of period 2,432 2,575 5,007 123 108 231 5,237
Changes compared to prior year
Provision for credit losses In €€ m. 83 (14) 69 17 9 26 95 In % 18 (5) 9 (144) 444 (260) 13
Net charge-offs In €€ m. 44 24 68 0 0 0 68 In % (12) (18) (14) 0 0 0 (14)
in €€ m. Jun 30, 2014 Dec 31, 2013 Brokerage and securities related receivables
Cash/margin receivables 46,059 40,938 Receivables from prime brokerage 10,539 9,140 Pending securities transactions past settlement date 8,810 2,697 Receivables from unsettled regular way trades 73,407 30,410
Total brokerage and securities related receivables 138,815 83,185
Accrued interest receivable 2,911 3,236
Assets held for sale 1,566 6,670
Other 19,336 19,448
Total other assets 162,628 112,539

Other Liabilities
Long-Term Debt
Shares Issued and Outstanding
On June 5, 2014, Deutsche Bank AG issued 59.9 million new common shares at €€ 29.20 per share, resulting in total proceeds of €€ 1.7 billion. The shares were issued with full dividend rights for the year 2014 from authorized capital and without pre-emptive rights. The shares were placed with Paramount Services Holdings Ltd.
On June 25, 2014, Deutsche Bank AG completed a capital increase from authorized capital against cash contributions through a public offering with subscription rights. In total, 299.8 million new common shares were issued, resulting in total proceeds of €€ 6.8 billion. The shares were issued with full dividend rights for the year 2014. 99.1 % of the subscription rights were exercised and thus 297.1 million new shares were issued at the subscription price of €€ 22.50 per share. The remaining 2.8 million new shares were sold in the market at an average price of €€ 26.58 per share.
Deutsche Bank Consolidated Financial StatementsInformation on the Consolidated Balance Sheet (unaudited) Shares Issued and Outstanding
102Interim Report as of June 30, 2014
in €€ m. Jun 30, 2014 Dec 31, 2013 Brokerage and securities related payables
Cash/margin payables 50,292 53,435 Payables from prime brokerage 31,136 30,266 Pending securities transactions past settlement date 8,044 2,289 Payables from unsettled regular way trades 71,892 33,001
Total brokerage and securities related payables 161,365 118,992
Accrued interest payable 2,956 3,673
Liabilities held for sale 114 6,264
Other 32,857 34,666
Total other liabilities 197,291 163,595
in €€ m. Jun 30, 2014 Dec 31, 2013 Senior debt:
Bonds and notes Fixed rate 80,588 76,953 Floating rate 32,211 26,503
Subordinated debt:
Bonds and notes Fixed rate 2,796 3,022 Floating rate 3,000 4,557
Other 21,940 22,047
Total long-term debt 140,536 133,082

The transaction costs related to these capital increases that were directly recorded in equity amounted to €€ 0.1 billion after tax.
Additional Equity Components
On May 20, 2014, Deutsche Bank AG placed Additional Tier 1 Notes (the “AT1 Notes” or “Notes”), amounting to €€ 3.5 billion. Warrants to subscribe a total of 30,250 shares, which had originally been attached to the Notes, were already detached by an initial subscriber.
The AT1 Notes constitute unsecured and subordinated notes of Deutsche Bank. The Notes bear interest on their nominal amount from the issue date to the first call date at a fixed annual rate. Thereafter the interest rate will be reset at five year intervals. Payments of interest are subject to cancellation, in whole or in part, and, if cancelled, are non-cumulative, and interest payments in the following years will not increase to compensate for any shortfall in interest payments in any previous year. The Notes do not have a maturity date. They are redeemable by Deutsche Bank at its discretion on the respective first call date and at five year intervals thereafter or in other limited circumstances. In each case, the Notes are subject to limitations and conditions as described in the terms and conditions for example, the Notes can be redeemed by Deutsche Bank at its discretion, in whole but not in part, for certain regulatory or taxation reasons. Any redemption is subject to the prior consent of the competent supervisory authority. The redemption amount and the nominal amount of the Notes may be written down upon the occurrence of a trigger event. A trigger event occurs if the Common Equity Tier 1 capital ratio, determined on a consolidated basis falls below 5.125 %. The Notes may also be written up, following a trigger event, subject to meeting certain conditions.
Deutsche Bank Consolidated Financial StatementsInformation on the Consolidated Balance Sheet (unaudited) Additional Equity Components
103Interim Report as of June 30, 2014
in million Jun 30, 2014 Dec 31, 2013 Shares issued 1,379.3 1,019.5
Shares in treasury 0.3 0.2
Thereof:
Buyback 0.0 0.0
Other 0.3 0.2
Shares outstanding 1,379.0 1,019.3

Other Financial Information (unaudited)
Credit related Commitments and Contingent Liabilities
In the normal course of business the Group enters regularly into irrevocable lending commitments as well as lending-related contingent liabilities consisting of financial and performance guarantees, standby letters of credit and indemnity agreements on behalf of its customers. Under these contracts the Group is required to perform under an obligation agreement or to make payments to the beneficiary based on a third party’s failure to meet its obligations. For these instruments it is not known to the Group in detail if, when and to what extent claims will be made. The Group considers these instruments in monitoring its credit exposure and may agree upon collateral to mitigate inherent credit risk. If the credit risk monitoring provides sufficient evidence of a loss from an expected claim, a provision is established and recorded on the balance sheet.
The following table shows the Group’s irrevocable lending commitments and lending-related contingent liabilities without considering collateral or provisions. It shows the maximum potential impact to the Group in the event that all of these liabilities must be fulfilled. The table does not show the expected future cash outflows from these obligations as many of them will expire without being drawn, arising claims will be honoured by the customers, or such claims may be recovered from proceeds from collateral obtained.
Other Contingencies
Litigation The Group operates in a legal and regulatory environment that exposes it to significant litigation risks. As a result, the Group is involved in litigation, arbitration and regulatory proceedings and investigations in Germany and in a number of jurisdictions outside Germany, including the United States, arising in the ordinary course of business. The legal and regulatory claims for which the Group has taken material provisions or for which there are material contingent liabilities that are more than remote are described below; similar matters are grouped together and some matters consist of a number of claims. These and other matters have the potential to result in the imposition of significant financial and other consequences for the Bank. The estimated loss in respect of each, where such an estimate can be made, has not been disclosed for individual matters because the Group has concluded that such disclosure can be expected to seriously prejudice their outcome. Note 29 “Provisions” of the Group’s Financial Report 2013 describes how the Group estimates provisions and expected losses in respect of its contingent liabilities, and the uncertainties and limitations inherent in such process. For these and other matters that may have a significant impact on the Group and for which an estimate can be made, the Group currently estimates that, as of June 30, 2014, the aggregate future loss of which the possibility is more than remote but less than probable is approximately €€ 3.2 billion (December 31, 2013: €€ 1.5 billion). This figure includes contingent liabilities on matters where the Group’s potential liability is joint and several and where the Group expects any such liability to be paid by a third party.
The Group may settle litigation or regulatory proceedings prior to a final judgment or determination of liability. It may do so to avoid the cost, management efforts or negative business, regulatory or reputational consequences of continuing to contest liability, even when the Group believes it has valid defenses to liability. It may also do so when the potential consequences of failing to prevail would be disproportionate to the costs of settlement. Furthermore, the Group may, for similar reasons, reimburse counterparties for their losses even in situations where it does not believe that it is legally compelled to do so.
Deutsche Bank Consolidated Financial StatementsOther Financial Information (unaudited) Other Contingencies
104Interim Report as of June 30, 2014
in €€ m. Jun 30, 2014 Dec 31, 2013 Irrevocable lending commitments 128,134 126,660
Contingent liabilities 63,017 65,630
Total 191,151 192,290

Credit Default Swap Antitrust Matters. On July 1, 2013, the European Commission (EC) issued a Statement of Objections (the “SO”) against Deutsche Bank, Markit Group Limited (Markit), the International Swaps and Derivatives Association, Inc. (ISDA), and twelve other banks alleging anti-competitive conduct under Article 101 of the Treaty on the Functioning of the European Union (TFEU) and Article 53 of the European Economic Area Agreement (the “EEA Agreement”). The SO sets forth preliminary conclusions of the EC that (i) attempts by certain entities to engage in exchange trading of unfunded credit derivatives were foreclosed by improper collective action in the period from 2006 through 2009, and (ii) the conduct of Markit, ISDA, Deutsche Bank and the twelve other banks constituted a single and continuous infringement of Article 101 of the TFEU and Article 53 of the EEA Agreement. If the EC finally concludes that infringement occurred, it may seek to impose fines and other remedial measures on Deutsche Bank, Markit, ISDA and the twelve other banks. Deutsche Bank filed a response contesting the EC’s preliminary conclusions in January 2014. Deutsche Bank and other SO addressees presented orally the key elements of their responses at an oral hearing in May 2014.
Antitrust Litigation regarding Credit Default Swaps. Several putative civil actions have been filed in federal court in the United States District Court for the Southern District of New York and the United States District Court for the Northern District of Illinois against Deutsche Bank and numerous other credit default swap (CDS) dealer banks. All of the complaints allege that the banks conspired to prevent the establishment of exchange traded CDS, with the effect of raising prices for over-the-counter CDS transactions, and seek to represent a class of individuals and entities located in the United States or abroad who, during a period from about October 2008 through the present, directly purchased CDS from or directly sold CDS to the defendants in the United States. All of these CDS civil actions were consolidated for pre-trial purposes and lead plaintiffs filed a consolidated amended complaint, followed by a second amended complaint. Defendants have filed a motion to dismiss the second amended complaint. That motion is currently pending.
Credit Correlation. Certain regulatory authorities are investigating Deutsche Bank’s bespoke credit correlation trading book and certain risks within that book, during the credit crisis. Issues being examined include the methodology used to value positions in the book as well as the robustness of controls governing the application of valuation methodologies. Deutsche Bank is cooperating with those investigations.
FX Investigations and Litigations. Deutsche Bank has received requests for information from certain regulatory authorities globally who are investigating trading in the foreign exchange market. The Bank is cooperating with these investigations. Relatedly, Deutsche Bank is conducting its own internal global review of foreign exchange trading. In connection with this review, the Bank has taken, and will continue to take, disciplinary action with regards to individuals if merited. Deutsche Bank is also named as a defendant in three putative class actions brought in the United States District Court for the Southern District of New York alleging antitrust claims relating to the alleged manipulation of foreign exchange rates.
High Frequency Trading. Deutsche Bank has received requests for information from certain regulatory authorities related to high frequency trading. The Bank is cooperating with these requests. Deutsche Bank is also named as a defendant in putative class action complaints alleging violations of U.S. securities laws related to high frequency trading.
Interbank Offered Rates Matters. Deutsche Bank has received subpoenas and requests for information from various regulatory and law enforcement agencies in Europe, North America and Asia Pacific in connection with industry-wide investigations concerning the setting of London Interbank Offered Rate (LIBOR), Euro Interbank Offered Rate (EURIBOR), Tokyo Interbank Offered Rate (TIBOR) and other interbank offered rates. Deutsche Bank is cooperating with these investigations.
On December 4, 2013, Deutsche Bank announced that it had reached a settlement with the European Commission as part of a collective settlement to resolve the European Commission’s investigations in relation to anticompetitive conduct in the trading of Euro interest rate derivatives and Yen interest rate derivatives. Under the terms of the settlement agreement, Deutsche Bank agreed to pay €€ 466 million for the Euro interest rate derivatives and €€ 259 million for the Yen interest rate derivatives matters, respectively, or €€ 725 million in total.
Deutsche Bank Consolidated Financial StatementsOther Financial Information (unaudited) Other Contingencies
105Interim Report as of June 30, 2014
The settlement amount was already substantially reflected in Deutsche Bank’s existing litigation reserves, and no material additional reserves were necessary. The settlement amount reflects the high market share held by Deutsche Bank in certain of the markets investigated by the European Commission. Deutsche Bank remains exposed to civil litigation and further regulatory action relating to these benchmarks.
In the period from mid-2012 to mid-2014, four financial institutions entered into settlements with the U.K. Financial Services Authority, U.S. Commodity Futures Trading Commission and U.S. Department of Justice (DOJ). While the terms of the various settlements differed, they all involved significant financial penalties and regulatory consequences. For example, two financial institutions’ settlements included a Deferred Prosecution Agreement, pursuant to which the DOJ agreed to defer prosecution of criminal charges against the applicable entity provided that the financial institution satisfies the terms of the Deferred Prosecution Agreement. The terms of the other two financial institutions’ settlements included Non-Prosecution Agreements, pursuant to which the DOJ agreed not to file criminal charges against the entities so long as certain conditions are met. In addition, affiliates of two of the financial institutions agreed to plead guilty to a crime in a United States court for related conduct.
A number of civil actions, including putative class actions, are pending in federal court in the United States District Court for the Southern District of New York (SDNY) against Deutsche Bank and numerous other banks. All but two of these actions were filed on behalf of parties who allege that they held or transacted in U.S. Dollar LIBOR-based derivatives or other financial instruments and sustained losses as a result of purported collusion or manipulation by the defendants relating to the setting of U.S. Dollar LIBOR. With one exception, all of the civil actions pending in the SDNY concerning U.S. Dollar LIBOR are being coordinated as part of a multidistrict litigation (U.S. Dollar LIBOR MDL). In March 2013, the District Court dismissed the federal and state antitrust claims, claims asserted under the Racketeer Influenced and Corrupt Organizations Act (RICO) and certain state law claims that had been asserted in six amended complaints. Appeals to the United States Court of Appeals for the Second Circuit were dismissed as premature; the United States Supreme Court has granted a writ of certiorari filed by plaintiffs in one of the actions seeking review of the Second Circuit’s dismissal and will consider the question of whether the appeal should be heard by the Court of Appeals now. Additional complaints relating to the alleged manipulation of U.S. Dollar LIBOR have been filed in, removed to, or transferred to the SDNY and are being coordinated as part of the U.S. Dollar LIBOR MDL. These additional actions have been stayed. The SDNY court issued a decision in June 2014 addressing various matters pending before it at the time and indicated in July 2014 that it is in the process of determining the next steps in the proceeding. An additional action concerning U.S. Dollar LIBOR is independently pending in the SDNY and is subject to a pending motion to dismiss.
A putative class action was filed against Deutsche Bank and other banks concerning the alleged manipulation of Yen LIBOR and Euroyen TIBOR. On March 28, 2014, the SDNY court granted defendants’ motions to dismiss claims asserted under U.S. federal antitrust laws and for unjust enrichment, but denied defendants’ motions as to certain claims asserted under the Commodity Exchange Act. Motions for reconsideration of the denial of defendants’ motions are pending. Deutsche Bank is also a defendant in a putative class action concerning the alleged manipulation of Euribor. Defendants’ time to respond to that complaint has been stayed pending amendments to the complaint. Claims for damages in these cases have been asserted under various legal theories, including violations of the Commodity Exchange Act, federal and state antitrust laws, the Racketeer Influenced and Corrupt Organizations Act, and other federal and state laws.
Kirch. The public prosecutor’s office in Munich is currently conducting criminal investigations against several former Management Board members and two current Management Board members of Deutsche Bank AG, Juergen Fitschen and Stephan Leithner, in connection with the Kirch case. The Kirch case involved several civil proceedings between Deutsche Bank AG and Dr. Leo Kirch as well as media companies controlled by him. The key issue was whether an interview given by Dr. Rolf Breuer, then Spokesman of Deutsche Bank’s Management Board, in 2002 with Bloomberg television, during which Dr. Breuer commented on Dr. Kirch’s (and his companies’) inability to obtain financing, caused the insolvency of the Kirch companies. In February 2014,
Deutsche Bank Consolidated Financial StatementsOther Financial Information (unaudited) Other Contingencies
106Interim Report as of June 30, 2014

Deutsche Bank and the Kirch heirs reached a comprehensive settlement, which has ended all legal disputes between them.
The public prosecutors are investigating whether the two current Management Board members failed to correct in a timely manner factual statements made by Deutsche Bank’s litigation counsel in submissions filed in a civil case between Kirch and Deutsche Bank AG before the Munich Higher Regional Court and the Federal Court of Justice, after allegedly having become aware that such statements were not correct. Under German law, a party in a civil litigation is under a statutory duty to make sure all factual statements made by it in court are accurate. The two current Management Board members are targets of the criminal investigation because (unlike the other current Management Board members of the Bank) they are alleged to have had special knowledge or responsibility in relation to the Kirch case. The investigation involving former Management Board members is based on the allegation that the former Management Board members gave incorrect testimony to the Munich Higher Regional Court.
The Supervisory Board and the Management Board of the Bank have obtained opinions from an international law firm and a retired president of one of the leading courts of appeal in Germany to the effect that there is no basis for the accusation of criminal wrongdoing made by the public prosecutors against the two current Management Board members. Deutsche Bank is cooperating with the Munich public prosecutor’s office.
Mortgage-Related and Asset-Backed Securities Matters and Investigation. Deutsche Bank, along with certain affiliates (collectively referred in these paragraphs to as “Deutsche Bank”), have received subpoenas and requests for information from certain regulators and government entities, including members of the Residential Mortgage-Backed Securities Working Group of the U.S. Financial Fraud Enforcement Task Force, concerning its activities regarding the origination, purchase, securitization, sale and/or trading of mortgage loans, residential mortgage-backed securities (RMBS), collateralized debt obligations, other asset-backed securities and credit derivatives. Deutsche Bank is cooperating fully in response to those subpoenas and requests for information.
Deutsche Bank has been named as defendant in numerous civil litigations in various roles as issuer or underwriter in offerings of RMBS and other asset-backed securities. These cases include putative class action suits, actions by individual purchasers of securities, actions by trustees on behalf of RMBS trusts, and actions by insurance companies that guaranteed payments of principal and interest for particular tranches of securities offerings. Although the allegations vary by lawsuit, these cases generally allege that the RMBS offering documents contained material misrepresentations and omissions, including with regard to the underwriting standards pursuant to which the underlying mortgage loans were issued, or assert that various representations or warranties relating to the loans were breached at the time of origination.
Deutsche Bank is a defendant in putative class actions relating to its role, along with other financial institutions, as underwriter of RMBS issued by IndyMac MBS, Inc. and Novastar Mortgage Corporation. These cases are in discovery.
On December 18, 2013, the United States District Court for the Southern District of New York dismissed the claims against Deutsche Bank in the putative class action relating to RMBS issued by Residential Accredit Loans, Inc. and its affiliates.
Deutsche Bank is a defendant in various non-class action lawsuits and arbitrations by alleged purchasers of, and counterparties involved in transactions relating to, RMBS, and their affiliates, including Assured Guaranty Municipal Corporation, Aozora Bank, Ltd., Bayerische Landesbank, Commerzbank AG, the Federal Deposit Insurance Corporation (as conservator for Colonial Bank, Franklin Bank S.S.B., Guaranty Bank, Citizens National Bank and Strategic Capital Bank), the Federal Home Loan Bank of Boston, the Federal Home
Deutsche Bank Consolidated Financial Statements 107Interim Report as of June 30, 2014 Other Financial Information (unaudited)
Other Contingencies

Loan Bank of San Francisco, the Federal Home Loan Bank of Seattle, HSBC Bank USA, National Association (as trustee for certain RMBS trusts), John Hancock, Knights of Columbus, Landesbank Baden-Württemberg, Mass Mutual Life Insurance Company, Phoenix Light SF Limited (as purported assignee of claims of special purpose vehicles created and/or managed by WestLB AG), Royal Park Investments (as purported assignee of claims of a special-purpose vehicle created to acquire certain assets of Fortis Bank), Sealink Funding Ltd. (as purported assignee of claims of special purpose vehicles created and/or managed by Sachsen Landesbank and its subsidiaries), Texas County & District Retirement System, The Charles Schwab Corporation, Triaxx Prime CDO 2006-1 Ltd., Triaxx Prime CDO 2006-1 LLC, Triaxx Prime CDO 2006-2 Ltd., Triaxx Prime CDO 2006-2 LLC, Triaxx Prime CDO 2007-1 Ltd. and Triaxx Prime CDO 2007-1 LLC.
In the actions against Deutsche Bank solely as an underwriter of other issuers’ RMBS offerings, Deutsche Bank has contractual rights to indemnification from the issuers, but those indemnity rights may in whole or in part prove effectively unenforceable where the issuers are now or may in the future be in bankruptcy or otherwise defunct.
Deutsche Bank has entered into agreements with certain entities that have threatened to assert claims against Deutsche Bank in connection with various RMBS offerings and other related products to toll the relevant statutes of limitations. It is possible that these potential claims may have a material impact on Deutsche Bank. In addition, Deutsche Bank has entered into settlement agreements with some of these entities, the financial terms of which are not material to Deutsche Bank.
Deutsche Bank National Trust Company (“DBNTC”) and Deutsche Bank Trust Company Americas (“DBTCA”) have been named as defendants in civil litigation concerning their roles as trustees of certain RMBS trusts. On June 18, 2014, a group of investors filed a civil action against DBNTC and DBTCA in New York State Supreme Court purportedly on behalf of and for the benefit of 544 private-label RMBS trusts asserting claims for alleged violations of the Trust Indenture Act of 1939, breach of contract, breach of fiduciary duty and negligence based on DBNTC and DBTCA’s alleged failure to perform their duties as trustees for the trusts. On June 18, 2014, Royal Park Investments SA/NV filed a purported class action on behalf of investors in 10 RMBS trusts against DBNTC in the U.S. District Court for the Southern District of New York asserting claims for alleged violations of the Trust Indenture Act of 1939, breach of contract and breach of trust based on DBNTC’s alleged failure to perform its duties as trustee for the trusts.
Precious metals. Deutsche Bank has received requests for information from certain regulatory authorities related to precious metal benchmarks. The Bank is cooperating with those requests. Deutsche Bank is also named as a defendant in several putative class action complaints alleging violations of U.S. antitrust law and the U.S. Commodity Exchange Act related to alleged manipulation of gold prices through participation in the Gold Fix.
U.S. Embargoes-Related Matters. Deutsche Bank has received requests for information from certain regulatory and law enforcement agencies concerning its historical processing of U.S. Dollar payment orders through U.S. financial institutions for parties from countries subject to U.S. embargo laws. These agencies are investigating whether such processing complied with U.S. federal and state laws. In 2006, Deutsche Bank voluntarily decided that it would not engage in new U.S. Dollar business with counterparties in Iran, Sudan, North Korea and Cuba and with certain Syrian banks, and to exit existing U.S. Dollar business with such counterparties to the extent legally possible. In 2007, Deutsche Bank decided that it would not engage in any new business, in any currency, with counterparties in Iran, Syria, Sudan and North Korea and to exit existing business, in any currency, with such counterparties to the extent legally possible; it also decided to limit its non-U.S. Dollar business with counterparties in Cuba. Deutsche Bank is providing information to and otherwise cooperating with these agencies in their investigations.
Deutsche Bank Consolidated Financial Statements 108Interim Report as of June 30, 2014 Other Financial Information (unaudited)
Other Contingencies

Mortgage Repurchase Demands From 2005 through 2008, as part of Deutsche Bank’s U.S. residential mortgage loan business, Deutsche Bank sold approximately U.S.$ 84 billion of private label securities and U.S.$ 71 billion of loans through whole loan sales. Deutsche Bank has been presented with demands to repurchase loans from or to indemnify purchasers, investors or financial insurers with respect to losses allegedly caused by material breaches of representations and warranties. Deutsche Bank’s general practice is to process valid repurchase demands that are presented in compliance with contractual rights.
As of June 30, 2014, Deutsche Bank has approximately U.S.$ 4.6 billion of mortgage repurchase demands outstanding and not subject to agreements to rescind (based on original principal balance of the loans). These demands consist primarily of demands made in respect of private label securitizations by the trustees or servicers thereof. Against these outstanding demands, Deutsche Bank recorded provisions of U.S.$ 520 million (€€ 380 million) as of June 30, 2014.
As of June 30, 2014, Deutsche Bank has completed repurchases, obtained agreements to rescind and otherwise settled claims on loans with an original principal balance of approximately U.S.$ 4.9 billion. In connection with those repurchases, agreements and settlements, Deutsche Bank has obtained releases for potential claims on approximately U.S.$ 65.9 billion of loans sold by Deutsche Bank as described above.
Deutsche Bank has entered into agreements with certain entities that have threatened to assert mortgage loan repurchase demands against Deutsche Bank to toll the relevant statutes of limitations. It is possible that these potential demands may have a material impact on Deutsche Bank.
Deutsche Bank anticipates that additional mortgage repurchase demands may be made in respect of mortgage loans that it has sold, but cannot reliably estimate their timing or amount, which can be influenced by, among other things, court decisions on when the statute of limitations on breaches of representations and warranties accrues including in an appeal pending before the New York Court of Appeal with respect to a residential mortgage-backed security issued by Deutsche Bank.
Related Party Transactions
Transactions with related parties are made in the ordinary course of business and on substantially the same terms, including interest rates and collateral, as those prevailing for comparable transactions with other parties.
Transactions with Key Management Personnel Key management personnel are those persons having authority and responsibility for planning, directing and controlling the activities of Deutsche Bank Group, directly or indirectly. The Group considers the members of the Management Board as currently mandated and the Supervisory Board of the parent company to constitute key management personnel for purposes of IAS 24. Among the Group’s transactions with key management personnel as of June 30, 2014, were loans and commitments of €€ 3 million and deposits of €€ 14 million. As of December 31, 2013, there were loans and commitments of €€ 4 million and deposits of €€ 12 million among the Group’s transactions with key management personnel. In addition, the Group provides banking services, such as payment and account services as well as investment advice, to key management personnel and their close family members.
Deutsche Bank Consolidated Financial Statements 109Interim Report as of June 30, 2014 Other Financial Information (unaudited)
Related Party Transactions

Transactions with Subsidiaries, Associates and Joint Ventures Transactions between Deutsche Bank AG and its subsidiaries meet the definition of related party transactions. If these transactions are eliminated on consolidation, they are not disclosed as related party transactions. Transactions between the Group and its associated companies and joint ventures and their respective subsidiaries also qualify as related party transactions.
Loans issued and guarantees granted
Deposits received
Other Transactions Trading assets and positive market values from derivative financial transactions with associated companies amounted to €€ 68 million as of June 30, 2014, and €€ 130 million as of December 31, 2013. Trading liabilities and negative market values from derivative financial transactions with associated companies were nil as of June 30, 2014, and €€ 1 million as of December 31, 2013.
Transactions with Pension Plans The Group has business relationships with a number of its pension plans pursuant to which it provides financial services to these plans, including investment management. Pension funds may hold or trade Deutsche Bank AG shares or securities. As of June 30, 2014, transactions with these plans were not material for the Group.
Deutsche Bank Consolidated Financial Statements 110Interim Report as of June 30, 2014 Other Financial Information (unaudited)
Related Party Transactions
Associated companies and
other related parties in €€ m. Jun 30, 2014 Dec 31, 2013 Loans outstanding, beginning of period 357 918
Loans issued during the period 302 528
Loan repayments during the period 299 676
Changes in the group of consolidated companies 0 (397)1
Exchange rate changes/other (1) (16)
Loans outstanding, end of period2 359 357
Other credit risk related transactions:
Allowance for loan losses 5 6
Provision for loan losses 0 0
Guarantees and commitments 60 54
1 In the second quarter of 2013, some entities were fully consolidated for the first time, which were formerly classified as equity method investments. Therefore loans madeto these investments were eliminated on consolidation. Consequently related provisions and allowances for loan losses reduced at the same time.
2 Loans past due were €€ 2 million as of June 30, 2014 and December 31, 2013, respectively.
Associated companies and
other related parties in €€ m. Jun 30, 2014 Dec 31, 2013 Deposits, beginning of period 167 245
Deposits received during the period 68 105
Deposits repaid during the period 76 179
Changes in the group of consolidated companies (42) (3)
Exchange rate changes/other 0 (2)
Deposits, end of period 117 167

Business Combinations
Xchanging Transaction Bank On September 2, 2013, Deutsche Bank AG announced that it completed the purchase of the remaining 51 % of the shares in its joint venture Xchanging etb GmbH (“Xetb”), which is the holding company of Xchanging Transaction Bank GmbH (“XTB”). The purchase price paid for the step-acquisition consists of a base component of €€ 41 million, subject to certain adjustments. Of that amount, €€ 36 million was paid as cash consideration by the acquirer. The remaining €€ 5 million was paid by XTB to the seller, Xchanging plc., in the course of closing the transaction, which resulted in a reduction of the acquired net assets.
The acquisition accounting was finalized in the second quarter 2014, resulting in a net increase of the pur-chase consideration paid and a corresponding increase of goodwill recognized of €€ 1 million each. Accordingly, the final amount of goodwill originating from the transaction amounted to €€ 38 million, which has been allocated to PBC (€€ 25 million), GTB (€€ 6 million), CB&S (€€ 5 million) and DeAWM (€€ 2 million). The reconciliation of the total purchase consideration and the opening balance sheet as of the acquisition date were as follows:
Fair Value of Assets Acquired and Liabilities Assumed as of the Acquisition Date
Non-Current Assets and Disposal Groups Held for Sale
Within the balance sheet, non-current assets and disposal groups held for sale are reported in Other assets and Other liabilities. This note provides further explanation on the nature and the financial impact of the non-current assets and disposal groups held for sale as of June 30, 2014.
Non-Current Assets and Disposal Groups Held for Sale at the Reporting Date Total assets held for sale amounted to €€ 1.6 billion as of June 30, 2014 (December 31, 2013: €€ 6.7 billion) and the disposal groups included liabilities of €€ 114 million (December 31, 2013: €€ 6.3 billion).
In the second quarter 2014, the Group reached an agreement with Blackstone Real Estate Partners VII (“Blackstone”) to sell Nevada Property 1 LLC, the owner of The Cosmopolitan of Las Vegas (“The Cosmopolitan”), a leading resort and casino held in the Corporate Division NCOU. Under the transaction, Blackstone will acquire 100 % of The Cosmopolitan for approximately €€ 1.3 billion (U.S.$ 1.73 billion), which will be paid in cash. Its classification as a disposal group held for sale did not result in an impairment loss. The transaction, which is subject to regulatory approvals, is expected to close in the fourth quarter 2014.
Deutsche Bank Consolidated Financial Statements 111Interim Report as of June 30, 2014 Other Financial Information (unaudited)
Non-Current Assets and Disposal Groups Held for Sale
in €€ m. Cash consideration transferred 36
Fair value of pre-existing stakes 21
Deduction for settlement of pre-existing relationship (8)
Total purchase consideration, including fair value of the Group’s equity interest held before the business combination 50
Recognized amounts of identifiable assets acquired and liabilities assumed1
Cash and cash equivalents 6
Financial assets available for sale 24
Intangible assets 6
All other assets 31
Provisions 22
All other liabilities 34
Total identifiable net assets 12
Goodwill 38
Total identifiable net assets and goodwill acquired 50
1 By major class of assets acquired and liabilities assumed.

In the first quarter 2014, the Group classified a real estate foreclosure portfolio as held for sale within the Corporate Division NCOU. The portfolio has since been sold. Its classification as held for sale did not result in an impairment loss. The respective portfolio has been measured at fair value less costs to sell on a non-recurring basis, with fair value measurement categorized as level 3 in the fair value hierarchy.
Also in the first quarter 2014, the Group recorded an impairment loss of €€ 9 million on an existing disposal group held for sale of the Corporate Division DeAWM. The charge was recognized in other income.
As of June 30, 2014 and December 31, 2013, unrealized net gains of €€ 3 million and €€ 2 million, respectively, relating to non-current assets and disposal groups classified as held for sale were recognized directly in accumulated other comprehensive income (loss).
Disposals
Events after the Reporting Period
After the reporting date no material events occurred which had a significant impact on the Group’s results of operations, financial position and net assets.
Deutsche Bank Consolidated Financial Statements 112Interim Report as of June 30, 2014 Other Financial Information (unaudited)
Events after the Reporting Period
Division Disposal Financial impact1 Date of the disposal Private & Business Clients Office building previously held as property and equipment. None. Second quarter 2014
Non-Core Operations Unit
Sale of the Group’s subsidiary BHF-BANK AG to Kleinwort Benson Group and RHJ International (“RHJI”), following receipt of outstanding regulatory approvals. The Group received total consideration subject to closing purchase price adjustments of €€ 340 million, comprised of €€ 309 million in cash and €€ 31 million in RHJI shares issued at par value.
None.
First quarter 2014
Non-Core Operations Unit
Sale of office buildings previously held as investment property within other assets.
None.
First quarter 2014
1 Impairment losses and reversals of impairment losses are included in Other income.

Other Information (unaudited)
Non-GAAP Financial Measures
This document and other documents the Group has published or may publish contain non-GAAP financial measures. Non-GAAP financial measures are measures of the Group’s historical or future performance, financial position or cash flows that contain adjustments that exclude or include amounts that are included or excluded, as the case may be, from the most directly comparable measure calculated and presented in accordance with IFRS in the Group’s financial statements.
Fully loaded CRR/CRD 4 Leverage Ratio As part of its balance sheet management, the Group uses a fully loaded CRR/CRD 4 leverage ratio, which is Tier 1 capital on a fully loaded basis as a percentage of the CRR/CRD 4 exposure measure (which is derived by applying adjustments to IFRS total assets). Such non-GAAP financial measure is described in “Management Report: Risk Report: Balance Sheet Management”. This measure is calculated based on the Group’s current interpretation of rules and might therefore vary from the assumptions and estimates applied by the Group’s competitors. Accordingly, the fully loaded CRR/CRD 4 leverage ratio may not be comparable with similarly labeled measures used by the Group’s competitors.
Pre-Tax and Post-Tax Return on Average Active Equity The pre-tax return on average active equity non-GAAP financial measure is based on IBIT attributable to Deutsche Bank shareholders, as a percentage of the Group’s average active equity, both as defined below.
In connection with the implementation of the Group’s communicated strategy, the Group considers the post-tax return on average active equity, both on a Group and a segment basis. The post-tax return on both average shareholders’ equity and average active equity at the Group level reflects the reported effective tax rate for the Group, which was 74 % for the three months ended June 30, 2014, and 58 % for the prior year’s quarter. The tax rate was 48 % for the six months ended June 30, 2014, and 38 % for the prior year’s comparative period. For the post-tax return on average active equity of the segments, the Group effective tax rate was adjusted to exclude the impact of permanent differences not attributable to the segments, so that the segment tax rates ranged from 35 % to 36 % for the current quarter and from 34 % to 36 % for the prior year’s quarter. The tax rate was 34 % for the six months ended June 30, 2014, and 34 % for the six months ended June 30, 2013.
IBIT attributable to Deutsche Bank Shareholders: The IBIT attributable to Deutsche Bank shareholders non-GAAP financial measure is based on income (loss) before income taxes as follows:
Average Active Equity: The Group calculates active equity to make comparisons to its competitors easier and refers to active equity in several ratios. However, active equity is not a measure provided for in IFRS and the Group’s ratios based on average active equity should not be compared to other companies’ ratios without considering differences in the calculations. The Group adjusts the average shareholders’ equity for average
Deutsche Bank Other Information (unaudited) 113Interim Report as of June 30, 2014 Non-GAAP Financial Measures
Pre-Tax and Post-Tax Return on Average Active Equity
Three months ended Six months ended in €€ m. Jun 30, 2014 Jun 30, 2013 Jun 30, 2014 Jun 30, 2013 Income (loss) before income taxes (IBIT) 917 792 2,597 3,206
Less income (loss) before income taxes attributable tononcontrolling interests (1) (1) (21) (10)
IBIT attributable to Deutsche Bank shareholders 916 791 2,576 3,196

dividends, for which a proposal is accrued on a quarterly basis and which are paid after the approval at the Annual General Meeting each year. Effective July 1, 2013, the definition of active equity has been aligned to the CRR/CRD 4 framework so that accumulated other comprehensive income (loss) excluding foreign currency translation, net of taxes, is now part of active equity. Prior periods have been restated.
Pre-tax and post-tax returns on average active equity are presented below. For comparison, also presented are the pre-tax and post-tax returns on average shareholders’ equity, which are defined as IBIT and net income, respectively, attributable to Deutsche Bank shareholders, as a percentage of average shareholders’ equity.
Book Value and Tangible Book Value per Basic Share Outstanding Book value per basic share and tangible book value per basic share are non-GAAP financial measures that are used and relied upon by investors and industry analysts as capital adequacy metrics. Book value per basic share represents the Bank’s total shareholders’ equity divided by the number of basic shares outstanding at period-end. Tangible book value represents the Bank’s total shareholders’ equity less goodwill and other intangible assets. Tangible book value per basic share is computed by dividing tangible book value by period-end basic shares outstanding.
Tangible Book Value
Deutsche Bank Other Information (unaudited) 114Interim Report as of June 30, 2014 Non-GAAP Financial Measures
Book Value and Tangible Book Value per Basic Share Outstanding
Three months ended Six months ended in €€ m. Jun 30, 2014 Jun 30, 2013 Jun 30, 2014 Jun 30, 2013 Average shareholders’ equity 58,125 56,990 56,877 55,803
Average dividend accruals (703) (625) (757) (681)
Average active equity 57,422 56,365 56,120 55,122
Three months ended Six months ended in % Jun 30, 2014 Jun 30, 2013 Jun 30, 2014 Jun 30, 2013 Pre-tax return on average shareholders’ equity 6.3 5.6 9.1 11.5
Pre-tax return on average active equity 6.4 5.6 9.2 11.6
Post-tax return on average shareholders’ equity 1.6 2.3 4.6 7.1
Post-tax return on average active equity 1.6 2.4 4.7 7.2
in €€ m. Jun 30, 2014 Dec 31, 2013 Total shareholders’ equity (Book value) 64,686 54,719
Goodwill and other intangible assets (14,112) (13,932)
Tangible shareholders’ equity (Tangible book value) 50,574 40,787
Basic Shares Outstanding
in million (unless stated otherwise) Jun 30, 2014 Dec 31, 2013 Number of shares issued 1,379.3 1,068.5
Treasury shares (0.3) (0.2)
Vested share awards 8.5 8.8
Basic shares outstanding1 1,387.5 1,077.1
Book value per basic share outstanding in €€ 46.62 50.80
Tangible book value per basic share outstanding in €€ 36.45 37.87
1 The basic shares outstanding have been adjusted for December 31, 2013 in order to reflect the effect of the bonus component of subscription rights issued in June 2014 in connection with the capital increase.

Cost-income ratio (adjusted) and Post-tax return on average active equity (adjusted) In connection with the implementation of the Group’s communicated strategy, Deutsche Bank has announced aspirations, at the Group level and with respect to the CB&S Corporate Division, for its cost-income ratio (adjusted) and its post-tax return on average active equity (adjusted), both of which are non-GAAP financial measures.
Cost-income ratio (adjusted) is calculated by dividing adjusted cost base (described below) by net revenues (reported).
Post-tax return on average active equity (adjusted) is calculated by dividing net income attributable to Deutsche Bank shareholders (adjusted) (described below) by average active equity (described above).
Adjusted cost base is a non-GAAP financial measure most directly comparable to the IFRS financial measure noninterest expenses. Adjusted cost base is calculated by adjusting noninterest expenses under IFRS for (i) the costs-to-achieve (CtA) of the Group’s Operational Excellence (OpEx) program, (ii) litigation expenses, (iii) policyholder benefits and claims, (iv) other severances, (v) impairment of goodwill and other intangible assets and (vi) other divisional-specific cost items.
IBIT attributable to Deutsche Bank shareholders (adjusted) is a non-GAAP financial measure most directly comparable to the IFRS financial measure income before income taxes (IBIT). It is calculated by adjusting IBIT attributable to Deutsche Bank shareholders (which, as described above, is itself a non-GAAP financial measure based on IBIT under IFRS) for (i) CRR/CRD 4 CVA (mark-to-market movements on related hedges), DVA and FVA, (ii) OpEx CtA, (iii) other severances, (iv) litigation expenses and (v) impairment of goodwill and other intangible assets.
Net income attributable to Deutsche Bank shareholders (adjusted) is a non-GAAP financial measure most directly comparable to the IFRS financial measure net income. It is calculated by adjusting IBIT attributable to Deutsche Bank shareholders (adjusted) for the income tax expense (benefit) impact for the period.
The Group believes that the presentation of these measures excluding the impact of these items provides a more meaningful depiction of the underlying fundamentals of its businesses impacted by such items.
Deutsche Bank Other Information (unaudited) 115Interim Report as of June 30, 2014 Non-GAAP Financial Measures
Cost-income ratio (adjusted) and Post-tax return on average active equity (adjusted)

Reconciliation of the movement of reported to adjusted parameters.
N/M – Not meaningful
Deutsche Bank Other Information (unaudited) 116Interim Report as of June 30, 2014 Non-GAAP Financial Measures
Cost-income ratio (adjusted) and Post-tax return on average active equity (adjusted)
Three months ended Six months ended Jun 30, 2014 Jun 30, 2013 Jun 30, 2014 Jun 30, 2013 in €€ m. (unless stated otherwise) CB&S Group CB&S Group CB&S Group CB&S Group Net revenues (reported) 3,532 7,860 3,579 8,215 7,608 16,253 8,126 17,606
CVA/DVA/FVA1 (114) (151) (88) (88) (106) (246) 49 49
Net revenues (adjusted) 3,646 8,011 3,667 8,303 7,714 16,499 8,077 17,557
Noninterest expenses (reported) (2,603) (6,693) (2,794) (6,950) (5,150) (13,159) (5,372) (13,572)
Cost-to-Achieve2 (161) (375) (20) (357) (272) (685) (122) (581)
Other Severance (5) (16) (20) (42) (17) (43) (20) (52)
Policyholder benefits and claims 0 (80) 0 7 0 (132) 0 (185)
Litigation (259) (470) (452) (630) (240) (470) (508) (762)
Impairment of Goodwill & Intangibles 0 0 0 0 0 0 0 0
Other disclosed cost specific items 0 (29) 0 (17) 0 (114) 0 (49)
Adjusted cost base (2,178) (5,723) (2,301) (5,910) (4,621) (11,715) (4,722) (11,944)
Income (loss) before income taxes (reported) 885 917 758 792 2,376 2,597 2,666 3,206
Income (loss) before income taxes attributable to noncontrolling interests3 N/M (1) N/M (1) N/M (21) N/M (10)
IBIT attributable to Deutsche Bank shareholders 885 916 758 791 2,376 2,576 2,666 3,196
CVA/DVA/FVA1 (114) (151) (88) (88) (106) (246) 49 49
Cost-to-Achieve2 (161) (375) (20) (357) (272) (685) (122) (581)
Other Severance (5) (16) (20) (42) (17) (43) (20) (52)
Litigation (259) (470) (452) (630) (240) (470) (508) (762)
Impairment of Goodwill & Intangibles 0 0 0 0 0 0 0 0
IBIT attributable to Deutsche Bank shareholders (adjusted) 1,423 1,928 1,339 1,909 3,012 4,020 3,268 4,542
Cost/income ratio (reported) 85 % 85 % 81 % 77 %
Cost/income ratio (adjusted) 73 % 72 % 72 % 68 %
Average Active Equity (six month ended) 22,715 56,120 19,659 55,122
Average Active Equity (three month ended) 24,045 57,422 20,346 56,365
Post-tax return on average active equity based on net income (reported)4 9 % 2 % 10 % 2 % 14 % 5 % 18 % 7 %
Post-tax return on average active equity based on net income (adjusted)4 15 % 3 % 17 % 6 % 17 % 7 % 22 % 10 %
1 CRR/CRD 4 Credit Valuation Adjustment (CVA), Debt Valuation Adjustment (DVA), Funding Valuation Adjustment (FVA). 2 Includes CtA related to Postbank and OpEx. 3 Within income before income taxes of the Segments, noncontrolling interests are reflected as expenses. 4 Based on net income attributable to Deutsche Bank shareholders.

Deutsche Bank Impressum 117Interim Report as of June 30, 2014

Exhibit 99.2
CAPITALIZATION & INDEBTEDNESS
THE FOLLOWING TABLE SETS FORTH OUR UNAUDITED CONSOLIDATED CAPITALIZATION IN ACCORDANCE WITH IFRS.
Due to rounding, numbers may not add up precisely to the totals provided.
Jun 30, 2014 (in €€ m.)Debt (1), (2):
Long-term debt 140,536 Trust preferred securities 10,118 Long-term debt at fair value through profit or loss 9,639
Total debt 160,293
Shareholders’ equity: Common shares (no par value) 3,531 Additional paid-in capital 33,696 Retained earnings 29,126 Common shares in treasury, at cost (5) Equity classified as obligation to purchase common shares 0 Accumulated other comprehensive income, net of tax
Unrealized net gains (losses) on financial assets available for sale, net of applicable tax and other 798
Unrealized net gains (losses) on derivatives hedging variability of cash flows, net of tax 62
Unrealized net gains (losses) on assets classified as held for sale, net of tax 3 Foreign currency translation, net of tax (2,538) Unrealized net gains from equity method investments 15
Total shareholders’ equity 64,686
Equity component of financial instruments 3,452 Noncontrolling interest 263
Total equity 68,401
Total capitalization 228,694
1 €€ 990 million (0.6%) of our debt was guaranteed as of June 30, 2014. This consists of debt of a subsidiary of Deutsche Postbank AG which is guaranteed by the German government.
2 €€ 33,997 million (21%) of our debt was secured as of June 30, 2014.

Exhibit 99.3
The following table sets forth Deutsche Bank AG’s ratio of earnings to fixed charges for the periods:
Comparatives for 2012 have been adjusted to reflect changes according to IFRS 10, IFRS 11, IAS 19, IAS 27 and IAS 28, which had to be applied retrospectively.
Comparatives for Interest expense and for Interest on deposits have been restated for 2012 and 2011.
For purposes of calculating the ratio of earnings to fixed charges, earnings consist of income (loss) before income tax expense, less net income (loss) from equity method investments plus fixed charges. Fixed charges for these purposes consist of interest expense and a portion of rentals, reflecting one-third of net rental expense, deemed representative of the interest component of the rental expense. These ratios are presented both including and excluding interest on deposits.
Six monthsEnded
Jun 30, 2014 Year EndedDec 31, 2013
Year EndedDec 31, 2012
Year Ended Dec 31, 2011
Year Ended Dec 31, 2010
Year EndedDec 31, 2009
in €€ millions, except ratios Earnings: 1. Income (loss) before income tax expense 2,597 1,456 814 5,390 3,975 5,202 2. Add: Fixed charges excluding capitalized interest
(Line 10) 5,705 11,045 15,901 17,207 13,493 14,762 3. Less: Net income (loss) from equity method
investments 327 369 163 (264) (2,004) 59
4. Earnings including interest on deposits 7,976 12,132 16,552 22,860 19,472 19,905 5. Less: Interest on deposits 2,025 3,360 4,946 5,958 3,800 5,119
6. Earnings excluding interest on deposits 5,951 8,773 11,606 16,902 15,672 14,786
Fixed Charges: 7. Interest Expense 5,567 10,768 15,619 16,921 13,196 14,494 8. Estimated interest component of net rental expense 139 277 283 286 297 268 9. Amortization of debt issuance expense 0 0 0 0 0 0
10. Total fixed charges including interest on deposits and excluding capitalized interest 5,705 11,045 15,901 17,207 13,493 14,762
11. Add: Capitalized interest 0 0 0 0 0 0
12. Total fixed charges 5,705 11,045 15,901 17,207 13,493 14,762 13. Less: Interest on deposits (Line 5) 2,025 3,360 4,946 5,958 3,800 5,119
14. Fixed charges excluding interest on deposits 3,680 7,685 10,954 11,249 9,692 9,641
Consolidated Ratios of Earnings to Fixed Charges: Including interest on deposits (Line 4/Line 12) 1.40 1.10 1.04 1.33 1.44 1.35
Excluding interest on deposits (Line 6/Line 14) 1.62 1.14 1.06 1.50 1.62 1.53

Exhibit 99.4
Articles of Association of Deutsche Bank Aktiengesellschaft
In conformity with the resolution of the Chairman’s Committee of the Supervisory Board on June 5, 2014 and the resolutions of the Annual General Meeting on 22 May 18, 2014
Deutsche Bank

2
§ 1 The stock corporation bears the name
Deutsche Bank Aktiengesellschaft
It is domiciled in Frankfurt am Main.
§ 2
§ 3
§ 4
It is divided into 1,079,431,146379,273,131 no par value shares.
I. General Provisions
(1) The object of the enterprise is the transaction of banking business of every kind, the provision offinancial and other services, and the promotion of international economic relations. The Company mayrealize this object itself or through subsidiaries and affiliated companies.
(2) To the extent permitted by law, the Company is entitled to transact all business and take all steps whichappear likely to promote the object of the Company, in particular to acquire and dispose of real estate,to establish branches at home and abroad, to acquire, administer and dispose of participations in otherenterprises, and to conclude enterprise agreements.
(1) The Company’s notices shall be published in the Federal Gazette [Bundesanzeiger].
(2) Information to the owners of admitted securities may also be communicated by way of remote datatransmission.
II. Share Capital and Shares
(1) The share capital is €€ 2,763,343,733.763,530,939,215.36.
(2) The Company shall not obtain any lien pursuant to its General Business Conditions in respect of theshares it has issued except by special pledging agreements.
(3) The share capital is conditionally increased by up to €€ 230,400,000 through the issue of up to90,000,000 new registered no par value shares. The conditional capital increase can only be carried outin so far as
a) the holders of conversion rights or option rights that are linked with participatory notes or convertiblebonds or bonds with warrants to be issued on or before April 30, 20157, by the Company or its affiliated companies, based on the authorization granted to the Management Board by resolution of the General Meeting on May 31, 2012, make use of the conversion or option rights, or
b) the holders with conversion obligations of convertible participatory notes or convertible bonds to be
issued on or before April 30, 20157, by the Company or its affiliated companies, based on the authorization specified above, fulfil their obligation to convert.
3
The new shares are entitled to a dividend from the beginning of the financial year in which they arecreated by exercise of conversion rights and/or option rights or by the fulfilment of conversionobligations. The Management Board is authorized to determine further details concerning the executionof the conditional capital increase.
The new shares are entitled to a dividend from the beginning of the financial year in which they arecreated by exercise of conversion rights and/or option rights or by the fulfilment of conversionobligations. The Management Board is authorized to determine further details concerning the executionof the conditional capital increase.
(4) The share capital is conditionally increased by up to €€ 230,400256,000,000 through the issue of up to90100,000,000 new registered no par value shares. The conditional capital increase can only be carriedout in so farinsofar as
a) the holders of conversion rights or option rights that are linked with participatory notes or convertiblebonds or bonds with warrants to be issued on or before April 30, 20162019, by the Company or its affiliated companies, based on the authorization granted to the Management Board by resolution ofthe General Meeting on May 26, 201122, 2014, make use of their conversion or option rights, or
b) the holders with conversion obligations of convertible participatory notes or convertible bonds to be
issued on or before April 30, 20162019, by the Company or its affiliated companies, based on theauthorization specified above, fulfil their obligation to convert.
(5) The Management Board is authorized to increase the share capital on or before April 30, 2019, once ormore than once, by up to a total of €€ 256,000,000 through the issue of new shares against cashpayment. Shareholders are to be granted pre-emptive rights. However, the Management Board isauthorized to except broken amounts from shareholders’ pre-emptive rights and to exclude pre-emptiverights insofar as is necessary to grant to the holders of option rights, convertible

4
bonds and convertible participatory rights issued by the company and its affiliated companies pre-emptive rights to new shares to the extent that they would be entitled to such rights after exercising theiroption or conversion rights. The Management Board is also authorized to exclude the pre-emptive rights in full if the issue price of the new shares is not significantly lower than the quoted price of the sharesalready listed at the time of the final determination of the issue price and the total shares issued sincethe authorization in accordance with § 186 (3) sentence 4 Stock Corporation Act do not exceed 10% ofthe share capital at the time the authorization becomes effective – or if the value is lower – at the time the authorization is utilized. Management Board resolutions to utilize authorized capital and to exclude pre-emptive rights require the Supervisory Board’s approval. The new shares may also be taken up bybanks specified by the Management Board with the obligation to offer them to shareholders (indirectpre-emptive right). (5)(in abeyance)
Shareholders are to be granted pre-emptive rights. However, the Management Board is authorized to exceptbroken amounts from shareholders’ pre-emptive rights and to exclude pre-emptive rights in so far as is necessary to grant to the holders of option rights, convertible bonds and convertible participatory rightsissued by the company and its affiliated companies pre-emptive rights to new shares to the extent that they would be entitled to such rights after exercising
(6) The Management Board is authorized to increase the share capital on or before April 30, 2018, once ormore than once, by up to a total of €€ 76,975,344.64 579,863.04 through the issue of new shares against cash payments or contributions in kind. Shareholders are to be granted pre-emptive rights. However,the Management Board is authorized to except broken amounts from shareholders’ pre-emptive rights and to exclude pre-emptive rights insofar as is necessary to grant to the holders of option rights,convertible bonds and convertible participatory rights issued by the company and its affiliatedcompanies pre-emptive rights to new shares to the extent that they would be entitled to such rights afterexercising their option or conversion rights. The Management Board is also authorized to exclude thepre-emptive rights if the capital increase against contributions in kind is carried out in order to acquirecompanies, shareholdings in companies or other assets. Finally, the Management Board is alsoauthorized to exclude the pre-emptive rights in full if the issue price of the new shares is not significantlylower than the quoted price of the shares already listed at the time of the final determination of the issueprice and the total shares issued since the authorization in accordance with § 186 (3) sentence 4 of theStock Corporation Act [Aktiengesetz] do not exceed 10% of the share capital at the time theauthorization becomes effective or – if the value is lower – at the time the authorization is utilized. Management Board resolutions to utilize authorized capital and to exclude pre-emptive rights requirethe Supervisory Board’s approval. The new shares may also be taken up by banks specified by theManagement Board with the obligation to offer them to shareholders (indirect pre-emptive right).
(7) The Management Board is authorized to increase the share capital on or before April 30, 2016, once ormore than once, by up to a total of €€ 691,200,000 through the issue of new shares against cashpayment. (7)(in abeyance)

5
their option or conversion rights. Management Board resolutions to utilize authorized capital and toexclude pre-emptive rights require the Supervisory Board’s approval. The new shares may also be taken up by certain banks specified by the Management Board with the obligation to offer them to theshareholders (indirect pre-emptive right).
The new shares are entitled to a dividend from the beginning of the financial year in which they arecreated by exercise of conversion rights and/or option rights or by the fulfilment of conversionobligations. The Management Board is authorized to determine further details concerning the executionof the conditional capital increase.
§ 5
(8) The share capital is conditionally increased by up to €€ 230,400,000 through the issue of up to90,000,000 new registered no par value shares. The conditional capital increase can only be carried outin so far as
c) the holders of conversion rights or option rights that are linked with participatory notes or convertiblebonds or bonds with warrants to be issued on or before April 30, 2017, by the Company or itsaffiliated companies, based on the authorization granted to the Management Board by resolution ofthe General Meeting on May 31, 2012, make use of their conversion or option rights, or
d) the holders with conversion obligations of convertible participatory notes or convertible bonds to be
issued on or before April 30, 2017, by the Company or its affiliated companies, based on theauthorization specified above, fulfil their obligation to convert.
(1) The shares are registered shares. Shareholders must notify to the Company for registration in the shareregister, in particular where natural persons are concerned, their name, their address as well as theirdate of birth and, where legal persons are concerned, their style, their business address and theirdomicile, and in all cases the number of shares they hold. Electronic mail addresses and anysubsequent changes thereto should be added to facilitate communication.
(2) If, in the event of a capital increase, the resolution on the increase does not specify whether the newshares are to be made out to bearer or registered in a name, they shall be registered in a name.
(3) The form that shares and dividend and renewal coupons are to take shall be determined by theManagement Board in agreement with the Supervisory Board. The same shall apply to bonds andinterest coupons. Global certificates may be issued. The claim of shareholders to have their shares andany dividend and renewal coupons issued in individual certificate form is excluded unless such issue isrequired by the rules in force at a stock exchange where the shares are listed.

6
§ 6
§ 7
§ 8 For the purpose of closer contact and business consultation with trade and industry, the Management Boardmay form regional Advisory Boards and Regional Advisory Councils, lay down rules of procedure for theirbusiness and establish the remuneration of their members. The Supervisory Board shall be informed once ayear of any changes in the membership of the Advisory Boards and the Regional Advisory Councils.
§ 9
III. The Management Board
(1) The Management Board shall consist of not less than three members.
(2) The Supervisory Board shall appoint the members of the Management Board and determine theirnumber. The Supervisory Board may appoint deputy members of the Management Board.
(1) The Company shall be legally represented by two members of the Management Board or by onemember jointly with a holder of procuration [Prokurist].
(2) The deputy members of the Management Board shall rank equally with full members in respect ofpowers of representation.
IV. The Supervisory Board
(1) The Supervisory Board shall consist of 20 members. They are elected for the period until conclusion ofthe General Meeting which adopts the resolutions concerning the ratification of acts of management forthe fourth financial year following the beginning of the term of office. Here, the financial year in whichthe term of office begins is not taken into account. For the election of shareholder representatives, theGeneral Meeting may establish that the terms of office of up to five members may begin or end ondiffering dates.
(2) In the election of shareholders’ representatives to the Supervisory Board and of any substitutemembers, the Chairman of the General Meeting shall be entitled to take a vote on a list of electionproposals submitted by management or shareholders. If substitute members are elected on a list, theyshall replace shareholders’ representatives prematurely leaving the Supervisory Board in the order inwhich they were named, unless resolved otherwise at the vote.
(3) If a Supervisory Board member is elected to replace an outgoing member, the new member’s term ofoffice shall run for the remainder of the outgoing member’s term. In the event that a substitute member takes the place of an outgoing member, the substitute member’s term of office shall expire – if a new vote to replace the outgoing member is taken at the first or second General Meeting after the vacancyarises – at the end of the said General Meeting, otherwise at the end of the outgoing member’s residual term of office.
(4) Any member of the Supervisory Board may resign from office without being required to show causesubject to his giving one month’s notice by written declaration addressed to the Management Board.

7
§ 10
§ 11
(1) Immediately following a General Meeting in which all members of the Supervisory Board to be electedby a General Meeting have been newly elected, a meeting of the Supervisory Board shall take place,for which no special invitation is required. At this meeting, the Supervisory Board under thechairmanship of its oldest member in terms of age shall elect from among its members and for theduration of its term of office the Chairman of the Supervisory Board and his Deputy in accordance with§ 27 of the German Co-determination Act [Mitbestimmungsgesetz]. In the event of the Chairman of theSupervisory Board or his Deputy leaving before completion of his term of office, the Supervisory Boardshall elect a substitute without delay.
(2) The Deputy of the Chairman of the Supervisory Board has the legal and statutory rights and duties ofthe Chairman only if the latter is unable to exercise them. This is without prejudice to § 29 (2) sentence3 and § 31 (4) sentence 3 of the German Co-determination Act.
(1) Meetings of the Supervisory Board are convened by the Chairman or, if the latter is unable to do so, byhis Deputy, whenever required by law or for business reasons.
(2) The Supervisory Board shall be deemed to constitute a quorum if the members have been invited inwriting or by cable at their last given address and not less than half the total members which it isrequired to comprise take part in the voting in person or by written vote. The chair shall be taken by theChairman of the Supervisory Board or his Deputy. The Chairman of the meeting shall decide themanner of voting.
(3) Resolutions may also be taken without a meeting being called, by way of written, cabled, telephoned orelectronic votes, if so ruled by the Chairman of the Supervisory Board or his Deputy. This also appliesto second polls pursuant to § 29 (2) sentence 1 and § 31 (4) sentence 1 of the German Co-determination Act.
(4) Resolutions of the Supervisory Board are taken with the simple majority of the votes unless otherwiseprovided by law. If there is equality of votes, the Chairman shall have the casting vote pursuant to§ 29 (2) and § 31 (4) of the German Co-determination Act; a second poll within the meaning of theseprovisions can be requested by any member of the Supervisory Board.
(5) If not all the members of the Supervisory Board are present to vote on a resolution and if absentmembers have not submitted written votes, the voting shall be postponed at the request of at least twomembers of the Supervisory Board who are present. In the event of such postponement, the new voteshall be taken at the next regular Supervisory Board meeting if no extraordinary meeting is called. Atthe new vote, a further minority call for postponement is not permitted.
(6) If the Chairman of the Supervisory Board is present at the meeting, or if a member of the SupervisoryBoard in attendance is in possession of his written vote, sub-paragraph 5 shall not apply if the same number of shareholders’ representatives and employees’ representatives are personally present or participate in the voting on the resolution by written vote, or if any inequality is balanced out byindividual members of the Supervisory Board not participating in the voting.

8 § 12
§ 13
The Supervisory Board must be informed without delay of any acquisition or disposal of suchparticipations involving more than 1% of the Company’s liable capital and reserves.
§ 14
(1) The Supervisory Board may appoint a Presiding Committee and one or several other Committees fromamong its members; this is without prejudice to § 27 (3) of the German Co-determination Act. The functions and powers of the Committees and the relevant procedures to be adopted shall bedetermined by the Supervisory Board. To the extent permitted by law, decisive powers of theSupervisory Board may also be delegated to the Committees. For Committee resolutions, unlessotherwise determined by mandatory legal regulations, § 11 (3) and (4) apply with the proviso that thecasting vote of the Supervisory Board Chairman is replaced by that of the Committee Chairman;§ 11 (5) and (6) do not apply.
(2) Declarations of intention on the part of the Supervisory Board and its Committees shall be made in thename of the Supervisory Board by the Chairman or his Deputy.
(1) The approval of the Supervisory Board is required for
a) the granting of general powers of attorney;
b) the acquisition and disposal of real estate in so far as the object involves more than 1% of the
Company’s liable capital and reserves pursuant to the German Banking Act [Gesetz über dasKreditwesen];
c) the granting of credits, including the acquisition of participations in other companies, for whichapproval of a credit institution’s supervisory body is required under the German Banking Act;
d) the acquisition and disposal of other participations, in so far as the object involves more than 2% ofthe Company’s liable capital and reserves pursuant to the German Banking Act.
(2) The approvals under sub-paragraphs 1 b) and d) are also required if the transaction concerned iscarried out in a dependent company.
(3) The Supervisory Board may specify further transactions which require its approval.
(1) The members of the Supervisory Board receive a fixed annual compensation (“Supervisory Board Compensation”). The annual base compensation amounts to €€ 100,000, for each Supervisory Board member, the Supervisory BoardChairman receives twice that amount and the Deputy Chairperson one and a half times that amount.
(2) Members and chairs of the Committees of the Supervisory Board are paid additional fixed annual compensation asfollows:

9
c.) For work on any other committee: Chair: €€ 100,000, members: €€ 50,000. c.
a.a.) For Integrity Committee, Audit Committee and Risk Committee work: Chair: €€ 200,000, members: €€ 100,000.
b.b.) For Nomination Committee andFor Mediation Committee work: no additional compensation.
(3) 75% of the compensation determined according to paragraphs 1 to 2 is disbursed to each SupervisoryBoard member after submitting invoices in February of the following year. The other 25% is converted bythe company at the same time into company shares based on the average closing price on the FrankfurtStock Exchange (Xetra or successor system) during the last ten trading days of the preceding January,calculated to three digits after the decimal point. The share value of this number of shares is paid to therespective Supervisory Board member in February of the year following his departure from theSupervisory Board, or the expiration of his term of office, based on the average closing price on theFrankfurt Stock Exchange (Xetra or successor system) during the last ten trading days of the precedingJanuary, provided that the member is not leaving the Supervisory Board due to important cause whichwould have justified dismissal.
(4) In case of a change in the Supervisory Board membership during the year, the compensation for thefinancial year will be paid on a pro rata basis, rounded up/down to full months. For the year of departure,the entire compensation is paid in cash; the forfeiture regulation in paragraph 3 sentence 3 applies to 25%of the compensation for that financial year.
(5) The company reimburses the Supervisory Board members for the cash expenses they incur in theperformance of their office, including any turnover tax (VAT) on their compensation and reimbursementsof expenses. Furthermore, any employer contributions to social security schemes that may be applicableunder foreign law to the performance of their Supervisory Board work shall be paid for each SupervisoryBoard member affected. Finally, the Supervisory Board Chairman will be reimbursed appropriately fortravel expenses incurred in performing representative tasks due to his function and reimbursed for costsfor the security measures required based on his function.
(6) In the interest of the company, the members of the Supervisory Board will be included in an appropriateamount, with a deductible, in any financial liability insurance policy held by the company. The premiumsfor this are paid by the company.
(7) The above provisions are applicable for the first time for the financial year beginning on January 1, 2013(compensation year), and replace the previous provisions in the Articles of Association with effect fromthis date.

10
§ 15 The General Meeting called to adopt the resolutions concerning the ratification of acts of management of theManagement Board and the Supervisory Board, the appropriation of profits, the appointment of the annualauditor and, as the case may be, the establishment of the annual financial statements (Ordinary GeneralMeeting) shall be held within the first eight months of each financial year.
§ 16
§ 17
§ 18
V. General Meeting
(1) The General Meeting shall be called by the Management Board or the Supervisory Board to take placein Frankfurt am Main, Düsseldorf, or any other German city with over 500,000 inhabitants.
(2) The General Meeting must be convened, in so far as no shorter period is admissible by law, at leastthirty days before the end of the day on which shareholders must register to take part; the day ofconvention and the last day of the period of notice (§ 17 (2) of the Articles of Association) are notcounted here.
(1) Shareholders who are entered in the share register and who register in time for the meeting are entitledto take part in the General Meeting and to exercise their voting rights.
(2) The registration must be received by the Company at the address specified in the notice of conventionin written or electronic form at least 5 days before the meeting. The day of receipt is not to be counted inthis.
(3) Details regarding registration and the issue of admission cards must be given in the invitation.
(4) The Management Board is authorized to make arrangements for shareholders to take part in theGeneral Meeting without being present in person and without naming an authorized representative, andto exercise all or some of their rights fully or partially, using electronic communication. In this context,the Management Board is also authorized to establish regulations on the scope and procedures for theparticipation and exercising of rights in accordance with sentence 1. Any use of these procedures andthe regulations established for them are to be announced when convening the General Meeting.
(5) The Management Board is authorized to arrange for shareholders to submit their votes in writing orusing electronic communication (absentee voting) without attending the General Meeting. TheManagement Board is also authorized to establish regulations on the procedure in accordance withsentence 1. Any use of these procedures and the regulations established for them are to be announcedwhen convening the General Meeting.
(1) Each no par value share carries one voting right.
(2) In the event of shares not having been fully paid up, the voting right shall commence, in accordancewith § 134 (2) sentences 3 and 5 of the Stock Corporation Act, when the minimum contribution requiredby law has been paid.

11
§ 19
§ 20
(3) The voting right can be exercised by an authorized representative (proxy). The issue of the power ofattorney, its cancellation and proof of the proxy authorization vis-à-vis the Company are required in textform. This is without prejudice to § 135 of the Stock Corporation Act. In the convocation of the GeneralMeeting, a simplification may be specified.
(1) The Chairman of the Supervisory Board chairs the General Meeting. If he is unable to do so, theGeneral Meeting is chaired by a Supervisory Board member elected by the majority of the shareholderrepresentatives on the Supervisory Board. In the event that none of these persons takes the chair, theChairman of the meeting shall be elected by the General Meeting under the direction of the oldestshareholder present.
(2) The Chairman directs the proceedings and determines the sequence of speakers and the sequence inwhich the items on the agenda are dealt with. In the course of the General Meeting he may determineappropriate restrictions on the speaking time, the time for putting questions and/or the total timeavailable in general for speaking and putting questions or for individual speakers. The ManagementBoard is authorized to determine whether and to what extent the General Meeting or parts of theGeneral Meeting shall be transmitted via electronic media. The transmission may also take place in aform to which the public has unlimited access.
(1) The resolutions of the General Meeting are taken by a simple majority of votes and, in so far as amajority of capital stock is required, by a simple majority of capital stock, except where law or theArticles of Association determine otherwise.
(2) The Chairman shall determine the form and further particulars of the voting. The voting result shall beobtained by ascertaining the “yes” and the “no” votes. The Chairman shall also determine the manner inwhich the votes are to be ascertained, for instance by deducting the “yes” or “no” votes and the abstentions from the overall number of votes to which the voters are entitled.
(3) The Supervisory Board shall be authorized to amend the Articles of Association in so far as suchamendments merely relate to the wording.

12
§ 21 The financial year of the Company is the calendar year.
§ 22
§ 23
§ 24 The Company was formed by the re-amalgamation of Norddeutsche Bank AG, Deutsche Bank AG West andSüddeutsche Bank AG, which had been disincorporated from Deutsche Bank in 1952 according to the Law onthe Regional Scope of Credit Institutions [Gesetz über den Niederlassungsbereich von Kreditinstituten].
VI. Annual Statement of Accounts and Appropriation of Profits
(1) The Management Board shall, within the first three months of each financial year, prepare the annualfinancial statements (balance sheet, profit and loss account, notes) and the management report for thepreceding financial year, and submit them to the auditor.
(2) The Supervisory Board shall submit its report to the Management Board within one month from the dateof receipt of the statements which must be presented to it. If the report is not submitted within thisperiod, the Management Board shall promptly specify an additional period of not more than one monthfor the Supervisory Board to submit its report. If the report is not made available to the ManagementBoard prior to the expiration of such additional period of time, the annual financial statements shall bedeemed not to have been approved by the Supervisory Board.
(1) The distributable profit shall be distributed among the shareholders unless the General Meetingdetermines otherwise. The General Meeting may resolve a non-cash distribution instead of or in addition to a cash dividend.
(2) In so far as the Company has issued participatory certificates and the respective conditions ofparticipatory certificates grant the holders of the participatory certificates a claim to distribution from thedistributable profit, the claim of the shareholders to this portion of the distributable profit is excluded(§ 58 (4) of the Stock Corporation Act).
(3) The dividends due to the shareholders are always distributed in proportion to the contribution made ontheir share in share capital and in proportion to the time which has elapsed since the date fixed forcontribution.
(4) In the event of new shares being issued, a different dividend entitlement may be established for suchshares.
VII. Formation of Deutsche Bank AG

13
§ 25
VIII. Contribution and Acquisition Provisions contained in the Disincorporation Agreement ofSeptember 27, 1952
(1) Pursuant to § 3 of the Big Bank Law [Großbankengesetz], Deutsche Bank contributes to the successorinstitution, Süddeutsche Bank Aktiengesellschaft, its entire business previously transacted byBayerische Creditbank, Südwestbank in Stuttgart and Mannheim, Oberrheinische Bank,Württembergische Vereinsbank, Hessische Bank and Rheinische Kreditbank in the Federal States[Länder] of Bayern, Baden/Württemberg (now Südweststaat), Rheinland-Pfalz and Hessen. Thecontribution includes all assets and all liabilities acquired or created in the course of this business.
(2) The assets include in particular:
a) all real estate and similar rights located in the Federal States of Bayern, Baden/Württemberg (nowSüdweststaat), Hessen and Rheinland-Pfalz,
b) all mortgage rights (including pre-registrations) held for own account on real estate in the Federal States of Bayern, Baden/Württemberg (now Südweststaat), Hessen and Rheinland-Pfalz,
c) all claims and the related securities as well as all other rights and assets recorded in the previousinstitutions’ books per December 31, 1951,
d) all rights arising from trusteeships, particularly from such as relate to bond issues where the
borrower was domiciled, per December 31, 1951, in the Federal States of Bayern,Baden/Württemberg (now Südweststaat), Hessen or Rheinland-Pfalz,
e) Deutsche Bank’s equalization claims, allocated in accordance with § 8 of the 2nd Conversion Law Implementing Order [Durchführungsverordnung zum Umstellungsgesetz], arising out of thecontribution balance sheet per December 31, 1951. Should these equalization claims besubsequently increased or reduced pursuant to a correction of the conversion account, thisamendment will be credited or debited to the successor institution in so far as this institution hasacquired the respective asset or liability in the conversion account.
(3) The liabilities include in particular: a) all commitments recorded in the previous institutions’ books per December 31, 1951, b) all commitments resulting from the trusteeships mentioned under (2) d),
c) all foreign commitments resulting from § 6 (2) of the 35th Conversion Law Implementing Order,subject to the provision of § 7 (2) of the Big Bank Law,
d) all pension liabilities towards entitled persons resident per December 31, 1951 in the Federal Statesof Bayern, Baden/Württemberg (now Südweststaat), Hessen or Rheinland-Pfalz, subject to the provision that all expenses under this heading are to be shared between Süddeutsche BankAktiengesellschaft and its sister institutions, Norddeutsche Bank Aktiengesellschaft and Rheinisch-Westfälische Bank Aktiengesellschaft, according to the formula used so far, i.e. on the basis of staffexpenditure in the respective year. This does not include retirements from the previous institutionsafter December 31, 1951, which must be borne by the institution concerned. Should theaforementioned pension liabilities be otherwise regulated following a change in the law in theFederal territory or in West Berlin or in the rest of Germany, the above regulation will cease to apply,with retroactive effect.

14
balance sheet per December 31, 1951,
appended to this document. The assets and liabilities shown in this balance sheet have been valuedprovisionally. The definitive contribution will be effected at the values established with legal validity inthe balance sheet for tax purposes drawn up for Deutsche Bank’s business in the Federal territory per December 31, 1951. If, as a result of the values established – whether by an increase in assets or a decrease in liabilities – the value of the assets should rise, then the incremental value – less a reasonable deduction on the assets side for depreciation in the interim period – must be added to the successor institution’s legal reserve.
DM 56,195,000.
Deutsche Bank guarantees that this value exists. As a set-off against this contribution, Süddeutsche Bank Aktiengesellschaft awards Deutsche Bank shares in the nominal amount of DM 39,996,000.Pursuant to § 8 and § 9 of the Big Bank Law, these shares will be transferred to the Bank deutscherLänder as trustee for the shareholders of Deutsche Bank.
(4) The contribution of assets and the acquisition of liabilities take place as at and with effect fromJanuary 1, 1952, subject to the provision that the contributed business of the previous institutions shallbe deemed to have been transacted from the said date for the account of the new successor institution.The basis for the contributed assets and acquired liabilities is the
(5) According to the balance sheet per December 31, 1951, the value of contributed assets less acquiredliabilities amounts to a total of