FORM 51-102F1 MANAGEMENT DISCUSSION AND ANALYSIS FOR...
17
Management’s Discussion and Analysis April 30, 2016 IDM Mining Ltd. – Final 1 FORM 51-102F1 MANAGEMENT DISCUSSION AND ANALYSIS FOR THE THREE MONTHS ENDED JANUARY 31, 2016 INTRODUCTION This Management’s discussion and analysis (“MD&A”) reviews the significant activities of IDM Mining Ltd. (“IDM” or the “Company”) and its subsidiaries and compares the financial results for the three and six month period ended April 30, 2016 (the “second quarter 2016”) and the comparable period in 2015 (the “second quarter 2015”). This MD&A should be read in conjunction with the unaudited condensed consolidated financial statements for the second quarter 2016 and the audited consolidated financial statements and accompanying notes for the years ended October 31, 2015 and 2014, and MD&A’s for all relevant periods, which are available on the SEDAR website at www.sedar.com . All financial information in this document is prepared in accordance with International Financial Reporting Standards (“IFRS”) and presented in Canadian dollars unless otherwise indicated. The effective date of this MD&A is June 29, 2016. Some of the statements in this MD&A are forward-looking statements that are subject to risk factors set out in the cautionary note contained herein. Additional information related to the Company is available for view on SEDAR at www.sedar.com and on the Company’s website at www.idmmining.com .
Transcript of FORM 51-102F1 MANAGEMENT DISCUSSION AND ANALYSIS FOR...

Management’s Discussion and Analysis April 30, 2016
IDM Mining Ltd. – Final 1
FORM 51-102F1
MANAGEMENT DISCUSSION AND ANALYSIS
FOR THE THREE MONTHS ENDED JANUARY 31, 2016
INTRODUCTION
This Management’s discussion and analysis (“MD&A”) reviews the significant activities of IDM Mining Ltd.
(“IDM” or the “Company”) and its subsidiaries and compares the financial results for the three and six month
period ended April 30, 2016 (the “second quarter 2016”) and the comparable period in 2015 (the “second
quarter 2015”). This MD&A should be read in conjunction with the unaudited condensed consolidated financial
statements for the second quarter 2016 and the audited consolidated financial statements and accompanying notes
for the years ended October 31, 2015 and 2014, and MD&A’s for all relevant periods, which are available on the
SEDAR website at www.sedar.com.
All financial information in this document is prepared in accordance with International Financial Reporting
Standards (“IFRS”) and presented in Canadian dollars unless otherwise indicated.
The effective date of this MD&A is June 29, 2016.
Some of the statements in this MD&A are forward-looking statements that are subject to risk factors set out in
the cautionary note contained herein.
Additional information related to the Company is available for view on SEDAR at www.sedar.com and on the
Company’s website at www.idmmining.com.
Management’s Discussion and Analysis April 30, 2016
IDM Mining Ltd. – Final 2
DESCRIPTION OF BUSINESS
IDM is based in Vancouver and was incorporated on July 14, 2009 pursuant to the Business Corporations Act
(British Columbia) and commenced business at that time. The Company’s shares were voluntary delisted from
the Toronto Stock Exchange (the “TSX”) after close of trading on December 29, 2015 and were listed on TSX
Venture Exchange (the “TSXV”) on open of trading on December 30, 2015 under the symbol “IDM”. On June
6, 2014, the Company changed its name from “Revolution Resources Corp.” to “IDM Mining Ltd.” and
consolidated its issued and outstanding shares on the basis of 6 pre-consolidated shares for one post-consolidated
share. All share and per share amounts in this MD&A have been adjusted to reflect the share consolidation.
The Company is an exploration stage company in the business of acquiring, exploring and developing natural
resource properties in British Columbia and Yukon. The Company’s primary focus is on the the high-grade Red
Mountain gold project (the “Project”) located near Stewart, B.C, which recently entered the BC and Canadian
environmental assessment process.
HIGHLIGHTS AND SIGNIFICANT EVENTS
The following is a summary of highlights and significant events that occurred during the six month period ending
April 30, 2016 and up to the date of this MD&A:
In December 2015, the Company completed a private placement with Oban Mining Corporation
(“Oban”) for gross proceeds of $1.0 million consisting of 11,111,111 common shares at a price of $0.09
and makes the second and final pre-production option payment of $1.0 million to Seabridge Gold.
In December 2015, the Company completed a non-brokered private placement for gross proceeds of
$1,581,488 consisting of 9,989,800 flow-through units at $0.11 per flow –through unit and 5,362,333
common units at $0.09 per common unit. Each common and flow-through unit consisted of one
common share and one-half warrant, with each whole warrant exercisable for a period of 24 months at
$0.14 per share. Finder’s fees payable in connection with the financing consisted of $48,485 and
552,939 finder’s warrants.
In January 2016, Mr Gernot Wober, Oban’s nominee, was appointed a director.
In February 2016, the Company closed the remainder of the transaction with Oban and acquired Oban’s
portfolio of properties located in Yukon. As consideration, the Company issued 7,188,889 common
shares and granted a 1% net smelter royalty over the Yukon properties and certain other rights. The
Yukon properties consist of approximately 14,500 claims covering 11 project areas consisting of 52
claim groups totaling over 300,000 hectares.
In February 2016, the Company received its Section 11 Order for the Red Mountain Project from the
British Columbia Environmental Assessment Office (the “BC EAO”`), setting out the scope,
requirements, processes, and methods of the provincial environmental assessment (“EA”), as well as
the public and Aboriginal consultation procedures.
In March 2016, the Company completed an evaluation of potential alternative locations for the mill and
tailing management facilities for the Project. The Company has selected a preferred location at Bromley
Humps due to its lower elevation, water management perspective, no requirement for divergence of any
waterways, reduced potential geohazards and the option to mill year–round would be available.
Additionally this alternative location has sufficient area for the mill, stockpile and expansion potential
for the tailings management facility beyond current requirements. The Company expects to have an
updated Preliminary Economic Assessment finalized early in the third quarter of calendar year 2016.
In April 2016, the Company updated it’s NI 43-101 compliant Resource Estimate for the Red Mountain
Project, which included the results of the additional drilling completed by the Company in 2014 and a
revised geologic interpretation which resulted in extensions of multiple previously defined zones as well
Management’s Discussion and Analysis April 30, 2016
IDM Mining Ltd. – Final 3
as the inclusion of mineral resources in two new zones. This estimate yielded a 16% increase in
contained Measure & Indicated (“M&I”) gold ounces and 31% increase in contained Inferred gold
ounces. The Project has a resource of 1,641,800 tonnes in the M&I category averaging 8.36 grams per
tonne (‘g/t’) gold and 26 g/t silver for 441,500 ounces of gold and 1,379,800 ounces silver with an
additional 548,100 tonnes in the Inferred category, averaging 6.1 g/t gold and 9.0 g/t silver, for 107,500
ounces of gold and 153,700 ounces silver.
In April 2016, the Company completed a brokered and non-brokered private placement for gross
proceeds of $10,848,898 consisting of 37,269,208 flow-through units at $0.11 per flow–through unit
and 74,992,059 common units at $0.09 per common unit. Each common and flow-through unit
consisted of one common share and one-half warrant, with each whole warrant exercisable for a period
of 24 months at $0.15 per share. Finder’s fees payable in connection with the financing consisted of
$611,625 and 6,372,730 finder’s warrants.
In June 2016, the Company strengthens its engineering and marketing team with the appointment of
Wayne Corso, P.E. as Project Manager – Engineering for the Project and the engagement of Vertex
Strategies Inc. for marketing and investor relations services.
Additional information, including the full news release, can be found on www.sedar.com and the Company’s
website www.idmmining.com
RESERVES AND RESOURCES
National Instrument 43-101 (“43-101”) of the Canadian Securities Administrators – Standards of Disclosure for
Mineral Projects – requires that each category of mineral reserves and mineral resources be reported separately.
Readers should refer to IDM’s continuous disclosure documents available at www.sedar.com for this detailed
information, which is subject to the qualifications and notes therein set forth.
PROPERTIES
Red Mountain, British Columbia
IDM has an option to earn a 100% interest in the 17,125 hectare Red Mountain Project. It is located in
northwestern B.C., 15 kilometers (“km”) northeast of the town of Stewart. Discovered in 1989, the property was
explored extensively until 1996 by Lac Minerals Ltd. and Royal Oak Mines Inc., with 466 diamond drill holes
and over 2,000 meters (“m”) of underground development completed, along with extensive engineering and
environmental baseline work. Additional studies were completed by Seabridge Gold Inc., North American
Metals Corp. and Banks Island Gold Ltd.
In April 2014, IDM entered into an option agreement with Seabridge Gold Inc (“Seabridge”) granting IDM the
right to acquire a 100% interest in the Red Mountain Project, subject to certain underlying royalties and gold
streams. To acquire 100%, IDM issued 4,955,000 shares, paid $2.0 million and must incur $7.5 million in
exploration and development expenditures over 3 years ($2.5 million per year commencing June 2014 - $5.1
million incurred to date).
IDM has the right to extend the deadline of the final $2.5 million of exploration and development expenditures
by one year upon payment of $250,000 to Seabridge. Upon the commencement of commercial production, the
Company will make an additional one-time payment of $1.5 million to Seabridge. Seabridge will also retain a
gold metal stream on the Red Mountain Project, allowing Seabridge to acquire 10% of the annual gold
production from the property at a cost of $1,000 per ounce up to a maximum of 500,000 ounces produced
(50,000 to Seabridge). Alternatively, Seabridge may elect to receive a one-time cash payment of $4.0 million at
the commencement of production in exchange for the buy-back of the gold metal stream.
An Independent Technical Report was prepared by JDS Energy & Mining Incorporated and TS Technical
Services Ltd., following the guidelines of the Canadian Securities Administrators National Instrument 43-101
and Form 43-101F1 report, titled “Preliminary Economic Assessment Technical Report, Red Mountain Gold
Project, Northwestern, BC, Canada” (“PEA”). The report was filed on SEDAR on September 3, 2014 and can

Management’s Discussion and Analysis April 30, 2016
IDM Mining Ltd. – Final 4
be viewed on the SEDAR website, www.sedar.com, and IDM’s website www.idmmining.com. This report,
which includes a revised resource estimate, was authored by Dunham Craig, P.Geo., Scot Klingmann, P.Eng.,
Gord Doerksen, P.Eng., and Tom Shouldice, P.Eng. who are independent Qualified Persons as defined under
National Instrument 43-101.
The PEA is preliminary in nature; it includes inferred mineral resources that are considered too speculative
geologically to have the economic considerations applied to them that would enable them to be categorized as
mineral reserves, and that there is no certainty that the PEA will be realized.
In April 2016, the Company completed an update to the resource estimate for the Project and an independent
technical report was prepared by Dr. Gilles Arseneau, P.Geo and Andrew Hamilton, P. Geo, following the
guidelines of the Canadian Securities Administrators National Instrument 43-101 and Form 43-101F1 report,
titled “Mineral Resources Update for the Red Mountain Gold Project, Northwestern, BC, Canada”. The report
was filed on SEDAR on May 6, 2016 and can be viewed on the SEDAR website, www.sedar.com, and IDM’s
website www.idmmining.com.
Red Mountain Preliminary Economic Assessment Results
A summary of the PEA results based on a 5% Discount Rate, 0.95 CAD:USD, US$1,250 per ounce gold price
and US$20 per ounce silver price is as follows. Full details are available in the NI 43-101 Technical Report.
Key Aspects and Assumptions of the PEA Study:
Summary of Results
Mine Life Years 5.0
Resource Mined M tonnes 1.4
Waste Mined M tonnes 0.0
Total Mined M tonnes 1.4
Strip Ratio w:o 0.0
Throughput Rate Tpd 1,022
Average Au Head Grade g/t 7.25
Average Ag Head Grade g/t 24.44
Au Payable k oz. 277.0
k oz./yr 55.5
Ag Payable k oz. 852.0
k oz./yr 170.6
Management’s Discussion and Analysis April 30, 2016
IDM Mining Ltd. – Final 5
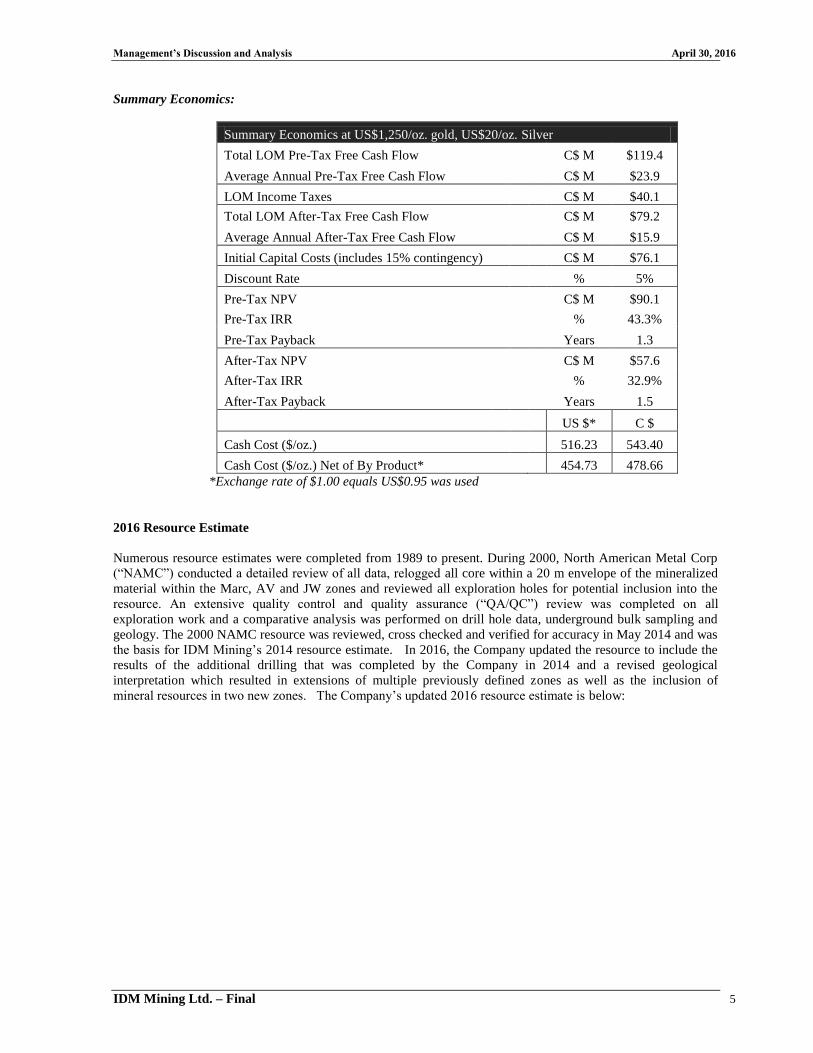
Summary Economics:
Summary Economics at US$1,250/oz. gold, US$20/oz. Silver
Total LOM Pre-Tax Free Cash Flow C$ M $119.4
Average Annual Pre-Tax Free Cash Flow C$ M $23.9
LOM Income Taxes C$ M $40.1
Total LOM After-Tax Free Cash Flow C$ M $79.2
Average Annual After-Tax Free Cash Flow C$ M $15.9
Initial Capital Costs (includes 15% contingency)
C$ M $76.1
Discount Rate % 5%
Pre-Tax NPV C$ M $90.1
Pre-Tax IRR % 43.3%
Pre-Tax Payback Years 1.3
After-Tax NPV C$ M $57.6
After-Tax IRR % 32.9%
After-Tax Payback Years 1.5
US $* C $
Cash Cost ($/oz.) 516.23 543.40
Cash Cost ($/oz.) Net of By Product* 454.73 478.66
*Exchange rate of $1.00 equals US$0.95 was used
2016 Resource Estimate
Numerous resource estimates were completed from 1989 to present. During 2000, North American Metal Corp
(“NAMC”) conducted a detailed review of all data, relogged all core within a 20 m envelope of the mineralized
material within the Marc, AV and JW zones and reviewed all exploration holes for potential inclusion into the
resource. An extensive quality control and quality assurance (“QA/QC”) review was completed on all
exploration work and a comparative analysis was performed on drill hole data, underground bulk sampling and
geology. The 2000 NAMC resource was reviewed, cross checked and verified for accuracy in May 2014 and was
the basis for IDM Mining’s 2014 resource estimate. In 2016, the Company updated the resource to include the
results of the additional drilling that was completed by the Company in 2014 and a revised geological
interpretation which resulted in extensions of multiple previously defined zones as well as the inclusion of
mineral resources in two new zones. The Company’s updated 2016 resource estimate is below:

Management’s Discussion and Analysis April 30, 2016
IDM Mining Ltd. – Final 6
Mineral Resource Statement for the Red Mountain Gold Project at a 3 grams per tonne (“g/t”) Cut-off Grade*
Deposit Tonnage In situ
Gold
Grade
In situ
Silver
Grade
In situ
Contained Gold
In situ
Contained
Silver
(tonnes) g/t g/t (Troy ounces) (Troy ounces)
MEASURED
MARC 642,800 9.84 38 203,400 784,500
AV 204,500 7.91 21 52,000 136,100
INDICATED
Marc 17,100 10.14 25 5,600 13,500
AV 505,000 7.45 21 120,900 333,500
JW 114,100 9.57 13 35,100 48,300
141 158,400 4.82 13 24,500 63,900
TOTAL MEASURED &
INDICATED
1,641,800
8.36
26
441,500
1,379,800
INFERRED
MARC 2,600 12.44 28 1,100 2,300
AV 35,100 10.18 19 11,500 21,600
JW 176,100 7.38 10 41,800 59,300
MARC FW 44,200 6.29 6 8,900 8,700
AV LOWER 44,900 5.11 6 7,400 9,100
JW LOWER 120,600 4.40 4 17,100 14,200
141 55,000 5.12 6 9,100 9,800
132 69,600 4.81 13 10,700 28,600
TOTAL INFERRED 548,100 6.10 9 107,500 153,700
*3 g/t Au is calculated as the cut-off grade for underground long hole stoping. Totals may not add due to rounding
The mineral resource estimate, effective date April 4, 2016, was prepared by Dr. Gilles Arseneau,, P. Geo, and
Andrew Hamilton, P. Geo, using 3D GEMS block modeling software. Resources were estimated from 480
surface and underground drill holes in 4 by 4 by 4 m blocks by ordinary kriging and anisotropic search ellipsoids
designed to fit the geology. Grade estimates were based on capped 1.5 m composited assay data. Gold values
used in the interpolation runs were top cut to 55 g/t gold, and silver top cut to 220 g/t silver
2016 Fiscal Activities
The Company continued to advance the Project through the EA process and in February 2016 received the
Section 11 Order for the Project from the BC EAO. The Section 11 Order outlines the scope, requirements,
processes and methods of the EA, as well as the public and Aboriginal consultation procedures.
An environmental baseline study program in support of the EA process began in the spring of 2014 and will
complete in the summer of 2016. Baseline studies to date have included: surface and groundwater quality,
hydrology and hydrogeology, climate, geochemical studies, archeological assessments, geohazards assessments,
fisheries and wildlife studies. Following the completion of the 2016 spring and early summer sampling and
monitoring program, the baseline environmental studies are expected to be sufficient to meet provincial and
federal guidelines, and the data will be incorporated into the provincial and federal EA Applications.
An update to the current PEA for Red Mountain, to include the 2014 and historic drilling results from the 141
Zone, has also been progressing in conjunction with the EA process. In addition, the Company engaged JDS
Mining and Energy (“JDS”) to analyze and complete trade-off studies for the Project with respect to processing
methods, tailing management facility (“TMF”) location, mill location, ore transport modality and mine portal

Management’s Discussion and Analysis April 30, 2016
IDM Mining Ltd. – Final 7
location. As a result of this analysis and feedback received from Nisga’a Nation, as well as provincial and
federal regulators, the Company has selected an alternative location of the Bromley Humps versus the Red
Mountain cirque to build the mill and TMF for the Project.
The Bromley Humps area is preferable due to its lower elevation, water management perspective, no requirement
for divergence of any waterways, reduced potential geohazards and the option to mill year–round would be
available. Additionally, this alternative location has sufficient area for the mill, stockpile and expansion
potential for the tailings management facility beyond current requirements.
The Company expects to have completed the update to its current PEA early in the second half of calendar year
2016 and is targeting completion of a Feasibility Study early in calendar year 2017. The revised PEA will
include the alternate mill and TMF location, as well as the updated NI43-101 resource estimate and will factor in
current metal prices, foreign exchange rates, capital and operating costs.
Subsequent to the quarter end, the Company has commenced the 2016 field season, which will consist of an infill
and step-out underground core drilling program using two rigs. Step-out holes will be completed along strike
and down-dip from existing resources, primarily at the JW Zone, as well as to upgrade inferred and indicated
resources in the JW zone and AV zone, respectively. The drilling will also gather additional material for
metallurgical testwork, as well as geotechnical and hydrological data. The program is expected to total
approximately 5,120 meters of drilling in 36 holes, pending receipt of all necessary approvals. Prior to the
drilling, the Company will rehabilitate and dewater the production sized decline that was driven by previous
operators.
The Company will continue to fully consult with the Nisga’a Nation (“Nisga’a), who holds Treaty rights in the
Project area, regarding the proposed 2016 field activities and during the permitting process. The Company is
committed to engaging with Nisga’a and supporting Nisga’a full participation in the environmental and
regulatory reviews of the Project, as well as in the employment and business opportunities related to the Project
and the proposed 2016 work programs.
2015 Fiscal Year Activities:
The Company advanced the permitting of the Project by submitting a Project Description to BC EAO and the
Canadian Environmental Assessment Agency (the “Agency”) in August 2015. In November 2015, BC EAO and
the Agency initiated the EA of the Project under Section 10(1)(c) of the British Columbia Environmental
Assessment Act.
In addition, the Company continued to advance the environmental baselines program for the Project, as well as
First Nation and stakeholder consultation by completing the following:
surface and groundwater sampling and analysis, geo-hazard assessment, wildlife and fisheries studies
and archaeological assessments;
Socioeconomic studies, First Nation and community engagement;
No field exploration work was completed in the 2015 field season.
2014 Fiscal Year Activities - Surface Exploration Work
Surface mapping, along with rock and soil sampling were completed in 2014. This work targeted known
showings, as well as reconnaissance work in new areas.
The McAdam zone is located 3,000 m southwest, and 800 m lower in elevation from the Marc and AV zone
resource area. This undrilled prospect hosts multiple en echelon shears and quartz-pyrite-molybdenite veins,
ranging from 0.2 to 1.5 m in thickness. Located in steep terrain requiring rope-assisted sampling, 102 chip
samples were previously collected by Lac Minerals in 1991. A total of 31 of these historic samples assayed over

Management’s Discussion and Analysis April 30, 2016
IDM Mining Ltd. – Final 8
1.0 g/t Au, averaging 18.7 g/t Au and 56.1 g/t Ag. Individual channel samples included: 0.2 m averaging 103.8
g/t Au, 1.0 meter averaging 24.7 g/t Au and 0.6 m averaging 57.1 g/t Au. Confirmation sampling by IDM crews
of quartz-pyrite-molybdenite veins at McAdam returned assay values ranging from 1.5 g/t Au to 36.7g/t Au. The
average of all 42 rock samples collected in the McAdam area is 2.8 g/t Au. The McAdam zone was identified as
top priority drill target for IDM’s fall 2014 drill campaign.
A further 700 m southwest of the McAdam zone, in an area of glacial retreat that has uncovered newly exposed
areas of outcrop; reconnaissance prospecting discovered additional new areas of gold mineralization which has
been collectively named the Lost Valley prospect. Two grab samples of pyrite +/- quartz stockwork returned
10.5 g/t Au and 2.2 g/t Au, respectively, 50 meters apart. Twelve other reconnaissance grab samples returned
low to anomalous precious metal values.
Recent glacial retreat has exposed a large area of previously unexplored outcrop and rubble, south of the
McAdam prospect. New exposure of a quartz monzonite stock (Erin stock) has revealed extensive molybdenite
mineralization within quartz vein stockwork. This intrusive measures about one square kilometer in area. Of the
106 grab, subcrop and channel samples collected in the Erin stock area, all samples averaged 0.110% Mo.
Individual grab samples of molybdenum rich stockwork, with veins typically 0.5 to 10 centimeters wide,
included grades of 1.39%, 1.65 and 1.81% Mo. Stockwork and mineralization is typically strongest within a 25
to 50 meter wide area proximal to the quartz monzonite contact with surrounding hornfels, but molybdenite is
common throughout the intrusive.
During the 2014 surface exploration program, a total of twelve diamond drill holes were completed at Red
Mountain primarily focused on exploration targets outside of the current resource area. Highest priority targets
included: the 141 Zone, Cambria & Uxlux Zones and McAdam Zone. The objective of the drilling at the 141
Zone was to target high-grade underground mineralization similar to the resource area and confirm the presence
of wide intervals of lower-grade porphyry-style gold mineralization, similar to other large gold deposits in north
western BC. Drill hole MC14-03 accomplished both tasks, intersecting 138 m of 1.41g/t Au including; 7.5
meters of 10.45g/t Au. This hole was completed at 202 meters depth and ended in mineralization. Drill hole
MC14-02 was completed at a shallower angle from the same pad, and intersected 84 meters averaging 0.80 g/t
Au. Drill hole MC14-01, collared 65 meters west of holes MC14-02 and MC14-03, intersected 60.00 meters
averaging 1.16 g/t Au.
Step-out drill hole MC14-005 intersected 9.35 meters true width averaging 6.59 g/t Au, including a 1.70 meter
interval of 20.0 g/t Au. This is located approximately 15 meters updip from the JW Zone, the third of a series of
en-echelon zones comprise the Resource Area at Red Mountain.
Two new zones were discovered through drilling during the 2014 season. Located near the underground decline,
the Marc Zone Extension is a historic prospect with high-grade gold from surface trenching. Previous operators
placed development rock from underground development over top of this prospect; drilling by IDM at the edge
of the waste rock pad collared into gold mineralization, with MCEX14-01 intersecting 5.50 meters averaging
6.16 g/t Au including 2.0 meters averaging 12.92 g/t Au. A second, steeper hole from the same drill pad
MCEX14-02 intersected 4.90 meters averaging 1.69 g/t Au. These two intercepts suggest a potential northerly
dip to the mineralized zone. Due to the Marc Zone Extensions’ close proximity to existing works, this is a
priority follow-up area for future drilling.
Five drill holes were completed in the Cambria zone. Significant new areas of massive and semi-massive
sulphide were identified during the 2014 field season. These are newly exposed areas of surface mineralization
that were uncovered due to glacial retreat over the past 20 years. The Cambria zone is located 500 meters
southeast and on trend with the Marc-AV-JW resource area. Similar to the Marc zone, the Cambria zone hosts a
large area of centimeter to several meters wide gold-bearing massive pyrite stockworks and veins. Cut-saw
channel samples averaged 10.94 g/t Au over 8.13 meters and 20.31 g/t over 3.40 meters, with mineralization
continuing under overburden. Located 150 meters north of Uxlox within a contiguous north-striking structure,
the Wyy Lo’oop Zone is another recently exposed outcropping of massive sulphides. A 3.94 meter long channel
sample of massive and semi-massive mineralization assayed 10.6 g/t Au.
Management’s Discussion and Analysis April 30, 2016
IDM Mining Ltd. – Final 9
Drilling tested 200 meters of strike length, encountering stockwork of massive pyrite and pyrrhotite veins.
Discovery drill hole CB14-01 intersected 4.39 meters true width averaging 5.67 g/t Au including 0.93 meters true
width averaging 13.50 g/t Au starting at 41.3 meters downhole. Other holes intersected strong sulphide
mineralization and anomalous gold values, with the Cambria structure wide open for expansion.
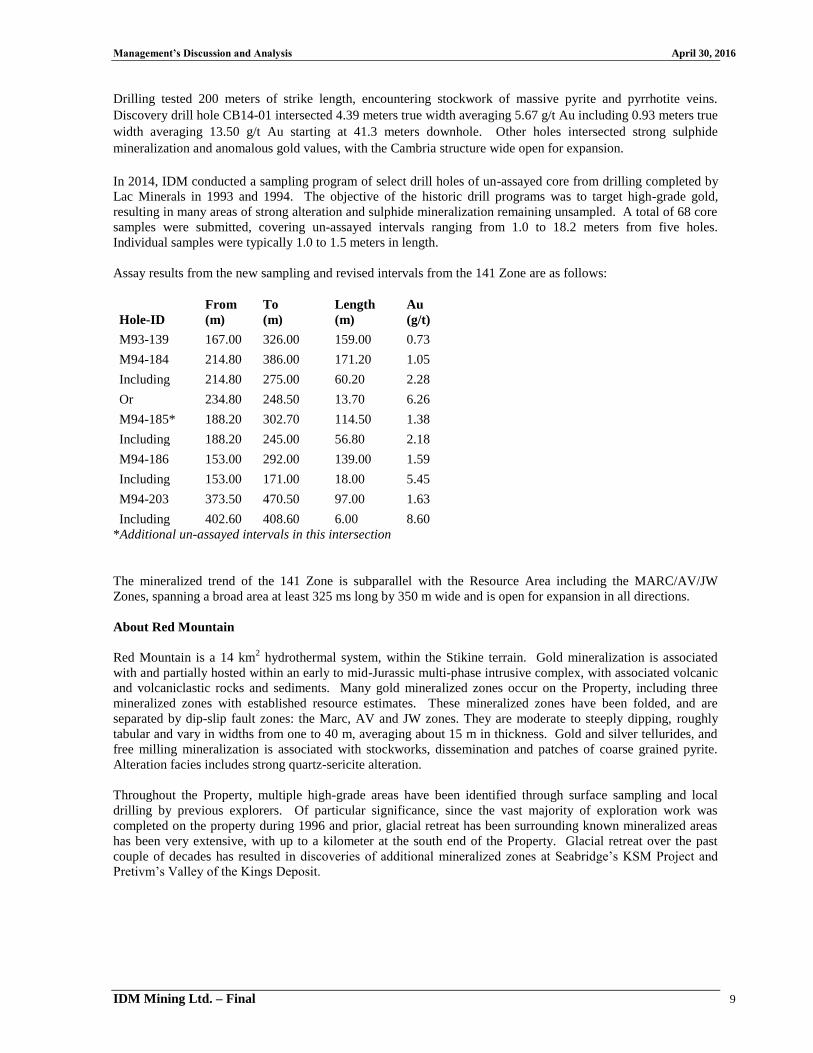
In 2014, IDM conducted a sampling program of select drill holes of un-assayed core from drilling completed by
Lac Minerals in 1993 and 1994. The objective of the historic drill programs was to target high-grade gold,
resulting in many areas of strong alteration and sulphide mineralization remaining unsampled. A total of 68 core
samples were submitted, covering un-assayed intervals ranging from 1.0 to 18.2 meters from five holes.
Individual samples were typically 1.0 to 1.5 meters in length.
Assay results from the new sampling and revised intervals from the 141 Zone are as follows:
Hole-ID
From
(m)
To
(m)
Length
(m)
Au
(g/t)
M93-139 167.00 326.00 159.00 0.73
M94-184 214.80 386.00 171.20 1.05
Including 214.80 275.00 60.20 2.28
Or 234.80 248.50 13.70 6.26
M94-185* 188.20 302.70 114.50 1.38
Including 188.20 245.00 56.80 2.18
M94-186 153.00 292.00 139.00 1.59
Including 153.00 171.00 18.00 5.45
M94-203 373.50 470.50 97.00 1.63
Including 402.60 408.60 6.00 8.60
*Additional un-assayed intervals in this intersection
The mineralized trend of the 141 Zone is subparallel with the Resource Area including the MARC/AV/JW
Zones, spanning a broad area at least 325 ms long by 350 m wide and is open for expansion in all directions.
About Red Mountain
Red Mountain is a 14 km2 hydrothermal system, within the Stikine terrain. Gold mineralization is associated
with and partially hosted within an early to mid-Jurassic multi-phase intrusive complex, with associated volcanic
and volcaniclastic rocks and sediments. Many gold mineralized zones occur on the Property, including three
mineralized zones with established resource estimates. These mineralized zones have been folded, and are
separated by dip-slip fault zones: the Marc, AV and JW zones. They are moderate to steeply dipping, roughly
tabular and vary in widths from one to 40 m, averaging about 15 m in thickness. Gold and silver tellurides, and
free milling mineralization is associated with stockworks, dissemination and patches of coarse grained pyrite.
Alteration facies includes strong quartz-sericite alteration.
Throughout the Property, multiple high-grade areas have been identified through surface sampling and local
drilling by previous explorers. Of particular significance, since the vast majority of exploration work was
completed on the property during 1996 and prior, glacial retreat has been surrounding known mineralized areas
has been very extensive, with up to a kilometer at the south end of the Property. Glacial retreat over the past
couple of decades has resulted in discoveries of additional mineralized zones at Seabridge’s KSM Project and
Pretivm’s Valley of the Kings Deposit.
Management’s Discussion and Analysis April 30, 2016
IDM Mining Ltd. – Final 10
Yukon Properties
In February 2016, the Company acquired Oban’s portfolio of Yukon Properties. As consideration, the Company
issued 7,188,889 shares and granted a 1% net smelter royalty over the properties and certain other rights to Oban.
The properties are subject to certain other underlying royalties.
The Yukon portfolio consists of approximately 14,500 claims covering over 11 project areas consisting of 52
claim groups totaling over 300,000 hectares. The properties cover multiple tectonic and metallogenic
environments as well as a variety of mineral deposit styles common in Yukon. Significant early stage
exploration was previously completed, including 158,646 soil samples, airborne geophysical surveys,
reconnaissance mapping and sampling, and over 10,000 meters of drilling on two of the projects. Review of this
data has identified over a dozen broad soil geochemical anomalies in addition to numerous other areas of interest
defined by geophysical and geological criteria. The highest priority targets are Pluto, Mahtin. Golden-Oly and
PDM Property
The Pluto Property in the Kluane region of the Yukon lies approximately 100km WSW of the town of Carmacks.
The land package covers an area of 588 square km and is underlain by a series of metamorphic schists of the
Yukon-Tanana terrane and the Paleocene Ruby Range granodiorites.
The Mahtin property is located approximately 50 km northwest of the town of Mayo. The area is underlain by
Cretaceous plutons intruding carbonate rocks. The property is located over 50 km southwest of Victoria Gold’s
Eagle Deposit at Dublin Gulch, and hosts intrusive-related gold potential as well as skarn mineralization. Over
17,400 soil samples were collected over this prospective area. The property has two main targets: May-Qu and
North Mahtin.
The Golden-Oly property covers an area of approximately 840 square km and is located adjacent to the North
Canol road, 125km northeast of the village of Ross River. Widespread gold and arsenic anomalies in soil grids
suggest that the targets may be intrusive related or sediment hosted mineralizing zones.
The PDM property covers an area of approximately 110 square km and located adjacement to the North Canol
road, approximately 100km northeast of Ross River. The property was covered by a ridge and spur soil program
with 1,322 samples collected.
QA/QC
The 2014 exploration program at Red Mountain included a rigorous Quality Control/Quality Assurance program,
overseen by Rob McLeod, P.Geo, President and CEO of IDM, a Qualified Person as defined by NI 43-101. Drill
cores were logged and cut in-half using a diamond saw, with one half placed in sealed bags and shipped to Acme
Analytical Labs’ sample preparation facility in Smithers, BC, with pulps subsequently shipped to Acme’s Lab in
Vancouver, BC. 10% of all samples submitted include randomly inserted blank material or multiple quality
control standards. An additional 10% of samples will be shipped to a third party analytical lab.
Additional technical information on Red Mountain including the NI43-101 Technical Report can be reviewed at
www.IDMmining.com and www.sedar.com.
QUALIFIED PERSON
Technical disclosure for the Company’s projects included in this MD&A has been reviewed and approved by
Robert McLeod, P. Geo. Mr. McLeod is IDM’s CEO and President and a Qualified Person as defined by
National Instrument 43-101 Standards of Disclosure for Mineral Projects.

Management’s Discussion and Analysis April 30, 2016
IDM Mining Ltd. – Final 11
SELECTED QUARTERLY INFORMATION
Three Month Period Ended
Apr 30, 2016 Jan 31, 2016 Oct 31, 2015 Jul 31, 2015
$’000 $’000 $’000 $’000
Total Assets 20,517 9,634 7,402 7,146
Exploration and Evaluation
Assets
9,189
7,891
6,702
6,299
Working Capital 7,518 (730) (1,554) (1,524)
Derivative liability - - - -
Shareholders’ Equity/(Deficit) 16,822 7,215 5,203 4,660
Net Income/(Loss) (206) (271) 947 (1,222)
Net Income/(Loss) per Share 0.00 0.00 0.00 (0.02)
Three Month Period Ended
Apr 30, 2015 Jan 31, 2015 Oct 31, 2014 Jul 31, 2014
$’000 $’000 $’000 $’000
Total Assets 6,649 7,272 7,533 11,227
Exploration and Evaluation
Assets
6,178
6,168
5,997
9,734
Working Capital (2,408) (2,925) (2,552) (1,251)
Derivative liability 2,750 3,250 4,750 5,000
Shareholders’ Equity/(Deficit) 1,071 50 (1,246) 3,493
Net Income/(Loss) 232 1,296 (6,913) (14,154)
Income/(Loss) per Share 0.01 0.03 (0.17) (0.68)
The variability in IDM’s net loss over the last the eight quarters resulted primarily from the abandonment and
write-off of certain mineral properties, changing levels in capital expenditures, share-based payments, finance
charges, and office and administrative expenses. Changing levels in capital expenditures expenses and general
and administrative costs fluctuate independently according to exploration activities and corporate activities
including shareholder communication.
Significant financial items during previous quarters include:
During the quarter ended October 31, 2014, the Company wrote-down the carrying value of the Champion Hills
properties and consequently wrote off associated capitalized costs of $6,634,445. In addition, the Company
wrote off expenditures incurred on the Mexican properties of $172,134.
During the quarter ended July 31, 2014, the Company elected to abandon the Montana de Oro Properties and
consequently wrote off associated capitalized costs of $9,193,484. The Company also recognized an unrealized
loss on the derivative liability of $4,000,000.
RESULTS OF OPERATIONS
For the three months ended April 30, 2016
The net loss for the three months ending April 30, 2016 was $206,294 or $0.00 per share compared to a net
income of $231,619 or $0.01 for the prior year’s comparative figure. The prior period’s net income included an
unrealized gain on a derivative liability of $500,000. There was no comparable amount in 2016 as the liability
was settled in fiscal year 2015. During the second quarter of 2015, the Company issued 1,230,000 stock
options resulting in share-based compensation of $112,257. No options were issued in the second quarter of
2016.
Significant expenditures or movements include management fees of $121,500 (2015 - $45,820), professional fees
of $94,618 (2015 - $30,766) and director fees $20,000 (2015 - $Nil).

Management’s Discussion and Analysis April 30, 2016
IDM Mining Ltd. – Final 12
For the six months ended April 30, 2016
The net loss for the six months ending April 30, 2016 was $476,999 or $0.00 per share compared to a net income
of $1,528,553 or $0.03 for the prior year’s comparative figure. The prior period’s net income included an
unrealized gain on a derivative liability of $2,000,000. There was no comparable amount in 2016 as the
liability was settled in fiscal year 2015. During the second quarter of 2015, the Company issued 1,230,000
stock options resulting in share-based compensation of $112,257. No options were issued in the second quarter
of 2016.
Significant expenditures or movements include management fees of $208,664 (2015 - $103,423), professional
fees of $180,331 (2015 - $79,374) and director fees $37,000 (2015 - $3,000).
The operating losses are a reflection of the Company’s status as non-revenue producing mineral exploration
company. As the Company has no main source of income, losses are expected to continue for the foreseeable
future.
Investing Activities
Net cash used by the Company in investing activities on exploration and evaluation assets for the six months
ended April 30, 2016 was $1,576,537 (2015 - $720,939) including the $1,000,000 paid under the Red Mountain
Option Agreement. In addition, the Company acquired field equipment in the amount of $62,236 for the
upcoming drill program.
Financing Activities
During the six months ended April 30, 2016, the Company received proceeds of $13,430,386 (2015 – $Nil) from
the issuance of shares and paid share issuance costs of $1,035,542 (2015 - $Nil).
In addition, the Company issued 7,188,889 common shares to acquire the Yukon properties.
Off-Balance Sheet Arrangements
The Company does not have any off balance sheet arrangements.
Related Party Transactions
These condensed consolidated financial statements include the financial statements of the Company and its 100%
owned subsidiaries Storgold Resources Ltd (Canada – Inactive), Revolution Resources (NC) Inc. (USA), Minera
Revolution, S.A. de C.V. (Mexico) and Minera Golondrina, S. de R.L. de C.V (Mexico).
During the six months ended April 30, 2016, the Company paid or accrued the following amounts as
compensation to key management personnel:
a) Management fees of $116,000 (2015 - $72,000) to Robert McLeod, CEO and a director of the
Company of which $Nil (2015 - $Nil) was capitalized to exploration and evaluation assets.
b) Management fees of $55,000 (2015 - $25,000) to Falkirk Resource Consultants Ltd, a company
controlled by Michael McPhie, an executive director of the Company.
c) Management fees of $35,000 (2015 - $22,500) to Susan Neale, an officer of the Company
d) Director fees of $37,000 (2015 - $3,000) to non-executive directors.
e) Professional advisory fees of $25,000 (2015- $Nil) to Cairn Merchant Partners LP, a company
controlled by Andrew Farncomb, a director of the Company.
Management’s Discussion and Analysis April 30, 2016
IDM Mining Ltd. – Final 13
Included in accounts payable is $60,250 (October 31, 2015 - $24,435) due to directors, officers and companies
controlled by directors and officers of the Company.
The Company operates from the premises of a group of public and private companies with a common director.
Certain companies provide geological consulting and office and administrative services to the Company and
various other public companies. Included in accounts payable and accrued liabilities is $140,177 (October 31,
2015 - $140,177) due to McLeod Williams Capital Corp, a related private company. During the six months ended
April 30, 2016, the Company paid or accrued $36,857 (2015 - $59,194) for office and administrative
expenditures.
Falkirk Resource Consultants Ltd, a private company controlled by Michael McPhie, that specializes in
government affairs, project permitting and environmental assessment and baseline studies provides these services
to public and private companies. During the six month period ended April 30, 2016, the Company paid or
accrued $172,936 (2015 - $Nil) for these services relating to the environmental baseline studies, permitting and
governmental affairs associated with the Red Mountain property.
Subsequent Events
.
a) In May 2016, the Company granted 10,500,000 stock options to directors, officers, employees and
consultants to purchase an aggregate of 10,500,000 common shares of the Company at an exercise price of
$0.19 per share for a five year term expiring May 11, 2021, approved by the shareholders at the annual
general meeting held in June 2016.
b) A total of 872,556 warrants have been exercised for total proceeds of $147,591.
c) In June 2016, the Company received approval from its shareholders for the 9,190,460 restricted warrants that
were issued to related parties pursuant to the April 2016 to become effective and exercisable.
LIQUIDITY AND CAPITAL RESOURCES
The Company has no operations that generate cash flow. The Company's future financial success will depend on
the discovery of one or more economic mineral deposits. This process can take many years, can consume
significant resources and is largely based on factors that are beyond the control of the Company and its
management. To date, the Company has financed its activities by the private placement of equity securities,
consisting of a combination of flow-through and non-flow-through securities, In order to continue funding their
exploration activities and corporate costs, exploration companies are usually reliant on their ongoing ability to
raise financing through the sale of equity. This is dependent on positive investor sentiment, which in turn is
influenced by a positive climate for the commodities that are being explored for, a company's track record, and
the experience and caliber of a company's management. There is no assurance that equity funding will be
accessible to the Company at the times and in the amounts required to fund the Company's activities.
Cash and Financial Condition
As at April 30, 2016, the Company had a working capital of approximately $7.5 million. Included in the
working capital is the $1.7 million relating to amounts owing in Mexico. Of this, $1.3 million relates to Mexican
mining property taxes (holding costs) required to keep the properties in good standing. The Company has
abandoned all properties in Mexico, is in the process of winding up operations in Mexico and is working with
certain vendors to settle outstanding payables with respect to the Mexican operations.
The Company has no other debt does not have any unused lines of credit or other arrangements in place to
borrow funds, and has no off-balance sheet arrangements.

Management’s Discussion and Analysis April 30, 2016
IDM Mining Ltd. – Final 14
The Company manages its liquidity risk (i.e., the risk that it will not be able to meet its obligations as they
become due) by forecasting cash flows from operations together with its investing and financing activities.
Expenditures are adjusted to ensure liabilities can be funded as they become due. Management and the Board of
Directors are actively involved in the review, planning, and approval of significant expenditures and
commitments.
Financial Instruments
Cash is carried at fair value using a level 1 fair value measurement. The carrying value of short-term investments,
receivables, prepaid expenses, accounts payable and accrued liabilities and Mexican mining taxes and other
payables approximate their fair value because of the short-term nature of these instruments.
Fair value estimates of financial instruments are made at a specific point in time, based on relevant information
about financial markets and specific financial instruments. As these estimates are subjective in nature, involving
uncertainties and matters of significant judgment, they cannot be determined with precision. Changes in
assumptions can significantly affect estimated fair values
OUTLOOK
The Company’s current acquisition, exploration and development activities are focused on precious metals in
British Columbia and Yukon, with a primary focus on the high grade underground Red Mountain project, which
recently entered the BC and Canadian environmental assessment process.
The Company anticipates completion of an infill and step-out underground core drilling program, consisting of
approximately 5,120 meters of drilling in 36 holes during the third quarter of calendar 2016. Step-out holes will
be completed along strike and down-dip from existing resources, primarily at the JW Zone, as well as to update
inferred and indicated resources in the JW Zone and AV zone, respectively. This drilling will also gather
additional material for metallurgical testwork, as well as geotechnical and hydrological data. Prior to the
drilling, the Company will rehabilitate and dewater the production sized decline that was driven by previous
operators.
The Company will also complete surface program of mapping and sampling, including targeting new areas of the
17,000 hectare property that has recently been exposed by rapid glacial melt. In conjunction with the re-logging
and sampling of historic drill core, the objective of the surface program will be to identify new drill targets within
the widespread alteration and mineralizing system at Red Mountain.
The Company anticipates releasing an updated PEA early in the second half of calendar year 2016, which will
include the alternative location for the tailing management facility and mill, as well as the updated NI43-101
resource estimate for Red Mountain.
In addition, the Company is targeting filing of the Project EA application with the regulators by end of calendar
year 2016 and publishing of a feasibility study in early 2017.
Management’s Discussion and Analysis April 30, 2016
IDM Mining Ltd. – Final 15
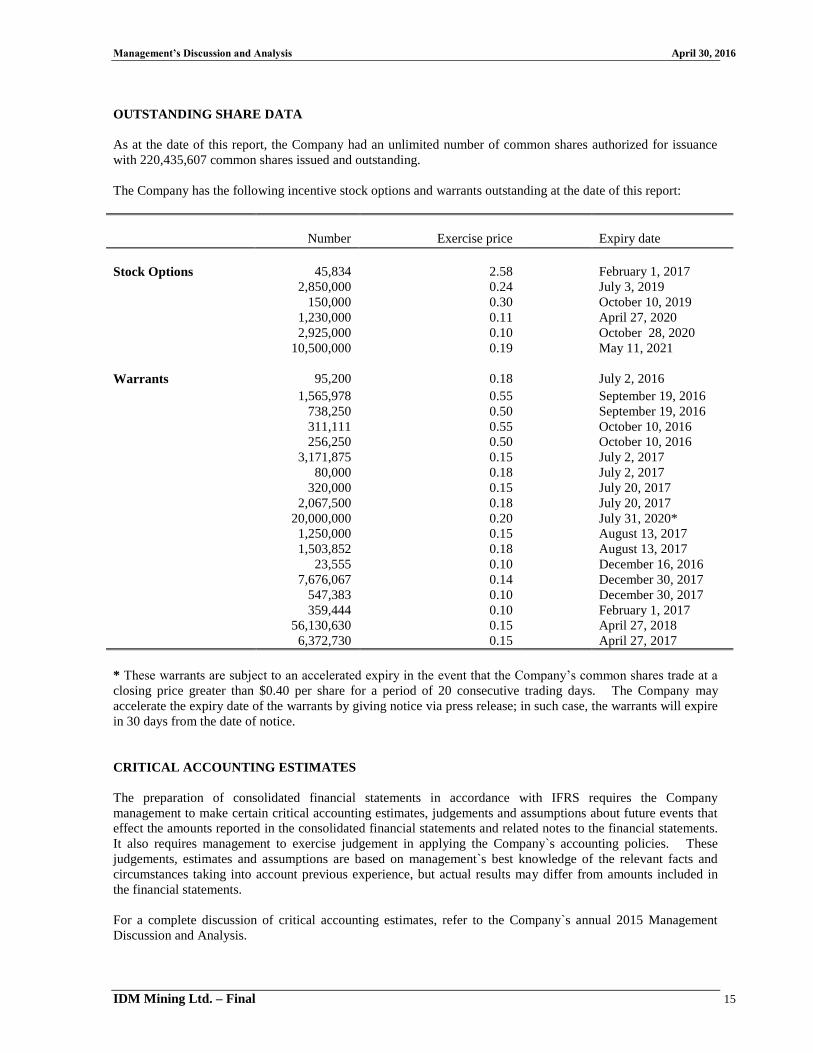
OUTSTANDING SHARE DATA
As at the date of this report, the Company had an unlimited number of common shares authorized for issuance
with 220,435,607 common shares issued and outstanding.
The Company has the following incentive stock options and warrants outstanding at the date of this report:
Number
Exercise price
Expiry date
Stock Options 45,834 2.58 February 1, 2017
2,850,000 0.24 July 3, 2019
150,000 0.30 October 10, 2019
1,230,000 0.11 April 27, 2020
2,925,000 0.10 October 28, 2020
10,500,000 0.19 May 11, 2021
Warrants 95,200 0.18 July 2, 2016
1,565,978 0.55 September 19, 2016
738,250 0.50 September 19, 2016
311,111 0.55 October 10, 2016
256,250 0.50 October 10, 2016
3,171,875 0.15 July 2, 2017
80,000 0.18 July 2, 2017
320,000 0.15 July 20, 2017
2,067,500 0.18 July 20, 2017
20,000,000 0.20 July 31, 2020*
1,250,000 0.15 August 13, 2017
1,503,852 0.18 August 13, 2017
23,555 0.10 December 16, 2016
7,676,067 0.14 December 30, 2017
547,383 0.10 December 30, 2017
359,444 0.10 February 1, 2017
56,130,630 0.15 April 27, 2018
6,372,730 0.15 April 27, 2017
* These warrants are subject to an accelerated expiry in the event that the Company’s common shares trade at a
closing price greater than $0.40 per share for a period of 20 consecutive trading days. The Company may
accelerate the expiry date of the warrants by giving notice via press release; in such case, the warrants will expire
in 30 days from the date of notice.
CRITICAL ACCOUNTING ESTIMATES
The preparation of consolidated financial statements in accordance with IFRS requires the Company
management to make certain critical accounting estimates, judgements and assumptions about future events that
effect the amounts reported in the consolidated financial statements and related notes to the financial statements.
It also requires management to exercise judgement in applying the Company`s accounting policies. These
judgements, estimates and assumptions are based on management`s best knowledge of the relevant facts and
circumstances taking into account previous experience, but actual results may differ from amounts included in
the financial statements.
For a complete discussion of critical accounting estimates, refer to the Company`s annual 2015 Management
Discussion and Analysis.

Management’s Discussion and Analysis April 30, 2016
IDM Mining Ltd. – Final 16
RISKS AND UNCERTAINITIES
Companies in the exploration stage face a variety of risks and investments are highly speculative. While unable
to eliminate all of them, the Company aims at managing and reducing such risks as much as possible. The
Company faces a variety of risk factors such as project feasibility and practically, risks related to determining the
validity of mineral property title claims, commodities prices and environmental laws and regulations.
Management monitors its activities and those factors that could impact them in order to manage risk and make
timely decisions.
Readers are referred to the Company’s 2015 Annual Information Form, located on SEDAR at www.sedar.com,
for a full list of applicable risk factors.
CAUTIONARY NOTE REGARDING FORWARD LOOKING INFORMATION AND STAEMENTS
Some of the statements contained in this document constitute forward-looking information within the meaning of
the Securities Act (British Columbia), Securities Act (Ontario), Securities Act (Nova Scotia) and the Securities
Act (Alberta). Forward-looking information includes disclosure regarding possible or anticipated events,
conditions or results of operations which are based on assumptions about future economic conditions and courses
of action, and includes future oriented financial information with respect to prospective results of operations or
financial position or cash flow that is presented either as a forecast or a projection. Forward-looking information
is often, but not always, identified by the use of words such as seek, anticipate, believe, plan, estimate, expect
and intend; statements that an event or result is due on or may, will, should, could, or might occur or be achieved;
and other similar expressions.
More specifically, forward-looking information contained here may include, without limitation, statements
concerning IDM’s plans for its mineral property located in British Columbia, Canada, the timing and amount of
estimated future production and mine life, expected future prices of minerals, mineral reserve and mineral
resource estimates, estimated capital and operating costs of the project, estimated capital pay-back period,
estimated asset retirement obligations, timing of development and permitting time lines; all of which involve
known and unknown risks, uncertainties and other factors which may cause actual results, performance or
achievements, or industry results, to be materially different from any future results, performance or achievements
expressed or implied by such forward-looking information.
Forward-looking information contained here is based on material factors and assumptions and is subject to a
variety of risks and uncertainties, which could cause actual events or results to differ materially from a
conclusion, forecast or projection in the forward-looking information. These include, without limitation, material
factors and assumptions relating to, and risks and uncertainties associated with, the availability of financing for
activities when required and on acceptable terms, the accuracy of the interpretation of drill results and the
estimation of mineral resources and reserves, the geology, grade and continuity of mineral deposits, the
consistency of future exploration, development or mining results with our expectations, metal price fluctuations,
the achievement and maintenance of planned production rates, the accuracy of component costs of capital and
operating cost estimates, current and future environmental and regulatory requirements, favourable governmental
relations, the availability of permits and the timeliness of the permitting process, the availability of shipping
services, the availability of specialized vehicles and similar equipment, costs of remediation and mitigation,
maintenance of title to mineral properties, industrial accidents, equipment breakdowns, contractor’s costs, remote
site transportation costs, materials costs for remediation, labour disputes, the potential for delays in exploration or
development activities, timely completion of future mineral reserve or resource estimates, timely completion of
scoping or feasibility studies, the inherent uncertainty of production and cost estimates and the potential for
unexpected costs and expenses, commodity price fluctuations, currency fluctuations, continuing global demand
for base metals, expectations and beliefs of management and other risks and uncertainties as discussed in our
MD&A. Although IDM has attempted to identify important factors that could cause actual actions, events or
results to differ materially from those described in forward-looking statements, there may be other factors that
cause actions, events or results not to be as anticipated, estimated or intended. There can be no assurance that
forward-looking statements will prove to be accurate. Should one or more of these risks and uncertainties
materialize, or should underlying assumptions prove incorrect, actual results may vary materially from any
conclusions, forecasts or projections described in the forward-looking information. Accordingly, readers are
advised not to place undue reliance on forward-looking information. Except as required under applicable

Management’s Discussion and Analysis April 30, 2016
IDM Mining Ltd. – Final 17
securities legislation, we undertake no obligation to publicly update or revise forward-looking information,
whether as a result of new information, future events or otherwise.