FORESTS, LAND MANAGEMENT AND AGRICULTURE Chapter … · Ch13 - Forests, Land Management and...
137
Ch13 - Forests, Land Management and Agriculture ACIA Scientific Report External Review January 2004 13–1 DO NOT CIRCULATE OR CITE FORESTS, LAND MANAGEMENT AND AGRICULTURE Chapter 13 ARCTIC CLIMATE IMPACT ASSESSMENT Draft of January 27, 2004 Lead Author Glenn Patrick Juday Contributing Authors Valerie Barber, Eugene Vaganov, Scott Rupp, Steve Sparrow, Paul Duffy Consulting Authors Berg, Edward D’Arrigo, Roseanne Eggertsson, Olafur Furyaev V.V., Hogg, Theodore Huttunen, Satu Jacoby, Gordon Kaplunov, V.Ya. Kellomaki, Seppo Kirdyanov, A.V. Lewis, Carol E. Linder, Sune Linderholm, Hans Naurzbaev, M.M. Pleshikov, F.I. Savva, Yu.V. Sidorova, O.V. Stakanov, V.D. Tchebakova N.M., Valendik E.N. Vedrova, E.F. Yarie, John
Transcript of FORESTS, LAND MANAGEMENT AND AGRICULTURE Chapter … · Ch13 - Forests, Land Management and...

Ch13 - Forests, Land Management and Agriculture ACIA Scientific Report
External Review January 2004 13–1 DO NOT CIRCULATE OR CITE
FORESTS, LAND MANAGEMENT AND AGRICULTURE
Chapter 13
ARCTIC CLIMATE IMPACT ASSESSMENT
Draft of January 27, 2004
Lead AuthorGlenn Patrick Juday
Contributing AuthorsValerie Barber, Eugene Vaganov, Scott Rupp, Steve Sparrow, Paul Duffy
Consulting AuthorsBerg, EdwardD’Arrigo, RoseanneEggertsson, OlafurFuryaev V.V.,Hogg, TheodoreHuttunen, SatuJacoby, GordonKaplunov, V.Ya.Kellomaki, SeppoKirdyanov, A.V.Lewis, Carol E.Linder, SuneLinderholm, HansNaurzbaev, M.M.Pleshikov, F.I.Savva, Yu.V.Sidorova, O.V.Stakanov, V.D.Tchebakova N.M.,Valendik E.N.Vedrova, E.F.Yarie, John

Ch13 - Forests, Land Management and Agriculture ACIA Scientific Report
External Review January 2004 13–2 DO NOT CIRCULATE OR CITE
Chapter 13 Contents13.0 Chapter Summary
13.0.1 Agriculture in the Arctic and Subarctic13.0.2 Circumpolar forest resource management context13.0.3 Tree-rings and past climates of the boreal region13.0.4 Climate change and treeline movement13.0.5 Boreal tree growth under current and scenario climates13.0.6 Climate change and forest disturbances in the boreal region13.0.7 Climate change and carbon cycling in the boreal forest13.0.8 Boreal forests and UV-B
13.1 Overview of the Chapter13.1.1 Relationship to ACIA Study Area13.1.2 Plan of the Chapter
13.2 Importance of the Boreal Forest and it relationship to climate13.2.1 Global importance of the Boreal Forest13.2.2 Importance of the Boreal Forest to the Arctic13.2.3 Overall climate features of the boreal region13.2.4 Importance of climate variability in the boreal region13.2.5 Unique influences of the forest on climate in the boreal region
13.3 Extent of the boreal forest and land tenure and management in the boreal region13.3.1 Russia13.3.2 Canada13.3.3 U.S.A. (Alaska)13.3.4 Fennoscandia13.3.4.1 Finland13.3.4.2 Sweden13.3.4.3 Norway13.3.4.4 Iceland and Greenland
13.4 Use and evaluation of the scenarios13.4.1 Method of analysis13.4.2 Size and placement of grids13.4.3 Range of scenarios13.4.4 Variability and seasonality13.4.5 “Surprises” in Climate Change Effects on Forests13.4.6 Issues of B2 versus A2 Scenario
13.5 Agriculture13.5.1 Relationship of the global agricultural system to the Arctic region13.5.2 Existing agriculture in the Arctic region13.5.3 Approach to analysis of scenarios and agriculture13.5.4 Climate limitations and influences13.5.5 Growing Degree Day analysis
Ch13 - Forests, Land Management and Agriculture ACIA Scientific Report
External Review January 2004 13–3 DO NOT CIRCULATE OR CITE
13.5.6 Precipitation and Potential Evapotranspiration analysis13.5.7 Indirect effects of climate change on agriculture
13.6 Tree-rings and past climate13.6.1 Issues in long-term climate reconstructions from tree-rings13.6.1 Tree-ring evidence of climate change in the historical past from central Eurasia13.6.1.1 Long-term climatic changes in Central Asian Subarctic during the last 400
years.13.6.1.2 Medieval and current warming in the north-eastern Eurasia inferred from
millennia tree-ring chronologies.13.6.1.3 Climate change on the eastern Taymir during half of the Holocene according to
the long-term tree-ring chronology.13.6.2 Tree-ring evidence of climate change in the recent historical past from Alaska and
Canada13.6.3 Tree-ring evidence of climate change in the historical past from north western
Europe
13.7 Direct Climate Effects on Tree Growth13.7.1 The Flakaliden direct warming experiment13.7.1.1 Background to the Flakaliden direct warming experiment13.7.1.2 Questions, hypotheses, and results of the Flakaliden experiment13.7.2 Climate effects on growth of trees in the Central Eurasian transect13.7.2.1 Climate Response Functions of Trees From the Siberian Forest-Tundra Zone to
the Steppe (grassland)13.7.2.2 Variation in climate and growth of trees on the Central Eurasian IGBP transect13.7.3 Response of North American conifers to climate and climate change scenarios13.7.3.1 Climate response of white spruce in Alaska and Canada13.7.3.3 Climate response of black spruce in Alaska and Canada13.7.3.4 Climate response of Scots pine in Scandinavia
13.8 Climate change and insects as a forest disturbance13.8.1 Role of forest insects in the boreal forest13.8.2 Climate and the spruce bark beetle in Alaska13.8.4 Mechanism of climate control of spruce bark beetles in southcentral Alaskain North America13.8.5 Other forest-damaging insects in the boreal region
13.9 Climate Change and Fire13.9.1 Fire and boreal forests
13.9.1.1 Weather and climatic controls13.9.1.2 Secondary succession13.9.1.3 Components of the fire regime13.9.1.4 Ignition sources
13.9.2 Regional fire regimes13.9.2.1 Russia13.9.2.2 Canada
Ch13 - Forests, Land Management and Agriculture ACIA Scientific Report
External Review January 2004 13–4 DO NOT CIRCULATE OR CITE
13.9.2.3 U.S.A. (Alaska)13.9.2.4 Fennoscandia
13.9.3 Possible climate change impacts on fire
13.10 Climate Change, in Relation to Carbon Uptake and Carbon Storage13.10.1 The role of boreal forest in the global carbon cycle13.10.2 The role of disturbance in the carbon cycle of the boreal forest13.10.3 Climate and carbon allocation in the boreal forest13.10.4 Relationship of forest cover type, disturbance, and climate change
13.11 Climate change, land use, nitrogen deposition, and CO2 fertilization effects on thecarbon cycle of the boreal forest13.11.1 Land use change13.11.2 Nitrogen deposition and CO2 fertilization
13.12 Examples of Climate Change and Change in Forest Distribution13.12.1 Some issues in the movement of treeline
13.12.1.1 Regional trends of climate and treeline in Northern Eurasia13.12.1.2 Regional trends of climate and treeline on the Yamal Peninsula13.12.1.3 Climate and treeline changes at the Polar Ural Mountains
13.12.2 History and examples of modern movement of treeline in northeast Canada
13.12 Ozone and UV-B effects on Forest Vegetation13.12.1 Particular nature of the ozone and UV-B problem in the Arctic13.12.2 Forest-related biological issues of ozone depletion and UV-B in the Arctic
13.13 Critical Research Needs13.13.1 Research needs in agriculture and climate change13.13.2 Research needs in northern boreal forests and climate change13.13.3 Research needs in UV-B and boreal forests
13.13 References

Ch13 - Forests, Land Management and Agriculture ACIA Scientific Report
External Review January 2004 13–5 DO NOT CIRCULATE OR CITE
13.0 Chapter Summary
13.0.1 Agriculture in the Arctic and Subarctic
Agriculture has existed in the ACIA region for well over a millennium, and today consists of amixture of commercial agriculture on several thousand farms and widespread subsistenceagriculture. Potatoes and forage are characteristic crops of the cooler areas, and grains andoilseed crops are restricted to areas with warmest growing seasons. The main livestock producedare dairy cattle and sheep, which have been declining, and diversified livestock such as bison orother native animals, which have generally been increasing in commercial operations (but notnecessarily in semi-traditional reindeer production systems). This analysis focused on cropagriculture and did not consider livestock systems. The five GCM scenarios (Chapter 4) allproduce rising temperatures that would very likely enable crop production to advance northwardthroughout the century, with some crops now suitable only for the warmer parts of the borealregion becoming suitable as far north as the Arctic Circle. Average annual yield of farms wouldlikely increase at the lower levels of warming due to climate suitability for higher yielding cropvarieties and lower probabilities of low temperatures limiting growth. However, in warmestareas, increased heat units during the growing season may cause a slight decrease in yields sincewarmer temperatures can speed crop development and thereby reduce the amount of timeorganic matter (dry measure) is accumulated. Under scenario conditions, water deficits are verylikely to increase or appear in most of the boreal region, the main exceptions being portions ofeastern Canada, Iceland, and western Scandinavia, which experience the strongest maritimeinfluence on their climates. In the later scenario period, unless irrigation is practiced, water stresswould very likely negatively impact crop yields. Water limitation may become more importantthan temperature limitations for many crops in much of the region. Indirect effects of climatewarming associated with the scenarios, such as an increase in the incidence of insects anddiseases that affect crops, would likely have significant impacts in most of the region. Overallnegative effects would not likely be stronger than positive effects. Lack of infrastructure is likelyto remain a major limiting factor for commercial agricultural development in the boreal region inthe near future, and climate warming that thawed permafrost would affect land transportationroutes. Shipping across the Arctic Ocean could fundamentally change the costs of shippingcargoes that affect agriculture. If climate warming is associated with migration of peoplenorthward, the larger resident population base is likely to stimulate the agricultural sector,ultimately expanding and improving infrastructure which would improve economic potential ofagriculture. Even under scenario levels of climate warming, government policies regardingagriculture and trade will still have a very large, and perhaps decisive, influence on theoccurrence and rate of agricultural development in the north. Agriculture could be sensitive tochanges in moisture supply from a reduction of northern sea ice cover during the warm season intwo different ways. On the one hand additional moisture could relieve moisture deficits, but cool,wet weather in the summer and at harvest time can limit production of certain crops.
13.0.2 Circumpolar forest resource management context
Understanding the condition or character of the forest resource system that climate changeaffects is crucial in assessing forests and land management. Russia has made commitments tomanagement of carbon stocks that is of global interest because of the amounts involved. After

Ch13 - Forests, Land Management and Agriculture ACIA Scientific Report
External Review January 2004 13–6 DO NOT CIRCULATE OR CITE
the major political, social, and economic changes of the 1990s, Russia both achieved successesand faces remaining challenges in rebuilding and sustaining forest management capability over avast area that has experience some exceptionally large fires in recent warm years. Ownership,management goals, and administrative responsibility in northern Canadian boreal forests areevolving away from a uniform system to more local and varied patterns, but large areas that arecurrently primary forest are committed to being harvested eventually. Fire and insect disturbanceat very large scales have generated resource management challenges in Canada. A largeproportion of Alaska is managed as strict nature reserves and as resource lands for biodiversityand ecosystem services. Large forest disturbances associated with climate warming haveoccurred in Alaska, disrupting ecosystems and imposing direct costs, but the large area ofreserves improves the ultimate prospects of species surviving potential future climate change. Inhighly managed forests of Finland, Sweden, and Norway, forests are generally effectivelymanaged and increasing in volume, but the prospect of climate change puts at risk humanexpectations of specific future resource returns and the investments that have been made toachieve them. In Iceland climate warming has improved tree growth at a time of a largeafforestation program designed to increase forest land cover and which has carbon sequestrationas an important goal.
13.0.3 Tree-rings and past climates of the boreal region
Tree-rings records of past climate provide valuable perspective on current and projected climatechanges. At about 6000 BP (the Postglacial thermal maximum), radial growth of larch trees onthe Taymir Peninsula of Russia surpassed the average of the last two millennia by 1.5 to 1.6times. Tree growth and warm season temperature have irregularly decreased in northernmostEurasia and North America from the Postglacial thermal maximum through the end of the 20th
century. Long-term tree-ring chronologies from Russia, Scandinavia, and North America recordthe widespread occurrence of a Medieval Warm Period about one thousand years ago, a colderLittle Ice Age ending about 150 years ago, and various types of climate change involvingwarming more recently. Recent decades are the warmest in a millennium or more at somelocations. Temperature and tree growth records generally change at the same time and in thesame direction across much of the Arctic and Subarctic. However, intensified air masscirculation associated with a warmer climate introduces a stronger flow of warm air into thisnaturally cold region in specific subregions and enhanced return flow of cold air out of the regionin other subregions. Temperature and tree growth trends are correlated but opposite in sign inthese contrasting subregions. In the western North American boreal region, rapid temperatureshifts followed by semi-stable temperature regimes are a fundamental feature of climate changein the region over at least the last 3 centuries.
13.0.4 Climate change and treeline movement
In the period between 9000 and 7000 B.P. trees occurred in at least small groups in what is nowtreeless tundra nearly all the way to the Arctic coastline in all sectors of the of Russian north,although treeline has been more stable in some parts of the Arctic. The greatest retreat of forestand expansion of tundra before the modern treeline configuration took place between 4000 and3000 B.P. During the period of maximum forest advance the mean July temperature in the northof Russia (at the coastline) was 2.5 to 7.00C higher than the modern mean. The more advanced

Ch13 - Forests, Land Management and Agriculture ACIA Scientific Report
External Review January 2004 13–7 DO NOT CIRCULATE OR CITE
position of treeline to the north reflected a series of other environmental changes in the Arctic,including increased solar insolation, reduced ice cover of the Arctic Ocean, increased climatecontinentality, and a significant intrusion of warm North Atlantic water into the Arctic. Thisdocumented record of past forest advance suggests that there is a solid basis for projectingsimilar treeline change from scenarios that produce similar levels of warming. It also suggeststhat the components of ecosystems present today have the capacity to respond and adjust to suchclimate fluctuations. At 6000 BP the northern treeline on the Taymir, which is currently thefarthest north in the world, was at least 150 km further north than at present. On the YamalPeninsula of Russia the most significant southward retreat of treeline during the last 4000 yearstook place after two closely spaced short-term cold events, one of which was very probably theeruption of Santorini volcano in 1628 B.C. in the eastern Mediterranean (one of the largesteruptions of the last few millennia). In spite of extremely favorable summer warmth that returnedafterward and even persisted at various intervals, the treeline never returned to its previousboundary. In northeast Canada the black spruce forest limit of Quebec has remained stableduring the last 2000-3000 yr BP. Treeline advance or retreat is not easily triggered by climaticchange there, although the forest has become more open and patchy. The modern climate hasbeen too cold for viable seed production of the principal treeline species (black spruce), whichpersists by vegetative layering in the absence of fire. Following forest fires, black spruce arekilled, fail to reproduce either by seed or layering, and are locally eliminated in fire patches. Inrecent decades, milder winters have permitted stems that were restricted to snow height by coldand snow abrasion to emerge into the upright form, and scenario climates would permit viableseed production, which would likely result in infilling of the patchy forest-tundra border andpossibly begin seed rain onto the tundra. In the Polar Ural Mountains, larch reproduction isassociated with warm weather, and newly established trees have measurably expanded forestcover during the 20th century, although there is a time lag between climate warming and upslopetreeline movement.
13.0.5 Boreal tree growth under current and scenario climates
Across the boreal forest, climate warming in the last several decades is associated with bothimproved and decreased current (not projected) tree growth, depending on species, site type, andregion. Some tree growth declines are large in magnitude and have been detected at differentpoints across a wide area, although the total extent of declines has not been delineated.Temperature-induced drought stress has been identified as the cause of reduced growth in someareas, but other declines are not currently explained. Reduced growth by high temperatures iscommon in treeline white spruce of western North America, suggesting reduced potential fortreeline movement under a warming climate. Boreal forest tree growth is increasing in somelocations, generally where moisture and nutrients are not limiting such as boreal regions ofEurope and eastern North America. The 5 GCM scenarios produce climates that apparentlywould not allow the growth of commercially valuable white spruce types and widespread blackspruce types in Alaska and probably western boreal Canada, based on empirically calibratedmeasurements. The scenarios produce climates that would very likely be associated withsignificant increases in growth of the world’s northernmost forest on the Taymir Peninsula. Theupper range of scenario conditions represent climates that may have crossed ecologicalthresholds, and it is possible that novel ecosystems could result as happened during majorperiods of global climate change in the past. Decreased sea ice cover may alter moisture budgets.

Ch13 - Forests, Land Management and Agriculture ACIA Scientific Report
External Review January 2004 13–8 DO NOT CIRCULATE OR CITE
If additional moisture is available, trees on many of the driest sites would not be as stressed ascurrent temperature relationships indicate. Trees occupying sites that currently supply amplemoisture would likely experience negative effects.
13.0.6 Climate change and forest disturbances in the boreal region
Large-scale forest fires and outbreaks of tree-killing insects are naturally characteristic of theboreal forest, are triggered by warm weather, and promote many important ecological processes.The dominant control over direct fire emissions of gases is soil drainage (as defined by watertable), moss cover, and permafrost dynamics. Seasonal area burned in Canada is correlated withwinter sea surface conditions in the Pacific, but the correlation varies by provincial region andclimate regime. Boreal forests are a major storehouse of carbon in trees and soils, containingapproximately 20% of the world’s reactive soil carbon, an amount similar to that held in theatmosphere. On a global basis, atmospheric carbon equal to 15-30% of annual emissions fromfossil fuels and industrial activities is taken up annually and stored in the terrestrial carbon sink.During the years 1981-1999, it is estimated that the three major factors affecting the terrestrialcarbon sink were biomass carbon gains in the Eurasian boreal region and North Americantemperate forests, and losses in areas of the Canadian boreal forest. Particular characteristics offorest disturbance by fire and insects, such as rate, timing, and pattern of disturbance are crucialfactors in determining the net uptake or release of carbon from the forest to the atmosphere. Theevidence necessary to establish a specific climate warming effect on disturbance include: 1) agreater frequency of fire or insect outbreaks, 2) more extensive areas of tree mortality, and 3)more intense disturbance resulting in higher average levels of tree death or severity of burning.Some elements of the record of recent boreal forest disturbance are consistent with this profile ofclimate warming influence on disturbance regime when compared to the recent past, especiallyforest fires in some parts of Canada and Russia, and insect disturbance in North America.
13.0.7 Climate change and carbon cycling in the boreal forest
Carbon uptake and release at the stand level in boreal forests is strongly influenced by theinteraction of nitrogen, water, and temperature influences, acting together, on forest litter qualityand decomposition. A direct soil warming experiment confirms at least a short-term increase inNorway spruce growth from enhanced nitrogen mineralization as long as water is not limiting.Warmer forest soil temperatures that occur following the death of a forest canopy by disturbanceincrease the rate of organic litter breakdown, and thus the release of elements for new plantgrowth (carbon uptake). The most likely mechanism for significant short-term change in borealcarbon cycling as a result of climate change is the control of species composition caused bydisturbance regimes. Successional outcomes from disturbance have different effects on carboncycling especially because of the higher level and availability of nutrient elements (and thusdecomposition) in organic litter from broadleaf trees compared to conifers. Climate and forestdisturbance interact with each other in particular ways at both large scales and at small scales tocause specific outcomes of species changes in succession, with their resulting effects on carbonbalance. Net global land use/land cover change, especially aggregate increases or decreases inthe area of forest land, may be the most important factor influencing the terrestrial sink ofcarbon. Seasonal amplitude of net ecosystem carbon exchange in northern Siberian ecosystems isgreater in disturbed than undisturbed sites, due to increased summer influx and winter efflux.

Ch13 - Forests, Land Management and Agriculture ACIA Scientific Report
External Review January 2004 13–9 DO NOT CIRCULATE OR CITE
Winter respiration in disturbed sites can be as much as 1.7 to 4.9 times that in undisturbed sites.Disturbance had a larger effect on this seasonal amplitude than did either year-to-year orgeographical differences in growing season temperature. Increases in atmospheric CO2 levelsimprove the rate of growth of boreal trees (thus increasing the uptake of atmospheric CO2) whenother factors are held constant. When water and nitrogen remain available at the higher growthrates typical of enhanced CO2 environments, further carbon uptake is achieved. Broadleaf litterproduced under elevated CO2 conditions is lower in quality (less easily decomposed) thanregular litter because of lower nitrogen concentration, but quality of conifer litter in elevatedCO2 environments may not be as affected.
13.0.8 UV-B effects on crops and boreal forests
Different crops species, and even varieties of the same species can exhibit substantial variabilityin UV-B sensitivity. Dicotyledonous species such as peas and canola, may be more susceptibleto increased UV-B than cereals like barley. In susceptible plants, UV-B causes gross disruptionof photosynthesis, and but may also inhibit plant cell division. Determining the magnitude of theeffect of elevated UV-B levels is difficult, because interactions with other environmental factors,such as temperature and water supply, affect the crop's reaction and overall growth. Damage byUV-B is likely to accumulate over the years in trees. Evergreens receive a uniquely high UVdose in the late winter, early spring, and at the beginning of the short growing season becausethey retain vulnerable leaf structures during this period of maximum seasonal UV-B exposurewhich is amplified by reflectance from snow cover. Exposure to enhanced levels of UV-Binduces changes in the anatomy of Scots pine needles on mature trees similar to characteristicsthat enhance drought resistance, including smaller epidermal area and enhanced development ofthe cuticle layer. UV-B radiation plays an important role in the formation of secondary chemicalsin birch trees at higher latitudes. Secondary plant chemicals released by willows exposed to UV-B might stimulate the herbivore resistance of birch. A lower level of animal browsing on birchesbecause of this chemical change induced by UV-B could possibly improve the performance ofbirch over its woody plant competitors. When nutrients are added, silver birch exposed to UV-Bproduces secondary metabolites that are an efficient defense mechanism against animalbrowsing.
13.1 Overview of the Chapter
13.1.1 Relationship to ACIA Study Area
The Arctic Region as defined by the Arctic Council (see Figure 1#1; Chapter 1.3.1) encompassesdifferent elements of the boreal forest region. Productive boreal forests of northwest Canada andAlaska are included, while in eastern Canada mostly marginal treeline forests and woodland arefound within the ACIA Arctic boundary. Permafrost-free forests in the northern portion of theNordic countries are within the ACIA-defined Arctic, but across central and eastern Siberia thesouthern ACIA Arctic boundary follows the margin of sparse northern taiga and forest-tundra. Inthis chapter we have focused on this northernmost portion of the boreal forest region, but wehave broadened our consideration of the subject for two important reasons.

Ch13 - Forests, Land Management and Agriculture ACIA Scientific Report
External Review January 2004 13–10 DO NOT CIRCULATE OR CITE
First, many elements of the boreal forest are best understood as a whole, for example thegradients of changing tree responses to the environment as one travels from south to north. Thischapter includes an extensive and well studied Siberian transect that uses such an approach.Second, the 5 scenarios of climate changes that form the basis of the ACIA analysis wouldproduce levels of warming within the ACIA area that today can only be found in the borealforest region far to the south of Arctic. If climate warming of a magnitude similar to thesescenarios actually occurs, then the nearest analogs of climate, and eventually ecosystems, thatwould occupy today’s Arctic are those of more southerly boreal forest regions.
13.1.2 Plan of the Chapter
We first describe forest characteristics across the northern boreal world in order to provide thecontext to understand the importance of recent climate-associated changes in the region andpotential changes in the future. We next provide an overview of our analysis of the climatescenarios and describe how we used the scenarios in different aspects of assessment.
While many factors affect agriculture in the far north, such as changing markets, social trends,and national and international policies, we focus on the climate-sensitive aspects of cropproduction systems as they would be affected under the climate scenarios. We use climatestations representative of areas with agricultural production or potential. We then consider thechallenges that climate warming and climate change cause for the task of land management.
We next present a great deal of new information on the direct effects of climate on tree growth inthe northern boreal world, both in the long-term past and more recent past. We apply datagenerated by the scenarios to project how growth of selected tree species would be affectedduring the 21st century. We also identify key climate controls over large-scale increases in insectsthat damage trees, and provide some recent evidence of these effects.
Forest fire is another major indirect climate effect on the status of forests in the far north. Weexamine some of the climate-sensitive aspects of fire and possible future fire conditions andaffects. The climate-related changes in growth, insect-caused tree growth reduction or death, andfire are major factors that control the uptake and storage of carbon from the atmosphere. Theimplications of future climate changes for forest distribution are briefly considered. Finally, wesummarize some recent published information on the effects of increased UV-B radiation onboreal forest species.
13.2 Importance of the Boreal Forest and it relationship to climate
13.2.1 Global importance of the Boreal Forest
The boreal region covers about 17% of the earth’s land surface area (Bonan et al. 1992), with abroad zone of forest in a continuous distribution across the Eurasian and North American landmasses. The boreal forest can be defined as a belt of forest south of the tundra characterized byonly a small number of species of spruce, larch, pine, and fir among the conifers and a limitednumber of species of broadleaved trees, primarily birch and poplar (Table 13.1). From a largerlandscape perspective conifers characteristically dominate the boreal forest, although
Ch13 - Forests, Land Management and Agriculture ACIA Scientific Report
External Review January 2004 13–11 DO NOT CIRCULATE OR CITE
broadleaved trees can be locally dominant. Forest and woodland in the Arctic nations (excludingDenmark), the great majority of it boreal forest, covers about 1.2 billion ha out of the total globalforest area in 2000 of 3.9 billion hectares, or about 31% of the world’s forest. (FAO 2001, Table13.2) Russia’s forest (excluding woodland) area, the vast majority of it boreal forest, represents22.4% of the world total, the largest proportion of any nation in the world by far (Table 13.2).Two of the remaining 3 countries with the largest percent of the world’s forest also are Arcticnations.
Table 13.01. Scientific and common names of tree and woody shrub species referred to in thischapter.
Table 13.02. Total forest area and percentage of world forest occurring in nations that includeterritory in the Arctic.
The focus of this Chapter is the northern portion of the boreal forest, but many aspects of thetopic must be considered from a somewhat larger perspective. The boreal forest contains trees atthe highest latitude on earth, and along its northern margin it merges into the circumpolar tundra.The boreal region is the northernmost part of the world where agricultural crops are producedregularly on a significant scale and where settled agricultural way of life has historicalcontinuity.
The boreal forests of North America and Eurasia share some plant and animal species anddisplay a number of other similarities. The boreal forest of Russia and especially Siberia is oftenreferred to as taiga, a native word meaning literally “little sticks.” Taiga is generally accepted inthe English language as equivalent to the true boreal forest.
The boreal forest is both a subject upon which climate change acts, and a contributor to climatechange. Both of these perspectives are examined in this chapter. On a global basis, the existenceof large areas of boreal forest cover is a significant factor in warming the entire planet (Bonan etal. 1992). The rough-textured, dark surface of lands covered with boreal forest canopy interceptsand absorbs a high proportion of sunlight energy, converting it to heat (Bonan et al. 1992). Thesmooth, snow-covered surface of the tundra is highly reflective. In high latitude regions wheresnow covers the ground for half of the year or more the albedo (reflective) effect of tundraversus boreal forest cover is magnified. Future expansion of the forest into the tundra regions oftoday as a result of a warming climate would thus amplify the warming further.
Another important influence of the world boreal forest on climate is its influence on levels ofatmospheric carbon dioxide and other greenhouse gasses. Boreal forests take up CO2 in growth,and store in live and dead plant matter, including large long-term accumulations in large treeboles and in soil. Forest release CO2 to the atmosphere through decomposition of dead organicmatter, live plant and animal respiration, and combustion that takes place during fire. Bothnatural (e.g. fire) and human-caused (e.g. timber removal) disturbances are important influenceson the boreal forest. An ecosystem disturbance is simply a change in state or condition thatdisrupts the way in which the system has been functioning (photosynthesis, water regulation,etc.), causing it to reinitiate successional development. Disturbances vary by cause, rate,intensity, extent, timing, frequency, and duration.

Ch13 - Forests, Land Management and Agriculture ACIA Scientific Report
External Review January 2004 13–12 DO NOT CIRCULATE OR CITE
Management-related factors influence carbon uptake and storage in the form of tree mass. Thesemanagement practices include the re-arrangement of forest age classes by timber harvest orsuppression of wildfires, selection of tree species, fertilisation, and thinning regimes. Thecombined effect of all management actions can either enhance or reduce carbon uptake andstorage. For example, across the Russian boreal region for many years after logging the foreststhat regrow take up less atmospheric CO2 than nearby old-growth forests (Schulze 1999). In theBoreal-Cordilleran ecoregions of Canada it is estimated that total suppression of naturaldisturbances and their complete replacement by harvesting for maximum sustainable yield,would increase C storage in soils and wood products over a period of a century or two (Price1997). Direct climate effects that increase or decrease tree growth in natural forests alsoinfluence short-term uptake of atmospheric carbon.
The boreal forest and northern tundra together contain 40% of the world’s reactive (able todecompose to carbon dioxide, water, and mineral elements) soil carbon, an amount similar tothe amount of carbon held in the atmosphere (Melillo et al., 1993; McGuire et al., 1995b). Theextensive boreal forest plains of northeast Europe, western Siberia, and central and easternNorth America that are within or immediately south of the discontinuous permafrost regionoccupy the zone of maximum carbon storage in soil organic matter on the earth. Climate,interacting with human use and management of boreal forest, northern agricultural and tundraecosystems, could enhance the decomposition of carbon stored in soil organic matter and itssubsequent release into the atmosphere, thus compounding global warming caused bygreenhouse gases.
The boreal forest is one of the most intact major vegetation regions of the earth, but borealforest has been extensively converted to other land uses or severely damaged by air pollution insome parts of the boreal world such as Iceland and particular areas of Russia respectively.Boreal forests of Finland, Sweden, and Norway and parts of Canada are generally intensivelymanaged for timber production, and in such intensively managed stands tree age structure, treespecies, and spacing are controlled (see 13.3.4). However, huge areas of central and easternSiberia and northwestern North America represent the most extensive remaining areas of naturalforest on the planet (see: www.globalforestwatch.org). Not all natural boreal forests are made upof older trees. Large areas of natural boreal forest are burned or subject to insect-caused treemortality annually. Often climatic factors, especially climate warming, create the conditions forfire and insect disturbances in boreal forests. The boreal forest is subject to rapid changescausing long-term consequences from these climate-related agents of change.
The boreal forest is the breeding zone for a huge influx of migratory forest birds that performmany important roles (e.g. insect consumption, seed dispersal) in the boreal region and otherforests of the world during migration and winter residence in the south. Climate affects thepopulation level of these migratory birds and their food resources. Climate-associated processesalso determine the amount and quality of forest habitat available to the migratory birds.
During the years 1981-1999, three regions on the globe primarily affected the outcome of theterrestrial sink, by which atmospheric carbon equal to 15-30% of annual global emissions fromfossil fuels and industrial activities is taken up and stored (Myneni et al. 2001). The major net

Ch13 - Forests, Land Management and Agriculture ACIA Scientific Report
External Review January 2004 13–13 DO NOT CIRCULATE OR CITE
terrestrial carbon change came from biomass carbon gains in Eurasian boreal region and NorthAmerican temperate forests, and losses in some Canadian boreal forests. Some of the terrestrialbiomass change was a response to direct and indirect climate effects. But human use andmanagement of the boreal forest was an important factor as well, and could be a significantcontributor to planetary management of the carbon cycle. Certain forest biomass sinks can beused to meet national commitments for greenhouse gas emissions reduction under theFramework Convention on Climate Change. Land and resource managers in the Arctic andboreal region are interested in potential “carbon cropping” which might involve payments fromorganizations wishing to sustain or enhance carbon storage (Bader 2004). Mechanisms to placevalues on the various carbon transfers are not fully in place. However, if effective, exchangablesystems of placing values on transfers of carbon is adopted at an international level, borealforests could potentially generate a flow of wealth into the Arctic and Subarctic regions fromother parts of the world for boreal forest and land management treatments, offsets for emissionselsewhere, or decisions designed to store or retain carbon.
Uncertainties remain about the influence of the boreal forest on each of the key processes thatdetermine global carbon balance. For example, the uptake of atmospheric carbon dioxide by treeand other plant growth can be either increase or decrease with increasing temperature,depending on the species, the region where the growth occurs, the range of the temperature, andother climate factors such as precipitation that change with temperature. But great progress hasbeen made in recent years in understanding the response of elements of the boreal system totemperature. Across the boreal world a first generation of studies, models, databases, andmeasurements have provided a significantly better understanding of one of the earth’s mostextensive and important vegetation types as will be seen in this chapter. Continued andexpanded research and management data collection will provide a reasonable basis fordetermining the net contribution of the boreal forest to greenhouse gas balance and climate, thefurther changes a warming climate would induce in the boreal forest, and the agricultural andforest management opportunities available to the region.
13.2.2 Importance of the Boreal Forest to the Arctic
Trees occur on only a minority of the land surface within the ACIA Arctic study area. Even so,forests and woodlands of the ACIA study area are important on a regional basis within the Arcticfor several reasons. Where trees do occur they serve as indicators of more productive land-basedecosystems with longer growing seasons than treeless tundra. Trees, even when present in smallamounts on the Arctic landscape, offer additional resources for a variety of uses to Arcticresidents. Finally, some areas of full canopy forest within the ACIA Arctic region are generallythe most productive natural systems within the political jurisdiction where they occur. Specificreasons for the importance of boreal forest and agriculture in the Arctic would include thefollowing.
(1) Portions of the boreal forest devoted to forest products production are major factors innational economies of some Arctic nations. Although the current zone of optimumclimate for boreal forest growth is in the middle or southern boreal region, nearly allscenarios of climate change place the climatically optimum forest region within what istoday the Arctic region within a century or so.

Ch13 - Forests, Land Management and Agriculture ACIA Scientific Report
External Review January 2004 13–14 DO NOT CIRCULATE OR CITE
(2) Residents of the boreal region depend on the products and resources of the forest for avariety of ways of life, including traditional ways of life that have become impractical tofollow elsewhere on earth.
(3) Large volumes of wood are transported by the major rivers of the boreal region(Eggertsson 1994, Ott et al. 2001) into the Arctic, and this wood resource supportsecosystems that decompose the wood and feed organisms in rivers, oceans, and beaches.Climate changes will affect all the processes in this system, including tree growth,erosion, river transport, and wood decay.
(4) Wood transported into the Arctic has been an important resource for people in anaturally treeless environment during prehistoric times (Alix 2001) and is still a usefuland valued resource for many Arctic residents today.
(5) The boreal forest collects, modifies, and distributes much of the freshwater that entersthe Arctic basin (see Chapter 5.7 and Chapter 7), and changes in boreal forests producedby climate change would modify many of these important functions.
(6) Portions of the boreal forest region have experienced some of the greatest climatewarming of reported during the 20th century, and the responses of the forest system andthe societal consequences in the region provide lessons that may be useful to otherregions that could eventually experience similar change.
(7) Recent climate warming in the boreal region has increased the probability ofoccurrence of critical temperature thresholds for the production of existing agriculturalcrops. Possible future climate warming almost certainly would increase the land area onwhich crops could be produced successfully, and very likely the variety of agriculturalcrops that could be grown.
13.2.3 Overall climate features of the boreal region
The boreal region is often assumed to be a zone of homogenous climate, but in fact its climatesare surprisingly diverse. During the long days of summer, interior continental locations underpersistent high-pressure systems experience hot weather that facilitates extensive forest firesfrequently exceeding 100K ha. In maritime portions of the boreal region affected by air massesthat originate over the North Atlantic, North Pacific, or Arctic Oceans, summer daily maximumtemperatures are on average cooler than interior locations and seldom reach extremes.
Precipitation is abundant in the boreal zone of most of the Nordic countries, western Russia, andcertain coastal and mountain regions of western North America. By contrast in thetopographically complex landscapes of Alaska, northwest Canada, and central and northeastSiberia, precipitation becomes limiting to forest growth so that natural grasslands are part oflandscape.
Precipitation in western North America boreal region is influenced by storms of the southernBering Sea and North Pacific and reaches a distinct maximum in the late summer. In other partsof the boreal forest region precipitation is more evenly distributed throughout the year or evenreaches a winter maximum. East-central Siberia experiences low winter snow depths because thestrong Siberian High suppresses precipitation. The boreal landscapes of far eastern Siberia andwestern North America are mountainous whereas the topography of most of central and westernSiberia and eastern Canada is subdued. The mountainous boreal regions are characterized by
Ch13 - Forests, Land Management and Agriculture ACIA Scientific Report
External Review January 2004 13–15 DO NOT CIRCULATE OR CITE
sharply varying local climates (Pojar 1996) and associated aspect-controlled differences in foresttypes (Viereck et al. 1986). As a result, the forest/tundra boundary is much more irregular therethan on the plains of the central portions of the continents (Figures 13.01 and 13.02). All of thisregional climatic variation must be taken into account as a fundamental backdrop whenconsidering climate change and ecological response in boreal forests.
In both Eurasia and North America, neither the northern or southern boundaries of the borealzone are aligned at the same latitude east to west. The Icelandic Low and Aleutian Low deflectstorm tracks and advect relatively mild air masses northward as they approach the westernmargin of Eurasia and North America respectively. As a result the boreal forest belt is locatedconsiderably farther north in both the Nordic countries and in western North America than in thecenter of the continents (Figures 13.01 and 13.02). By contrast cold polar air flowing southwardfollows a persistent path along the eastern portion of both continents, and consequently theboreal forest belt reaches its southernmost limits there. In the center of the large Eurasian landmass, the latitudinal position of boreal forest depends mainly on the degree of continentality ofthe climate. The most northern forests in the world occur along the Lower Khatanga River incentral Siberia (72º32' N) where the continentality is higher than either western or easternSiberia. The warmer summer temperature in northernmost central Siberia is the critical factorthat allow trees to survive there despite extreme winter cold.
Figure 13.01 Distribution of boreal forest in Eurasia. Simplified system of three forestformations is used, representing a gradient of decreasing productivity and species diversityfrom south to north. Note the irregular boundaries in the mountainous east and Scandinavia,southward displacement of zones in the colder east, and far north position of forest-tundra incentral Eurasia.
Figure 13.02 Current distribution of boreal forest in North America. A simplified three classsystem of forest formation is used comparable to Eurasia. Note the irregular boundaries andnorthward displacement of boundaries in the mountainous west, and the southwarddisplacement of boundaries in the east. The area depicted in red represents a broad zonewhere the ratio of precipitation to evapotranspiration is nearly 1, and under 2 X CO2scenarios the environment is projected to become too dry to support closed canopy borealforest, and is converted to aspen “parkland,” a woodland formation (Hogg 1995).
13.2.4 Importance of climate variability in the boreal region
Essentially all of the boreal forest in Alaska is north of 60 degrees northern latitude, andpractically all the boreal forest of eastern Canada is south of 60 degrees (Figure 13.02). Theboreal forest region is particularly prone to climatic variability because minor variations in thesekey features of atmospheric circulation can either intensify the advection of warm air into thisnaturally cold region, or enhance the distribution of cold air southward through the region. Thereis some evidence that the climate system in the far north operates in a way that these positive(west of continent) and negative (east of continent) anomalies operate in synchrony with eachother. It appears that the intensification of meridional (north/south) air mass movement isespecially effective in warming the western margin of the North American Arctic while cooling

Ch13 - Forests, Land Management and Agriculture ACIA Scientific Report
External Review January 2004 13–16 DO NOT CIRCULATE OR CITE
the eastern margin of the continent (Figure 13.03) leading to east-west temperature anomalies inthe Arctic and boreal region (see also in Chapter 2, e.g. Figure 2.4.3, Chapter 5.6.C).
Figure 13.03. Opposite warm season temperature trends between large-scale North Americantreeline reconstruction (Jacoby and D’Arrigo 1989) and combined recorded data andreconstruction in central Alaska (Barber et al. 2004).
Periods of major climate change, including alternation between glacial and interglacialconditions, have repeatedly and drastically affected the northern regions of the planet (seeChapter 2.5). During the late Pleistocene, and several previous glaciations, what is today theboreal region was mostly covered with glacial ice; forest organisms were largely displaced southof the current limits of the region (Wright 1983, Wright and Barnosky 1984, Chapter 2.5). Therelatively small unglaciated portion of today’s boreal region contained different assemblages orcommunities of species in response to climates unlike any found today and was almost entirelytreeless (Anderson and Brubaker 1994).
Boreal forest vegetation of today characteristically has a large ecological amplitude, that is theability to survive across a wide range of environmental conditions. The paleoenvironmentalrecord as well as modern instrument-based measurements demonstrate major shifts intemperature regimes in this region even during the time forest has been present (see Chapter 2.5,13.6), and there are good reasons for believing that this wide range of possible temperatures is afundamental feature of the region. Rapid ands large changes in climate over the short term sendssignals through boreal systems for vital processes such as infrequent periodic tree reproduction(Juday et al. 2003). On the one hand, this high level of natural climate variability suggests thatduring periods of climate change, the effects are more likely to be detectable at an earlier time inthe boreal region than many other parts of the earth. On the other hand, a long and persistenthistory of climate variability in the region suggests that organisms in the boreal forests of todaymay be among the better adapted to climate change, because have been filtered by many climatefluctuations in the past. Because ecosystems quite unlike those of today have existed in the past(Wright 1983, Wright and Barnosky 1984, Anderson and Brubaker 1994) in the region, majorclimate change in the future would be likely to produce ecosystems unknown today.
The simultaneous pattern of temperature and precipitation anomalies can have importantecological impacts in forests of the north. Wildfire in the boreal forest is the product of short tomedium term warm and dry conditions, usually associated with high pressure dominance nearthe long days of the summer solstice (Johnson 1992). Alternating periods of warm and dry versuscool and moist summer climate in central Alaska regulate the growth and reproduction of whitespruce, ultimately providing a mechanism to synchronize the production of seed crops to timeperiods immediately following major forest fires (Barber et al. 2000, Juday et al. 2003). If futureclimate changes alter not just the mean of climate parameters but the pattern of alternatingwarm/dry and cool/moist conditions, the resulting climate pattern could interfere with thereproductive success of one of the major North American conifers. This example indicates thepotential for subtle influences to be major factors in climate change effects.
13.2.5 Unique influences of the forest on climate in the boreal region
Ch13 - Forests, Land Management and Agriculture ACIA Scientific Report
External Review January 2004 13–17 DO NOT CIRCULATE OR CITE
The Boreal Ecosystem-Atmosphere Study (BOREAS) was a large-scale internationalinterdisciplinary experiment in the northern boreal forests of Canada that began in 1993. Its goalwas to understand how boreal forests interact with the atmosphere, how much carbon dioxidethey can store, and how climate change will affect them.
Albedo (surface reflectivity) measurements in BOREAS are among the lowest ever measuredover vegetated regions. BOREAS measurements indicate that the boreal forest (especial blackspruce dominated forest) absorbs nearly 91% of the sun's incident energy (Hall et al. 1996).BOREAS found that in terms of the water and energy balance, the boreal ecosystem oftenbehaves like an arid landscape, particularly early in the growing season. Even though the mosslayer is moist for most of the summer, nutrient-poor soils and limiting climatic conditions resultin low photosynthetic rates, leading to low evapotranspiration. As a result, relatively littlemoisture is transferred to the atmosphere, compared to what is available. Much of theprecipitation simply penetrates through the moss layer into the soils, which are permeable, thenencounters the underlying semi-impermeable layer and runs off. Most of the incoming solarradiation is intercepted by the vegetation canopy, which exert strong control over transpirationwater losses, rather than by the moist underlying moss/soil surface. As a result, much of theavailable surface energy is dissipated as sensible heat, which often leads to the development of adeep (3000 m) and turbulent atmospheric boundary layer.
BOREAS also found that coniferous vegetation in particular follows a very conservative wateruse strategy. The vegetation transpiration stream is drastically reduced by stomatal closure whenthe foliage is exposed to dry air, even if soil moisture is freely available. This feedbackmechanism acts to keep the surface evapotranspiration rate at a steady and surprisingly low level(less than 2 mm/day over the season). The low evapotranspiration rates coupled with a highavailable energy during the growing season can lead to high sensible heat fluxes and thedevelopment of deep planetary boundary layers, particularly during the spring and early summer.These planetary boundary layers are often characterized by intense mechanical and sensible heat-driven turbulence.
13.3 Extent of the boreal forest and land tenure and management in the boreal region
The influence of climate change on forests values and forest users depends on the amount andinitial condition of the forest resource and the uses that the peoples, cultures, and economiesmake of the forest or the intangible values of the forest for them. This section reviews the extentof forest, the overall allocation of forest land to different uses, the main patterns of forest use, themanagement systems, and the values generated by the boreal forest. Where these characteristicscan be singled out by political jurisdiction or other means, the discussion is focused on thenorthern boreal forest. This discussion is the basis for considering climate change impacts.
13.3.1 Russia
(Footnote: Data from: http://www.forest.ru/eng/basics/)Russia contains the largest area of forest of any nation, amounting to an estimated 763.5 millionhectares, although some doubt remains concerning the origin and accuracy of this figure. (Basicstatistical figures from Russian Forest Fund, January 1993-published in 1995). The boreal forest

Ch13 - Forests, Land Management and Agriculture ACIA Scientific Report
External Review January 2004 13–18 DO NOT CIRCULATE OR CITE
of Russia can be thought of as three roughly parallel belts of southern taiga and middle taiga,sparse northern taiga, and in the farthest north a forest-tundra region extending to the completelytreeless tundra (Figure 13.01). Dominant components of the Russian boreal forest change acrossRussia from spruce in the west (European Russia) to larch in the center and east, to pine atvarious localities (Figure 13.04A). In Northern Eurasia, especially in central Siberia (Figure13.04B) and the Far East as much as to 70-75% of taiga forests appear to be close to a naturalstate. The remaining forests consist of fragments and other human-influenced forest and areasdominated by marsh-bog complexes.
Figure 13.04A. Forest species cover types of Russia. The area of central Eurasian transect(Krasnoyarsk Kray Region) is outlined.
Figure 13.04B. Vegetation zones and forests of northern central Asia. Zones: A - Arcticdesert; _ - Tundra; _ - Forest-Tundra; D - Northern open forest; E - Northern Taiga; F –Middle Taiga; G - Southern Taiga; H – Subtaiga; Forest-Steppe (grassland), and Steppe(grassland); I - Mountain Taiga; Species: 1 - pine; 2 –spruce, fir, cedar; 3 - larch; 4 -birchand aspen; 5 - others; 6 - non-forested. (From: Institute of Forests, Siberian Division,Krasnoyarsk, Russia).
The Federal Forest Service of Russia manages about 94% of the total forest land area in Russia,with another 4% belonging to agricultural organizations, 1% to the Committee of EnvironmentProtection and 1% to other state bodies. The central and especially the southern taiga zones havea long history of quite intensive land use. Although large untouched areas are rare or absent evenin northern European Russia, a much greater proportion of these forests exist in a natural statethan in similar vegetation zones in Nordic countries. The Karelian Isthmus region in the St.Petersburg Oblast is a good example. The forests of the Green Belt along the Finnish-Russian(Karelian) border are one of the most important centers of boreal biodiversity in Europe. Manyspecies in the Red Data Book (endangered) lists for Sweden and Finland still exist in relativelyhealthy populations in northwest Russia. Disruption or decline in the ecological health of theseremnant natural forests in Russia by climate warming would have severe implications for thesurvival, at the least within Europe, of the listed species.
Economically exploitable forests may total about half of the forested areas under state forestmanagement in Russia, generally in the southern taiga. The northern boreal forest of Russia isgenerally too distant from transportation infrastructure and consumption centers to repay thecosts of timber removals. The Russian forest sector is a major employer, probably totaling 1.8million people in the mid and late 1990s. However, during the 1990s public sector forestmanagement organizations often did not have enough money to retain employees, fight forestfires, enforce logging regulations, or make periodic inventories. A slow recovery of public sectorcapacity has begun in more recent years.
A reform of 1993 (Basic Forest Law) started a movement towards market transactions in thissector. The Basic Forest Law allows forest leasing and auctions of standing timber, and forestleasing is the main market mechanism currently in use. In the early 1990s rapid and
Ch13 - Forests, Land Management and Agriculture ACIA Scientific Report
External Review January 2004 13–19 DO NOT CIRCULATE OR CITE
unsustainable cutting of old-growth and mature forests began. After 1996 changes in forestmanagement policy and better information resulted in a slowing of the pace of timber cutting inold-growth forests. The new Forest Code of the Russian Federation was issued in 1997. TheRussian forest management system uses the term Forest Fund. It simply means all forest andrelated lands under governmental jurisdiction, which in practice is nearly all the forest. Thedominant part of the Forest Fund was (and still is) under management of Russian Federal ForestService (Rosleskhoz), although some other organizations now own or manage small areas offorests in Russia.
For management purposes, Russian forests have been divided into three categories based oneconomic and ecological characteristics. The first category comprises forests with a protectivefunction, e.g. watershed forests (20% of forested land), which are available for intermediate andsanitary tree fellings and small (maximum size 10 hectares) clear-cutting. The second category ismade up of forests in inhabited areas and forests with low productivity (5.5% of forest area). Thevast majority of the forest (74.5%) is included in category three, industrially exploitable forests,where clear-cutting (up to 50 ha) is the main management practice. In addition to managingnearly all Russian forests, Rosleskhoz is also responsible for about 20% of the logging, in theform of intermediate and sanitary logging. Climate change impacts that disturb forest cover incategory one and two forest would impose extra costs on managers, local governments, andforest users to stabilize or recover forests. In category three forest, actual or potential forestproduct values are at risk from climate change. However, because of the economicinaccessibility of the majority of this forest in the northern taiga, direct losses might be relativelysmall overall.
As of 2000s the Russian Federation had 99 state zapovedniks, or strict scientific nature reserves,totaling 31 million ha or 1.82% of Russia's territory. (Ostergren and Shvarts 2000). Zapovedniksgenerally meet category I criteria of the IUCN classification of protected areas. During the 1990sRussia established 35 national parks totaling 6.8 million ha (0.40% of Russia's territory). Thereare plans to establish additional zapovedniks and parks. (Colwell et al. 1997). Practically all thenational parks are located in Forest Fund areas and are managed by the state forestry authorities.These areas are managed for a range of scientific and biodiversity values, and the main concernsare climate changes that could reduce the chances for survival of the protected species orecosystems.
The forests of Russia are an important component of the planetary regulation of atmosphericcarbon because of the extensive area of forest land and the high storage of carbon in cold soils.In consideration of its extensive and significant forest resources, Russia has obtained substantialcarbon emission credits under its participation in the Kyoto Protocol on greenhouse gasses.Fulfilling the potential of Russia’s forests to meet these goals will require sustaining, and tosome degree rebuilding a land management capability over a vast area with certain fundamentalcapabilities – forest inventory and measurement, surveillance and detection of forest healthproblems, trained and deployable fire control and management forces, and various resourcemanagement specialists. Many of the benefits of increasing carbon sequestration in the forest ofRussia can be obtained as a direct result of actually implementing policies that are widely agreedas rational and beneficial (Shvidenko et al. 1997), including measures such as harvest levels in

Ch13 - Forests, Land Management and Agriculture ACIA Scientific Report
External Review January 2004 13–20 DO NOT CIRCULATE OR CITE
line with actual growth, effective fire control forces in regions of high value timber, adequateregeneration effort, and others.
13.3.2 Canada
(Footnote: Sections 13.3.2 and 13.3.4 are adapted from:http://www.borealforest.org/world/world_management.htm)
The Canadian boreal forest represents nearly 6.4% of the world’s forest area. Forests covernearly half the Canadian landscape, totaling about 245 million hectares, and about 46% of theforests of Canada are commercially valuable. Forests play a large role in the Canadianenvironment, economy, culture and history. The large majority of Canadian forest is crown landheld for the public, with 71% controlled by the provinces and 23% under federally control(Natural Resources Canada 2003). A few percent of Canadian forest land is managed byterritorial governments and the balance is in private hands. Of the 417.6 million hectares offorest in Canada, 22.8 million (5.5%) are by law managed to remain in a natural state. Onanother 27.5 million hectares (6.6%) timber harvesting is excluded by administrative policy, forexample on unstable soils or as habitat buffers along important lakes or rivers. Commercialforests managed for the production of wood products and other benefits such as recreation,wildlife, and other products cover 235 million hectares (56.3%). Of the commercial forest, 119million hectares (28.5% of the total forest area) is managed primarily for timber production,while the remainder has not been definitively allocated as to use. The balance of the forest landbase is made up of open forests comprised of natural areas of small trees, shrubs and peatlands. In the Canadian land tenure system, provincial governments are responsible for managing mostof the land within their boundaries held for the benefit of the public (crown land). Until recentyears land north of 60 degrees (an area not organized into Provinces) was held and managed bythe federal government. But in the area north of 60 degrees, by progressive steps, ownership anddecision-making responsibility are passing to aboriginal people and Territorial governments.Simultaneously lands of major conservation interest are being established as new national parksand wildlife refuges managed by the federal government. The Aboriginal people of Canada, whomeet their cultural, spiritual and material needs from their forest homeland, have a uniqueperspective and set of goals in forest management. Canadian land and forest management haschanged significantly and likely will change further as aboriginal title, Treaty rights, and thegovernment’s responsibility to protect these rights are all more specifically defined. The large majority of Canadian forest is boreal, with species such as white spruce, black spruce,aspen, and paper birch having essentially transcontinental distribution. The forests of Canada arenaturally dynamic, with disturbances at large scales quite typical. Across all forest types ofCanada, 18.6 million hectares were affected by insect defoliation in 2002 (Natural ResourcesCanada 2003). Section 13.10.2 describes the role of disturbance in of the boreal forest withrespect to carbon in greater detail, and Section 13.8.1 describes the role of forest insectdisturbances in the boreal forest. In the late 1990s over 300 communities in Canada depended largely on jobs in the forestrysector. In that time period the wood and paper industries and associated organizations employed

Ch13 - Forests, Land Management and Agriculture ACIA Scientific Report
External Review January 2004 13–21 DO NOT CIRCULATE OR CITE
more than 830,000 people, and paid more than $11.1 billion in wages annually. In 2002 directemployment in the forest industry was 361,400 (Natural Resources Canada 2003). HistoricallyCanada has been one of the world's largest suppliers of wood and paper products, with 1995shipments of manufactured forest products valued at $71.4 billion. Forest products exports fromCanada contributed $32.1 billion to the country's net balance of trade in 1996 - almost as muchas energy, fishing, mining and agriculture combined. Canadian forests also contribute to uses andsupport industries providing billions of dollars in sales, including recreation, tourism, naturalfoods, furs, Christmas trees and maple syrup. Much of the rapidly increasing recreation activityis forest-based. The number of visitor-days to forested national parks was 29.7 million in 1994. Timber is harvested from about one million hectares of forest land in Canada annually, or lessthan 0.5% of the total commercial forest area. Allocations of timber resources are based on long-term goals of land use and forest management established in forest plans, and regional analysesand estimates of wood supply. On public (Crown) lands, tenure arrangements with forestcompanies or communities to harvest timber are usually issued through contracts or licenses.Recent changes to legislation and tenure arrangements include provisions to license theharvesting of other forest resources such as blueberries or mushrooms. All harvest activities mustalso complement or integrate management objectives for wildlife, water, subsurface resources,hydroelectric energy and transportation. The northwestern Canadian boreal forest of northernAlberta and British Columbia, and southern Northwest Territory and Yukon Territory are the lastregions of Canada to experience large scale forest products harvest, beginning primarily in the1980s. The installation of wood products processing facilities stimulated the expanded harvest inthe northwest Canadian boreal forest, and under the leasing system large areas that are currentlyprimary forest are now committed to being harvested eventually. The new emphasis in Canadian forest management typically includes the identification ofobjectives for the conservation of forests as a source of economic wealth, of habitat for wildlifeand fish, of gene pools for biological diversity, and of water and carbon. Climate change callsinto question the ability to adequately forecast future forest condition and growth and thusconduct meaningful planning. However, Canadian forest land managers are considering how todeal with climate change effects with specifically adapted silvicultural techniques formaintaining forest health, managing declining stands, regenerating disturbed areas with desiredgenotypes and species, and assisting in species migration (Parker et al. 2000). Because of the large share of productive forest resources under Canadian provincial jurisdiction,an important source of leadership in developing coordinated forest policy has been the CanadianCouncil of Forest Ministers (CCFM), made up of the principal forestry official of the provinces.Faced with public concerns about the extent of timber harvesting, and in response to the 1992National Forest Strategy and UN Conference on Environment and Development (UNCED), theCCFM developed a framework of criteria and indicators to define and measure progress towardssustainable forest management, in consultation with the entire Canadian forest community. Theframework reflects the values of Canadians and identifies the forest features and uses they wantto sustain or enhance, and including indicators of environmental, social and economic health. Canada and 11 other countries have collaborated in the development of criteria and indicators forthe conservation and sustainable management of boreal and temperate forests outside Europe

Ch13 - Forests, Land Management and Agriculture ACIA Scientific Report
External Review January 2004 13–22 DO NOT CIRCULATE OR CITE
(known as "the Montreal Process"). Climate change adds major uncertainty to basic assumptionsabout future forest condition, growth, and uses that are critical in making decisions in thepresent. For example, current forest harvest levels developed to meet the test of sustainabilitymust be based on projections of future forest growth and mortality. A major climate shift wouldalter these factors in ways not fully understood but quite likely to be disruptive. So the dilemmais actually now, in deciding what forest activities should be allowed today based on an assumedfuture in which climate change outside the range experienced in previous planning horizons maybe having an effect.
13.3.3 U.S.A. (Alaska)
Alaska is by far the largest state in the U.S.A., occupying about 20% of the area covered byremainder of the nation and an area greater than the Nordic countries combined. The twodifferent types of forest found in Alaska are (1) coastal rainforest in southeast and southcentralAlaska, and (2) the boreal forest of northern and interior Alaska. The coastal forest in Alaskacovers about 5 million hectares, but the most productive areas of this forest type are south of theACIA-defined Arctic. However, much of southcentral Alaska is either coastal forest or aboreal/coastal forest transition and is within the ACIA boundary. The amount of land in theboreal region of Alaska that supports at least 10% forest cover is about 46 million ha, or 41% ofthe state. Statewide, about 6.4 million hectares or 16.3% of total Alaska forest land is classifiedas “productive” forest: that is, land capable of an average growth rate of 1.4 cubic meters perhectare per year (Labau and van Hees, 1990). Even less of the Alaska boreal forest, 12% or 5.5million ha, is considered productive commercial timberland (Labau and Van Hess 1990).
Of the 114 million hectares that make up Alaska, the federal government owned over 95% untilAlaska was admitted (established) as a state in 1959. The state government was granted the rightto eventual ownership of 32 million hectares (28% of Alaska) as a condition of statehood. Todate the state of Alaska has received 27.4 million hectares (85%) of its entitlement. Under termsof the Alaska Native Claims Settlement Act, Alaska Native corporations are entitled to receive13.4 million hectares (11.7% of Alaska), and most of that land has been conveyed. Individualprivate land owners have only about 0.6 million hectares (0.5% of Alaska). With the passage oftime the private individual ownership category will slowly increase, based on government landsales and transfers. The federal government retains nearly 68 million hectares in Alaska (60% ofthe state), including about 6.0 million hectares in national parks and 23.7 million hectares innational wildlife refuges.
National parks and wildlife refuges generally preclude resource development, but there are a fewexceptions. In some circumstances petroleum development can take place on wildlife refuges,and activities of native residents to obtain resources such as houselogs and fuelwood, or poles forfishtraps may occur in national parks. Taking all federal land designations together, andincluding other protected land such as state parks, Alaska has probably the highest percentage(about 40%) of its surface area devoted to strict protection of natural habitats in the world. Atleast 25% of Alaska’s productive boreal timberland is reserved by law from forest harvest, andprobably a similar amount is reserved by administrative policy (Labau and van Hees, 1990).Climate change effects for this strictly preserved land base, are likely to involve primarily thetemporary reduction or increase in the amount of certain species from land cover change.

Ch13 - Forests, Land Management and Agriculture ACIA Scientific Report
External Review January 2004 13–23 DO NOT CIRCULATE OR CITE
Because of the intactness and extent of these ecosystems, even following large-scale climatechange, species survival prospects are enhanced. The prescription offered by conservationbiologists that best equips species to withstand major movement of optimum climate zones is tomaintain large-scale, topographically diverse landscapes with naturally functioning ecosystems(Markham and Malcom 1996). Such a strategy preserves complete gene pools, specially adaptedecotypes, and provides maximum opportunity for natural migration and disturbance recovery.The current boreal forest is largely the result of such adjustment by the biota to the many cyclesof glacial and interglacial climate changes during the Pleistocene. The current land allocationsituation matches the conservation biology prescription for climate change resilience better inAlaska than in almost any other major forest region of the world.
Alaska’s boreal forest is used currently for a variety of economic, subsistence, recreational,scientific, and other purposes. Local-scale logging has been a traditional use for much of the 20thcentury. The boreal region has only small-scale wood products facilities, mainly small sawmillsand facilities to manufacture specialty products such as houselogs and birchwood items.Employment in forest products manufacturing industries, mostly in the coastal region, peaked in1990 at just under 4,000, constituting 1.4 percent of total Alaska employment in that year (U.S.Bureau of Economic Analysis, unpublished data, and Goldsmith and Hull, 1994), but is onlyabout 650 today. In the 1990s the two major wood products manufacturing facilities (pulp mills)in the state, which were supplied from long-term (50-yr.) contracts, permanently stoppedoperations. Much of the current economic activity associated with the Alaska boreal forest isgenerated simply by the basic activities of exercising the rights and responsibilities of ownership.These activities include forest inventory, monitoring conditions and trends, wildland firemanagement, administration of access and permits for use. Those administrative activities willoccur under any scenario for the future, although they might need to be intensified under certainconditions that could be caused by climate change.
In Alaska, there are so few roads that timber removals generally must meet the costs of buildingor extending surface transportation routes. Much of the productive forest is distributed inscattered small stands across large landscapes. As a result, productive timberland is, with a fewexceptions, not economically reachable. If low-cost forms of access, such as winter roads onfrozen ground, can be used then the area of forest with positive stumpage value also increases. Awarming climate decreases the amount of time when winter access is safe on ice bridges andfrozen winter roads (see Chapter 15, Figure 15.4.2). Even a small amount of additional warmingwould initiate thawing of permafrost across a sizeable portion of the interior boreal region,severely disrupting the ground surface and causing widespread death of existing forest cover (seeChapter 15). Over the long term, however, sustained climate warming eventually would expandthe productive forest area significantly (Juday, et al., 1998, p. 25).
The contributions of Alaska forests in providing subsistence food, fuel, and building materialsand indirect ecosystem services, generally not measured by dollar flows, are very important inAlaska and probably exceed values from commercial timber operations in most of its borealregion. Alaska forests contribute ecosystem services especially important to the cash economyby providing commercial fisheries, sport hunting and fishing, and values of non-consumptiveuses of the forest involving tourism, recreation, and enhancement of the quality of life. Scientificresearch is one of the most important of the current uses of the Alaska boreal forest, with climate

Ch13 - Forests, Land Management and Agriculture ACIA Scientific Report
External Review January 2004 13–24 DO NOT CIRCULATE OR CITE
change effects and carbon cycle investigations as major topics of continuing interest.
Over one million nonresident tourists visit Alaska annually, and the number of tourist visits hasincreased steadily over the last decades (Alaska Division of Tourism, unpublished data). Forestscreate specific scenic resources for major segments of the tour industry, including cruise shipsand state ferry routes in Prince William Sound, and near the rights of way of the Alaska statehighway system and the Alaska railroad. Beginning in the 1990s large-scale insect-caused treedeath or injury related to climate warming was observed along several of the most popular andheavily traveled tourist routes. Recreation continues in those areas, but the quality of theexperience for some visitors has been reduced.
If the assumption is made that demand and prices will rise and the public will allow expandedtimber cutting under certain circumstances, then the size and economic value of the Alaskaforest products sector would likely increase, and thus the risk of harm to it from climate changewould be greater. If the assumption is made that access will continue to be expensive(prohibitive), that manufacturing cost disadvantages in Alaska will persist, and that publicattitudes about expanded timber cutting on the public lands is negative, then the size andeconomic value of the Alaska forest products sector will likely remain at current (historicallydepressed) levels or even decline further, limiting the magnitude of exposure to risk fromclimate change (Berman et al. 1999).
Much of recent Alaska forest management has been described as "opportunistic", that is takingadvantages of other events or projects to build programs and capabilities. But as inventory dataaccumulated, publicly built access systems expanded, and new scientific insights and datahandling tools became available in Alaska, professional forest managers anticipated they wouldbe able to set and accomplish goals more systematically. However, the increased uncertaintyassociated with climate change that has already been experienced in Alaska makes long-termforest planning and management considerably more difficult. Already it is not clear that there isa reasonable probability that the cost of planting or regenerating certain stands in certain regionscan be recovered in future forest harvest because of higher risk from climate-triggered insectoutbreaks (see 13.8.2) among other factors already obvious on the landscape.
13.3.4 Fennoscandia
Finland, Sweden, and Norway have certain features in common. These nations extend from atleast 60 degrees latitude (or further south) to north of the Arctic Circle. Across that north-southdistance these nations encompass north temperate deciduous or transition forest and an entiregradient of the boreal forest to treeline and tundra in the north. Despite their northerly location,the climate of the region is the warmest at equivalent latitude in the circumpolar world, due tothe strong influence of the Atlantic Gulf Stream. Annual precipitation varies from 1,500 mm orgreater in the west of Norway receiving the strongest Gulf Stream influence, to 300 mm in thenortheastern portions of Finland. The growing season lasts 240 days in the south and 100 days inthe north. Mean temperatures range from 14-17°C (58-62°F) in July to between +1 and -14°C(32- 7°F) in January-February. The combination of relatively mild temperatures and a deep,dependable snowpack which insulates the ground even in the coldest northern areas means thatpermafrost is practically absent in forest regions.

Ch13 - Forests, Land Management and Agriculture ACIA Scientific Report
External Review January 2004 13–25 DO NOT CIRCULATE OR CITE
Most of Sweden and Finland are characterized by relatively even topography and are less than300 m above sea level. In the west, mainly in Norway, the Scandinavian mountain range reachesheights of 1,000-2,000 m above sea level. These mountain peaks are not forest-covered. Thetreeline varies from 700 m above sea level in the southern portion of the mountains to 400 m inits northerly portion.
In northern portions of Fennoscandia (and the adjacent Kola region of Russia), the Sami (Lapp)people pursue reindeer husbandry in forest lands on the basis of ancient rights. The Sami arelegally entitled to use lands that belong to others in order to feed and protect their reindeer herds.Sami earn their living from reindeer breeding, and reindeer move through different areasthroughout the year. The forest owners affected by the herds are under a mandate to cooperatewith Sami communities to ensure that reindeer can obtain their life cycle requirements. However,because these rights are exercised across four national jurisdictions, legal systems, and boundarycontrols traditional flexibility is hindered (see Chapter 11.3). This jurisdictional complexityworks against adaptability of the herding system that would be desirable in response to climatechange.
Due to the generally low buffering capacity of forest soils in the Fennoscandian region, a highlevel of air pollution-mainly originating abroad-has resulted in widespread soil acidification.Leaching of mineral nutrients has reduced soil buffering level by as much as half in recentdecades. High levels of acid deposition, both sulfur oxides and nitrogen oxides, represent futurerisks to growth and health of forest ecosystems. However, overall the measured rates of growthof managed and tended stands have increased considerably, which might be due at least partiallyto the N-input.
13.3.4.1 Finland
Finland is Europe's most heavily-forested country, with sixteen times more forest per capitathan the European average. Forests as defined by the UN Food and Agriculture Organization(FAO) cover 23 million hectares or 74.2% of the land area. Finland's forests have beenintensively harvested over the last few decades. Despite an active program of harvest and thereduction of national territory after the Second World War (territory Finland ceded to the SovietUnion contained over 12% of its forest area and about 20% of the best saw-timber stands),Finland’s reserves of wood volume are now greater than during the 20th century, and continuingto increase. Today the annual aggregate wood growth in Finland is about 75 million cubicmeters, while around 60 million cubic meters or less are harvested or die of natural causes. Ofthe total logged area, regeneration felling accounts for roughly one third and thinning two thirds.
In the boreal region the most common trees are Scots pine, Norway spruce, silver birch anddowny birch. Usually two or three tree species dominate a given stand. Naturally pure pinestands are found in rocky terrain, on top of arid eskers and on pine swamps. Natural sprucestands are found on richer soil. Birch is commonly found as an admixture, but it canoccasionally form pure birch stands. About half of the forest land area consists of mixed stands.Various kinds of peatlands are also an important part of the Finnish landscape. Originally, aboutone third of Finland was covered by peatlands. Many peat areas have been drained for farming,

Ch13 - Forests, Land Management and Agriculture ACIA Scientific Report
External Review January 2004 13–26 DO NOT CIRCULATE OR CITE
forestry, and peat extraction purposes. Bog drainage reached a peak in the 1970s, when nearlyone per cent of the country's total land area was being drained each year. About half of theoriginal peatland area has been preserved in its virgin state.
The Finnish forest is nearly all intensively managed. In the 20th century, foresters favoredconifers, especially pine, at the expense of other species. As the oldest generations of trees havebeen felled the average tree age in the forest has become younger. Forest stand treatments andforest roads have fragmented large contiguous wilderness areas, and forest fires are largelyprevented. Managed commercial forests of this kind now cover more than 90% of Finland'sproductive forest land. About 40% of all endangered species of Finland are dependent on olderage classes of natural forest (Parviainen 1994). Any climate change effects (intensifiedphysiological stress, fire) that disproportionately affect the remnant of older forest will havelarge impacts on survival of the rare elements of biodiversity.
With the implementation of new forest management and protected area programs, thecontribution of forest harvest and management to species endangerment will diminish. For themoment, however, forestry is still a greater threat to the preservation of species than any otherhuman activity (Esseen et al. 1992). One reason for this is that about half of the plant, animaland fungus species found in the country live in forests. Of the various factors reducingbiodiversity attributable to forestry, the most important is the rarity of larger, old trees - bothdead and live (Esseen et al. 1992). Specialist organisms such as arboreal lichens, wood-rottingfungi, and mosses and invertebrates have declined with the large old trees, snags, and logs.
Finland has 35 national parks that cover 8150 km2. Together with other nature reserves, thetotal protected area amounts to approximately 29,000 km2 or about 9% of the total land area ofFinland. The Finnish government adopted a special protection program for old-growth forests in1996 and for broadleaf woodland in the late 1980s. There are ten programs designed to protectvarious types of natural features and areas. The goal is to extend protection to over 10% of thenational territory. As of March, 2003, about 3.57 million hectares of land to be protected hadbeen identified. About 2.7 million hectares had been included in the programs by the beginningof 1999. Protecting habitats either totally or partially from human activities is the main strategyto recover endangered species and encourage biodiversity. In the case of forests, this mainlymeans protecting the remaining old-growth stands of both conifer and broadleaf forest growingon rich soil as public reserves, because these are the habitats that have been declining mostrapidly. There are elaborate arrangements for consultation with landowners during the planningstages of protection programs. This process of consultation was followed when the areas forinclusion in the Finnish Natura 2000 scheme were being designated. The largest category ofprotected areas is wilderness in Lapland. Wilderness areas, established by the FinnishParliament, cover about 15 000 km2 of forest, treeline and tundra habitats. Although strictlylimited, some forest cutting is permitted in some parts of these wilderness areas.
Most of Finland's highly-productive forests, especially those in the southern and central parts ofthe country, are privately owned. Nearly 60% of the Finnish forest is privately owned and one infive people in the country belongs to a forest-owning family, including a broad spectrum of thepopulation. The average size of a private forest holding is 30 hectares. Most of the forest in
Ch13 - Forests, Land Management and Agriculture ACIA Scientific Report
External Review January 2004 13–27 DO NOT CIRCULATE OR CITE
Lapland is publicly owned, and as a result in the north forests have been managed moreuniformly and on a larger scale than those elsewhere.
Until the mid to late 1990s, one third of the Finland’s export earnings come from forests, andthe forest products industry as a whole was second only to metal products as an export sector.The economic activity (turnover) of the forest sector was roughly EUR 23.5 billion;management activities contribute EUR 1.7 billion, the forest industry EUR 17 billion, andmachines and other equipment EUR 5 billion. Finland's share of the total value of global exporttrade in forest products was about 7.6 %. Forest management and the forest industry employedabout 100,000 people, the rest of the sector about 50,000 people. There are about 100,000timber sales deals made every year between forest owners and forest industry companies.
An environmental program for forestry was adopted in 1994 based on forest-related principlesapproved at the UN Conference on Environment and Development in 1992 and the 1993 generalprinciples for sustainable forestry adopted by European forest ministers in Helsinki. The goal ofFinnish forestry has become ensuring a sustainable economic return as well as preservingbiodiversity and facilitating multiple use of forests. Management practices strongly altering theenvironment such as bog drainage, deep plowing of forest soil, and use of herbicides to killundergrowth have been almost totally abandoned. Habitats of importance for preservationbiodiversity preservation have been excluded from timber operations, and both living and deadtrees are now routinely left in cutting areas to support biodiversity. Natural regeneration of treeshas increased in importance relative to planting nursery-grown seedlings and more attention ispaid to preserving forest landscapes.
The Government of Finland adopted a National Forest Program (NFP) in March 1999. TheNFP's goals are to increase the industry's annual consumption of domestic wood by 5-10 millioncubic meters by 2010, double the wood processing industry's export value and increase theannual use of wood for energy to 5 million cubic meters. The Finnish government, incollaboration with forest industry, will also ensure competitive conditions for the forestindustry, such as supplying energy at a competitive price, and launch the technology anddevelopment programs needed for promoting the wood processing industry and wood-basedenergy production. In addition to wood product utilization NFP recognizes and promotes otherforest uses, including hunting, reindeer husbandry, wild mushroom and berry picking, scenicand cultural values, recreation and tourism.
The forest sector in Finland also makes a unique contribution to zero net emissions of carbondioxide. At present, about 20 per cent of the total energy production of Finland is based onwood, which is a high figure in terms of global comparison. The industry produces about 80 percent of wood energy by burning black liquor, a by-product from pulp mills, and sawdust andchips from the wood processing industry. Pulp mills are completely self-sustaining in terms ofenergy and are even able to supply other plants with energy. Households and small heatingplants produce about 20 per cent of wood energy. They use primarily small dimension woodfrom thinning, chips made out of logging waste, and building waste.
13.3.4.2 Sweden
Ch13 - Forests, Land Management and Agriculture ACIA Scientific Report
External Review January 2004 13–28 DO NOT CIRCULATE OR CITE
Sweden is also a heavily forested nation. Closed forest, and forest plantations cover a little morethan 60% of the nation or about 27.1 million hectares. Forested shrubland, which is especiallycommon in the transition between closed forest and tundra, represents another 3 million hectaresor 6.6% of Sweden. Inland waters make up almost 10% of the country, and the non-forest landbase is about 23%. (FAOSTAT. 2000. http://apps.fao.org/page/collections). Sweden has 25national parks that together cover a total of more than 0.6 million hectares , or 1.5% of thecountry's area. Sweden also has 1,563 nature reserves covering 2.6 million hectares, or around5.5% of Sweden's total area. In addition there are other nature reserves and other protected areaswhich are increasingly provided by private forest owners, including individual forest ownersand large forest companies.
One striking feature in Sweden compared to other timber-producing countries around the worldis that the State owns only 5% of the productive forest lands. In 1993 most government-ownedtimberland was transferred to a forest product corporation - AssiDomän - in which the Stateowns 51% of the shares, and the remaining 49% are quoted on the stock exchange. Privateindividuals (families) are the largest single category of forest owners in Sweden. In Sweden,approximately half of the country's forests are family owned. Forest companies ownapproximately 3% and other owners account for 12%. Forest industry land holdings areconcentrated in central Sweden and some portions of Norrland (the northern 3/5 of Sweden),where they also operate many large, modern production facilities. Swedish forest companies,have globalized their operations and established themselves firmly in the European countriesand on other continents. Currently some 8 million hectares of forest land have been certified inSweden. Certification is a process of formal evaluation and recognition by third-party evaluatorsthat forest products have been produced by sustainable management practices, and can beadvertised to consumers as such. Forest companies account for most of the certified forest land.
Sweden has the highest population of the Nordic countries at 8.8 million inhabitants, but it isstill largely a sparsely populated country, especially in the north. Despite the relatively lowpopulation density Sweden’s forests show the impact of many centuries of human use. Only inthe northern interior are the forests less affected by humans. Today much of the north Swedishforest is protected, either as nature reserves or by other means. The average size of a privateforest is about 50 hectares in Sweden. Until World War II, most private forest owners werefarmers who lived on their property and were engaged in crop cultivation as well as harvestingwood products from the forest. Since then the area of forest land devoted to this type ofcombined agriculture and forestry enterprise has dropped from more than 9 million to less than4 million hectares. Today many individual forest owners do not live on their forest land, butoften in communities close to it or in more faraway cities and towns. The bulk of forestry workon their properties is now performed by employees of the forest owners' associations or by othercontractors. The
Early in the 19th century, Sweden began the process of industrialization by rapidly expandingits sawmill industry. The vast untouched forest resources of Norrland thus began to be tapped.The major Norrland rivers were suitable for floating timber to the Baltic Sea, thereby openingup previously untouched inland forests to large scale logging. The sawmill companies, whichpurchased very large tracts of land from farmers until 1905, soon gained a strong position onEuropean timber export markets. Northern Sweden was very sparsely populated until the
Ch13 - Forests, Land Management and Agriculture ACIA Scientific Report
External Review January 2004 13–29 DO NOT CIRCULATE OR CITE
beginning of the 19th century. At that time an accelerating agrarian colonization took place, andlater during that century a large-scale exploitation of the virgin forest began. The first forestresources to be exploited were those close to the Bothnian coast, and subsequently exploitationmoved further inland. This exploitation affected almost all forest land in northern Swedenduring the period 1850-1950.
The boreal forest landscape in Sweden has changed dramatically during the last 150 years. As aresult of the vigorous pursuit of forest management goals over the last 100 years, widespreadstands of commercially tended Scots pine of generally similar age and structure make up most ofthe north Swedish landscape (Esseen et al. 1992). Less than 3% of the forest area of Swedensupports trees greater than 160 years old and less than 2% of the volume of conifers in Sweden isin trees larger than 45 cm diameter (Esseen 1992). The volume of standing dead trees in Swedenhas decreased by more than 90% in the last century and the number of large diameter conifers(>30 cm d.b.h.) has decreased by more than 80% (Linder and Ostland 1992). Many old-growthspecialist species including arboreal lichens, mosses, insects, wood-rotting fungi, and cavity-nesting insectivorous birds have become rare in boreal Sweden (Esseen 1992). All taxonomicgroups that are represented in 1,487 threatened forest species of Sweden include elements thatare largely dependent on old forests or habitat elements of old forests (Berg et al. 1994). Many ofthese species belong to functional groups, such as insect predators, that perform vital functionsfor the health and productivity of the forest system as a whole. As a result, the northern Swedishforest is particularly vulnerable to any climate change effects that would accelerate tree mortalityin older stands.
About 20% of the energy consumption in the country originates from forest biomass, and thatthere presently is a significant annual accumulation of C in standing biomass, equal to ca 30%of the fossil fuel emissions. The high level of air pollution originating outside the country, andthe accelerated leaching of mineral nutrients in Sweden has resulted in widespread soilacidification. . Critical levels of both sulfur dioxide and nitrogen dioxide deposits are beingexceeded. The accelerated leaching of mineral nutrients caused by acid deposition has reducednutrient levels by half on some sites in recent decades. On the other hand, nitrogen depositionincreases supplies of a critical nutrient element. Air pollution poses a serious threat to the healthand growth of Swedish forest ecosystems. In general, researchers believe that multiple stressesmay act synergistically, resulting in acceleration of change due to other stresses (Oppenheimer1989). Climate change, therefore, must be understood to be acting in this context in Sweden, asone among many factors.
Today's timber stock is 50% larger than it was when detailed measurements began in the 1920s.However, for much of the early and mid 20th century forests in Sweden were exploited in waysthat today, with increased knowledge and insights, are understood to be detrimental to theenvironment. Extensive clear cutting was carried out, and little effort was made to protectbiodiversity. Since the 1992 UNCED meeting in Rio, the concept of sustainability hasbroadened. This is reflected in the revised Swedish forestry policy that went into effect in 1994.The 1994 Forestry Law states, "The forest is a national resource which should be managed sothat it provides a good return on a sustainable basis and ensures the preservation ofbiodiversity." These two goals are equal priorities (Lamas and Fries 1995). Underlying thispolicy is the conviction that there will continue to be a demand for renewable products in the

Ch13 - Forests, Land Management and Agriculture ACIA Scientific Report
External Review January 2004 13–30 DO NOT CIRCULATE OR CITE
future and that Swedish forests can remain an important source of natural raw material producedon principles of ecological cycles. Swedish forest legislation contains protects key woodlandhabitats, forests located near high mountains, and wetland forests. Special regulations govern 4million hectares of low-productivity woodlands that are not included in the productive forestland, allowing only careful low-intensity utilization and ensuring that their basic characterremains unchanged. Hydrologic and other possible changes caused by changing climatesrepresent potential risk for some of these protected features.
Sweden's forest policy also states that forests should be able to sustain hunting and the gatheringof wild mushrooms and berries as well as active silviculture. The "right of common access" istraditional in Sweden. People are entitled to hike through the natural landscape and to pickmushrooms and berries regardless of who owns the land. This tradition broadens the pool ofresources and users with specific concerns about potential climate change impacts beyond thoseof timber and a comparatively small number of forest land owners. Hunting and fishing remainwidespread and significant activities of modern life in Sweden. Both hunting and fishing areconsidered in forest management since they are naturally connected to key managementpractices in the forests. Sports such as orienteering, cross-country skiing, and other popularoutdoor activities that take place in the forests involve a relatively large proportion of people inSweden. They have a strong interest in the health of the forests and are also an important forestand climate change constituency even though they do not remove products from the forest.
13.3.4.3 Norway
Forests and other wooded land cover about 37 per cent, or 11.9 million hectares, of theNorwegian mainland. Nearly 23 per cent, or 7.2 million hectares, is regarded as productiveforest. The productive forest is distributed among 125,000 forest properties. About 79% of theproductive forest area is owned by private individuals.
The total area of wilderness territory in Norway has been greatly reduced over the past 100years. Wilderness territory is defined as areas more than 5 kilometers from roads, railways andregulated water-courses, power lines, and vehicle tracks. Although the largest reduction inwilderness during the 20th century occurred in the lowlands of southern Norway, wherewilderness is now virtually eliminated, mountainous areas and north Norway have experiencedmajor reduction and fragmentation of wilderness as well. Today wilderness represents 12% ofthe total land area of Norway (not including Spitsbergen and Jan Mayen). Approximately 6.4%of mainland Norway has official protected area status. New protection plans, especially foradditional national parks, are being developed, and about 15 per cent of the land base will bewithin protected areas by the year 2010. Both public and private land that lie within or adjacentto designated national parks are protected from construction, pollution, or any otherencroachment.
Norwegian forests have been exploited intensively for export of roundwood, sawn timber andwood tar for hundreds of years. In addition, there is a long tradition of using the forests fordomestic animal grazing and game hunting. For many years the amount of wood removed fromNorwegian forests has been less than the amount of growth. The biomass of standing trees hasalmost doubled since 1925, and the cubic volume of standing forest increased by more than 95
Ch13 - Forests, Land Management and Agriculture ACIA Scientific Report
External Review January 2004 13–31 DO NOT CIRCULATE OR CITE
per cent from 1925 to 1994 to about 616 million cubic meters. In 1994 the net increase(increment or growth minus removal) in forest mass was 9.5 million m3, or 1.5 per cent of thetotal cubic mass of standing forest. The 1994 volume of Norwegian forest was made up of 46per cent spruce, 33 per cent pine and 22 per cent deciduous trees. The net increase was greatestfor deciduous trees and pine. Because of their increase in total biomass Norwegian forests havecontributed to a net transfer of carbon dioxide from the atmosphere into storage during the 20th
century. It is estimated that in 1994, the net amount of carbon dioxide assimilated by forest was15 million tonnes, amounting to about 40 per cent of Norway's human-caused emissions.
The increase in wood volume can be attributed to many factors. A sustained effort at intensiveforest management has systematically removed older stands that have low rates of net growthand increased the proportion of stands in the early and most rapid stages of growth. Anextensive effort of afforestation has established forests on sites, such as formerly open wetlands,which supported no (or only minor) forest cover previously. Natural forest vegetation hasreturned to uncultivated land that is no longer farmed, producing a gradual build-up ofvegetation mass. Long-range transport of nitrogen in precipitation has had a fertilizing effect onNorwegian forests. Finally, the introduction of new species that grow faster than native specieson some sites has also led to greater forest growth. It should also be noted that the particularlylarge increase reflected in the inventory data in the most recent years is probably due in part tonew methods of calculation.
Today the forest is used first and foremost as a source of raw materials for sawmills and thepulp and paper industries. Government grants or subsidies for forest planting began as early as1863 in Norway. In recent years planting of forest has been somewhat reduced to between 200 -300 km2 of forest planted or sown annually. In Norway plantations are often monocultures ofspruce. The diversity and abundance of the fauna and flora in planted spruce forest is muchlower than that of the naturally regenerated forest.
Although the volume of forest has increased considerably since the turn of the century, today'sforest has been transformed from its original condition. Clear-cutting, establishment ofplantations, introduction of alien species, ditching, and building of forest roads are some of theintensive forest management measure that have been applied. Acidification and pollution haveaffected forests as well. As in the other Nordic countries, management practices applied in orderto produce the increased biomass of trees have caused a reduction biological diversity. Much ofthe present forest growth is concentrated in large monocultures. Large stands of the same ageclass contribute to a reduction in the number of species of flora and fauna that would be foundin a more natural, mixed type of vegetation.
Forestry and the forest industry are important sectors of the Norwegian economy. Wood andforest products represent about 11 percent of Norwegian non-oil exports. This is slightly lessthan the export value of the Norwegian fishing industry, somewhat higher than both thealuminum and the natural gas export values, and twice the value of Norwegian high-technologyexports. About 30,000 people receive their income from primary forestry and the forestindustry. Most of the activity takes place in rural districts, and production is almost completelybased on renewable resources. Beginning in the 16th century, and continuing for centuries sincethen Norway exported large quantities of sawn lumber. However, since World War II most of
Ch13 - Forests, Land Management and Agriculture ACIA Scientific Report
External Review January 2004 13–32 DO NOT CIRCULATE OR CITE
the sawn lumber has been utilized nationally. Most homes in Norway are constructed of wood,with wooden interior fittings, and wood is an important part of the every day life of Norwegians.In 1995, the wood processing industry used a total of 5.1 million cubic meters of wood andemployed about 16,000 people.
About 50 percent of the Norwegian round wood harvested is used by sawmills. There are 225sawmills in Norway operating on an industrial scale. Paper products have the highest exportvalues of all the forest-based products. Paper and board products are currently being producedon 36 different machines in Norway. Wood pulp and chemical pulp is being produced at 17various production units. Every year about a million tons of newsprint are exported. The pulpand paper industry employs a total of 9,000 people.
Until a century ago, wood was the dominant energy resource in Norway. Oil and hydropowerare currently the major energy sources, and the use of fuelwood is only 7 percent of the volumebeing used 100 years ago. The forest may, however, play an increasing role as an energy supply.Shortages of electricity and carbon dioxide taxes on the use of oil have increased the interest inbio-energy. Today, the pulp and paper industry is by far the largest producer of bio-energy inNorway.
13.3.4.4 Iceland and Greenland
As a geologically young landform situated along the mid-Atlantic Ridge isolated from bothEurope and North America, Iceland has always supported ecosystems with only a restricted setof species, probably no more than 405 native vascular species (Blöndal 1991). Iceland is alsothe portion of the ACIA study area with the strongest human impact on ecosystems. The entireisland was estimated to be about 65% covered with vegetation at the time of Viking settlementin the year 874, but Iceland is only about 25% vegetated today (Blöndal 1993). This reduction invegetative cover is the result of intensive land and resource utilization by a farming and agrariansociety over 11 centuries.
When Norse farmers, traders, warriors (Vikings), and seafarers arrived in Iceland from westernand/or northern Scandinavia in the 870s and 880s, the land was uninhabited and vegetated fromthe seashore to all but the glaciated mountains. At higher altitudes the woodlands gave way todwarf birch, willow, grasses and moss. Birch woodlands separated by wetlands dominated thelowland vegetation. The lowlands were the only habitable land areas and they were occupied inthe first decade or two. Most of the first settlers were farmers and they brought livestock to theisland. Forests were cleared rapidly by burning and wood harvest for building materials andcharcoal manufacture, generally within 50 years of the arrival of the settlers. Nearly all thehabitable woodlands were converted to pastures and only the mountainsides and highlandmargins retained forests, which survived to early modern times.
Estimates vary as to the percentage of the island originally covered with forest and woodyvegetation at settlement, but a range of 25 to 30% is plausible (Blöndal 1991). The native forestof Iceland was principally downy birch and a few tall willow species with a relatively largeproportion of the woody stems in a dwarfed and somewhat contorted growth form. Rowan andEuropean aspen are occasionally found among the birches. Tea-leaved willow, hairy willow,

Ch13 - Forests, Land Management and Agriculture ACIA Scientific Report
External Review January 2004 13–33 DO NOT CIRCULATE OR CITE
and creeping juniper are common shrubs in birch woodlands. Until the 1970s most of theplantations were established within the existing birch woodland but that practice is not usedanymore. Nowadays (from the year 2003) approx. 2000 ha is planted annually in Iceland. In thelate 1980s semi-natural forest and woodland vegetation covered only about 1.33% of Icelandamounting to about 117,000 hectares of native birch woodland and 15-20.000 ha of plantations.More than 80% of the woodland remaining in Iceland was less than 5 m in height in the 1980s,and 14.2% of the birch woods are with taller trees than 5 m (Sigurdsson and Snorrason 2000).Ancient native birch woodlands and scrub are key areas of terrestrial biodiversity in Iceland.The birch woods still retain most of their original biodiversity and are a key habitat for anumber of threatened and endangered species, while the deforested land has suffereddegradation and has in some cases been reduced to deserts.
Roughly 70% of forest and woodlands in Iceland are privately owned, the remainder is owned bythe national government or local municipalities. The Iceland Forest Service, an agency under theMinistry of Agriculture, is primarily responsible for implementing and monitoring governmentalforest policy. The Environment and Food Agency of Iceland belonging to the Ministry for theEnvironment plays a role in the conservation of protected native birch forests. The main forestrylaws in Iceland include the Forestry Law (1955), the Farm Afforestation Law (1991), theSouthland Afforestation Law (1997). In response to a request by the Icelandic parliament, theIceland Forest Service prepared a comprehensive afforestation plan for all of Iceland as a part ofIceland's sustainable development strategy, resulting in the Regional Afforestation Law (1999).The Icelandic Soil Conservation Service, also under the Ministry of Agriculture, is responsiblefor implementing the Soil Conservation Law (1965) which also contains provisions forvegetation conservation and restoration.”
In southern and western Iceland the land was cleared and barley was grown. Domestic livestockwere sustained at numbers that were hard on the land and caused landscape degradation, soilloss, and reduced long-term productivity of pastures. A pollen record from Iceland (Hallsdóttir1987) confirms the rapid decline of birch and the expansion of grasses between 870-900 AD, atrend that continued to the present. As early as 1100 more than 90% of the original Icelandicforest was gone and by 1700 about 40% of the soils had been washed or blown away. Vastgravel-covered plains were created where once there was vegetated land. The Icelandic SoilConservation Service was established in 1907 to combat the destructive forces of soil erosion inthe country. This is a unique context in which to consider climate change effects within theACIA study area – essentially humans have eliminated so much of the native forest ecosystems,and even damaged soils, that climate change actually represents an opportunity for forestrecovery and expansion.
The exploration of Greenland in 984 by Eric the Red gave the more adventurous Icelanders newfarm sites and freedom from limits on establishing themselves in an occupied landscape. Thesmall areas of woodlands in Greenland, dominated by birch and willow in the south and alder inthe valleys of the Western settlement, were highly valued. The Greenland Norse were farmersalso, although they supplemented their diets with seal, birds, and caribou. For several centuriesthe Norse remained committed to their farming way of life but gradually experienced variousstresses (land degradation, trade and genetic isolation, social/economic challenges), many ofwhich were aggravated by climate cooling. The Norse Settlements in Greenland and Iceland

Ch13 - Forests, Land Management and Agriculture ACIA Scientific Report
External Review January 2004 13–34 DO NOT CIRCULATE OR CITE
were established shortly after the beginning of a period of relatively warm and stable climatethat persisted between the eighth through the twelfth centuries (Ogilvie and McGovern 2000).With the gradual degradation of the landscape causing reduced capacity to support livestock andcrops, and during a severe cooling period between 1343 and 1362, the Norse presence ended inthe Western Settlement of Greenland and the Norse population disappeared. The mid-fourteenthcentury cold interval in Greenland was probably the period of the lowest temperature in the last700 years, and the effect of this climate change on the Norse system is highly likely to havebeen an important factor in its terminal decline (Ogilvie and McGovern 2000) (see also Chapter16). Simultaneously, Arctic-adapted Thule people arrived for the first time as the culmination oftheir historic expansion eastward and may have played a role in displacing the indigenous Norsepeople who first inhabited the area.
Until quite recently, efforts to conserve and increase the area covered by native woodlands inIceland were hindered because the majority of woodlands were subject to grazing, mainly bysheep; the total area covered by birch woodlands does not appear to have changed significantlyin recent decades. However, the establishment of the Icelandic Soil Conservation Service in1907 was instrumental in fencing off and halting the most severe erosion processes in lowlandareas of southern and northeastern Iceland. Plantations now total at least 20,000 hectares(Gunnarsson 1999). Until the 1980s the lands most suitable (from the standpoint of soils andclimate) for reestablishing native birch forests remained committed to farming and winterfodder production for sheep and horses. However, with Iceland’s membership in the EuropeanEconomic Area (EEA) and the World Trade Organization (WTO), Icelandic agriculture hasbeen integrated into a trading and market zone in which many of its products are already insurplus by lower cost producers, and thus fall under production quotas or price disadvantages.Farms are going out of traditional agricultural production, and other forms of land-use, such asafforestation and horse farming, are increasing.
Starting in 1907 but especially since the mid-20th century, efforts were made to establish forestplantations in Iceland. About 130 tree species from most of the world’s cold regions have beenevaluated for their growth and survival characteristics (Blöndal 1991). Different types of forestare being established for particular purposes. Native birch forest is often favored on recreationareas near urban centers and private land surrounding weekend recreation cottages in thecountryside. Usually land that is being converted to native birch forest must be fenced toexclude sheep. Protection forests are designed to prevent erosion of exposed soil, which is stillquite common. Species commonly used in protection forests include downy birch, Russianlarch, Siberian larch, lodgepole pine, willows and alder. A program to afforest denuded orseverely eroded land has resulted in the planting of about a million trees in 70 areas subject tosoil erosion. Production forests are designed to produce wood for timber, fuelwood, andChristmas trees. Planted species include Sitka spruce, Russian and Siberian larch, lodgepolepine and black cottonwood. State-supported forestry projects (afforestation projects) have beeninitiated during resent years in all parts of Iceland starting in eastern Iceland in 1991. The aimsof the projects are to create jobs in the rural areas e.g. in nurseries and to support jobs on thosefarmsteads taking part in the project. Farmers who participate in the project can receive a 97 %state grant of the total cost of afforestation on their farmlands (Gunnarsson 1999).

Ch13 - Forests, Land Management and Agriculture ACIA Scientific Report
External Review January 2004 13–35 DO NOT CIRCULATE OR CITE
The main challenge to successful introduction of tree species to Iceland has been findingvarieties that can survive, and as a lesser concern also, to reproduce in an environment of strong,steady winds and growing seasons at the cool margin of tree tolerance. Warmer climateconditions generally increase the planting success and particularly the growth of trees inIceland. The restructuring of the rural economy to include less production agriculture and moreecotourism, recreation, and amenity-based uses is supporting the trend toward the conversion ofthe Icelandic landscape from a treeless farming region into one with expanded forest area. Thegovernment program to sequester carbon dioxide has increased afforestation efforts. About 4.5million trees are planted annually in Iceland resulting in afforestation of nearly 11 km2 per year.Most of the tree planting for sequestration of carbon is contracted to farmers. A national goal isto expand forest cover on 1% of the national area per decade until forests cover about 5% ofIceland, which would represent the greatest forest extent in a millennium. In 1995 the estimatecarbon sequestration of Icelandic plantation forests was 65K tonnes CO2, or about 2.9% of thenational emissions per year at the time. By 1999 the corresponding figures were 127K tonnesrepresenting 4.7% of emissions (Sigurdsson et al. 2000).
13.4 Use and evaluation of the scenarios
13.4.1 Method of analysis
In this chapter we have used the output of the 5 GCM model scenarios primarily in the form ofnumerical output for key climate variables in specific grid cells across our area of analysis.Criteria and assumptions used in the scenarios are described in Chapter 4. For purposes of thisstudy we chose 14 sites that were broadly distributed across the northern part of the boreal regionor were located somewhat south of the Arctic but which currently experience climate conditionsprojected to occur in the Arctic and boreal region under climate warming. Most of the locationswere chosen because they have a medium to long-term climate record. Many are majorpopulation, trade, or transportation centers within their respective regions, and include mostregions where agriculture and forest management are currently practiced in the far north orpotentially could be practiced now. The selected locations include areas in the eastern, central,and western portions of both Eurasia and North America (Figure 1.X).
Note: This information should appear as numbered symbols on a map in Chapter 1:The selected sites are: Fairbanks, Alaska, USA (64.82oN, 147.52oW), Big Delta, Alaska, USA(analysis of growing degrees only)(63.92oN, 145.33oW), Whitehorse, Yukon Territory, Canada(62.72oN, 135.10oW), Ft. Vermillion, Alberta, Canada (58.40oN, 116.00oW), Thompson,Manitoba, Canada (55.80oN, 97.90oW), Goose Bay, Newfoundland, Canada (53.30oN, 60.4oW),Reykjavik, Iceland (64.13oN, 21.56oW), Tromso, Norway (69.83oN, 18.55oE), Umeå, Sweden(63.8oN, 20.30oE), Rovaniemi, Finland ( 66.55oN, 25.00oE)), Archangelsk, Russia (64.5oN,40.42oE), Novosibirsk, Russia (55.00oN, 82.90oE), Yakutsk, Russia (62.00oN, 130.00oE),Magadan, Russia (59.60oN, 150.80oE). We also used the mean of 4 climate stations on theTaymir Peninsula in northern central Siberia; Dudinka (69.67oN, 86.28oE), Essej (68.78oN,102.62oE), Khatanga (71.97oN, 86.78oE), and Olenek (68.83oN, 112.72oE).
The primary variables we obtained were (1) mean monthly temperature, (2) total monthlyprecipitation, and (3) Growing Degree Days (GDD). Mean monthly temperature is the mean of

Ch13 - Forests, Land Management and Agriculture ACIA Scientific Report
External Review January 2004 13–36 DO NOT CIRCULATE OR CITE
all daily mean temperatures for the month. Daily mean temperature is simply the mean of thehigh and low temperature of a given day. Monthly temperature integrates much of the short-termvariability in weather and yet preserves a specific seasonal signal of warmth or coolness that hasproved useful in many applications such as tree-ring studies. Monthly precipitation reflectsamount and timing of moisture, and is widely used in forestry, agriculture, and hydrologicalapplications. GDD is a measurement of accumulated heat energy. GDD is calculated by takingthe sum of daily mean temperatures above some defined threshold. For example, if the thresholdvalue for accumulation is 5 °C, then a series of daily means of 2, 6, 7, and 5 would accumulaterespectively 0, 1, 2, and 0 degrees for a total of 3 GDD.
We obtained output climate variables from the climate model scenarios generally for the period1990-2099, which allowed an 8 to 10-year overlap with recorded data (typically 1990 or 1991through 1998 or 1999). In some cases recorded data from stations was truncated in 1989 or 1990,so we obtained scenario output from 1980 to 2099 in order to generate a 9 or 10-year overlap.We then calculated the difference for the overlap period between monthly or annual values of thescenario output of temperature or precipitation, representing the entire grid cell, and the specificrecording station we were comparing it to. From these values, we then calculated an overallmean difference and this difference was applied as a correction factor for scenario output for allyears beyond the overlap period. We did not adjust the variance, although we examined somefeatures of scenario versus recorded variance (see 13.4.4). The adjustment of GCM output foruse at a specific location is an active area of ongoing research (e.g., Hewitson 2003).
13.4.2 Size and placement of grids
In these models grid cells are large polygons that represent the earth’s surface. In the scenariooutputs climate is represented by a single value for an entire grid cell. Of course, climate at aspecific station locality within the grid cell can be different than the value that expresses theentire grid cell for several reasons. It is important to understand what causes some of thesedifferences in order to properly evaluate the scenario output and the ways we have used it in thischapter.
The different GCMs use grid cells of different sizes and non-uniform placement. A grid cell thatcontains a given station locality may be represented as a polygon largely north of the station inone model scenario but largely south of the station locality in another model, and the temperaturevalues in the two scenarios would have a different relationship to the climate station locality. Thereal geography of the earth is another factor that can cause a difference between a climate stationand a grid cell value. In one model it is possible that high and low elevation terrain have beenintegrated to calculate a single number for the climate parameter, whereas in another model thegrid cell has been placed in a way that the earth’s surface is more uniformly high or low.
Mountain terrain often produces sharp gradients of precipitation. As a result, grid cells thatinclude mountains and smaller valleys can exhibit particularly large differences in precipitationfrom recording station that are typically located in low elevation valleys.
A small grid cell occupying an area along a mean frontal position in one scenario will showgreater climate variability that a larger cell even if both contain the same recording climate

Ch13 - Forests, Land Management and Agriculture ACIA Scientific Report
External Review January 2004 13–37 DO NOT CIRCULATE OR CITE
station. In addition, different models produce different patterns of air mass mixing, and as aresult different patterns of mean frontal positions.
13.4.3 Range of scenarios
The model scenarios produce a variety of annual and seasonal mean temperatures by the end ofthe model runs in 2099. The grid cell containing Ari Mas the world's northernmost treeline onthe Taymyr Peninsula, Russia provides an example of different scenario outputs of warming(Figure 13.05). We adjusted Ari Mas grid cell data for mean annual temperature of 4 stations(Dudinka, Essej, Khatanga, and Olenek), which average about –11.5 for the available 20th
century record. The long-term mean (regression line fit) for the CCC output of mean annualtemperature adjusted to the stations reaches about –7.2 °C at the end of the scenario period, butthe CSM warms to about –2.7 °C at during the scenario run (Figure 13.05). The CCC resultsmaintain a grid cell climate within the range of forest-tundra transition conditions, whereas theCSM results represent mean annual temperatures typical of regions where today some of themore productive examples of the northern boreal forest can be found.
Figure 13.05. Average of mean annual temperature (MAT) of four climate stations (Dudinka,Essej, Khatanga, and Olenek) on the Taymyr Peninsula near the northernmost treeline in theworld (Jacoby et al. 2000). Data from the CSM and CCC scenarios have been adjusted for thestation mean for the grid cell and are depicted to 2099. The CSM scenario producestemperatures typical of a discontinuous permafrost region at the end of the scenario period,which would represent a change to a climate typical of areas with some commercial timberproduction. (Data from: ACIA data archive).
Sometimes in our analyses it was possible to calibrate the response function of a key outcome toclimate, such as tree growth. Often the scenarios produced similar results with differencesmainly in short-term (year-to-year) variability. The graphical display of such model scenarioclimate output overlaps to such an extent that clear trends are difficult to see. As a result, whenthe outputs of a climate variable of interest were broadly similar among the 5 scenarios we usedthe high and low-end members to look at the range of consequences produced by the scenarios.Again using the Ari Mas region as an example, warm season (May – September) the ECHAMmodel warms by about 5.7 °C and CSM by about 3.0 °C (Figure 13.06). The warm season meanis closely related to the mean radial growth of trees at this location, so that the scenarios providesome basis for understanding what the possible effects of climate warming at this locality mightbe on tree growth and vigor (sustained rate of growth over time) (Figure 13.06). It should beremembered that the relationship of tree growth to climate may change under an altered climate.
Figure 13.06. Historic relationship between growth of Siberian larch and warm seasontemperature and future scenarios in the Taymyr Peninsula of Russia. Note the generally closerelationship between the regional tree ring growth signal, here depicted as detrended andnormalized index values, and the mean of May through September temperature. These treesare heat limited and display a positive relationship with temperature. The ECHAM scenariofor the 21st century produces temperatures that would approximately double the rate of growthand make this marginal site a productive forest, The CSM scenario does not produce the same

Ch13 - Forests, Land Management and Agriculture ACIA Scientific Report
External Review January 2004 13–38 DO NOT CIRCULATE OR CITE
degree of warming, but would eliminate periods of severe growth limitation. (Data from:Jacoby et al. 2000).
Very few of the outputs we examined showed cooling or no change. Perhaps the best example inour analysis is Reykjavik, Iceland. The CCC and GFDL scenarios for the grid cell that containsReykjavik produce mean annual temperatures and summer (May – August) temperatures thatgenerally are not warmer than the 20th century recorded data and end the scenario period near thelong-term means of the recorded data (Figure 13.07A and 13.07D). Other scenario outputs forthe Reykjavik grid cell generally include a warming trend (Figure 13.07B and 13.07C), but themagnitude of warming is notably less than most of the other grid cells and stations we examined.
Figure 13.07. Relationship between summer and mean annual temperature at ReykavikIceland for both the period of instrument record and the scenario period. The four depictedscenarios produce warmer temperatures in both the summer and annual mean temperaturethan the level recorded during the mid 20th century warm peak, but in this highly maritimearea none of the scenarios greatly exceed those temperatures. Note the variability in thedegree to which the different scenarios reproduce the historical relationship between the twovariables depicted. (Data from: ACIA data archive).
13.4.4 Variability and seasonality
In addition to long-term trends and magnitude of warming, the models produce different featuresof shorter term climate variability. Often these short-term climate events or minor trends can bedecisive ecological influences. For example, even one or two years of strong warmth can beenough to produce extreme risk of forest fire (Johnson 1992), or optimal conditions for majoroutbreaks of insects that kill trees or reduce their growth (see section 13.8). On the other handcold spells during the growth season may harm or kill the trees. A short-term period of favorableclimate may trigger production of especially large tree seed crops, which in turn will producelong lasting ecological consequences (Juday et al. 2003). The set of stations used for scenarioanalysis contain the reciprocal temperature relationships mentioned earlier (Section 13.2.4,Figure 13.08). When mean annual temperatures at Goose Bay, Labrador, Canada (eastern edgeof continent) are high, they tend to be low at Haparanda, Sweden (western edge of continent)(Figure 13.08). When summer (June – August) temperatures are high at Fairbanks, Alaska, USA(western interior of continent) they tend to be low at Yakutsk, Russia (eastern interior ofcontinent) (Figure 13.08).
Figure 13.08. Negative (opposite) relationship of temperatures at contrasting eastern andwestern portions of continents among the scenario stations. (Data from ACIA data archive)
Because these features of climate variability are so important in producing ecological effects it isimportant to understand the behavior of the models with respect to key features of short-term andmedium term variability and seasonality.
Most of the model scenario outputs for the grid cells we examined reproduce something close tothe historical record of the difference between summer temperature and mean annual temperature(Figures 13.07 and 13.09 A, C, D, and E). However, sometimes scenario outputs show a different

Ch13 - Forests, Land Management and Agriculture ACIA Scientific Report
External Review January 2004 13–39 DO NOT CIRCULATE OR CITE
relationship between summer and mean annual temperature than recorded data (Figure 13.09 B).The CCC scenario output for the grid cell containing Fairbanks, Alaska U.S.A. does notreproduce the same relationship between temperature trends in the coldest winter months andmean annual temperature as the recorded data (Figure 13.10). It is possible that climate warmingwould actually produce such an effect, but not all the scenarios agree on such features andrealistic projections of effects on forests and agriculture require a resolution of suchdiscrepancies. Differences in the relationship between seasonal and annual climate variables canhave particular ecological importance. For example, warmer growing season temperature canincrease growth of trees leading to one set of effects, but warming mean annual temperature maypromote thawing of permafrost, which can undermine or destroy the soil rooting zone for treesgrowing on such sites. Thus different rates of warming annually versus seasonally can producequite different ecological effects.
Figure 13.09. Relationship between summer and mean annual temperature at Goose Bay,Labrador, Canada, recorded data, and scenario data. All scenarios produce a magnitude ofwarming that substantially alters the moderately temperature-limited forest climate typical ofthe 20th century. The scenarios enter ranges of temperatures that would surpass thresholds forkey factors such as outbreaks of insects that attack trees, new species, and altered ecosystemfunctions such as growth, fire, and decomposition. (Data from: D’Arrigo et al. 1996)
Figure 13.10 Winter and mean annual temperature at Fairbanks, Alaska, recorded dataversus the CCC scenario. Fairbanks data are a combination of University Experiment Station(1906-1948) and Fairbanks Airport (1948-2001). The CCC scenario develops a relationshipbetween the seasonal temperatures not seen in the record, a disparity that widens with time.Different models have different strengths and weaknesses and all should be applied with anawareness of limitations, circumstances in which they perform well, and novelties that couldaffect assessments of key climate-dependent processes. (Data from: National Weather Service)
13.4.5 “Surprises” in Climate Change Effects on Forests
As with any use of models to project into the future, we introduce a note of caution. It should bewell understood that our projections of changes and impacts to forests, land management, andagriculture are only as good as the climate models upon which they are based. But it is alsoimportant to understand that the consequences of change introduced into ecosystems ofteninclude elements of chance and contingency that have very real and long-lasting consequences.Even though ecological events could unfold in a variety of ways under a given climate scenario,the fact that events do take a certain pathway of cause and effect closes off a whole set of otheroutcomes from that point onward. These characteristics of chance and contingency work againstpredictability in ecosystems. Other elements of analysis contribute toward predictability inecosystems. Including large areas in the analysis allows processes that have a variety of potentialoutcomes, for example the number of trees of a certain species reproducing successfully after afire, to occur again and again. Repeated outcomes of the climate change “experiment” will thencause the results or outcomes to begin to approach some distribution that may be described.Repeated outcomes can be produced not only as the result of multiple examples across space, butas the result of multiple outcomes across time in the same place. As a result, when larger areas

Ch13 - Forests, Land Management and Agriculture ACIA Scientific Report
External Review January 2004 13–40 DO NOT CIRCULATE OR CITE
and longer time periods of analysis are involved, the outcomes in ecosystems can be betterdescribed.
The climate changes that are the most difficult to predict are low-probability, high-impact events.By definition, there will be few examples of such events to learn from; in fact, analogous eventsmay not have been witnessed during historical time. An example in forest ecosystems would bethe introduction and spread of tree pathogens such as insects or fungi. The abundance ofsusceptible trees can be radically reduced, with long-lasting consequences, by what amounts tounique events from the human time perspective. New and overall warmer climate regimes mightbe characterized by a greater number of freezing events during warm periods, causing new formsof chronic short-term or permanent damage to the trees. The upper levels of warming producedby the 5 climate scenarios we evaluated is within the range of climate change that it would bereasonable to assume would include “ecosystem surprises” for which we have no record andwhich our ecological modeling is not likely to predict.
Of course, humans are not passive spectators of change in forest ecosystems or forest resourcesthat are important to them. Humans actively intervene, plan, and manage forest resources andagents of change in forests, through their influence on factors such as fire, that affect forests andforest values. Humans completely plan and create agricultural crops, livestock herds, andmarketing systems. So climate change may initially create an effect that humans can respond toin a way that makes humans the most important agent of change. In some ways thesemanagement responses are part of the standard set of land and resource management treatmentsthat forestry and agriculture have developed over time. Reforestation, new species plantations,salvage of dead trees, sanitation treatments of a stand to reduce its vulnerability to pathogens,planting new crops, and altering soil or site conditions have a long history. Crops can be movedto suitable temperature zones, fields irrigated, and tillage systems adjusted to manipulate soiltemperature within certain limits. What is new, and only now being developed, is the applicationof these techniques and the development of additional techniques to achieve specific goalsassociated with climate change in the far north, including both adaptation or mitigationapproaches, and some appreciation of the associated costs.
13.4.6 Issues of B2 versus A2 Scenario
For all of the model analysis presented in our chapter, we used the B2 scenario of the model. Weprovide some summary evaluation of the possible differences of the A2 scenario of the modelscompared to the B2 results in this section.
Broadly speaking, all the scenarios produce warming within the boreal region greater thanreconstructions of climate for nearly the last 1000 years or essentially since the Medieval WarmPeriod. The A2 scenarios of the 5 GCMs produce a warmer end of the 21st century than theircorresponding B2 scenarios in every case (see Chapter 4). The magnitude of warming from thebeginning to the end of the 21st century produced by the lowest of the B2 scenarios (CSM) isabout 3.5 °C, but the lowest of the A2 scenarios produce a warming of about 4.5 C. The greatestmagnitude of warming of all scenarios is the A2 version of ECHAM at a little more than 7 °C.So the greatest potential difference between all scenarios is about twice the warming during thenext century.
Ch13 - Forests, Land Management and Agriculture ACIA Scientific Report
External Review January 2004 13–41 DO NOT CIRCULATE OR CITE
Considered from the broadest perspective, the difference between the A2 and B2 scenariosbecomes largely a matter of timing of effects on forests rather than different kinds of effects. Inpractical term this means that the amount of time necessary to reach the thresholds we describein this chapter would happen sooner under the A2 version of the scenarios than the B2. Thedifference in timing of these effects may be as much as 40 years earlier in the case of the A2scenarios. The A2 versions of the scenarios begin to diverge in amounts significant for forestprocesses after about 2040.
In general we found that ECHAM (B2) scenario output best matched features of annualtemperature variability in the recorded data for the stations we examined, and many of the other4 scenarios produced less annual variability. The A2 version of the ECHAM scenario produces apattern of steep rise early in the 21st century, then a period of little change, and finally a steep riseagain in the last decades of the century. This suggests that warming effects in the A2 version ofthis scenario, with large variability possible from year to year, could be especially sudden. Undersuch a scenario the risk of extreme events, such as widespread forest fires and insect outbreaks,would probably be greatest.
13.5 Agriculture
13.5.1 Relationship of the global agricultural system to the Arctic region
The world’s population relies on two basic agricultural systems for its food supply. The first isthe large-scale commercial production and trade of commodities. The commodities thatdominate this system are cattle, sheep, and hogs for meat or wool, dairy animals for milkproducts, grains for animal feed and direct human consumption, and oilseeds. These productsmove through a complex, and in most cases, efficient network of trading, transportation, andprocessing before reaching the final consumer. Lower volumes of products that are important forhuman dietary variety also move through this network, including potatoes, fruits and vegetables,and raw products for beverages and spices. As a result, a diverse array of foods is available tothose consumers who have both physical and economic access to the network. Within the Arctic,major population centers, areas served by regular surface transportation, and economic outpostsare served by this agricultural and trading system. The potential impacts of climate change onthis system are global and complex; vulnerabilities come from direct climate influences on cropsin multiple climate zones across the earth, from direct climate effects on shipping activities, andfrom subtle climate influences on prices and relative price differences (Rosenzweig and Parry1994).
The second type of agricultural system that supplies food for the world’s population issubsistence agricultural production. This system can be generally characterized as regional andlargely self-reliant. It does not rely on a complex infrastructure to move either raw ormanufactured products to the final consumer. Products are characteristic of the productionregion, and often obtained as part of a mixture of annual activities (see Chapter 11.1.2). Theseregions are categorized as those having low population density and/or a low economic profile.The majority of the area of the Arctic, but a minority of the population of the Arctic, are served

Ch13 - Forests, Land Management and Agriculture ACIA Scientific Report
External Review January 2004 13–42 DO NOT CIRCULATE OR CITE
by this subsistence agricultural system. Generally, regions in which subsistence agriculturepredominates either have limited access or do not have physical and/or economic access to theworld’s primary food supply network. Potential climate change impacts on the subsistencesystem can be acute and local, for example a mid-season frost kills a crop, or subtle and longerterm, such as climate effects on price advantages or barter opportunities.
In the Arctic many examples can be found of a mixture of the two food systems or a culturalpreference for the subsistence agricultural system despite economic and infrastructureadvantages which would permit participation in the commercial production system. People in theArctic can and often do move between participation in the one system and the other. By nomeans is it clear that the commercial production system will completely displace the subsistenceagricultural system in the foreseeable future.
13.5.2 Existing agriculture in the Arctic region
Agriculture is a relatively small industry in high latitude regions and consists mostly of croppingcool season forage crops, cool-season vegetables, and small grains; raising traditional livestock(cattle, sheep, goats, pigs, poultry); and herding reindeer. This chapter focuses on production ofcrops rather than animal agriculture. Production of cheap reliable feeds is often a majorconstraint to animal agriculture and livestock production is often limited more by non-climatefactors such as availability of processing facilities and appropriate waste handling rather thandirectly by climate. While agriculture is limited by climate in this region, especially in the coolerparts, is also limited by lack of infrastructure, small population base, remoteness from markets,and land ownership issues. Major climate limitations include short growing seasons (not enoughtime to mature or to produce high yields of harvestable crop), lack of heat energy (too fewgrowing degree days during the season), long and/or unfavorable winter weather which can limitsurvival of many perennial crops, and high moisture stress in some areas.
Most of the locations studied have climates which are currently at least marginally suitable forgrowing barley, oats, green peas, and potatoes (although not always to full tuber maturity).Wheat has been grown as far north as Rovaniemi, Finland in Europe and in the southernNorthwest Territories and at Fairbanks, AK in North America in experimental plantings, but isconsidered too marginal for commercial production in those areas and is a major commercialcrop only in southern Siberia (represented by Novosibirsk). Canola/rapeseed is also producedonly in the southern-most part of the region and is considered marginal even in many areas nowconsidered suitable for barley (such as interior Alaska). Sunflowers currently are producedgenerally in the same localities as wheat. The magnitude of warming represented by the climatescenarios would remove these heat limitations in the currently climatically marginal areas by midor late 21th century.
All of the sites examined here have summers with enough heat to produce at least one successfulharvest of forage crops including legumes such as alfalfa or clover and grass such as timothy.Slight growing season warming could increase the probability of two or more successful harvestsand thus increased yields in some areas. However, winter survival is a problem in most areas,thus alfalfa is produced only in the warmer parts of the region, and clovers are successfully
Ch13 - Forests, Land Management and Agriculture ACIA Scientific Report
External Review January 2004 13–43 DO NOT CIRCULATE OR CITE
grown in areas with relatively mild winters. Perennial grasses, especially smooth bromegrass andtimothy, are grown in much of the region.
Agricultural production statistics match the boundaries of the ACIA study area at the nationallevel for Iceland. Relevant statistics also are available for the 3 northern counties of Norway(Troms, Finnmark, and Norland), the U.S. state of Alaska, the Yukon and Northwest Territoriesof Canada. These areas are highlighted in this section. Data from the Norrbottens region ofSweden match the ACIA analysis area, and Finnish agricultural statistics are readily available atthe national level and for jurisdictions with boundaries that are not as relevant for ACIApurposes. Complete and reliable statistics for agriculture in the ACIA portion of Russian are notavailable.
(Footnote: Data on agriculture in Canada in the following section comes from Statistics Canadawww.statcan.ca/english/freepub/95F0302XIE/).Yukon Territory is one of the most mountainous parts of Canada, but agriculture is practiced invalleys, especially in the southern interior and suitable landforms in Northwest Territories. Thereare at least 170 farms in Yukon and 30 in Northwest Territories, representing a total capital valueof over $67 million, primarily in land and buildings. Most of these farms are operated as part of ayearly cycle of other activities, and only 21 have gross receipts > $25K. As in Alaska, farmers inthe Canadian north take a diversified approach to agriculture. They produce traditional livestockand engage as well in sled dog breeding, and non-traditional livestock production primarily forlocal and specialty markets. Along with central eastern Alaska, western Yukon Territory is thedriest part of the North American Subarctic. Because portions of these regions are alreadynatural grasslands too dry for tree growth, irrigation would certainly be required to exploitimproved temperature regimes for crop agriculture. In the central and eastern Canadian Arctictemperatures currently fall well below minimums necessary for traditional agriculture, althoughwarming trends can be detected. Across much of the Canadian far north, further climate warmingas produced by the scenarios would move the zone of temperature suitability northward into aregion largely dominated by soils with relatively poor suitability for agriculture. Broad areas ofTurbic and Organic Cryosols cover these northern landscapes (Lacelle et al. 1998), and in theglaciated north soils are often, thin, stony, and derived from nutrient-poor bedrock parentmaterials. Areas with pockets of suitable climates and soils close to population centers couldbecome locally important for the production of food for established populations wishing toobtain greater self-sufficiency.
(Footnote: Data in from 2002 report of the annually updated Alaska Agricultural StatisticsService (http://www.nass.usda.gov/ak/alaska02/akcont02.htm).
Alaska has several climatically distinct agricultural regions including interior valleys andlowlands with warm and dry summer climates, coastal regions with cooler summers andmoderate to high precipitation, and a broad transition region in the major population zone ofsouthcentral Alaska. Most of the volume and value of agricultural production takes place in thetransition and interior locations. In the dry interior valleys heat sums necessary to mature grainssuch as barley are generally achieved, and recent trends of warming have improved the adequacyof this critical factor (Sharratt 1992, 1999). In interior valleys and the southcentral transitionregion there is a good correlation between years of excellent crop production and adequate and

Ch13 - Forests, Land Management and Agriculture ACIA Scientific Report
External Review January 2004 13–44 DO NOT CIRCULATE OR CITE
especially well timed early and mid growing season precipitation. However, persistent and heavyprecipitation in the late summer can delay, reduce, or even ruin crop harvest and recovery.
Alaska in 2001 had about 580 farms and ranches (sales greater than $1,000) covering 370K ha,the great majority of which is unimproved pasture. Alaska crop production in the same yearincluded 105 tonnes of potatoes (including high-value certified virus-free seed potatoes), 27Ktonnes of hay, and 800 tonnes of carrots, and over 250K bushels of oats and barley. Alaskaproduced 11.5K cattle, 1.2K sheep, and 1K hogs and 15K domestic reindeer in 2001. A few farmand ranch operations are producing species such as elk (wapiti), bison, yak, and musk-ox, anddomestic reindeer. Some Alaska crops and pastures are already moisture-limited, especiallyunder the warmer summer climate of recent years (Sharratt 1994). Scenarios of further climatewarming without a significant increase in early and mid-season precipitation in these areaswould not be favorable, although irrigated crop production would be able to take advantage ofthe greater growing season heat units. Scenarios of climate warming in coastal areas wouldgenerally be favorable, although much of the area is made up of steeply mountainous terrain withlittle soil development. In the southcentral transition region, Alaskan agriculture faces strongeconomic challenges from competing urban and suburban land uses in the region whereagriculture is best established. Large new areas are available to be opened to agricultureespecially in central Alaska, but no recent public policy initiative to do so has emerged.National-level agricultural subsidy payments to Alaskan farmers have nearly doubled in the lastdecade to over $2 million, or about 20% of net farm income.
In 2000 northern Finland contained about 10,000 farms, of which about 50% were dairy farms.The average farm size is about 11.5 ha. While the land ownership remains configured in thesefarm properties, the number that are producing significant amounts of dairy products hasdecreased rapidly in recent years (Häkkilä, 2002). Reasons for the decline include surpluses ofdairy products, small quantities produced, and especially social change. These changes includemigration of farm owners to towns and cities with more attractive professional opportunities andhigher income potential, and the conversion of inactive farms into country residences for towndwellers.
(Footnote: Data from Statistics Norway (www.ssb.no/english/subjects/10/04/10/).The three northern Norwegian counties include 95K ha of land in agricultural use in 1999,distributed among about 6,500 owners. The area receives nearly the maximum warminginfluence on land in the Arctic of the Gulf Stream, so there is a strong maritime influenceespecially in the south and west of the region. Climate factors limiting to agriculture aremaximum and total summer warmth, often associated with cool and wet maritime weather.Prolonged cool wet maritime conditions can result in slow plant growth and failure of crops tocomplete development, wet fields and crops at harvest time, and, occasionally, outbreaks of plantdiseases. Agricultural operations are generally small, with only 570 holdings >30 ha and only 50holdings >50 ha. Employment in agriculture, horticulture, and forestry in the three county regionin 1999 totaled about 6,500 full time equivalents. Many of these farming operations fit into adiversified set of annual activities that include wage employment, fishing, cultural landscapemaintenance, and personal consumption and non-cash trade of crops. Nearly all farmingoperations include cultivated meadows for hay and pasture, and about one third produce

Ch13 - Forests, Land Management and Agriculture ACIA Scientific Report
External Review January 2004 13–45 DO NOT CIRCULATE OR CITE
potatoes. Only 45 farms, all in the southernmost county of Nordland, produce grain or oilseedcrops.
Climate warming is likely to move the grain production boundary northward. Climate changescenarios that enhance the maritime effect, especially in the summer, are not favorable toagriculture in this coastal region, although the effects may be lessened inland. Scenarios thatincrease growing season length and increase daily maximum temperatures while maintaining orslightly decreasing persistence of growing season clouds and rain are favorable to agriculturalproduction in this area. Agriculture in the far north of Norway will be strongly influenced bynational and European policies to subsidize rural populations and landscapes perhaps more thanany other factor. The government of Norway is likely to have sufficient revenues available frompetroleum to intervene strongly in the economics of northern community infrastructure andagriculture to obtain its social and environmental goals for some time to come.
Iceland is surrounded during the growing season by a cool ocean surface; locations farthestinland from the cool maritime influence are covered with glacial ice. As a result, lack of summerwarmth has been the chronic limitation to Icelandic agriculture, especially in years when sea icereaches the Icelandic shoreline. Icelandic agriculture traditionally has been limited to the cropsmost tolerant of cool season conditions. Even small amounts of warming would begin to changethis situation significantly. Iceland produces over 2 million m3 of hay, more than 10K tonnes ofpotatoes, and over 4K tonnes of cereal grains (barley), (Statistics Iceland 2003). Glasshouseagriculture using abundant geothermal heat supports the production of about 1K tonnes oftomatoes and cucumbers. In 2001 Iceland’s 3000 farms produced 473K sheep, 70K cattle, and73K horses, and 106K liters of processed milk (Statistics Iceland 2003). During the last decadeof the 20th century sheep and hay production have declined at double digit rates, largely for non-climatic market, policy, and social reasons. Numbers of cattle and horses (the famous Icelandicpony) have remained level. Icelandic agriculture employs about 4,400 people which is 3.1% ofthe total employment. Greenland supports about 20K sheep and over 3K reindeer (StatisticsGreenland 2003).
The entrance of Iceland into the European Community Common Agricultural Programme (CAP)has been the major force in Icelandic agriculture in the last decade. In general, CAP subsidieshave sustained smaller and higher cost producers and rural economies, introduced limitations forcertain products, reduced risk to producers, and transferred funds from consumers to producers.Climate warming would permit accelerated expansion of cereal grain production and possiblynew oilseed crops, reduce cost for winter forage for livestock, and allow increased per unit cropyields where nutrients or water are not limiting. There are complex multiple goals in Icelandicagricultural including food production, employment, rural stability, landscape amenity, andenvironmental protection. Because the agricultural system exists in a highly interventionistpublic policy environment, a traditional economic analysis would likely show that national andCAP policies will be more influential than climate warming in the future of Icelandic agriculture.(See section 13.3.4.4 for discussion of forest land use conversion of agricultural land).
13.5.3 Approach to analysis of scenarios and agriculture

Ch13 - Forests, Land Management and Agriculture ACIA Scientific Report
External Review January 2004 13–46 DO NOT CIRCULATE OR CITE
The 14 sites that were chosen for examination of the scenario output were selected to representareas in the northern part of the boreal region currently supporting commercial agriculture andareas north of current potential (see Section 13.4.1). We did not consider soil effects for thisanalysis. We realize that soil can be a major limitation to agriculture, and changes in soilprocesses following climate change can have significant impacts on agriculture. Large tracts ofsoils already exist in much of the circumpolar north that are suitable for agriculture if otherconstraints are removed, with the exception of the expansive Canadian Shield covering much ofnorthern Canada, where the granitic soils are shallow and nutrient poor.
For this analysis, we used growing degree days (GDD) as a primary determinant for climatesuitability for producing annual crops. Growing degrees days (a measurement of accumulatedheat energy) are considered a good predictor of development of plant phenology and are oftenused to predict timing of different plant growth stages. For example, GDD are often used byfarmers and extension agents to determine optimum harvest time for forage crops. Some majorlimitations of use of growing degree days are that they may vary for different cultivars, locations(Sanderson et al. 1994), and growth stages (Bourgeois et al., 2000, Kleemola, 1991). Heat energyrequirements for plants interact with other environmental factors, such as moisture stress andphotoperiod (Bootsma, 1984, Nuttonson, 1955, 1957) and thus, use of degree days may not be agood predictor of plant development under stress. Heat requirements for plant developmentgenerally decrease with increasing photoperiod, so fewer growing degree days are needed toreach a given growth stage at high latitudes than at low latitudes.
In areas with humid autumns, GDD may equal or exceed the threshold for a given crop to reachmaturity, but wet conditions may not allow the crop to dry enough to allow it to be mechanicallyharvested economically. Thus, some projections indicating suitability for some crops mayactually not be true due to this problem, especially in more humid zones within the northernboreal region.
We obtained values from the literature on GDD requirements for various crops from as highlatitude areas as possible and assumed similar GDD requirements for a given crop throughout theregion. A problem with using GDD data from the literature for determining climate suitabilityfor a given crop is that different reports use different base temperatures for calculating GDD. Forexample, for cool season crops, many agriculturists often use a base of 5oC, while others use abase of 0oC. Others use some experimentally determined growth threshold as the basetemperature. If no information existed for GDD requirements at 5oC or 0oC base, we estimatedGDD requirements for the base temperatures of interest from published GDD based on similarbase temperatures. In some cases there was not enough information to do so for both 5oC and 0oCbase temperatures. Despite its limitations, use of GDD is a widely reported and accepted methodto approximately predict crop phenology. We believe that growing degree day analysis is a goodway to estimate climate suitability for producing annual crops.
For predicting potential water stress, we used potential evapotranspiration (PET) from themodels minus growing season precipitation (PPT). Positive values indicate a potential waterdeficit, which we interpret to mean potential water stress, which could limit crop yields orquality. We realize that many crops can produce acceptable yields even under potential waterdeficit conditions and that water stress is also affected by soil water holding capacity, rooting
Ch13 - Forests, Land Management and Agriculture ACIA Scientific Report
External Review January 2004 13–47 DO NOT CIRCULATE OR CITE
depth, timing of the precipitation (such as spring vs. summer), and type of storms (for example,infrequent large rainfall events may result in more loss of water due to runoff than small,frequent storms).
For this report, we ignored effects of atmospheric CO2 enrichment and changes in crops pestsother than to estimate the potential general effects. Few field studies have been done on CO2enrichment effects on crop plants at high latitudes and results from more temperate zones maynot be transferable to northern areas, thus we have little data on which to judge effects of CO2enrichment. Climate effects on pests are complex and difficult to forecast. We believe that suchan analysis is needed, but have opted to leave detailed analysis of such effects to futureassessments.
For this analysis, we selected a few annual crops which are currently well adapted or aremarginally adapted for parts of the region and which have potential to become economicallyimportant crops for animal feed (cereal grains), human food, (beans, peas, potatoes, wheat), oroilseeds (canola, sunflowers).
13.5.4 Climate limitations and influences
If model projections for GDD for a given site equaled or exceeded the minimum GDDrequirements for a given crop but were below the mid-point of the range given in Table 13.03,we considered the crop to be marginal. We based our analysis on 20 year averages, partly tosmooth out much of the variability in the data and also because we believe it would require about20 years under a changing climate regime for farmers to accept the change and then adoptfarming practices that included new crops.
Table 13.03. Growing degree day requirements to reach maturity for various annual crops:
Some of the GDD requirements for some of the crops of interest presented in Table 13.03 for thetwo different base temperatures appear inconsistent (for example, seed peas appear to requirefewer GDD at base 5o than canola but may require more at the upper end of the range). This maybe due to errors in the literature, errors in our estimation of GDD requirements, or it may meanthat either the 5oC or 0oC base temperature is not appropriate for some crops. This may causeerror in determination of climate suitability for some crops. Data in Table 13.04 are estimates ofnumber of accumulated growing degree days (based on air temperatures) required for foragecrops to reach optimum time of harvest. These may be underestimates for high latitude regions,as low soil temperatures may delay initiation of growth, especially in spring.
Table 13.04. GDD (base 5oC) required for 3 forage crops to reach optimum stage for harvest
Since the models use large grid cells, which often contain large tracts of terrain not likely tobecome suitable for agriculture (such as high mountains), and since some of the models give dataobviously not realistic even for present conditions, we chose to use proportional changes frompresent, which we compared to real weather data, rather than use actual projections provided bythe models. For each parameter analyzed (GDD at base 0 and 5oC, growing season water

Ch13 - Forests, Land Management and Agriculture ACIA Scientific Report
External Review January 2004 13–48 DO NOT CIRCULATE OR CITE
deficit), we selected the models that project the extremes (i.e. highest and lowest) for eachlocation (Table 13.05).
Table 13.05. Projected GDD for model projecting high and low extremes at each site
Success of perennial crops is governed more by winter survival success than by growing seasonweather conditions. Factors such as timing of killing frosts, warm spells during winter, length ofdormant season, snow depth, and winter temperatures all interact to affect winter survival. Warmperiods during winter, especially prolonged temperatures above 0oC, can be detrimental toperennial plants by reducing winter dormancy and depleting carbohydrate reserves (Crawford,1997). The complexity of these interactions makes prediction of climate change effects on thesecrops difficult.
13.5.5 Growing Degree Day analysis
When GDD0 was used for analysis, all models indicated all locations being suitable for green peaproduction early in this century, and the high extreme models (GFDL or CCC) projectedclimates suitable for barley at all locations by 2030. When GDD5 were used, the modelsestimating the most GDDs projected Reykjavik and Tromso being unsuitable for green peas by2030. Potatoes were indicated by GFDL to be suited for all but Reykjavik, Tromso, Rovaniemi,and Magadan (marginal at Umeå and Archangelsk) by 2030, while the low extreme models(Hadley or CSM) showed only Fairbanks, Fort Vermillion, Thompson, Goose Bay, Novosibirsk,and Yakutsk as being suitable by then. Thus, projections for potatoes may be too low, as potatoesare already produced, at least marginally, in many areas not projected to be suitable by 2030.This may be because use of growing degree days may not a good way to predict phonologicaldevelopment in potatoes (Shaykewich and Blatta 2001). Models generally projected all exceptthe coolest sites in Scandinavia as having climates at least marginally suitable for potatoproduction by century end.
All model projections indicate climate suitability for dry pea production at all locations butReykjavik and Tromso by 2030 when GDD5 were used for analysis, although the low extrememodels (Hadley or CSM) showed Goose Bay, all of the Scandinavian sites, and Archanglesk andMagadan being unsuitable for dry peas based on using GDD base 0o for analysis. All modelsindicate all sites except Reykjavik and Tromso having climates suitable (marginally so at GooseBay) for seed pea production by the end of the century. The high extreme models (GFDL orCCC) indicated all of the North American sites (marginal at Big Delta, Whitehorse, and GooseBay) and Novosibirsk and Yakutsk having climates suitable for dry bean production by 2030, butthe low extreme models (Hadley or CSM) show dry bean production being only marginallysuited even at the warmest sites (Fairbanks, Fort Vermillion, Thompson, Novosibirsk) by 2030.Models projecting the highest number of heat units at a given location indicated all sites butReykjavik, Tromso, and Rovaniemi becoming at least marginally suitable for dry beans by 2060,whereas, the low extreme models (Hadley or CSM) indicated only Fairbanks, Fort Vermillion,Thompson, Goose Bay, Novosibirsk, and Yakutsk as being sites for likely dry bean productionby 2090.

Ch13 - Forests, Land Management and Agriculture ACIA Scientific Report
External Review January 2004 13–49 DO NOT CIRCULATE OR CITE
Most models indicated most locations being at least marginally suitable for all of the cerealgrains by the end of the century, although the low extreme models indicated only Fairbanks, FortVermillion, Thompson, Goose Bay, Novosibirsk, and Yakutsk as being well suited for wheat by2090 when GDD5 was used for analysis, The high extreme model (GDFL or CCC) for eachlocation showed canola being suited at all locations except Tromso by 2030, when using GDD0for analysis, All models indicated that climate will be at least marginally suited for oilseedsunflowers by 2030 at Fairbanks, Thompson, and Novosibirsk and the high extreme modelsprojected climates suitable for sunflowers at all sites but Goose Bay, Reykjavik, and Tromso(marginal at Rovaniemi) by the 2090. Conversely, the low extreme models indicated onlyFairbanks, Thompson, Novosibirsk, and Yakutsk as being well suited and Big Delta, and FortVermillion as being marginally suited for this crop by near the end of the century.
Assuming amount of heat is the main factor limiting yields and number of harvests of perennialforage crops, model projections indicate warmer growing seasons are to likely increase thepotential number of harvests and hence seasonal yields for perennial forage crops at all locations.Uncertainty about winter conditions make forecasts about survival potential for crops difficult.Warmer winters could actually decrease survival of some perennial crops if winter thawsfollowed by cold weather become more frequent. Crops adapted to certain types of winter stressmight experience different types of stresses if winter temperatures rise and winter thaws becomemore frequent. However, lengthened growing seasons, especially in autumn, may result innorthward extension of climate suitable for alfalfa production.
All of the models indicate high variability in growing season GDD accumulation among years.Thus, even though 20 year averages may indicate climates well suited for crops for a given area,frequency of growing seasons cool enough to limit production may convince farmers that the riskfor producing these crops is too high. Thus, farmer’s perception of risk could be a limiting factorfor northward advancement of many of the crops analyzed.
13.5.6 Precipitation and Potential Evapotranspiration analysis
Most of the models projected increases in precipitation at most locations, with some forecastingup to 20% increases over present by 2090.There was a great deal of variability among models,with no one model consistently forecasting the greatest or smallest change in PPT over locations.A few models projected negative changes in PPT for a few sites. For example, CSM shows adecrease of 5% at Whitehorse (compared to present) during the 2011-2030 time frame andHadley showed a decrease of about 1% at Umeå and about 4% at Tromso by the 2090. Allmodels projected PET generally increasing over time at all locations, with much variabilityamong models and locations.
Some locations in the Subarctic already experience water deficits large enough to negativelyimpact crop yields. For example Sharratt (1994) indicated that barley yields in interior Alaskaare depressed in about 5 of 9 years due to insufficient water supply. Water deficits were usuallyprojected to increase over time, with GFDL usually showing the smallest deficits and Hadley andCSM usually projecting the largest (Table 13.06). Most models show rather large water deficits,especially by end of analysis period. However, the Hadley model projects rather large watersurpluses throughout the 21st century at Goose Bay, and slight surpluses at Reykjavik until about

Ch13 - Forests, Land Management and Agriculture ACIA Scientific Report
External Review January 2004 13–50 DO NOT CIRCULATE OR CITE
mid-century (Table 13.06). Most models, but especially CSM, show fairly small deficits atTromso. These results indicate that water may become a major limiting factor for production ofmost crops at all but the maritime sites in the boreal zone. Unless irrigation is supplied, whichmay not be economical for most of the crops analyzed, production may be limited in many areasto drought resistant crops, such as cereal grains.
Table 13.06. Projected water deficits (mm) for model projecting high and low extreme at eachsite.
13.5.7 Indirect effects of climate change on agriculture
This analysis has focused on the direct effects of changes in growing season temperatures (usinggrowing degree days as crop growth potential indicators) and moisture relationships on potentialagricultural crop production in the next century in high latitude regions. However, indirecteffects of climate change may have as much or greater impacts on agricultural development asdirect effects. We mention several of them here without in-depth analysis, but to acknowledgetheir potential importance and alert those involved in future assessments that these factors needto be considered.
The development of crop disease requires suitable host, pathogen, and environmental conditions.Temperature and moisture are critical for the spread of many plant diseases (IPCC 1996, WG II,Section 13.4.3), especially in a region as severely heat-limited as the Arctic. Under conditions ofclimate warming, risk of crop damage increases in all regions of the northern half of Europe(Beniston et al. 1998). The severity and number of species capable of reaching infestation levelsfor North American agriculture may increase with less severe winters (Shriner et al. 1998).Based on these findings in the literature, disease and weed pests are likely to increase throughoutthe Arctic region under the scenarios. We do not project these problems to offset potential yieldincreases or eliminate the potential for new crops in most cases. However, severe outbreakscould indeed have that effect. For example, climate warming in Finland may increase incidenceof potato late blight to the point that it will significantly decrease potato yield in that country(Carter et al. 1996).
While we did not analyze for effects of atmospheric CO2 enrichment, higher CO2 concentrationsmay result in potential yield increases for most crops (Warrick, 1988). Lack of experimental dataon CO2 fertilization effects on crops in high latitude regions make in-depth analysis of this effectimpossible at the present time.
Lack of infrastructure development, small population sizes (thus limiting local markets) anddistance to large markets are likely to continue to be major factors limiting agriculturaldevelopment in most of the northern part of the boreal region during the next century. A possiblyprofound potential for indirect impact of climate warming on agriculture in the Arctic andSubarctic is the effect on transportation, including land transport and the prospect of regularocean shipping across the Arctic Ocean with less ice cover or no ice (see Chapter 15). Thawingof permafrost that is susceptible to ground subsidence is disruptive to existing roads andrailroads. Ultimately, once the ground surface thaws, a potentially more stable foundation isavailable for permanent transportation routes and facilities. Shipping across the Arctic could

Ch13 - Forests, Land Management and Agriculture ACIA Scientific Report
External Review January 2004 13–51 DO NOT CIRCULATE OR CITE
potentially greatly enhance economical trade of agricultural products, especially products uniqueto these regions, and thus enhance development of commercial agriculture in the far north.
If the net effect of climate change is greater world agricultural production, then prices of food arelikely to be lower for the world as a whole as long as the rather large subsidies that influenceprices do not markedly increase or decrease. Lower world food prices would reduce the incentiveto rely on local commercial or subsistence production in the Arctic region. The opposite is true ifclimate change reduces world agricultural production. A key component of the ability of worldfood production to cause this price competition (other factors being equal) is shipping cost.Regular shipping across an ice-free Arctic Ocean (see Chapter 15) would very likely lowertransport costs for non-perishable bulk commodities such as grains or fertilizers, and therebylower prices for the basic inputs to the agricultural system in the Arctic. In addition the export ofbulk finished products from the Arctic could be stimulated by Arctic shipping. The volume ofagricultural imports to or exports from the Arctic is unlikely to generate the economies of scalethat would support regular shipping at a major cost advantage for agriculture within the Arctic, atleast not within the ACIA analysis period. Mining and petroleum industries would be more likelyto generate higher volumes of cargo to be moved, although there is only a limited ability tochange the kind of cargo handled by specialized vessels. However, if Arctic ports of call wereintegrated into the much higher volume of general trade between the northern continents, thenprice advantages for agriculturally related Arctic cargoes would be much more likely.
The impacts of lower transport cost on Arctic commercial agricultural production would becomplex. Cheap, regular Arctic shipping would provide a price advantage that could possiblystimulate production of unique Arctic commodities such as reindeer and caribou meat or muskox milk or cheese, as long as other factors affecting demand were favorable. On the other hand,lower costs of shipping would likely discourage production in the Arctic of agriculturalcommodities widely produced elsewhere, unless there were a decisive shift in the overall worldsupply or demand structure. Even though the trade, shipping, and economic factors of aseasonally ice-free Arctic and regional costs compared to future supply and demand are likely tobe decisive in the future of Arctic agriculture, the data to analyze them in a meaningful way atthis point are lacking.
In Europe, the US, and Canada public policy and interventions are major factors that agriculturalproducers confront in determining their activities. In many cases national or trading areaagricultural transfer payments and rules of production correlate especially well with the annualprofile of agriculture in the Arctic, as noted in the country summaries of current agriculture.There is no obvious trend to suggest this large role of government policy would change duringthe ACIA period of analysis. Russia is experiencing a period of population and economicconsolidation in its northern regions, an adjustment required after investments made duringSoviet times could not be sustained under new conditions. Given the strong dominance of stateownership of land, governmental policy will be a decisive factor in the future of agriculture mostof the Arctic nations. The current agricultural profiles also suggest that local markets are vital tothe agricultural sector in the Arctic. If climate change results in increases in the humanpopulation resident in the Arctic, then the entire agricultural sector is likely to expand given thehistoric positive relationship between regional population and agricultural production.
Ch13 - Forests, Land Management and Agriculture ACIA Scientific Report
External Review January 2004 13–52 DO NOT CIRCULATE OR CITE
13.6 Tree-rings and past climate
13.6.1 Issues in long-term climate reconstructions from tree-rings
The most recent historical period of Northern Hemisphere warming of similar magnitude (butpossibly different in its cause) to recent decades is the Medieval Warm Period (MWP) of AD900-1300 (see also Chapter 2.5.3.7). But interpretations of the climate during the MWP do notalways agree. Some evidence suggests that the MWP was not general across the planet and didnot exceed the current warming in its fluctuations (Hughes and Diaz, 1994; Mann et al., 1998).Other evidence suggests a greater (1 to 1.5°C) warming across the Northern Hemisphere duringthe MWP (Dahl-Jensen et al., 1998, Naurzbaev and Vaganov, 2000; Esper et al., 2002) comparedto today. The main tool to examine this problem of the context of recent warming in mostterrestrial regions of the far north is long-term climate reconstructions base on tree-rings becausefew or no other historical records exist and marine proxies and ice cores cannot provide therequired geographic coverage or detail.
Tree-ring chronologies serve as a useful basis for reconstruction of natural temperaturefluctuations in the high latitudes over millennial intervals, although the degree of reliabilityneeds to be assessed carefully in each application. An important potential limitation is that therelationship of tree-rings and climate may have changed somewhat at different periods of time.However, compared to other indirect sources of climatic information, tree-ring chronologieshave certain important advantages. First, a complete annual sequence of climatic information isrecorded in tree-rings. Second, in northern Eurasia where trees reach a maximum age of 1100years there is a dense dendroclimatic network allowing spatially detailed quantitativetemperature reconstruction for the last 500-600 years, and in some regions for more than twomillennia (Vaganov et al., 1996 b; 2000; Hughes et al., 1999; Briffa et al., 2001).
Recent Northern Hemisphere warming is unique within the last several centuries for the rate andamplitude of warming (Briffa et al., 1996, 2001; Mann et al., 1998). Some climatic models,which include anthropogenic activity, calculate that the greatest magnitude of warming, in therange of 3 to 4°C, should have occurred over the last several centuries in the high latitudes of theNorthern Hemisphere (Budyko and Izrael 1987; Kondrat’ev, 2002). However, temperaturereconstructions, generally of the warm season or even a specific portion of the warm season,based on tree-ring chronologies from the subarctic area of Eurasia, a region that makes up a largepart of the predicted zone of maximum warming, do not show warming of the predictedmagnitude (Briffa et al., 1998; Naurzbaev and Vaganov, 2000). This may be partly due to thedisproportionate influence of temperatures during the warm season on tree growth, genuine localgeographical climate variability, or issues in calibrating the rings to predict temperature withuniformly reliability throughout the whole period of analysis.
13.6.1 Tree-ring evidence of climate change in the historical past from central Eurasia
In this section several aspects of high resolution proxy records based on tree-ring chronologiesare examined. 1) Subarctic temperature reconstruction of Asia is compared with the mainclimatic forcing mechanisms during the last several centuries. 2) Reconstructed temperaturefluctuations during the MWP are compared with recent temperature changes in high latitudes of
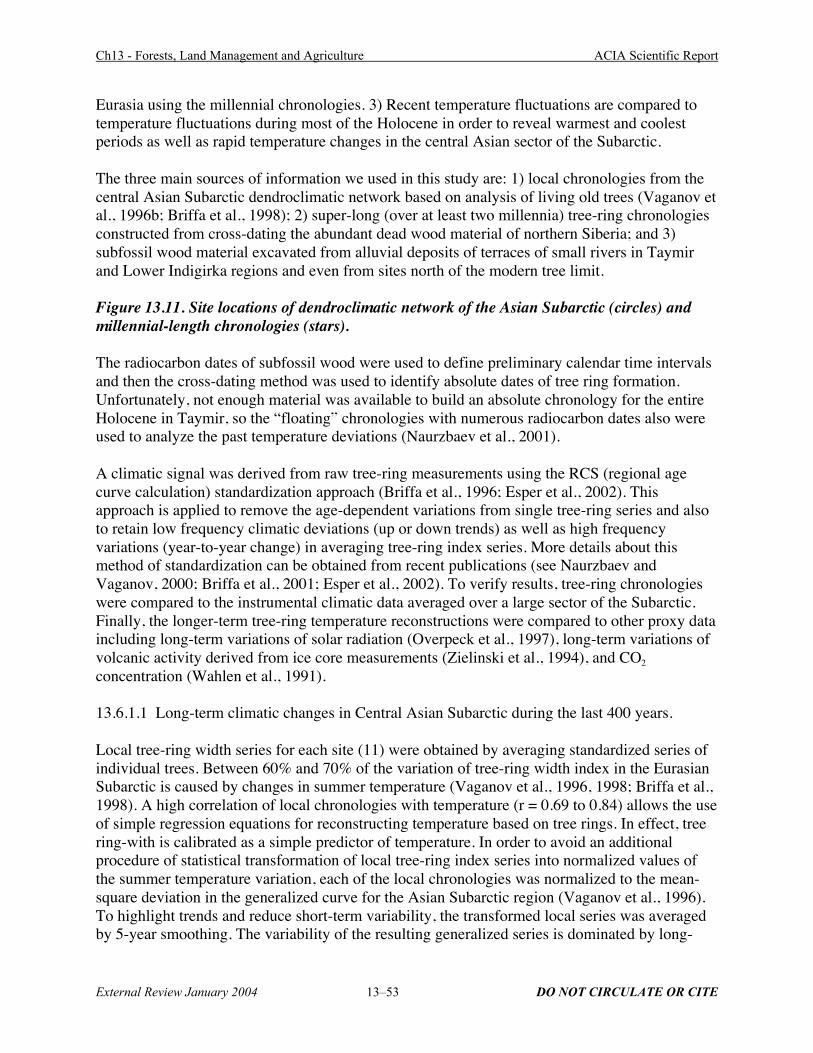
Ch13 - Forests, Land Management and Agriculture ACIA Scientific Report
External Review January 2004 13–53 DO NOT CIRCULATE OR CITE
Eurasia using the millennial chronologies. 3) Recent temperature fluctuations are compared totemperature fluctuations during most of the Holocene in order to reveal warmest and coolestperiods as well as rapid temperature changes in the central Asian sector of the Subarctic.
The three main sources of information we used in this study are: 1) local chronologies from thecentral Asian Subarctic dendroclimatic network based on analysis of living old trees (Vaganov etal., 1996b; Briffa et al., 1998); 2) super-long (over at least two millennia) tree-ring chronologiesconstructed from cross-dating the abundant dead wood material of northern Siberia; and 3)subfossil wood material excavated from alluvial deposits of terraces of small rivers in Taymirand Lower Indigirka regions and even from sites north of the modern tree limit.
Figure 13.11. Site locations of dendroclimatic network of the Asian Subarctic (circles) andmillennial-length chronologies (stars).
The radiocarbon dates of subfossil wood were used to define preliminary calendar time intervalsand then the cross-dating method was used to identify absolute dates of tree ring formation.Unfortunately, not enough material was available to build an absolute chronology for the entireHolocene in Taymir, so the “floating” chronologies with numerous radiocarbon dates also wereused to analyze the past temperature deviations (Naurzbaev et al., 2001).
A climatic signal was derived from raw tree-ring measurements using the RCS (regional agecurve calculation) standardization approach (Briffa et al., 1996; Esper et al., 2002). Thisapproach is applied to remove the age-dependent variations from single tree-ring series and alsoto retain low frequency climatic deviations (up or down trends) as well as high frequencyvariations (year-to-year change) in averaging tree-ring index series. More details about thismethod of standardization can be obtained from recent publications (see Naurzbaev andVaganov, 2000; Briffa et al., 2001; Esper et al., 2002). To verify results, tree-ring chronologieswere compared to the instrumental climatic data averaged over a large sector of the Subarctic.Finally, the longer-term tree-ring temperature reconstructions were compared to other proxy dataincluding long-term variations of solar radiation (Overpeck et al., 1997), long-term variations ofvolcanic activity derived from ice core measurements (Zielinski et al., 1994), and CO2concentration (Wahlen et al., 1991).
13.6.1.1 Long-term climatic changes in Central Asian Subarctic during the last 400 years.
Local tree-ring width series for each site (11) were obtained by averaging standardized series ofindividual trees. Between 60% and 70% of the variation of tree-ring width index in the EurasianSubarctic is caused by changes in summer temperature (Vaganov et al., 1996, 1998; Briffa et al.,1998). A high correlation of local chronologies with temperature (r = 0.69 to 0.84) allows the useof simple regression equations for reconstructing temperature based on tree rings. In effect, treering-with is calibrated as a simple predictor of temperature. In order to avoid an additionalprocedure of statistical transformation of local tree-ring index series into normalized values ofthe summer temperature variation, each of the local chronologies was normalized to the mean-square deviation in the generalized curve for the Asian Subarctic region (Vaganov et al., 1996).To highlight trends and reduce short-term variability, the transformed local series was averagedby 5-year smoothing. The variability of the resulting generalized series is dominated by long-

Ch13 - Forests, Land Management and Agriculture ACIA Scientific Report
External Review January 2004 13–54 DO NOT CIRCULATE OR CITE
term climatic changes. The obtained generalized curve was compared with other temperaturereconstructions for circumpolar Northern Hemisphere (Overpeck et al., 1997) as well as with themain climatic forcing mechanisms.
Temperature variations occurring in the Asian Subarctic over the past 400 years correspond wellto those observed across the circumpolar region (Figure 13.12). Both curves illustrate mostclearly the temperature rise from the beginning of the 19th century to the middle of the 20th
century. The main discrepancies between two curves occur within the second decade of the 19th
century and after 1950s. The correlation for pre-industrial period is significant, but low (r = 0.38,p<0.05), and markedly increases (r = 0.65, p<0.001) for the industrial period of 1800-1990 dueto a distinct temperature rise, which is reliably exhibited in both curves.
Figure 13.12. Variations of temperature proxy records in circumpolar regions of theNorthern Hemisphere: 1- according to data in Overpeck et al., (1997), 2 –data for AsianSubarctic (see Figure 13.14 for locations of sites).
More interesting is the correlation analysis of both curves (Figure 13.12) with the main climaticforcing factors. The Asian Subarctic generalized curve shows a significant correlation with allmain climatic forcing factors: with solar radiation (r = 0.32 for the whole period and 0.68 for theindustrial period from 1800 to 1990), with volcanic activity (r = -0.41 for the whole period and–0.59 for industrial one), and with CO2 concentration (r = 0.65 for period since the year 1850).The circumpolar curve (Figure 13.12) is not significantly correlated with volcanic activity andhas only lesser correlations with solar radiation and carbon dioxide concentration. This isbecause more homogenous proxy data (only the tree-ring chronologies) were used for AsianSubarctic reconstruction instead of different sources of proxy records used in the circumpolarcurve (i.e. tree-rings, lake sediments, isotopes in ice cores). Correlations with climatic forcingfactors obtained indicate that natural factors (solar irradiance and volcanic activity) explainedmore of common variability in temperature changes than the carbon dioxide concentration.Spatial-temporal analysis of reconstructed summer temperature variations in the Asian Subarcticrevealed that recent warming is characterized by increased frequency of years with anomalouswarm summers over the whole Subarctic territory of Siberia (the latitudinal transect about 5000km long) (Vaganov et al., 1996).
13.6.1.2 Medieval and current warming in the north-eastern Eurasia inferred from millenniatree-ring chronologies.
Millennium length tree-ring chronologies were constructed from samples at two sites close to thenorthern treeline, 1) east Taymir (71°00’ N, 102°00’ E) and 2) northeast Yakutia (69°24’ N,148°25’ E). These stands are made up of Gmelin larch and Cajander larch in which the oldestliving trees are up to 1100 years old (Vaganov et al., 2000). Well preserved dead tree trunksallowed the record to be extended earlier than the maximum age of the living samples, allowingthe construct of absolutely dated tree-ring chronologies for the time periods from B.C. 431 toA.D. 1999 and from B.C. 359 to A.D. 1998, respectively. The RCS approach was applied todistinguish variation caused by climatic change. These representative tree samples were highlyresponsive to recorded temperature, allowing the reconstruction of temperatures of the last twomillennia with annual resolution. With this long-term record, the instrument record of
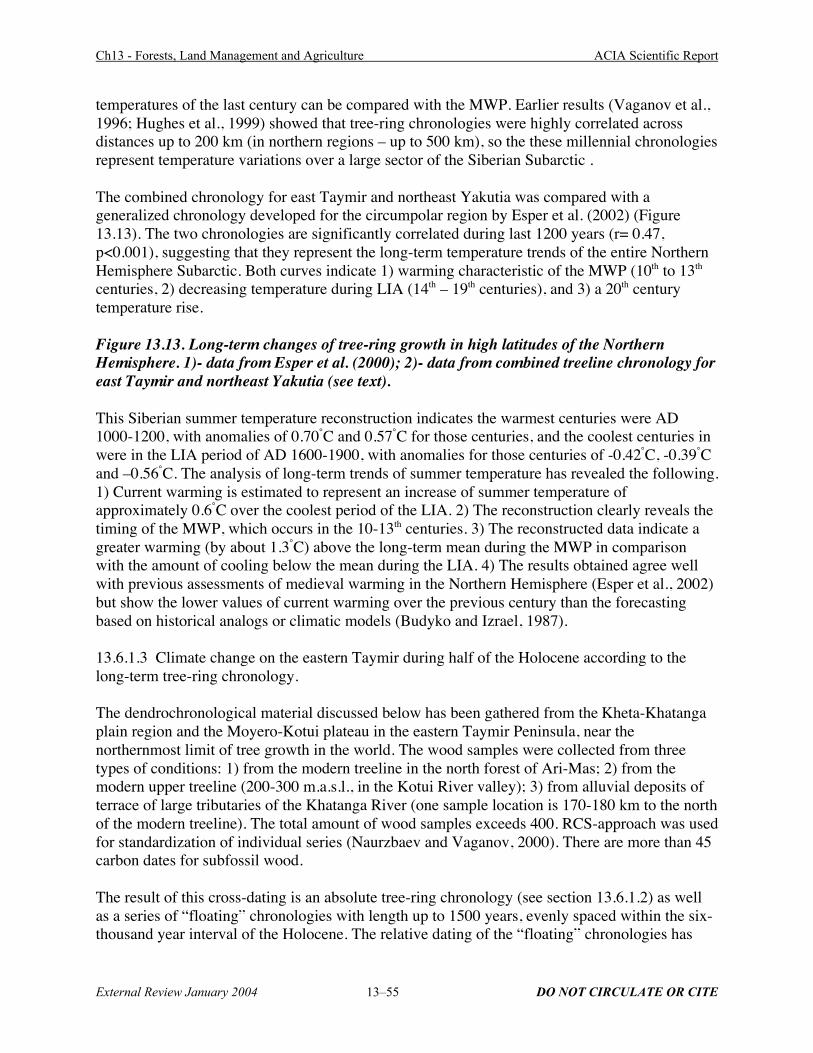
Ch13 - Forests, Land Management and Agriculture ACIA Scientific Report
External Review January 2004 13–55 DO NOT CIRCULATE OR CITE
temperatures of the last century can be compared with the MWP. Earlier results (Vaganov et al.,1996; Hughes et al., 1999) showed that tree-ring chronologies were highly correlated acrossdistances up to 200 km (in northern regions – up to 500 km), so the these millennial chronologiesrepresent temperature variations over a large sector of the Siberian Subarctic .
The combined chronology for east Taymir and northeast Yakutia was compared with ageneralized chronology developed for the circumpolar region by Esper et al. (2002) (Figure13.13). The two chronologies are significantly correlated during last 1200 years (r= 0.47,p<0.001), suggesting that they represent the long-term temperature trends of the entire NorthernHemisphere Subarctic. Both curves indicate 1) warming characteristic of the MWP (10th to 13th
centuries, 2) decreasing temperature during LIA (14th – 19th centuries), and 3) a 20th centurytemperature rise.
Figure 13.13. Long-term changes of tree-ring growth in high latitudes of the NorthernHemisphere. 1)- data from Esper et al. (2000); 2)- data from combined treeline chronology foreast Taymir and northeast Yakutia (see text).
This Siberian summer temperature reconstruction indicates the warmest centuries were AD1000-1200, with anomalies of 0.70°C and 0.57°C for those centuries, and the coolest centuries inwere in the LIA period of AD 1600-1900, with anomalies for those centuries of -0.42°C, -0.39°Cand –0.56°C. The analysis of long-term trends of summer temperature has revealed the following.1) Current warming is estimated to represent an increase of summer temperature ofapproximately 0.6°C over the coolest period of the LIA. 2) The reconstruction clearly reveals thetiming of the MWP, which occurs in the 10-13th centuries. 3) The reconstructed data indicate agreater warming (by about 1.3°C) above the long-term mean during the MWP in comparisonwith the amount of cooling below the mean during the LIA. 4) The results obtained agree wellwith previous assessments of medieval warming in the Northern Hemisphere (Esper et al., 2002)but show the lower values of current warming over the previous century than the forecastingbased on historical analogs or climatic models (Budyko and Izrael, 1987).
13.6.1.3 Climate change on the eastern Taymir during half of the Holocene according to thelong-term tree-ring chronology.
The dendrochronological material discussed below has been gathered from the Kheta-Khatangaplain region and the Moyero-Kotui plateau in the eastern Taymir Peninsula, near thenorthernmost limit of tree growth in the world. The wood samples were collected from threetypes of conditions: 1) from the modern treeline in the north forest of Ari-Mas; 2) from themodern upper treeline (200-300 m.a.s.l., in the Kotui River valley); 3) from alluvial deposits ofterrace of large tributaries of the Khatanga River (one sample location is 170-180 km to the northof the modern treeline). The total amount of wood samples exceeds 400. RCS-approach was usedfor standardization of individual series (Naurzbaev and Vaganov, 2000). There are more than 45carbon dates for subfossil wood.
The result of this cross-dating is an absolute tree-ring chronology (see section 13.6.1.2) as wellas a series of “floating” chronologies with length up to 1500 years, evenly spaced within the six-thousand year interval of the Holocene. The relative dating of the “floating” chronologies has

Ch13 - Forests, Land Management and Agriculture ACIA Scientific Report
External Review January 2004 13–56 DO NOT CIRCULATE OR CITE
been conducted in accordance with the calibrated radiocarbon age of the samples (Stuiver andReimer, 1993).
The resulting curve of tree-ring index (relative growth) extends over 6,000 years, and indicatesfavorable climatic conditions at about 6000 BP (Figure 13.14). This period of warmth isclassified as the Postglacial thermal maximum (Lamb, 1977a). The growth of larch trees at thattime surpassed the average radial growth of trees during the last two millennia by 1.5 to 1.6times. Tree growth (and temperature, accordingly) has decreased from the Postglacial thermalmaximum right through the end of the 20th century (Figure 13.14). Several samples of subfossilwood collected in the flood-plain of the Balakhnya River were accurately dated in accordancewith the “floating” chronology for the period from 4140 to 2700 BC. Due to geography of thewatershed, these samples could not have originated from the more southern regions, whichmeans that during the Postglacial thermal maximum the northern tree line was situated at least150 km further to the north than the present. The Postglacial thermal maximum also can beclearly identified by the relative levels of the stable isotope 13C in the annual tree rings(Naurzbaev et al., 2001). Increased 13C concentration in this species is highly correlated withwarm climate, confirming the reconstructed warmth during this period.
Figure 13.14. Comparison of multi-millennium length Taymir tree-ring chronologies(absolute and “floating”) (d) with other late Holocene paleotemperature records . a) Record ofsummer melting on the Agassiz Ice Cap, northern Ellesmere Island, Canada; b) Summertemperature anomalies estimated from the elevation of 14C dated sub-fossil pine wood samplesin the Scandes mountains, central Sweden; c) Paleotemperature reconstruction from oxygenisotopes in calcite sampled along the growth axis of a stalagmite from a cave at Mo i Rana, innorthern Norway. (redrawn from Figure 6 in Bradley 2000).
Quantitative evaluation of mean deviations of summer and average annual temperaturesdemonstrates higher temperature variability during the Postglacial thermal maximum, incomparison with the evaluation of mean deviations recorded in 20th century instrumental records(about 3.5°C). This corresponds well to the earlier published data (Naurzbaev and Vaganov,2000) and to findings of subfossil wood in alluvial deposits of Balakhnya River (150 km to thenorth from the modern timber line). Reliable dates for the Postglacial thermal maximum, inagreement with the “floating” chronologies, indicate that during this period sparse larch forestextended at least 1 to 1.5° latitude further north than the most northern forest massif of Ari-Mas.
A comparison of the long-term temperature reconstruction obtained for the Taymir with otherindicators of long-term temperature change in the high latitudes of the Northern Hemisphereduring the Holocene reveals several noteworthy features (Figure 13.14). During much of theHolocene, and especially starting from 9-8 KY BP the overall high latitude Northern Hemispheretemperature steadily decreased, although there were shorter but significant amplitude offluctuations. This distinct trend of general temperature decrease agrees with the Taymirchronology. The concurrence of characteristic temperature fluctuations can be seen, for example,in significant decreases 4 and 3 Kys ago and at the end of the 1st millennium BC, and increases atthe beginning of the 1st millennium BC, the MWP, and others. This coincidence suggests thatsome subregions of the polar area of the Northern Hemisphere experienced long-termtemperature changes in common with the high latitude mean, which can be reconstructed using

Ch13 - Forests, Land Management and Agriculture ACIA Scientific Report
External Review January 2004 13–57 DO NOT CIRCULATE OR CITE
various proxy data. These interpretations of the data are supported, for instance, by the results ofradiocarbon and dendrochronological dating of wood remains from the period of medievalwarming collected north of the modern treeline in the Polar Urals (Shiyatov, 1993) (see13.11.1.3). However, the some aspects of the question of the temperature increase during thePostglacial thermal maximum relative to observed current climate warming remain open.Deviations of data obtained from different sources are significant: from 0.6°C (glacier andstalagmite layers and bottom deposits) to 3 to 3.5°C (indicated by Taymir tree-ring chronologyand to the greatest extension of forest in Scandinavian mountains (Kullman and Kjallgren, 2000).These deviations of reconstructed temperature may have been influenced by local conditions, orby different sensitivity of indirect sources to temperature change, or by inadequate calibrationmodels. Unfortunately, at the present time it is impossible to determine the cause of thesedeviations.
Concerning the question of determining the anthropogenic component in climate variations athigh latitudes it is important to know: 1) is the climate (temperature) change already affected byincreasing greenhouse gas concentration? 2) can the rate of temperature increase be regarded asunprecedented in the modern period? A series of synthesizing studies, as well as results of theapplication of global climatic models establish a significant influence of anthropogenicemissions on the rate of temperature rise in the Northern Hemisphere (Mann et al., 1998).However, according to the long-term north Siberian tree-ring chronologies, in contrast to globaltrends the present summer temperature increase in the high latitudes is less than that experiencedduring the Postglacial thermal maximum. In this region natural climatic forcing factors appear tohave been more significant role than the combination of human and natural factors producing thecurrent summer warming thus far. In the Siberian study area the amplitude of the current summerwarming is not thus far greater than the warming during the MWP, and is clearly less than thatduring the Postglacial thermal maximum. This may be partly explained by the difference inregional versus global trends, and partly on the difference between the trends of summer versusannual temperature.
In order to answer the second question with a confidence, it is necessary to get good quantitativedata of high temporal resolution for the Holocene which will help to identify periods of drasticnatural temperature increases of the past and to evaluate the amplitude of such increases.Therefore, one of the urgent tasks of the present time is the construction and analysis of super-long-term tree-ring chronologies for Eurasia with an adequate amount of subfossil wood. Suchstudies are being intensively conducted in Europe (Leuschner and Delorme, 1988; Leushner etal., 2000; Bailie, 2000) and in north Asia (Shiyatov, 1986; Hantemirov, 1999; Vaganov et al.,1998). They should soon provide Eurasia with high-resolution tree-ring chronologies which canbe used for quantitative reconstruction of temperature and for calibration of data obtained fromother indirect sources of climatic information with lesser time resolution.
13.6.2 Tree-ring evidence of climate change in the recent historical past from Alaska andCanada
One of the first large-scale climate reconstructions based on boreal tree-ring data was a study oftreeline white spruce across northern North America (primarily Canada) covering about 90degrees of longitude or about one third of the circumpolar northern treeline extent (Jacoby and

Ch13 - Forests, Land Management and Agriculture ACIA Scientific Report
External Review January 2004 13–58 DO NOT CIRCULATE OR CITE
D'Arrigo 1989). This chronology is based on the positive response of tree growth at treeline totemperature, and allows the reconstruction of mean annual temperature anomalies back to 1700A.D. (Figure 13.15). Key features of the reconstruction are (1) intermediate temperatures duringmost of the 18th century, (2) sharp cooling during the first half of the 19th century, (3) gradualwarming from the mid 19th century to a mid 20th century peak, and (4) a slight cooling fromabout 1950 to the 1970s. If recent proxy data or climate records are available in a given localityto compare to the overall long-term record, unusual warming during the last decades of the 20th
century is often noted (Jacoby et al 1988, Jacoby and D’Arrigo 1989). Some of the recentincrease in this annual temperature reconstruction can be attributed to recovery from the laststages of the LIA.
Figure 13.15. Annual temperature anomaly reconstructed from white spruce at NorthAmerican treeline. For details of reconstruction technique see D'Arrigo (1996, 2001) andJacoby, G., and R. D'Arrigo, (1989).
Since the studies of the late 1980s other analyses add more geographical representation andlonger temporal coverage (e.g. Mann et al. 1999) leading to essentially complete coverage of the20th century (Esper et al. 2002). The most recent reconstructed climate curves are essentiallysimilar to those of the Jacoby and D'Arrigo (1989) for the periods they overlap (Figure 13.15).
The need to splice together tree-ring records from overlapping generations of trees introducessome questions about whether the successively earlier generations of trees have been calibratedcorrectly and preserve low-frequency variations (longer-term trends) in temperature adequately.Methods of processing tree-ring data to correctly preserve the low-frequency variations haveimproved, which allow such trends and their possible causes to be identified (Esper et al. 2002).The Esper et al. (2002) reconstruction shows more prominent low-frequency trends, includingthe Medieval Warm Period and the Little Ice Age, than previous reconstruction or global ornorthern hemisphere-wide averages.
New technology, such as x-ray density (Jacoby et al. 1988) and stable isotope techniques, allowmeasurements of tree-ring properties in addition to ring-width. Maximum latewood density ofnorthern conifers increases when mid- to late growing season moisture stress is great (D'Arrigoet al. 1992). Maximum latewood density of boreal conifers also may represent an index ofcanopy growth as indicated by satellite-sensed NDVI values where productivity is temperature-related (D'Arrigo et al. 2000). Carbon 13 isotope content is generally measured asdiscrimination, which represents difference in amount of isotope in sampled plant tissuecompared to a reference standard. Less carbon 13 discrimination (greater carbon 13 content insample) indicates production of the sampled plant tissue under a condition of restricted stomatalexchange, generally as a result of moisture stress (Livingston and Spittlehouse1996).
Maximum latewood density, 13C isotope discrimination, and ring-width of upland white sprucestands in central Alaska are well-correlated with each other (Barber et al. 2000). Latewooddensity and 13C isotope discrimination contain information specific to the climatic conditions ofthe year of ring formation, in contrast to ring-width which is influenced by two or more years oftemperature, making them ideal for reconstructing past climates (Barber et al. 2000). No
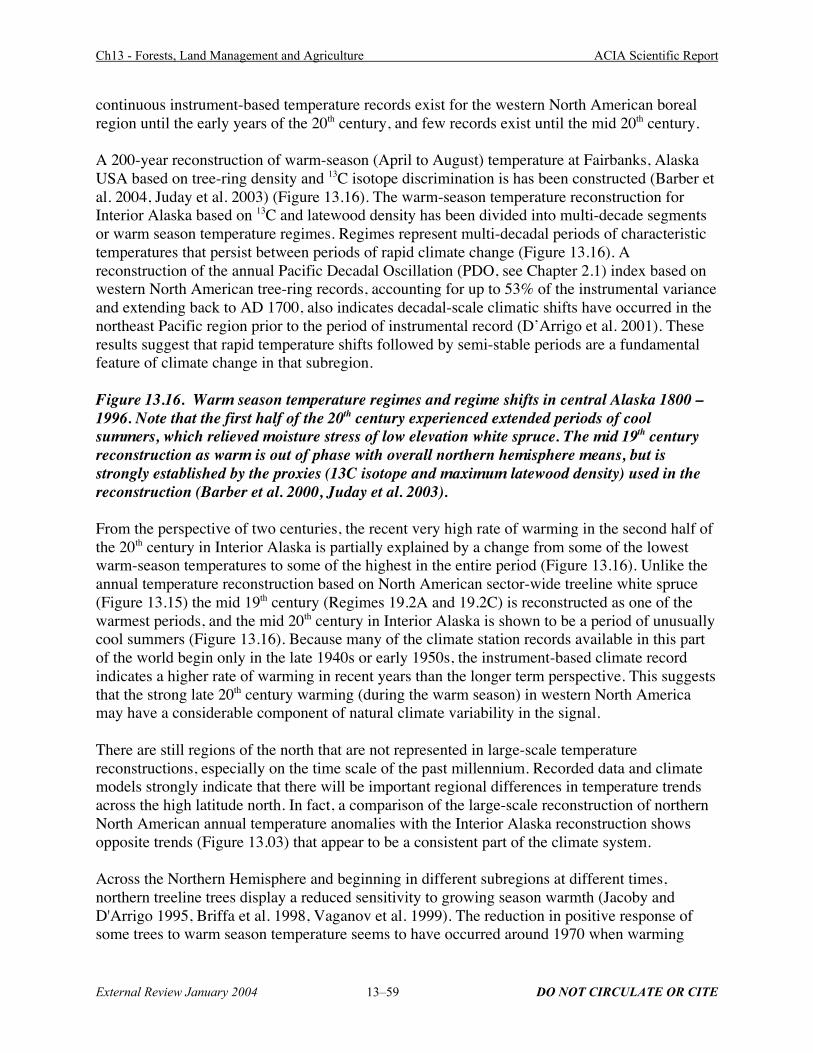
Ch13 - Forests, Land Management and Agriculture ACIA Scientific Report
External Review January 2004 13–59 DO NOT CIRCULATE OR CITE
continuous instrument-based temperature records exist for the western North American borealregion until the early years of the 20th century, and few records exist until the mid 20th century.
A 200-year reconstruction of warm-season (April to August) temperature at Fairbanks, AlaskaUSA based on tree-ring density and 13C isotope discrimination is has been constructed (Barber etal. 2004, Juday et al. 2003) (Figure 13.16). The warm-season temperature reconstruction forInterior Alaska based on 13C and latewood density has been divided into multi-decade segmentsor warm season temperature regimes. Regimes represent multi-decadal periods of characteristictemperatures that persist between periods of rapid climate change (Figure 13.16). Areconstruction of the annual Pacific Decadal Oscillation (PDO, see Chapter 2.1) index based onwestern North American tree-ring records, accounting for up to 53% of the instrumental varianceand extending back to AD 1700, also indicates decadal-scale climatic shifts have occurred in thenortheast Pacific region prior to the period of instrumental record (D’Arrigo et al. 2001). Theseresults suggest that rapid temperature shifts followed by semi-stable periods are a fundamentalfeature of climate change in that subregion.
Figure 13.16. Warm season temperature regimes and regime shifts in central Alaska 1800 –1996. Note that the first half of the 20th century experienced extended periods of coolsummers, which relieved moisture stress of low elevation white spruce. The mid 19th centuryreconstruction as warm is out of phase with overall northern hemisphere means, but isstrongly established by the proxies (13C isotope and maximum latewood density) used in thereconstruction (Barber et al. 2000, Juday et al. 2003).
From the perspective of two centuries, the recent very high rate of warming in the second half ofthe 20th century in Interior Alaska is partially explained by a change from some of the lowestwarm-season temperatures to some of the highest in the entire period (Figure 13.16). Unlike theannual temperature reconstruction based on North American sector-wide treeline white spruce(Figure 13.15) the mid 19th century (Regimes 19.2A and 19.2C) is reconstructed as one of thewarmest periods, and the mid 20th century in Interior Alaska is shown to be a period of unusuallycool summers (Figure 13.16). Because many of the climate station records available in this partof the world begin only in the late 1940s or early 1950s, the instrument-based climate recordindicates a higher rate of warming in recent years than the longer term perspective. This suggeststhat the strong late 20th century warming (during the warm season) in western North Americamay have a considerable component of natural climate variability in the signal.
There are still regions of the north that are not represented in large-scale temperaturereconstructions, especially on the time scale of the past millennium. Recorded data and climatemodels strongly indicate that there will be important regional differences in temperature trendsacross the high latitude north. In fact, a comparison of the large-scale reconstruction of northernNorth American annual temperature anomalies with the Interior Alaska reconstruction showsopposite trends (Figure 13.03) that appear to be a consistent part of the climate system.
Across the Northern Hemisphere and beginning in different subregions at different times,northern treeline trees display a reduced sensitivity to growing season warmth (Jacoby andD'Arrigo 1995, Briffa et al. 1998, Vaganov et al. 1999). The reduction in positive response ofsome trees to warm season temperature seems to have occurred around 1970 when warming

Ch13 - Forests, Land Management and Agriculture ACIA Scientific Report
External Review January 2004 13–60 DO NOT CIRCULATE OR CITE
resumed after a mid 20th century cool interval. When late 20th century warming resumed sometrees continued to increase in radial growth in response to the warmer conditions. However thegrowth increase per unit of warming was not nearly as great as previously, and in some treestemperature no longer had a reliable predictive relationship to tree growth at all (Briffa et al.1998). In Alaska, much of the change can be attributed to greater moisture deficit associated withhigher warm season temperatures (Jacoby and D'Arrigo 1995). In northern Siberia the effect isattributed to shorter period of thawed soil because of increased depth of snow cover, an indirecteffect of warmer winters (Vaganov et al. 1999). In other areas there are speculative hypothesesabout air pollution, UV damage, and other factors (Briffa et al. 1998).
13.6.3 Tree-ring evidence of climate change in the historical past from north western Europe
In the past few decades Scandinavian tree-ring data have provided an increasing amount ofinformation of past climate variability. There are still a number of old and mature forestsvirtually untouched by man preserved in natural reserves, especially in the central and northernScanainavia. Scots pines growing close to its altitudinal or latitudinal distribution limits in theScandinavian Mountains or in northernmost Sweden mainly respond to summer temperatures(with increased growth) and data from such sites have been used to interpret past climatevariability (Briffa et al. 1990, Grudd et al. 2002, Gunnarson and Linderholm 2002, Linderholm2002). Furthermore, due to the proximity to the Norwegian Sea, and hence the influence ofmaritime air masses brought in with westerly and south-westerly winds, precipitation may alsobe a growth-limiting factor in moist areas, such as the western slopes of the ScandinavianMountains or in peatlands (Linderholm et al. 2002, Solberg et al. 2002, Linderholm et al. 2003).High-frequency NAO-signals (see Chapter 2.1) have been found in tree-ring data from east-central Scandinavia (Lindholm et al. 2001).
The relationship of climate and tree-ring variability in Scots pine in Scandinavia has been studiedin a wide range of growth environments. A comprehensive study was made of pine growing onpeatlands in a north-south profile through Sweden, to see if the trees contained high-resolutionclimate information (Linderholm et al. 2002). Peatland pines were also compared to pinesgrowing on dry sites. Pines growing on peatlands are dependent on growth season temperatureand precipitation as well as on local water table variations. Local water table variations areinfluenced by longer-term trends in both temperature and precipitation. There is a lag in theresponse of the pines to water levels of up to several decades so that trees are integrating theimmediate effects of growth season climate as well as a delayed effect from the water table,making them unsuitable for high frequency climate reconstruction. The pines growing onpeatland also change sensitivity depending on climate. When the growing season is wet and cold,temperature is more important and trees respond positively to temperature, in particular to Julytemperature. Precipitation response increases to the south but is never as important as for pinesgrowing on dry soils. Precipitation is important mainly in controlling water table levels(Linderholm et al. 2002).
A 1091-year record of tree growth from AD 909 to 1998 developed from living and subfossilScots pine in the central Scandinavian Mountains provides evidence of low-frequency climatevariation (Gunnarson and Linderholm 2002). July temperatures had the largest effect on thegrowth of these trees, but prior October-December temperatures are also positively and

Ch13 - Forests, Land Management and Agriculture ACIA Scientific Report
External Review January 2004 13–61 DO NOT CIRCULATE OR CITE
significantly correlated with growth. The response to precipitation during the vegetative periodwas negative although not significantly. The authors inferred that the chronology representssummer temperatures for the central Scandinavian Mountains, although it is suggested that careshould be taken when interpreting the record. The chronology indicates prolonged excursionsbelow the mean (cool conditions unfavorably for tree growth) in the mid 12th, the 13th, mid 16th,and late 17th centuries, correlating with the Little Ice Age. Below mean conditions in the late 18th
century correlates with a ‘recent cold’ (Lamb 1977b, Grove 1988, Jones and Bradley 1992,Fisher et al. 1998). The chronology also provides evidence for a ‘Medieval Warm Period’ in the10th and early part of the 11th centuries as well as warmer periods during the mid 14th, mid 17th
and 20th centuries (Gunnarson and Linderholm 2002).
13.7 Direct Climate Effects on Tree Growth
13.7.1 The Flakaliden direct warming experiment
13.7.1.1 Background to the Flakaliden direct warming experiment
In 1994 a soil warming experiment began at Flakaliden near Vindeln, 65 km northwest of Umea,Sweden (64° 07 ' N, 19° 27 ' E). The experiment is in a planted Norway spruce forest establishedin 1963. The environment of the area is representative of the northern portion of the Europeanboreal forest. Mean annual temperature is 2.3 °C and mean annual precipitation about 590 mm.The goals of the Flakaliden warming experiment are to:
(1) Quantify the effect of soil warming on the seasonal course of plant respiration andphenology of trees at low (irrigated) and high (irrigated and fertilized) availability of soilnutrients.
(2) Test and improve available mechanistic models used to predict impacts of climatechange on respiratory dynamics in plants and forest soils.
(3) Estimate net carbon budgets for boreal Norway spruce at tree, stand and regional scale, inpresent and future climates.
The soil warming treatment was installed in late 1994 installed in the buffer zone of one irrigatedand one irrigated-fertilized stand, with two 10 x 10 m sub-plots per treatment. Each heated sub-plot has a non-heated control plot. The reason for using treatments including irrigation was toreduce the risk of drying the soil as an effect of the soil warming. The objective of the treatmentis to shorten the period when the soil is frozen by one month in spring and autumn, respectively.The objective is to maintain soil temperature in heated plots 5 °C greater than in control plotsduring the warm season.
13.7.1.2 Questions, hypotheses, and results of the Flakaliden experiment
Based on the assumption of a doubling of carbon dioxide in the atmosphere and an increase inannual mean temperatures of 4 - 6 °C, the following responses were hypothesised:
(1) Increased carbon dioxide and temperature will have a small positive effect on biomassproduction in boreal forest growing on nutrient poor sites. The stimulating effect is

Ch13 - Forests, Land Management and Agriculture ACIA Scientific Report
External Review January 2004 13–62 DO NOT CIRCULATE OR CITE
mainly the effect of a shorter period with frozen soils and increased nitrogenmineralisation.
(2) Increased carbon dioxide and temperature will have a positive effect on photosynthesis inboreal forest growing on sites with good nutrient availability. The net effect on biomassproduction is, however, reduced as an effect of increased plant respiration (mainlyfoliage).
(3) In boreal forests growing on poor sites, an increase in temperatures will stimulate soilrespiration more than biomass production and therefore the net carbon balance will benegative until a new 'steady state' is reached. The strength of the carbon source willdepend on site index and the size of the soil carbon pool.
(4) The boreal forest ecosystems will be a major sink for atmospheric carbon, once new'steady-states' have been reached between carbon fixation and decomposition of soilorganic matter. The time to reach a new 'steady state' will depend on site index and thesize of the soil carbon pool.
It should perhaps be stressed that in these experiments only soil temp has been increased. Underthe scenarios of climate change, both soil and air temperature increase. So far only 'short-term'effects of soil warming have been observed, and it may take many years before important 'long-term' effects can be verified. After four seasons observed results include:
* Faster recovery of photosynthetic capacity in spring, * Increased needle concentration of most nutrient elements, * Increased production of fine roots and shorter longevity, * Significant increase (> 50%) in stem wood growth on the heated plots compared to controls
(Jarvis and Linder 2000).
The Flakaliden modelling experiments have shown that it is essential that carbon productionmodels incorporate low temperature effects associated with frozen soils, frost and post-winterrecovery of photosynthetic function; failure to do so will lead to biased estimates of carbon sinksand unrealistic predictions of responses to global change. Improved element concentration maybe due to transient effects brought about by enhanced decomposition while season length andother factors influenced by atmospheric warming under scenario conditions were unaffected.
13.7.2 Climate effects on growth of trees in the Central Eurasian IGBP transect
13.7.2.1 Climate Response Functions of Trees From the Siberian Forest-Tundra Zone to theSteppe (grassland)
The geography of Central Eurasia offers an excellent opportunity to examine how climateinfluences tree growth along an uninterrupted transect from the cold tundra margin in the northto the semi-arid steppe grassland of central Asia. This transect approach can, in one sense,provide some ideas about how climate warming might affect growth by simply comparing theclimate factors that historically and currently control tree growth as one proceeds southward. Ofcourse, there are several limitations to this approach that should be kept in mind. For example,the genetics of individual trees of even the same species are changing as one moves south. But

Ch13 - Forests, Land Management and Agriculture ACIA Scientific Report
External Review January 2004 13–63 DO NOT CIRCULATE OR CITE
the comprehensive view of how tree growth responds differently to climate from cool to warmregions is still quite useful.
To define the main climatic factors that influence tree ring growth at various regions along theCentral Eurasian IGBP transect, correlation coefficients of tree ring structure chronologies withmonthly temperature and precipitation were calculated (Fritts, 1976; Schweingruber, 1988,1996). Tree ring data of Siberian larch, Gmelin larch, Siberian spruce, and Scots pine from 46sites located at regions from the forest-steppe zone in the south to forest-tundra zone in the northwere used (Figure 13.17). Tree ring-width relationships to climate were investigated at all sites.
Figure 13.17. Tree sample localities along the Central Eurasian IGBP transect (Yenesimeridian).
To strengthen the climatic signal common to each region, tree-ring data from sites were averagedas regional chronologies when sufficiently high correlation of master chronologies from the samevegetation zone permitted. Averaged regional chronologies were obtained for the followingvegetation zones along the transect: forest-tundra and the northern part of the northern taiga;northern taiga; middle taiga, south taiga. These chronologies were compared to regional climaticdata averaged for several meteorological stations. In the south, in the forest steppe zone, thesimilarity of master chronologies was lower and 3 regional chronologies were obtained. Theywere correlated with the data from the nearest meteorological stations.
Figure 13.18.
Comparison of the climatic response functions obtained for trees growing at different regionsalong the transect show that there is a change in the climatic factor that defines tree-ring growthat sites located along the temperature gradient in Central Eurasia (Figure 13.18). Summertemperature is one of the most important external factors that define tree-ring growth at thenorthern tree line (Vaganov et al., 1996 b, 1999). It positively influences tracheid production(TRW) and defines up to 70% of TRW variability. In the middle taiga region effect of summertemperature on tree ring growth decreases and the influence of precipitation increases(Kirdyanov, 2000). In this region a strong negative effect of winter precipitation in addition topositive June temperature influence is found. In the forest-steppe zone tree ring climatic responsefunctions are typical of regions with limited moisture (Fritts, 1976) in which TRW variability ismainly explained by variability of moisture as directly determined by precipitation and indirectlydetermined by temperature influence. Negative influence of spring–early summer temperature isexplained by water loss from soil at the beginning of growing season. High temperature ofprevious August-September effects soil water content which is important for tree ring growthactivation during the next growth season (Schweingruber, 1996; Magda and Zelenova, 2002).

Ch13 - Forests, Land Management and Agriculture ACIA Scientific Report
External Review January 2004 13–64 DO NOT CIRCULATE OR CITE
So, from the north to the south along the transect, the limiting positive effect of summertemperature in the forest-tundra zone is replaced by the limiting effect of spring precipitation(positive) and early summer temperature (negative) in the forest-steppe zone (Figure 13.18).Climate conditions at the beginning and in the first part of a growth season (soil moisture andtemperature) play the key role in determining annual radial tree growth and wood productivity atvarious latitudes from the northern treeline to forest-steppe zone. In moving from north to south,the start of tree-ring growth season shifts to the earlier dates. Conditions of June-July areimportant for trees growing at the northern tree line, whereas April-June precipitation andtemperature influence tree ring formation in forest-steppe (Figure 13.18).
Under scenario condition, trees currently growing in a given central Eurasian forest zone wouldbegin to experience temperatures typical today of the next zone to the south. The simplestresponse (linear) would be for the propagules of the vegetation of any zone under considerationto migrate northward and eventually reconstitute the zone further north – in effect a “migration”of the zone northward through regeneration over time, so that the zones of today over time arereplaced in the same sequence by the zones found to their south (Figure 13.18). However, novelfeatures of the scenario climate and its effects through time could bring about a non-linear forestresponse (Figure 13.18). It is difficult to make specific predictions of these outcomes, but someprocesses of scenario climate warming are or could be unique. For example, under scenarioconditions thawing of permafrost at its southern limits would be very likely and would transformforest soils and site types in ways that may have few or no current analogs. Scenarios producewarmth in the southern taiga typical today of temperate forest, but then issues of adequatemoisture supply and species migration would arise that could either permit or hinderdevelopment of temperate forest. The current territory of southern taiga is projected to bereplaced by forest-steppe (Tchebakova et al. 1995) with a 15% phytomass decrease (Monserud etal. 1996) under a warmer climate, and forest degradation and decline during the transition periodwould result in a major increase in forest debris and forest flammability. The range of possibleoutcomes at the in the extreme range of the scenarios could include warming and drying effectsthat could bring tundra into contact with semi-arid steppe (Figure 13.18). Empirical relations ofevapotranspiration and vegetation in central North America project an aspen parkland into theArctic (Figure 13.02, Hogg et al. 1995) under a scenario based on CO2 doubling.
13.7.2.2 Variation in strength of climate influence on growth of trees on the Central EurasianIGBP transect
Tree ring variability of Gmelin larch, Siberian larch, and Scots pine was compared from siteslocated at different latitudes along the Central Eurasian IGBP transect (the Yenisey meridian).Denrochronological parameters of tree ring width chronologies were calculated for trees from theforest-tundra zone (71°), northern (64°-69°), central (61°) and south (58°) taiga regions, forest-steppe zone (53°) and high elevation forest (51°) (Tables 13.7, 13.8). To obtain values of meantree ring width (TRW) comparable for different regions, growth of mature trees only (i.e. at theperiod when the age trend in individual TRW curves is not pronounced) was analyzed. Averageage of larch trees growing in the south of the study area is less than that of northern larches.Hence, mean TRW for larch from the north (61°-71°) was calculated for the period of the mostrecent 50 years for trees older than 200 years and for the sites located at 57°-51° for larch after
Ch13 - Forests, Land Management and Agriculture ACIA Scientific Report
External Review January 2004 13–65 DO NOT CIRCULATE OR CITE
150 years of growth. Because pine trees are generally younger than larch growing at the samelatitude, mean TRW of pine was obtained for the most recent 50 years of trees older than 150years.
Correlation coefficient of individual chronologies with master time series and coefficient ofsensitivity indicate the strength of environmental factor influences that synchronize tree ringgrowth at the same site. The higher these two parameters, the greater the role of environment indefinition of tree ring growth. These statistics were averaged for the master chronologiesobtained for sites from the same latitudinal belt.
TRW of larch trees increases from the north to the south up to the region of south taiga (57°)(Table 13.07). Then at the region of high elevation forest zone in Tuva (51°) TRW decreases.Correlation of individual chronologies with master time series and tree-ring sensitivity valuesindicate a decrease in environmental influence on tree-ring growth in the north to south directionalong the transect. The highest values of correlation were obtained for the northern treelineregion and sites at 200 km to the south, the lowest corresponding values were in the south taigaregion. Tree growth in the south taiga region is less sensitive in comparison to growth ofnorthern trees and tree at high elevation forest (Table 13.07). Similar changes in tree ringvariability along the longitudinal transect were found for pine. TRW increases from the northernborder of pine area to the south taiga region. At the same time the correlation of individual serieswith the master chronology and the sensitivity both decrease (Table 13.08). In the forest-steppezone (latitude 53°) pines at the same site show the highest sensitivity and synchronicity of treering growth.
Table 13.07. Statistical characteristics of larch tree ring width chronologies from differentlocations along the Central Eurasian IGBP transect.
Table 13.08. Statistical characteristics of pine ring width chronologies from different locationsalong the Central Eurasian IGBP transect.
These trends of tree ring width variability along the longitudinal transects in Central Eurasia aretypical of tree growth in the entire Siberian boreal zone. Similar results were reported in the caseof the increase of larch TRW with decreasing site latitude in Yakutia in East Siberia (Shashkinand Vaganov 2000). This trend is caused by the gradient of the environmental factors that mostinfluence on tree-ring growth (Vaganov and Shashkin, 2000). At the northern treeline, lack ofsummer warmth is the main climatic factor that limits ring growth (Vaganov et al., 1996 b,Kirdyanov and Zarharjewski, 1996). As a result, at such high latitudes large-scale patterns ofsummer temperature synchronizes the growth of trees not only at the same site but also at thesites located up to 800 km apart (Vaganov et al., 1999). Climate warming depicted in thescenarios would have broadly shared positive effects on larch growth across this area.
The influence of summer temperature decreases moving southward from the northern end of thetransect. Such a gradient of environmental control leads to the higher growth rate and lesssensitivity of tree growth to climate in the middle of the transect. However, toward the southernportion of the transect there is once again an increase in the correlation between individual tree-ring growth and sensitivity of master chronologies. Summer warmth in these dry regions now
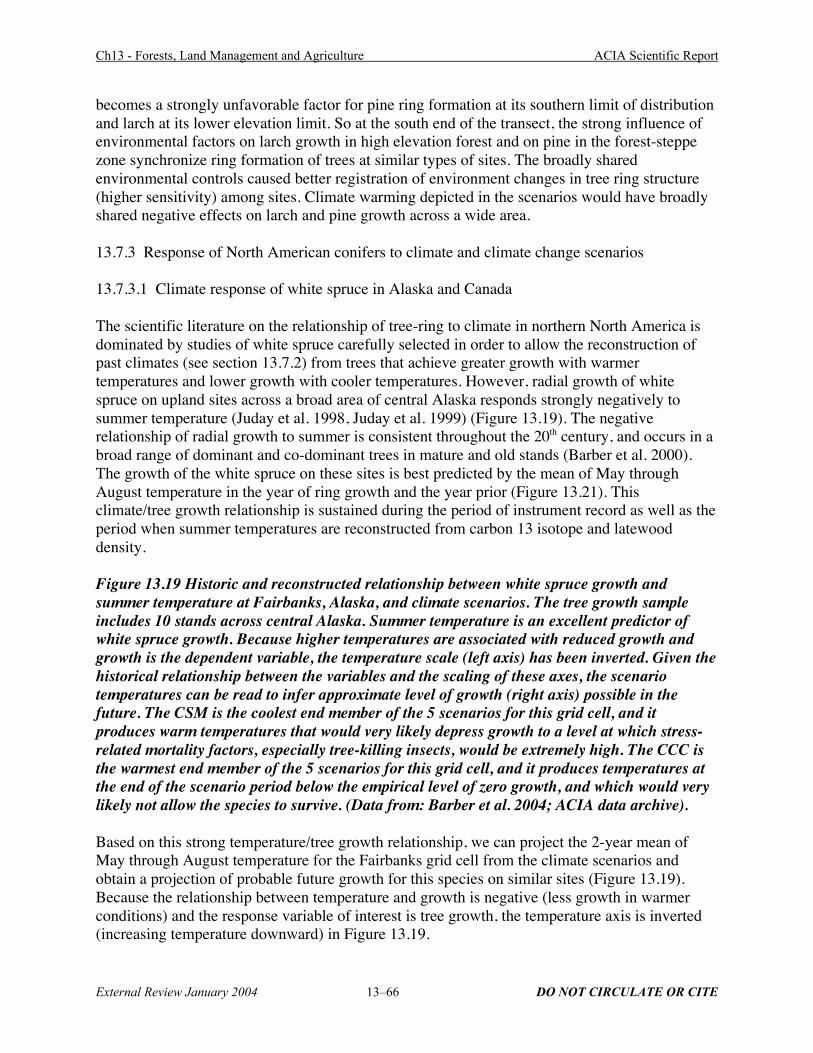
Ch13 - Forests, Land Management and Agriculture ACIA Scientific Report
External Review January 2004 13–66 DO NOT CIRCULATE OR CITE
becomes a strongly unfavorable factor for pine ring formation at its southern limit of distributionand larch at its lower elevation limit. So at the south end of the transect, the strong influence ofenvironmental factors on larch growth in high elevation forest and on pine in the forest-steppezone synchronize ring formation of trees at similar types of sites. The broadly sharedenvironmental controls caused better registration of environment changes in tree ring structure(higher sensitivity) among sites. Climate warming depicted in the scenarios would have broadlyshared negative effects on larch and pine growth across a wide area.
13.7.3 Response of North American conifers to climate and climate change scenarios
13.7.3.1 Climate response of white spruce in Alaska and Canada
The scientific literature on the relationship of tree-ring to climate in northern North America isdominated by studies of white spruce carefully selected in order to allow the reconstruction ofpast climates (see section 13.7.2) from trees that achieve greater growth with warmertemperatures and lower growth with cooler temperatures. However, radial growth of whitespruce on upland sites across a broad area of central Alaska responds strongly negatively tosummer temperature (Juday et al. 1998, Juday et al. 1999) (Figure 13.19). The negativerelationship of radial growth to summer is consistent throughout the 20th century, and occurs in abroad range of dominant and co-dominant trees in mature and old stands (Barber et al. 2000).The growth of the white spruce on these sites is best predicted by the mean of May throughAugust temperature in the year of ring growth and the year prior (Figure 13.21). Thisclimate/tree growth relationship is sustained during the period of instrument record as well as theperiod when summer temperatures are reconstructed from carbon 13 isotope and latewooddensity.
Figure 13.19 Historic and reconstructed relationship between white spruce growth andsummer temperature at Fairbanks, Alaska, and climate scenarios. The tree growth sampleincludes 10 stands across central Alaska. Summer temperature is an excellent predictor ofwhite spruce growth. Because higher temperatures are associated with reduced growth andgrowth is the dependent variable, the temperature scale (left axis) has been inverted. Given thehistorical relationship between the variables and the scaling of these axes, the scenariotemperatures can be read to infer approximate level of growth (right axis) possible in thefuture. The CSM is the coolest end member of the 5 scenarios for this grid cell, and itproduces warm temperatures that would very likely depress growth to a level at which stress-related mortality factors, especially tree-killing insects, would be extremely high. The CCC isthe warmest end member of the 5 scenarios for this grid cell, and it produces temperatures atthe end of the scenario period below the empirical level of zero growth, and which would verylikely not allow the species to survive. (Data from: Barber et al. 2004; ACIA data archive).
Based on this strong temperature/tree growth relationship, we can project the 2-year mean ofMay through August temperature for the Fairbanks grid cell from the climate scenarios andobtain a projection of probable future growth for this species on similar sites (Figure 13.19).Because the relationship between temperature and growth is negative (less growth in warmerconditions) and the response variable of interest is tree growth, the temperature axis is inverted(increasing temperature downward) in Figure 13.19.
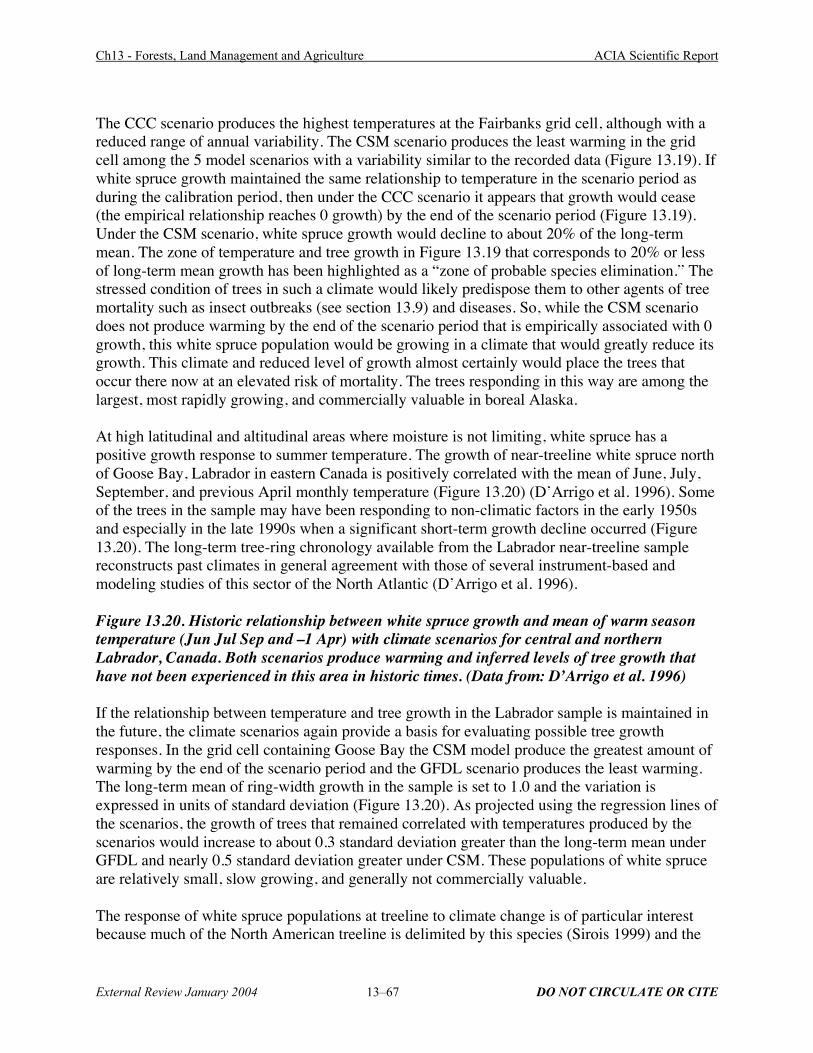
Ch13 - Forests, Land Management and Agriculture ACIA Scientific Report
External Review January 2004 13–67 DO NOT CIRCULATE OR CITE
The CCC scenario produces the highest temperatures at the Fairbanks grid cell, although with areduced range of annual variability. The CSM scenario produces the least warming in the gridcell among the 5 model scenarios with a variability similar to the recorded data (Figure 13.19). Ifwhite spruce growth maintained the same relationship to temperature in the scenario period asduring the calibration period, then under the CCC scenario it appears that growth would cease(the empirical relationship reaches 0 growth) by the end of the scenario period (Figure 13.19).Under the CSM scenario, white spruce growth would decline to about 20% of the long-termmean. The zone of temperature and tree growth in Figure 13.19 that corresponds to 20% or lessof long-term mean growth has been highlighted as a “zone of probable species elimination.” Thestressed condition of trees in such a climate would likely predispose them to other agents of treemortality such as insect outbreaks (see section 13.9) and diseases. So, while the CSM scenariodoes not produce warming by the end of the scenario period that is empirically associated with 0growth, this white spruce population would be growing in a climate that would greatly reduce itsgrowth. This climate and reduced level of growth almost certainly would place the trees thatoccur there now at an elevated risk of mortality. The trees responding in this way are among thelargest, most rapidly growing, and commercially valuable in boreal Alaska.
At high latitudinal and altitudinal areas where moisture is not limiting, white spruce has apositive growth response to summer temperature. The growth of near-treeline white spruce northof Goose Bay, Labrador in eastern Canada is positively correlated with the mean of June, July,September, and previous April monthly temperature (Figure 13.20) (D’Arrigo et al. 1996). Someof the trees in the sample may have been responding to non-climatic factors in the early 1950sand especially in the late 1990s when a significant short-term growth decline occurred (Figure13.20). The long-term tree-ring chronology available from the Labrador near-treeline samplereconstructs past climates in general agreement with those of several instrument-based andmodeling studies of this sector of the North Atlantic (D’Arrigo et al. 1996).
Figure 13.20. Historic relationship between white spruce growth and mean of warm seasontemperature (Jun Jul Sep and –1 Apr) with climate scenarios for central and northernLabrador, Canada. Both scenarios produce warming and inferred levels of tree growth thathave not been experienced in this area in historic times. (Data from: D’Arrigo et al. 1996)
If the relationship between temperature and tree growth in the Labrador sample is maintained inthe future, the climate scenarios again provide a basis for evaluating possible tree growthresponses. In the grid cell containing Goose Bay the CSM model produce the greatest amount ofwarming by the end of the scenario period and the GFDL scenario produces the least warming.The long-term mean of ring-width growth in the sample is set to 1.0 and the variation isexpressed in units of standard deviation (Figure 13.20). As projected using the regression lines ofthe scenarios, the growth of trees that remained correlated with temperatures produced by thescenarios would increase to about 0.3 standard deviation greater than the long-term mean underGFDL and nearly 0.5 standard deviation greater under CSM. These populations of white spruceare relatively small, slow growing, and generally not commercially valuable.
The response of white spruce populations at treeline to climate change is of particular interestbecause much of the North American treeline is delimited by this species (Sirois 1999) and the

Ch13 - Forests, Land Management and Agriculture ACIA Scientific Report
External Review January 2004 13–68 DO NOT CIRCULATE OR CITE
performance under warmer conditions of populations there today is an indication of the possiblefuture effects of climate change. In a large (over 1,500 trees) sample of treeline white spruceacross the Brooks Range and Alaska Range Mountains over 40% displayed a statisticallysignificant negative growth response to summer warmth while slightly fewer than 40% had apositive response to late spring warmth (Wilmking 2003). In the negatively responding (warmer= less growth) white spruce population, July temperature explained most of the variability ingrowth. Growth was strongly reduced at temperatures above a July threshold of about 16 degreesC at the Fairbanks index station (temperatures were estimated to be 3 to 4 degrees cooler at thevarious actual treeline sites). Growth of positive responders is correlated to March or Apriltemperature, and the relationship is generally not significant until the second half of the 20th
century (Wilmking 2003). D’Arrigo and Jacoby (personal communication) found a similar dualresponse in white spruce in the Wrangell St. Elias Mountains of Alaska. A study of 8 sites at andnear alpine and Arctic treeline in three regions of Alaska found mixed populations oftemperature response types as well, and growth decreased in response to warming temperaturesat all but the wettest sites since 1950 (Lloyd and Fastie 2002). The negative growth response totemperature is more common at in stands and tree islands compared to isolated individual trees(Wilmking 2003, Lloyd and Fastie 2002). The intensity of the negative effect of July warmthincreased after 1950 compared to before, directly reflecting the fact that July temperatures werewarmer than the threshold in greater number of years in the second half of the 20th centurycompared to earlier (Wilmking 2003).
The explanation for reduced treeline white spruce growth with warming is that negativeresponders are experiencing temperature-induced drought stress, while the positive respondingtrees are not (Wilmking 2003, Juday 2003, Jacoby and D’Arrigo 1995). At some treeline sites innorthern Alaska individual trees have shifted their response to climate during their lifetimes,following the regime shift to warmer conditions took place in the last decades of the 20th century(Jacoby and D’Arrigo 1995). Whereas previously the tree’s growth responded positively tosummer temperature, it either became insensitive or began responding negatively to summertemperature after the shift to the warmer regime.
These results establish that from the ecological perspective, recently climate warming has been amajor event that has strongly affected the growth performance of a majority of white spruce atand near treeline in Alaska and almost certainly in similar climate zones in Canada. The 5 GCMused in this assessment produce July temperatures which the empirical relationship associateswith very low or no growth in negative responding white spruce by the mid to late 21st century.This suggests that under scenario conditions of additional warming, northern white spruce treelimit in Alaska and adjacent Canada cannot be assumed to readily advance. At the least, treelinecould become much more complex, with negative responders disappearing and positiveresponders expanding. It is possible that novel conditions would emerge, such as a portion of thesouthern tundra boundary in North America not in contact with boreal forest (see Figure 2; Hogg1995). The actual response of treeline white spruce in this part of the world also adds support tothe suggestion that aridification could be a major issue under scenario warming.
13.7.3.3 Climate response of black spruce in Alaska and Canada

Ch13 - Forests, Land Management and Agriculture ACIA Scientific Report
External Review January 2004 13–69 DO NOT CIRCULATE OR CITE
Black spruce dominated stands represent about 55% of the boreal forest cover of Alaska and alarge fraction of the northern boreal region of Canada. The response of black spruce to climatehas been studied as extensively or for as long or as white spruce, so the literature onclimate/growth relationships is more limited. This section draws on some recentdendrochronology work in Interior Alaska.
Different temperature factors are most closely associated with black spruce growth on differentpermafrost-dominated sites (Figure 13.21), a more variable response than the consistenttemperature/growth response in upland white spruce (Section 13.8.3.2).
Figure 13.21. Correlation of black spruce radial growth and Fairbanks mean monthlytemperatures from four permafrost-dominated sites in central Interior Alaska. On two of thesites (A) and (C) the relationship of tree growth and summer warmth is strongly negative. Atone site (D) growth is positively related to winter temperature, and at the remaining site (B)winter (February) warmth is positive but April is negative. (Data from: G. Juday and V.Barber, Bonanza Creek LTER data archive).
Of four sites examined, three show a some negative growth response to increasing temperature,while one shows a positive response (Figure 13.21). Both the Toghotthele site (Figure 13.21A)and the Zasada Road 10 site in Bonanza Creek LTER site (Figure 13.21C) show a negativegrowth response to summer temperatures (year of growth and 2 years prior). Radial growth ofblack spruce at both the northern and southern BOREAS sites in western Canada study was alsonegatively related to summer temperature, or conversely, favored by cooler and wetter conditions(Brooks et al. 1998). Black spruce at Caribou Poker Creek Research Watershed (CPCRW) showboth a negative correlation to April and May temperatures (during the growth year) and apositive correlation to February temperature (2 years prior to growth) (Figure 13.22B). A simple2-month index of the mean of April and February temperature models the growth of the CPCRWtrees with a high correlation (Figure 13.22). The negative effect of warm early springtemperatures on growth at CPCRW can be attributed to the onset of photosynthesis in springwhen the ground is still frozen, causing desiccation and damage to the needles (Berg and Chapin1994) early in the growing season. Growth of black spruce trees at Ft. Wainright display apositive correlation between growth and winter temperatures (Figure 13.21D). When Januaryand February were warm in the year of growth and in the year prior to growth, the trees grewbetter (Figure 13.23).
Figure 13.22. Relationship of radial growth of black spruce at Caribou-Poker Creek ResearchWatershed and a 2-month climate index, the mean of April and February 2 years prior. Thesmoothed (5-year running mean) values are highly correlated during the 20th century,suggesting that tree growth of this species and at sites similar to these could be predicted fromscenario values. While warm February temperatures favor growth, warmth in April depressesgrowth. Under strong warming in the late 20th century, growth of this species has declinedbecause the negative influence of April is stronger. (Data from: G. Juday and V. Barber,Bonanza Creek LTER data archive).

Ch13 - Forests, Land Management and Agriculture ACIA Scientific Report
External Review January 2004 13–70 DO NOT CIRCULATE OR CITE
Figure 13.23. Relationship of radial growth of black spruce at Fort Wainwright and a 4-month climate index (mean of January, previous January, previous February, and previousDecember at Fairbanks, Alaska. The smoothed (5-year running mean) values are highlycorrelated during the 20th century. This is one of the few species and site types in centralAlaska for which the empirically calibrated growth rate can be inferred to improve under thewarming climate scenarios. However, this permafrost site is very near thawing, and warmingof the magnitude depicted in the scenarios would probably initiate thawing during thescenario period, leading to widespread ground subsidence and tree toppling. (Data from: G.Juday and V. Barber, Bonanza Creek LTER data archive)
For the Toghotthele site the same approach of scenario output used for white spruce (Section13.8.3.2) was applied to the empirical record of black spruce growth (Figure 13.24). Again theresults suggest that if climates similar to those produced by the scenarios actually occurred, blackspruce would, by the end of the scenario period, experience climates that would not permit thespecies to survive on similar types of sites. In this case the particular set of monthly temperaturesthat drives the relationship would reach the warmest levels under the CSM scenario and slightlylower levels under the CCC scenario. However, in both scenarios warmth in individual yearsproduces an empirical relationship very near 0 growth before the end of the scenario period.Allowing for some differences in calibration and degree of climate control, the generally similargrowth of black spruce in the BOREAS study areas suggests that elimination of black sprucewould be widespread across the western North American boreal forest.
Figure 13.24. Relationship of summer temperatures at Fairbanks and relative growth of blackspruce on Alaska Native owned land, Toghotthele Corporation, in central Alaska. The meanof three summer months is an excellent predictor of tree growth, with warm years resulting instrongly reduced growth. Conventions are the same as Figure 13.23. By the end of thescenario period, temperatures that would not permit the species to survive are produced by thescenarios. (Data from: G. Juday and V. Barber, Bonanza Creek LTER data archive).
By contrast, the positive relationship between monthly temperatures and black spruce growth atthe Ft. Wainright site suggests that growth of tree on sites similar to it would increase (Figure13.23). The output of the ECHAM scenario for the Fairbanks grid cell includes especially strongwarming in the particular winter months that best model black spruce growth at the site, so theempirical relationship, if it were maintained, suggests a major increase in rate of growth (Figure13.23). Black spruce at the Ft. Wainwright site occupy a low productivity system, so the overallsignificance of the projected growth increase is not clear. The CSM scenario generates wintertemperatures that do not warm as rapidly or to as great a degree, so the modeled relationship ofthese positive responding spruce suggests a modest increase in growth under scenario warming.Presumably the positive effect of warm winter temperatures on growth is experienced thoughcontrol of active layer rooting depth and soil temperature in this permafrost-dominatedecosystem. However, well before the end of the scenario period all the scenarios for this grid cellgenerate mean annual temperatures above freezing (Figure 13.10). If warming to that extent wereto actually occur, the temperature/growth relationship depicted (Figure 13.23) is not likely topersist. Instead widespread ground subsidence from thawing permafrost would occur,representing a new challenge for the survival of this species on such sites. Once the soil thawing

Ch13 - Forests, Land Management and Agriculture ACIA Scientific Report
External Review January 2004 13–71 DO NOT CIRCULATE OR CITE
process was complete, species with higher growth rates than black spruce such as white spruce orpaper birch would likely have a competitive advantage on the transformed site.
13.7.3.4 Climate response of Scots pine in Scandinavia
Growth responses of Scots pine varied throughout the 20th century at the tree limit in the centralScandinavian Mountains (Linderholm 2002). Long, hot, and dry summers have traditionally beenthough to be optimal for pine growth in that environment. Pine growth was the greatest for thelast 3 centuries during the decade 1945-54. Although summer temperature wasn’t particularlyhigh during this mid 20th century optimum period for Scots pine, higher than average spring andfall temperatures that extended the growing season were inferred to be the cause of this decade ofhigh growth (Linderholm 2002). Despite similar apparently favorable temperature conditions inthe latter part of the 20th century, growth in this species on similar sites declined during the mostrecent warmth. This suggests the occurrence of some additional unique component to the recentwarming that negated the previously positive influence of extended growing seasons.
In addition to north/south transects of tree ring chronologies, an east/west transect has beendeveloped Fennoscandia (Linderholm et al. 2003). Nine tree-ring width chronologies for Scotspine were compared for growth variability and response to climate along a gradient of maritimeto continental conditions in central Fennoscandia. The study revealed higher growth variance andstronger response to climate in the oceanic area west of the Scandinavian Mountains, comparedto the more continental areas further east. Pine growth responded positively to elevated summertemperatures in the western areas, and positively to high summer precipitation in the east.Generally, pine growth showed a weaker relationship with the North Atlantic Oscillation (NAO,see Chapter 2.1) than with temperature and precipitation. During the last half of the 20th century,pine growth in western Fennoscandia displayed reduced sensitivity to climate, while in the eastgrowth sensitivity increased. Indications of growth stress were found in one site east of theScandinavian Mountains. Increasing temperatures have been accompanied by increasingprecipitation in Fennoscandia throughout the 20th century, and it was suggested that a change inclimate regime from sub-continental to sub-maritime caused those trees to experience climaticstress (Linderholm et al. 2003).
A selection of Scots pine tree-ring width chronologies has been collected across Sweden (Figure13.25). The standardized chronologies include wet (peatland) and dry (mineral soil) growthenvironments (Figure 13.26). Despite large differences in climate responses among the sites, thecollective growth trend for all the sampled Scots pine in the last few decades of the 20th centuryis negative (Figure 13.26). Furthermore, a common feature is distinct changes in growthsensitivity to climate at all sites during that period, a feature that has also been observed atseveral other Fennoscandian sites. The pattern is one of widespread and simultaneous decreasesin growth, and a decreased ability of previously established climate factors to predict growth asaccurately.
Figure 13.25. Location of 14 Scots pine tree-ring width chronologies. N = Nikkaluokta, AJ =Angerusjärvi, LY = Lycksele, ST = Stortjäderbergsmyran, J = Jämtland, ÅÖ = Årsön, TS =Tannsjö, SK = Skuleskogen, N = Norberg, BM = Bredmossen, SH = Stockholm, HM =Hanvedsmossen, GH = Gullhult, AM = Anebymossen.

Ch13 - Forests, Land Management and Agriculture ACIA Scientific Report
External Review January 2004 13–72 DO NOT CIRCULATE OR CITE
Figure 13.26. Standard chronologies (age de-trended and normalized with long-term meanset to 1.0 and standard deviation on 1.0) of Scots pine tree-ring width chronologies in Sweden.Vertical axis is in units of standard deviation (departure from mean growth). Thick line is 11-year running average, d denotes chronologies from dry sites and w denotes chronologies fromwet, peatland, sites. Curves express the degree of growth at any time relative to the long-termmean of the sample. Note the synchronous late 20th century decline. (Data from: Linderholm2002, Linderholm et al. 2002, Linderholm et al. 2003).
Because precipitation, in addition to temperature, has increased over the past decades inScandinavia, it is not likely that drought stress can be the main reason for decreasing Scots pinegrowth throughout Sweden. The one exception is northernmost Sweden where growth responsesto summer temperatures are decreasing and responses to autumn precipitation increasing.However, in central Sweden the evidence suggests a different cause of reduced growth andchanging climate responses. On the eastern slopes of the Scandinavian Mountains the climatecould be regarded as sub-continental, with low annual precipitation and high temperatureamplitude over the year. Tree-ring data from sites east of the mountains implies that over the pastdecades this area has attained a more maritime climate character, and consequently the trees mayhave suffered stress from surplus moisture rather than drought stress (Linderholm et al. 2003). Inconclusion, the observed change in tree growth patterns and growth/climate relationships is mostlikely an effect of contemporary climate change. How trees respond to increased temperaturesand/or precipitation is dependent on the local climate, and it seems that trees in oceanic areas areless affected than those where the local climate regime has shifted from sub-continental to sub-maritime.
13.8 Climate change and insects as a forest disturbance
13.8.1 Role of forest insects in the boreal forest
The boreal forest is naturally subject to periodic large-scale tree mortality from insect outbreaks.The death of attacked trees has a considerable influence on the balance of carbon sequestered byforests. In boreal forests of Canada, insect-caused timber losses (death of trees) may be as muchas 1.3 to 2.0 times the mean annual depletions due to fires (Volney and Fleming 2000). Theparticular insects involved in large-scale boreal outbreaks include bark and wood-boring beetles,defoliating insects (often Lepidopterans – moths and butterflies), and insects that attack roots andcones. Major population increases of these insects, called irruptions, along with wildland firesare the major short-term agents of change in the boreal forest. Insect-caused tree mortality canappear suddenly and within a matter of one to 10 years affect hundreds of thousands to millionsof hectares of boreal forest in an outbreak or related series of outbreaks. Moderate to severedefoliation of trees by insects has affected nearly 16 million ha yr-1 in the province of Ontariosince 1975 (Parker et al. 2000). Nearly all boreal forest regions are subject to this phenomenon,and it may represent an adaptive response in which simultaneous mass tree death helps createconditions for the renewal of site productivity through processes such as warming soils,mobilizing nutrient elements, and promoting simultaneous tree regeneration.
Ch13 - Forests, Land Management and Agriculture ACIA Scientific Report
External Review January 2004 13–73 DO NOT CIRCULATE OR CITE
The peculiar vulnerability of boreal forests to large-scale insect disturbance may also be relatedto the low biodiversity of both the host tree populations (limited number of species) and thelimited diversity within the complex of tree-attacking insects and the populations of predatorsand parasites that work to stabilize their numbers. Ecological theory predicts that systems withfew species should be less stable or buffered against major populations swings, and the borealforest region is the least species-rich in most taxonomic groups of the world’s major forestregions. Finally, the occurrence of tree hybrids may be a non-climatic risk factor for large-scaleinsect outbreaks. Where the distributions of two tree species approach each other, the trees,especially wind-pollinated conifers, can interbreed and form hybrid offspring. Because thehybrid trees contain a random assortment of the genes of both parents, they seldom inherit highlyintegrated and complete defense traits against insect attacks, such as specific chemical defensesor timing of events to avoid vulnerability. As a result, tree defenses against insect attack may belowest in hybrid zones (Whitham 1989, 1994).
The level of tree mortality caused by insect outbreaks can vary from selective removal of a fewpercent of dominant trees to the death of nearly the entire forest canopy. Although vulnerabletree species and ages classes must be present for insect outbreaks to occur, often climatic eventsare the trigger or proximate cause of the insect population increases and associated widespreadtree mortality. In general, many organisms in the boreal region, and especially the northernboreal forest region, are heat-limited, that is they could perform (survive, grow, and reproduce)better with more warmth if other factors did not become limiting. Many insect agents of treemortality in the northern boreal region are heat-limited, so that sustained periods of abnormallywarm weather are often associated with irruptions of insects that attack boreal tree species.Given that this is a natural climate-driven system, it is important to distinguish climate changeeffect from natural operation of this system.
Generally, a climate warming effect imposed on the natural insect – tree death system wouldamount to 1) a greater frequency of insect outbreaks, 2) more extensive areas of tree mortality inoutbreaks, 3) greater intensity of insect attack resulting in higher average levels of tree deathwithin outbreaks. The sustained operation of these factors as a result of climate warming, were itto occur, would begin to change regional tree species composition within decades. A necessaryconfirmation of the occurrence of a specifically climate warming effect from the insect – treedeath process would include the detection of difference in the composition of the new, alteredforest with historical and recent paleo-ecological records of previous generations of forest. Analternative possibility that needs to be considered is that climate warming (along with increasedprecipitation) might produce a more favorable growth environment for certain tree species oncertain site types. The increased vigor of the trees would increase their ability to producedefensive compounds and successfully resist the even somewhat increased levels of insectattacks.
It is possible that both influences of climate warming on forests and tree-hosted insects (positiveand negative for forest health) could occur simultaneously in different locations of the borealforest, or could occur sequentially in one place at different levels of intensity of climatewarming. As a result, climate warming could be associated with improved forest health in somelocations and forest health problems elsewhere, and the climate change effect at any given timewould be the sum of these two outcomes. In addition, the initial stage of climate warming would
Ch13 - Forests, Land Management and Agriculture ACIA Scientific Report
External Review January 2004 13–74 DO NOT CIRCULATE OR CITE
produce one profile of the balance of forest health outcomes across the area of analysis, but laterstages representing stronger warming would shift the previous balance of forest health outcomes.
13.8.2 Climate and the spruce bark beetle in Alaska
During the 1990s the Kenai Peninsula in southcentral Alaska experienced the world’s largestoutbreak of spruce bark beetles (Dendroctonus rufipennis Kirby) (Werner 1996). The forests ofthe Kenai lowlands are transitional between coastal Sitka spruce rainforests and the white spruce– paper birch boreal forests of semiarid central Alaska. From 1989 to 1999 more than 1.6 millionha of mature forest made up of white spruce and hybrids of Sitka and white spruce (called Lutzspruce) in southcentral Alaska experienced at least 10% to 20% tree mortality, the thresholdlevel for aerial mapping detection. In much of the insect outbreak area virtually all maturecanopy trees were killed. Extensive logging was initiated to salvage beetle-killed timber onprivate lands, and the U.S. federal government has found it necessary to appropriate funds toreduce fuel hazards in stands with numerous dead trees after infestation.
The first spruce bark beetle infestation on the Kenai Peninsula that was documented occurred in1950. Local infestations occurred throughout the 1950’s and 1960’s on the northern Peninsula(Holsten 1990). A major outbreak in the northern Peninsula that started in 1970 prompted theForest Service to initiate annual surveys in 1971, which have continued with only a fewinterruptions. Annual survey maps show that spruce bark beetles are endemic to Kenai Peninsulaforests, at least under the present climatic regime. In any given year there is always a backgroundlevel of infestation somewhere in south-central Alaska, with periodically major outbreaks insome years.
The relationship of spruce bark beetle to climate involves 2 direct temperature controls overpopulations of the insect, and an indirect control through host tree resistance. Two successivecold winters depress the survival rate of spruce bark beetle to such a low level that there is littleoutbreak potential for the following season (Holsten 1990). The spruce bark beetle is a heat-limited organism on the Kenai Peninsula and normally requires 2 summers to complete its lifecycle. During abnormally warm summers on the Kenai Peninsula the spruce bark beetle cancomplete its life cycle in 1 year, dramatically increasing the potential for population buildup(Werner and Holsten 1985). Host resistance to beetle attack is increased by tree health. Healthyspruce trees can successfully resist moderate numbers of beetle attacks by opposing the woodboring activity of females entering the tree to lay eggs, with pitch under high turgor pressure(Holsten 1990). The beetles are unable to overcome the flow of pitch and either are expelled orsuccumb in their pitch tubes. Host trees that are under stress (condition of low growth reserves),including either climate stress or stress from mechanical breakage of host trees, have reducedgrowth reserves, less pitch and lower turgor pressure, and so are less able to resist spruce barkbeetle attacks. When entire populations of trees are stressed by regional events, spruce barkbeetle reproductive success is greatly increased.
The USDA Forest Service conducts annual aerial surveys for “red needles,” i.e., conifer leavesdead for a year or less that allow the mapping of areas of spruce killed by spruce bark beetlewithin the previous year. These annual surveys describe the areal extent of active infestation;densities of recently killed trees can range from a few stems to hundreds of stems per hectare

Ch13 - Forests, Land Management and Agriculture ACIA Scientific Report
External Review January 2004 13–75 DO NOT CIRCULATE OR CITE
(USDA Forest Service annual reports, 1950-1999). There is a 1-3 yr lag between beetlesentering a stand and a stand-wide flush of red-needles (tree death). Typically, a sequence of red-needle acreage maps on the Kenai Peninsula will show a rise and fall of active infestation over a5-10 yr period on a scale of 100-1000 hectares. Generally after that time nearly allwhite/Sitka/Lutz spruce greater than 12 cm will be dead in the affected stand, and no more red-needle acreage for that stand will be recorded in subsequent surveys.
13.8.4 Mechanism of climate control of spruce bark beetles in southcentral Alaska
Following the 1976-77 rise in North Pacific sea surface temperatures (Mantua et al. 1997) meanannual and mean summer temperatures on the Kenai Peninsula lowlands rose 0.5-1.5oC. Thistemperature rise is the latest acceleration in post-Little Ice Age climate warming in south-centralAlaska (Jacoby and D’Arrigo 1995, Wiles et al. 1996). The most visible manifestation of thelate 20th century warming until recently was a drying landscape, with dried up ponds, fallingwater levels (as much as 1 m) in closed-basin lakes, and black spruce invasion of peat wetlandsseen across the landscape.
Annual red-needle acreages for the southern Kenai Peninsula can be compared with standardizedclimate parameters recorded at the Homer airport climate station (Figure 13.27). In Figure13.29°C drought index is calculated by subtracting the normalized past October to presentSeptember total precipitation from the normalized May-August mean temperature of the namedyear. The drought index is designed to combine the moisture contribution of the previous winterwith the growing season moisture and temperature of the identified year. The first major sprucebark beetle outbreak of the post-1950 period occurred in the early 1970’s, following theextremely warm and dry period of 1968-69 on the northern Peninsula (Figure 13.27). Red-needle mortality dropped to nearly zero by 1975, following three cool summers (1973-75). Onboth the northern and southern Peninsula, the sustained onset of warm summers beginning in1987 was followed by substantial increase in red-needle mortality beginning in 1990 andreaching a maximum in 1996. Annually mapped red-needle area declined after 1996 on thesouthern Peninsula because beetles had killed most of the available mature spruce forest.
Figure 13.27. Timing of climate events that release spruce bark beetles from population limitscompared to actual outbreaks of bark beetles during the period of record in the 20th century.Warm summers permit high hatching success and rapid maturation of beetles, lack of coldwinters provides for high survivorship and early breeding and beetle development . Stressedhost tree populations are less able to resist attacks. Beetle outbreaks lag one or two yearsbehind sustained warm intervals. The beetle outbreak in the last decade of the 20th century waspromoted by the strongest sustained climate signals in the record, and the subsequentoutbreak was the largest single episode of insect-caused tree mortality in the history of NorthAmerica. (Data from: E. Berg, personal communication; Witter et al. 2004; National WeatherService, Homer Airport station)
The association of red-needle mortality with drought is particularly striking in the southernPeninsula forests during the 1989-1997 period (Figure 13.27C&D). Spruce bark beetle firstattack the large, slowly growing trees in a stand (Hard 1985, 1987). The survival of smaller trees(both young saplings and released understory pole-size trees) is attributed to their ability to

Ch13 - Forests, Land Management and Agriculture ACIA Scientific Report
External Review January 2004 13–76 DO NOT CIRCULATE OR CITE
produce enough pitch to swamp the beetle galleries and kill the larvae. An additional factor maybe that large trees are more prone to drought stress. Due to cold soils, spruce trees in Alaskausually root within the upper 30-40 centimeters of soil and extend their roots laterally for 1-2meters. This shallow, extended rooting can bring trees into competition with neighboring treesand surface vegetation, especially in times of drought. Ring-widths in many large trees generallydecline for 5-10 years prior to the tree succumbing to bark beetles, clearly signifying a stressedcondition. Drought is the most likely source of this stress (Figure 13.27, Hard 1987).
While warm summers are the proximate cause of outbreaks, spruce stands much reach a certainlevel of maturity before serious spruce bark beetle infestation can develop, regardless of summertemperatures. For example, relatively light levels of tree mortality from bark beetles occurred inan area near the headquarters of the Kenai National Wildlife Refuge that burned in 1926, while anearby stand of spruce 125 years old or older experienced heavy mortality. Many stands on thesouthern Kenai Peninsula were composed of trees that regenerated following a moderate sprucebark beetle outbreak in the 1870’s-1880’s, and those trees only matured to a condition that wouldsupport substantial spruce bark beetle infestations in the mid-20th century. By the time that warmsummers began in 1987 these trees had once again become prime bark beetle habitat.
Moisture appears to be another important factor in spruce bark beetle outbreaks on the KenaiPeninsula. Precipitation at the Kenai Airport station reached a record low in 1967-69. This dryperiod was followed by an intense but short-lived spruce bark beetle outbreak in 1970-74 (Figure13.27C&D). It appears that at least two warm summers are required to initiate a spruce barkbeetle outbreak. This is consistent with the fact that the beetles normally have a two-year lifecycle, except in the warmest summers when the life cycle can be completed in one year (Wernerand Holsten 1985). In 1987 summer temperatures shifted above the mean, beginning a sustainedseries of warm summers that is unique in both the instrumental and local reconstructedtemperature records (Figure 13.27). After 1987 the spruce bark beetle outbreak accelerated, noperiod of several cool summers, which could thermally arrest the outbreak, has occurred to thepresent. Red-needle acreage mortality, however, has dropped steadily since 1996 because mostof the mature spruce forest had been killed. Food supply, rather than climate, appears to havebeen the ultimate limiting factor in this outbreak, unlike outbreaks of the past 200-250 yearsstudied by staff of the Kenai National Wildlife Refuge.
These results suggest that there is a continuing high risk caused by climate warming in managingforest land in southcentral Alaska for spruce forest crops. Under recent climate conditions, andespecially under scenarios of further climate warming, spruce bark beetle irruption potential willremain high. As the small surviving (understory) spruce trees in the region mature to commercialforest dimensions, they will move into the prime susceptibility size and age classes to serve ashosts for spruce bark beetle. Under these circumstances, the regional environment would remaineffectively saturated with spruce bark beetles because climate limitations on beetles have beenremoved. Investments in regeneration and early tending of new commercial stands of spruce,should that be desired, would carry considerable risk because bark beetles would becomeeffective agents of tree mortality at about the time that stands of spruce became large enough togenerate commercial value.
13.8.5 Climate and the spruce budworm in North America
Ch13 - Forests, Land Management and Agriculture ACIA Scientific Report
External Review January 2004 13–77 DO NOT CIRCULATE OR CITE
The eastern spruce budworm (Choristoneura fumiferana), is a defoliating insect affecting conifertrees, generally in the southern and central boreal region in the U.S. and Canada. The absolutedistribution limits of spruce budworm generally follow that of white spruce throughout theboreal forest, and there are records of severe defoliation within 150 km of the Arctic Circle(Harvey 1985). Outbreaks have at times extended over 72 million hectares and lasted for up to15 years (Fleming and Volney 1995). The budworm is generally present in the forest at lowbackground numbers. During irruptions, there can be more than 22 million budworm larvae perhectare in suitable forest stands (Crawford and Jennings 1989)
Weather appears to be a critical factor in determining the budworm’s distribution. Irruptions ofbudworm generally follow drought and outbreaks also start after hot, dry summers (Fleming andVolney 1995). Drought stresses the host tree population, reducing host resistance (Mattson andHack 1987). Elevated summer temperatures increases budworm reproductive output. Femalebudworms lay 50% more eggs at 25 degrees C than at 15 degrees C (Jardine 1994). Finally,higher temperatures and drought can shift the timing of budworm reproduction so that naturalparasitoid predators are no longer effective in limiting budworm numbers (Mattson and Hack1987). Conversely, cold weather can stop a budworm outbreak. Budworms starve if a late springfrost kills the new shoot growth of the host trees on which the larvae feed.
Given this weather/climate sensitivity of budworm, it was inferred that a warming climate wouldbe associated with northward movement of outbreaks of the spruce budworm (Gitay et al. 2001).Such a northward movement appears to have happened. Before about 1990, spruce budworm hadnot appeared able to reproduce in the northern boreal forest of central Alaska. In that year after aseries of warm summers a spruce budworm irruption occurred in the Bonanza Creek Long-TermEcological Research site and visible canopy damage spread over several tens of thousands ofhectares of nearby white spruce forest. Populations of budworm have persisted in this area nearthe Arctic Circle including a minor outbreak in 2002 - 2003.
13.8.6 Other forest-damaging insects in the boreal region
Aspen is the most important deciduous tree species in the Canadian boreal forest, with >1000 Tgof carbon stored in the aboveground biomass. Aspen dieback has become conspicuous over partsof the southern boreal forest and aspen parkland in western Canada. In 18 aspen stands nearGrande Prairie, Alberta, defoliation histories were reconstructed based tree rings and records ofpast insect outbreaks. Several factors contributed to the observed dieback. Defoliation by foresttent caterpillar (Malacosoma disstria Hubner) and drought in the 1960s and 1980s led to reducedgrowth and predisposed some stands to secondary damage by wood-boring insects and fungalpathogens. Thaw-freeze events during a period (1984-1993) of unusually light late winter snowcover also contributed to the observed dieback. Under global change, the severity of thesestressors may increase, which would pose a serious concern for the future health, productivity,and carbon sequestration of aspen forests in the region (Hogg et al. 2002).
During the last 2 decades of the 20th century, warmer summers and winters in central Alaskawere associated with a noticeable increase in the area of trees killed or damaged by insects. Themapped area of forest affected by spruce budworm, coneworm, and larch sawfly defoliation
Ch13 - Forests, Land Management and Agriculture ACIA Scientific Report
External Review January 2004 13–78 DO NOT CIRCULATE OR CITE
mapped throughout interior Alaska increased, totaling over 300K ha of combined infestationsduring the period 1991-96 (Holsten and Burnside, 1997).
A variety of insects are known have the potential to become serious agents of tree mortality in amuch warmer boreal and Arctic region. Insect species not currently present should be able toreadily disperse into the region if warmer climate conditions allow, and some may developoutbreak potential. In Europe, climate warming, especially in the form of warmer winters, isassociated with increased outbreaks of various species of bark beetles and aphids (Beniston et al.1998). In Ontario, Canada, forest land managers estimate that a range of forest damaging insectsthat are currently prominent in the central and southern boreal area would move northward or, ifalready present, develop greater outbreak potential (Parker et al. 2000). These include sprucebudworm, forest tent caterpillar, jack pine budworm (Choristoneura pinus pinus Freeman), andgypsy moth (Lymantia dispar L.). The bronze birch borer (Agrilus anxius) is a North Americanspecies that can cause severe damage to paper birch and may be effective in limiting birch alongthe southern (warm) margin of its distribution (Haak 1996). The bronze birch borer is presenttoday in small numbers as far north as Alaska. The scenarios produce levels of warmth innorthern boreal North America near the conditions where the bronze birch borer effectivelylimits birch today. In boreal Alaska, a larch outbreak killed most of the larger and older tamarack(Larix laricina) trees during a warm period in the decade of the 1990s, and aspen leaf miner(Phyllocnistis populiella (Chamber) appeared at outbreak levels (142K ha) by 2003 (Witter et al.2004).
13.9 Climate Change and Fire
13.9.1 Fire and boreal forests
Fire is a major climate –related disturbance factor in the boreal forest and it exerts pervasiveecological effects (Zackrisson, 1977; Van Cleve et al., 1991; Payette, 1992). Climate,disturbance, and vegetation interact and affect each other, and together they influence the rateand pattern of changes in vegetation (Neilson 1993; Noble 1993), the rate of future disturbance(Gardner et al. 1996, Rupp et al. 2002; Turner et al. 2003), and the pattern of new forestdevelopment (Turner et al. 1995; Rupp et al. 2000a,b). Understanding these interactions andfeedbacks is critical in order to understand how scenarios of climate warming will affect futurefire regimes and the consequences these ecological changes will have for both boreal forests andforest management.
The total area burned in North America has been increasing concurrently with recent climaticwarming (Stocks, 2000). The annual area burned in western North America has doubled in thelast 20 years of the 20th century (Murphy et al. 2000). Based upon less precise statistics thereappears to be a similar trend in the Russian Federation (Kasischke et al. 2003).
Three factors are important when examining the impacts of climate change on the fire regime.First, boreal forests become increasingly flammable during succession as the forest floor andunderstory builds-up. Conifer-dominated stands are usually more flammable than broadleavedand other vegetation types. Early post-fire vegetation is generally less flammable than older andmore structurally complex vegetation. Vegetation. Vegetation also influences fire probability

Ch13 - Forests, Land Management and Agriculture ACIA Scientific Report
External Review January 2004 13–79 DO NOT CIRCULATE OR CITE
indirectly, through its effects on regional climate (Chapin et al. 2003), with early-successionalstands absorbing and transferring only half the atmospheric radiation as late successional sprucestands (Baldocchi and Vogel 1995). A second factor is the need to understand the direct affectsof climate on the fire regime. Finally, humans and their changes in land use affect the fireregime, and these changes must be considered to understand future fire effects in a warmerclimate.
13.9.1 The role of fire in Subarctic and boreal forest
Disturbance is the driving force behind vegetation dynamics in the boreal biome. Wildfires,alluvial processes (i.e., erosion and flood deposition), treefall events caused by wind, and tree-killing insect outbreaks all play a major role that can impact large portions of the landscape. Butfire is particularly significant because of its pervasive presence, its strong link to climate, and thedirect feedbacks it has on permafrost dynamics, regional climate, and the storage and release ofcarbon. Fire often follows large-scale tree death caused by other factors.
In the mosaic of old burns that covers the boreal-forest landscape, there are four tendenciesrelated to ecosystem development, expressed over timescales of decades to millennia and overdiffering landscape areas. There is a tendency towards paludification, which is the water-loggingand cooling of soil caused by the buildup of organic soil layers (Viereck, 1970). Paludificationcan be a significant factor in treeline retreat in maritime climates (Crawford et al. 2003). Asecond tendency is for the longer-lived conifer species to usurp the canopy from shorter-livedhardwood species (Van Cleve et al., 1991; Pastor et al., 1999) with an accompanying decline inliving biomass (Paré and Bergeron, 1995). The third tendency is towards the formation of ashifting-mosaic-steady-state in which burned areas at different stages of secondary successionform the pieces of the mosaic (Wright, 1974). Fourth there is a tendency of increased risk ofburning with age. Fire opposes paludification by oxidizing the organics building up on theground surface (Mann and Plug, 1999). Fire also interrupts conifer take-over by restartingsuccessional development with the earliest broadleaf-dominated stages. And because time sincelast fire is an important cause of vegetation composition and soil conditions, fire frequency has alarge influence on carbon storage and release within the boreal forest (Kasischke et al., 1995;Kurz and Apps, 1999).
13.9.1.1 Weather and climatic controls
Fire is strongly controlled by both temporal and spatial patterns of weather and climate(Flannigan and Harrington 1988, Johnson 1992, Swetnam 1993, Flannigan et al. 2001). Specificfire behavior responds to hourly, daily, and weekly weather conditions. Solar radiation,continentality, topography, and specific terrain features influence these fire-generatingconditions. The general fire regime of an area responds to long-term, landscape-level climaticpatterns. As climate varies, the controlling weather variables can vary in magnitude and direction(Flannigan et al. 2001).
Case studies from northern coniferous forests have documented weather variables prior to andduring specific fire events (Flannigan and Harrington 1988) and have identified good predictorsof conditions that promote the rapid spread of fire. These conditions are warm temperatures, little
Ch13 - Forests, Land Management and Agriculture ACIA Scientific Report
External Review January 2004 13–80 DO NOT CIRCULATE OR CITE
or no precipitation, low relative humidity, and high winds. Synoptic weather conditions thatproduce cold frontal systems, drought, and low relative humidity have been found to be goodpredictors of area-burned activity (Flannigan et al. 2001). Upper air circulation patterns havebeen related to area burned (Newark 1975). Catastrophic burning events are related to thebreakdown of the 500-mb-long wave ridge (Nimchuk 1983). Breakdown of these ridgesgenerally occur at the same time as documented increases in lightning strikes and strong surfacewinds.
Regional and global links between meteorological variables and weather anomalies, calledteleconnections, have been identified. The most documented sources of teleconnections are theEl Nino Southern Oscillation (ENSO) and the Pacific Decadal Oscillation (PDO, see Chapter2.1). Several studies in North America have linked teleconnections to area-burned anomolies(Swetnam and Betancourt 1990; Johnson and Wowchuck 1993; Flannigan et al. 2000).Teleconnections may offer long-range forecasting techniques for temperature and precipitationanomalies that could be used by fire managers in estimating fuel moisture and fire potential(Flannigan et al. 2001). Winter season sea surface conditions in the Pacific are significantlycorrelated with temperature and seasonal area burned in Canada (Flannigan et al. 2000).Significant correlations in these factors vary by provincial region and North Pacific Oscillation(NPO) phase (1953-1976 vs. 1977-1995). Interestingly, the sign of the correlation changed fromstrongly negative (1953-1976) to strongly positive (1977-1995) for 4 regions (Alberta, W.Ontario, E. Ontario, Quebec) at the same time they changed from strongly positive to stronglynegative for 2 regions (BC and Saskatchewan). During the same period two regions did notchange signs (Yukon/NWT and Manitoba). These shifts occur at previously identified changes inclimate regimes (for example see Section 13.6, Figure 13.16), and emphasize the control theoverall atmospheric circulation has on fire at a regional scale in understandable, but varyingways.
13.9.1.2 Secondary succession
There are two different scenarios of the relay floristics (sensu Egler, 1954) pathway forsecondary succession after fire that operate in the boreal forest. The first is the process in whichdeciduous shrubs and trees initially colonize burned sites but are replaced in the overstory inapproximately 150-200 years by coniferous trees that may be limited in movement by the timenecessary for successive generations to reach reproductive maturity or the presence of individualsurviving trees dispersed throughout the burn. The second process is self-replacement, whichoccurs after fires by root sprouting (i.e., aspen, birch, balsam poplar, and numerous shrubspecies) or by fire-stimulated seed release (i.e., black spruce) (Mann and Plug, 1999; Greene etal., 1999). Both of these successional processes occur in the boreal forest. However, the relativeimportance of each pathway in determining the structure of the boreal forest at a landscape scaleis still unknown.
13.9.1.3 Components of the fire regime
Fire regime describes the general characteristics of fire and its effects over time on ecosystems. Itcan be defined by specific components such as frequency, intensity, severity, size, timing,residuals, etc. These characteristics have been used to develop classification systems that aim to

Ch13 - Forests, Land Management and Agriculture ACIA Scientific Report
External Review January 2004 13–81 DO NOT CIRCULATE OR CITE
describe the principal types of fire regimes associated with different ecosystems. Thesefire/ecosystem regime categories are general and broad due to the large spatial and temporalvariability exhibited by specific ecosystems (Whelan 1995), but they do provide a conceptualmodel useful for understanding both fire behavior and fire effects in a particular system.Documentation of the components of fire regimes (i.e., ignition sources, frequency, extent, andseverity) for specific ecosystems and geographic regions is also highly variable, and in manycases not well quantified.
13.9.1.4 Ignition sources
Lightning strikes and humans are the two sources of ignitions in the boreal forest:. Lightning isthe most significant cause of fires (defined by total area burned), although this trend variesamong regions. The number of lightning-caused fires generally declines as latitude increasesbecause of decreased heating at the ground surface necessary to produce convective storms, andas climate becomes more maritime (cool layer at ground surface) (Johnson 1992). Humans areresponsible for high numbers of ignitions, but the fires started consume much less area becausethey are usually actively suppressed. Indigenous peoples ignited fires for specific purposesthroughout history, but their impact on past overall fire regimes remains uncertain (Johnson1992; Swetnam et al. 1999). Specific regions of the boreal forest in North America experiencedstrong human-caused fire impacts during the “gold rush” era of the late 19th and early 20th
centuries.
13.9.2 Regional fire regimes
13.9.2.1 Russia
Fire statistics for the Russian Federation, in general, and the Russian boreal region, specifically,are incomplete at best (Stocks 1991; FAO 2001). Official fire statistics have been reported onlyfor protected regions of Forest Fund land (see 13.3.1). Furthermore, only 60% of the Forest Fundland is identified as protected (FAO 2001). Approximately 430 million ha of forested tundra andmiddle taiga in Siberia and the Far East receive no fire protection. The paucity of reliablestatistics is a result of numerous issues including sheer remoteness, lack of detection andmapping technology, lack of fire management funding, and deliberate falsification of pastrecords for political reasons. Humans were identified as the major source of ignitions at 65%,followed by lightning 16%, prescribed agricultural burning 7%, and 12% linked toother/unknown activities (Shetinsky 1994). Intensive prevention and education programs havefound little success in decreasing human caused fires. Many of these fires grow to large sizes dueto overstretched suppression resources.
Keeping the limitations in mind, the statistics for the protected Forest Fund area can give someperspective on fire across the Russian Federation. Between 18,000 to 37,000 forest fires weredetected annually for the period 1950-1999. The average annual area burned within the zone ofdetection for the decades 1950-1959, 1960-1969, 1970-1979, 1980-1989, 1990-1999 was 1.54,0.68, 0.48, 0.54, and 1.2 million ha, respectively (FAO 2001). Indirect estimates of annual areaburned on both protected and unprotected Forest Fund areas have been developed throughmodeling techniques. Shvidenko and Goldammer (FAO 2001) used a modified expert system

Ch13 - Forests, Land Management and Agriculture ACIA Scientific Report
External Review January 2004 13–82 DO NOT CIRCULATE OR CITE
model (Shvidenko and Nilsson 2000), available fire statistics, and forest inventory data on ageand stand structure to calculate an estimated total of the annual average area burned in all ofRussia over the past 30 years. The estimate applies to the Forest Fund and State Land Reservearea. An estimated 5.10 million ha burned, of which 3.94 million ha were in the borealbioclimatic zones of forest tundra/northern taiga, middle taiga, and southern taiga (see Figure13.01).
Satellite remote sensing techniques provide insight into the potential total extent of area burnedacross major regions of the Russian Federation. In 1987 an estimated 14.4 millions hectaresburned in the Russian Far East and eastern Siberia (Cahoon et al. 1994), and in 1992 anestimated 1.5 million hectares burned in all of the Russian territories (Cahoon et al. 1996). In1998, following a very strong El Nino, an estimated 9.4 million hectares burned in the Asianregions of Russia (FAO 2001).
Only a small fraction of total forested area falls under any organized fire suppressionmanagement. Fire suppression is headed by the Ministry of Natural Resources of Russia, whichmanages suppression efforts through regional offices. Fire suppression resources include bothground and aerial operations. Aerial operations provide detection and monitoring services, anddirect suppression resources (i.e., water and retardant drops, transport of ground personnel andsmokejumpers). The State Forest Guard (ground suppression) and the Avialesookhrana (aerialdetection and suppression) coordinate fire suppression with local and regional authorities. Undersevere fire conditions military detachments and local populations are recruited.
Operational policy and logistical allocation follows fire danger predictions, which is based onweather and climatic conditions. The Nesterov fire index, similar to the Canadian Forest FireDanger Rating System or the US National Fire Danger Rating System, is used for prediction.Aircraft patrols and resource deployments are based on the fire index predictions. A severelimitation to successful fire management has been a lack of funding – in 1998 only US$0.06 perhectare was allocated to fire suppression (FAO 2001). In addition, a lack of advanced technologyequipment (i.e., satellite monitoring, radios, etc.), aircraft, and State Forest Guard personnel, aswell as unfavorable land-use practices have been identified as major weaknesses in the currentsystem.
13.9.2.2 Canada
Canadian fire management agencies developed a large fire database (LFDB) for all fires largerthan 200 ha for the period 1959 to the present (Stocks et al. 2000). Fires larger than 200 harepresent only 3.5% of the total number of fires, but 97% of the total area burned over this period(Stocks et al. 2000). The fire perimeters were digitized and mapped in a GIS and includeancillary information including ignition location and date, size, cause, and suppression action(s)taken. This database has been expanded into the past where data exist (as far back as 1918) andis continuously updated with each passing fire season.
Lightning-caused fires predominate throughout the fire record and account for almost all largefires in the northern portions of Canada. Over the period 1959-1997 approximately 68% of allfires were ignited by lightning, and those fires burned approximately 79% of the total area
Ch13 - Forests, Land Management and Agriculture ACIA Scientific Report
External Review January 2004 13–83 DO NOT CIRCULATE OR CITE
burned (Stocks et al. 2000). Temporal trends show a steady increase in number of lightning firesand contribution to total area burned from the 1960s through the 1990s, which fire managersattribute to technology improvements in fire detection and monitoring. Human-caused fires are asignificant contributor to the total number of fires almost exclusively in populated areas andalong the road network. Suppression of human-caused fires is effective in limiting the total areaburned by this ignition source. Temporal trends show a steady decrease in total area burned dueto human-caused ignitions and this is attributed to aggressive fire suppression tactics.
Average total annual area burned for the period 1959-1997 was approximately 1.9 millionhectares, with interannual variability ranging from 270,000 to 7.5 million hectares burned(Stocks et al. 2000). Spatial trends identified just a few ecozones (Taiga Plains, Taiga Shield,Boreal Shield, and Boreal Plains) that accounted for the majority (88%) of total area burnedduring the 1959-1997 period. The two primary reasons for this pattern are (1) a continentalclimate in these ecozones is conducive to extreme fire danger conditions, and (2) these ecozonescontain large uninhabited areas with low values-at-risk, and so fires are allowed to burnunimpaired (Stocks et al. 2000).
Organized fire suppression and management has operated in Canada since the early 1900’s,originally stimulated as a response to large catastrophic fires, much like those experienced in theUS. Canada is recognized worldwide for its advanced technologies and operational efficienciesin both fire prevention and suppression. The Canadian Forest Fire Danger Rating System(CFFDRS) was first developed in 1968 and consists of two subcomponents. The Canadian ForestFire Weather Index (FWI) system, which provides a quantitative rating of relative fuel potentialfor standard fuel types based upon weather observations. The Canadian Forest Fire BehaviorPrediction (FBP) system accounts for fire behavior variability of fuel types based on topographyand components of the FWI. The CFFDRS is used for training, prevention, operational planning,prescribed burning, and suppression tactics. In addition, CFFDRS is used by researchers forinvestigating fire growth modeling, fire regimes, and potential climate change impacts. Thesystem is used extensively in Alaska in place of the US Fire Danger Rating System – a systemdeveloped primarily for the lower 48 states.
Aerial reconnaissance in conjunction with lightning detection systems has been employedheavily since the 1970’s throughout the North American boreal forest (including Alaska). Thelightning detection system identifies areas of high lightning strike density and allows for focusedaerial detection operations. This has greatly increased detection efficiencies over remote regions.
13.9.2.3 U.S.A. (Alaska)
The fire record for the Alaskan boreal forest has evolved over time and consists of three datasets(Kasischke et al. 2003). The first is a tabular summary of total annual area burned since 1940.The second is a tabular database that contains the location, ignition source, size, managementoption, and initiation and extinguishment date for all fires since 1956. The third is a GIS databaseof the boundary of fires since 1950. The spatial database includes all fires > 400 ha (1000 acres)in size for 1950 to 1987 and all fires > 25 ha (100 acres) since 1988.

Ch13 - Forests, Land Management and Agriculture ACIA Scientific Report
External Review January 2004 13–84 DO NOT CIRCULATE OR CITE
The importance of lightning as an ignition source in the Alaskan boreal forest was minimized inearly studies because anthropogenic sources of ignitions thought to be more important (Lutz1956). However, the implementation of digital electronic lightning detection systems along witha more thorough review of fire statistics lead to the realization that lightning is not onlywidespread throughout the growing season in interior Alaska, but is responsible for ignition ofthe fires that burn most of the area (Barney and Stocks 1983; Gabriel and Tande 1983). Analysisof fire statistics from the Alaska Fire Service shows that while humans start >61% of all fires,these fires are responsible for only 10% of the total area burned (Kasischke et al. 2003). Theremaining fires are the result of ignitions from lightning.
Convective storms and associated lightning can range in size from individual clouds to synopticthunderstorms covering thousands of square kilometers. A single thunderstorm may producemost of the annual lightning strikes of an area (Nash and Johnson 1996). In Interior Alaska thelightning density gradient generally runs from high in the east to low in the west, parallel withthe warmer summer climate in the interior continental areas to cooler maritime summer climatenear the coast (Kasischke et al. 2003). However, the distribution of mapped fires that originatefrom lightning strikes is well distributed throughout the interior of the state. In contrast tolightning ignitions that are uniformly distributed between the Brooks and Alaska Ranges, humanfire ignitions are centered around major population centers (Fairbanks and Anchorage), as wellas along the major road networks (Kasischke et al. 2003).
The presence of the boreal forest landscape may promote convective thunderstorms. In centralAlaska the density of lightning strikes is consistently highest within boreal forest compared totundra and shrub zones across a climatic gradient (Dissing and Verbyla 2003). Within the tundrathe number of lightning strikes increases the closer the boreal forest edge. The paleo recordindicates that wildfires increased once black spruce became established in interior Alaska(despite a cooler, moister climate). This may have been due to two factors: 1) increasedlandscape heterogeneity and higher sensible heat fluxes (see 13.2.5 BOREAS results) leading toincreased convective thunderstorms, and 2) increased fuel flammability associated with the blackspruce vegetation type (Dissing and Verblya 2003; Lynch et al. 2003; Chambers and Chapin2003; Kasischke et al. 2003). These results suggest that climate changes that promote theexpansion or increase in density of conifer forest will likely increase the incidence of fire, butthat climate changes that decrease conifers (burning occurs too frequently, aridification) willlikely decrease subsequent burning.
Annual area burned in Alaska exhibits a bimodal distribution, with years of high fire activity(ignitions and area burned) punctuating a greater number of years of low activity. For theAlaskan boreal forest region, 55% of the total area burned between 1961 and 2000 occurred injust 6 years. The average annual area burned during these episodic fire years was seven timesgreater than the area burned in the low fire years.
With the observed increase in air temperature and lengthening of the growing season over thepast several decades in the North American boreal forest region, a corresponding increase in fireactivity between the 1960s and 1990s might be expected (Stocks, 2000). For the Alaska borealforest region (which was less affected by fire suppression efforts than southern boreal areas),

Ch13 - Forests, Land Management and Agriculture ACIA Scientific Report
External Review January 2004 13–85 DO NOT CIRCULATE OR CITE
such an increase in fire activity is not apparent. There has only been a slight (7%) rise in theannual area burned between 1981 and 2000 (297,624 ha yr-1) compared to the period between1961 and 1980 (276,624 ha yr-1) (Kasischke et al. 2003). The frequency of large fire years hasbeen greater since 1980 (4 large fire years) than before 1980 (two large fire years), and theincrease in average annual area burned between these periods is due to the increase in frequencyof large fire years and the decrease in fire fighting activities in remote areas. The length of thedata record for Alaska is insufficient to determine whether the increase in frequency of large fireyears is part of natural variability or a response to recent climate warming. The official firestatistics for Alaska show there were two large fire years per decade in the 1940s and 1950s,indicating that the frequency of large fire years is relatively constant over the past 60 years.
The number and size distribution of fires in the Alaskan boreal forest region is different duringthe low and severe fire years. During low fire years over the period 1950 to 1999 an average of17 fires occurred per year > 400 ha with an average size of 7,800 ha. In contrast, during high fireyears an average of 66 fires > 400 ha occurred with an average size of 20,300 ha (Kasischke etal. 2003). In low fire years, 73% of the total area burned occurred in fires < 50,000 ha in size. Inhigh fire years, 65% of the total area burned occurred in fires ≥ 50,000 ha in size. In low fireyears, 9% of the total area burned in fires ≥ 100,000 ha in size, with no fires being larger than200,000. In contrast, during high fire years, 33% of the total area burned in fires ≥ 100,000 ha insize.
Fire managers in Alaska typically recognize two fire seasons (Kasischke et al. 2003). The majorfire season typically occurs after mid-June when the earth’s surface becomes warm enough todrive convective thunderstorm activity. However, there is an earlier fire season throughout thestate that is associated with the extremely dry fuel conditions that occur immediately after snowmelt and before leaf-out in late spring. At this time, precipitation levels are low, and fuelmoisture conditions are extremely low because of the curing of dead vegetation during winterand the lack of green vegetation. During this period, human activities result in the majority offire ignitions.
Fire management and suppression is a relatively new concept in Alaska and did not become anorganized effort until 1939. In the early 1980s, fire management efforts in Alaska werecoordinated under the direction of an interagency team. Beginning in 1984, fire managementplans were developed for thirteen fire-management planning areas. The fire plans provide forfive separate suppression options:
• Critical protection is provided for areas of human habitation or development. Theseareas receive immediate initial attack and continuing suppression action until the fire isextinguished.
• Full protection is provided to areas of high-resource values. Fires receive immediateinitial attack and aggressive suppression to minimize acreages burned.
• Modified action provides for initial attack on new fires during the severe part of the fireseason (May 1-July 10). Escaped fires are evaluated by the land manager andsuppression agency for appropriate suppression strategies. On specified dates (generally,after July 10), the modified action areas convert to limited action.

Ch13 - Forests, Land Management and Agriculture ACIA Scientific Report
External Review January 2004 13–86 DO NOT CIRCULATE OR CITE
• Limited action is provided to areas of low-resource values or where fire may actuallyserve to further land management objectives. Suppression response is the monitoring offire behavior and those actions necessary to ensure it does not move onto areas of highervalues.
• Unplanned areas exist where land managers declined participation in the planningprocess. These few unplanned areas receive the equivalent of full protection.
The formation of these plans radically changed wildland fire management in Alaska. Theadoption of these cooperative plans created areas where fires were no longer aggressivelyattacked due to the low economic resource value of those lands. The primary goals of the plansare to restore the natural fire regime to the boreal forest ecosystem and to reduce suppressioncosts.
13.9.2.4 Fennoscandia
Finland, Sweden, and Norway account for a very small percentage of total area burned in theboreal forest and generally have not experienced large fires in modern times. This can beattributed to the ease of access throughout these relatively small countries and their highlymanaged forest systems. In addition, lightning fires are not a major factor, because they accountfor less than 10% of all fires (Stocks 1991). Fire statistics for this region of the boreal forest arelimited and discontinuous. The lack of natural fire is one of the principal causes of endangermentof a set of fire-dependent species in northern Fennoscandia (Esseen et al. 1992).
Finland reported an annual average of 800 ha burned during the 1990s (FA0 2001 – Table 8).Since record keeping began in 1952 there has been a steady decrease in area burned from a highof 5,760 ha (annual average) in the 1950s to 1,355 ha in the 1960s to less than 1,000 ha from1971-1997 (FAO 2001). On average 2,224 fires per year occurred during the period 1995-1999.Human caused fires accounted for 61% of all fires, followed by 29% of unknown cause, and10% lightning caused (FAO 2001).
Boreal forest encompasses most of Sweden and is covered by a mix of flammable conifer trees,shrubs, and mosses. Sweden reported an annual average of 1600 ha during the 1990’s (FAO2001 – Table 8). Humans are the major cause of fires accounting for approximately 65% (FAO2001) of the annual average of 3280 fires during the 1990s (FAO 2001 – Table 8). According tothe FAO (2001) Norway reported on average 564 ha burned annually between 1986 and 1996.The highest frequency of fires occurs in the boreal forest region of the eastern lowlands(Mysterud et al. 1998). On average there were only 513 fires per year during the 1990s (FAO2001 – Table 8).
Forest fires are virtually absent from the sparsely forested regions of Iceland and Greenland. Nofire statistics were reported to the FAO for the period 1990-1999.
13.9.3 Possible climate change impacts on fire
Rupp et al. (2000a,b) used a spatially explicit model to simulate the transient response ofSubarctic vegetation to climatic warming in northwestern Alaska. In the model simulations of a

Ch13 - Forests, Land Management and Agriculture ACIA Scientific Report
External Review January 2004 13–87 DO NOT CIRCULATE OR CITE
warming climate led to more and larger fires. Vegetation and fire regime continued to change forcenturies in direct response to climate warming (+2 to +4 degree C increases in mean growingseason temperature). Flammability increased rapidly in direct response to climate warming andmore gradually in response to simulated climate-induced vegetation change. In the simulationswarming caused as much as a 228% increase in the total area burned per decade, which led to anincreasingly early successional and more homogenous deciduous forest-dominated landscape.
Turner et al. (2003) used the same model (Rupp et al. 2000b) to simulate fire regime sensitivityto precipitation trends. Projected precipitation estimates by global climate models have thelargest associated errors and the highest variability between models. A simulated instantaneous 2degree C increase in average growing season temperature was applied with two differentprecipitation regimes (a 20% increase and 20% decrease from current precipitation) to explorethe possible influence of climate change on long-term boreal forest ecosystem dynamics. Bothwarming scenarios predicted an increase in the total number of fires compared to current climate.However, the distribution of fire sizes was surprising. As expected, the warmer and drierscenario resulted in fewer small fires and an associated shift towards larger fires. Also asexpected, the warmer and wetter scenario resulted in fewer large fires and an associated shifttowards smaller fires. However, the distribution of very large fires (burning > 25% of the totallandscape area) was unexpected. The warmer and wetter scenario produced more very large firescompared to the warmer and dryer scenario. The warmer and dryer climate scenario experiencedfrequent medium-sized fires, which prevented fuels from building up across the landscape andlimited the number of large fires. In contrast, the warmer and wetter climate scenario led tofrequent small fires, which allowed the development of well-connected highly flammable late-successional stands across the landscape.
Additional model simulations suggest that vegetation effects can cause significant changes in thefire regime in Interior Alaska (Rupp et al. 2002). Landscapes with a black spruce componenthad more fires and more area burned than did landscapes with no black spruce component.Black spruce landscapes also experienced numerous burning events that consumed extensiveportions (more than 40%) of the landscape. These results agree with observations in theCanadian boreal forest where 2% of the fires account for 98% of the total area burned (Stocks1991). Large-scale fire events need to be realistically represented in ecosystem models becausethey strongly influence ecosystem processes at landscape and regional scales. These results havestrong implications for global scale models of terrestrial ecosystems. Currently, these modelsconsider only plant functional types distinguished by their physiological (C3 versus C4),phenological (deciduous versus evergreen), and physiognomic (grass versus tree) attributes. Thefire modeling results suggest the need for a finer resolution of vegetation structure andcomposition related to flammability in order to simulate accurately the dynamics of the fireregime, and to understand how different climate changes would be likely to change ecosystemsat several different scales.
Modeling results show that fire regime plays an important role in determining the overall relativeabundance of ecosystem types at any given time, and that different fire regimes createqualitatively different patterns of the placement of ecosystems across the landscape (Rupp et al.2000b, 2002). One process is “contagion” or the spread of effects into one type largely due to itsjuxtaposition with another. Simulation results in a typical Alaska black spruce landscape

Ch13 - Forests, Land Management and Agriculture ACIA Scientific Report
External Review January 2004 13–88 DO NOT CIRCULATE OR CITE
revealed increases in the total amount of deciduous forest that burned in two landscapes thatcontained a black spruce component. The results indicated a much shorter fire return interval fordeciduous forest in a landscape dominated by black spruce, and the fire return times were similarto actual fire intervals calculated by Yarie (1981) for deciduous forest in interior Alaska (Rupp etal. 2000b, 2002). Landscape-level changes in the fire return interval of specific fuel types is animportant effect of spatial contagion that currently cannot be addressed by statistical formulationwithin a global vegetation model. Although there is an excellent quantitative understanding offire behavior as a function of climate and vegetation at the scale of hours and meters (Johnson1992), the dynamic simulation of fire effects at landscape or regional scales remains rudimentary(Gardner et al. 1999). A long-term potential consequence of intensified fire regimes underclimate warming is that fire-induced changes in vegetation may lead to a more homogenouslandscape dominated by early successional deciduous forest (Rupp et al. 2000b, 2002). This hasstrong implications for the regional carbon budget and feedbacks to climate (see section 13.x.x).A shift from coniferous to deciduous forest dominance would have a negative feedback toclimate warming due to changes in albedo and energy partitioning (Chapin et al., 2000).
Stocks et al. (1998) used outputs from four current General Circulation Models (GCM) to projectforest fire danger in Canada and Russia under a warmer climate. Temperature and precipitationanomalies between current CO2 and 2 x CO2 runs were combined with observed weather datafor the period 1980-1989 in both Canada and Russia. All four model scenarios projected largeincreases in the areal extent of extreme fire danger in both countries under the 2 x CO2scenarios. A monthly analysis identified an earlier start date to the fire seasons in both countriesand significant increases in total area experiencing extreme fire danger throughout the warmestmonths of June and July. Scenarios are still of limited use, however, in projecting changes inignitions.
Model predictions of the spatial-temporal dynamics of a boreal forest under climate change havebeen made for the landscape of the Kas-Yenisei erosion plain in the southern taiga of westSiberia (Ter-Mikaelian et al. 1991) It is predicted that the number of years in which there aresevere fires will more than double under a summer temperature jump from 9.8°C to 15.3°C, thearea of forests burned annually would increase by 146%, and average stored wood mass woulddecrease by 10%.
Flannigan and Van Wagner (1991) also investigated the impact of postulated greenhousewarming on the severity of the forest fire season in Canada. They used 2 x CO2 simulationresults from 3 GCMs to calculate the seasonal severity rating across Canada. Their resultssuggest a 46% increase in seasonal severity rating, with a possible similar increase in areaburned, in a 2 x CO2 climate.
Flannigan et al. (1998) looked at future projections of wildfire in circumboreal forests inresponse to scenarios of global warming. Simulations were based on GCM outputs as in studiesdescribed above. The simulation and fire history results suggested that the impact of globalwarming on northern forests through forest fires may not be severe, as previously suggested, andthat there may be large regions of the Northern Hemisphere with a reduced fire frequency. Thesesimulation results are attributed to a switch from using monthly to daily GCM data. Thescenarios still produced areas where the interval between fires would likely decrease (i.e.,
Ch13 - Forests, Land Management and Agriculture ACIA Scientific Report
External Review January 2004 13–89 DO NOT CIRCULATE OR CITE
become more frequent), but they also produced regions of no change or with greater probabilityof an increasing interval (i.e., less frequent fires).
13.10 Climate Change, in Relation to Carbon Uptake and Carbon Storage
13.10.1 The role of boreal forest in the global carbon cycle
Within the terrestrial biosphere, forests cover 43% of the land area but are potentially responsiblefor 72% of the annual net primary productivity (McGuire et al 1995b). The boreal forest coversroughly 1.37 x10⁹ hectares and by itself (not including high latitude tundra) containsapproximately 20% of the world’s reactive soil carbon, an amount similar to that held in theatmosphere (IPCC 2001; Schlesinger 1997). Climatic change can impact high-latitude carboncycling on multiple timescales. The most likely mechanism for significant short-term change inboreal carbon cycling from climate change is the change in rates of organic matterdecomposition of the forest floor and mineral soil that would come about as a result of majorchanges in species composition caused by alteration of disturbance regimes. Climatic change canstrongly affect rates of carbon cycling through impacts on the disturbance regime and especiallythe subsequent successional development of ecosystems (Jiang et al 2002; Barr et al 2002;Gower et al 2001; Wang et al. 2001; Zimov et al. 1999; Trumbore and Harden 1997). Shifts indominant tree species composition within the present boreal forest in response to scenarios ofclimate change (Carcaillet et al. 2001; Hogg and Hurdle 1995; Smith et al. 1992) would likelyhave profound impacts on the global carbon budget (Kasischke et al. 2002; Amiro 2001; Goweret al. 2001).
Boreal and Subarctic peatlands contain approximately 455 Pg of carbon accumulating at anaverage rate of 0.096 Pg/yr and constitute a significant portion of the total boreal carbon pool(Gorham 1991). The majority of peat consists of molecules that are highly resistant todegradation (e.g. lignin and cellulose). Species composition in sphagnum bogs is highly resilient(likely to remain the same or recover after change) because the mosses modify the localenvironment to produce highly acidic conditions, and their resiliency increases with age (Kuhry1994).
13.10.2 The role of disturbance in the carbon cycle of the boreal forest
The four processes that largely control storage and release of carbon in boreal forests are: 1) rateof plant growth, 2) rate of decomposition of dead organic matter, 3) rate of permafrost accretionand degradation, 4) frequency and severity of fires (Kasischke et al. 1995). All of these fourprocesses are impacted by landscape-scale disturbance. Differences in carbon cycling betweenmature and recently disturbed forest ecosystems have been observed in both experimental studiesand modeling experiments. Some studies (Arain et al. 2002, and Valentini et al. 2000) suggestthat the annual carbon budget of the mature northern forest is at equilibrium and in some caseslosing carbon to the atmosphere. Alternatively, model results and field experiments show thatwhen ecosystems are disturbed, significant losses of soil carbon and nutrients can occur (Schimelet al. 1994) for a number of years after the disturbance.
Ch13 - Forests, Land Management and Agriculture ACIA Scientific Report
External Review January 2004 13–90 DO NOT CIRCULATE OR CITE
The effects of temperature and disturbance (i.e., fire and grazing) on carbon exchange over threeyears in five undisturbed sites and five disturbed sites in forests of northeast Siberia weremeasured by Zimov et al. (1999) and results show that disturbance increased the seasonalamplitude of net carbon exchange. Disturbance had a larger effect on seasonal amplitude thandid either interannual or geographic differences in growing season temperature.
Fire affects the storage of carbon in the boreal forest in five ways: 1) carbon is sent to theatmosphere through combustion, 2) fire converts relatively decomposable plant material intostable charcoal, 3) fire re-initiates succession and changes the ratio of forest stand age classesand stand age distribution, 4) fire alters the thermal and moisture regime of the mineral soil andremaining organic matter, which strongly affects rates of decomposition, and 5) fire increases theavailability of soil nutrients through conversion of plant biomass to ash (Kasischke et al. 1995).Each of these effects exerts an influence at different time scales. As a result, the effect of a givenclimate scenario on carbon storage in the boreal region will be greatly influenced by fire regime(see 13.9), and would represent a complex calculation requiring a great deal of specificinformation in space and time.
Relatively few studies have directly examined carbon emissions in the boreal forest as a result offire. Nonetheless, valuable contributions have been made by studies that use remotely senseddata to estimate direct carbon emission from combustion as fires are occurring (Isaev et al. 2002;Amiro et al. 2001). These studies show that wildland fires have the potential to directly release asignificant amount of carbon into the atmosphere. The effects of wildfire on this initial carbonloss are highly variable and strongly influenced by forest type and fire severity (Wang et al.2001). Soil drainage as defined by water table, moss cover and permafrost dynamics, is thedominant control on direct fire emissions (Harden et al. 2000).
Fires cause the release of carbon not only during, but also for a short time after, fire occurs. Treemortality after surface fires can be extensive, leading to a pulse of carbon released fromheterotrophic respiration as needles and other fine fuels fall to the ground and are decomposedrapidly (Conard and Anova 1997). The non-combustion, post-fire release of CO2 has thepotential to affect global levels of atmospheric CO2 over the short term, representing anothermechanism by which the boreal forest can play a significant role in the global carbon cycle.Together, these direct and indirect fire-generated carbon emissions from boreal forestsworldwide may exceed 20% of the estimated global emissions from all biomass burning (Conardand Anova 1997).
Wildland fires change the distribution of soil organic carbon pools with respect to their turnover(release to CO2) times. Soil carbon in the form of forest litter that has fallen recently has arelatively rapid turnover rate, but carbon in the form of charcoal is stable (very long turnoverrates). If rates of burning increase in the boreal forest, potentially an increasing proportion of soilorganic carbon would be converted to stable charcoal. This change in the soil organic carbonpool allocation is difficult to estimate, because the effects of wildfire on carbon redistribution arestrongly influenced by forest type and fire severity (Wang et al. 2001). The importance of thisshifting distribution of turnover times in soil organic carbon is shown by the work of Harden etal. (2000). They developed a system of Ordinary Differential Equations to explore constraints oncontrols of carbon losses to fire. This involved using modern estimates for production,
Ch13 - Forests, Land Management and Agriculture ACIA Scientific Report
External Review January 2004 13–91 DO NOT CIRCULATE OR CITE
decomposition and storage of carbon, a model of fire dynamics developed over millennial time-scales, and an assessment of the long-term carbon balance for a variety of boreal landscapes inNorth America. A sensitivity analysis found that their model results were responsive to the rateat which charred plant remains decomposed. Unfortunately, the specific characteristics of firesthat result in maximum production of charcoal are not well studied. However, it seemsreasonable to infer that a moderate-intensity fire, in which combustion is enough to kill trees butnot intense enough to completely consume them, would produce the greatest amount of charcoal.In complex mountainous or hilly terrain at high latitudes, north-facing slopes have higher fuelmoisture content and as a result generally experience less complete combustion of fuels duringfire (Van Cleve et al. 1991). This suggests that slope aspect might be an important factor in theconversion of plant biomass to charcoal.
Much of the difference in carbon cycling after disturbance can be linked to shifts in speciescomposition and ecosystem age structure that enhance both peak summer CO2 uptake and winterCO2 efflux. Seasonal amplitude of net ecosystem carbon exchange in northern Siberianecosystems is greater in disturbed than undisturbed sites, due to increased summer influx andwinter efflux (Zimov et al. 1999). Disturbed sites differ from undisturbed sites during thesummer in having 2.1 to 2.5 times the daytime CO2 influx and 1.8 to 2.6 times the nighttimeCO2 efflux. Winter respiration in disturbed sites is 1.7 to 4.9 times that in undisturbed sites.Carbon cycling within disturbed ecosystems is more sensitive to interannual temperaturevariability than older forests, and disturbed sites also experience a greater annual carbonexchange between warm and cold years than older forests (Zimov et al. 1999).
Two hypotheses have been advanced to explain why these differences in carbon cycling causedby enhanced CO2 summer uptake and winter efflux occur in disturbed areas. One hypothesis isthat recent increase in March-April temperatures in high-latitude continental regions of NorthAmerica and Siberia could advance snowmelt and increase the length of the growing season (seeChapter 5.3). The second hypothesis is that temperature-driven increases in summer carbon gain(greater CO2 uptake from greater growth) balanced by increased winter respiration (greater CO2release from enhanced decomposition and live respiration) could enhance the seasonal amplitudeof atmospheric CO2 without a change in net annual carbon accumulation. Although themechanism remains somewhat uncertain, experimental studies confirm that these responses dooccur under appropriate conditions.
13.10.3 Climate and carbon allocation in the boreal forest
Changes in species composition modify the way carbon is allocated and stored. Deciduousforests experience greater carbon cycling (production and decomposition) than conifer stands(Gower et al. 2001). Both aboveground net primary production and overall (includingbelowground) net primary production were roughly two times greater in a boreal deciduousforest than a coniferous forest. The fraction of net primary production allocated to coarse andfine root primary production is roughly 2 times greater for evergreen conifers than deciduoustrees (Gower et al. 2001). Because of these differential allocation patterns between deciduousand evergreen stands, the amount of carbon in the soil in mature black spruce stands isapproximately three times the amount of carbon in the biomass of the trees (Kasischke et al.1995). Since the rate of decomposition is higher in deciduous forests than coniferous (both

Ch13 - Forests, Land Management and Agriculture ACIA Scientific Report
External Review January 2004 13–92 DO NOT CIRCULATE OR CITE
because of litter quality and site conditions) nitrogen is probably more available, furtherincreasing production (Makipaa et al. 1999). These results make sense physiologically sincedeciduous species have higher maximum rates of photosynthesis and productivity thanevergreens and produce litter that quickly decomposes.
Aboveground carbon pools are directly related to stand age. Gower et al. (2001) found that withrespect to changes in net primary production, stand age is roughly equivalent to the influences ofenvironmental and edaphic factors. Similarly, Wang et al. (2001) found that wildfire exerts alingering effect on carbon exchange between the boreal forest and the atmosphere via its impacton the age structure of forests and leaf area index (LAI) during succession. They also found astrong inverse linear relationship between aboveground net primary productivity (A NPP) andage that was largely explained by a decline in LAI. Fire reduces LAI and increases absorption.Modeling results from Kurz and Apps (1999) suggest forest ecosystems in Canada have been asink from 1920-1980 and a source from 1980-1989. They suggest this is a result of a change inthe disturbance regime. Sometime around 1977, there was a regime shift in the climate of theNorth Pacific Ocean suggested to be part of a low frequency oscillation (Niebauer 1998). One ofthe consequences of this shift was that the position of the Aleutian Low associated with El Ninomoved even farther eastward than it did previously. This shift is consistent with a more easterly(less southerly) flow component across interior Alaska, and could exert teleconnective influenceson the fire dominated disturbance regime of Canada (Bonsal et al. 1993). If this is the case, itsuggests that climatic changes occurring at low temporal frequencies exert a strong influence onthe rate of carbon cycling in regions where the disturbance regime is climatically driven. Kurzand Apps (1999) suggest that as stand age increases, the ability to sequester carbon decreases andthe susceptibility to disturbance increases.
Modification of soil thermal regime and permafrost degradation as a result of fire has beendocumented. Warmer and drier conditions following a forest fire increase decomposition anddecrease carbon storage (Kasischke et al. 1995). Simulation results suggest that a 5 degreeincrease in ambient air temperature results a 6-20% decrease in the total ground carbon over a25-year period (Bonan and Van Cleve 1992). In China, Wang et al. (2001) found that soil surfaceCO2 flux decreases immediately after wildfire because of a lack of root respiration, whichaccounts for about 50% of total soil surface flux. In the time after a fire during which appreciabletree mortality has occurred, the majority of respiration shifts from autotrophic to heterotrophic.As a consequence of the increased heterotrophic respiration and low net primary production inthe early stages of succession, areas that have recently burned in the boreal forest tend to act as acarbon source for a brief period of time. Rapalee et al. (1998) found evidence that fire scars onthe landscape are a net carbon source for about 30 years after burning, after which systemsbecome a net sink of carbon. Experiments in the Alaskan boreal forest show that about 20% ofthe ground layer carbon is lost through decomposition during the first 20-30 years after a fire,due to increased soil temperature (Van Cleve and Viereck 1983). Rapalee et al. (1998) assertsthat ecosystem changes in NEP are driven by changes in decomposition and species composition.They further suggest that changes in species composition are driven by fire-induced modificationof the active layer. The relative importance of modification of the active layer depends to a largeextent on aspect and fire severity.

Ch13 - Forests, Land Management and Agriculture ACIA Scientific Report
External Review January 2004 13–93 DO NOT CIRCULATE OR CITE
Fire frequencies in the sphagnum peat have decreased over the past 7000 years due to cooler andwetter conditions (Kuhry 1994, see 13.6.1, Figure 13.14). Emissions of carbon from combustionof peat are still an order of magnitude greater than warming-induced oxidation (Gorham 1991).Fire affects not only the amount of carbon in the forested peat systems but also the subsequentrate of accumulation. Kuhry (1994) found that peat accumulation in sphagnum-dominatedpeatlands of western boreal Canada decreased significantly with increasing fire frequencies. It isestimated that warming and drying would result in relatively rapid decomposition of peat soilorganic carbon (Schimel et al. 1994). Valentini et al. (2000) investigated two contrasting landcover types, a regenerating forest and a bog, in the central Siberian region during July 1996 andfound a limitation imposed on net CO2 uptake by the decreasing soil water content in theregenerating forest. Results showed strong differences in both transpiration and carbonassimilation. The bog uses the incoming energy principally for transpiration and, because of theconstant availability of water, the transpiration is not sensitive to seasonal changes in moistureconditions. The bog system also maintained high carbon assimilation potential compared to avery young logged forest. This trend was maintained and amplified in dry conditions, when thecarbon uptake of regenerating forest decreased significantly. Bogs and peatlands represent a verydifferent land cover type than forests and must be considered separately when assessing the roleof disturbance in the boreal forest (see Chapter 7).
13.10.4 Relationship of forest cover type, disturbance and climate change
Vegetation response to climatic warming could feed back to cause large changes in regional andglobal climate through effects on terrestrial carbon storage (Smith & Shugart 1993) and on waterand energy exchange (Bonan et al. 1992, Chapin and Starfield 1997). The rate and magnitude ofthis feedback is influenced by transient changes in the distribution of terrestrial ecosystems inresponse to changes in climate, disturbance regime, and recruitment rates. The long-termdirection of ecosystem change is also sensitive to spatial patterns and processes operating at thelandscape-scale (Turner et al. 1995).
Current predictions of vegetation response to climatic warming assume either disturbance regimedoes not change (Pastor and Post 1986) or use globally averaged rates of disturbance (Smith andShugart 1993). Conversely, projections of future disturbance regime in a warmer climate(Flannigan and Van Wagner 1991, Kasischke et al. 1995, Flannigan et al. 1998, Gardner et al. inpress) generally neglect rates and patterns of vegetation response to climate and disturbance.However, the climate-disturbance-vegetation interactions clearly influence the rate and pattern ofchanges in vegetation (Neilson 1993, Noble 1993) and disturbance (Gardner et al. 1996) througheffects on fire probability and spread (Gardner et al. in press) and pattern of colonization (Turneret al. 1997).
Landscape-scale interactions between vegetation and disturbance are particularly important at theforest-tundra ecotone (Noble 1993, Starfield & Chapin 1996, Chapin & Starfield 1997) wherevegetation change is very likely to have large feedbacks to climate (Pielke and Vidale 1995). Thepotential colonization of tundra by forest would very likely increase terrestrial carbon storage(Smith and Shugart 1993), reducing the warming potential of the atmosphere, but increaseabsorption of solar radiation (Bonan et al. 1992) creating a positive feedback to regionalwarming (Chapin & Starfield 1997).

Ch13 - Forests, Land Management and Agriculture ACIA Scientific Report
External Review January 2004 13–94 DO NOT CIRCULATE OR CITE
Modeling transient dynamics of vegetation change allows investigation of both the short- andlong-term responses of ecosystems to landscape-level disturbance and recruitment, and thesubsequent feedbacks between climate and the biosphere. These spatial processes areresponsible for long-term changes in vegetation distribution (Dale 1997) in response to changingclimate and must eventually be incorporated into large spatio-temporal scaled models of gradualclimatic change.
13.11 Climate change, land use, nitrogen deposition, and CO2 fertilization effects on thecarbon cycle of the boreal forest
13.11.1 Land use change
Atmospheric CO2 and O2 data confirm that the terrestrial biosphere was largely neutral withrespect to net carbon exchange during the 1980’s but became a net carbon sink in the 1990’s(Schimel et al. 2001). A key question is, what caused this shift of terrestrial ecosystems tocollectively act as a sink? Several studies have indicated that land-use change is responsible forthe majority of the terrestrial sink (Goodale et al. 2002; Fang et al. 2001; Houghton and Hackler2000, Birdsey et al. 1995; Houghton et al. 1983). Calculations of land-use changes can be used tocalculate associated carbon fluxes (Houghton and Hackler 2000). Since 1850, there has been a20% decrease in the global forest area, and during this period deforestation has been responsiblefor approximately 90% of the estimated emissions from land-use change (Houghton et al. 1999).
The majority of land-use change studies have focused on areas outside the boreal region and areview of the critical issues in the process provides perspective on the impact of land-use changeon carbon cycling in the boreal forest. In the tropics, forests contain 20 to 50 times more carbonper unit area than agricultural land, and as a result the annual rate of CO2 released due to tropicaldeforestation during the early 1990’s involves 1.2 to 2.3 Pg of carbon (Melillo et al. 1996). Oncetropical vegetation is cleared, soil mass is quickly lost through erosion and oxidation. Whentropical forest soils are cleared of vegetation and cultivated, surface horizons experienceexponential mass loss resulting in roughly a 25 % decrease (Melillo et al. 1996). Yet, despite thelarge atmospheric source of CO2 resulting from tropical deforestation, the terrestrial system isacting as a net sink for carbon (IPCC 2001), and in a spatially explicit inversion analysis, Rayneret al. (1999) found no evidence of a large net source from the tropics. The spatial inversionanalysis allows a more focused examination of carbon fluxes between discrete regions. Forexample, the lack of a large tropical net source suggests a tropical terrestrial sink of roughly thesame magnitude. The exact nature of this tropical terrestrial sink remains a source of debate.Melillo et al. (1996) used gas flux studies to show that undisturbed tropical forests in theBrazilian Amazon are responsible for a net carbon uptake, but more work needs to be done toexamine and quantify carbon flux from tropical forests experiencing and recovering fromdeforestation.
Like tropical forests, temperate and boreal regions in the Northern hemisphere have experiencedsubstantial land-use changes in the past several hundred years. Siberian forests account for 20%of the world forest area and net primary production; Valentini et al. (2000) estimate thatapproximately 8.0 x 10⁵ hectares are harvested there annually. Fang et al. (2001) found that

Ch13 - Forests, Land Management and Agriculture ACIA Scientific Report
External Review January 2004 13–95 DO NOT CIRCULATE OR CITE
Chinese forests acted as a carbon source from 1948-1980, and a sink from 1981-1998.Subsequent works focused on constraining spatial and temporal aspects of carbon fluxes and as aconsequence, several atmospheric inversion analyses have indicated a large terrestrial carbonsink in the Northern hemisphere (Rayner et al. 1999; Fan et al. 1998; Keeling et al. 1996; Ciais etal. 1995). Estimates of carbon flux in the United States derived from independent forestinventory methods (Caspersen et al. 2000; Turner et al. 1995; Birdsey et al. 1995) and ecosystemmodels (Hurtt et al. 2002) provide supporting evidence of the presence of a North Americansink, although of a lower magnitude than that estimated by Fan et al. (1998). Goodale et al.(2002) found that growth rates in unmanaged forests of the Eastern U.S. have changed little overthe past several decades suggesting nearly all of the carbon accumulation in the region is due toforest regrowth from past disturbance rather than growth stimulated by increased atmosphericCO2, N deposition, or climate change.
13.11.2 Nitrogen deposition and CO2 fertilization
A process-based model that simulates biomass production of Norway spruce in south-eastNorway under both current climate and climate change scenarios was used to predict biomassproduction responses to three climate change scenarios (Nilsen 2002). The results showed thatnet primary production (net primary production) increased by 7% over the current 10.1 t drymass ha -1 yr -1under a mean annual air temperature of 4°C. Doubling current ambient CO2concentration increased net primary production by 36%. The scenario of both elevatedtemperature and elevated CO2 concentration led to an increase in net primary production ofnearly 50%, which was higher than the sum of the two effects alone.
Nitrogen availability is often the limiting factor in net primary productivity. The majority ofanthropogenic nitrogen inputs come from combustion (both biomass and fossil fuel) andagricultural fertilizer application (IPCC 2001). Photosynthetic rate is correlated with the nitrogencontent of leaves, since carbon assimilation is driven by the nitrogen rich enzyme Rubisco.Hence reduced nitrogen availability decreases both leaf nitrogen content and photosynthesis. Asa result, the carbon and nitrogen cycles are fundamentally coupled. Due to this coupling,increased nitrogen deposition from human activity must be considered in conjunction withelevated CO2 levels. Elevated CO2 levels directly exert multiple impacts on fundamentalbiochemical processes such as photosynthesis and respiration, which collectively determine netprimary production.
Among studies that manipulate both CO2 and nitrogen availability, the mean enhancement ofphotosynthesis to elevated CO2 at the lowest level of nitrogen availability is 40%, while themean enhancement at higher levels of nitrogen availability is 59% (McGuire et al. 1995a). Theseresults indicate that for a fixed increase in CO2, biomass increases proportionally to increasednitrogen availability. In a review of studies, McGuire et al. (1995a) also found that compared tolow nitrogen availability and baseline CO2 levels, increased nitrogen availability and elevatedCO2 could be calibrated with a 6.5 times increase in biomass. Differential increases in biomassin response to elevated CO2 exist between species and, in general, deciduous species exhibittwice the growth response of conifer species to elevated CO2 (Ceulmans and Mousseau 1994).

Ch13 - Forests, Land Management and Agriculture ACIA Scientific Report
External Review January 2004 13–96 DO NOT CIRCULATE OR CITE
The carbon and nitrogen cycle are also strongly correlated with evapotranspiration. Arain et al.(2002) examined the response of net ecosystem productivity (NEP) and evaporation to elevatedatmospheric levels of CO2 and found that modeled and measured results showed a linearrelationship between CO2 uptake and evaporation. This coupling implies that as nitrogendeposition increases and plant tissue C:N ratios decrease, nitrogen cycling increases for a fixedlevel of evapotranspiration (Schimel et al. 1997). This is essentially an example of biologicalsupply and demand. It becomes less efficient for plants to exert energy on retranslocation beforesenescence; hence the quality of litter increases. The scaling of this response from tissue to plantlevel is seen in the results of modeling and field studies showing nitrogen fertilization results inincreased net primary productivity (Chapin 1988; Vitousik and Howarth 1991; McGuire et al.1992; Bergh et al. 1999).
At the ecosystem level, studies indicate that conifers and deciduous species differ in theirresponse to elevated levels of CO2. Arain et al. (2002) examined the response of boreal netecosystem productivity (NEP) to elevated CO2 levels in both a 70-year-old aspen stand and a115-year-old black spruce stand. They found that the aspen stand was a weak to moderate carbonsink while the black spruce stand was a weak carbon sink in cool years and a weak carbon sourcein warm years (consistent with Figure 13.24 and BOREAS results described in section 13.7).These results emphasize the practical importance of the strong coupling between water flux andboth carbon and nitrogen cycles. When mid-summer temperatures were high, the NEP of theblack spruce stand was significantly decreased due to increased respiration. At longer timescales, reduced litter quality resulting from elevated CO2 has the potential to cause long-termnegative feedbacks to constrain the response of net primary productivity. Litter nitrogenconcentration is generally positively correlated with decomposition rates, and Cotrufo et al.(1994) found that in deciduous stands, cumulative respiration rates were lower for litter derivedfrom elevated CO2 conditions while rates for Sitka spruce remained relatively unaffected. Theseresults have implications for the response of forests not only to elevated atmospheric CO2 butalso to the warmer temperatures that inevitably accompany elevated atmospheric CO2 levels.
Schimel et al. (1994) found that the amount of nitrogen lost from an ecosystem is an increasingfunction of the rate at which nitrogen is cycled through the system. For example, nitrogenmineralization is a key index of soil inorganic nitrogen turnover, and is strongly correlated withevapotranspiration. Schimel et al. (1997) found evidence that losses of nitrogen trace gases arelinked to the rate of mineralization of NH4 and NO3 from organic matter, a rate that increases astemperature and soil moisture increase. Similarly, the product of H2O flux and NO3/DON(Dissolved Organic Nitrogen) concentration directly controls leaching losses of NO3 and DON(Schimel et al. 1997). Hence, nitrogen losses are controlled by soil moisture and water flux. Thislinkage between hydrologic and nutrient cycles is of critical importance in assessing therelevance of warming enhanced nitrogen mineralization to net primary productivity. Schimel etal. (1997) noted that water/energy and nutrient limitation of net primary productivity and carbonstorage tend to equilibrate in near “steady-state” ecosystems. This implies that the greatestpotential for discrepancies between carbon, nitrogen and water cycling exist in recently disturbedecosystems. In support of this, Schimel et al. (2001) noted that in general, carbon accumulationin recovering ecosystems is high and chronosequence studies show lower accumulation in“natural landscapes”. The decreased net primary productivity observed in “mature” ecosystemsis a consequence of the equilibration of the nitrogen, and water fluxes. Hence, impacts of
Ch13 - Forests, Land Management and Agriculture ACIA Scientific Report
External Review January 2004 13–97 DO NOT CIRCULATE OR CITE
warming on enhanced nitrogen mineralization are likely to be greatest in recently disturbedecosystems.
Finally, although it is not always the case that nitrogen limits growth; a review of studiesexposing plants to both elevated CO2 and increased soil nitrogen concentrations showssignificant increases in net primary productivity (McGuire et al. 1995a). Under the assumptionthat “mature” ecosystems exhibit decreased net primary productivity because of equilibration ofthe nitrogen and water fluxes, elevated atmospheric CO2 concentrations can reasonably beassumed to stimulate growth. The relatively rapid increase in atmospheric CO2 makes thisscenario even more plausible. Elevated atmospheric CO2 concentrations have been shown toincrease the amount of photosynthesis per unit of water transpired, also known as water useefficiency (WUE). Schimel et al. (1994) suggest that if CO2 or fertilizer and pollutant N increaseglobal net primary production over the coming decades, soil C increases can occur on acommensurate timescale. Despite this prospect of greater carbon storage, the estimated effect ofwarming is sensitive to the feedback between primary production and decomposition via thenitrogen cycle. As SOM is lost through enhanced nitrogen mineralization caused by warming,more nitrogen becomes available for plant growth, which results in more SOM formation, thusacting as a negative feedback (Schimel et al. 1994).
Another possible mechanism causing equilibration of the carbon, nitrogen and water fluxescomes from examination of the tissue level response to elevated atmospheric CO2concentrations. Acclimation to elevated CO2 can occur by affecting one or more of three aspectsof leaf-level carbon assimilation: carboxylation, light harvest and carbohydrate synthesis(McGuire et al. 1995a). Under saturating light conditions at low levels of intercellular CO2,assimilation is limited by the quantity and activity of rubisco, the enzyme that is primarilyresponsible for capturing atmospheric carbon in the production of sugars. At high levels of inter-cellular CO2, the enzymatically-controlled rate of carbohydrate synthesis, which affects thephosphate regeneration that is necessary for harvesting light energy, may regulate the fixation ofcarbon (McGuire et al. 1995a). Hence mechanisms acting at scales from tissue-levelbiochemistry to ecosystem-level nutrient cycling exert influences to equilibrate carbon, nitrogenand water fluxes in mature ecosystems. This equilibration has implications for recent patterns ofcarbon flux observed in terrestrial ecosystems. Schimel et al. (2001) note that the terrestrialcarbon sink must become saturated because photosynthesis follows a saturating function withrespect to CO2. As the rate of photosynthesis slows, plant and microbial respiration must catchup eventually, reducing incremental carbon storage to zero. Simulations with the terrestrialecosystem model (TEM) concur, suggesting that soon after the atmospheric CO2 concentrationstabilizes, heterotrophic respiration comes into balance with net primary production and a CO2-stimulated terrestrial carbon sink disappears (Melillo et al. 1996).
In addition to the effect that anthropogenic modification of carbon and nitrogen cycles has onatmospheric CO2, temperature in boreal and tundra regions is related to the intra-annualvariability in atmospheric CO2 concentrations. Surface temperature in the north is positivelycorrelated with seasonal amplitude of atmospheric CO2 the following year. Zimov et al. (1999)found that 75% of the annual increases in mean annual air temperature between 1974 and 1989coincided with decreases in CO2 amplitude at the Barrow monitoring station, consistent withobservations of net summer CO2 efflux in warm years in tundra and boreal forest.

Ch13 - Forests, Land Management and Agriculture ACIA Scientific Report
External Review January 2004 13–98 DO NOT CIRCULATE OR CITE
13.12 Examples of Climate Change and Change in Forest Distribution
13.12.1 Some issues in the movement of treeline
The contrast between a realm of life where trees dominate the environment and a very differentrealm where much shorter herbaceous and low woody vegetation is the exclusive plant cover, isone of the most visually striking landscape characteristics of the circumpolar Arctic world. Anumber of questions about Arctic and associated alpine treelines have attracted scientific interestfor well over a century. A simple catalog and summary of this body of research would be toolarge for this chapter. Treeline questions have been studied from a number of differentperspectives, but nearly all are at least implicitly connected with the question of how coldtemperatures limit tree growth and survival. Because of this overriding interest in temperaturelimits, and because of the ubiquitous occurrence of treelines across the Arctic and the high stateof preservation of dead trees in the cold environment of the Arctic, treeline studies have much tooffer on the specific question of climate warming and cooling. In this section we have chosen tofocus on some recent studies that shed light on the long-term history of dynamics and movementof tree limits as related to specific processes that temperature controls. These studies provide aperspective of long-term continuity, and insight into the mechanisms that recent climate warminghave affected and potential warming depicted in the scenarios could affect.
13.12.1.1 Regional trends of climate and treeline in Northern Eurasia
In the period between 9000 and 7000 B.P. forest occupied what is now treeless tundra nearly allthe way to the Arctic coastline in all sector of the north of Russia (MacDonald et al. 2000). Theseresults are based on earlier subfossil wood collections carried out by Russian scientists as well asmodern collections of subfossil wood on the Kola, Yamal, and Taymir Peninsulas and at themouth of the Lena River. Subsequently, the greatest retreat of forest and expansion of tundrabefore the modern treeline configuration took place between 4000 and 3000 B.P. During theperiod of maximum forest advance the mean July temperature in the north of Russia (at thecoastline) was 2.5 to 7.00C higher than the modern mean, based on modern tree growthrelationships to temperature. The advance of treeline to the north reflected a series of otherenvironmental changes in the Arctic, including increased solar insolation, reduced ice cover ofthe Arctic Ocean, increased climate continentality, and a significant intrusion of warm NorthAtlantic water into the Arctic (MacDonald et al., 2000). This documented record of past forestadvance suggests that there is a solid basis for projecting similar treeline change from scenariosthat produce similar levels of warming. It also suggests that the components of ecosystemspresent today have the capacity to respond and adjust to such climate fluctuations.
A reconstruction of treeline movement in the Swedish Scandes Mountains using 173 datedremains of pine wood reveals a that there has been a gradual decrease in the upper treeline (withsmall fluctuations), generally consistent with climate cooling. The total elevational retreat oftreeline was estimated to be 500 m, corresponding to a reduction in temperature of 60 to 80C.Superimposed on that movement, and taking place currently is an upward movement of morethan 100 m, which would represent the largest adjustment of treeline position in the last 3000years of the Holocene (Kullman, 2001). However, it is important to note that the present upward

Ch13 - Forests, Land Management and Agriculture ACIA Scientific Report
External Review January 2004 13–99 DO NOT CIRCULATE OR CITE
movement of trees is estimated by depicting the climatically imposed tree-limit, while the actualposition of past treeline may have been due to many other factors. As result the data on relativetreeline elevations in Kullman’s reconstruction are underestimated and, therefore, the modernmovement of treeline is probably within the range of recent fluctuations rather thanextraordinary.
13.12.1.2 Regional trends of climate and treeline on the Yamal Peninsula
The works of S.G. Shiyatov and colleagues on the Yamal Peninsula represent a detailed analysisof the dynamics of polar treeline (Shiyatov et al. 1996, Hantemirov 1999, Hantemirov andShiyatov 1999, Hantemirov and Shiyatov 2002). Holocene wood deposits in the south of theYamal Peninsula include a large quantity of subfossil tree remains: stems, roots and branches.This is the result of intensive accumulation and conservation of buried wood in permafrost. B.M.Zhitkov (1913) first described the existence of this material in the modern tundra zone of theYamal Peninsula. Later B.A. Tikhomirov (1941) showed that tree remains conserved in peatsediments were direct evidence that the northern treeline in the warmest period of the Holocenereached the central regions of the Yamal Peninsula (up to 700 N). Today the polar treeline isconsiderably further south on the Peninsula, at about latitude 67o30´.
Systematic collection of subfossil wood samples started in 1982 in the watersheds of theKhadyta, the Yadayakhodiyakha, and the Tanlova Rivers on the southern Yamal Peninsula,located between 67o00´ and 67o50´ N and 68030´ and 71000´ E. River flow in this area is from thenorth to the south, excluding the possibility that wood was transported to the collection localityfrom more southerly locations, and giving very high confidence that the region experienced aconsiderably warmer summer climate in the relatively recent past.
The combination of radiocarbon dates on the subfossil wood (53 dates) with the cross-dating ofring series from the samples allows the construction of a continuous tree-ring chronology 7314years in length. Absolute dates can generally be assigned to the recovered wood remains. Theresult makes it possible to reconstruct the dynamics of tree limits on the Yamal Peninsula duringthe Holocene (Figure 13.28). During the period 10.5 to 9K years ago trees grew across the mostof the Peninsula. The most favorable conditions for tree growth (almost certainly warmsummers) occurred from 7200 B.C. to 6000 B.C. At that time and continuing until 5600 B.C. theclimatic conditions became less favorable for tree growth (almost certainly cooler summers), buttrees persisted and did not retreat to the south. Beginning about 5400 B.C. trees were displacedsouthward. The forest stand density also greatly decreased in this period, and it can beconsidered as a transition to the next stage of the Holocene. From 5400 until 1700 B.C. the polartreeline was still located at 690 N, well north of today’s position. In unfavorable periods (4500-3900 B.C. and 3600-3400 B.C.) tree survival was mainly restricted to the actual river corridors,but in climatically more favorable periods (5200-4500 B.C.; 3900-3600 B.C. and 3400-1800B.C.) forests grew on hills and raised surfaces beyond the rivers.
One of the most important periods of displacement of polar treeline to the south and majorreduction in the density and productivity of forest stands occurred about 1700 B.C. This stagecan be regard as the end of the Middle Holocene and the beginning of modern stage of tree-lineevolution on the Yamal Peninsula. During the last 1700 years, forest-tundra and forest

Ch13 - Forests, Land Management and Agriculture ACIA Scientific Report
External Review January 2004 13–100 DO NOT CIRCULATE OR CITE
associations were primarily restricted to river valleys in the south part of the Peninsula.Somewhat more favorable conditions occurred from 1200 to 900 B.C., from 100 B.C. to 200A.D. and during the medieval warm period (700-1400 A.D.).
Figure 13.28. Dynamics of polar treeline on the Yamal Peninsula in Siberia. (a) relativedistance of sampled tree remains from the present position of northernmost open stands oflarch in river valleys. (b) Radiocarbon date and number of samples. Proposed division of theHolocene into three stages is indicated. (Data from Hantemirov and Shiyatov, 1999).
The reconstruction of treeline dynamics for last 4000 years of the Holocene was made with evengreater precision using more than 500 cross-dated tree stems with known coordinates of theirburial places in valleys of different rivers on the southern Yamal Peninsula (Figure 13.29).
Figure 13.29. Reconstruction of polar treeline dynamics on the Yamal Peninsula from 2000B.C. Latitude of recovered samples is indicated by year. (Data from: Hantemirov, Shiyatovand Surkov, in press).
Treeline displacements northward and southward were relatively small and less important duringthe last 3600 years than those that occurred in the previous few millennia. Treeline generallymoved at the most 5 km to the south, and subsequently northward only to the present boundaryof open woodland in the river valleys. However, one particularly noteworthy major displacementof treeline to the south occurred in the second half of the 17 century B.C. In this relatively shortperiod of time (not exceeding 100 years) the boundary of larch open woodland moved to thesouth nearly 15-20 km, and afterward treeline retreated a further 8 to 10 km during next 700years. This major displacement of treeline in 17th century B.C. appears to have been driven bystrongly inclement climatic conditions (cold summers), in fact representing the lowestreconstructed summer temperatures in the entire series. It was precisely after 1657 B.C. that thetemperature decreased sharply. The 14 of 20 years during the interval 1630-1611 B.C. appear tohave been extremely cold, reaching a nadir in two specific years, 1626 and 1625 B.C. No otherperiod during the reconstruction is even close. Moreover, it is clear that in 1625 B.C. a severefreeze occurred in the middle of the summer (as indicated by characteristic anatomical structuresof freeze injury in the tree rings). It is very probable that the short-term extreme climate eventrepresented climate cooling following one of the largest volcanic eruptions of the last fewmillennia, which happened in about 1628 B.C. (possibly the eruption of Santorini volcano in theeastern Mediterranean). The cooling appears to have reinforced another closely spaced coolingevent that preceded it. The earliest of the two periods of extreme cold temperatures begansometime after 1657 B.C., but in this case it is difficult to determine the cause (Baillie, 1999;Grudd et al., 2000). These events were the final circumstances which resulted in the mostsignificant southward retreat of treeline at least during last the 4000 years. In spite of extremelyfavorable summer warmth that returned afterward and even persisted at various intervals, thetreeline never returned to its previous boundary.
Another important result of mass dendrochronological dating of subfossil wood samples is theability to calculate the relative abundance of Siberian spruce in forest stands of the area, which isan index or proxy for the degree of continentality of the climate. The change in the amount of

Ch13 - Forests, Land Management and Agriculture ACIA Scientific Report
External Review January 2004 13–101 DO NOT CIRCULATE OR CITE
spruce in the forest stand’s composition (the remaining part is all larch) is shown in Figure 13.30.In the first 6 centuries, from 900 until 1500 A.D., the proportion of spruce decreased from 22down to 3-5%. After that, the percentage of spruce become stable in the range of 7 to 10%. The20th century is characterized by an increasing percentage of spruce in forest stands in valley ofthe River Khadytayakha, and a weak northward advancing polar treeline.
Figure 13.30. Change in proportion of subfossil remains made up of spruce compared tolarch in Yamal Peninsula samples.
13.12.1.3 Climate and treeline changes at the Polar Ural Mountains
Significant spatio-temporal changes took place in the upper treeline ecotone in the Polar UralMountains (66-67° N, 65-66° E) during the last millennium (Shiyatov, 1993, 1995, 2003).Within the treeline ecotone, which is located from 100 to 350 m a.s.l., open forests of Siberianlarch dominate. Patches of closed forests of mixed larch and Siberian spruce grow at loweraltitude in the ecotone. Up to the present these forests have largely developed under conditions ofvery little human influence. A large number of wood remnants persist on the ground up to 60-80m above the present treeline and also within the ecotone between forest and tundra. These woodremains have been preserved for a long time (up to 1300 years) because of the low rate of wooddecomposition in the severe cold. The wood remnants provide material to extend a ring-widthchronology back to 645 A.D. and to date the lifespan of a large quantity of dead trees
In order to estimate the downward displacement of the upper treeline (the highest altitudinalposition of open forest over the last millennium), a transect 430 m long and 20 m wide was setup on the south-eastern slope of Rai-lz Massif, from the highest location of larch wood remnants(340 m a.s.l.) down to the present upper treeline (280 m). The transect was divided into 10 x 10m quadrats. All of the wood remnants were mapped and wood sections were cut from the base ofthe trunk and roots were collected from each individual tree. Calendar year of establishment anddeath for each tree was determined by cross-dating. Altogether, a life history of 270 dead treeswas defined. In addition, 16 young living trees and seedlings were also mapped and their agedetermined.
Figure 13.31. Altitudinal displacement of the upper treeline in the Polar Ural Mountainsduring the last 1150 years (Data from: Shiyatov 2003).
Using these data, stages in the overall downward displacement of upper treeline over the last1150 years was reconstructed (Figure 13.31). This time interval was divided into 5 periods,distinguished by differing directions of treeline shifting (rising or retreating in elevation) anddiffering rates of displacement. During the earliest period (430 years duration, from 850-1280A.D.), the upper treeline rose from 305 to 340 m a.s.l., i.e. 1-2 m/decade on average. The highestaltitudinal position reached by the treeline and the densest and most productive larch standsobserved in the last millennium occurred in the 13th century. The second period (300 years inlength, 1280-1580 A.D.) was characterized by a severe retreat of the upper treeline (from 340 mdown to 295 m) at a mean rate of 2-3 m/decade. During the third period (210 years, 1580-1790A.D.), the treeline retreat stopped. The observed rise (from 295 to 305 m, 0.5-1.0 m/decade) wasnot significant. The most extreme retreat was seen in the fourth period (120 years, 1790-1910
Ch13 - Forests, Land Management and Agriculture ACIA Scientific Report
External Review January 2004 13–102 DO NOT CIRCULATE OR CITE
A.D.), during which the upper treeline receded from 305 to down to 270 m, i.e. 2-4 m/decade.During this fourth period, the upper treeline was at its lowest altitudinal position for themillennium. In the last period, from 1910 to the present time, vigorous forest establishment tookplace on sites that were forested during the Middle Ages. The rate of change was the highest forthe millennium (from 270 to 308 m, 4-6 m/decade).
The last period of expansion of forest vegetation is being studied using both direct and indirectevidence (old terrestrial, aerial and satellite photographs, repeated stand descriptions ofpermanent plots and transects, morphology and age structure of stands, large-scale mappingwithin the ecotone, and meteorological and dendroclimatic data). Table 13.09 shows changes inarea under different types of forest-tundra ecosystems within the ecotone during the 20thcentury.These data were obtained at the time of large-scale (1:10000) mapping of the key area (3085 ha)located at the bottom of Tchernaya Mountain. Three maps were produced which show the spatialdistribution of these types of forest-tundra ecosystems for the beginning, middle and end of the20th century. Change in area was estimated during two periods; 50 years from 1910 to 1960, and40 years from 1960 to 2000.
Table 13.09. Area changes of different types of forest-tundra ecosystems from 1910 to 2000 inthe Polar Ural Mountains (From Shiyatov 2003).
Over these 90 years, the area of tundra with only scattered individual trees decreasedsignificantly from 2403 to 1917 ha, or from 78 to 62% of the main area. The greatest rate ofchange (-76 ha/decade) was observed during the first 50 years, when isolated seedlingestablishment above the treeline was the most intensive. Data obtained on the change in area ofthe sparse trees mapping unit is very interesting since during the first period the change waspositive (+37 ha/decade) but during the second period it was negative (-52 ha/decade). Thedecrease was caused when young established trees began producing seeds and as a result thedensity of stands increased (many of them changed from tundra with isolated trees into openforest). It is for this reason that the increase in area under open forest was so great during theperiod from 1960 to 2000 (from 450 to 593 ha, +36 ha/decade). However, the most impressivechanges were seen in the case of closed forests. The area of closed forest increased from 5 to 258ha over the 90 years with the transformation of open forests into closed forests. To date, morethan 550 repeated terrestrial photographs have been taken which can be used to reconstruct standparameters for the middle of the 20th century.
Warming during the 20th century was the major cause of spatio-temporal expansion of trees inthe treeline ecotone. The mean temperature for June at Salekhard weather station (50 km to theeast of the study area) increased from 7.2°C (1883-1919) to 8.5°C (1920-1998). The mean forJuly increased from 13.8°C to 14.3°C. Mean temperatures in the winter months (November-March) increased from -20.8°C to -19.6°C. The average June-July temperature, which is criticalfor tree growth, increased from 10.5°C to 11.4°C, or by 0.9°C. This means that the June-Julyisotherm rose 120-130 m in altitude (in this area the elevational temperature gradient is0.7°C/100 m). However, the upper treeline did not rise to this altitude. In fact, the mean rise wasonly 20-40 m. The main reason for this was a deficiency of viable seeds on sites remote fromfertile trees and stands.

Ch13 - Forests, Land Management and Agriculture ACIA Scientific Report
External Review January 2004 13–103 DO NOT CIRCULATE OR CITE
In this area, larch cones open and seeds are disseminated only on days of elevated temperaturestypically from the end of June to the end of July (Shiyatov, 1966). Wind is the primary methodof seed dissemination, with the influence of other methods, such as animals and birds, beinginsignificant. Since seed dissemination takes place in summer when snow cover is absent, it isdifficult for seeds to be transported upwards over long distances. Heavy larch seeds are carriedno more then 40-60 m from a tree and most of these seeds become lodged in lichen-moss andshrub layers that prevent them from germinating successfully. That is why abundant seedlingestablishment took place only close to individual trees and within existing stands.
Impressive changes have occurred in the structure of existing stands during the last 90 years.Most sites with trees have become much denser and more productive (up to 4 to 5 times) andmany tundra sites located within the treeline ecotone have been afforested. The degree ofafforestation increased from 22 to 38% (calculation based on data from Table 13.09). Thus,many parameters describing forest-tundra ecosystem position reacted to summer temperaturechanges. However, for the purpose of climatic reconstruction, the best factors to reconstructsummer temperature are those obtained from existing stands (tree rings, biomass, density ofstand and canopy, degree of afforestation) rather than treeline movement which experiences lageffects. Although the displacement rate of the upper treeline is a good reflection of long-termclimatic fluctuations (Table 13.10), reconstruction of actual temperature changes is complicatedbecause of the response lag caused by the slow growth of seedlings and the lack of seeds onremote sites. For example, the recent warming observed in summer months is of the same degreeas inferred in the Middle Ages (about 1°C) but the upper treeline has not yet reached thealtitudinal position on which forests grew in the 13th century. To overcome such discrepancies, itis necessary to use corrective factors. These will be different for each period and study area. Forexample, in the Polar Ural Mountains over the 90 years of study, the upper treeline rose 20-40 min altitude but the June-July temperature isotherm rose 120-130 m. Therefore, reconstructedtemperatures based on recent treeline movement should be increased by a factor of 4.
Table 13.10. Rates of change at the treeline ecotone in the Polar Ural Mountains during thelast 1150 years. (From Shiyatov 2003)
A similar pattern of recent movement of treeline in the Polar Ural Mountains can be confirmedas a widespread phenomenon by comparison of high resolution satellite images. The satelliteimage and on-ground data analysis show an increasing proportion of the area with higher standcrown closure. Specifically, in 1968 about 23.5% of area supported stands with crown closure ≥0.3, but about 50.0% in 1988. The border of stands with closure £0.1 moved between 100 and400 m horizontal distance, depending on the site. Some areas, which were covered by treesbefore Little Ice Age, still do not support any trees.
13.12.2 History and examples of modern movement of treeline in northeast Canada
Treeline does not always fluctuate in a straightforward way in response to the control of directclimate warming and cooling on the establishment and death of trees from seed, as illustrated innortheast Canada. Treeline populations in northern Quebec are primarily single species stands ofblack spruce, surviving in the upright growth form in protected sites, or in a damaged, lowgrowth form where spruce are exposed to wind and snow abrasion above the snowpack. Spruce

Ch13 - Forests, Land Management and Agriculture ACIA Scientific Report
External Review January 2004 13–104 DO NOT CIRCULATE OR CITE
macrofossils are generally absent in the northern Quebec tundra zone, and the forest limit andsoil charcoal limit occur together, strongly suggesting that the forest limit has remained stableduring the last 2000-3000 yr BP. Apparently treeline advance or retreat is not easily triggered byclimatic change in this location (Lavoie and Payette 1996). However, the character of the forestnear the treeline has changed over the last few millennia. The Hustich hypothesis suggests thatthe regenerative capacity of forests decreases from south to north (Hustich 1966). At the treelineof northeast Canada the summer climate is too cold for frequent seed production, although blackspruce produce cones that fail to complete only the last stages of development (Sirois 1999). Theblack spruce present today were established thousands of years ago in northern Quebec and havepersisting by layering since then. Sporadic and patchy fires kill black spruce in this environmentand, in the absence of seed production from nearby survivors, trees are eliminated in the localfire patches. By this process, the treeline of today, which is out of equilibrium with theenvironment that created it, has developed a more irregular and patchy boundary with time(Payette and Gagnon 1985).
Since the 1960s and 1970s small-tree stands have emerged above the snowpack, triggered byrecent less harsh conditions associated with snowier winters in the last decades (Pereg andPayette 1998). This process merely decreases the numbers of low, damaged growth formindividuals in the population and increases the numbers of upright, tree form stems. The level ofwarming produced by the scenarios would be sufficient to provide the final requirement ofsummer warmth that would result in viable seed production at treeline in northeast Canada (seeFigure 13.09 for summer temperature scenarios at Goose Bay, Labrador). The initial effect ofwarming would be to induce viable seed production within the forest-tundra zone, resulting ininfilling of the patchy forest-tundra border. It is possible that production of viable seeds atabsolute tree limit would begin seed rain onto the tundra, a process that probably has notoccurred in appreciable amounts for thousands of years.
13.12 Ozone and UV-B effects on Forest Vegetation
13.12.1 Particular nature of the ozone and UV-B problem in the Arctic
For a general background of the ozone and UV-B issue, see chapter 3. Generally, during thesummer UV-B radiation is at levels in the Arctic not much different than at mid latitudes.However, the Arctic and Antarctic are uniquely susceptible to short-term, intense stratosphericozone thinning, especially in their respective spring seasons. See chapter 3 for furtherinformation on UV-B in the high latitudes, see Chapter 3.
13.12.2 Forest-related biological issues of ozone depletion and UV-B in the Arctic
Exposure to increased UV-B (280-315 nm) radiation is known to inhibit plant growth,development, and physiological processes. Longer living, slow growing plants such as trees mayshow cumulative effects of increasing UV-B radiation (Sullivan and Teramura, 1992). Effects ofelevated UV-B radiation on plant processes vary in severity and direction and among species,varieties, and clones, as well as among plant parts and developmental stages. To avoid UV-Bradiation, plants have developed screening mechanisms including increased leaf thickness orcuticle (Johanson et al. 1995; Newsham et al. 1996), optical structures to scatter and reflect UV-
Ch13 - Forests, Land Management and Agriculture ACIA Scientific Report
External Review January 2004 13–105 DO NOT CIRCULATE OR CITE
B (Kinnunen at al., 2001), and the accumulation of UV-B screening phenolics and flavinoids inthe epidermal cells of the leaves (Cen and Bornman, 1993; Day, 1993; Alenius et al., 1995).
Until the 1980s relatively few plant species had been screened to determine the effect ofenhanced levels of UV-B radiation. Some species show sensitivity to present levels of UV-Bradiation while others are apparently unaffected by very large UV enhancements.Dicotyledonous crop plants such as peas (Day and Vogelmann 1995) and canola seem to bemore susceptible to increased radiation than cereals like wheat (Beyschlag et al. 1989) andbarley, although many other factors play an important role in sensitivity. Even varieties of thesame species can exhibit substantial variability in UV-B sensitivity (Teramura and Sullivan1994). About two-thirds of the few hundred species and cultivars tested appear to be susceptibleto damage from increased UV-B radiation. Crop damage caused by UV-B radiation underlaboratory conditions generally has been attributed to impairment of the photosynthetic process(Day and Vogelmann 1995). But in addition to gross disruption of photosynthesis, UV-B mayinhibit plant cell division as a physiological change, causing reduced growth and yields(Teramura and Sullivan 1994). Accurately determining the magnitude of the effect of elevatedUV-B levels in the field is difficult, because interactions with other environmental factors, suchas temperature and water supply, affect the crop's reaction and overall growth (Balakumar et al.1993, Mepsted et al. 1996).
Sensitivity to UV-B differs among forest species and populations and is influenced byenvironmental conditions (Lavola 1998, Laakso & Huttunen 1998). Composition of flavonoidsvary according to altitude and latitude. High-latitude low altitude species and populations aremore sensitive (fewer protective mechanisms) to enhanced levels of UV-B than low-latitude,high altitude species and populations (more developed defense mechanisms), reflecting thenatural levels of exposure to UV-B (Sullivan and Teramura, 1992). Scots pine populationsgrowing at high latitudes are rich in prodelphinidin (Laracine-Pittet and Lebreton1988) andsiginificant differences in the characteristics of UV absorbing compounds occur among speciesof pine (Kaudun et al. 1998) and birch (Lavola 1998).
UV-B radiation has many direct and indirect effects on plant growth and development (Caldwellet al., 1998). The direct effects are most damaging because the UV-B photons cause lesions inimportant UV-B absorbing biomolecules such as nucleic acids and proteins (Greenberg et al.,1989; Caldwell, 1993; Taylor et al., 1997). Photoproducts of DNA formed by UV-B radiation areall toxic and mutagenic (Taylor et al., 1997) and altered DNA or RNA structures may interferewith transcription and replication causing slower protein synthesis from UV-B stress (Jordan etal., 1994: Taylor et al., 1997). The indirect effects of UV-B on plants can also cause damage bythe formation of free radicals and peroxides (Takahama and Oniki, 1997; Yamasaki et al., 1997).Excessive UV-B radiation can also alter patterns of gene activity (Caldwell et al., 1998).
Field studies in both crop plants and trees suggest that a primary effect of increased UV-B irradiance is tocause subtle light-induced morphological responses, which induce altered carbon allocation (Day 2001,Bassman et al. 2003). Recent UV acclimation studies with subarctic and Arctic plants have emphasized amultitude of responses ranging from avoidance and protective mechanisms to inhibition and accumulationof effects (Gwynn-Jones et al. 1999, Laakso 1999, Kinnunen et al. 2001, Latola et al. 2001, Turunen et al.
Ch13 - Forests, Land Management and Agriculture ACIA Scientific Report
External Review January 2004 13–106 DO NOT CIRCULATE OR CITE
2002, Huttunen et al. 2003). Enhanced UV-B affects litter decomposition directly (photodegradation andmineral nutrient cycling) and indirectly (by chemical changes in plant tissues) and affects also thebiochemical cycling of carbon (Rozema et al. 1997). Both direct and indirect effects include physical,chemical and biological components. Indirect effects of UV-B are the most likely source of significanteffects in subarctic and Arctic forest ecosystems.
Subarctic conifers are long-lived with long generation times; damage by UV-B is likely toaccumulate over the years. Winter injuries to evergreens are caused by the interaction betweenfreezing, desiccation and photo-oxidation (Sutinen et al. 2001). Under subarctic and Arcticconditions, late winter cold temperatures, enhanced UV from intense solar radiation and waterdeficiency are the major environmental risks. Xeromorphile leaves and small leaf size ofsubarctic and Arctic trees reduce evapotranspiration. However, late spring at high-latitudesubarctic and Arctic ecosystems is characterized by high radiation levels and fluctuationsbetween freezing and thawing temperatures. The UV dose received by evergreens in the latewinter, early spring, and at the beginning of the short growing season is high due to reflectancefrom persistent snow cover. Some earlier studies have considered evergreens tolerant, but otherstudies have revealed evergreens to be sensitive to enhanced UV-B radiation (McLeod &Newsham 1997, Laakso et al. 2000, Kinnunen et al. 2001).
Experimental field evidence indicates that enhanced UV-B mainly increases the amount ofsoluble UV-B-absorbing compounds in summergreens (Searles et al. 2001), but the protectivefunctions of wall-bound phenolic compounds and epicuticular waxes in evergreens are morecomplicated. The responses are species-specific among pine species (Laakso et al. 2000).
In Scots pine needles from mature subarctic trees, enhanced UV-B levels induced xeromorphic(change in plant anatomy to enhance drought resistant) characteristics, include smaller epidermalarea and enhanced development of the cuticle layer (Latola et al. 2001). UV responses increasedconcentration of UV-B absorbing compounds in the epidermal cells and induced high andaccumulating proportions of oxidized glutathione (Turunen et al. 1998, 1999, Laakso et al. 2001,Latola et al. 2001, Kinnunen et al. 2001). The cumulative stress has been measured as graduallydecreased total glutathione and increased proportion of oxidized glutathione levels in the lastthree needle years (Huttunen et al. 2003).
The most consistent enhanced UV-B field response (Day 2001, Searles et al. 2001) is an increasein concentrations of soluble or wall bound leaf UV-B absorbing compounds and is complicatedby great seasonal, daily and developmental variation, both in epicuticular and internalcompounds. It is important to remember, that not all soluble flavonoids are UV-inducible(Lavola, 1997) or acid methanol extracted e.g. cell wall bound UV-B-absorbingphenylpropanoids, (Jungblut et al., 1995).
An increase in UV-B-absorbing compounds may result in a decrease of cell expansion and cell wall growth(Day 2001). In young Scots pine seedlings, UV-B induction of flavonoid biosynthesis (Schnitzler et al.1997), diacylated flavonol glucosides provided protection (Turunen et al. 1999) and changes were observedat ambient range of UV-B radiation (Lavola et al. 2003). The biosynthesis of UV-B-absorbing compounds,e.g. diacylated flavonol glucosides, and the development of waxy cuticles seemed to provide effective UVprotection in young needles (Kinnunen et al. 2000, Laakso et al. 2000) by rapid development of epicuticular

Ch13 - Forests, Land Management and Agriculture ACIA Scientific Report
External Review January 2004 13–107 DO NOT CIRCULATE OR CITE
waxes, an increase in cutinization, and first an increase and then an inhibition of UV-screening compounds(Laakso et al. 2000, Kinnunen et al. 2001).
Plant surface wax morphology, chemistry and quantity respond to environmental changes. Manydiols (Turunen et al. 1997) are important as reflectants to avoid harmful ultraviolet radiation, butthey also absorb in the UV region. In many tree species, phenolics and other UV protectivesubstances are situated in the cuticle. The role of epicuticular waxes has been considered mainlyto provide UV reflectance, but some wax components, e.g. secondary alcohols ( e.g.nonacosan-10-ol) and b-diketones, do absorb ultraviolet light (Hamilton 1995). Naturally growing treelineScots pines (Pallas National Park ) were exposed to enhanced UV-B during the period of Arcticsummer day. The average needle dry weight increased and the wax content decreased in the UV-treated trees. The responses were observed both in the previous and current needle year.
A long-term study of silver birch conducted over 3 growing seasons showed changes in growth(i.e. shorter and thinner stems), biomass allocation and chemical protection, while the effects onsecondary metabolites in the bark was minor (Tegelberg et al., accepted). The changes did notoccur until the third growing season, demonstrating the importance of long-term studies and thecumulative effects of UV-B radiation. Another 3-year study on Scots pine showed how varyingdefense mechanisms within the season, needle age and developmental stage protected the Scotspine needles against increased UV-B radiation (Kinnunen et al., 2001). However, protectivepigment decreased during the third year of exposure, suggesting that cumulative effects of UV-Baffect defense mechanisms and possibly make these defenses insufficient for long-term exposure.
Quantitative changes were detected in secondary metabolites (plant chemicals) in leaves of dark-leaved willow exposed to enhanced UV-B radiation (Tegelberg and Julkunene-Tiitto, 2001). Thechanges in amount of secondary compounds are likely to have indirect effects at the ecosystemlevel on willow-eating insects and their predators, and on the decomposition process. Both dark-leaved and tea-leaved willow showed chemical adaptations to increasing UV radiation. But theplant chemical adaptations were based more on clone-specific than on species-specific responses(Tegelberg et al., accepted). Several types of phenolic compounds in seedlings of nutrient-limited silver birch do respond to UV-B irradiance, and seedlings are less susceptible to UVradiation when grown in nutrient limiting conditions (Lavola et al., 1997). However, changes insecondary metabolites of these willows exposed to UV-B might increase the herbivore resistanceof birch (Lavola et al., 1997). A lower level of animal browsing on birches because of thischemical change induced by UV-B could possibly improve the performance of birch over itswoody plant competitors. Silver birch exposed to UV-B with nutrient addition also displays anefficient defense mechanism by production of secondary metabolites, and demonstrates theadditive effects of nutrient addition (del la Rosa et al., 2001). These results clearly establish thatUV-B radiation plays an important role in the formation of secondary chemical characteristics inbirch trees at higher latitudes (Lavola, 1998).
13.13 Critical Research Needs
13.13.1 Research needs in agriculture and climate change

Ch13 - Forests, Land Management and Agriculture ACIA Scientific Report
External Review January 2004 13–108 DO NOT CIRCULATE OR CITE
This assessment was focused mainly on annual crops and used growing degree-day changes toestimate likely effects of climate change on northern agricultural potential. Future assessmentsshould include in-depth analyses of perennial crops and livestock, including the scenarios of non-climate factors such as markets and public sector policies. Better climate/ crop models specific toagriculture in high latitude regions (such as special crop varieties, long day-length effects) arealso needed for future assessments. The effects of climate warming on soil processes should bemade an integral part of the modeling systems. Future assessments should include many moreclimate stations in the boreal region and Arctic regions. The insect, disease, and weed issues thatmight accompany a warming climate and expanded agriculture should be addressed, particularlythose with a unique high latitude dimension no likely to be part of ongoing studies in moresoutherly locations.
Given the critical role of public policy in agriculture in the region, an important issue is toidentify national and international policies that might accommodate expansion in the Arctic andSubarctic in specific crops. The infrastructure change needed to accommodate climate changeshould be identified along with the economic impact to construct new infrastructure and theeconomic impact if such project were constructed.
13.13.2 Research needs in northern boreal forests and climate change
Given the large contribution of the boreal forest to the terrestrial carbon sink, and the largestocks of carbon stored in it, the health and vigor of the forests of this region is a particularlysignificant input to a climate change policy, science, and management. Climatic models,recorded data, and proxies all indicate that there are significant spatial differences in temperatureanomalies and the associated tree growth changes around the globe. Not all species and relativelyfew forest site types have been examined to determine the strength and components of climatecontrols of tree growth. In order to determine the current, and likely future, carbon uptakeactivity of the boreal forest, these spatial differences in climate change and tree growth need tobe systematically identified, both in the contemporary environment and in the recent historicalpast. Particular attention should be given to way to effectively combine ground level studies,which clarify mechanism of control and provide historical time depth, with remote sensingapproaches, which give comprehensive spatial coverage that can be easily repeated and updated.
Trees and forest types that change their level of sensitivity to climate or even switch their growthresponses to temperature, are of particular interest. If climate controls growth more at some timesand less at others in the past, then tree-ring data used to reconstruct past climates will containbiases from the recorded climate data they are calibrated to, especially if the calibrating climatedata cover a short time period. If this change/reduction in tree growth/climate relationships isunique to the 20th century, is the climate change of recent decades largely responsible for growthdeclines, and if so has it acted directly or indirectly?
In order to better understand, measure, and predict the rapid transformations that are possible inthe boreal forest, better information information is needed on the role of climate and forestcondition in triggering major fire and insect disturbances. The specific characteristics of fires thatresult in maximal production of charcoal, which represents an important form of long-termcarbon sequestration, are not well documented. Further insight is needed into the interaction of

Ch13 - Forests, Land Management and Agriculture ACIA Scientific Report
External Review January 2004 13–109 DO NOT CIRCULATE OR CITE
climate, forest disturbance, forest succession (and its influences in carbon dynamics), water andnitrogen dynamics, and changes in carbon stocks.
Forest advance into tundra has the potential for a large positive temperature feedback.Unfortunately our understanding of change at this crucial ecological boundary comes from asmall number of widely separated studies undertaken for many different objectives. Acoordinated, circumpolar treeline study and monitoring initiative will be necessary to definitivelyaddress the simple question of how and why this boundary is changing at the scale required toaddress its potential global importance.
Improvements in scaling output from the GCM’s grid data to application at a given location willimprove confidence in scenario projections.
13.13.3 Research needs in UV-B and boreal forests
The UV- survival strategies of evergreens appear to include simultaneous inhibition andavoidance. The late winter and early spring conditions are critical, and their importance shouldbe studied further and effects quantified. More studies, longer-term studies, and well-designedecosystem studies that incorporate the previously established effects from individual plot studiesand consider the multiple influences UV-B on plant chemistry in settings of ecologicalcommunities will be needed to understand the cumulative effect of increased UV-B radiation onforests at high latitudes.

Ch13 - Forests, Land Management and Agriculture ACIA Scientific Report
External Review January 2004 13–110 DO NOT CIRCULATE OR CITE
13.13 References
Alenius, C.M., Vogelmann, T.C. and Bornman, J.F. 1995. A three-dimensional representation ofthe relationship between penetration of UV-B radiation and UV-screening pigments inleaves of Brassica napus. New Phytologist 131:297-302.
Alix, C. 2001. Exploitation du bois par les populations néo-eskimo entre le nord de l’Alaska et leHaut-Arctique canadien. Thèse de doctorat de l’Université de Paris I - PanthéonSorbonne, Anthropologie, Ethnologie, Préhistoire, 2 volumes.
Amiro, B. D., Stocks, B.J., Alexander, M.E., Flannigan, M.D., Wotton, B.M. (2001). “Fire,climate change, carbon and fuel management in the Canadian boreal forest.” InternationalJournal of Wildland Fire 10(4): 405.
Anderson, P. M. and L. B. Brubaker (1994). "Vegetation history of Northcentral Alaska: Amapped summary of late-quaternary pollen data." Quaternary Science Reviews 13: 71-92.
Arain, M., Black, T., Barr, A., Jarvis, P., Massheder, J., Verseghy, D., Nesic, Z. (2002). “Effectsof seasonal and interannual climate variability on net ecosystem productivity of borealdeciduous and conifer forests.” Canadian Journal of Forest Research 32: 878-891.
Ash, A.H.B., Blatta, D.A., Mitchell B.A., Davies, B., Shaykewich, C.F., Wilson, J.L., andRaddatz, R.L. 1999. Agricultural climate of Manitoba.http://www.gov.mb.ca/agriculture/climate/waa50s00.html .
Bader, H.G. 2004. Memorandum to section heads. Alaska Division of Lands and Minerals,Department of Natural Resources. Northern Regional Office, Fairbanks, Alaska. January6, 2004.
Baillie M.G.L. A Slice Through Time: Dendrochronology and precision Dating. Routhedge,London, 2000, 286 p.
Balakumar, T., Vincent, V. H. B., Paliwal, On the interaction of UV-B radiation (280-315 nm)with water stress in crop plants, Physiologia Plantarum 1993, 87, 217-222.
Baldocchi, D.D. and C.A. Vogel. (1995). Energy and CO2 Flux Densities Above and Below aTemperate Broad-leaved forest and Boreal Pine Forest, Tree Physiology, Volume 16,March 1995, pp. 5-16.
Barber, V., G. Juday and B. Finney. 2000. Reduced growth of Alaska white spruce in thetwentieth century from temperature-induced drought stress. Nature 405: 668-672.
Barber, V.A., G.P. Juday and B.P. Finney. 2004. Reconstruction of Summer Temperatures inInterior Alaska: Evidence for Changing Synoptic Climate Regimes. Climatic Change.Xx:xx
Barney, R. J. and B. J. Stocks. Fire frequencies during the suppression period. In: The Role ofFire in Northern Circumpolar Ecosystems. Ross W. Wein and David A. MacLean,editors. p. 45-62. 1983. WR 203
Barr, A. G., Griffis, T.J., Black, T.A., Lee, X., Staebler, R.M., Fuentes, J.D., Chen, Z.,Morgenstern, K. (2002). “Comparing the carbon budgets of boreal and temperatedeciduous forest stands.” Canadian Journal of Forest Research 32: 813-822.
Bassman J.H., Edwards G.E. & Robberecht R. 2003. Photosynthesis and growth in seedlings offive forest tree species with contrasting leaf anatomy subjected to supplemental UV-Bradiation. Forest Science 49(2),176-187.
Beniston, M., Tol, R.S.J, Delecolle, R., Hoermann, G., Inglesias, A., Innes, J., McMichael, A.J.,Martens, W.J.M., Nemesova, I., Nicholls, R., Toth, F.L. 1998. Europe. Pages 151-185. In

Ch13 - Forests, Land Management and Agriculture ACIA Scientific Report
External Review January 2004 13–111 DO NOT CIRCULATE OR CITE
R.T.Watson, M.C.Zinyowera, R.H.Moss, and D.J.Dokken, editors. The Regional Impactsof Climate Change: An Assessment of Vulnerability. Intergovernmental Pannel onClimate Change. Cambridge University Press, Cambridge.
Berg, A.; Ehnstrom, B.; Gustafsson, L.; Hallingback, T.; Jonsell, M.; Weslien, J. 1994.Threatned plant, animal, and fungus species in Swedish forests: distributions and habitatassociations. Conservation Biology 8 (3): 718-731.
Berg, E.E., and Chapin, F.S. III. 1994. Needle loss as a mechanism of winter drought avoidancein boreal conifers. Canadian Journal of Forest Research 24: 1144-1148.
Bergh, J. S. L., T. Lundmark, B. Elfving (1999). “The effect of water and nutrient availability onthe productivity of Norway Spruce in northern and southern Sweden.” Forest Ecologyand Management 119: 51-62.
Beyschlag, W., Barnes, P. W., Flint, S. D., Caldwell, M. M., Enhanced UV-B Irradiation has NoEffect on Photosynthetic Characteristics of Wheat (Triticum aestivum L.) and Wild Oat(Avena fatua L.) under Greenhouse and Field Conditions, Photosynthetica 1989, 22, 516-525.
Birdsey, R. A., Heath, L.S., Joyce, L.A. (Ed) (1995). Productivity of America's forest andclimate change. Ft. Collins, USDA Forest Service; Rocky Mountain Forest and RangeExperiment Station: 56-70.
Blöndal, S. 1991: Forest recreation in Iceland. SNS project "Multiple used forestry inScandinavia practice and perspective" unpublished report.
Blöndal, S. 1993: Socioeconomic importance of forests in Iceland. Pp 1-13, In: Alden, J.,Mastrantonio, J.L., and Odum, S. (editors). Forest development in cold climates. NATOASI Series. Plenum Press. New York.
Bonan, G. B. and K. Van Cleve. 1992. Soil temperature, nitrogen mineralization and carbonsource-sink relationships in boreal forests. Can. J. For. Res. 22:629-639.
Bonan, G. B., D. Pollard, et al. (1992). "Effects of boreal forest vegetation on global climate."Nature 359: 716-718.
Bonsal, B. R., Chakravarti, A.K., Lawford, R.G. (1993). “Teleconnections between North PacificSSR anomalies and growing season extended period dry spells on the Canadian prairies.”International Journal of CLiamtology 13: 865-878.
Bootsma, A. 1984. Forage crop maturity zonation in the Atlantic Region using growing degreedays. Canadian Journal of Plant Science 64: 329-338.
Bourgeois, G., S. Jenni, et al. (2000). "Improving the prediction of processing pea maturity basedon the growing-degree day approach." HortScience 35: 611-614.
Bradley, R. S. (2000). "Past global changes and their significance for the future." Quatern. SciRev. 19: 391-402.
Breazeale, D. 1999. Using growing degree days for alfalfa production. Fact Sheet 99-71.University of Nevada Cooperative Extension Service, Reno, Nevada.
Briffa K.R., Jones P.D., Schweingruber F.H., Karlen W., Shiyatov S.G. (1996). Tree-ringvariables as a proxy-climate indicators: Problems with low-frequency signals. In: ClimateChange and Forcing Mechanisms of the last 2000 years. NATO ASI Ser., Ser.1: GlobalChange, vol. 41: 9-41.
Briffa K.R., Osborn T.J., Schweingruber F.H., Harris I.C., Jones P.D., Shiyatov S.G., VaganovE.A. Low-frequency temperature variations from a northern tree ring density network.J.Geophys.Res., 2001, 106 (D3): 2929-2941.

Ch13 - Forests, Land Management and Agriculture ACIA Scientific Report
External Review January 2004 13–112 DO NOT CIRCULATE OR CITE
Briffa, K. R., F. H. Schweingruber, et al. 1998. "Reduced sensitivity of recent tree-growth totemperature at high northern latitudes." Nature 391(12 February): 678-682.
Briffa, K.R., Bartholin, T.S., Eckstein, D., Jones, P.D., Karlén, W., Schweingruber, F.H. andZetterberg, P. 1990: A 1.400-year tree-ring record of summer temperatures inFennoscandia. Nature 346: 434-439
Budyko M.I., Izrael Yu.A. 1987. (Editors) Anthropogenic Forcing of Climate. Leningrad,Gidrometeoizdat, 476 p. (in Russian).
Cahoon, D. R., Jr., B. J. Stocks, et al. (1994). Satellite analysis of the severe 1987 forest fires innorthern China and southeastern Siberia. J. Geophy. Res. 99: 18,627-18,638.
Cahoon, D. R., Jr., B. J. Stocks, et al. (1996). Monitoring the 1992 forest fires in the borealecosystem using NOAA AVHRR satellite imagery. Biomass Burning and ClimateChange - Volume 2: Biomass Burning in South America, Southeast Asia, and Temperateand Boreal Ecosystems, and the Oil Fires of Kuwait. J. L. Levine. Cambridge, MA, MITPress: 795-802.
Caldwell, C.R. 1993. Ultraviolet induced photodegradation of cucumber (Cucumis sativus L.)micrsomal and soluble protein tryptophanyl residues in vitro. Plant Physiology 101:947-953.
Caldwell, M.M., Björn, L.O., Bornman, J.F., Flint, S.D., Kulandaivelu, G., Teramura, A.H., andTevini, M. 1998. Effects of increased solar UV radiation on terrestrial ecosystems.Journal of Photochemistry and Photobiology B: Biology 46:40-52.
Carcaillet, C., Bergeron, Y., Richard, P. J. H., Frechette, B., Gauthier, S., Prairie, Y. T. (2001).“Changes of fire frequency in the Eastern Canadian boreal forest during the Holocene:does vegetation composition or climate trigger the fire regime.” Journal of Ecology 89:930-946.
Carter, T.R., Saarikko, R.A., and Niemi, K.J. 1996. Assessing the risks and uncertainties ofregional crop potential under a changing climate in Finland. Agricultural and FoodScience in Finland 5: 329-350.
Caspersen, J. P., Pacala, S.W., Jenkins, J.C., Hurtt, G.C., Moorcroft, P.R., Birdsey, R.A (2000).“Contributions of land-use history to carbon accumulation in U.S. Forests.” Science 290:1148-1151.
Cen, Y.-P. and Bornman, J.F. 1993. The effect of exposure to enhanced UV-B radiation in thepenetration of monochromatic and polychromatic UV-B radiation in leaves of Brassicanapus. Physiologia Plantarum 87:249-255.
Ceulmans, R., Mousseau, M., (1994). “Effect of elevated atmospheric CO2 on woody plants.”New Phytology 127: 425-446.
Chambers, S. D., and F. S. Chapin, III. 2003. Fire effects on surface-atmosphere energyexchange in Alaskan black spruce ecosystems: Implications for feedbacks to regionalclimate. Journal of Geophysical Research 108:8145, doi:8110.1029/2001JD000530.
Chapin, F. S. I., Walter, C.S.H., Clarkson, D.T. (1988). “Growth response of barley and tomatoto nitrogen stress and its control by abscisic acid, water relations and photosynthesis.”Planta 173: 352-366.
Chapin, F.S., Iii, T.S. Rupp, A.M. Starfield, L. Dewilde, E.S. Zavaleta, N. Fresco, J. Henkelman,and A.D. Mcguire. 2003. Planning for resilience: modeling change in human-fireinteractions in the Alaskan boreal forest. Frontiers in Ecology 1, 255-261.
Chapin, F.S., III. , D. Baldocchi , W. Eugster , S.E. Hobbie , E. Kasischke , A.D. McGuire , R.Sr.Pielke , J. Randerson , E.B. Rastetter , N. Roulet , S.W. Running and S.A. Zimov. 2000.

Ch13 - Forests, Land Management and Agriculture ACIA Scientific Report
External Review January 2004 13–113 DO NOT CIRCULATE OR CITE
Arctic and boreal ecosystems of western North America as components of the climatesystem. Global Change Biology 6 (Suppl. 1): 211-223.
Chapin, F.S., III. and A.M. Starfield. 1997. Time lags and novel ecosystems in response totransient climatic change in arctic Alaska. Climate Change 35: 449-461.
Ciais, P., Tans, P.P., Trolier, M., White, J.W.C., Francey, R.J. (1995). “A Large NorthernHemisphere Terrestrial CO2 Sink Indicated by the 13C/12C Ratio of Atmospheric CO2.”Science 269(5227): 1098-1101.
Colwell, M.A., Koroliuk, A.Y., Dubyrin, A.V., Soboleb, N.A. 1997. Russian nature reserves andconservation of biological diversity. Natural Areas Journal 17(1): 56-68.
Conard, S. G., Anova, G. A. (1997). “Wildfire in Russian boreal forests - potential impacts offire regime characteristics on emissions and global carbon balance estimates.”Environmental Pollution 98(3): 305.
Cotrufo, M. F., Ineson, P., Rowland, A.P. (1994). “Decomposition of tree leaf litters grownunder elevated CO2: effect of litter quality.” Plant and Soil 163: 121-130.
Crawford RMM, 1997. Oceanity and the ecological disadvantages of warm winters. Bot. J. Scotl.49, 205-221.)
Crawford RMM, Jeffree CE & Rees WG. 2003. Paludification and forest retreat in northernoceanic environments. Annals of Botany 91, 213-226.)
Crawford, H.S., and Jennings, D.T. 1989. Predation by birds on spruce budworm Choristoneurafumiferana: functional, numerical, and total responses. Ecology 70: 152-163.
Dahl-Jensen D., Mosegaard K., Grundestrup N., Clow G.D., Johnsen S.J., Hansen A.W., BallingN. Past temperatures directly from the Greenland ice sheet. Science, 1998, 282: 268-271.
D'Arrigo, R. D., C. M. Malmstrom, G. C. Jacoby, S. Los and D. E. Bunker. 2000.Tree-ringindices of interannual biospheric variability: testing satellite-based model estimates ofvegetation activity. Internat.J. Remote Sens. 21: 2329-2336.
D'Arrigo, R. D., G. C. Jacoby, et al. (1992). "Tree-ring width and maximum latewood density atthe North American tree line: parameters of climate change." Canadian Journal of ForestResearch 22: 1290-1296.
D'Arrigo, R., R. Villalba and G. Wiles. 2001. Tree-ring estimates of Pacific decadal climatevariability. Climate Dynamics 18: 219-224.
D'Arrigo, R.D., E.R.Cook and G.C.Jacoby. 1996. Annual to decadal-scale variations innorthwest Atlantic sector temperatures inferred from Labrador tree rings. CanadianJ.For.Res. 26: 143-148.
Day, T.A. 1993. Relating UV-B radiation screening effectiveness of foliage to absorbing-compound concentration and anatomical characteristics in a diverse group of plants.Oecologia 95:542-550.
Day T.A. 2001. Ultraviolet radiation and plant ecosystems. In: Cockell, C.S. & Blaustein A.R.(eds.) Ecosystems, evolution, and ultraviolet radiation. Springer Verlag, 80 – 117.
Day, T. A., Vogelmann, T. C., Alterations in photosynthesis and pigment distributions in pealeaves following UV-B exposure, Physiologia Plantarum 1995, 94, 433-440.
Dofing, S.M. 1992. Growth, phenology, and yield components of barley and wheat grown inAlaska. Canadian Journal of Plant Science 72: 1227-1230.
Dofing, S.M. and Knight, C.W. 1994. Variation for grain fill characteristics in northern-adaptedspring barley cultivars. Acta Agricluture Scandinavia, Section B., Soil and Plant Science44: 88-93.

Ch13 - Forests, Land Management and Agriculture ACIA Scientific Report
External Review January 2004 13–114 DO NOT CIRCULATE OR CITE
Eggertsson, O. 1994. Origin of the Arctic Driftwood – A Dendrochronological Study. LundquaThesis 32, Lund University, Department of Quaternary Geology.
Egler, F.E., 1954. Vegetation science concepts. I. Initial Floristic composition, a factor in old-field vegetation development. Vegetatio 4, 412-417.
Esper, J., Cook, E.R. and Scheingruber, F.H. 2002. Low-frequency signals in long tree-ringchronologies for reconstructing past temperature variability. Science 295: 2250-2253.
Esseen, P.A.; Ehnstrom, B.; Eriscon, L.; Sjoberg, K. 1992. Boreal forests - the focal habitats ofFennoscandia. In: Ecological Principles of Nature Conservation. Applications inTemperate and Boreal Environments. L. Hansson (ed.) Elsevier Applied Science,London. pp 252-325.
Fan, S., Gloor, M., Mahlman, J., Pacala, S., Sarmiento, J., Takahashi, T., Tans, P. (1998). “Alarge terrestrial carbon sink in North America implied by atmospheric and oceanic carbondioxide data and models.” Science 282: 442-446.
Fang, J., Chen, A., Peng, C., Zhao, S., Ci, L, (2001). “Changes in Forest Biomass CarbonStorage in China Between 1949 and 1998.” Science 292(5525): 2320-2322.
FAO. 2001. Forest Resources Assessment 2000. Main Report FAO Forestry Paper 140. Rome.Fisher, H., Werner, M., Wagenbach, D., Schwager, M., Thorsteinnson, T., Wilhelms, F.,
Kipfstuhl, J. and Sommer, S. 1998: Little Ice Age clearly recorded in northern Greenlandice cores. Geophysical Research Letters, 25: 1749-1752
Flannigan M., Campbell I., Wotton M., Carcaillet C., Richard P., Bergeron Y. 2001. CanadianJournal of Forest Research. 31 (5): 854-864.
Flannigan, M.D., and Harrington, J.B., 1988. A study of the relation of meteorological variablesto monthly provincial area burned by wildfire in Canada (1935-80). Journal of AppliedMeteorology 27, 441-452.
Flannigan, M.D., Bergeron, Y., Engelmark, O., Wotton, B.M. 1998. Future wildfire incircumboreal forests in relation to global warming. Journal of Vegetation Science 9 (4):469-476.
Flannigan, M.D., Stocks, B.J., Wotton, B.M. 2000. Climate change and forest fires. Science ofthe Total Environment 262 (3): 221-229.
Flannigan, M.D., Van Wagner, C.E. 1991. Climate change and wildfire in Canada. CanadianJournal of Forest Research 21(1): 66-72.
Fleming, R.A., and Volney, W.J.A. 1995. Effects of climate change on insect defoliatorpopulation processes in Canada’s boreal forest: some plausible scenarios. Water, Soil,and Air Pollution 82: 445-454.
Fritts H.C. 1976. Tree-rings and climate. London; New York; San Francisco: Acad. Press.Gabriel, H.W. and G.F. Tande. 1983. A regional approach to fire history in Alaska. Bureau of
Land Management., BLM-Alaska Tech. Rep. 9, Anchorage, Alaska. 34 p.Gardner RH, Hargrove WW, Turner MG, Romme WH (1996) Global change, disturbances and
landscape dynamics. In: Global change and terrestrial ecosystems (eds Walker B, SteffenW), 149-172. Cambridge University Press, Cambridge, UK.
Gardner, R.H., Romme, W.H., and Turner, M.G., 1999. Predicting forest fire effects at landscapescales. In: Spatial Modeling Of Forest Landscapes: Approaches and Applications (EdsMladenoff, D.J., and Baker, W.L.), 163-185. Cambridge University Press, Cambridge.
Gitay, H. et al. 2001. Ecosystems and their goods and services. Chapter 5, Pp 235-342. In:Climate Change 2001 Impacts, Adaptation, and Vulnerability. Cambridge UniversityPress. Cambridge, United Kingdom. 1032 pp.
Ch13 - Forests, Land Management and Agriculture ACIA Scientific Report
External Review January 2004 13–115 DO NOT CIRCULATE OR CITE
Goodale, C. L., Apps, M.J., Birdsey, R.A., Field, C.B., Heath, L.S., Houghton, R.A., Jenkins,J.C., Kuhlmaier, G.H., Kurz, W., Liu, S., Nabuurs, G-J., Nilsson, S., Shvidenko, A.Z.(2002). “Forest carbon sinks in the northern hemisphere.” Ecological Applications 12(3):891-899.
Gorham, E. (1991). “Northern peatlands: Role in the carbon cycle and probable responses toclimatic warming.” Ecological Applications 1(2): 182-195.
Gower, S. K., O; Olson, RJ; Apps, M; Linder, S; Wang, C (2001). “Net primary production andcarbon allocation patterns of boreal forest ecosystems.” Ecological Applications 11(5):1395-1411.
Greenberg, B.M., Gaba, V., Canaani, O., Malkin, S. and Maattoo, A.K. 1989. Separatephotosensitizers mediate degradation in the 32-kda photosystem II reaction center proteinin the visible and UV spectral region. Proceedings of the National Academy of Science ofthe United States of America 86:6617-6620.
Greene, D.F., Zasada, J.C., Sirois, L., Kneeshaw, D., Morin, H., Charron, I., and Simard, M.-J.,1999. A review of the regeneration dynamics of North American boreal forest treespecies. Canadian Journal of Forest Research 29, 824-839.
Grove, J.M. 1988: The Little Ice Age. Methuen & Co. London. 498 pp.Grudd H., Briffa K.R., Karlén W., Bartholin T.S., Jones P.D., and Kromer B., 2002: A 7400-year
tree-ring chronology in northern Swedish Lapland: natural climatic variability expressedon annual to millennial timescales. The Holocene, 12: 657-666.
Grudd, H., Briffa, K.R., Gunnarson, B.E. and Linderholm, H.W. 2000: Swedish tree ringsprovide new evidence in support of a major, widespread environmental disruption in1628!B.C. Geophysical Research Letters 27, 2957-2960.
Gunnarson B. and Linderholm H.W. 2002: Low frequency climate variation in Scandinavia sincethe 10th century inferred from tree rings. The Holocene, 12: 667-671.
Gunnarsson, K. 1999: Afforestation projects and rural development in Iceland In: Niskanen A.,and Väyrynen J. (eds.) Regional Forest Programmes: A Participatory Approach toSupport Forest Based Regional Development EFI Proceedings No 32; 198-204.
Gwynn-Jones, D., Lee J., Johanson, U., Phoenix G., Callaghan T. & Sonesson M. 1999. Theresponses of plant functional types to enhanced UV-B radiation. In: Rozema J. (Ed.)Stratospheric ozone depletion: the effects of enhanced UV-B radiation on terrestrialecosystems, pp173-186. Backhuys Publishers, Leiden, The Netherlands
Haak, R.A. 1996. Will Global Warming Alter Paper Birch Susceptibility to Bronze Birch BorerAttack? Pages 234- 247 in W.J. Mattson, P. Niemila, and M. Rossi (eds.) Dynamics offorest herbivory: Quest for pattern and principle. USDA Forest Service GeneralTechnical Report NC-183. USDA Forest Service, North Central Forest ExperimentStation. St. Paul, MN.
Häkkila, M. 2002. Farms of northern Finland. Fennia 180 (1-2): 199-211Hall F.G., Sellers P.J., Williams D.L. 1996. Initial results from the boreal ecosystem-atmosphere
experiment, BOREAS. Silva Fennica 30(2-3) (1996) 109-121Hallsdóttir, M. 1987: Pollen analytical studies of human influences on vegetation in relation to
the Landnám Tephra layer in southwest Iceland. Lundqua Thesis 18; 45 pHamilton R. J. 1995. Analysis of waxes. In: Hamilton R. (ed.) Waxes: chemistry, molecular
biology and functions. The Oily Press Dundee, 311-342.Hantemirov R.M., 1999. Tree-ring reconstruction of summer temperatures on a north of Western
Siberia for the last 3248 years. Siberian Ecological Journal. 6 (2): 185-191.

Ch13 - Forests, Land Management and Agriculture ACIA Scientific Report
External Review January 2004 13–116 DO NOT CIRCULATE OR CITE
Hantemirov R.M., Shiyatov S.G., 1999. Main stages of woody vegetation development in theYamal Peninsula in the Holocene. Russian Journal of Ecology. 30 (3): 141-147.
Hantemirov R.M., Shiyatov S.G. 2002. A continuous multi-millennial ring-width chronology inYamal, northwestern Siberia. The Holocene. 12(6) 717-726.
Hard, J. S. 1985 Spruce beetles attack slowly growing spruce. Forest Science 31:839-850.Hard, J. S. 1987 Vulnerability of white spruce with slowly expanding lower boles on dry, cold
sites to early seasonal attack by spruce beetles in south central Alaska. Canadian Journalof Forest Research 17:428-435.
Harden, J. W., Trumbore, S.E., Stocks, B.J., Hirsch, A., Gower, S.T., O'Neill, K.P., Kasischke,E.S. (2000). “The role of fire in the boreal carbon budget.” Global Change Biology6(Suppl. 1): 174-184.
Harvey, G T (1985) The taxonomy of the coniferophagous Choristoneura (LepidopteraTortricidae): a review, Pages 16-48 in C.J. Saunders et al. (eds.) Recent Advances inSpruce Budworms Research, Canadian Forestry Service, Ottawa ON. 527 pp.
Hewitson, B., 2003: Developing perturbations for climate change impact assessments. EOS,Trans, Amer. Geophys. Union, 84 (35), 337-341.
Hogg, E. H., Hurdle, P.A., (1995). “The aspen parkland in western Canada: A dry-climateanalogue for the future boreal forest?” Water, Air and Soil Pollution 82: 391-400.
Holsten, E. and R. Burnside (1997). "Forest health in Alaska: an update." Western Forester42(4): 8-9.
Holsten, E. H. 1990 Spruce beetle activity in Alaska 1920-1989. USDA FS Technical ReportR10- 90-18.
Houghton, R. A., Hackler, J L, Lawrence, K T (1999). “The U.S. Carbon Budget: Contributionsfrom Land-Use Change.” Science 285(5427): 574-577.
Houghton, R. A., Hackler, J.L. (2000). “Changes in terrestrial carbon storage in the UnitedStates. 1: The roles of agriculture and forestry.” Global Ecology & Biogeography 9(2):125-144.
Houghton, R. A., Hobbie, J.E., Melillo, J.M., Moore, B., Peterson, B.J., Shaver, G.R., Woodwell,G.M. (1983). “Changes in the carbon content of terrestrial biota and soils between 1860and 1980: A net release of CO2 to the atmosphere.” Ecological Monographs 53(3): 235-262.
Hughes M.K., Diaz H.F. Was there a “Medieval Warm Period” and if so, where and when?Climatic Change, 1994, 26: 109-142.
Huhges M.K., Vaganov E.A., Shiyatov S.G., Touchan R., Funkhouser G. Twentieth-centurysummer warmth in northern Yakutia in a 600-year context. Holocene 1999, 9(5): 603-608.
Hurtt, G. C., Pacala, S.W., Moorcroft, P.R., Caspersen, J., Shevliakova, E., Houghton, R.A.,Moore III, B. (2002). Projecting the future of the U.S. carbon sink. Proceedings oftheNational Academy of Sciences of the United States of America 99.
Hustich, I. 1966. On the forest-tundra and the northern tree-lines, Annales UniversitatisTurkuensis Series A II, 36: 7-47.
Huttunen S., Lappalainen N., Taipale T. & Hägg M. 2003. Arctic and subarctic plants andincreasing UV radiation. Submitted Arctic Science Yearbook.
IPCC (Intergovernmental Panel on Climate Change) Climate Change 2001: The Scientific Basis.Working Group I contribution to the IPCC Third Assessment Report. (URL:http://www.ipcc.ch/), 2001.

Ch13 - Forests, Land Management and Agriculture ACIA Scientific Report
External Review January 2004 13–117 DO NOT CIRCULATE OR CITE
IPCC. 1996. Climate Change 1995. The Science of Climate Change. J.T.Houghton, L.G.MeiraFilho, Callander B.A., K.Maskell (Eds.). Cambridge, UK. Cambridge Univ. Press. 572 p.
Isaev, A. S., Korovin, G. N., Bartalev, S. A., Ershov, D. V., Janetos, A., Kasischke, E. S.,Shugart, H. H., French, N. H. F., Orlick, B. E., Murphy, T. L. (2002). “Using RemoteSensing to Assess Russian Forest Fire Carbon Emissions.” Climatic Change 1-2: 235-249.
Jacoby, G. C., I. S. Ivanciu, et al. (1988). "A 263-year record of summer temperature fornorthern Quebec reconstructed from tree-ring data and evidence of a major climatic shiftin the early 1800's." Palaeogeography, Palaeoclimatology, Palaecology 64: 69-78.
Jacoby, G., and R. D'Arrigo, (1989)Reconstructed Northern Hemisphere annual temperaturesince 1671 based on high latitude tree-ring data from North America, Climatic Change14: 39-59.
Jacoby, G., and R. D'Arrigo, (1995). Tree-ring width and density evidence of climatic andpotential forest change in Alaska, Glob. Biogeochem. Cycles 9: 227-234.
Jacoby, G.C., N.V. Lovelius, O.I. Shumilov, O.M.Raspopov, J.M. Karbainov, and D.C. Frank,2000, Long-term temperature trends and tree growth in the Taymir region of northernSiberia, Quaternary Research , 53, 312-318.
Jardine, K. 1994. Finger on the carbon pulse. The Ecologist 24:220-224.Jarvis, P. and Linder, S. 2000. Botany: Constraints to growth of boreal forests. Nature 405: 904 –
905.Jiang, H., Apps, M.J., Peng, C., Zhang, Y., Liu, J. (2002). “Modelling the influence of harvesting
on Chinese boreal forest carbon dynamics.” Forest ecology and management 169(1): 65-82.
Johanson, U., Gehrke, C., Bjorn, L.O. and Callaghan, T.V. 1995. The effects of enhanced UV-Bradiation on the growth of darf shrubs in a subarctic heathland. Functional Ecology9:713-719.
Johnson, E. A. 1992. Fire and Vegetation Dynamics; Studies from North American BorealForest, Cambridge University Press.
Johnson, E.A. and Wowchuk, D.R., 1993. Wildfires in the southern Canadian Rocky Mountainsand their relationship to mid-tropospheric anomalies. Canadian Journal of ForestResearch 23, 1213-1222.
Jones, P.D. and Bradley, R.S. 1992: Climate variations over the last 500 years. In R.S Bradleyand P.D Jones (eds): Climate since A.D. 1500. Routledge, London, 649-665
Jordan, B.R., James, P., Strid, A., and Anthony, R. 1994. The effect of ultraviolet-radiation ongene expression and pigment composition in etiolated and green pea leaf tissue: UV-Binduced changes are gene-specific and dependent on the developmental stage. Plant, Celland Environment 17:45-54.
Juday, G. P., R. A. Ott, et al. 1998. Forests, Climate Stress, Insects and Fire. Implications ofGlobal Climate Change in Alaska and the Bering Sea Region, Fairbanks AK, The Centerfor Global Change and Arctic System Research.
Juday, G. P., V. A. Barber, et al. 1999. Recent dynamics of white spruce treeline forests acrossAlaska in relation to climate. Sustainable Development in the Northern TimberlineForests. Proceedings of the Timberline Workshop, May 10-11, 1998, Whitehorse,Canada, The Finnish Forest Research Institute.
Juday, G.P., Barber, V., Rupp S., Zasada, J., Wilmking M.W. 2003. A 200-year perspective ofclimate variability and the response of white spruce in Interior Alaska. Chapter 13 Pp.
Ch13 - Forests, Land Management and Agriculture ACIA Scientific Report
External Review January 2004 13–118 DO NOT CIRCULATE OR CITE
226-250. In: Greenland, D., Goodin, D., and Smith, R. (editors). Climate Variability andEcosystem Response at Long-Term Ecological Research (LTER) Sites. OxfordUniversity Press.
Jungblut, TP., Schnitzler, JP, Heller, W., Hertkorn, N., Metzger, JW., Szymczak W.,Sandermann Jr, H. 1995. Structures of UV-B induced sunscreen pigments of the Scotspine (Pinus sylvestris L. ) Angewandte Chemie – International Edition in English34(3),312-314.
Juskiw, P.E., Jame, Y-W., and Kryzanowski, L. 2001. Phenological development of springbarley in a short-season growing area. Agronomy Journal 93: 370-379.
Kasischke, E.S., Christensen, N.L., and Stocks, B.J., 1995. Fire, global warming, and the carbonbalance of boreal forests. Ecological Applications 5: 437-451.
Kasischke, E. S., Williams, D., B. Donald. 2002. “ Analysis of the patterns of large fires in theboreal forest region of Alaska.” International Journal of Wildland Fire 11(2): 131.
Kasischke, E.S., T.S. Rupp, and D.L. Verbyla. 2003. Fire trends in the Alaskan boreal forest. In:Chapin, F.S., III, J. Yarie, K. Van Cleve, L.A. Viereck, M.W. Oswood, And D.L.Verbyla, editors. Alaska's Changing Boreal Forest. Oxford University Press. In Press.
Kasischke, Eric, S., N. L. Christensen, Jr., and Brian J. Stocks. 1995. Fire, Global warming, andthe carbon balance of boreal forests. Ecological Applications 5:437-451.
Kaudun, S.S., Lebreton, P. & Fady, B. 1998. Geographical variability of Pinus halepensis Mill.As revealed by foliar flavonoids. Biochemical Systematics and Ecology 26,83-96.
Keeling, R. F., Piper, S.C., Heimann, M (1996). “Global and hemispheric CO2 sinks deducedfrom changes in atmospheric O2 concentration.” Nature 381(6579): 218-220.
Kinnunen, H., Huttunen S. & Laakso, K. 2001: UV-absorbing compounds and waxes of Scotspine needles during a third growing season of supplemental UV-B in the field.Environmental Pollution, 112(2), 215-220.
Kinnunen, H., Huttunen, S., and Laakso, K. 2001. UV-absorbing compounds and waxes of Scotspine needles during a third growing season of supplemental UV-B. EnvironmentalPollution 112:215-220.
Kirdyanov A.V. Dendroclimatic Analysis of Tree-Ring Width, Tracheid Dimension and Wooddensity Variations In Conifers Along the Regional Temperature Gradient (the YeniseyMeridian). Abstracts of the XXI IUFRO World Congress “Forests and Society: The Roleof Research”, Kuala Lumpur, Malaysia, 2000, Vol.3, p. 536-537.
Kirdyanov A.V., Zarharjewski D.V. Dendroclimatological study on tree-ring width andmaximum density chronologies from Picea obovata and Larix sibirica from the North ofKrasnoyarsk region (Russia). Dendrochronologia, 1996, v. 14: 227-236.
Kleemola, J. 1991. Effect of temperature on phasic development of spring wheat in northernconditions. Acta Agriculture Scandinavia 41:275-283.
Kondrat’ev K.Ya. Global climate change: reality, assumptions and fantasies. Earth Res. FromSpace, 2002, 1: 3-23 (in Russian).
Kuhry, P. (1994). “The role of fire in the development of Sphagnum-dominated peatlands inwestern boreal Canada.” Journal of Ecology 82: 899-910.
Kullman L. 20th century climate warming and tree-limit rise in the southern Scandes of Sweden.Ambio, 2001, 30(2): 72-80.
Kullman L., Kjallgren L. A coherent postglacial tree-limit chronology (Pinus sylvestris L.) forthe Swedish Scandes: aspect of paleoclimate and “recent warming”, based on megafossilevidence. Arctic, Antarctic, and Alpine Research, 2000, 32(4): 419-428.

Ch13 - Forests, Land Management and Agriculture ACIA Scientific Report
External Review January 2004 13–119 DO NOT CIRCULATE OR CITE
Kurz, W.A. and Apps, M.J., 1999. A 70-year retrospective analysis of carbon fluxes in theCanadian forest sector. Ecological Applications 9(2): 526-547.
Laakso K., Sullivan J.H., Huttunen, S. 2000. The effects of UV-B radiation on epidermalanatomy in loblolly pine (Pinus taeda L.) and Scots pine (Pinus sylvestris L.) Plant, Celland Environment 23(5), 461-472.
Laakso, K. & Huttunen, S. 1998. Effects of the ultraviolet-B radiation (UV-B) on conifers: areview. Environmental Pollution 99, 319-328.
Laakso, K. 1999. Effects of ultraviolet-B radiation (UV-B) on needle anatomy and glutathionestatus of field grown-pines. Acta Universitatis Ouluensis A 338. 47pp.
Laakso, K., Kinnunen H. & Huttunen, S. 2001. The glutathione status of mature Scots pniesduring the third season of UV-B radiation exposure. Environmental Pollution 111, 349-354.
Labau, V. J. and W. van Hees. 1990. An inventory of Alaska's boreal forests: their extent,condition, and potential use. International Symposium Boreal Forests: Climate,Dynamics, Anthropogenic Effects, Archangelsk, Russia, State Committee of USSR onForests.
Lacelle, B., Tarnocai, C., Waltman, S., Kimble, J., Swanson, D., Naumov, Ye. M., Jacobsen, B.,Goryachkin, S., Broll, G. 1998. Northern Circumpolar Soil Map. Agriculture and Agri-Food Canada, USDA, V.V. Dokuchayev Soils Institute, Institutes of Geography –University of Copenhagen and Moscow, Institute of Landscape Ecology – University ofMuenster.
Lamas, T., and Fries, C. 1995. Emergence of a biodiversity concept in Swedish forestry. Water,Air, and Soil Pollution 82 (1/2):57-66.
Lamb H.H. 1977b. Climate: Present, Past and Future. Vol.2. Climate History and Future.London, Methuen, 603 p.
Lamb, H.H. 1977a. Climate, Present, Past and Future. Methuen, London, 835 pp.Laracine-Pittet C, Lebreton P. 1988. Flavonoid variability within Pinus sylvestris.
Phytochemistry 27,2663 – 2666.Latola K., Kinnunen H. & Huttunen S. 2001. Needle ontogeny of mature Scots pines under
enhanced UV-B radiation. Trees 15, 346-352.Lavoie, C., and Payette, S. 1996. The long-term stability of the boreal forest limit in subarctic
Québec. Ecology 77(4): 1226-1233.Lavola A. 1998. Accumulation of flavonoids and related compounds in birch induced by UV-B
irradiance. Tree Physiology 18,53-58.Lavola A., Aphalo PJ., Lahti M., Julkunen-Tiitto R. 2003. Nutrient availability and the effect of
increasing UV-B radiation on secondary plant compounds in Scots pine. Environmentaland experimental Botany 49(1), 49-60.
Lavola, A. 1998. Accumulation of flavenoids and related compounds in birch induced by UV-Bradiation. Tree Physiology. 18:53-58.
Lavola, A., Julkunen-Tiitto, R., de la Rosa, T. and Lehto, T. 1997. The effect of uv-B radiationon uv-absorbing secondary metabolites in birch seedlings grown under simulated forestsoil conditions. New Phytologist 137:617-621.
Leuschner H.H., Delorme A. Tree ring work in Goettingen – absolute oak chronologies back to6255 BC. PACT 22- Febr.5, 1988: 123-131.
Ch13 - Forests, Land Management and Agriculture ACIA Scientific Report
External Review January 2004 13–120 DO NOT CIRCULATE OR CITE
Leuschner H.H., Spurk M., Baillie M., Jansma E. Stand dynamics of prehistoric oak forestsderived from dendrochronologically dated subfossil trunks from bogs and riverrinesediments in Europe. Geolines, 2000, 11: 118-121.
Linder, P., and Ostlund, Lars. 1992. Forandringar i norra Sveriges skogar 1870-1991. [Changesin the boreal forests of Sweden 1870-1991.] Svensk Bot. Tidskr. 86: 199-215.
Linderholm, H.W. 2002: 20th century Scots pine growth variations in the central ScandinavianMountains related to climate change. Arctic, Antarctic, and Alpine Research. 34: 440-449.
Linderholm, H.W., Moberg, A. and Grudd, H. 2002: Peatland pines as climate indicators? – Aregional comparison of the climatic influence on Scots pine growth in Sweden. CanadianJournal of Forest Research 32: 1400-1410.
Linderholm, H.W., Solberg, B.∅. and Lindholm, M. 2003: Tree-ring records from centralFennoscandia: The relationship between tree growth and climate along an east westtransect. The Holocene 13(6): 887-895.
Lindholm, M., Eggertson, O., Lovelius, N., Raspopov, O., Shumilov, O. and Laanelaid, A. 2001:Growth indices of North European Scots pine recorded the seasonal North AtlanticOscillation. Boreal Environment Research 6: 275-284.
Livingston, N. J. and D. L. Spittlehouse. 1996. Carbon isotope fractionation in tree rings earlyand late wood in relation to intra-growing season water balance. Plant Cell Environ. 19:768-774.
Lloyd, A. H. and C. L. Fastie. 2002. Spatial and temporal variability in the growth and climateresponse of treeline trees in Alaska. Climatic Change 52: 481-509.
Lloyd, A. H., T. S. Rupp, et al. (in press). Patterns and dynamics of treeline advance on theSeward peninsula, Alaska." JGR-Atmosphere.
Lutz, H.J., 1956. Ecological effects of forest fires in the interior of Alaska. United StatesDepartment of Agriculture Technical Bulletin 1133. United States Government PrintingOffice, Washington, D.C.
Lynch, J. A., B. Bigelow, J. S. Clark, M. Edwards, and B. Finney. 2003. Spatial and temporalvariations in fire in Boreal Alaska. Journal of Geophysical Research.
MacDonald G.M., Velichko A.A., Kremenetski C.V., Borisova O.K. et al. Holocene treelinehistory and climate change across Northern Eurasia. Quaternary Res., 2000, 53: 302-311.
Magda V.N. and Zelenova A.V. Radial growth of pine as an indicator of atmosphere humidity inMinusinsk hollow. Izvestiya RGO, 2002, v. 134 (1): 73-78. (In Russian).
Makipaa, R., Karjalainen, T., Pussinen, A., and Kellomaki. 1999. Effects of climate change andnitrogen deposition on the carbon sequestration of a forest ecosystem in the boreal zone.Can J. For. Res. 29:1490-1501.
Mann M.E., Bradley R.S., Hughes M. K. Global scale temperature patterns and climate forcingover the six centuries. Nature, 1998. V. 392: 779-782.
Mann, D. H. and Plug, J. (1999). “Vegetation and soil development at an upland taiga site,Alaska.” Ecoscience 6(2): 272-285.
Mann, M., R. Bradley, and M. Hughes. 1999. Northern Hemisphere temperatures during the pastmillennium: inferences, uncertainties, and limitations, Geophys. Res. Lett., 26, 759-762.
Mantua, N. J., Hare, S. R., Zhang, Y., Wallace, J. M., and R. C. Francis. 1997 A Pacificinterdecadal climate oscillation with impacts on salmon production. Bulletin of theAmerican Meteorological Society 78: 1069-1079.
Markham, A., and J. Malcom. 1996. Biodiversity and wildlife conservation: adaptation to

Ch13 - Forests, Land Management and Agriculture ACIA Scientific Report
External Review January 2004 13–121 DO NOT CIRCULATE OR CITE
climate change. Pp 384-401, in: Smith, J., Bhatti, N., Menzhulin, G., Benioff, R.,Campos, M., Jallow, B., and Rijsberman, F. (eds.). Adaptation to climate change:assessment and issues. Springer-Verlag, New York.
Mattson, W.J., and R.A. Haack. 1987. The role of drought in outbreaks of plant-eating insects.BioScience 37: 110-118.
McGuire, A. D., Melillo, J.M., Joyce, L.A., Kicklighter, D.W., Grace, A.L., Moore, B.,Vorosmarty, C.J. 1992. “Interactions Between Carbon and Nitrogen Dynamics inEstimating Net Primary Productivity for Potential Vegetation in North America.” Globalbiogeochemical cycles 6(2): 101-124.
McGuire, A. D., Melillo, J.M., Joyce, L.A. 1995a. “The role of nitrogen in the response of forestnet primary production to elevated atmospheric carbon dioxide.” Annu. Rev. Ecol. Syst.26: 472-503.
McGuire, A.D., Melillo, J.M., Kicklighter, D.W., and Joyce, L.A., 1995b. Equilibrium responsesof soil carbon to climate change: Empirical and process-based estimates. Journal ofBiogeography 22, 785-796.
McLeod A.R. & Newsham K.K. 1997. Impact of elevated UV-B on forest ecosystems. In:Lumsden P. (ed.) Plants and UV-B. Society for Experimental Biology Seminar Series 64,247-281.
Melillo, J. M., Houghton, R.A., Kicklighter, D.W., McGuire, A.D. (1996). “Tropicaldeforestation and the global carbon budget.” Annual review of Energy and theEnvironment 21: 293-310.
Melillo, J.M., McGuire, A.D., Kicklighter, D.W., Moore III, B., Vorosmarty, C.J., and Schloss,A.L., 1993. Global climate change and terrestrial net primary production. Nature 63,234-240.
Mepsted, R., Paul, N. D., Stephen, J., Corlett, J. E., Nogues, S., Baker, N. R., Jones, H. G.,Ayers, P. G., Effects of enhanced UV-B radiation on pea (Pisum sativum L.) grownunder field conditions in the UK, Global Change Biology 1996, 2, 325-334.
Miller, P, Lenier, W, and Brandt, S. 2001. Using growing degree days to predict plant stages.Montana Guide Fact Sheet MT 200103 AG 7/2001. Montanta State University ExtensionService, Bozeman, Montana.
Monserud R.A., Tchebakova N.M., Kolchugina T.P., Denisenko O.V. 1996. Change in Siberianphytomass predicted for global warming. Silva Fennica 30(2-3):185-200.
Murphy, P. J., B. J. Stocks, et al. (2000). Historical fire records in the North American borealforest. Fire, Climate Change, and Carbon Cycling in the North American Boreal Forest.E. S. Kasischke and B. J. Stocks. New York, Springer-Verlag: 274-288.
Myneni, R.B., Dong, J., Tucker, C.J., Kaufmann, R.K., Kauppi, P.E., Liski, J., Zhou, L.,Alexeyev, V., Hughes, M.K. 2001. A large carbon sink in the woody biomass ofNorthern forests. Proceedings of the National Academy of Sciences of the United Statesof America. 98(26): 14784-14789.
Mysterud, I., Mysterud, I., and Bleken, E. 1998. Forest fires and environmental management inNorway. Int. Forest Fire News 18: 72-75.
Nash, C.H. and E.A. Johnson. 1996. Synaptic climatology of lightning-caused forest fires insubalpine and boreal forests. Canadian Journal of Forest Research 26: 1859-1874.
Natural Resources Canada. 2003. The State of Canada’s Forests 2002-2003. Canadian ForestryService. Ottawa, Canada. 95 pp.

Ch13 - Forests, Land Management and Agriculture ACIA Scientific Report
External Review January 2004 13–122 DO NOT CIRCULATE OR CITE
Naurzbaev M.M., Sidorova O.V., Vaganov E.A. History of the late Holocene climate on theeastern Taymir according to long-term tree-ring chronology. Archaeology, Ethnology andAnthropology of Eurasia, 2001, 3(7): 17-25.
Naurzbaev M.M., Vaganov E.A. Variation of summer and annual temperature in the east Taymirand Putoran (Siberia) over the last two millennia inferred from tree-rings.J.Geophys.Res., 2000,105(6): 7317-7327.
Neilson R.P. 1993 Transient ecotone response to climatic change: some conceptual and modelingapproaches. Ecological Applications, 3, 385-395.
Newark, M.J. 1975. The relationship between forest fire occurrence and 500 mb longwaverodging. Amosphere 13: 26-33.
Newsham, K.K., McLeod, A.R., Greeslade, P.D., and Emmett, B.A. 1996. Appropriate controlsin outdoor UV-B supplementation experiments. Global Change Biology 2:319-324.
Niebauer, H. J. (1998). “Variability in Bering Sea ice cover as affected by a regime shift in theNorth Pacific in the period 1947-1996.” Journal of Geophysical Research 103(c12):27171-27737.
Nilsen, P. 2002. Production of Picea abies in south-east Norway in response to climate change: acase study using process-based model simulation with field validation. ScandinavianJournal of Forest Research 17(1): 35-46
Nimchuk, N. 1983. Wildfire behavior associated with upper ridge breakdown, Alberta Energyand Natural Resources, Forest Service, Edmonton, Alberta. ENR Report Number T/50.
Noble I.R. 1993. A model of the responses of ecotones to climate change. EcologicalApplications, 3, 396-403.
Nuttonson, M.Y. 1955. Wheat-climate Relationships and the Use of Phenology in Ascertainingthe Thermal and Photo-thermal Requirements for Wheat. 388 pp. American Institute ofCrop Ecology. Washington, D.C.
Nuttonson, M.Y. 1957. Barley-climate Relationships and the Use of Phenology in Ascertainingthe Thermal and Photo-thermal Requirements for Barley. 200 pp. American Institute ofCrop Ecology. Washington, D.C.
Ogilvie, A.E.J., and McGovern, T.H. Sagas and Science, Climate and Human Impacts in theNorth Atlantic. Pp 385-393. In: Fitzhugh, W.W. and Ward, E.I. (editors). Vikings theNorth Atlantic Saga. Smithsonian Institution Press. Washington D.C.
Oppenheimer, M. 1989. Climate change and environmental pollution: physiological andbiological interactions. Climatic Change 15(1-2): 255-270.
Ott, R.A., Lee, M.A., Putman, W.E., Mason, O.K., Worum, G.T., and Burns, D.N. Burns. 2001.Bank Erosion and Large Woody Debris Recruitment Along the Tanana River, InteriorAlaska. Report to the Dept. of Environment Conservation Division of Air and WaterQuality. Alaska Dept. Of Natural Resources and Tanana Chiefs Conference, ForestryProgram. Project No. NP-01-R9.
Ostergren, D.M., Shvarts, E. 2000. Russian zapovedniki in 1998, recent progress and newchallenges for Russia’s strict nature preserves. Pp 209-213. In: Watson, A.E., Aplet,G.H., Hendee, J.C., (comps.). Personal, societal, and ecological values of wilderness. 6th
World Wilderness Congress proceedings on research, management, and allocation,Volume II. USDA Forest Service, Rocky Mountain Research Station, Ogden Utah.RMRS-P-14.
Overpeck J., Hughen K., Hardy D., Bradley R., Case R., Douglas M., Finney B., Gaejewski K.,Jacoby G., Jennings A., Lamoureux S., Lasca A., MacDonald G., Moore J., Retelle M.,

Ch13 - Forests, Land Management and Agriculture ACIA Scientific Report
External Review January 2004 13–123 DO NOT CIRCULATE OR CITE
Smith S., Wolfe A., Zielinski G. Arctic environmental change of the last four centuries.Science, 1997, 278(14): 1251-1256.
Parker, W.C., Colombo, S.J., Cherry, M.L., Flannigan, M.D., Greifenhagen, S., McAlpine, R.S.,Papadopol, C. and Scarr, T. 2000. Third millennium forestry: what climate change mightmean to forests and forest management in Ontario. The Forestry Chronicle 76(3): 445-461.
Paré, D. and Bergeron, Y., 1995. Above-ground biomass accumulation along a 230-yearchronosequence in the southern portion of the Canadian boreal forest. Journal of Ecology83, 1001-1007.
Parviainen, J. 1994. Finnish silviculture, managing for timber production and conservation.Journal of Forestry 92(9): 33-36.
Pastor, J., and Post, W.M., 1986. Influence of climate, soil moisture, and succession of forestcarbon and nitrogen cycles. Biogeochemistry 2, 3-27.
Pastor, J., Cohen, Y., and Moen, R., 1999. Generation of spatial patterns in boreal forestlandscapes. Ecosystems 2: 439-450.
Payette, S., 1992. Fire as a controlling process in the North American boreal forest. In: ASystems Analysis of the Global Boreal Forest (Eds Shugart, H.H., Leemans, R., andBonan, G.B.,), 145-169. Cambridge University Press, Cambridge.
Payette, S, and Gagnon, R. 1985. Late Holocene deforestation and tree regeneration in the forest-tundra of Quebec. Nature 313: 570-572.
Pereg, D., and S. Payette. 1998. Development of black spruce growth forms at treeline. PlantEcology 138: 137-147.
Pielke, R.A., Vidale, P.L. 1995. The boreal forest and the polar front. Journal of GeophysicalResearch-Atmospheres 100 (D12): 25755-25758.
Pojar, J. (1996). "Environment and biogeography of the western boreal forest." ForestryChronicle 72 (1): 51-58.
Price, D. T., Halliwell, D. H., Apps, M. J., Kurz, W. A., and Curry, S. R. 1997. Comprehensiveassessment of carbon stocks and fluxes in a Boreal-Cordilleran forest management unit.Can J. For. Res. 27:2005-2016.
Rapalee, G., Trumbore, S.E., Davidson, E.A., Harden, J.W., Veldhuis, H. (1998). “Soil carbonstocks and their rates of accumulation and loss in a boreal forest landscape.” Globalbiogeochemical cycles 12(4): 687-702.
Rayner, P. J., Enting, I.G., Francey, R.J., Langenfelds, R (1999). “Reconstructing the recentcarbon cycle from atmospheric CO2, d13C and O2/N2 observations.” Tellus Series B51(2): 213-231.
Rosa del la, T.M., Julkunen-Tiitto, R., Lehto, T. and Aphalo, P.J. 2001. Secondary metabolitesand nutrient concentrations in silver birch seedlings under five levels of daily UV-Bexposure and two relative nutrient addition rates. New Phytologist 150:121-131.
Rosenzweig, C. and Parry, M. 1994. Potential impacts of climate change on world food supply.Nature 367: 133-138.
Rozema, J., van de Staaij, J., Björn, L.O. & Caldwell, M. 1997. UV-B as an ienvironmentalfactor in plant life: stress and regulation. TREE 12(1),22-28.
Rupp, T.S., Chapin III, F.S., and Starfield, A.M., 2000b. Response of subarctic vegetation totransient climatic change on the Seward Peninsula in northwest Alaska. Global ChangeBiology 6, 541-555.

Ch13 - Forests, Land Management and Agriculture ACIA Scientific Report
External Review January 2004 13–124 DO NOT CIRCULATE OR CITE
Rupp, T.S., Chapin III, F.S., Starfield, A.M., and Duffy, P., 2002. Modeling boreal forestdynamics in interior Alaska. Climatic Change 55, 213-233.
Rupp, T.S., Starfield, A.M., and Chapin III, F.S., 2000a. A frame-based spatially explicit modelof subarctic vegetation response to climatic change: comparison with a point model.Landscape Ecology 15, 383-400.
Sanderson, M.A., Larnezos, T.P., and Matches, A.G. 1994. Morphological development ofalfalfa as a function of growing degree days. Journal of Production Agriculture 7: 239-242.
Schimel, D. S., House, J.I., Hibbard, K.A., Bousquet, P., Ciais, P., Peylin, P., Braswell, B.H.,Apps, M.J., Baker, D., Bondeau, A., Canadell, J., Churkina, G., Cramer, W., Denning,A.S., Field, C.B., Friedlingstein, P., Goodale, C., Heimann, M., Houghton, R. A., Melillo.2001. “Recent patterns and mechanisms of carbon exchange by terrestrial ecosystems.”Nature 414(6860): 169-173.
Schimel, D. S., VEMAP participants, Braswell, B.H. (1997). “Continental scale variability inecosystem processes: Models, data, and the role of disturbance.” Ecological Monographs67(2): 251-271.
Schimel, D.S., Braswell, B.H., Holland, E.A., Mckeown, R., Ojima, D.S., Painter, T.H., Parton,W.J., Townsend, A.R. 1994. Climatic, edaphic, and biotic controls over storage andturnover of carbon in soils. Global Biogeochemical Cycles 8 (3): 279-293.
Schlesinger, W. H. (1997). Biogeochemistry: An Analysis of Global Change, Academic Press.Schulze, E. -D., LLoyd, J., Kelliher, F. M., Wirth, C. , Rebmann, C., Luhker, B., Mund, M.,
Knohl, A., Milyukova, I. M., Schulze, W., Ziegler, W., Varlagin, A. B., Sogachev, A. F.,Valentini, R., Dore, S., Grigoriev, S., Kolle, O., Panfyorov, M. I., Tchebakova, N.,Vygodskaya, NN. 1999. Productivity of forest in the Eurosiberian boreal region and theirpotential to act as a carbon sink -- a synthesis. Global Change Biology 5:703-722.
Schnitzler J.P., Jungblut T.P., Feicht C., Kofferlein M., Langebartels, C., Heller, W., SandermanJr. H. 1997. UV-B induction of flavonoid biosynthesis in Scots pine (pinus sylvestris L.)seedlings. Trees – Structure and Function 11(3), 162-168.
Schweingruber F. H. Tree rings Basics and Applications of Dendrochronology. ReidelPublishers, Dordtrecht, 1988, 276 pp.
Schweingruber F.H. Tree Rings and Environment. Dendroecology. - Birmensdorf, Swiss FederalInstitute for Forest, Snow and Landscape Research. Berne, Stuttgart, Vienna, Haupt.1996, 609 p.
Searles, P.S., Flint, S.D., Caldwell, M.M. 2001. A meta-analysis of plant field studies simulatingstratospheric ozone depletion. Oecologia 127, 1-10.
Sharratt, B. 1992. Growing season trends in the Alaskan climate record. Arctic 45(2): 124-127.Sharratt, B. 1994. Observations and modeling of interactions between barley yield and
evapotranspiration in the subarctic. Agricultural Water Management 25: 109-119.Sharratt, B. 1999. Thermal requirements for barley maturation and leaf development in interior
Alaska. Field Crops Research 63: 179-184.Shashkin E.A., Vaganov E.A. Dynamics of stem basal area increment in trees from various
regions of Siberia related to global temperature changes. Lesovedenie (Russian Journal ofForestry), 2000, 3: 3-11. (In Russian).
Shaykewich, C.F and Blatta, D.A. 2001. Heat Units for Potato Production in Manitoba.Manitoba Agriculture, Soils and Crops Branch. Carman MB. 6p. Available at:http://www.gov.mb.ca/agriculture/climate/wac01s01.html.
Ch13 - Forests, Land Management and Agriculture ACIA Scientific Report
External Review January 2004 13–125 DO NOT CIRCULATE OR CITE
Shiyatov S.G. 1986. Dendrochronology of upper timberline in Polar Ural Mountains. Moscow,Nauka, 186 p. (in Russian).
Shiyatov S.G. 1993. The upper timberline dynamics during the last 1100 years in the Polar UralMountains. In: Oscillations of the Alpine and Polar Tree Limit in the Holocene. Stuttgart,Jena, New-York. Gustav Fischer Verlag, 195-203.
Shiyatov, S.G. 1966. The time of dispersion of Siberian larch seeds in north-western part of itsareal space and role of that factor in mutual relation between forest and tundra. In:Problems of physiology and geobotany. Publication of the Sverdlovsk Branch of the Ail-Union Botanical Society, Issue 4, 109-113 (in Russian).
Shiyatov, S.G. 1995. Reconstruction of climate and the upper timberline dynamics since AD 745by tree-ring data in the Polar Ural Mountains. Publication of the Academy of Finland,6/95, Painatusk-eskus, 144-147.
Shiyatov, S.G., Hantemirov, R.M., Schweingruber, F.H., Briffa, K.R. and Moell, M. 1996:Potential long-chronology development on the Northwest Siberian Plain: Early results.Dendrochronologia, 14, 13-29.
Shiyatov S.G., 2003. Rates of change in the upper treeline ecotone in the Polar Ural Mountains.PAGES News. 11(1): 8-10.
Shvidenko, A. Z. and S. Nilsson. 2000. Extent, distribution and ecological role of fire in Russianforests. Fire, Climate Change, and Carbon Cycling in the Boreal Forest. E. S. Kasischkeand B. J. Stocks. New York, Springer-Verlag: 132-150.
Shvidenko, A., Nilsson, S, Roshkov, V. 1997. Possibilities for Increased Carbon Sequestrationthrough the Implementation of Rational Forest Management in Russia. Water, Air & SoilPollution 94(1/2): 137-162.
Shriner,D.S., R.B.Street, R.Ball, D.D'Amours, K.Duncan, D.Kaiser, A.Maarouf, L.R.Mortsch,P.J.Mulholland, R.Neilson, J.A.Patz, J.D.Scheraga, J.G.Titus, H.Vaughan, M.Weltz, andet al. 1998. North America. Pages 255-330 in R.T.Watson, M.C.Zinyowera, R.H.Moss,and D.J.Dokken, editors. The Regional Impacts of Climate Change: An Assessment ofVulnerability. Intergovernmental Panel on Climate Change. Cambridge University Press,Cambridge, UK.
Sigurdsson, B. and Snorrason A. 2000: Carbon sequestration by afforestation and revegetation asmeans of limiting net-CO2 emissions in Iceland. Biotechnologie, Agronomie Société etEnvironnement 4(4): 303-307.
Sirois, L. 1999. The sustainibility of development in northern Quebec forests: socialopportunities and ecological challenges. Pp 17-27 In: In: Workshop on NorthernTimberline Forests: Environmental and Socio-economic Issues and Concerns. FinnishForest Research Institute. Kolari Research Station. 289pp.
Smith T.M., Weishampel J.F., Shugart H.H. The responce of terrestrial C storage to climatechange modeling C dynamics at varying spacial scales. Water, Air, and Soil pollution,1992, 64: 307-326.
Smith, W.B., Vissage, J.S., Darr, D.R., and Sheffield, R.M. 2001. Forest Resources of the UnitedStates, 1997. North Central Research Station, U.S. Department of Agriculture, ForestService. St. Paul, MN. 198 p.
Solberg, B.Ø., Hofgaard, A. and Hytteborn, H. 2002: Shifts in radial growth responses of coastalPicea abies induced by climatic change during the 20th century, Central Norway.Ecoscience 9: 79-88.

Ch13 - Forests, Land Management and Agriculture ACIA Scientific Report
External Review January 2004 13–126 DO NOT CIRCULATE OR CITE
Starfield, A.M., and Chapin III, F.S., 1996. Model of transient changes in arctic and borealvegetation in response to climate and land use change. Ecological Applications 6: 842-864.
Statistics Iceland. 2003. Iceland in figures 2002-2003, Volume 8. Hagstofa Islands. Reykjavik.Stocks, B. J., Fosberg, M. A., Lynham, T. J., Mearns, L., Wotton, B. M., Yang, Q. ; Jin, J-Z.,
Lawrence, K., Hartley, G. R., Mason, J. A., McKenny, D. W. (1998). “Climate Changeand Forest Fire Potential in Russian and Canadian Boreal Forests.” Climatic Change38(1): 1-13.
Stocks, B. J., M. A. Fosberg, et al. (2000). Climate change and forest fire activity in NorthAmerican boreal forests. Fire, Climate Change, and Carbon Cycling in the NorthAmerican Boreal Forest. E. S. Kasischke and B. J. Stocks. New York, Springer-Verlag:368-376.
Stocks, B.J. 1991. The extent and impact of fires in northern circumpolar countries. In: GlobalBiomass Burning, Atmospheric, Climatic, and Biospheric Implications (J.S. Levine, ed.),197-202. MIT Press, Cambridge, Mass.
Stuiver M., Reimer P.J. 1993. Extended 14C data base and revised Calib 3.0 14C age calibrationprogram. Radiocarbon, 35: 215-230.
Sullivan, J.H. and Teramura, A.H. 1992. The effects of ultraviolet-B radiation on loblolly pine.2. Growth of field-grown seedlings. Trees 6:115-120.
Sutinen M-L., Arora R. , Wisniewwski M., Ashworth E., Strimbeck R., Palta, J. 2001.mechanisms of frost survival and freeze-damage in nature. In: Birgas, F.J. & ColomboS.J. (Eds.) Conifer cold hardiness. Tree Physiology. Kluwer Academic Press, pp. 89 –120.
Swetnam, T. W., and Betancourt, J.L., 1990. Fire-Southern Oscillation relations in theSouthwestern United States. Science 249(4972): 1017-1020.
Takahama, U., and Oniki, T. 1997. A peroxidase/phenolics/ascorbate system can scavengehydrogen peroxide in plants. Physiologia Plantarum 101:845-852.
Taylor, R.M., Tobin, A.K. and Bray, C.M. 1997. DNA damage and repair in plants. In:Lumsden, P.J. (ed). Plants and UV-B, Responses to Environmental Change. CambridgeUniversity Press, Cambridge, pp 53-76.
Tchebakova N.M., Monserud R.A., Leemans R., Nazimova D.I. 1995. Possible vegetation shiftsin Siberia under climate change. Pp 67-82. In: Leemans. R., Elder. O., Pernetta ,J.(editors). Impacts of climatic change on ecosystems and species: Terrestrial ecosystems.Gland, Switzeland:IUCN.
Tegelberg, R., and Julkunen-Tiitto, R. 2001. Quantitative changes in secondary metabolites ofdark-leaved willow (Salix myrsinifolia) exposed to enhanced ultraviolet-B radiation.Physiologia Plantarum 113: 541-547.
Tegelberg, R., Julkunen-Tiitto, R. and Aphalo, P.J. (Accepted). The effects of long-term elevatedUV-B on phytochemicals in the bark of silver birch (Betula pendula). Tree Physiology.
Teramura, A. H., Sullivan, J. H., Effects of UV-B radiation on photosynthesis and growth ofterrestrial plants, Photosynthesis Research 1994, 39, 463-473.
Ter-Mikaelian, M., Furyaev ,V,.V., Antonovsky, M. I. 1991. A spatial forest dynamics modelregarding fires and climate change. In: Pp 298-314 Problems of ecological monitoringand ecosystem modeling, V.13, Leningrad, Gidrometeoizdat. (In Russian).
Ch13 - Forests, Land Management and Agriculture ACIA Scientific Report
External Review January 2004 13–127 DO NOT CIRCULATE OR CITE
Tikhomirov B.A., 1941. About the forest phase in the post-glacial history of vegetation in a northof Siberia and its relics in a modern tundra. Materials on Flora and Vegetation History ofUSSR. M.-L., V.1:315-374.
Trumbore, S. E., Harden, J.W., (1997). “Accumulation and turnover of carbon in organic andmineral soils of the BOREAS northern study area.” Journal of geophysical research103(D24): 28.
Turner, D. P., Koerper, G.J., Harmon, M.E., Lee, J.J. (1995). “A carbon budget for forests of theconterminous United States.” Ecological applications 5(2): 421-436.
Turner, M.G., Collins, S.L., Lugo, A.L., Magnuson, J.J. Rupp, T.S., Swanson, F.J. 2003.Disturbance Dynamics and Ecological Response: The Contribution of Long-termEcological Research. BioScience 53(1):46-56.
Turunen M., Heller, W., Stich, S., Sandermann, H. & Sutinen M-L. 1999. Effects of UVexclusion on phenolic compounds of young Scots pine seedlings in the subarctic.Environmental Pollution 106(2), 225-234.
Turunen M., Vogelmann T. & Smith W.K. 1998. Effective UV-screening in lodgepole pineneedles. In: De Kok L.J. & Stulen I (eds.) Responses of Plant metabolism to AirPollution. Backhuys Publishers. Leiden, The Netherlands, pp. 463-464.!
Turunen, M., Huttunen, S., Percy, K.E., McLaughlin C.K. & Lamppu, J. 1997: Epicuticular waxof subarctic Scots pine needles: response to sulphur and heavy metal deposition. NewPhytol. 135,501-515
Turunen, M., Sutinen, M-L., Derome K., Norokorpi Y. & Lakkala, K. 2002. Effects of solar UVradiation on birch and pine seedlings in the subarcitc. Polar record 38(206) 233-240.
USDA Forest Service. 1950-1999. Forest Insect and Disease Conditions in Alaska. (annualreports), Forest Health Protection, State and Private Forestry, Alaska Region, Anchorage.
Vaganov E.A., Briffa K.R., Naurzbaev M.M., Schweingruber F.H., Shiyatov S.G., Shishov V.V.Long-term climatic changes in the Arctic region of the Northern Hemisphere. DokladyEarth Sci., 2000, 375(8): 1314-1317.
Vaganov, E.A., A.V. Shashkin. Growth and tree ring structure of conifers. Nauka, Novosibirsk,2000, 232 p (In Russian).
Vaganov, E.A., Hughes, M.K., Kirdyanov, A.V., Schweingruber, F.H., Silkin, P.P. Influence ofsnowfall and melt timing on tree growth in subarctic Eurasia. Nature, 1999, 400:149–151.
Vaganov, E.A., Shiyatov S.G., Hantemirov R.M., Naurzbaev M.M. Summer temperaturevariations in high latitudes of the Northern Hemisphere during last 1,5 millennium:comparative analysis tree-ring and ice core data. Doklady AN, 1998, 338(5):681-684.
Vaganov, E.A., Shiyatov S.G., Mazepa V.S. Dendroclimatic studies in Ural-Siberian Subarctic -Novosibirsk: Nauka. 1996 b. 246 p. (in Russian).
Valentini, R., Dore, S., Marchi, G., Mollicone, D., Panfyorov, M., Rebmann, C., Kolle, O.,Schulze, E.-D. (2000). “Carbon and water exchanges of two contrasting central Siberialandscape types: regenerating forest and bog.” Functional Ecology 14(1): 87-96.
Van Cleve, K. C., F. S., III. ; Dyrness, C. T., Viereck, L.A., (1991). “Element cycling in Taigaforests: State-factor control.” Bioscience 41(2): 78-88.
Van Cleve, K., Viereck, L.A. (1983). “A comparison of successional sequences following fire onpermafrost-dominated and permafrost-free sites in interior Alaska.” Permafrost: FourthInternational Conference, Proceedings: 1286-1291.

Ch13 - Forests, Land Management and Agriculture ACIA Scientific Report
External Review January 2004 13–128 DO NOT CIRCULATE OR CITE
Viereck, L. A., K. Van Cleve, et al. (1986). Forest ecosystem distribution in the taigaenvironment. Forest ecosystems in the Alaskan taiga. K. Van Cleve, F. S. Chapin III, P.W. Flanagan, L. A. Viereck and C. T. Dyrness. New York, Springer-Verlag: 22-43.
Viereck, L.A., 1970. Forest succession and soil development adjacent to the Chena River ininterior Alaska. Arctic and Alpine Research 2, 1-26.
Vitousek, P. M., Howarth, R.W. (1991). “Nitrogen limitation on land and in the sea: How can itoccur?” Biogeochemistry 13(2): 87-116.
Volney, W.J.A. and Fleming, R.A. 2000. Climate change and impacts of boreal forest insects.Agriculture, Ecosystems and Environment. 82(1-3): 283-294.
Wahlen M., Allen D., Deck B., Herchenroder A. Initial measurements of CO2 concentrations(1530-1940 AD) in air occluded in the GIPS2 ice core from central Greenland. Geophys.Res. Letts., 1991, 18: 1457-1460.
Wang, C., Gower, S.T., Wang, Y., Zhao, H., Yan, P., Bond-Lamberty, B.P., (2001). “Theinfluence of fire on carbon distribution and net primary production of boreal Larixgmelinii forests in north-eastern China.” GLobal Change Biology 7(6): 719-730.
Warrick, R.A. 1988. Carbon dioxide, climate change and agriculture. The Geographical Journal154: 221-233.
Werner, R.A. 1996. Forest health in boreal ecosystems of Alaska. The Forestry Chronicle 72(1)43-46.
Werner, R. A. and E. H. Holsten. 1985 Factors influencing generation times of spruce beetles inAlaska, Canadian Journal of Forest Research 15:438-443.
Whelan, R.J. 1995. The ecology of fire. New York: Cambridge University Press. 346 p.Whitham, T.G. 1989. Plant hybrid zones as sinks for pests. Science 244:1490-1493.Whitham, T.G., P.A. Morrow, and B.M. Potts. 1994. Plant hybrid zones as centers of
biodiversity: The herbivore community of two endemic Tasmanian eucalypts. Oecologia97:481-490.
Wiles, G. C., R. D. D'Arrigo, et al. (1996). "Temperature changes along the Gulf of Alaska andthe Pacific Northwest coast modeled from coastal tree rings." Canadian Journal ofForestry Research 26.
Witter, D. (compiler). 2004. Forest health conditions in Alaska, 2003. USDA Forest Service.General Technical Report R10 TP 123. 82 p.
Wright, H.E. Jr. 1974. Landscape development, forest fires, and wilderness management.Science 186, 487-495.
Wright, H.E. Jr. 1983. Introduction. Pp. xi-xvii In: Wright, H.E. Jr. editor. Late-Quaternaryenvironments of the United States, Volume 2, The Holocene. University of MinnesotaPress. Minneapolis, Minnesota. 277 p.
Wright, H.E. Jr. and Barnosky, C.W. 1984. Introduction to the English Edition. Pp. xiii-xxii In:Velichko, A.A. editor. Late-Quaternary environments of the Soviet Union. University ofMinnesota Press. Minneapolis, Minnesota. 327 p.
Yamasaki, H., Sakihama, Y. and Ikehara, N. 1997. Flavenoid-peroxidase reaction as adetoxification mechanism of plants against H2O2. Plant Physiology 115:1405-1412.
Yarie, J. (1981). “Forest fire cycles and life tables: a case study from interior Alaska.” CanadianJournal of Forest Research 11(3): 554-562.
Zackrisson, O. (1977). “Influence of forest fires on the North Swedish boreal forest.” Oikos 29:22-32.

Ch13 - Forests, Land Management and Agriculture ACIA Scientific Report
External Review January 2004 13–129 DO NOT CIRCULATE OR CITE
Zielinski G.A., Mayewski P.A., Meeker L.D., Whitlow S., Twickler M.S., Morrison M., MeeseD.A., Gow A.G., Alley R.B. Record of volcanism since 7000 BC from the GISP2Greenland ice core and implications for the volcano-climate system. Science, 1994, 264:948-951.
Zimov, S. A., Davidov, S.P., Zimova, G.M., Davidova, A.I., Chapin, F.S., Chapin, M.C.,Reynolds, J.F. (1999). “Contribution of Disturbance to increasing seasonal amplitude ofatmospheric CO2.” Science 284: 1973-1976.

Ch13 - Forests, Land Management and Agriculture ACIA Scientific Report
External Review January 2004 13–130 DO NOT CIRCULATE OR CITE
Table 13.01. Species names of trees in this chapter.
Listed in order of scientific name:
Listed in order of common name:
alder Alnus spp.aspen (European) Populus tremula L.aspen (North American) Populus tremuloides Michx.birch, downy Betula pubescens Ehrh.birch, dwarf Betula nana L.birch, mountain Betula pubescens subps. Czerepanovibirch, silver Betula pendula Rothchosenia Chosenia arbutifolia (Pall.)A. Skvorts.cottonwood, black Populus trichocarpa Torr. and Gray.fir Abies spp.juniper/cedar, creeping Juniperus communis L.larch, Cajander Larix cajanderi Mayr.larch, Gmelin Larix gmelinii Rupr.larch, Russian Larix sukaczewii Dyl.larch, Siberian Larix sibirica Ledeb.pine, lodgepole Pinus contorta Doug. ex Loudpine, Scots Pinus sylvestris!L.poplar, balsam Populus balsamifera Lrowan Sorbus aquipariaspruce, black Picea mariana (Mill.) B.S.P.spruce, Lutz Picea X lutzii Littlespruce, Siberian Picea obovata Ledebspruce, Sitka Picea sitchensis Bong. Carr.spruce, white Picea glauca (Moench) Vosstamarack Larix laricina (Du Roi) K. Kochwillow Salix spp.willow, dark-leaved Salix myrsinifolia Saillisb.willow, hairy Salix lanata L.willow, tea-leaved Salix phylicifolia L.

Ch13 - Forests, Land Management and Agriculture ACIA Scientific Report
External Review January 2004 13–131 DO NOT CIRCULATE OR CITE
Table 13.02. Total forest area and percentage of world forest occurring in nations that includeterritory in the Arctic.
Nation Total forest area (mill. ha) % of world forest
Russia 851.4 22.4 1
Canada 244.6 6.4 1
U.S.A. (all) 302.4 8.0 1
Finland 21.9 .6 1
Sweden 27.1 .7 1
Norway 8.8 .2 1
Iceland .034 NA 1
Total in Arctic nations 1456.2 38.3
World total 3,800 100.0
U.S.A. (Alaska boreal only) 35.0 .9 2
Sources:http://www.fs.fed.us/r10/spf/facts/spffact.htmSmith et al.( 2001)
1 “forest” category (FAO 2002)
2 “boreal forest” category (Labau and van Hees 1990)

Ch13 - Forests, Land Management and Agriculture ACIA Scientific Report
External Review January 2004 13–132 DO NOT CIRCULATE OR CITE
Table 13.03. Growing degree -day requirements to reach maturity for various annual crops.
Crop Growing degree days using5oC base
Growing degree days using0oC base
Peas (green for processing) 700-800 1000Spring barley 700-900 1200-1500Peas (for seed) 800-1150 1500-1700Oats 1300-1700Canola 950-1050 1350-1550Potatoes 1000-1100 -Spring wheat 1000-1200 1400-1650Dry beans 1100-1500Sunflowers (for seed) - 1800-2000References: Anon. 1996-2000; Ash et al. 1999; Miller et al. 2001; Dofing and Knight 1994;Dofing 1992; Juskiw et al. 2001; Nuttonsson 1955, 1957; Sharratt 1999.
Table 13.04. GDD (base 5oC) required for 3 forage crops to reach optimum stage for harvest.Crop GDD
Alfalfa 350-450Red clover 450Timothy 350-450References: Bootsma, 1984, Breazeale, 1999.
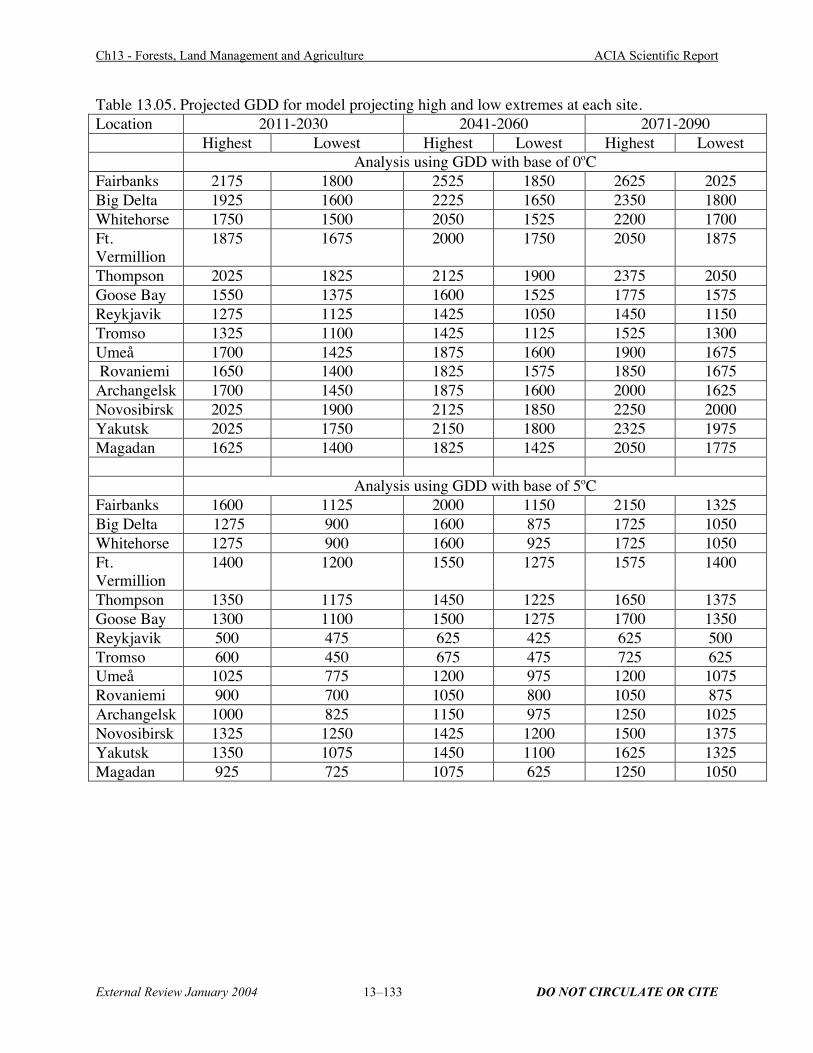
Ch13 - Forests, Land Management and Agriculture ACIA Scientific Report
External Review January 2004 13–133 DO NOT CIRCULATE OR CITE
Table 13.05. Projected GDD for model projecting high and low extremes at each site.Location 2011-2030 2041-2060 2071-2090
Highest Lowest Highest Lowest Highest LowestAnalysis using GDD with base of 0oC
Fairbanks 2175 1800 2525 1850 2625 2025Big Delta 1925 1600 2225 1650 2350 1800Whitehorse 1750 1500 2050 1525 2200 1700Ft.Vermillion
1875 1675 2000 1750 2050 1875
Thompson 2025 1825 2125 1900 2375 2050Goose Bay 1550 1375 1600 1525 1775 1575Reykjavik 1275 1125 1425 1050 1450 1150Tromso 1325 1100 1425 1125 1525 1300Umeå 1700 1425 1875 1600 1900 1675 Rovaniemi 1650 1400 1825 1575 1850 1675Archangelsk 1700 1450 1875 1600 2000 1625Novosibirsk 2025 1900 2125 1850 2250 2000Yakutsk 2025 1750 2150 1800 2325 1975Magadan 1625 1400 1825 1425 2050 1775
Analysis using GDD with base of 5oCFairbanks 1600 1125 2000 1150 2150 1325Big Delta 1275 900 1600 875 1725 1050Whitehorse 1275 900 1600 925 1725 1050Ft.Vermillion
1400 1200 1550 1275 1575 1400
Thompson 1350 1175 1450 1225 1650 1375Goose Bay 1300 1100 1500 1275 1700 1350Reykjavik 500 475 625 425 625 500Tromso 600 450 675 475 725 625Umeå 1025 775 1200 975 1200 1075Rovaniemi 900 700 1050 800 1050 875Archangelsk 1000 825 1150 975 1250 1025Novosibirsk 1325 1250 1425 1200 1500 1375Yakutsk 1350 1075 1450 1100 1625 1325Magadan 925 725 1075 625 1250 1050

Ch13 - Forests, Land Management and Agriculture ACIA Scientific Report
External Review January 2004 13–134 DO NOT CIRCULATE OR CITE
Table 13.6. Projected water deficits (mm) for model projecting high and low extreme at eachsite.Location 2011-2030 2041-2060 2071-2090
Highest Lowest Highest Lowest Highest Lowest
Fairbanks 250 166 282 207 311 253Whitehorse 150 116 287 165 321 265Ft.Vermillion
324 148 355 168 371 218
Thompson 335 132 394 157 413 169Goose Bay 22 -122 62 -151 58 -125Reykjavik 184 -20 216 -15 241 68Tromso 84 -31 117 14 134 44Umeå 217 139 250 163 262 173Rovaniemi 185 51 233 111 226 145Archangelsk 191 -7 232 26 231 31Novosibirsk 389 126 414 127 469 149Yakutsk 289 152 315 161 328 165Magadan 224 117 238 164 269 180

Ch13 - Forests, Land Management and Agriculture ACIA Scientific Report
External Review January 2004 13–135 DO NOT CIRCULATE OR CITE
Table 13.07. Statistical characteristics of larch tree ring-width chronologies from different
locations along the Central Eurasian IGBP transect.
Latitude N of sites/ N oftrees
Mean TRW(mm)
Correlation withmaster chronology
Coefficient ofsensitivity
710
690
640
610
570
510
4/48
3/557/71
5/78
3/284/3/33
0.19
0.210.24
0.37
0.530.46
0.80
0.820.67
0.66
0.580.68
0.42
0.400.34
0.28
0.210.37
Table 13.08. Statistical characteristics of pine ring-width chronologies from different locationsalong the Central Eurasian IGBP transect.
Latitude N of sites/ N oftrees
Mean TRW(mm)
Correlation withmaster chronology
Coefficient ofsensitivity
660
610
580
530
1/19
3/242/24
4/2/16
0.32
0.360.52
0.62
0.65
0.600.55
0.65
0.30
0.220.21
0.32

Ch13 - Forests, Land Management and Agriculture ACIA Scientific Report
External Review January 2004 13–136 DO NOT CIRCULATE OR CITE
Table 13.09. Area changes of different types of forest-tundra ecosystems from 1910 to 2000 inthe Polar Ural Mountains (From Shiyatov 2003).
Forest-tundra ecosystem typesTime Tundra with
individual treesSparse growth of
treesOpen forest Closed forest
1910 2403 ha 349 ha 328 ha 5 haRate of change -76 ha/decade +37 ha/decade +24 ha/decade +15 ha/decade
1960 2021 ha 535 ha 450 ha 79 haRate of change -26 ha/decade -52 ha/decade +36 ha/decade +42 ha/decade
2000 1917 ha 327 ha 593 ha 258 ha

Ch13 - Forests, Land Management and Agriculture ACIA Scientific Report
External Review January 2004 13–137 DO NOT CIRCULATE OR CITE
Table 13.10 Rates of elevation change at the treeline ecotone in the Polar Ural Mountains duringthe last 1150 years. (From Shiyatov 2003).
In: .pdf file