Forestry Department - Home | Food and Agriculture ... Department Food and Agriculture Organization...
60
Forestry Department Food and Agriculture Organization of the United Nations FRA2010/094 Rome, 2010 GLOBAL FOREST RESOURCES ASSESSMENT 2010 COUNTRY REPORT INDIA
Transcript of Forestry Department - Home | Food and Agriculture ... Department Food and Agriculture Organization...

Forestry Department Food and Agriculture Organization of the United Nations
FRA2010/094
Rome, 2010
GLOBAL FOREST RESOURCES
ASSESSMENT 2010
COUNTRY REPORT
INDIA
2
The Forest Resources Assessment Programme Sustainably managed forests have multiple environmental and socio-economic functions important at the global, national and local scales, and play a vital part in sustainable development. Reliable and up-to-date information on the state of forest resources - not only on area and area change, but also on such variables as growing stock, wood and non-wood products, carbon, protected areas, use of forests for recreation and other services, biological diversity and forests’ contribution to national economies - is crucial to support decision-making for policies and programmes in forestry and sustainable development at all levels.
FAO, at the request of its member countries, regularly monitors the world’s forests and their management and uses through the Forest Resources Assessment Programme. This country report forms part of the Global Forest Resources Assessment 2010 (FRA 2010). The reporting framework for FRA 2010 is based on the thematic elements of sustainable forest management acknowledged in intergovernmental forest-related fora and includes variables related to the extent, condition, uses and values of forest resources, as well as the policy, legal and institutional framework related to forests. More information on the FRA 2010 process and the results - including all the country reports - is available on the FRA Web site (www.fao.org/forestry/fra ). The Global Forest Resources Assessment process is coordinated by the Forestry Department at FAO headquarters in Rome. The contact person for matters related to FRA 2010 is: Mette Løyche Wilkie Senior Forestry Officer FAO Forestry Department Viale delle Terme di Caracalla Rome 00153, Italy E-mail: [email protected] Readers can also use the following e-mail address: [email protected]
DISCLAIMER The designations employed and the presentation of material in this information product do not imply the expression of any opinion whatsoever on the part of the Food and Agriculture Organization of the United Nations concerning the legal status of any country, territory, city or area or of its authorities, or concerning the delimitation of its frontiers or boundaries. The Global Forest Resources Assessment Country Report Series is designed to document and make available the information forming the basis for the FRA reports. The Country Reports have been compiled by officially nominated country correspondents in collaboration with FAO staff. Prior to finalisation, these reports were subject to validation by forestry authorities in the respective countries.

FRA 2010 – Country Report, India
3
Contents
ABOUT THE REPORT ............................................................................ERROR! BOOKMARK NOT DEFINED.
1 TABLE T1 – EXTENT OF FOREST AND OTHER WOODED LAND..................................................... 6
2 TABLE T2 – FOREST OWNERSHIP AND MANAGEMENT RIGHTS ................................................. 11
3 TABLE T3 – FOREST DESIGNATION AND MANAGEMENT .............................................................. 15
4 TABLE T4 – FOREST CHARACTERISTICS ........................................................................................... 20
5 TABLE T5 – FOREST ESTABLISHMENT AND REFORESTATION................................................... 24
6 TABLE T6 – GROWING STOCK................................................................................................................ 26
7 TABLE T7 – BIOMASS STOCK................................................................................................................. 30
8 TABLE T8 – CARBON STOCK .................................................................................................................. 33
9 TABLE T9 – FOREST FIRES...................................................................................................................... 36
10 TABLE T10 – OTHER DISTURBANCES AFFECTING FOREST HEALTH AND VITALITY ........... 39
11 TABLE T11 – WOOD REMOVALS AND VALUE OF REMOVALS ..................................................... 43
12 TABLE T12 – NON-WOOD FOREST PRODUCTS REMOVALS AND VALUE OF REMOVALS... 46
13 TABLE T13 – EMPLOYMENT .................................................................................................................... 49
14 TABLE T14 – POLICY AND LEGAL FRAMEWORK ............................................................................. 53
15 TABLE T15 – INSTITUTIONAL FRAMEWORK ...................................................................................... 55
16 TABLE T16 – EDUCATION AND RESEARCH ....................................................................................... 57
17 TABLE T17 – PUBLIC REVENUE COLLECTION AND EXPENDITURE ........................................... 59

FRA 2010 – Country Report, India
4
Report preparation and contact persons The present report was prepared by the following person(s):
Name
(FAMILY NAME,
First name)
Institution / address E-mail Fax Tables
Dr D.Pandey
Forest Survey of
India, Kaulagarh
Road, Dehradun -
248195
[email protected] +91-135-2759104
Mr Subhash Ashutosh
Forest Survey of
India, Kaulagarh
Road, Dehradun -
248195
[email protected] +91-135-2755037
Mr Rajesh Kumar
Forest Survey of
India, Kaulagarh
Road, Dehradun -
248195
[email protected] +91-135-2754507
Mr Prakash Lakhchaura
Forest Survey of
India, Kaulagarh
Road, Dehradun -
248195
[email protected] +91-135-2754507
FRA 2010 – Country Report, India
5
About the Report
Forest Survey of India (FSI) is a national organisation under the Ministry of Environment and Forests and mandated to assess the India’s forest resource periodically. Forest cover and its characteristics are assessed every two year using remote sensing technology with wall to wall approach. Growing stock and its distribution into diameter class and species, biomass stock and carbon stock are estimated through National Forest Inventory (NFI) using sample based approach. During NFI the field parties also observe the incidence of forest fire ocularly within and around sample plot in two ha area. Detection of forest fire through remote sensing technology, web based rapid response system, has also started sine November 2004. The studies of FSI are published every two year coinciding with forest cover assessment in State of Forest Report. In last two decades 10 such reports have been published which forms the most reliable basis of information about India’s forest resource. The first nine (9) tables presented in this report are mainly based on the FSI’s studies.
The Indian Council of Forestry Research and Education (ICFRE), a national organisation mandated for forestry research and education has been given the responsibility by the Ministry of Environment and Forests to produce reports on forestry statistics of India periodically. Such reports are compiled by collecting data from the state forest departments. Forestry Statistics India of ICFRE has formed the second important source of information for this report and data in the tables 11, 12, 13 and 17 has largely come from such report.
In addition, the state forest departments who own and manages the forests of the country were also contacted to provide data on the employment, human other disturbances to forests etc of their states. The Ministry of Environment and Forests and Indian Institute of Forest Management (IIFM) were also contacted to provide information on policy, area under sustainable forest management (SFM) and other issues.
The quality of data on biomass and carbon stock is likely to improve in the final report with the conclusion of the new study undertaken by FSI. The information on fuelwood and human resource and employment is being further improved.
Dr. D.Pandey Director General Forest Survey of India Kaulagarh Road, PO: IPE Dehradun-248195, India E-mail: [email protected]

FRA 2010 – Country Report, India
6
1 Table T1 – Extent of Forest and Other wooded land
1.1 FRA 2010 Categories and definitions
Category Definition
Forest Land spanning more than 0.5 hectares with trees higher than 5 meters and a canopy cover of more than 10 percent, or trees able to reach these thresholds in situ. It does not include land that is predominantly under agricultural or urban land use.
Other wooded land Land not classified as “Forest”, spanning more than 0.5 hectares; with trees higher than 5 meters and a canopy cover of 5-10 percent, or trees able to reach these thresholds in situ; or with a combined cover of shrubs, bushes and trees above 10 percent. It does not include land that is predominantly under agricultural or urban land use.
Other land All land that is not classified as “Forest” or “Other wooded land”.
Other land with tree cover (Subordinated to “Other land”)
Land classified as “Other land”, spanning more than 0.5 hectares with a canopy cover of more than 10 percent of trees able to reach a height of 5 meters at maturity.
Inland water bodies Inland water bodies generally include major rivers, lakes and water reservoirs.
1.2 National data
1.2.1 Data sources
References to sources of information
Quality (H/M/L)
Variable(s) Year(s) (Data
Period)
Additional comments
State of Forest Report
1997. Forest Survey of
India, MOEF, GOI, India.
H Extent 1990, 1994
State of Forest Report
1999. Forest Survey of
India, MOEF, GOI, India.
H Extent 1997
State of Forest Report,
2001. Forest Survey of
India, MOEF, GOI, India.
H Extent 2000
State of Forest Report,
2003. Forest Survey of
India, MOEF, GOI, India.
H Extent Oct 2002-Jan
2003
State of Forest Report,
2005. Forest Survey of
India, MOEF, GOI, India.
H Extent Oct 2004-Jan
2005
(Note MOEF= Ministry of Environment and Forests and GOI= Government of India)
1.2.2 Classification and definitions
The following table (SFR, 2005) provides the classification and sub-classification and their
definitions in use at Forest Survey of India, Ministry of Environment and Forests, India. The
“Forest Cover” includes very dense forests, moderately dense forests and open forests
including mangroves cover.

FRA 2010 – Country Report, India
7
National class Definition
Forest Cover All lands, more than one hectare in area, with a tree canopy density of more
than 10 percent. (Such lands may not be statutorily notified as forest area).
Very Dense Forest All lands, with a forest cover with canopy density of 70 percent and above.
Moderately Dense
Forest
All lands, with a forest cover with canopy density of 40-70 percent
Open Forest All lands, with forest cover with canopy density of 10 to 40 percent.
Mangrove Cover Mangrove forest is salt tolerant forest ecosystem found mainly in tropical and
sub-tropical coastal and/or inter-tidal regions. Mangrove cover is the area
covered under mangrove vegetation as interpreted digitally from remote sensing
data. It is a part of forest cover and also classified into three classes viz. very
dense, moderately dense and open.
Non Forest Land Lands without any forest cove.
Recorded Forest Area Geographic areas recorded as forests in Government records.
Scrub All lands, generally in and around forest areas, having bushes and or poor tree
growth chiefly small or stunted trees with canopy density less than 10 percent.
Tree Cover It comprises tree patches (blocks and linear) outside the recorded forest area
exclusive of forest cover and less than the minimum mapable area of 1 ha. The
areas of scattered trees are computed notionally.
Trees Outside Forests Trees growing outside Recorded Forest Areas
1.2.3 Original data
The following table presents the national data on forest cover in India compiled from biennial
“State of Forest Report (SFR)”of FSI as updated and revised in the last report (SFR 2005).
(Note: 1. NF= Non Forest. It includes 31407 (000 ha) of Inland water bodies .
* the areas of mangroves though separately shown are already included in very dense
,moderately dense and open forest categories. In the sub-total of forest cover of 2000, 2002
and 2004, the areas of mangroves have to be excluded.
Until 1997, the mangrove was a separate category of forest cover and it was not possible to
classify it into dense and open categories. Since 2000, the mangrove cover was classified into
three categories namely very dense, moderately dense and open and hence the same was
merged with forest cover. The figure of mangrove cover shown for 2000, 2002 and 2004 has
already been included under, VDF, MDF and OF. Hence sub-total and total will not match
for these years. Since mangrove is an eco-system and hence separately shown.
Extent in “000” ha Category
Sub-Category 1990 1992 1994 1997 2000 2002 2004
Very dense 5 452 6 457 Moderately Dense
38 514 38 532 36 726 37 736 39 517
33 406 33 265
Open 24 999 24 903 26 131 25 506 25 873 28 924 28 987
Mangrove 426 453 483 487 448* 445* 445*
Forest Cover
Sub-Total 63 939 63 888 63 340 63 729 65 390 67 782 67 709
Tree Cover - - - 8 147 9 990 9 166
Scrub 5 894 6 052 5 270 5 190 4 732 4 027 3 848
Other NF1
258 893 258 786 260 116 259 807 250 457 246 927 248 003 Non Forest Sub-Total 264 787 264 838 265 386 264 997 263 336 260 944 261 017 Country Total Area TOTAL
328 726 328 726 328 726 328 726 328 726 328 726 328 726
FRA 2010 – Country Report, India
8
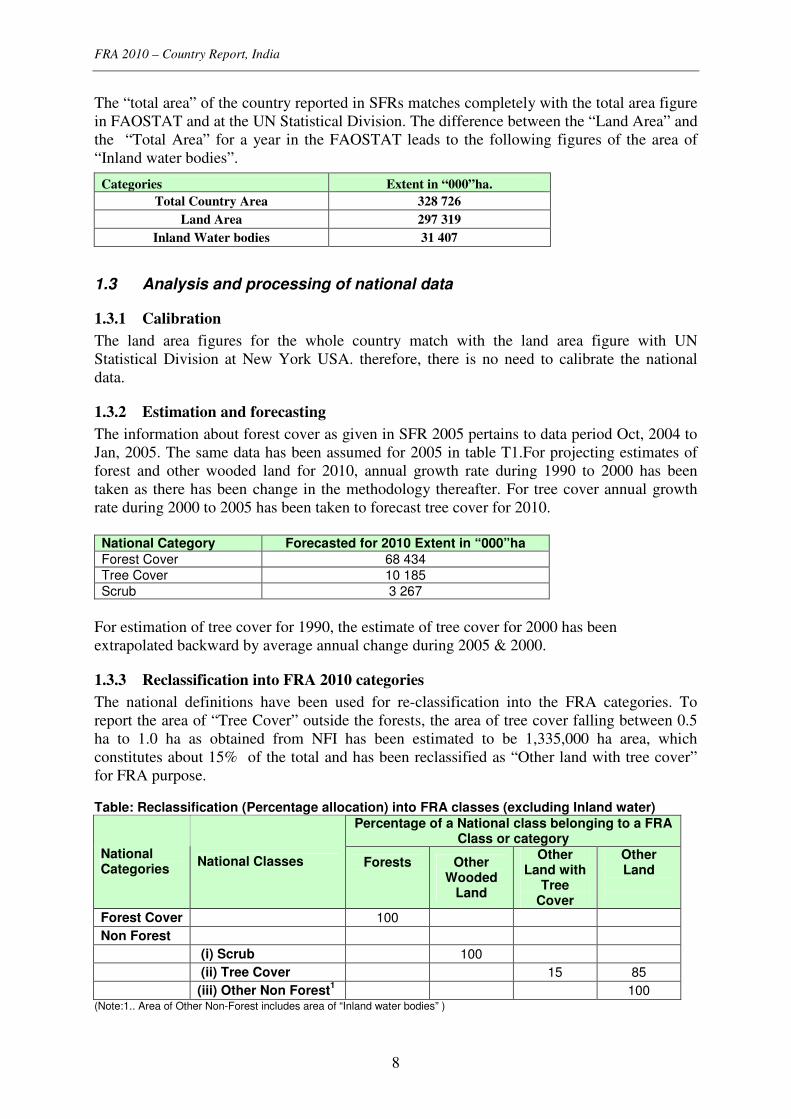
The “total area” of the country reported in SFRs matches completely with the total area figure
in FAOSTAT and at the UN Statistical Division. The difference between the “Land Area” and
the “Total Area” for a year in the FAOSTAT leads to the following figures of the area of
“Inland water bodies”.
1.3 Analysis and processing of national data
1.3.1 Calibration
The land area figures for the whole country match with the land area figure with UN
Statistical Division at New York USA. therefore, there is no need to calibrate the national
data.
1.3.2 Estimation and forecasting
The information about forest cover as given in SFR 2005 pertains to data period Oct, 2004 to
Jan, 2005. The same data has been assumed for 2005 in table T1.For projecting estimates of
forest and other wooded land for 2010, annual growth rate during 1990 to 2000 has been
taken as there has been change in the methodology thereafter. For tree cover annual growth
rate during 2000 to 2005 has been taken to forecast tree cover for 2010.
National Category Forecasted for 2010 Extent in “000”ha
Forest Cover 68 434
Tree Cover 10 185
Scrub 3 267
For estimation of tree cover for 1990, the estimate of tree cover for 2000 has been
extrapolated backward by average annual change during 2005 & 2000.
1.3.3 Reclassification into FRA 2010 categories
The national definitions have been used for re-classification into the FRA categories. To
report the area of “Tree Cover” outside the forests, the area of tree cover falling between 0.5
ha to 1.0 ha as obtained from NFI has been estimated to be 1,335,000 ha area, which
constitutes about 15% of the total and has been reclassified as “Other land with tree cover”
for FRA purpose. Table: Reclassification (Percentage allocation) into FRA classes (excluding Inland water)
Percentage of a National class belonging to a FRA Class or category
National Categories
National Classes Forests
Other Wooded
Land
Other Land with
Tree Cover
Other Land
Forest Cover 100
Non Forest
(i) Scrub 100
(ii) Tree Cover 15 85
(iii) Other Non Forest1 100
(Note:1.. Area of Other Non-Forest includes area of “Inland water bodies” )
Categories Extent in “000”ha.
Total Country Area 328 726
Land Area 297 319
Inland Water bodies 31 407
FRA 2010 – Country Report, India
9
FSI does not separately provide the area of “Inland Water bodies” but includes it in the Non-
Forest Area. The figures of the total area of India reported by FSI and the UN Statistical
Division and FAOSTAT match, therefore, the area of “Inland Water bodies” (31.407 million
ha.) as reported by UN Statistical division is being used as national data as well as FRA data.
The area figure for Inland water bodies in the UN Statistical database is the same for 1990
and 2000, and the same is being assumed for 2005 and 2010.
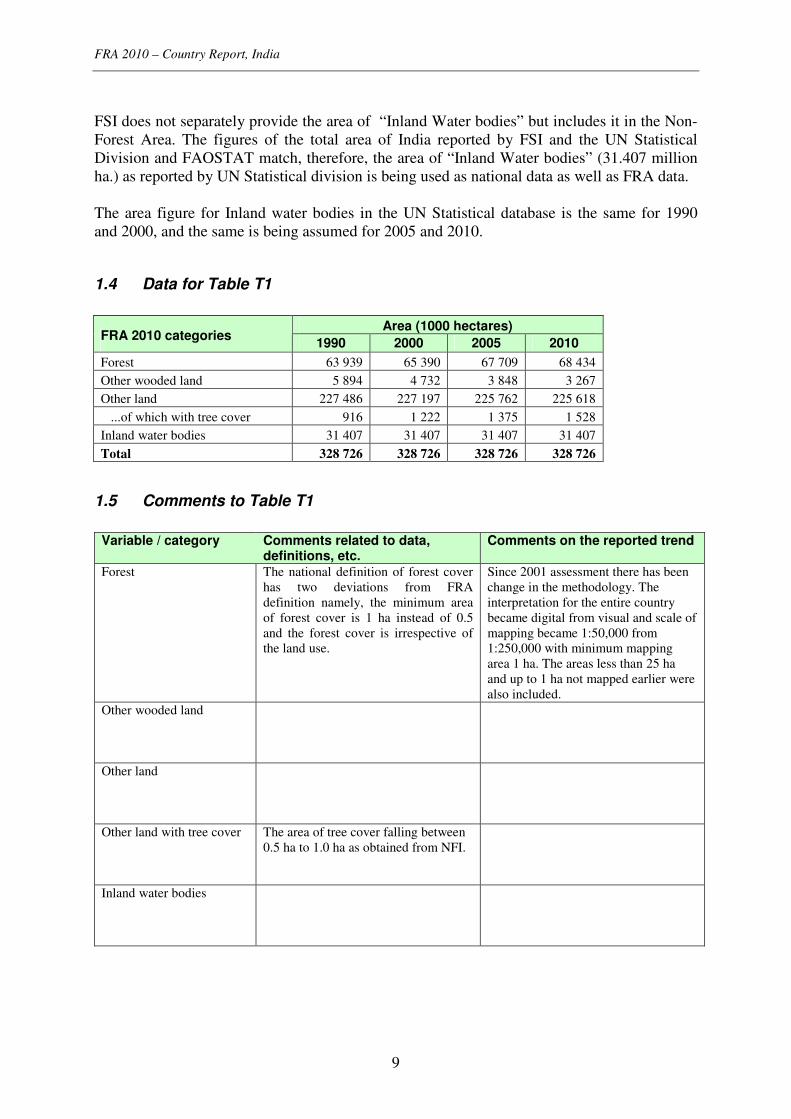
1.4 Data for Table T1
Area (1000 hectares)
FRA 2010 categories 1990 2000 2005 2010
Forest 63 939 65 390 67 709 68 434
Other wooded land 5 894 4 732 3 848 3 267
Other land 227 486 227 197 225 762 225 618
...of which with tree cover 916 1 222 1 375 1 528
Inland water bodies 31 407 31 407 31 407 31 407
Total 328 726 328 726 328 726 328 726
1.5 Comments to Table T1
Variable / category Comments related to data,
definitions, etc. Comments on the reported trend
Forest The national definition of forest cover
has two deviations from FRA
definition namely, the minimum area
of forest cover is 1 ha instead of 0.5
and the forest cover is irrespective of
the land use.
Since 2001 assessment there has been
change in the methodology. The
interpretation for the entire country
became digital from visual and scale of
mapping became 1:50,000 from
1:250,000 with minimum mapping
area 1 ha. The areas less than 25 ha
and up to 1 ha not mapped earlier were
also included.
Other wooded land
Other land
Other land with tree cover The area of tree cover falling between
0.5 ha to 1.0 ha as obtained from NFI.
Inland water bodies
FRA 2010 – Country Report, India
10
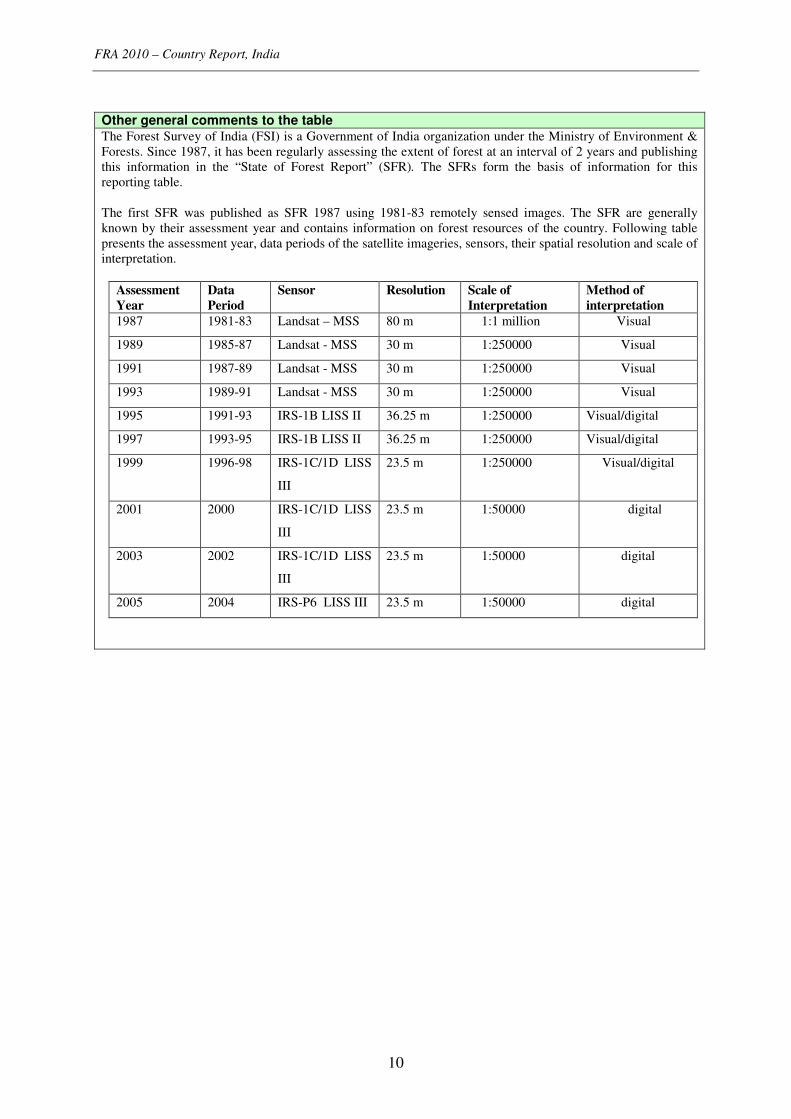
Other general comments to the table The Forest Survey of India (FSI) is a Government of India organization under the Ministry of Environment &
Forests. Since 1987, it has been regularly assessing the extent of forest at an interval of 2 years and publishing
this information in the “State of Forest Report” (SFR). The SFRs form the basis of information for this
reporting table.
The first SFR was published as SFR 1987 using 1981-83 remotely sensed images. The SFR are generally
known by their assessment year and contains information on forest resources of the country. Following table
presents the assessment year, data periods of the satellite imageries, sensors, their spatial resolution and scale of
interpretation.
Assessment
Year
Data
Period
Sensor Resolution Scale of
Interpretation
Method of
interpretation
1987 1981-83 Landsat – MSS 80 m 1:1 million Visual
1989 1985-87 Landsat - MSS 30 m 1:250000 Visual
1991 1987-89 Landsat - MSS 30 m 1:250000 Visual
1993 1989-91 Landsat - MSS 30 m 1:250000 Visual
1995 1991-93 IRS-1B LISS II 36.25 m 1:250000 Visual/digital
1997 1993-95 IRS-1B LISS II 36.25 m 1:250000 Visual/digital
1999 1996-98 IRS-1C/1D LISS
III
23.5 m 1:250000 Visual/digital
2001 2000 IRS-1C/1D LISS
III
23.5 m 1:50000 digital
2003 2002 IRS-1C/1D LISS
III
23.5 m 1:50000 digital
2005 2004 IRS-P6 LISS III 23.5 m 1:50000 digital

FRA 2010 – Country Report, India
11
2 Table T2 – Forest ownership and management rights
2.1 FRA 2010 Categories and definitions
Category Definition Public ownership Forest owned by the State; or administrative units of the public
administration; or by institutions or corporations owned by the public
administration.
Private ownership Forest owned by individuals, families, communities, private co-operatives,
corporations and other business entities, private religious and educational
institutions, pension or investment funds, NGOs, nature conservation
associations and other private institutions.
Individuals
(sub-category of Private
ownership)
Forest owned by individuals and families.
Private business entities and
institutions
(sub-category of Private
ownership)
Forest owned by private corporations, co-operatives, companies and other
business entities, as well as private non-profit organizations such as NGOs,
nature conservation associations, and private religious and educational
institutions, etc.
Local communities
(sub-category of Private
ownership)
Forest owned by a group of individuals belonging to the same community
residing within or in the vicinity of a forest area. The community members
are co-owners that share exclusive rights and duties, and benefits contribute
to the community development.
Indigenous / tribal
communities
(sub-category of Private
ownership)
Forest owned by communities of indigenous or tribal people.
Other types of ownership Other kind of ownership arrangements not covered by the categories above.
Also includes areas where ownership is unclear or disputed.
Categories related to the holder of management rights of public forest resources Public Administration
The Public Administration (or institutions or corporations owned by the
Public Administration) retains management rights and responsibilities
within the limits specified by the legislation.
Individuals/households Forest management rights and responsibilities are transferred from the
Public Administration to individuals or households through long-term
leases or management agreements.
Private institutions
Forest management rights and responsibilities are transferred from the
Public Administration to corporations, other business entities, private co-
operatives, private non-profit institutions and associations, etc., through
long-term leases or management agreements.
Communities
Forest management rights and responsibilities are transferred from the
Public Administration to local communities (including indigenous and
tribal communities) through long-term leases or management agreements.
Other form of management
rights Forests for which the transfer of management rights does not belong to any
of the categories mentioned above.

FRA 2010 – Country Report, India
12
2.2 National data
2.2.1 Data sources
References to sources of information
Quality (H/M/L)
Variable(s) Year(s) Additional comments
State of Forest Report 1993.
Forest Survey of India,
MOEF, GOI, India.
H Recorded forest
area
1990
State of Forest Report 1997.
Forest Survey of India,
MOEF, GOI, India.
H Extent, Recorded
forest area
1990
State of Forest Report,
2005. Forest Survey of
India, MOEF, GOI, India.
H Extent, Recorded
forest area,
Management rights
2000,
2005
National Forest Inventory
Database of FSI
H Ownership 2005
2.2.2 Classification and definitions
The Forest Survey of India (FSI) is a Government of India organization under the Ministry of
Environment & Forests. Since 1987, it has been regularly assessing the extent of forest at an
interval of 2 years and publishing this information in the “State of Forest Report” (SFR).
The SFR also contains information on legal status of forests which has three categories (a)
Reserved forests, (b) Protected forests and (c) Un-classed forests. The first two categories of
forests are “owned by government”. The ownership of un-classed forests varies from state to
state and includes forest owned by private individuals, communities and local bodies besides
government.
National class Definition
Reserved Forest An area notified under the provisions of the Indian Forest Act or other State Forest
Acts, having full degree of protection.
Explanation: In reserved forests all activities are prohibited unless permitted. Their
ownership belongs to government.
Protected Forests An area notified under the provisions of the Indian Forest Act or other State Forest
Acts, having limited degree of protection.
Explanation: In protected forest all activities are permitted unless prohibited. Their
ownership belongs to government.
Un-Classed Forests An area recorded as forest in government land records but not notified as reserved
or protected forest under Indian Forest Act or Other State Forest Acts.
Explanation: Level of protection and Ownership status of such forests varies from
state to state.
2.2.3 Original data
The figures of reserved, protected and un-classed forests has been taken from the published
SFRs. These figures are provided by the provinces which are compiled at the Forest Survey of
India. These areas may or may not consist of tree or forest cover but in the government
FRA 2010 – Country Report, India
13
records they fall in the category of forests. The trees outside the boundaries of these forests
are known as TOF.
2.3 Analysis and processing of national data
2.3.1 Calibration
Not required.
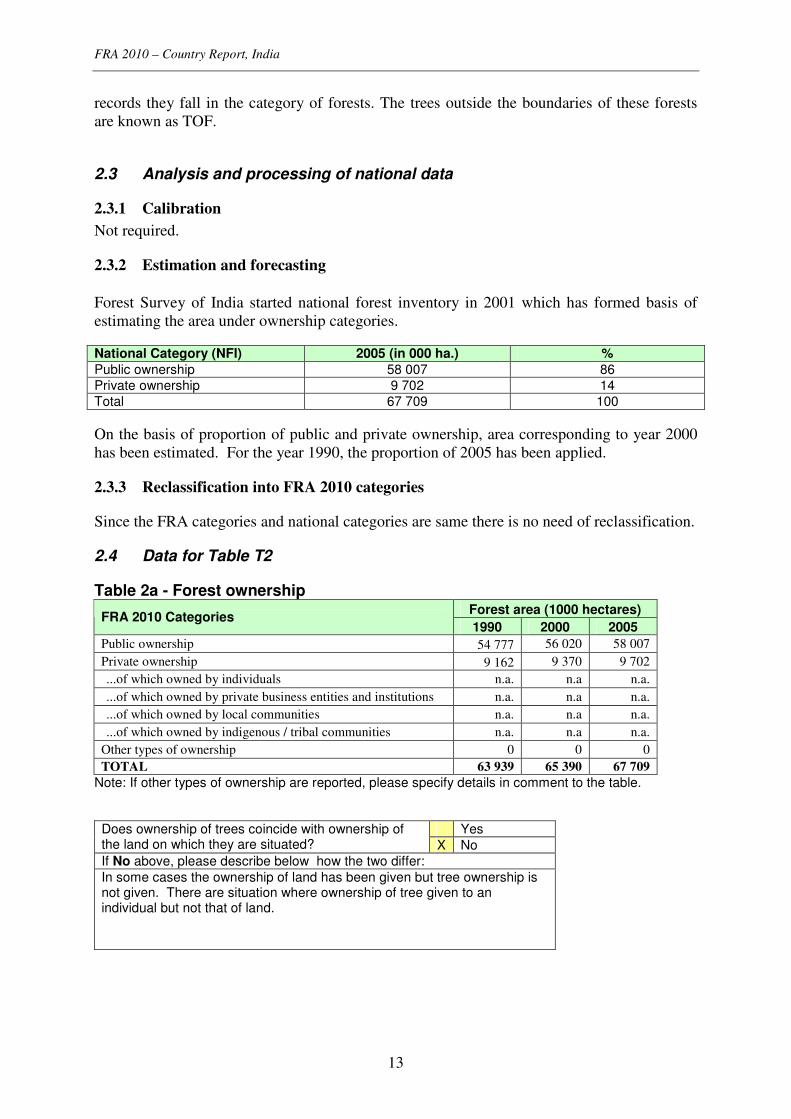
2.3.2 Estimation and forecasting
Forest Survey of India started national forest inventory in 2001 which has formed basis of
estimating the area under ownership categories. National Category (NFI) 2005 (in 000 ha.) %
Public ownership 58 007 86
Private ownership 9 702 14
Total 67 709 100
On the basis of proportion of public and private ownership, area corresponding to year 2000
has been estimated. For the year 1990, the proportion of 2005 has been applied.
2.3.3 Reclassification into FRA 2010 categories
Since the FRA categories and national categories are same there is no need of reclassification.
2.4 Data for Table T2
Table 2a - Forest ownership Forest area (1000 hectares)
FRA 2010 Categories 1990 2000 2005
Public ownership 54 777 56 020 58 007
Private ownership 9 162 9 370 9 702
...of which owned by individuals n.a. n.a n.a.
...of which owned by private business entities and institutions n.a. n.a n.a.
...of which owned by local communities n.a. n.a n.a.
...of which owned by indigenous / tribal communities n.a. n.a n.a.
Other types of ownership 0 0 0
TOTAL 63 939 65 390 67 709
Note: If other types of ownership are reported, please specify details in comment to the table.
Yes Does ownership of trees coincide with ownership of the land on which they are situated? X No
If No above, please describe below how the two differ:
In some cases the ownership of land has been given but tree ownership is not given. There are situation where ownership of tree given to an individual but not that of land.

FRA 2010 – Country Report, India
14
Table 2b - Holder of management rights of public forests
Forest area (1000 hectares) FRA 2010 Categories
1990 2000 2005
Public Administration n.a. 45 771 36 453
Individuals n.a. 0 0
Private corporations and institutions n.a. 0 0
Communities n.a. 10 249 21 554
Other n.a. 0 0
TOTAL n.a. 56 020 58 007
2.5 Comments to Table T2
Variable / category
Comments related to data, definitions, etc.
Comments on the reported trend
Public ownership
Private
ownership
There are some tribal communities mainly
in north eastern regions which own forest.
However, information on the extent of
such areas are not reliably available.
Other types of
ownership
Management
rights
In 2000 and 2005, the areas under
communities management are those which
are managed under Joint Forest
Management (JFM). The JFM was
initiated in 1990. Hence estimates of 1990
are not available.
FRA 2010 – Country Report, India
15
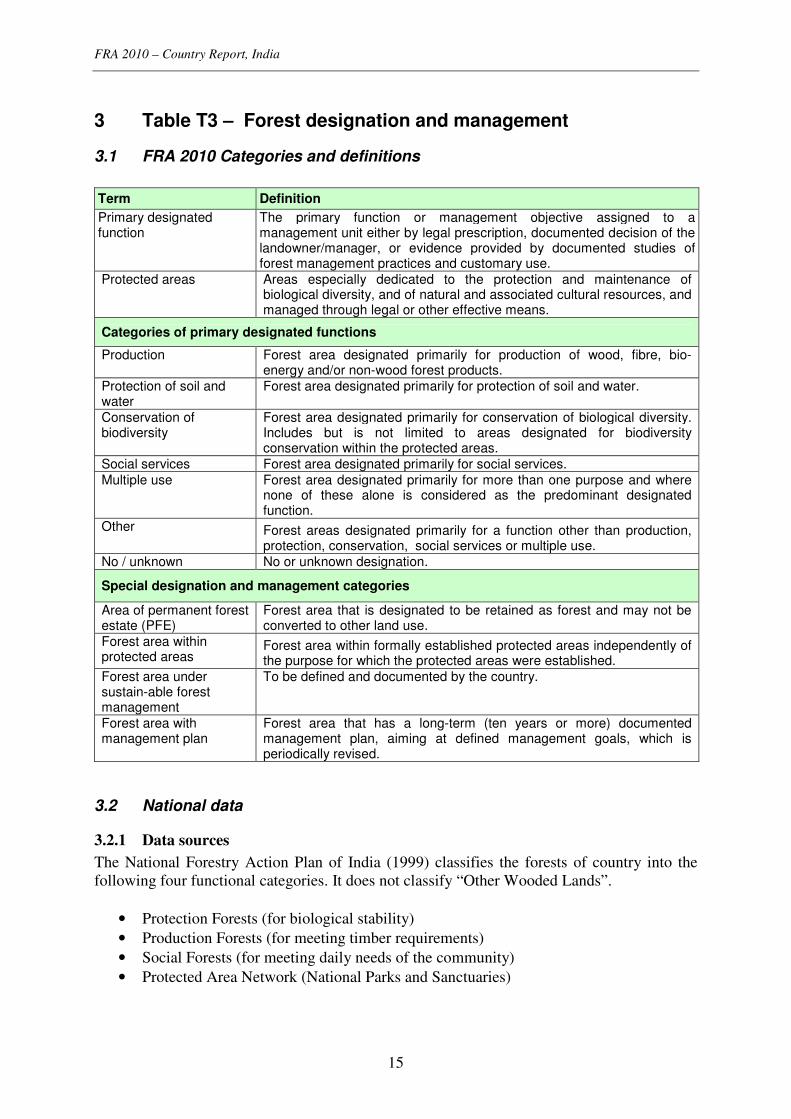
3 Table T3 – Forest designation and management
3.1 FRA 2010 Categories and definitions
Term Definition
Primary designated function
The primary function or management objective assigned to a management unit either by legal prescription, documented decision of the landowner/manager, or evidence provided by documented studies of forest management practices and customary use.
Protected areas Areas especially dedicated to the protection and maintenance of biological diversity, and of natural and associated cultural resources, and managed through legal or other effective means.
Categories of primary designated functions
Production Forest area designated primarily for production of wood, fibre, bio-energy and/or non-wood forest products.
Protection of soil and water
Forest area designated primarily for protection of soil and water.
Conservation of biodiversity
Forest area designated primarily for conservation of biological diversity. Includes but is not limited to areas designated for biodiversity conservation within the protected areas.
Social services Forest area designated primarily for social services.
Multiple use Forest area designated primarily for more than one purpose and where none of these alone is considered as the predominant designated function.
Other Forest areas designated primarily for a function other than production, protection, conservation, social services or multiple use.
No / unknown No or unknown designation.
Special designation and management categories
Area of permanent forest estate (PFE)
Forest area that is designated to be retained as forest and may not be converted to other land use.
Forest area within protected areas
Forest area within formally established protected areas independently of the purpose for which the protected areas were established.
Forest area under sustain-able forest management
To be defined and documented by the country.
Forest area with management plan
Forest area that has a long-term (ten years or more) documented management plan, aiming at defined management goals, which is periodically revised.
3.2 National data
3.2.1 Data sources
The National Forestry Action Plan of India (1999) classifies the forests of country into the
following four functional categories. It does not classify “Other Wooded Lands”.
• Protection Forests (for biological stability)
• Production Forests (for meeting timber requirements)
• Social Forests (for meeting daily needs of the community)
• Protected Area Network (National Parks and Sanctuaries)
FRA 2010 – Country Report, India
16
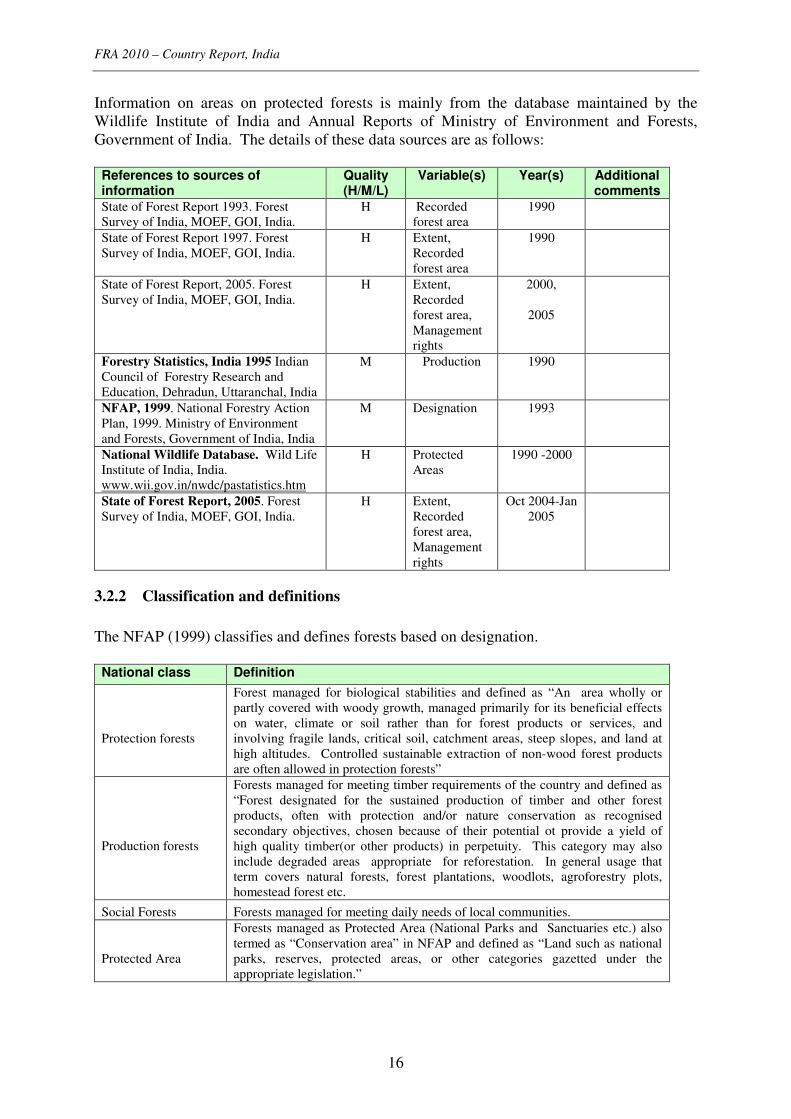
Information on areas on protected forests is mainly from the database maintained by the
Wildlife Institute of India and Annual Reports of Ministry of Environment and Forests,
Government of India. The details of these data sources are as follows:
References to sources of information
Quality (H/M/L)
Variable(s) Year(s) Additional comments
State of Forest Report 1993. Forest
Survey of India, MOEF, GOI, India.
H Recorded
forest area
1990
State of Forest Report 1997. Forest
Survey of India, MOEF, GOI, India.
H Extent,
Recorded
forest area
1990
State of Forest Report, 2005. Forest
Survey of India, MOEF, GOI, India.
H Extent,
Recorded
forest area,
Management
rights
2000,
2005
Forestry Statistics, India 1995 Indian
Council of Forestry Research and
Education, Dehradun, Uttaranchal, India
M Production 1990
NFAP, 1999. National Forestry Action
Plan, 1999. Ministry of Environment
and Forests, Government of India, India
M Designation 1993
National Wildlife Database. Wild Life
Institute of India, India.
www.wii.gov.in/nwdc/pastatistics.htm
H Protected
Areas 1990 -2000
State of Forest Report, 2005. Forest
Survey of India, MOEF, GOI, India.
H Extent,
Recorded
forest area,
Management
rights
Oct 2004-Jan
2005
3.2.2 Classification and definitions
The NFAP (1999) classifies and defines forests based on designation.
National class Definition
Protection forests
Forest managed for biological stabilities and defined as “An area wholly or
partly covered with woody growth, managed primarily for its beneficial effects
on water, climate or soil rather than for forest products or services, and
involving fragile lands, critical soil, catchment areas, steep slopes, and land at
high altitudes. Controlled sustainable extraction of non-wood forest products
are often allowed in protection forests”
Production forests
Forests managed for meeting timber requirements of the country and defined as
“Forest designated for the sustained production of timber and other forest
products, often with protection and/or nature conservation as recognised
secondary objectives, chosen because of their potential ot provide a yield of
high quality timber(or other products) in perpetuity. This category may also
include degraded areas appropriate for reforestation. In general usage that
term covers natural forests, forest plantations, woodlots, agroforestry plots,
homestead forest etc.
Social Forests Forests managed for meeting daily needs of local communities.
Protected Area
Forests managed as Protected Area (National Parks and Sanctuaries etc.) also
termed as “Conservation area” in NFAP and defined as “Land such as national
parks, reserves, protected areas, or other categories gazetted under the
appropriate legislation.”
FRA 2010 – Country Report, India
17
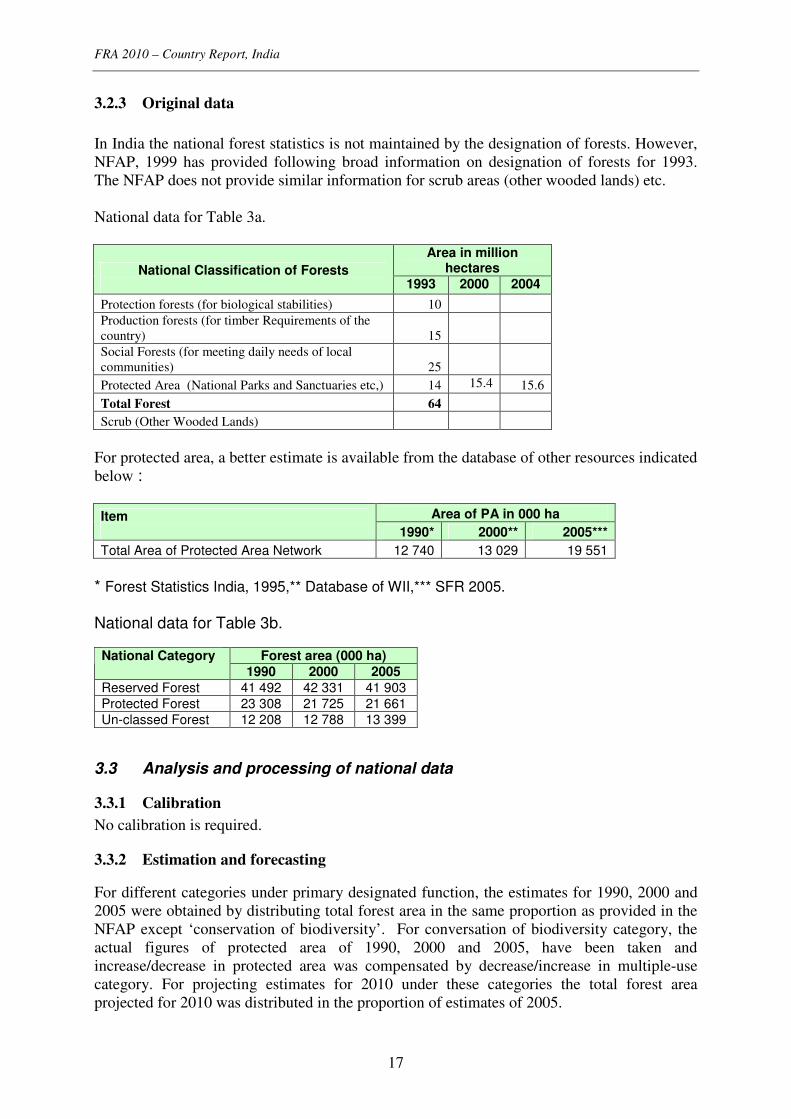
3.2.3 Original data
In India the national forest statistics is not maintained by the designation of forests. However,
NFAP, 1999 has provided following broad information on designation of forests for 1993.
The NFAP does not provide similar information for scrub areas (other wooded lands) etc.
National data for Table 3a.
Area in million
hectares National Classification of Forests 1993 2000 2004
Protection forests (for biological stabilities) 10
Production forests (for timber Requirements of the
country) 15
Social Forests (for meeting daily needs of local
communities) 25
Protected Area (National Parks and Sanctuaries etc,) 14 15.4 15.6
Total Forest 64
Scrub (Other Wooded Lands)
For protected area, a better estimate is available from the database of other resources indicated
below :
Area of PA in 000 ha Item 1990* 2000** 2005***
Total Area of Protected Area Network 12 740 13 029 19 551
* Forest Statistics India, 1995,** Database of WII,*** SFR 2005.
National data for Table 3b.
Forest area (000 ha) National Category
1990 2000 2005
Reserved Forest 41 492 42 331 41 903
Protected Forest 23 308 21 725 21 661
Un-classed Forest 12 208 12 788 13 399
3.3 Analysis and processing of national data
3.3.1 Calibration
No calibration is required.
3.3.2 Estimation and forecasting
For different categories under primary designated function, the estimates for 1990, 2000 and
2005 were obtained by distributing total forest area in the same proportion as provided in the
NFAP except ‘conservation of biodiversity’. For conversation of biodiversity category, the
actual figures of protected area of 1990, 2000 and 2005, have been taken and
increase/decrease in protected area was compensated by decrease/increase in multiple-use
category. For projecting estimates for 2010 under these categories the total forest area
projected for 2010 was distributed in the proportion of estimates of 2005.
FRA 2010 – Country Report, India
18
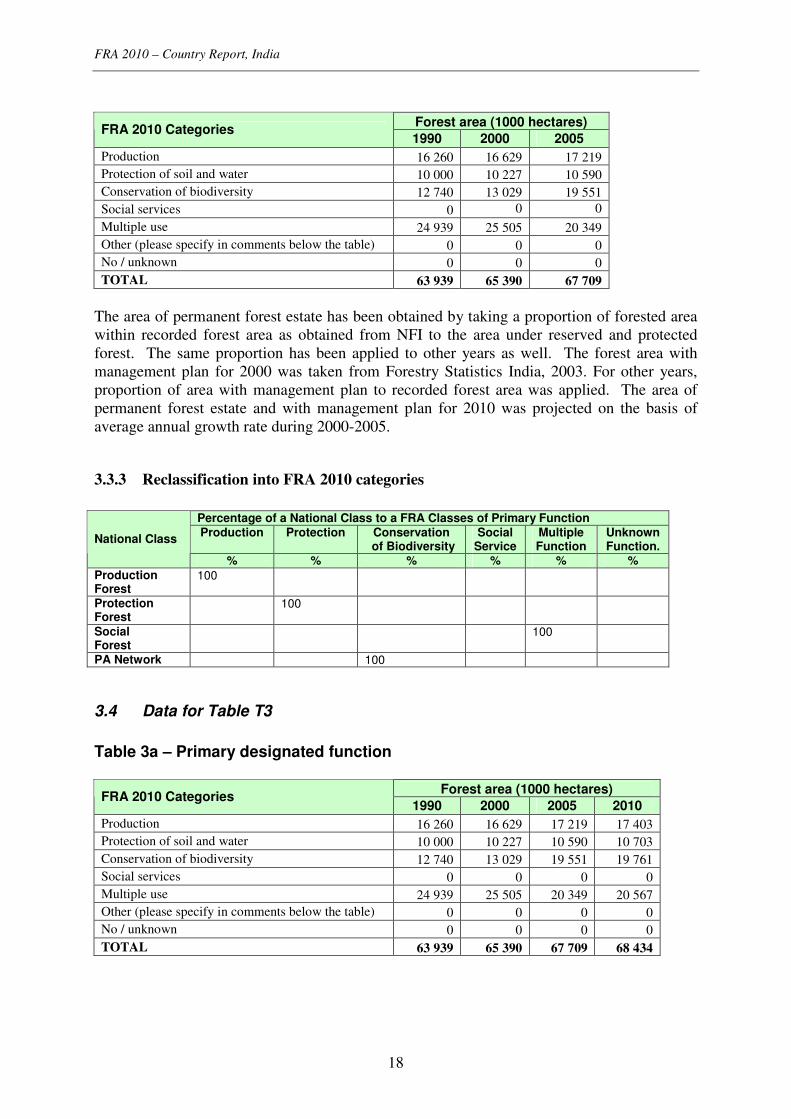
Forest area (1000 hectares)
FRA 2010 Categories 1990 2000 2005
Production 16 260 16 629 17 219
Protection of soil and water 10 000 10 227 10 590
Conservation of biodiversity 12 740 13 029 19 551
Social services 0 0 0
Multiple use 24 939 25 505 20 349
Other (please specify in comments below the table) 0 0 0
No / unknown 0 0 0
TOTAL 63 939 65 390 67 709
The area of permanent forest estate has been obtained by taking a proportion of forested area
within recorded forest area as obtained from NFI to the area under reserved and protected
forest. The same proportion has been applied to other years as well. The forest area with
management plan for 2000 was taken from Forestry Statistics India, 2003. For other years,
proportion of area with management plan to recorded forest area was applied. The area of
permanent forest estate and with management plan for 2010 was projected on the basis of
average annual growth rate during 2000-2005.
3.3.3 Reclassification into FRA 2010 categories
Percentage of a National Class to a FRA Classes of Primary Function
Production Protection
Conservation of Biodiversity
Social Service
Multiple Function
Unknown Function.
National Class
% % % % % %
Production Forest
100
Protection Forest
100
Social Forest
100
PA Network 100
3.4 Data for Table T3
Table 3a – Primary designated function
Forest area (1000 hectares) FRA 2010 Categories
1990 2000 2005 2010
Production 16 260 16 629 17 219 17 403
Protection of soil and water 10 000 10 227 10 590 10 703
Conservation of biodiversity 12 740 13 029 19 551 19 761
Social services 0 0 0 0
Multiple use 24 939 25 505 20 349 20 567
Other (please specify in comments below the table) 0 0 0 0
No / unknown 0 0 0 0
TOTAL 63 939 65 390 67 709 68 434
FRA 2010 – Country Report, India
19
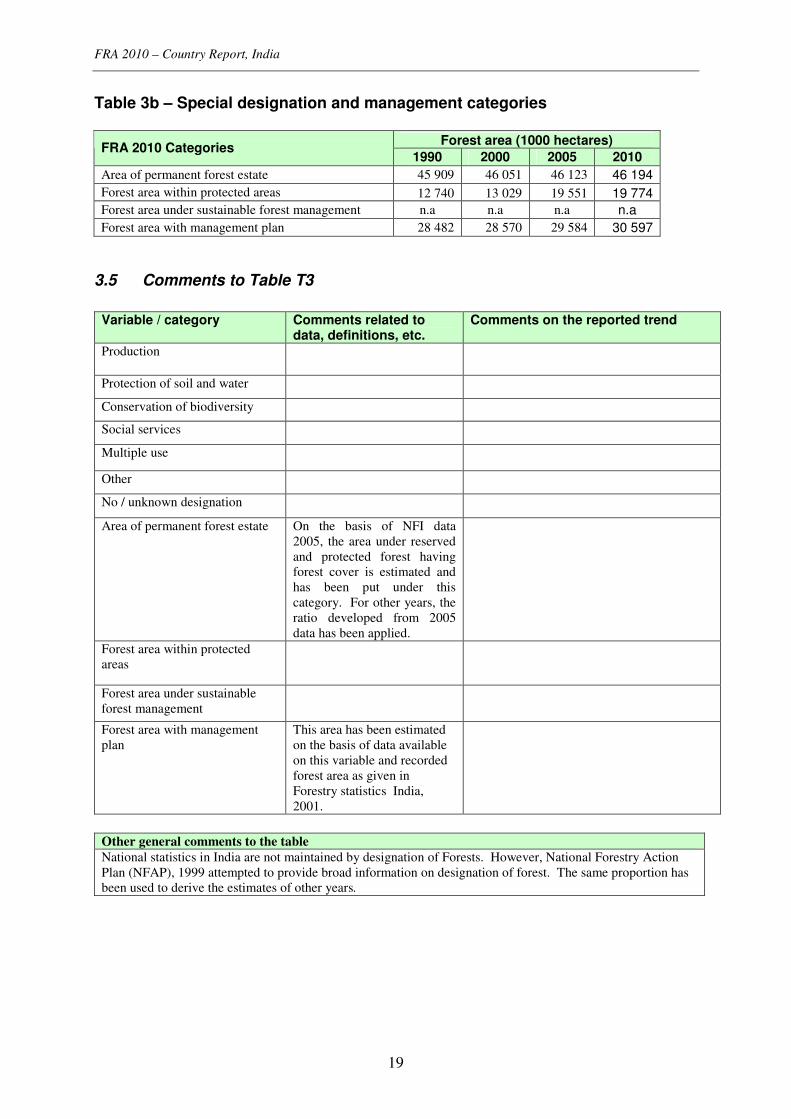
Table 3b – Special designation and management categories
Forest area (1000 hectares) FRA 2010 Categories
1990 2000 2005 2010
Area of permanent forest estate 45 909 46 051 46 123 46 194
Forest area within protected areas 12 740 13 029 19 551 19 774
Forest area under sustainable forest management n.a n.a n.a n.a Forest area with management plan 28 482 28 570 29 584 30 597
3.5 Comments to Table T3
Variable / category Comments related to
data, definitions, etc. Comments on the reported trend
Production
Protection of soil and water
Conservation of biodiversity
Social services
Multiple use
Other
No / unknown designation
Area of permanent forest estate On the basis of NFI data
2005, the area under reserved
and protected forest having
forest cover is estimated and
has been put under this
category. For other years, the
ratio developed from 2005
data has been applied.
Forest area within protected
areas
Forest area under sustainable
forest management
Forest area with management
plan
This area has been estimated
on the basis of data available
on this variable and recorded
forest area as given in
Forestry statistics India,
2001.
Other general comments to the table
National statistics in India are not maintained by designation of Forests. However, National Forestry Action
Plan (NFAP), 1999 attempted to provide broad information on designation of forest. The same proportion has
been used to derive the estimates of other years.
FRA 2010 – Country Report, India
20
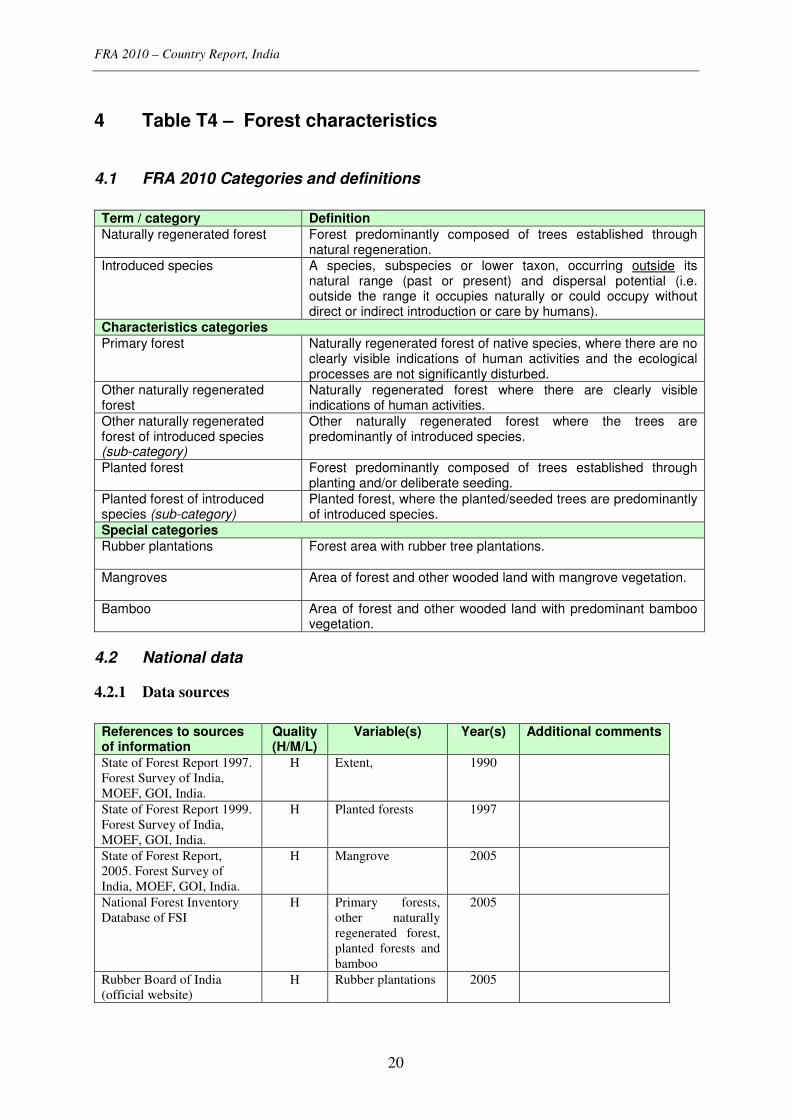
4 Table T4 – Forest characteristics
4.1 FRA 2010 Categories and definitions
Term / category Definition
Naturally regenerated forest Forest predominantly composed of trees established through natural regeneration.
Introduced species A species, subspecies or lower taxon, occurring outside its natural range (past or present) and dispersal potential (i.e. outside the range it occupies naturally or could occupy without direct or indirect introduction or care by humans).
Characteristics categories
Primary forest Naturally regenerated forest of native species, where there are no clearly visible indications of human activities and the ecological processes are not significantly disturbed.
Other naturally regenerated forest
Naturally regenerated forest where there are clearly visible indications of human activities.
Other naturally regenerated forest of introduced species (sub-category)
Other naturally regenerated forest where the trees are predominantly of introduced species.
Planted forest Forest predominantly composed of trees established through planting and/or deliberate seeding.
Planted forest of introduced species (sub-category)
Planted forest, where the planted/seeded trees are predominantly of introduced species.
Special categories
Rubber plantations Forest area with rubber tree plantations.
Mangroves Area of forest and other wooded land with mangrove vegetation.
Bamboo Area of forest and other wooded land with predominant bamboo vegetation.
4.2 National data
4.2.1 Data sources
References to sources of information
Quality (H/M/L)
Variable(s) Year(s) Additional comments
State of Forest Report 1997.
Forest Survey of India,
MOEF, GOI, India.
H Extent, 1990
State of Forest Report 1999.
Forest Survey of India,
MOEF, GOI, India.
H Planted forests 1997
State of Forest Report,
2005. Forest Survey of
India, MOEF, GOI, India.
H Mangrove 2005
National Forest Inventory
Database of FSI
H Primary forests,
other naturally
regenerated forest,
planted forests and
bamboo
2005
Rubber Board of India
(official website)
H Rubber plantations 2005

FRA 2010 – Country Report, India
21
4.2.2 Classification and definitions
National class Definition
Mangrove cover
Mangrove forest is salt tolerant forest ecosystem found mainly in tropical and sub-tropical coastal and/or inter-tidal regions. Mangrove cover is the area covered under mangrove vegetation as interpreted digitally from remote sensing data. It is a part of forest cover and also classified into three classes viz. very dense, moderately dense and open.
Bamboo A forest having bamboo crop in more than 25 % of its area is treated as bamboo forest as per the crop classification used for NFI.
4.2.3 Original data
Area (1000 hectares) Categories
1990 2000 2005
Rubber plantations (Forest) 563 597
Mangroves 426 448 445
Bamboo 5418
Categories 2005
Primary Forest 15701
Other naturally regenerated forest 42522
4.3 Analysis and processing of national data
4.3.1 Calibration
No calibration is required
4.3.2 Estimation and forecasting
The estimate of primary forest, other naturally regenerated forest and planted forest have been
generated from NFI data. The primary and other naturally regenerated forest for 2010 has
been assumed to be same as in 2005. The increase in the forest cover in 2010 will be
attributed to planted forest only. The area of introduced species in planted forest has been
estimated from plantation data as given in SFR 1999. For other years the data of 2005 is
assumed to be valid.
Forecasted area (1000 hectares) FRA 2010 Categories
2010
Primary forest 15 701
Other naturally regenerated forest 42 522
...of which of introduced species
Planted forest 10 258
...of which of introduced species 1 344
TOTAL 68 481
Rubber plantation area is available for 2000 and 2005. For estimating area for 2010, annual
growth rate during 2000 to 2005 has been taken. The same growth rate has been applied
backward to estimate area under rubber plantations for 1990. Area under mangroves is
available from SFR 2005. For estimating area of mangroves for 2010, annual growth rate
during 1990 to 2000 has been taken. The area under bamboo for 2005 has been estimated on
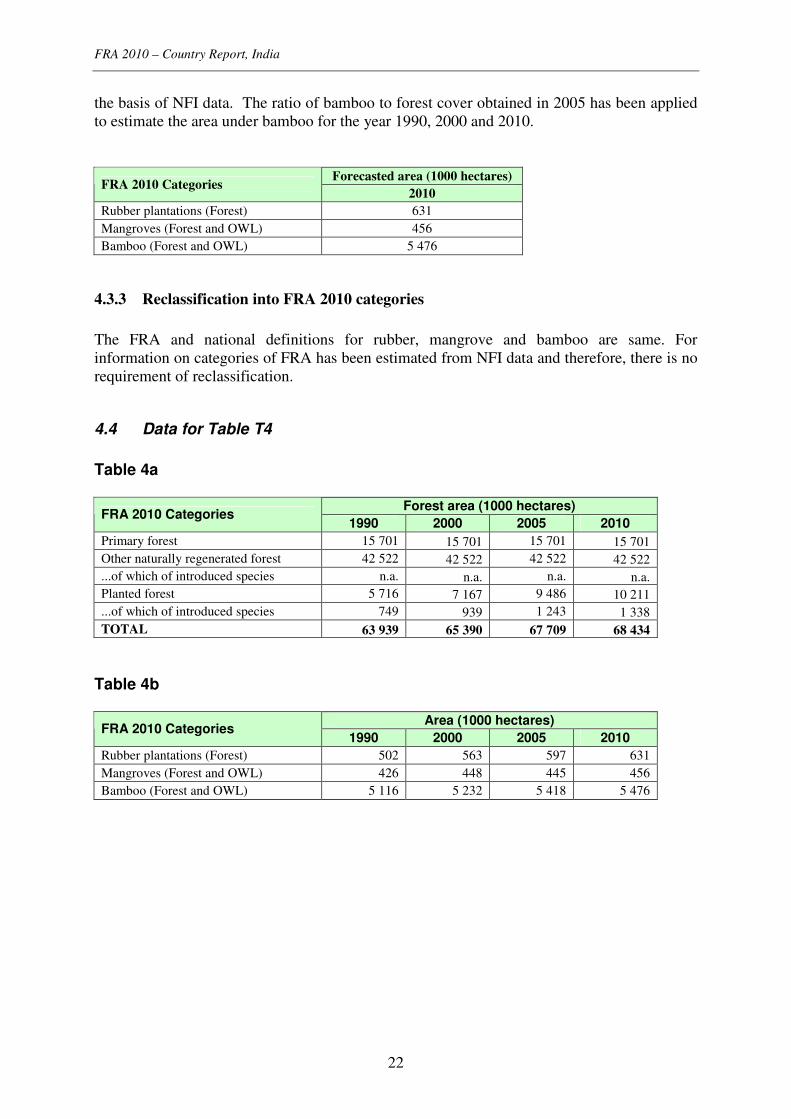
FRA 2010 – Country Report, India
22
the basis of NFI data. The ratio of bamboo to forest cover obtained in 2005 has been applied
to estimate the area under bamboo for the year 1990, 2000 and 2010.
Forecasted area (1000 hectares)
FRA 2010 Categories 2010
Rubber plantations (Forest) 631
Mangroves (Forest and OWL) 456
Bamboo (Forest and OWL) 5 476
4.3.3 Reclassification into FRA 2010 categories
The FRA and national definitions for rubber, mangrove and bamboo are same. For
information on categories of FRA has been estimated from NFI data and therefore, there is no
requirement of reclassification.
4.4 Data for Table T4
Table 4a
Forest area (1000 hectares) FRA 2010 Categories
1990 2000 2005 2010
Primary forest 15 701 15 701 15 701 15 701
Other naturally regenerated forest 42 522 42 522 42 522 42 522
...of which of introduced species n.a. n.a. n.a. n.a.
Planted forest 5 716 7 167 9 486 10 211
...of which of introduced species 749 939 1 243 1 338
TOTAL 63 939 65 390 67 709 68 434
Table 4b
Area (1000 hectares) FRA 2010 Categories
1990 2000 2005 2010
Rubber plantations (Forest) 502 563 597 631
Mangroves (Forest and OWL) 426 448 445 456
Bamboo (Forest and OWL) 5 116 5 232 5 418 5 476
FRA 2010 – Country Report, India
23
4.5 Comments to Table T4
Variable / category
Comments related to data, definitions, etc.
Comments on the reported trend
Primary forest
Other naturally
regenerating
forest
Planted forest
Rubber
plantations
Mangroves
Bamboo National statistics in India are not
maintained by characteristic of Forests.
The same have been estimated on the basis
of NFI data.
Other general comments to the table National statistics in India are not maintained by characteristic of Forests. The same have been estimated on
the basis of NFI data.
FRA 2010 – Country Report, India
24
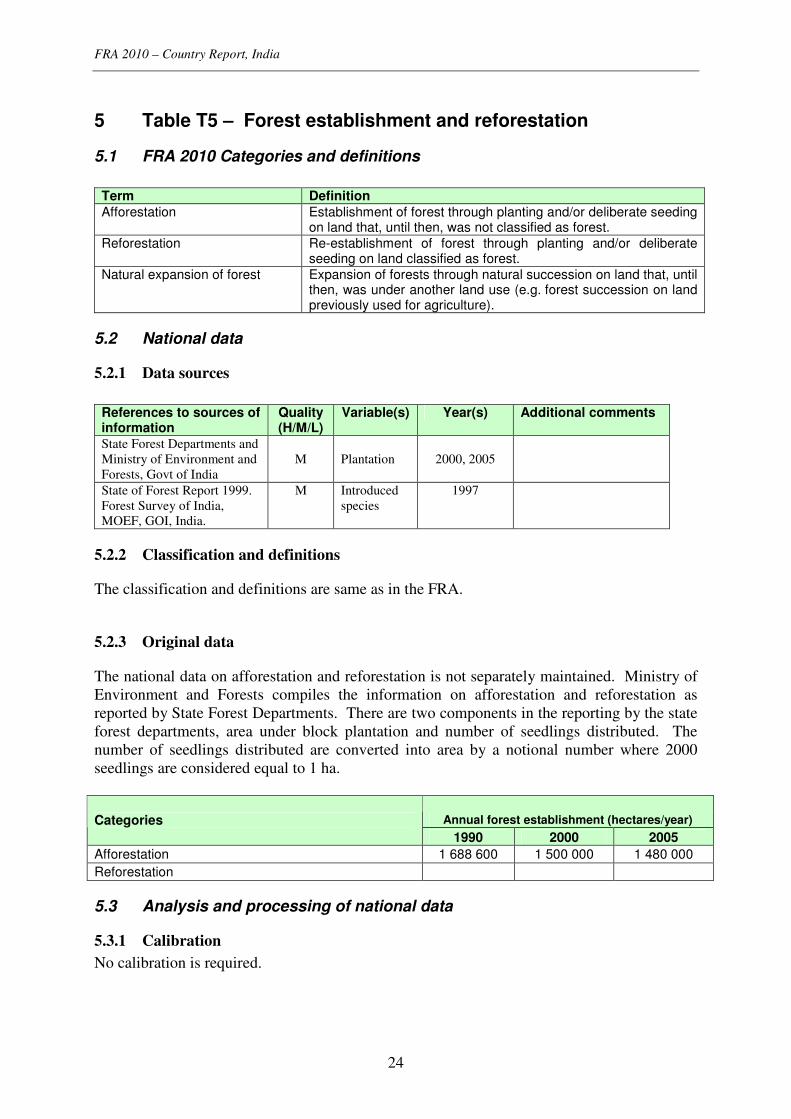
5 Table T5 – Forest establishment and reforestation
5.1 FRA 2010 Categories and definitions
Term Definition
Afforestation Establishment of forest through planting and/or deliberate seeding on land that, until then, was not classified as forest.
Reforestation Re-establishment of forest through planting and/or deliberate seeding on land classified as forest.
Natural expansion of forest Expansion of forests through natural succession on land that, until then, was under another land use (e.g. forest succession on land previously used for agriculture).
5.2 National data
5.2.1 Data sources
References to sources of information
Quality (H/M/L)
Variable(s) Year(s) Additional comments
State Forest Departments and
Ministry of Environment and
Forests, Govt of India
M Plantation 2000, 2005
State of Forest Report 1999.
Forest Survey of India,
MOEF, GOI, India.
M Introduced
species
1997
5.2.2 Classification and definitions
The classification and definitions are same as in the FRA.
5.2.3 Original data
The national data on afforestation and reforestation is not separately maintained. Ministry of
Environment and Forests compiles the information on afforestation and reforestation as
reported by State Forest Departments. There are two components in the reporting by the state
forest departments, area under block plantation and number of seedlings distributed. The
number of seedlings distributed are converted into area by a notional number where 2000
seedlings are considered equal to 1 ha.
Annual forest establishment (hectares/year) Categories
1990 2000 2005
Afforestation 1 688 600 1 500 000 1 480 000
Reforestation
5.3 Analysis and processing of national data
5.3.1 Calibration
No calibration is required.

FRA 2010 – Country Report, India
25
5.3.2 Estimation and forecasting
5.3.3 Reclassification into FRA 2010 categories Available data and information does not allow re-classification of the plantation area into area
under afforestation and reforestation.
5.4 Data for Table T5
Annual forest establishment (hectares/year)
...of which of introduced species
1)
(hectares/year) FRA 2010 Categories
1990 2000 2005 1990 2000 2005
Afforestation n.a. n.a. n.a. n.a n.a n.a
Reforestation 1 688 600 1 500 000 1 480 000 n.a n.a n.a
...of which on areas previously
planted n.a n.a n.a n.a n.a n.a
Natural expansion of forest n.a n.a n.a n.a n.a n.a
5.5 Comments to Table T5
Variable / category
Comments related to data, definitions, etc.
Comments on the reported trend
Afforestation
Reforestation The statistics on afforestation and
reforestation are not separately
maintained in India. However, the
combined estimates of forestation and
reforestation are given at 5.3.2 in the
original data. These are reported figures
of plantations which could be at variance
with actual figures.
Natural expansion
of forest
No national statistics is maintained for
this category.
Other general comments to the table Note: The estimates are on the basis of five years average and inclusive of both afforestation and
reforestation. Ministry of Environment and Forests compiles the information as reported by State Forest
Department. Other information of table 5 is not available. Introduced species includes Eucalyptus spp., Populus
spp., Acacia auriculiformis and Acacia mearnsii etc.

FRA 2010 – Country Report, India
26
6 Table T6 – Growing stock
6.1 FRA 2010 Categories and definitions
Category Definition
Growing stock Volume over bark of all living trees more than X cm in diameter at breast height (or above buttress if these are higher). Includes the stem from ground level or stump height up to a top diameter of Y cm, and may also include branches to a minimum diameter of W cm.
Growing stock of commercial species
Growing stock (see def. above) of commercial species.
6.2 National data
6.2.1 Data sources
References to sources of information
Quality (H/M/L)
Variable(s) Year(s) Additional comments
FSI, 1989. State of Forest
Report 1989. Forest Survey of
India, Ministry of
Environment and Forests,
Government of India.
M Extent,
Growing
Stock
1984
FSI, 1995. State of Forest
Report 1995. Forest Survey of
India, Ministry of
Environment and Forests,
Government of India.
M Extent,
Growing
Stock
1994
FSI, 2001. State of Forest
Report, 2001. Forest Survey of
India, Ministry of
Environment and Forests,
Government of India.
M Extent 2000
FSI, 2003. India Pilot Study.
Forest Survey of India,
Ministry of Environment and
Forests, Government of India.
(Unpublished report).
M Extent,
Growing
Stock
2003
FSI, 2005. State of Forest
Report, 2005. Forest Survey of
India, Ministry of
Environment and Forests,
Government of India.
H Extent,
growing
stock
2005
6.2.2 Classification and definitions
The following table provides the definition of growing stock as used by Forest Survey of
India, Ministry of Environment and Forest, India.
National class Definition
Growing Stock The sum-total of all trees, by number or volume (under bark) or biomass, growing within a particular area of interest.

FRA 2010 – Country Report, India
27
(Source: SFR205)
6.2.3 Original data
Following table contain national data on growing stock which is volume (under bark) of all
living trees more than 10 cm in diameter at breast height (or above buttress if these are
higher). It includes the stem volume from ground level or stump height up to a top diameter of
10 cm, and branches up to a minimum diameter of 5 cm.
The relative ranking of these species is presented below.
FRA 2010 category / Species name
Growing stock in forest
(million cubic meters)
Rank Scientific name Common name 2005
1st Shorea robusta Sal 377
2nd Tectona grandis Teak 190
3rd Pinus roxburghii Chir Pine 145
4th Terminalia crenulata Saja 127
5th Abies smithiana Spruce 112
6th Anogeissus latifolia Dhauda 111
7th Quercus semecarpifolia Kharsu Oak 96
8th Abies pindrow Silver fir 89
9th Mangifera indica Aam 90
10th Schima wallichii Makrisal 83
Remaining 3 709
TOTAL 5 129
6.3 Analysis and processing of national data
6.3.1 Calibration
Calibration is not required.
6.3.2 Estimation and forecasting
The estimate of growing stocks for 2005 has been generated on the basis of NFI data
conducted during 2002 to 2006. This estimate also includes estimates of growing stock in
TOF of patches having area 1.0 ha or more. For forecasting estimates for 2010, the per
hectare increment in growing stock was calculated on the basis of per hectare growing stock
of 2000 and 2005 and applied on the projected forest area of 2010. The breakup of coniferous
Year Categories 1990 2000 2005
Growing Stock in million m3 4 363 4 662 5 129
Extent of Forest in “000”ha 63 939 65 390 67 709
FRA 2010 – Country Report, India
28
and broadleaves of 2005 based on the previous table in 6.2.3, has been applied on 1990, 2000
and 2010.
6.3.3 Reclassification into FRA 2010 categories
No reclassification is required.
6.4 Data for Table T6
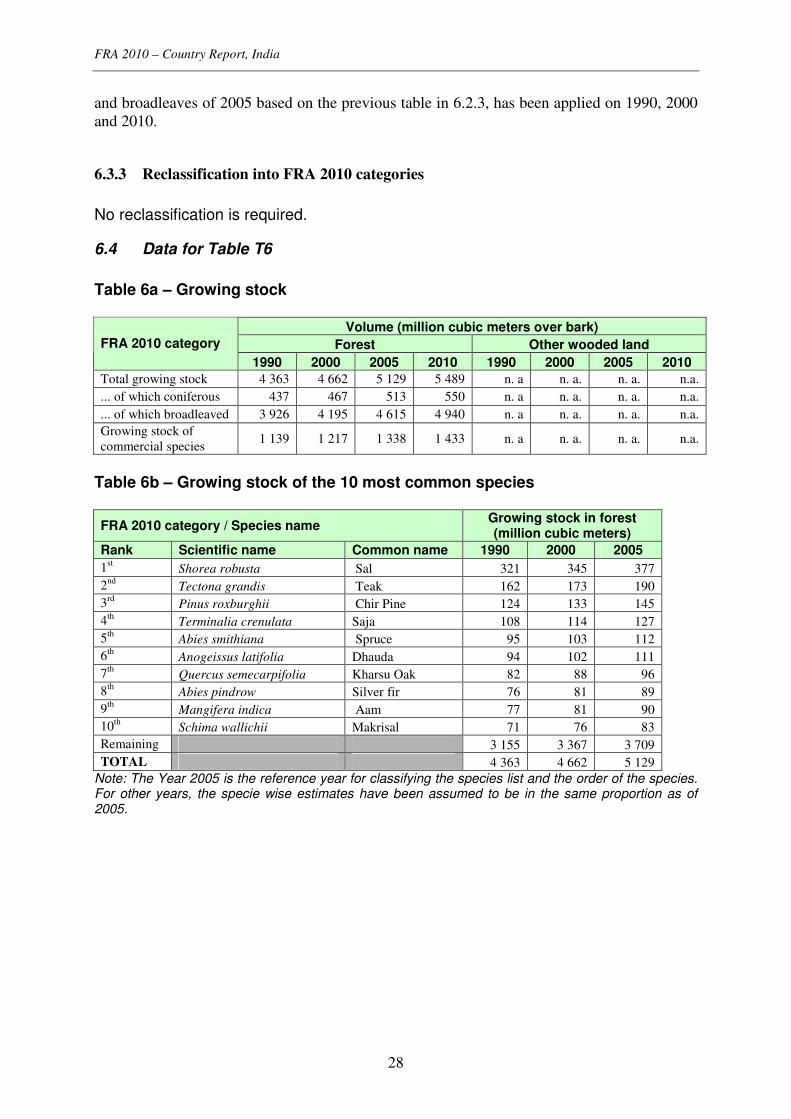
Table 6a – Growing stock
Volume (million cubic meters over bark)
Forest Other wooded land FRA 2010 category
1990 2000 2005 2010 1990 2000 2005 2010
Total growing stock 4 363 4 662 5 129 5 489 n. a n. a. n. a. n.a.
... of which coniferous 437 467 513 550 n. a n. a. n. a. n.a.
... of which broadleaved 3 926 4 195 4 615 4 940 n. a n. a. n. a. n.a.
Growing stock of
commercial species 1 139 1 217 1 338 1 433 n. a n. a. n. a. n.a.
Table 6b – Growing stock of the 10 most common species
FRA 2010 category / Species name Growing stock in forest (million cubic meters)
Rank Scientific name Common name 1990 2000 2005
1st Shorea robusta Sal 321 345 377
2nd
Tectona grandis Teak 162 173 190
3rd
Pinus roxburghii Chir Pine 124 133 145
4th
Terminalia crenulata Saja 108 114 127
5th
Abies smithiana Spruce 95 103 112
6th
Anogeissus latifolia Dhauda 94 102 111
7th
Quercus semecarpifolia Kharsu Oak 82 88 96
8th
Abies pindrow Silver fir 76 81 89
9th
Mangifera indica Aam 77 81 90
10th
Schima wallichii Makrisal 71 76 83
Remaining 3 155 3 367 3 709
TOTAL 4 363 4 662 5 129
Note: The Year 2005 is the reference year for classifying the species list and the order of the species. For other years, the specie wise estimates have been assumed to be in the same proportion as of 2005.
FRA 2010 – Country Report, India
29
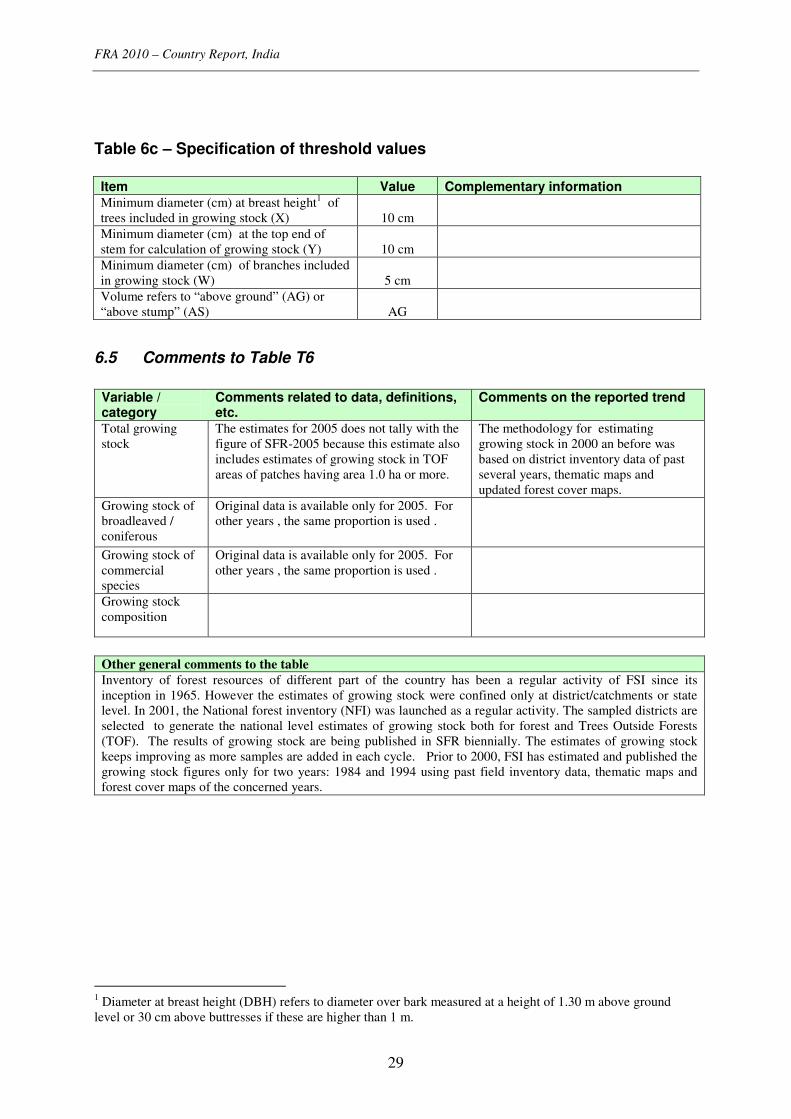
Table 6c – Specification of threshold values Item Value Complementary information Minimum diameter (cm) at breast height
1 of
trees included in growing stock (X) 10 cm
Minimum diameter (cm) at the top end of
stem for calculation of growing stock (Y) 10 cm
Minimum diameter (cm) of branches included
in growing stock (W) 5 cm
Volume refers to “above ground” (AG) or
“above stump” (AS) AG
6.5 Comments to Table T6
Variable / category
Comments related to data, definitions, etc.
Comments on the reported trend
Total growing
stock
The estimates for 2005 does not tally with the
figure of SFR-2005 because this estimate also
includes estimates of growing stock in TOF
areas of patches having area 1.0 ha or more.
The methodology for estimating
growing stock in 2000 an before was
based on district inventory data of past
several years, thematic maps and
updated forest cover maps.
Growing stock of
broadleaved /
coniferous
Original data is available only for 2005. For
other years , the same proportion is used .
Growing stock of
commercial
species
Original data is available only for 2005. For
other years , the same proportion is used .
Growing stock
composition
Other general comments to the table
Inventory of forest resources of different part of the country has been a regular activity of FSI since its
inception in 1965. However the estimates of growing stock were confined only at district/catchments or state
level. In 2001, the National forest inventory (NFI) was launched as a regular activity. The sampled districts are
selected to generate the national level estimates of growing stock both for forest and Trees Outside Forests
(TOF). The results of growing stock are being published in SFR biennially. The estimates of growing stock
keeps improving as more samples are added in each cycle. Prior to 2000, FSI has estimated and published the
growing stock figures only for two years: 1984 and 1994 using past field inventory data, thematic maps and
forest cover maps of the concerned years.
1 Diameter at breast height (DBH) refers to diameter over bark measured at a height of 1.30 m above ground
level or 30 cm above buttresses if these are higher than 1 m.

FRA 2010 – Country Report, India
30
7 Table T7 – Biomass stock
7.1 FRA 2010 Categories and definitions
Category Definition Above-ground biomass All living biomass above the soil including stem, stump, branches, bark, seeds,
and foliage.
Below-ground biomass All biomass of live roots. Fine roots of less than 2mm diameter are excluded
because these often cannot be distinguished empirically from soil organic matter or
litter.
Dead wood All non-living woody biomass not contained in the litter, either standing, lying on
the ground, or in the soil. Dead wood includes wood lying on the surface, dead
roots, and stumps larger than or equal to 10 cm in diameter or any other diameter
used by the country.
7.2 National data
7.2.1 Data sources
References to sources of information
Quality (H/M/L)
Variable(s) Year(s) Additional comments
FSI, 1991. State of Forest
Report 1989. Forest Survey of
India, Ministry of
Environment and Forests,
Government of India.
M Extent,
Growing Stock
1984
FSI, 1995. State of Forest
Report 1995. Forest Survey of
India, Ministry of
Environment and Forests,
Government of India.
M Extent,
Growing Stock
1994
FSI, 2003. State of Forest
Report, 2001. Forest Survey of
India, Ministry of
Environment and Forests,
Government of India.
H Extent 2000
FSI, 2007. State of Forest
Report, 2005. Forest Survey of
India, Ministry of
Environment and Forests,
Government of India.
H Extent, growing
stock
2005
Timber Mechanics: Strength,
Classification and grading of
timber, ICFRE Publication 38,
1996
H Specific gravity 1996
FRA 2010 – Country Report, India
31
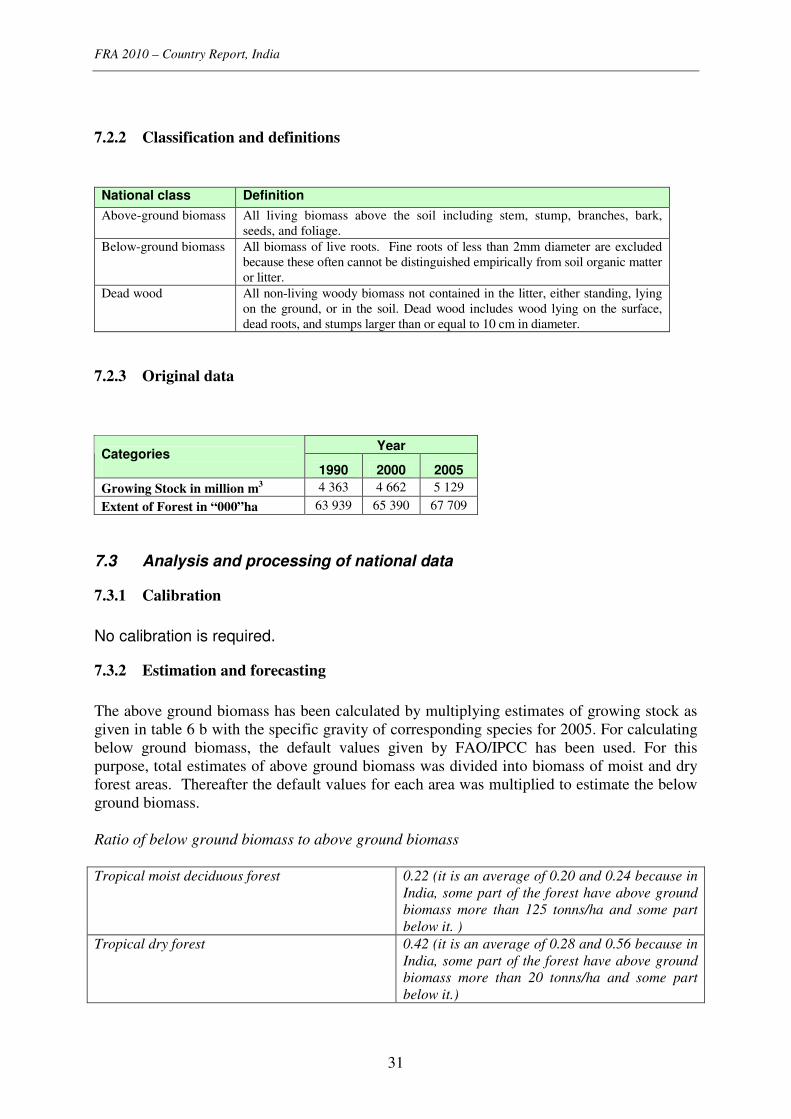
7.2.2 Classification and definitions
National class Definition
Above-ground biomass All living biomass above the soil including stem, stump, branches, bark,
seeds, and foliage.
Below-ground biomass All biomass of live roots. Fine roots of less than 2mm diameter are excluded
because these often cannot be distinguished empirically from soil organic matter
or litter.
Dead wood All non-living woody biomass not contained in the litter, either standing, lying
on the ground, or in the soil. Dead wood includes wood lying on the surface,
dead roots, and stumps larger than or equal to 10 cm in diameter.
7.2.3 Original data
7.3 Analysis and processing of national data
7.3.1 Calibration
No calibration is required.
7.3.2 Estimation and forecasting
The above ground biomass has been calculated by multiplying estimates of growing stock as
given in table 6 b with the specific gravity of corresponding species for 2005. For calculating
below ground biomass, the default values given by FAO/IPCC has been used. For this
purpose, total estimates of above ground biomass was divided into biomass of moist and dry
forest areas. Thereafter the default values for each area was multiplied to estimate the below
ground biomass.
Ratio of below ground biomass to above ground biomass
Tropical moist deciduous forest 0.22 (it is an average of 0.20 and 0.24 because in
India, some part of the forest have above ground
biomass more than 125 tonns/ha and some part
below it. )
Tropical dry forest 0.42 (it is an average of 0.28 and 0.56 because in
India, some part of the forest have above ground
biomass more than 20 tonns/ha and some part
below it.)
Year Categories 1990 2000 2005
Growing Stock in million m3 4 363 4 662 5 129
Extent of Forest in “000”ha 63 939 65 390 67 709

FRA 2010 – Country Report, India
32
7.3.3 Reclassification into FRA 2010 categories
Not required
7.4 Data for Table T7
Biomass (million metric tonnes oven-dry weight)
Forest Other wooded land FRA 2010 category
1990 2000 2005 2010 1990 2000 2005 2010
Above-ground biomass 2 616 2 796 3 076 3 291 n.a n.a n.a n.a
Below-ground biomass 825 882 970 1 038 n.a n.a n.a n.a
Dead wood n.a n.a n.a n.a n.a n.a n.a n.a
TOTAL n.a n.a n.a n.a n.a n.a n.a n.a
7.5 Comments to Table T7
Variable / category
Comments related to data, definitions, etc.
Comments on the reported trend
Above-ground
biomass
The estimates of growing stock used for
biomass calculation are under bark only.
Hence the same is under estimated. In
addition, the above ground biomass
reported is only woody biomass and the
limits of measurements of woody biomass
has been mentioned in table 6c of growing
stock. FSI has taken a study for estimating
missing component of the above ground
biomass, the results of which will be used to
complete the total above ground biomass.
Alternately, biomass expansion factor as
provided by IPCC/FAO shall be used in the
final report.
Below-ground
biomass
In the light of the comments on above
ground biomass, the below ground biomass
is also under estimated.
Dead wood FSI has undertaken a study for estimating
biomass of dead wood. The results of which
are not yet available.
FRA 2010 – Country Report, India
33
8 Table T8 – Carbon stock
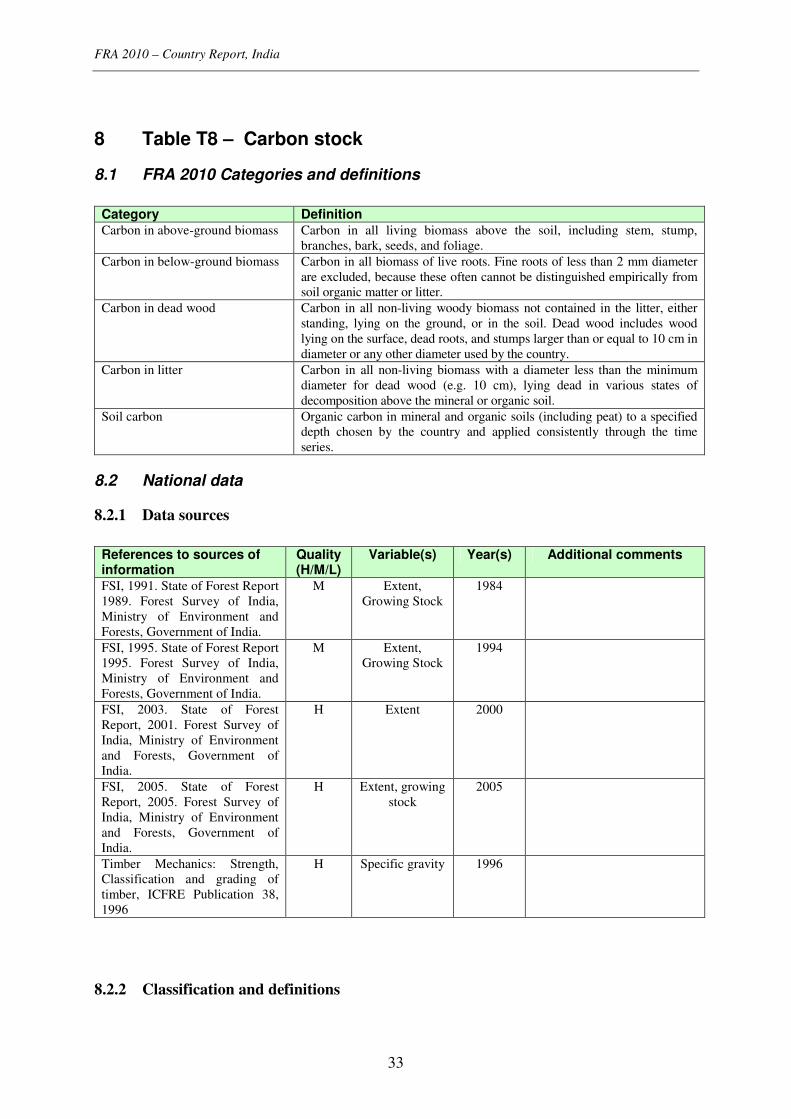
8.1 FRA 2010 Categories and definitions
Category Definition Carbon in above-ground biomass Carbon in all living biomass above the soil, including stem, stump,
branches, bark, seeds, and foliage.
Carbon in below-ground biomass Carbon in all biomass of live roots. Fine roots of less than 2 mm diameter
are excluded, because these often cannot be distinguished empirically from
soil organic matter or litter.
Carbon in dead wood Carbon in all non-living woody biomass not contained in the litter, either
standing, lying on the ground, or in the soil. Dead wood includes wood
lying on the surface, dead roots, and stumps larger than or equal to 10 cm in
diameter or any other diameter used by the country.
Carbon in litter Carbon in all non-living biomass with a diameter less than the minimum
diameter for dead wood (e.g. 10 cm), lying dead in various states of
decomposition above the mineral or organic soil.
Soil carbon Organic carbon in mineral and organic soils (including peat) to a specified
depth chosen by the country and applied consistently through the time
series.
8.2 National data
8.2.1 Data sources
References to sources of information
Quality (H/M/L)
Variable(s) Year(s) Additional comments
FSI, 1991. State of Forest Report
1989. Forest Survey of India,
Ministry of Environment and
Forests, Government of India.
M Extent,
Growing Stock
1984
FSI, 1995. State of Forest Report
1995. Forest Survey of India,
Ministry of Environment and
Forests, Government of India.
M Extent,
Growing Stock
1994
FSI, 2003. State of Forest
Report, 2001. Forest Survey of
India, Ministry of Environment
and Forests, Government of
India.
H Extent 2000
FSI, 2005. State of Forest
Report, 2005. Forest Survey of
India, Ministry of Environment
and Forests, Government of
India.
H Extent, growing
stock
2005
Timber Mechanics: Strength,
Classification and grading of
timber, ICFRE Publication 38,
1996
H Specific gravity 1996
8.2.2 Classification and definitions

FRA 2010 – Country Report, India
34
National class Definition
Carbon in above-
ground biomass
Carbon in all living biomass above the soil, including stem, stump, branches,
bark, seeds, and foliage.
Carbon in below-
ground biomass
Carbon in all biomass of live roots. Fine roots of less than 2 mm diameter are
excluded, because these often cannot be distinguished empirically from soil
organic matter or litter.
Carbon in dead wood Carbon in all non-living woody biomass not contained in the litter, either
standing, lying on the ground, or in the soil. Dead wood includes wood lying on
the surface, dead roots, and stumps larger than or equal to 10 cm in diameter or
any other diameter used by the country.
Carbon in litter Carbon in all non-living biomass with a diameter less than the minimum
diameter for dead wood (e.g. 10 cm), lying dead in various states of
decomposition above the mineral or organic soil.
Soil carbon Organic carbon in mineral and organic soils (including peat) to a specified depth
chosen by the country and applied consistently through the time series.
8.2.3 Original data
Biomass (million metric tonnes oven-
dry weight)
Forest Category
1990 2000 2005
Above-ground biomass 2 616 2 796 3 076
Below-ground biomass 825 882 970
8.3 Analysis and processing of national data
8.3.1 Calibration
Not required
8.3.2 Estimation and forecasting
For estimation of carbon above ground, the carbon content of different species as available
from literature was used. For below ground carbon estimation, default value as given by
FAO/IPCC was applied. The Carbon in litter (excluding branch) and soil was estimated on the
basis of NFI database of FSI inventoried during 2002 to 2006.
8.3.3 Reclassification into FRA 2010 categories
Reclassification is not required.
FRA 2010 – Country Report, India
35
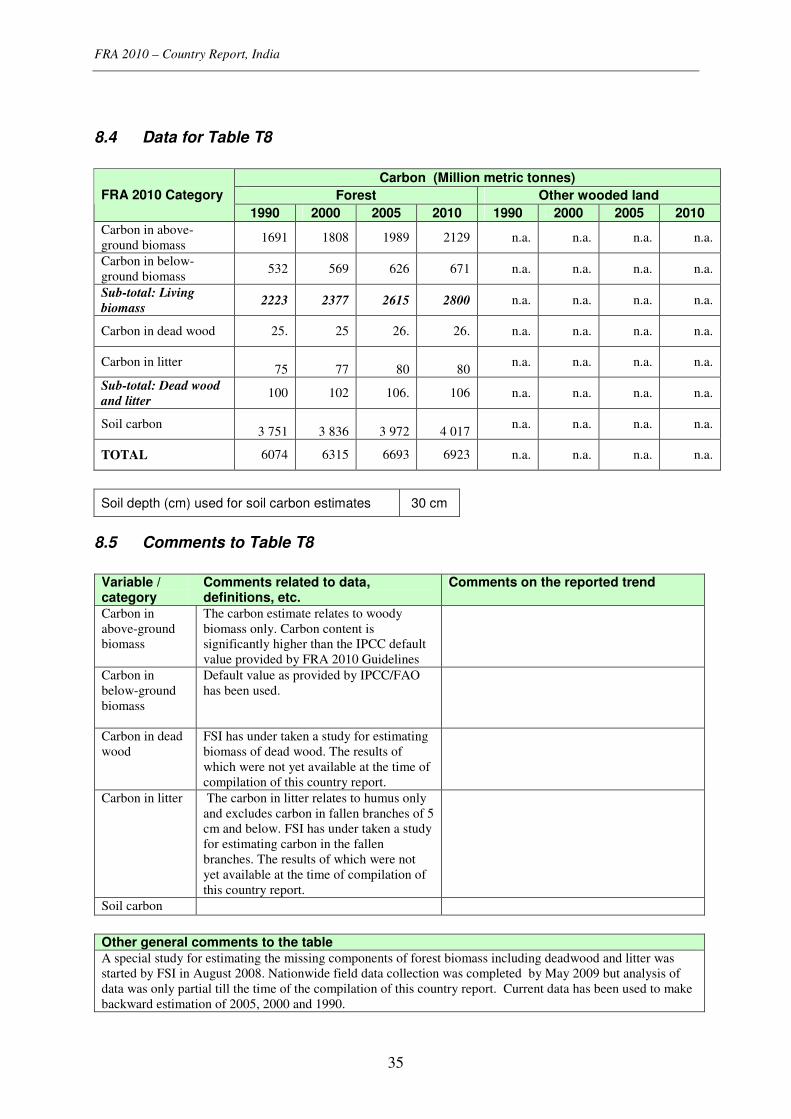
8.4 Data for Table T8
Carbon (Million metric tonnes)
Forest Other wooded land FRA 2010 Category
1990 2000 2005 2010 1990 2000 2005 2010
Carbon in above-
ground biomass 1691 1808 1989 2129 n.a. n.a. n.a. n.a.
Carbon in below-
ground biomass 532 569 626 671 n.a. n.a. n.a. n.a.
Sub-total: Living
biomass 2223 2377 2615 2800 n.a. n.a. n.a. n.a.
Carbon in dead wood 25. 25 26. 26. n.a. n.a. n.a. n.a.
Carbon in litter 75 77 80 80
n.a. n.a. n.a. n.a.
Sub-total: Dead wood
and litter 100 102 106. 106 n.a. n.a. n.a. n.a.
Soil carbon 3 751 3 836 3 972 4 017
n.a. n.a. n.a. n.a.
TOTAL 6074 6315 6693 6923 n.a. n.a. n.a. n.a.
Soil depth (cm) used for soil carbon estimates 30 cm
8.5 Comments to Table T8
Variable / category
Comments related to data, definitions, etc.
Comments on the reported trend
Carbon in
above-ground
biomass
The carbon estimate relates to woody
biomass only. Carbon content is
significantly higher than the IPCC default
value provided by FRA 2010 Guidelines
Carbon in
below-ground
biomass
Default value as provided by IPCC/FAO
has been used.
Carbon in dead
wood
FSI has under taken a study for estimating
biomass of dead wood. The results of
which were not yet available at the time of
compilation of this country report.
Carbon in litter The carbon in litter relates to humus only
and excludes carbon in fallen branches of 5
cm and below. FSI has under taken a study
for estimating carbon in the fallen
branches. The results of which were not
yet available at the time of compilation of
this country report.
Soil carbon
Other general comments to the table A special study for estimating the missing components of forest biomass including deadwood and litter was
started by FSI in August 2008. Nationwide field data collection was completed by May 2009 but analysis of
data was only partial till the time of the compilation of this country report. Current data has been used to make
backward estimation of 2005, 2000 and 1990.
FRA 2010 – Country Report, India
36
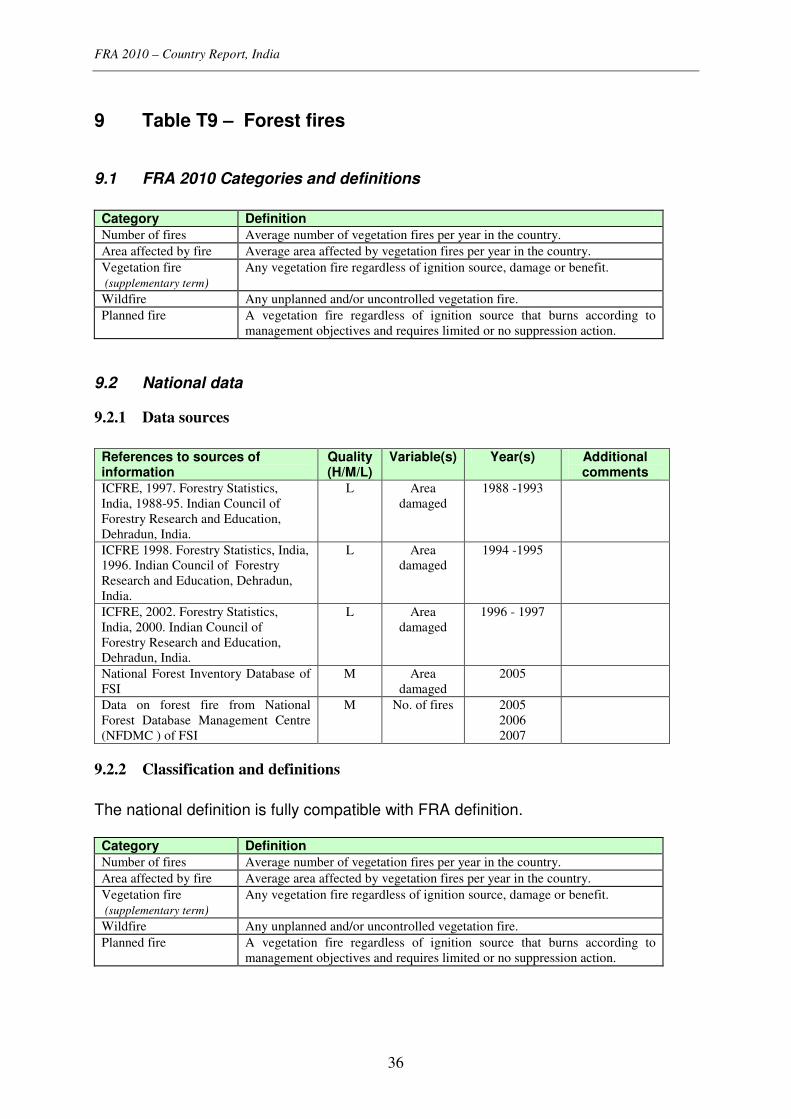
9 Table T9 – Forest fires
9.1 FRA 2010 Categories and definitions
Category Definition
Number of fires Average number of vegetation fires per year in the country.
Area affected by fire Average area affected by vegetation fires per year in the country.
Vegetation fire
(supplementary term)
Any vegetation fire regardless of ignition source, damage or benefit.
Wildfire Any unplanned and/or uncontrolled vegetation fire.
Planned fire A vegetation fire regardless of ignition source that burns according to
management objectives and requires limited or no suppression action.
9.2 National data
9.2.1 Data sources
References to sources of information
Quality (H/M/L)
Variable(s) Year(s) Additional comments
ICFRE, 1997. Forestry Statistics,
India, 1988-95. Indian Council of
Forestry Research and Education,
Dehradun, India.
L Area
damaged
1988 -1993
ICFRE 1998. Forestry Statistics, India,
1996. Indian Council of Forestry
Research and Education, Dehradun,
India.
L Area
damaged
1994 -1995
ICFRE, 2002. Forestry Statistics,
India, 2000. Indian Council of
Forestry Research and Education,
Dehradun, India.
L Area
damaged
1996 - 1997
National Forest Inventory Database of
FSI
M Area
damaged
2005
Data on forest fire from National
Forest Database Management Centre
(NFDMC ) of FSI
M No. of fires 2005
2006
2007
9.2.2 Classification and definitions
The national definition is fully compatible with FRA definition. Category Definition
Number of fires Average number of vegetation fires per year in the country.
Area affected by fire Average area affected by vegetation fires per year in the country.
Vegetation fire
(supplementary term)
Any vegetation fire regardless of ignition source, damage or benefit.
Wildfire Any unplanned and/or uncontrolled vegetation fire.
Planned fire A vegetation fire regardless of ignition source that burns according to
management objectives and requires limited or no suppression action.
FRA 2010 – Country Report, India
37
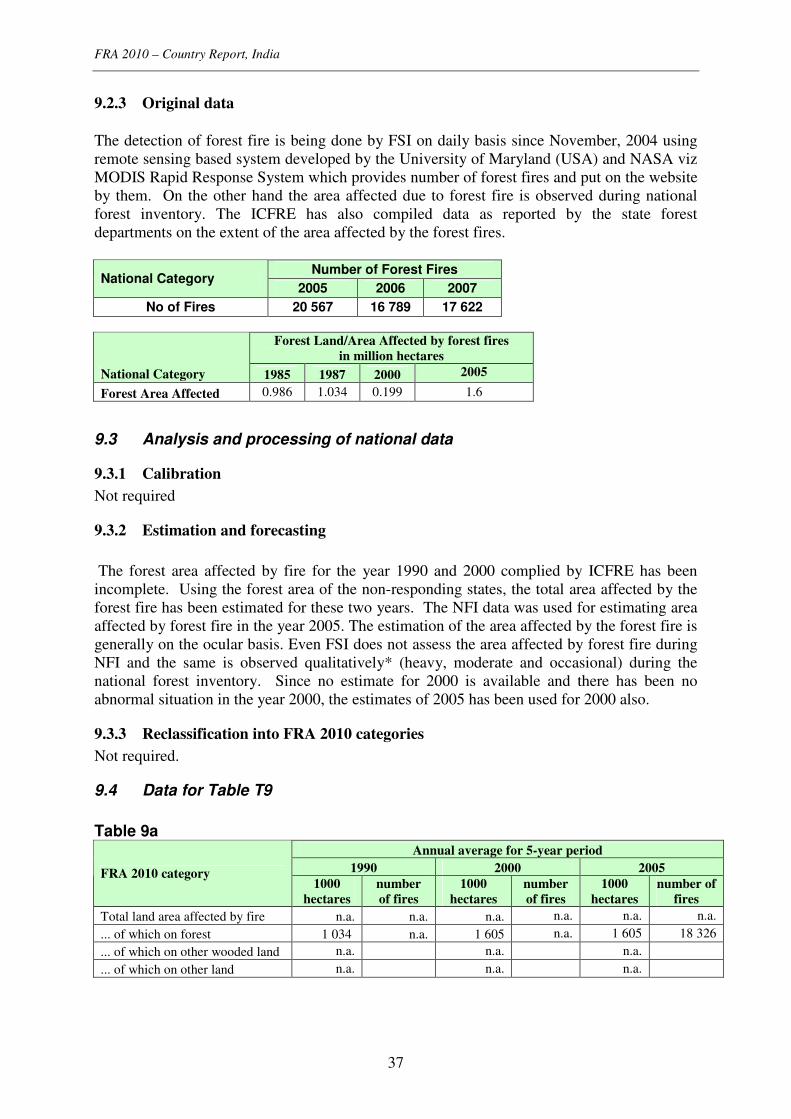
9.2.3 Original data
The detection of forest fire is being done by FSI on daily basis since November, 2004 using
remote sensing based system developed by the University of Maryland (USA) and NASA viz
MODIS Rapid Response System which provides number of forest fires and put on the website
by them. On the other hand the area affected due to forest fire is observed during national
forest inventory. The ICFRE has also compiled data as reported by the state forest
departments on the extent of the area affected by the forest fires.
Number of Forest Fires
National Category 2005 2006 2007
No of Fires 20 567 16 789 17 622
Forest Land/Area Affected by forest fires
in million hectares
National Category 1985 1987 2000 2005
Forest Area Affected 0.986 1.034 0.199 1.6
9.3 Analysis and processing of national data
9.3.1 Calibration
Not required
9.3.2 Estimation and forecasting
The forest area affected by fire for the year 1990 and 2000 complied by ICFRE has been
incomplete. Using the forest area of the non-responding states, the total area affected by the
forest fire has been estimated for these two years. The NFI data was used for estimating area
affected by forest fire in the year 2005. The estimation of the area affected by the forest fire is
generally on the ocular basis. Even FSI does not assess the area affected by forest fire during
NFI and the same is observed qualitatively* (heavy, moderate and occasional) during the
national forest inventory. Since no estimate for 2000 is available and there has been no
abnormal situation in the year 2000, the estimates of 2005 has been used for 2000 also.
9.3.3 Reclassification into FRA 2010 categories
Not required.
9.4 Data for Table T9
Table 9a
Annual average for 5-year period
1990 2000 2005 FRA 2010 category 1000
hectares
number
of fires
1000
hectares
number
of fires
1000
hectares
number of
fires
Total land area affected by fire n.a. n.a. n.a. n.a. n.a. n.a.
... of which on forest 1 034 n.a. 1 605 n.a. 1 605 18 326
... of which on other wooded land n.a. n.a. n.a.
... of which on other land n.a. n.a. n.a.

FRA 2010 – Country Report, India
38
Table 9b
Proportion of forest area affected by fire (%) FRA 2010 category
1990 2000 2005
Wildfire 100 100 100
Planned fire
9.5 Comments to Table T9
Variable / category
Comments related to data, definitions, etc.
Comments on the reported trend
Area affected by
fire
Heavy: more than 50 % area in 2 ha plot is
affected by fire while in Moderate between
10-50 % and in Occasional less than 10 %.
Number of fires The numbers of the forest fires reported in
the original data are based on downloading
of the same from the website and all points
are not verified in the field.
Wildfire /
planned fire
FRA 2010 – Country Report, India
39
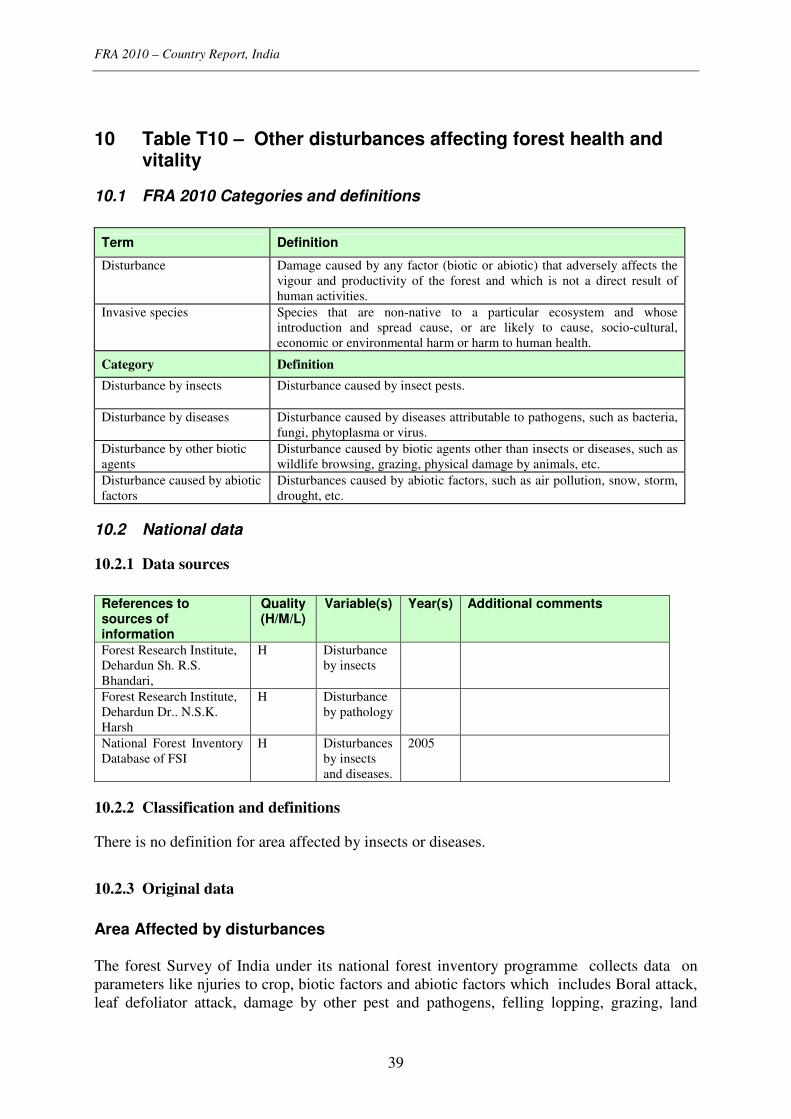
10 Table T10 – Other disturbances affecting forest health and vitality
10.1 FRA 2010 Categories and definitions
Term Definition
Disturbance Damage caused by any factor (biotic or abiotic) that adversely affects the
vigour and productivity of the forest and which is not a direct result of
human activities.
Invasive species Species that are non-native to a particular ecosystem and whose
introduction and spread cause, or are likely to cause, socio-cultural,
economic or environmental harm or harm to human health.
Category Definition
Disturbance by insects Disturbance caused by insect pests.
Disturbance by diseases Disturbance caused by diseases attributable to pathogens, such as bacteria,
fungi, phytoplasma or virus.
Disturbance by other biotic
agents
Disturbance caused by biotic agents other than insects or diseases, such as
wildlife browsing, grazing, physical damage by animals, etc.
Disturbance caused by abiotic
factors
Disturbances caused by abiotic factors, such as air pollution, snow, storm,
drought, etc.
10.2 National data
10.2.1 Data sources
References to sources of information
Quality (H/M/L)
Variable(s) Year(s) Additional comments
Forest Research Institute,
Dehardun Sh. R.S.
Bhandari,
H Disturbance
by insects
Forest Research Institute,
Dehardun Dr.. N.S.K.
Harsh
H Disturbance
by pathology
National Forest Inventory
Database of FSI
H Disturbances
by insects
and diseases.
2005
10.2.2 Classification and definitions
There is no definition for area affected by insects or diseases.
10.2.3 Original data
Area Affected by disturbances The forest Survey of India under its national forest inventory programme collects data on
parameters like njuries to crop, biotic factors and abiotic factors which includes Boral attack,
leaf defoliator attack, damage by other pest and pathogens, felling lopping, grazing, land

FRA 2010 – Country Report, India
40
slide, flood, other natural calamities etc. On the basis of these information, the area affected
by disturbances has been estimated.
Area affected by insects and disease The national paper presented on the “Dalbergia Sissoo in India” mentions that Dalbergia
sissoo is diseased over an area of 8 400 square kilometres of Gangetic plains in north of Bihar
(one of the States of India) alone. With a very conservative assumption that at least one
percent of this figure spans forest land leads to an estimate of about 8,400 hectares of forest
area affected by this disease.
The “Annual Report” of Ministry of Environment and Forests, Government India (GOI, 2001)
indicates mortality of millions of trees of Shorea robusta due to a stem borer insect
(Hoplocerambyx spinicornis). However, the report does not indicate the area of forest affected
by this insect. Therefore, a very conservative assumption has been made that the insect has
affected at least 1000 sq.km of forests during the year 2000.
The information on major outbreak of insects and diseases affecting forest health and vitality
has been obtained from Forest Research Institute Dehradun.
10.3 Analysis and processing of national data
10.3.1 Calibration
Not required
10.3.2 Estimation and forecasting
The area affected by different category of disturbances has been estimated on the basis of
NFI data 2005.
10.4 Data for Table T10
Table 10a – Disturbances
Affected forest area (1000 hectares) FRA 2010 category 1990 2000 2005
Disturbance by insects n.a. 322 839
Disturbance by diseases n.a. 122 0
Disturbance by other biotic agents n.a. n.a. 25499
Disturbance caused by abiotic factors n.a. n.a. 4383
Total area affected by disturbances n.a. n.a. 29882
Notes: The figures for the reporting years refer to the averages of annually affected areas for the 5-year periods
1988-1992, 1998-2002 and 2003-2007 respectively.

FRA 2010 – Country Report, India
41
Table 10b – Major outbreaks of insects and diseases affecting forest health and vitality
Description / name Tree species or genera
affected (scientific name)
Year(s) of latest
outbreak
Area affected
(1000 hectares)
If cyclic, approx. cycle (years)
Needle spot, Bifussella saccata Pinus Wallichiana 2003 10.0
approx.
Yes, yearly
Gall rust, Hapalophragmium
ponderosum
Acacia modesta 2002 5 Yes, yearly
Canker rots, Ganoderma
applantum, Phellinus
pachypholeus, P. caryophyllii
Cinnamomum camphora,
Peltophorum vogelianum, ,
Termenalia myriocarpa,
Ficus glaberrima, Mangifera
indica
2004 8 Yes, three years
Twig canker , diseases,
Fusarium sambucinum
Eucalyptus camaldulensis 2004 2.0 Yes, yearly
Twig canker , Fusarium solani Terminalia arjuna 2003 5.0 Yes, yearly
Stem canker, Pestalotiopis Jatropha cucas
Dwarf mistletoe Arceuthobium
minutissimum
Pinus Wallichiana 2006 25 Yes, yearly
Twig canker, Pestalotiopsis
versicolor
Cinnamomum camphora 2006 2.0 Yes, yearly
Root rot, Amylosporus campbelli Tectona grandia 2000 2.0 No
Rust, Aecidium kamali Terminalia tomentosa 2001 2.0 Yes, yearly
Mortality, Phytophthora
cinnamomi
Cedrus deodara 2000 20 No
Mortality, Rhizoctonia bataticola Azadirachta indica 2003 5 No
Stem Cankers, Botryodiplodia
theobromae and Phoma sp.
Rohida trees 2003 2 No
Mortality, Ganoderma lucidum,
Botryodiplodia theobromae
Prosopis cineraria 2005 10 No
Root rot, Ganoderma lucidum Dalbergia sissoo, Albizia
spp., Acacia spp.
2003 10 No
Die back, Phomopsis tectonae Tectona grandis 2000 10 Yes, yearly
Vascular wilt, Ralstonia
solanacearum
Tectona grandis 2001 20 No
Leaf blight, Asperisporium
pongamiae
Pongamia pinnata 2000 30 Yes, yearly
Sal heart wood borer
hplocerambyx spinicornis Shorea robusta
2005-2006
(mild) 21 15 years
Ascotis imparata Shorea robusta 2002 to
2008 4
Yearly outbreaks at
different places
Hyblasa purea Eutectona
machaeralis Tectona granids
2004 to
2008 2
Central Tarai Forest
Division, Haldwani
Outbreak of sal heartwood borer Shorea robusta 2007-08 1.1 - Do -
Otbreak of sal defoliator Shorea robusta 2008-09 1
Umaria Forest
Division,
Chhattisgarh
Outbreak of teak defoliator & skeletonizer
Tectona grandis 2001-08 3 Sporadic every year in M.P. and Maharashtra
Gypsy moth (Lymantria spp.) Defoliator Cater Pillar
Willow & Poplar 2006-7 9 -
Note: Area affected refers to the total area affected during the outbreak.

FRA 2010 – Country Report, India
42
Table 10c – Area of forest affected by woody invasive species
Scientific name of woody invasive species Forest area
affected 2005 (1000 hectares)
Total forest area affected by woody invasive species
Note: The total forest area affected by woody invasive species is not necessary the sum of the values above, as these may be overlapping.
10.5 Comments to Table T10
Variable / category
Comments related to data, definitions, etc.
Comments on the reported trend
Disturbance by
insects
Disturbances by insects in 2005 include also
disturbances by diseases, since it is not
possible to disaggregate figures.
Disturbance by
diseases
The area affected by diseases less than
1000 ha has not been reported in the
table.
Disturbance by
other biotic agents
Grazing by domestic animals affects the
major area of biotic agents category.
Disturbance caused
by abiotic factors
Major outbreaks
Invasive species
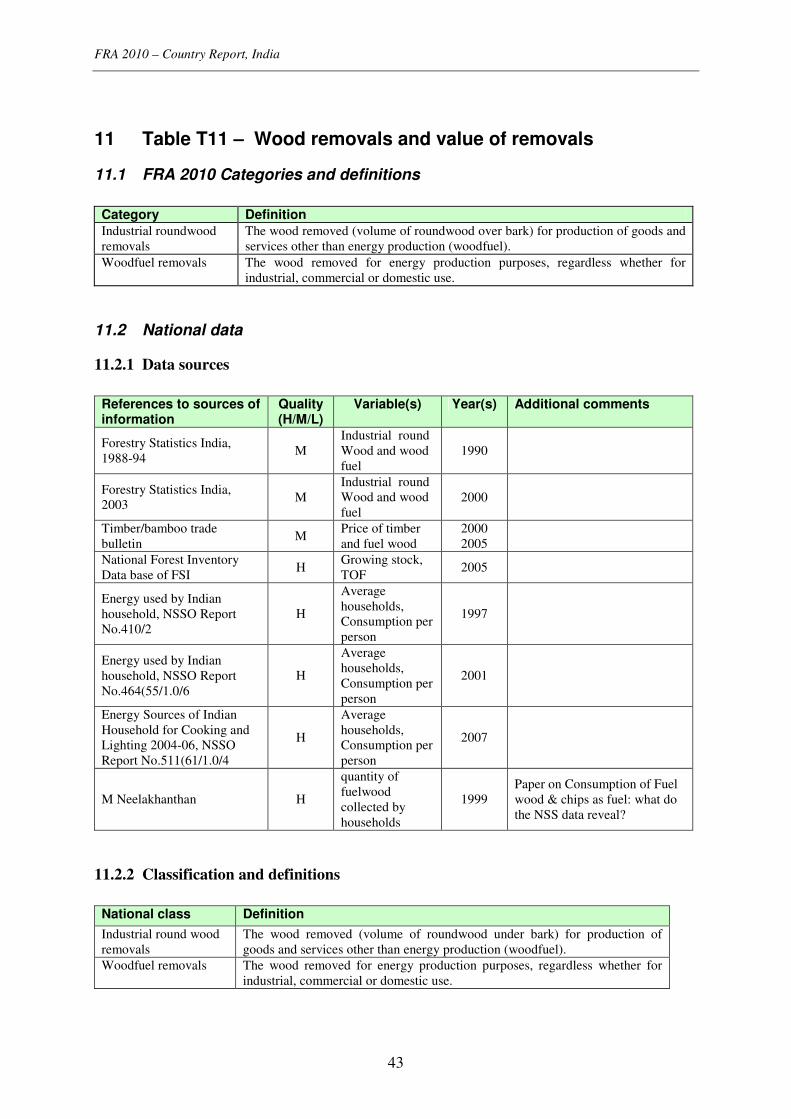
FRA 2010 – Country Report, India
43
11 Table T11 – Wood removals and value of removals
11.1 FRA 2010 Categories and definitions
Category Definition
Industrial roundwood
removals
The wood removed (volume of roundwood over bark) for production of goods and
services other than energy production (woodfuel).
Woodfuel removals
The wood removed for energy production purposes, regardless whether for
industrial, commercial or domestic use.
11.2 National data
11.2.1 Data sources
References to sources of information
Quality (H/M/L)
Variable(s) Year(s) Additional comments
Forestry Statistics India,
1988-94 M
Industrial round
Wood and wood
fuel
1990
Forestry Statistics India,
2003 M
Industrial round
Wood and wood
fuel
2000
Timber/bamboo trade
bulletin M
Price of timber
and fuel wood
2000
2005
National Forest Inventory
Data base of FSI H
Growing stock,
TOF 2005
Energy used by Indian
household, NSSO Report
No.410/2
H
Average
households,
Consumption per
person
1997
Energy used by Indian
household, NSSO Report
No.464(55/1.0/6
H
Average
households,
Consumption per
person
2001
Energy Sources of Indian
Household for Cooking and
Lighting 2004-06, NSSO
Report No.511(61/1.0/4
H
Average
households,
Consumption per
person
2007
M Neelakhanthan H
quantity of
fuelwood
collected by
households
1999
Paper on Consumption of Fuel
wood & chips as fuel: what do
the NSS data reveal?
11.2.2 Classification and definitions
National class Definition
Industrial round wood
removals
The wood removed (volume of roundwood under bark) for production of
goods and services other than energy production (woodfuel).
Woodfuel removals
The wood removed for energy production purposes, regardless whether for
industrial, commercial or domestic use.
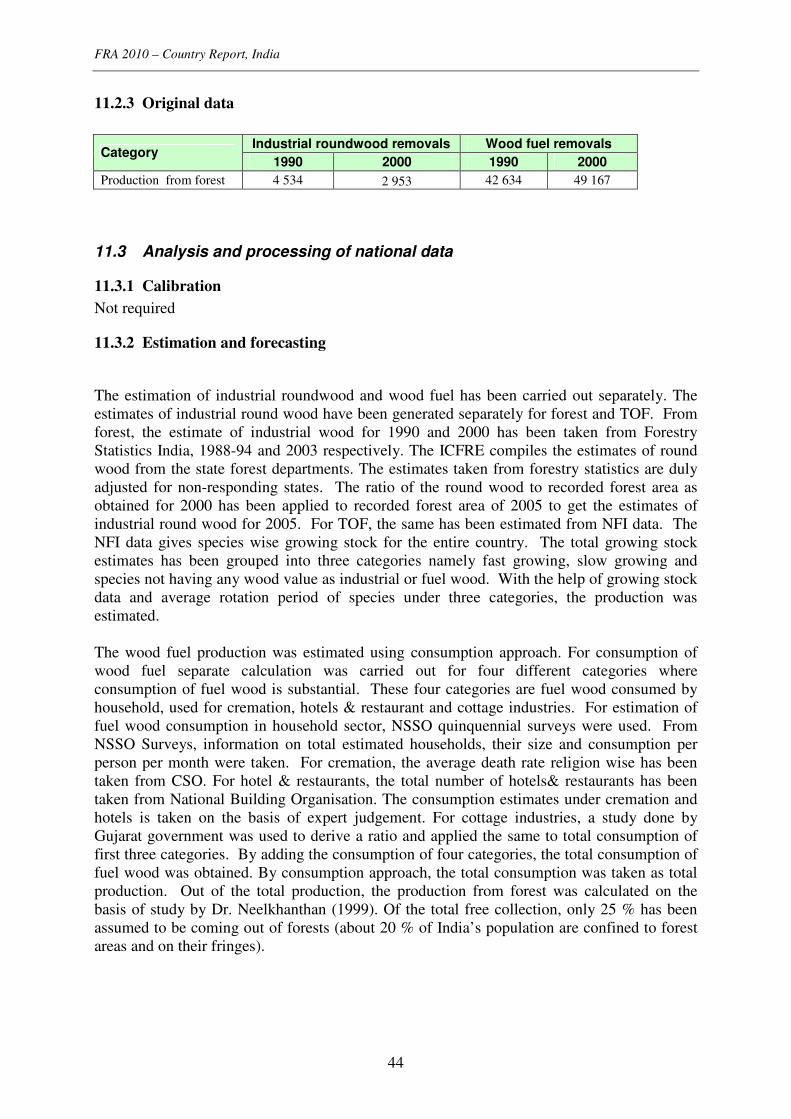
FRA 2010 – Country Report, India
44
11.2.3 Original data
Industrial roundwood removals Wood fuel removals
Category 1990 2000 1990 2000
Production from forest 4 534 2 953 42 634 49 167
11.3 Analysis and processing of national data
11.3.1 Calibration
Not required
11.3.2 Estimation and forecasting
The estimation of industrial roundwood and wood fuel has been carried out separately. The
estimates of industrial round wood have been generated separately for forest and TOF. From
forest, the estimate of industrial wood for 1990 and 2000 has been taken from Forestry
Statistics India, 1988-94 and 2003 respectively. The ICFRE compiles the estimates of round
wood from the state forest departments. The estimates taken from forestry statistics are duly
adjusted for non-responding states. The ratio of the round wood to recorded forest area as
obtained for 2000 has been applied to recorded forest area of 2005 to get the estimates of
industrial round wood for 2005. For TOF, the same has been estimated from NFI data. The
NFI data gives species wise growing stock for the entire country. The total growing stock
estimates has been grouped into three categories namely fast growing, slow growing and
species not having any wood value as industrial or fuel wood. With the help of growing stock
data and average rotation period of species under three categories, the production was
estimated.
The wood fuel production was estimated using consumption approach. For consumption of
wood fuel separate calculation was carried out for four different categories where
consumption of fuel wood is substantial. These four categories are fuel wood consumed by
household, used for cremation, hotels & restaurant and cottage industries. For estimation of
fuel wood consumption in household sector, NSSO quinquennial surveys were used. From
NSSO Surveys, information on total estimated households, their size and consumption per
person per month were taken. For cremation, the average death rate religion wise has been
taken from CSO. For hotel & restaurants, the total number of hotels& restaurants has been
taken from National Building Organisation. The consumption estimates under cremation and
hotels is taken on the basis of expert judgement. For cottage industries, a study done by
Gujarat government was used to derive a ratio and applied the same to total consumption of
first three categories. By adding the consumption of four categories, the total consumption of
fuel wood was obtained. By consumption approach, the total consumption was taken as total
production. Out of the total production, the production from forest was calculated on the
basis of study by Dr. Neelkhanthan (1999). Of the total free collection, only 25 % has been
assumed to be coming out of forests (about 20 % of India’s population are confined to forest
areas and on their fringes).

FRA 2010 – Country Report, India
45
11.3.3 Reclassification into FRA 2010 categories
Not required.
11.4 Data for Table T11
Industrial roundwood removals Wood fuel removals FRA 2010 Category
1990 2000 2005 1990 2000 2005
Total volume (1000 m3 o.b.) 35 055 41173 45 957 213 169 245 837 260 752
... of which from forest 4 534 2 953 2 957 42 634 49 167 52 150
Unit value (local currency / m3 .b.) 2 780 4 643 6 000 556 929 1200
Total value (1000 local currency) 97453000 191166000 275742000 118522000 228382000 312902000
1990 2000 2005
Name of local currency INR INR INR
11.5 Comments to Table T11
Variable / category Comments related to data, definitions, etc.
Comments on the reported trend
Total volume of
industrial roundwood
removals
The wood removal from forests
constitutes only about 6 % of the total
and the rest is from TOF where the
removal is derived from the growing
stock of the TOF estimated by FSI. For
the annual removal from TOF, a
rotation of 10 years has been assumed
for fast growing tree species and 60
years for other tree species with
industrial wood value.
More and more wood is coming from
TOF.
Total volume of
woodfuel removals
Unit value For unit value expert judgement has
been taken from Timber/bamboo
bulletin which provides prices of
different spp. of timber in different dia-
meter class.
Total value

FRA 2010 – Country Report, India
46
12 Table T12 – Non-wood forest products removals and value of removals
12.1 FRA 2010 Categories and definitions
Term Definition
Non-wood forest product (NWFP)
Goods derived from forests that are tangible and physical objects of biological origin other than wood.
Value of NWFP removals For the purpose of this table, value is defined as the market value at the site of collection or forest border.
NWFP categories Category
Plant products / raw material 1. Food 2. Fodder 3. Raw material for medicine and aromatic products 4. Raw material for colorants and dyes 5. Raw material for utensils, handicrafts &
construction 6. Ornamental plants 7. Exudates 8. Other plant products Animal products / raw material 9. Living animals 10. Hides, skins and trophies 11. Wild honey and bee-wax 12. Wild meat 13. Raw material for medicine 14. Raw material for colorants 15. Other edible animal products 16. Other non-edible animal products
12.2 National data
12.2.1 Data sources
References to sources of information
Quality (H/M/L)
Variable(s) Year(s) Additional comments
Forestry Statistics India,
2003 M
Non-wood
forest
products
2000, 2001
12.2.2 Classification and definitions
National class Definition
Non-wood forest
product (NWFP)
Goods derived from forests that are tangible and physical objects of biological
origin other than wood.
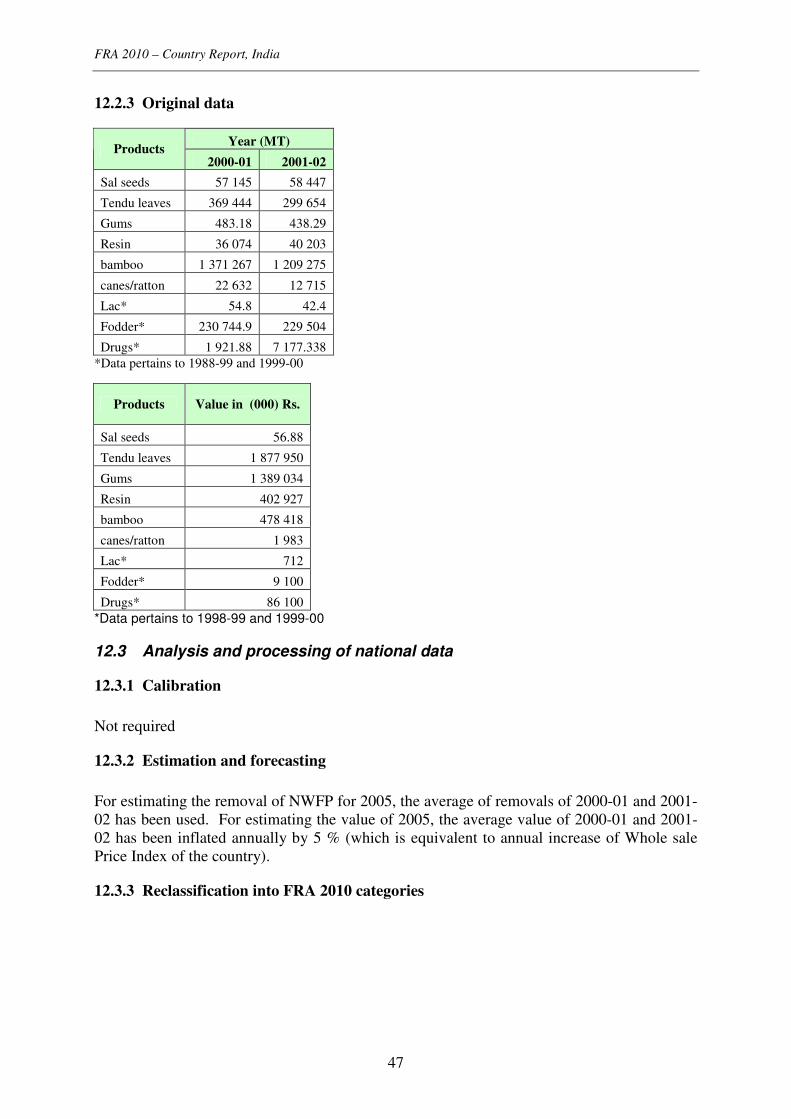
FRA 2010 – Country Report, India
47
12.2.3 Original data
Year (MT) Products
2000-01 2001-02
Sal seeds 57 145 58 447
Tendu leaves 369 444 299 654
Gums 483.18 438.29
Resin 36 074 40 203
bamboo 1 371 267 1 209 275
canes/ratton 22 632 12 715
Lac* 54.8 42.4
Fodder* 230 744.9 229 504
Drugs* 1 921.88 7 177.338
*Data pertains to 1988-99 and 1999-00
Products Value in (000) Rs.
Sal seeds 56.88
Tendu leaves 1 877 950
Gums 1 389 034
Resin 402 927
bamboo 478 418
canes/ratton 1 983
Lac* 712
Fodder* 9 100
Drugs* 86 100
*Data pertains to 1998-99 and 1999-00
12.3 Analysis and processing of national data
12.3.1 Calibration
Not required
12.3.2 Estimation and forecasting
For estimating the removal of NWFP for 2005, the average of removals of 2000-01 and 2001-
02 has been used. For estimating the value of 2005, the average value of 2000-01 and 2001-
02 has been inflated annually by 5 % (which is equivalent to annual increase of Whole sale
Price Index of the country).
12.3.3 Reclassification into FRA 2010 categories
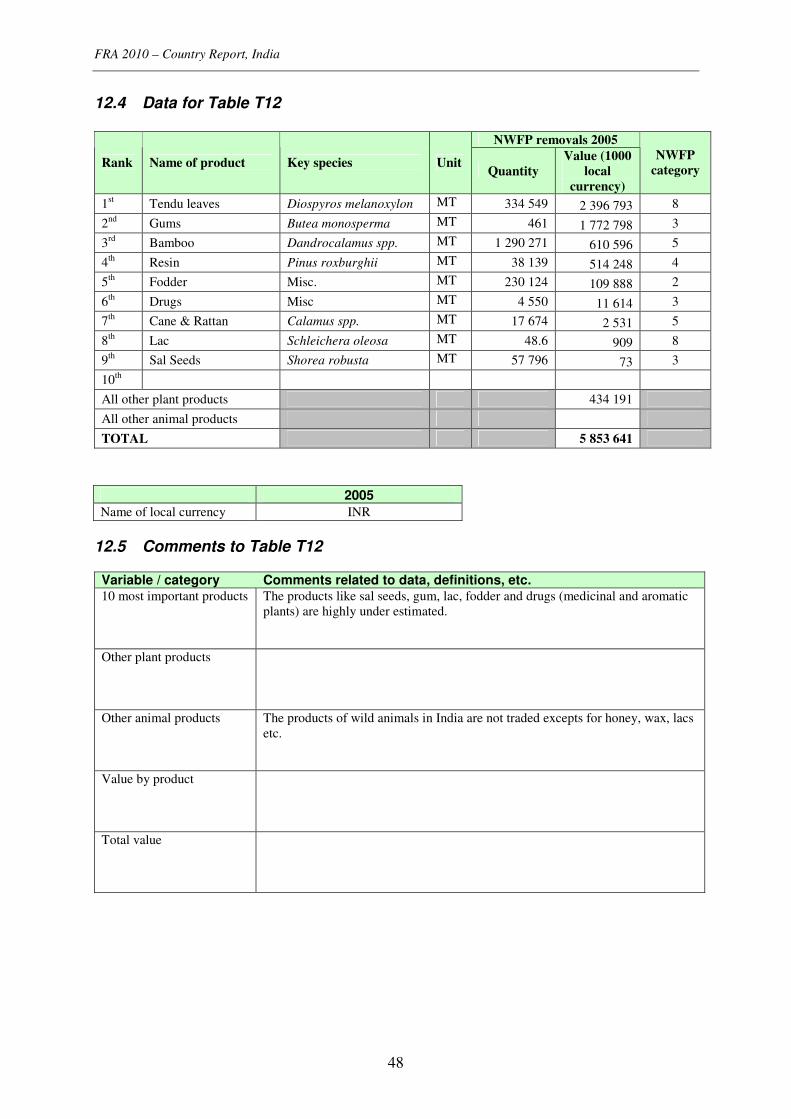
FRA 2010 – Country Report, India
48
12.4 Data for Table T12
NWFP removals 2005
Rank Name of product Key species Unit Quantity
Value (1000
local
currency)
NWFP
category
1st Tendu leaves Diospyros melanoxylon MT 334 549 2 396 793 8
2nd
Gums Butea monosperma MT 461 1 772 798 3
3rd
Bamboo Dandrocalamus spp. MT 1 290 271 610 596 5
4th
Resin Pinus roxburghii MT 38 139 514 248 4
5th
Fodder Misc. MT 230 124 109 888 2
6th
Drugs Misc MT 4 550 11 614 3
7th
Cane & Rattan Calamus spp. MT 17 674 2 531 5
8th
Lac Schleichera oleosa MT 48.6 909 8
9th
Sal Seeds Shorea robusta MT 57 796 73 3
10th
All other plant products 434 191
All other animal products
TOTAL 5 853 641
2005
Name of local currency INR
12.5 Comments to Table T12
Variable / category Comments related to data, definitions, etc. 10 most important products The products like sal seeds, gum, lac, fodder and drugs (medicinal and aromatic
plants) are highly under estimated.
Other plant products
Other animal products The products of wild animals in India are not traded excepts for honey, wax, lacs
etc.
Value by product
Total value
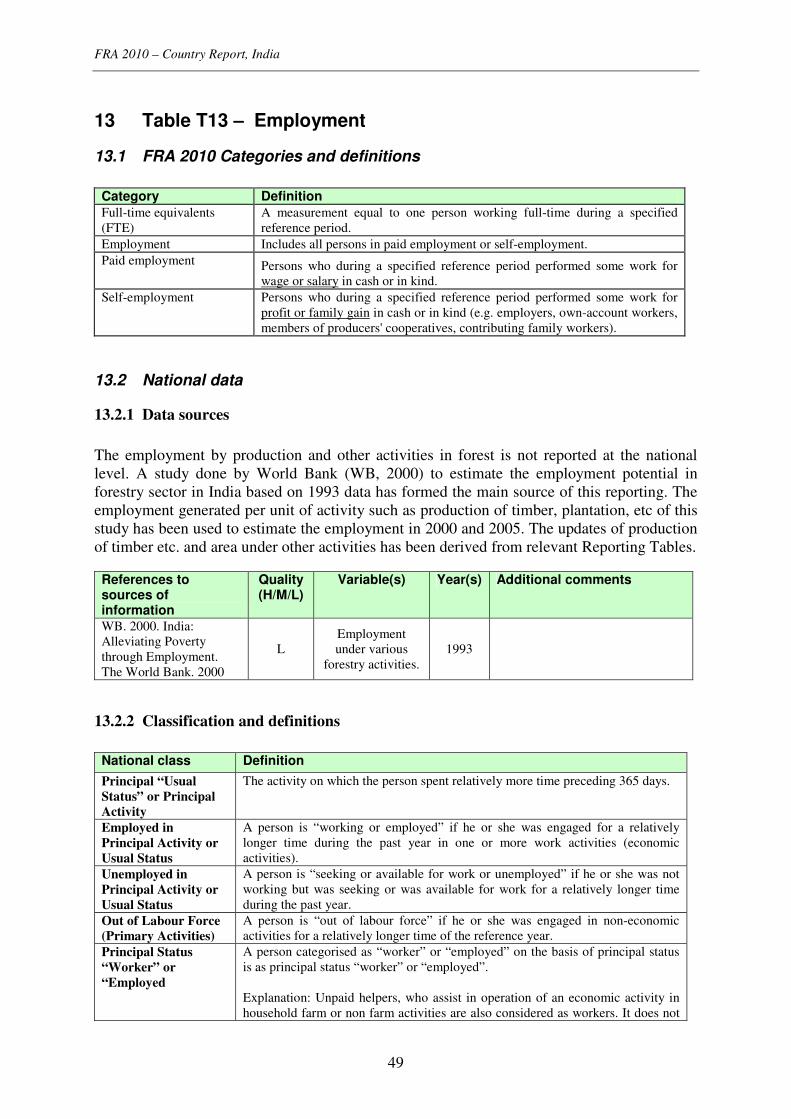
FRA 2010 – Country Report, India
49
13 Table T13 – Employment
13.1 FRA 2010 Categories and definitions
Category Definition
Full-time equivalents
(FTE)
A measurement equal to one person working full-time during a specified
reference period.
Employment Includes all persons in paid employment or self-employment.
Paid employment Persons who during a specified reference period performed some work for
wage or salary in cash or in kind.
Self-employment Persons who during a specified reference period performed some work for
profit or family gain in cash or in kind (e.g. employers, own-account workers,
members of producers' cooperatives, contributing family workers).
13.2 National data
13.2.1 Data sources
The employment by production and other activities in forest is not reported at the national
level. A study done by World Bank (WB, 2000) to estimate the employment potential in
forestry sector in India based on 1993 data has formed the main source of this reporting. The
employment generated per unit of activity such as production of timber, plantation, etc of this
study has been used to estimate the employment in 2000 and 2005. The updates of production
of timber etc. and area under other activities has been derived from relevant Reporting Tables. References to sources of information
Quality (H/M/L)
Variable(s) Year(s) Additional comments
WB. 2000. India:
Alleviating Poverty
through Employment.
The World Bank. 2000
L
Employment
under various
forestry activities. 1993
13.2.2 Classification and definitions
National class Definition
Principal “Usual
Status” or Principal
Activity
The activity on which the person spent relatively more time preceding 365 days.
Employed in
Principal Activity or
Usual Status
A person is “working or employed” if he or she was engaged for a relatively
longer time during the past year in one or more work activities (economic
activities).
Unemployed in
Principal Activity or
Usual Status
A person is “seeking or available for work or unemployed” if he or she was not
working but was seeking or was available for work for a relatively longer time
during the past year.
Out of Labour Force
(Primary Activities)
A person is “out of labour force” if he or she was engaged in non-economic
activities for a relatively longer time of the reference year.
Principal Status
“Worker” or
“Employed
A person categorised as “worker” or “employed” on the basis of principal status
is as principal status “worker” or “employed”.
Explanation: Unpaid helpers, who assist in operation of an economic activity in
household farm or non farm activities are also considered as workers. It does not
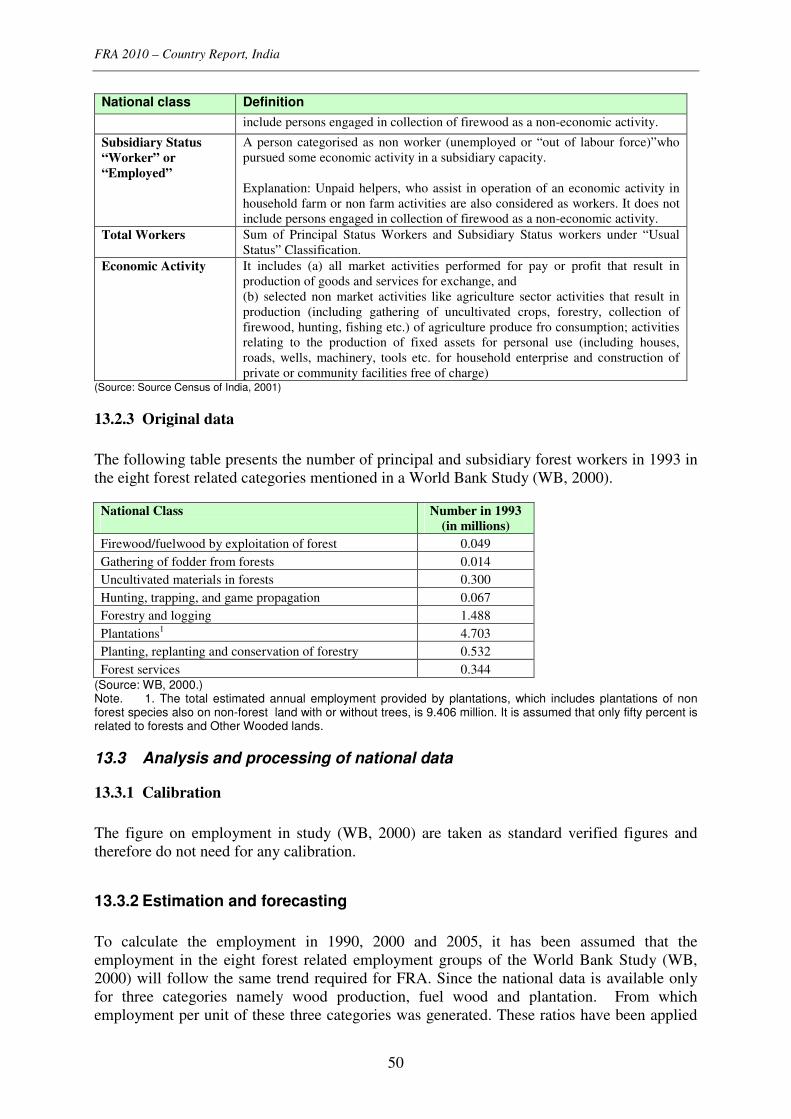
FRA 2010 – Country Report, India
50
National class Definition
include persons engaged in collection of firewood as a non-economic activity.
Subsidiary Status
“Worker” or
“Employed”
A person categorised as non worker (unemployed or “out of labour force)”who
pursued some economic activity in a subsidiary capacity.
Explanation: Unpaid helpers, who assist in operation of an economic activity in
household farm or non farm activities are also considered as workers. It does not
include persons engaged in collection of firewood as a non-economic activity.
Total Workers Sum of Principal Status Workers and Subsidiary Status workers under “Usual
Status” Classification.
Economic Activity It includes (a) all market activities performed for pay or profit that result in
production of goods and services for exchange, and
(b) selected non market activities like agriculture sector activities that result in
production (including gathering of uncultivated crops, forestry, collection of
firewood, hunting, fishing etc.) of agriculture produce fro consumption; activities
relating to the production of fixed assets for personal use (including houses,
roads, wells, machinery, tools etc. for household enterprise and construction of
private or community facilities free of charge) (Source: Source Census of India, 2001)
13.2.3 Original data
The following table presents the number of principal and subsidiary forest workers in 1993 in
the eight forest related categories mentioned in a World Bank Study (WB, 2000).
National Class
Number in 1993
(in millions)
Firewood/fuelwood by exploitation of forest 0.049
Gathering of fodder from forests 0.014
Uncultivated materials in forests 0.300
Hunting, trapping, and game propagation 0.067
Forestry and logging 1.488
Plantations1 4.703
Planting, replanting and conservation of forestry 0.532
Forest services 0.344
(Source: WB, 2000.) Note. 1. The total estimated annual employment provided by plantations, which includes plantations of non forest species also on non-forest land with or without trees, is 9.406 million. It is assumed that only fifty percent is related to forests and Other Wooded lands.
13.3 Analysis and processing of national data
13.3.1 Calibration
The figure on employment in study (WB, 2000) are taken as standard verified figures and
therefore do not need for any calibration.
13.3.2 Estimation and forecasting
To calculate the employment in 1990, 2000 and 2005, it has been assumed that the
employment in the eight forest related employment groups of the World Bank Study (WB,
2000) will follow the same trend required for FRA. Since the national data is available only
for three categories namely wood production, fuel wood and plantation. From which
employment per unit of these three categories was generated. These ratios have been applied
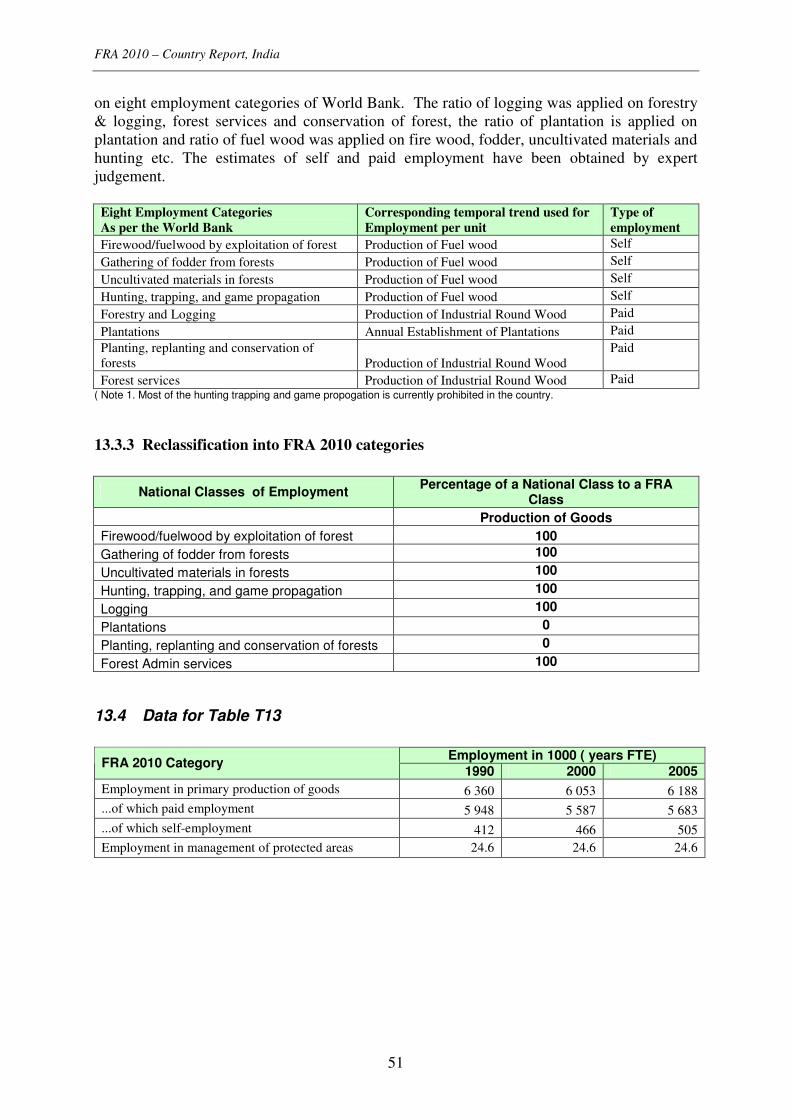
FRA 2010 – Country Report, India
51
on eight employment categories of World Bank. The ratio of logging was applied on forestry
& logging, forest services and conservation of forest, the ratio of plantation is applied on
plantation and ratio of fuel wood was applied on fire wood, fodder, uncultivated materials and
hunting etc. The estimates of self and paid employment have been obtained by expert
judgement.
Eight Employment Categories
As per the World Bank
Corresponding temporal trend used for
Employment per unit
Type of
employment
Firewood/fuelwood by exploitation of forest Production of Fuel wood Self
Gathering of fodder from forests Production of Fuel wood Self
Uncultivated materials in forests Production of Fuel wood Self
Hunting, trapping, and game propagation Production of Fuel wood Self
Forestry and Logging Production of Industrial Round Wood Paid
Plantations Annual Establishment of Plantations Paid
Planting, replanting and conservation of
forests Production of Industrial Round Wood
Paid
Forest services Production of Industrial Round Wood Paid
( Note 1. Most of the hunting trapping and game propogation is currently prohibited in the country.
13.3.3 Reclassification into FRA 2010 categories
National Classes of Employment Percentage of a National Class to a FRA
Class
Production of Goods
Firewood/fuelwood by exploitation of forest 100
Gathering of fodder from forests 100
Uncultivated materials in forests 100
Hunting, trapping, and game propagation 100
Logging 100
Plantations 0
Planting, replanting and conservation of forests 0
Forest Admin services 100
13.4 Data for Table T13
Employment in 1000 ( years FTE)
FRA 2010 Category 1990 2000 2005
Employment in primary production of goods 6 360 6 053 6 188
...of which paid employment 5 948 5 587 5 683
...of which self-employment 412 466 505
Employment in management of protected areas 24.6 24.6 24.6
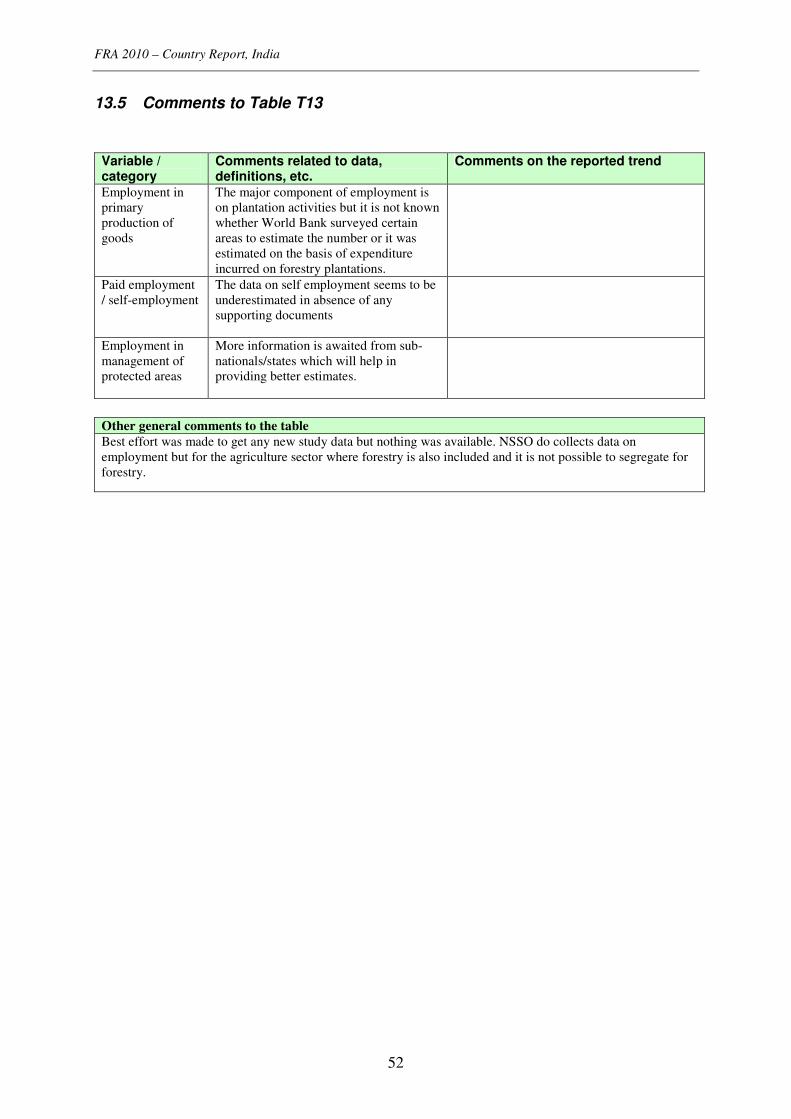
FRA 2010 – Country Report, India
52
13.5 Comments to Table T13
Variable / category
Comments related to data, definitions, etc.
Comments on the reported trend
Employment in
primary
production of
goods
The major component of employment is
on plantation activities but it is not known
whether World Bank surveyed certain
areas to estimate the number or it was
estimated on the basis of expenditure
incurred on forestry plantations.
Paid employment
/ self-employment
The data on self employment seems to be
underestimated in absence of any
supporting documents
Employment in
management of
protected areas
More information is awaited from sub-
nationals/states which will help in
providing better estimates.
Other general comments to the table
Best effort was made to get any new study data but nothing was available. NSSO do collects data on
employment but for the agriculture sector where forestry is also included and it is not possible to segregate for
forestry.

FRA 2010 – Country Report, India
53
14 Table T14 – Policy and legal framework
14.1 FRA 2010 Categories and definitions
Term Definition
Forest policy A set of orientations and principles of actions adopted by public authorities in
harmony with national socio-economic and environmental policies in a given
country to guide future decisions in relation to the management, use and
conservation of forest and tree resources for the benefit of society.
Forest policy
statement
A document that describes the objectives, priorities and means for implementation
of the forest policy.
National forest
programme (nfp)
A generic expression that refers to a wide range of approaches towards forest policy
formulation, planning and implementation at national and sub-national levels. The
national forest programme provides a framework and guidance for country-driven
forest sector development with participation of all stakeholders and in consistence
with policies of other sectors and international policies.
Law (Act or Code)
on forest
A set of rules enacted by the legislative authority of a country regulating the access,
management, conservation and use of forest resources.
14.2 Data for Table T14
Indicate the existence of the following (2008)
√ Yes Forest policy statement with national scope
No
Year of endorsement 1988 If Yes above, provide:
Reference to document National Forest Policy, 1988
√ Yes National forest programme (nfp)
No
Name of nfp in country National Forestry Action Plan
Starting year 1999
In formulation
√ In implementation
Under revision Current status
Process temporarily suspended
If Yes above, provide:
Reference to document or web
site www.envfor.nic.in
√ Yes, specific forest law exists
√ Yes, but rules on forests are incorpo-
rated in other (broader) legislation Law (Act or Code) on forest with national scope
No, forest issues are not regulated by
national legislation
Year of enactment 1927, 1972, 1980
Year of latest amendment Time to time If Yes above, provide:
Reference to document
Indian Forest Act 1927
Wildlife ( Protection ) Act, 1972
Forest Conversation Act, 1980
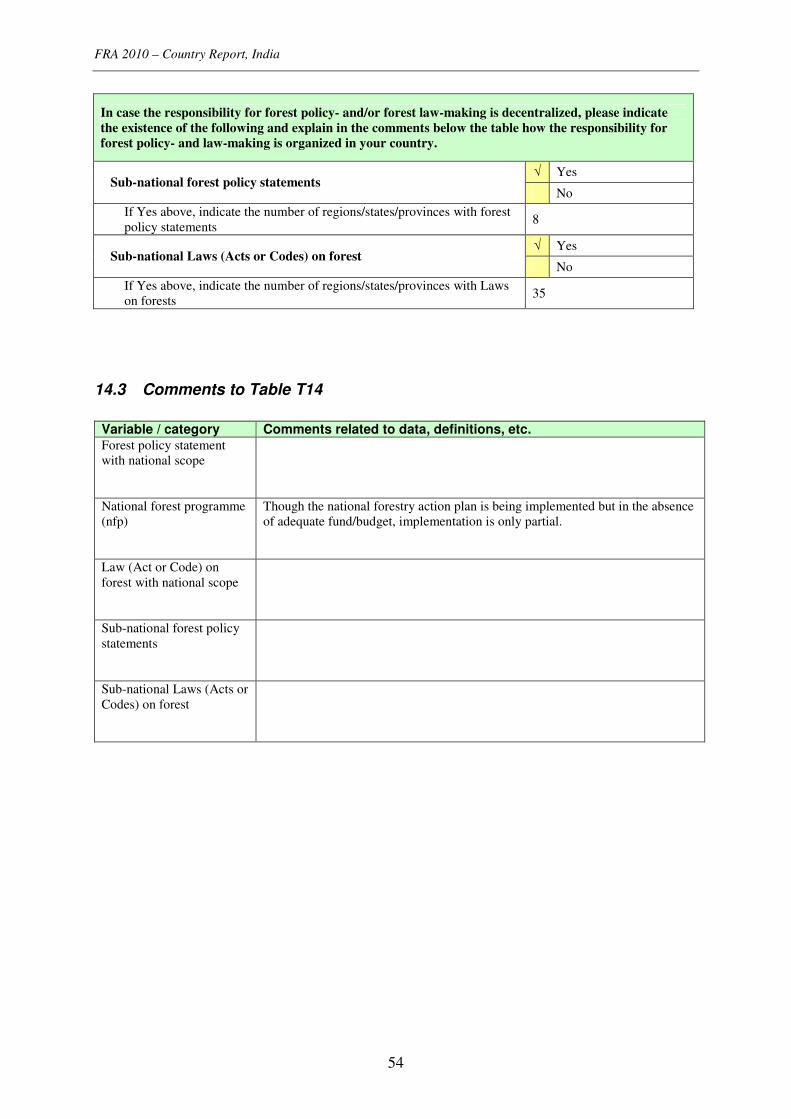
FRA 2010 – Country Report, India
54
In case the responsibility for forest policy- and/or forest law-making is decentralized, please indicate
the existence of the following and explain in the comments below the table how the responsibility for
forest policy- and law-making is organized in your country.
√ Yes Sub-national forest policy statements
No
If Yes above, indicate the number of regions/states/provinces with forest
policy statements 8
√ Yes Sub-national Laws (Acts or Codes) on forest
No
If Yes above, indicate the number of regions/states/provinces with Laws
on forests 35
14.3 Comments to Table T14
Variable / category Comments related to data, definitions, etc. Forest policy statement
with national scope
National forest programme
(nfp)
Though the national forestry action plan is being implemented but in the absence
of adequate fund/budget, implementation is only partial.
Law (Act or Code) on
forest with national scope
Sub-national forest policy
statements
Sub-national Laws (Acts or
Codes) on forest

FRA 2010 – Country Report, India
55
15 Table T15 – Institutional framework
15.1 FRA 2010 Categories and definitions
Term Definition
Minister responsible for
forest policy-making
Minister holding the main responsibility for forest issues and the formulation of
the forest policy.
Head of Forestry The Head of Forestry is the Government Officer responsible for implementing
the mandate of the public administration related to forests.
Level of subordination Number of administrative levels between the Head of Forestry and the Minister.
University degree Qualification provided by University after a minimum of 3 years of post
secondary education.
15.2 Data for Table T15
Table 15a – Institutions FRA 2010 Category 2008
Minister responsible for forest policy formulation :
please provide full title
Minister for Environment & Forests
1st level subordination to Minister
√ 2nd
level subordination to Minister
3rd
level subordination to Minister
Level of subordination of Head of Forestry within
the Ministry
4th
or lower level subordination to Minister
Other public forest agencies at national level
None
Institution(s) responsible for forest law enforcement
Ministry of Environment & Forests and the Regional
offices,
State Forest Departments,
National Tiger Conservation Authority,
Directorate of Wildlife Preservation,

FRA 2010 – Country Report, India
56
Table 15b – Human resources
Human resources within public forest institutions
2000 2005 2008 FRA 2010 Category
Number %Female Number %Female Number %Female
Total staff
180 596 4.07 179 673 4.07 179 119 4.06
...of which with university
degree or equivalent 33 435 7.05 33 264 7.05 33 161 7.05
Notes: The data of the total human resources working under state forest departments is taken
firstly from Forestry Statistics, India (ICFRE) 2001 and 2003. In addition many state forest
departments and forestry institutions under central governments provided the latest data
(2008) on total human resources as well as the percentage of female and the educational
qualifications of their staff.
15.3 Comments to Table T15
Variable / category Comments related to data, definitions, etc. Comments on the
reported trend Minister responsible for
forest policy formulation
Level of subordination of
Head of Forestry within the
Ministry
Other public forest
agencies at national level
Institution(s) responsible
for forest law enforcement
Human resources within
public forest institutions
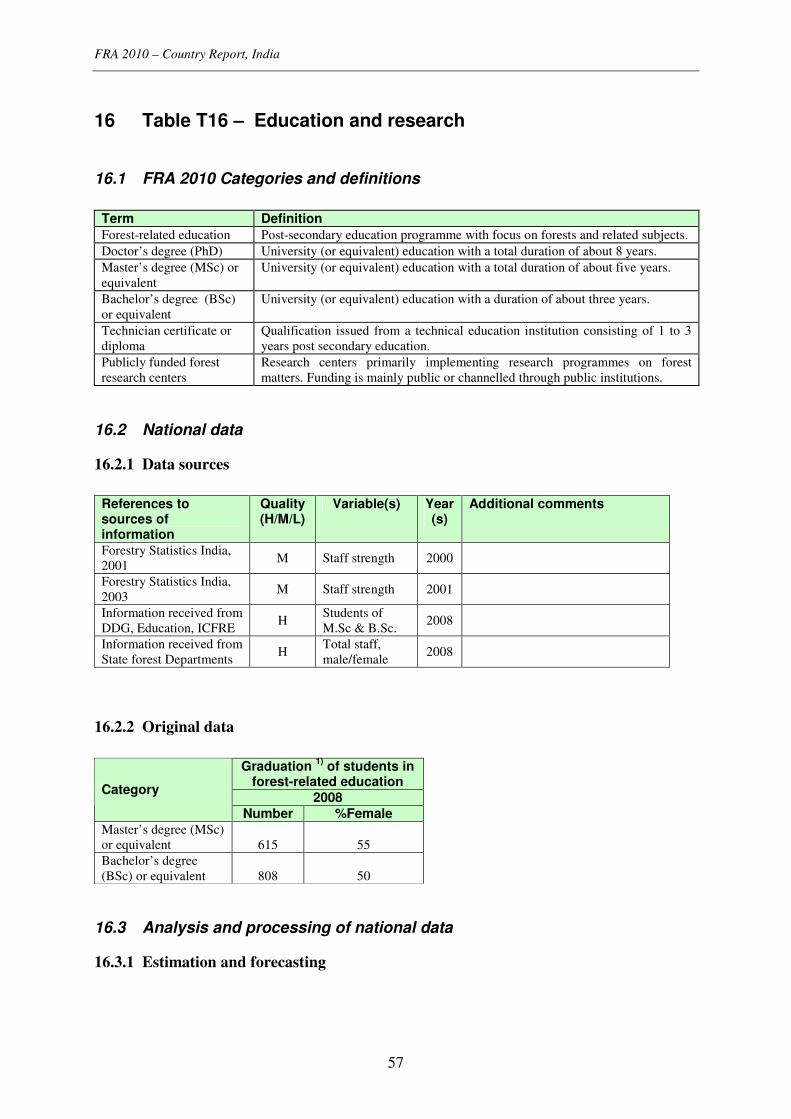
FRA 2010 – Country Report, India
57
16 Table T16 – Education and research
16.1 FRA 2010 Categories and definitions
Term Definition
Forest-related education Post-secondary education programme with focus on forests and related subjects.
Doctor’s degree (PhD) University (or equivalent) education with a total duration of about 8 years.
Master’s degree (MSc) or
equivalent
University (or equivalent) education with a total duration of about five years.
Bachelor’s degree (BSc)
or equivalent
University (or equivalent) education with a duration of about three years.
Technician certificate or
diploma
Qualification issued from a technical education institution consisting of 1 to 3
years post secondary education.
Publicly funded forest
research centers
Research centers primarily implementing research programmes on forest
matters. Funding is mainly public or channelled through public institutions.
16.2 National data
16.2.1 Data sources
References to sources of information
Quality (H/M/L)
Variable(s) Year(s)
Additional comments
Forestry Statistics India,
2001 M Staff strength 2000
Forestry Statistics India,
2003 M Staff strength 2001
Information received from
DDG, Education, ICFRE H
Students of
M.Sc & B.Sc. 2008
Information received from
State forest Departments H
Total staff,
male/female 2008
16.2.2 Original data
Graduation
1) of students in
forest-related education
2008 Category
Number %Female Master’s degree (MSc)
or equivalent 615 55
Bachelor’s degree
(BSc) or equivalent 808 50
16.3 Analysis and processing of national data
16.3.1 Estimation and forecasting

FRA 2010 – Country Report, India
58
The number of students in MSc and BSc for 2008 along with percentage of female has been
compiled from ICFRE. For other years, the same intake has been presumed. For
professionals working under publicly funded forest research, persons working in state forest
department and central organisation have been combined. The bifurcation of total staff
among different categories and percentage of female has been worked out from the
information received from state forest departments. Data for Table T16
Graduation 1)
of students in forest-related education
2000 2005 2008 FRA 2010 Category
Number %Female Number %Female Number %Female
Master’s degree (MSc)
or equivalent 565 55% 565 55% 565 55%
Bachelor’s degree
(BSc) or equivalent 808 50% 808 50% 808 50%
Forest technician
certificate / diploma 3 000 2% 3 000 2% 3 000 2%
Professionals working in publicly funded forest research centres 2)
2000 2005 2008 FRA 2010 Category
Number %Female Number %Female Number %Female
Doctor’s degree (PhD)
482 24 425 24 394 24
Master’s degree (MSc)
or equivalent 1 226 23 1 080 23 1 002 23
Bachelor’s degree
(BSc) or equivalent 1 572 18 1 389 18 1 289 18
16.4 Comments to Table T16
Variable / category Comments related to data,
definitions, etc.
Comments on the reported trend
Graduation of students in
forest-related education
The numbers mentioned are average of
at least five years and therefore have
been rounded off. The number
specially of technician level who are
given in service education/training is
highly inconsistent.
Numbers are more or less static.
Professionals working in
public forest research
centres

FRA 2010 – Country Report, India
59
17 Table T17 – Public revenue collection and expenditure
17.1 FRA 2010 Categories and definitions
Category Definition
Forest revenue All government revenue collected from the domestic production and trade of
forest products and services. For this purpose, forest products include:
roundwood; sawnwood; wood-based panels; pulp and paper; and non-wood forest
products. As far as possible, this should include revenue collected by all levels of
government (i.e. central, regional/provincial and municipal level), but it should
exclude the income of publicly owned business entities.
Public expenditure All government expenditure on forest related activities (further defined below).
Operational expenditure
(sub-category to Public
expenditure)
All government expenditure on public institutions solely engaged in the forest
sector. Where the forest administration is part of a larger public agency (e.g.
department or ministry), this should only include the forest sector component of
the agency’s total expenditure. As far as possible, this should also include other
institutions (e.g. in research, training and marketing) solely engaged in the forest
sector, but it should exclude the expenditure of publicly owned business entities.
Transfer payments
(sub-category to Public
expenditure)
All government expenditure on direct financial incentives paid to non-
government and private-sector institutions, enterprises communities or
individuals operating in the forest sector to implement forest related activities.
Domestic funding
Public expenditure funded from domestic public financial resources, including:
retained forest revenue; forest-related funds; and allocations from the national
budget (i.e. from non-forest sector public revenue sources).
External funding
Public expenditure funded from grants and loans from donors, non-governmental
organisations, international lending agencies and international organisations,
where such funds are channelled through national public institutions.
17.2 National data
17.2.1 Data sources
References to sources of
information
Quality
(H/M/L)
Variable(s) Year(s) Additional comments
Revenue 2000,
2005
Table 17a - Forest revenues
Revenues (1000 Rupees) FRA 2010 Categories
2000 2005
Forest revenue 15 165 800
15 074 200
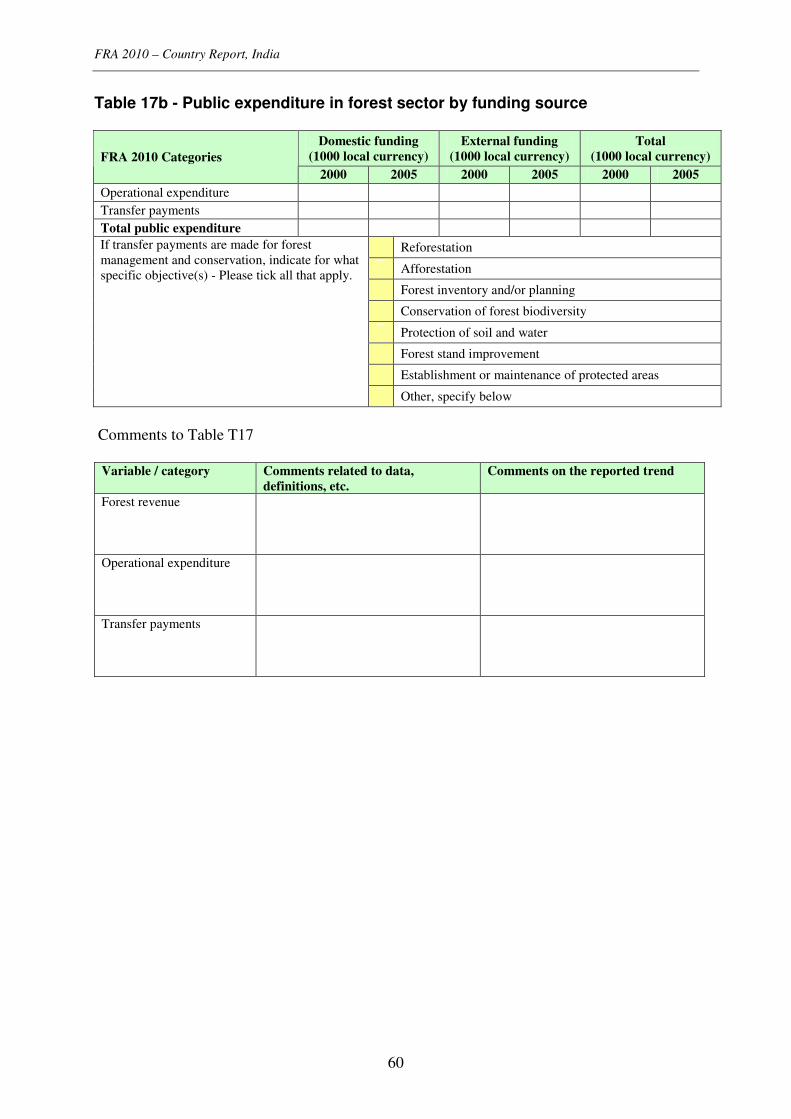
FRA 2010 – Country Report, India
60
Table 17b - Public expenditure in forest sector by funding source
Domestic funding
(1000 local currency)
External funding
(1000 local currency)
Total
(1000 local currency) FRA 2010 Categories
2000 2005 2000 2005 2000 2005
Operational expenditure
Transfer payments
Total public expenditure
Reforestation
Afforestation
Forest inventory and/or planning
Conservation of forest biodiversity
Protection of soil and water
Forest stand improvement
Establishment or maintenance of protected areas
If transfer payments are made for forest
management and conservation, indicate for what
specific objective(s) - Please tick all that apply.
Other, specify below
Comments to Table T17
Variable / category Comments related to data,
definitions, etc.
Comments on the reported trend
Forest revenue
Operational expenditure
Transfer payments