FORESTRY BMPs
16
1 Compliance and Implementation Monitoring Report, 2011-2014 FORESTRY BMPs IN SOUTH CAROLINA
Transcript of FORESTRY BMPs

1
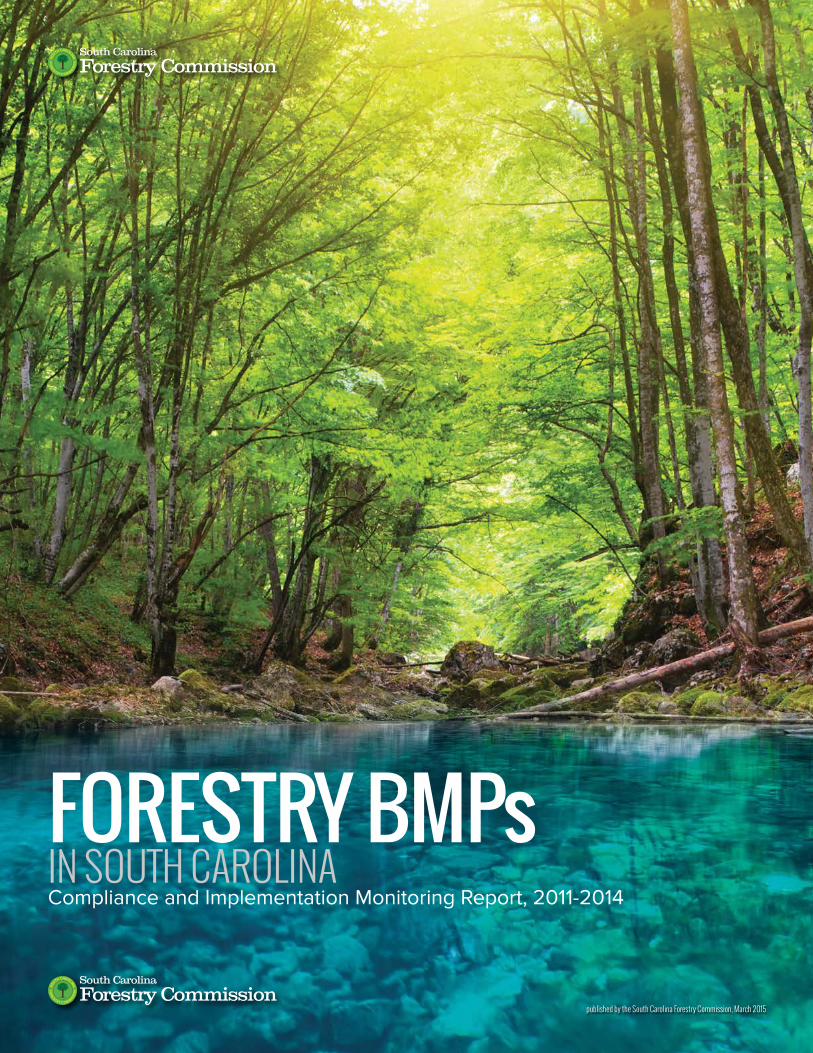
Compliance and Implementation Monitoring Report, 2011-2014
FORESTRY BMPsIN SOUTH CAROLINA
2
CONTENTSEXECUTIVE SUMMARY
COMPLIANCE TRENDS
STUDY METHODS
OTHER FINDINGS
MONITORING RESULTS
CONCLUSION
Compliance and Implementation Monitoring of
Forestry Best Management Practices in South
Carolina 2011-2014: A Follow-up to the 2011-
2012 Report
Prepared by
Herb Nicholson
Environmental Program Manager
South Carolina Forestry Commission
Best Management Practices Monitoring Report
BMP-9, published by the South Carolina
Forestry Commission, March 2015
This project was funded in part by the U.S.
Environmental Protection Agency under a
section 319 grant through the SC Department
of Health and Environmental Control (DHEC).
3
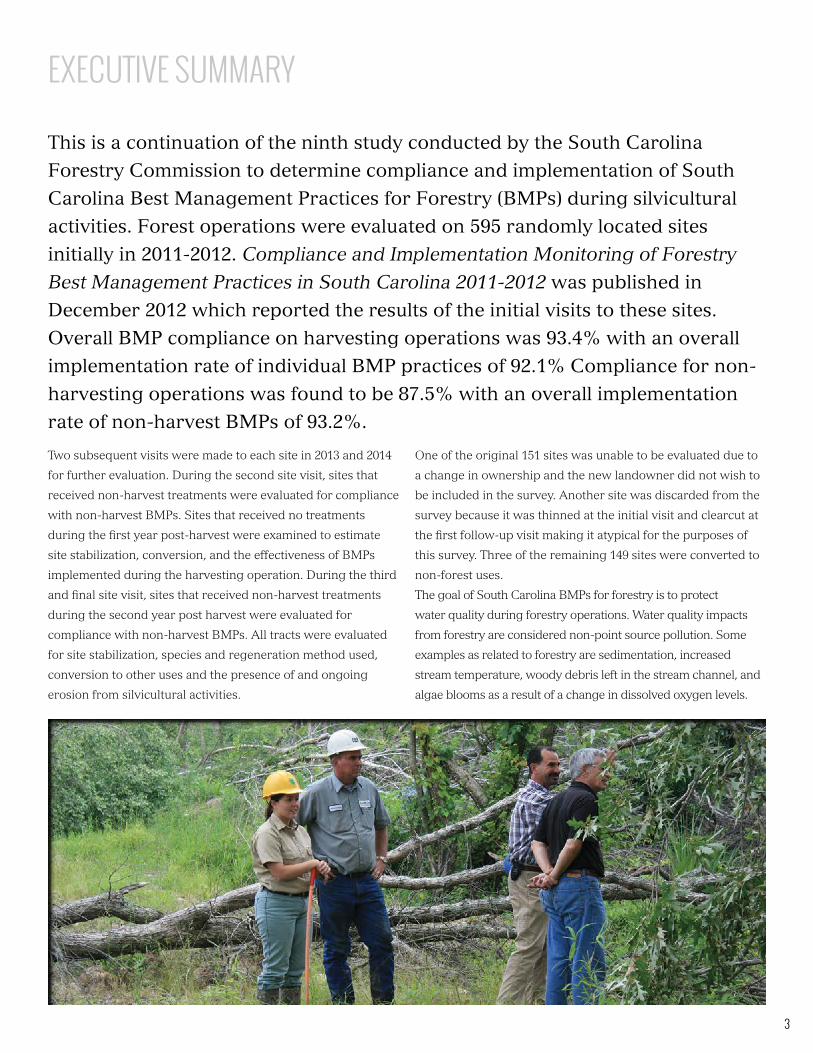
EXECUTIVE SUMMARY
This is a continuation of the ninth study conducted by the South Carolina
Forestry Commission to determine compliance and implementation of South
Carolina Best Management Practices for Forestry (BMPs) during silvicultural
activities. Forest operations were evaluated on 595 randomly located sites
initially in 2011-2012. Compliance and Implementation Monitoring of Forestry
Best Management Practices in South Carolina 2011-2012 was published in
December 2012 which reported the results of the initial visits to these sites.
Overall BMP compliance on harvesting operations was 93.4% with an overall
implementation rate of individual BMP practices of 92.1% Compliance for non-
harvesting operations was found to be 87.5% with an overall implementation
rate of non-harvest BMPs of 93.2%.
Two subsequent visits were made to each site in 2013 and 2014
for further evaluation. During the second site visit, sites that
received non-harvest treatments were evaluated for compliance
with non-harvest BMPs. Sites that received no treatments
during the first year post-harvest were examined to estimate
site stabilization, conversion, and the effectiveness of BMPs
implemented during the harvesting operation. During the third
and final site visit, sites that received non-harvest treatments
during the second year post harvest were evaluated for
compliance with non-harvest BMPs. All tracts were evaluated
for site stabilization, species and regeneration method used,
conversion to other uses and the presence of and ongoing
erosion from silvicultural activities.
One of the original 151 sites was unable to be evaluated due to
a change in ownership and the new landowner did not wish to
be included in the survey. Another site was discarded from the
survey because it was thinned at the initial visit and clearcut at
the first follow-up visit making it atypical for the purposes of
this survey. Three of the remaining 149 sites were converted to
non-forest uses.
The goal of South Carolina BMPs for forestry is to protect
water quality during forestry operations. Water quality impacts
from forestry are considered non-point source pollution. Some
examples as related to forestry are sedimentation, increased
stream temperature, woody debris left in the stream channel, and
algae blooms as a result of a change in dissolved oxygen levels.

4
STUDY METHODS
SITE FOLLOW UP VISIT: 1 YEAR POST-HARVESTIn spring of 2013, all of the monitoring sites were revisited to evaluate compliance with non-harvest BMPs and to gather additional
information on several other variables including conversion, site stabilization, blowdown within streamside management zones
(SMZs) and whether or not BMPs implemented during the harvest were still performing effectively.
During this site visit, the entire site was examined to determine if a non-harvest treatment had been conducted during the first
year following the harvest. If the site received a non-harvest treatment during the first year after harvest, a BMP compliance
inspection was conducted. The inspection covered compliance and implementation of BMPs in each of six categories:
Site preparation treatments
Reforestation
Prescribed burning
Pesticide application
Fertilization application
Minor drainage
Each category was evaluated on a pass/fail basis depending on the responses to a series of yes/no questions within each category.
After each operation was evaluated, the site was rated for overall BMP compliance. Sites were rated excellent, adequate, or
inadequate depending on the level of BMP compliance.
If the site had not been site prepared or reforested after one year, information was collected on the site regarding site stabilization
in both high and light traffic areas. In both high and light traffic areas, percent bare ground was estimated in 5% increments.
Other questions were also answered for each site:
Are stream crossings currently stable?
Is there a water quality or sediment deposition impact from a crossing failure?
Are road waterbars and water control structures functioning?
Is there blowdown within the SMZ? If so, what species?
SITE FOLLOW-UP VISIT: 2 YEARS POST-HARVESTIn spring of 2014, each site was visited a third time. Sites that received non-harvest treatments within the second year post-harvest
were evaluated for compliance with an implementation of non-harvest BMPs. All sites were evaluated to examine reforestation
methods and degree of site stabilization.
The following information was gathered on all sites on the third and final site visit:
Method of regeneration
Planting spacing
Percent bare ground in light traffic areas
Percent bare ground in high traffic areas
Length of SMZ, if present
Effectiveness of harvesting BMPs two years post-harvest (if no non-harvest activity took place)
Evidence of ongoing erosion resulting from the harvest operation
Evidence of ongoing erosion resulting from the non-harvest operation

5
MONITORING RESULTS: NON-HARVEST OPERATIONS
Non-harvest forest operations include site preparation, reforestation, prescribed burning, pesticide application, fertilizer
application, and minor drainage. Within two years post-harvest, at least one non-harvest activity was conducted on 55.0% of sites
(82 of 149) evaluated in this survey. Since the initial report published in 2012 included a small number of sites (16) with non-harvest
treatments, the results from those sites were included in this analysis to provide a more suitable sample size. For the categories of
Prescribed Burning and Minor Drainage, only a small sample size was present, yielding results that were statistically insignificant,
but still worth mentioning in this report.
Site preparation operations were evaluated on 65 sites, including sites with
mechanical site preparation, chemical application, and prescribed fire. On three
sites, a combination of operations were conducted including two with mechanical
and prescribed fire and one with chemical and prescribed fire. Compliance with site
preparation BMPs was sufficient to protect water quality on 98.5% of these sites. One of these sites was rated with inadequate
compliance in this category.
A total of 139 applicable practices were evaluated with 92.1% implementation. Eleven individual practices were not properly
applied, including one with significant risk to negatively impact water quality. The most common problem noted was failure to use
waterbars on firebreaks. The practice noted to have significant risk involved mechanical methods not following the contour on
slopes of 11-20%.
Reforestation activities were observed on 77 sites within two years of harvest. Forty-
nine sites were hand planted and 28 sites were machine planted. Compliance with
BMPs related to reforestation was 97.4%, with two sites rated as having significant
risk to negatively impact water quality. Both sites were located on industry-owned1
land in the Piedmont region of the state. Causes for concern on both included machine planting in, through, and down ephemeral
streams and machine planting on steep slopes.
A total of 114 applicable BMPs related to reforestation were evaluated with 93.9% implementation. Seven practices were not
implemented including two with significant risk to negatively impact water quality. Problems included failure to hand plant on
steep slopes with erodible soils, not machine planting on slopes >5% and the presence of planting bags or garbage associated
with planting.
site preparation98.5 % Compliance
reforestation97.4 % Compliance
1. Forest Industry landownership for purposes of this publication includes forest industry that owns a wood processing mill and timber investment groups such as TIMOs and REITs.

6
Prescribed burning was evaluated on seven sites, and compliance with BMPs was
sufficient to protect water quality on 85.7% of those sites (6 of 7). One site was rated
with inadequate compliance in this category.
A total of 37 applicable BMPs were evaluated with 81.1% implementation. Problems
statewide included the absence of waterbars in firebreaks and the failure to use hand tools to tie firebreaks into streams.
Pesticide application was evaluated on 33 sites and compliance with BMPs was
sufficient to protect water quality on 100% of those sites. A total of 159 applicable
BMPs were evaluated with 100% implementation. No sites in this survey were
identified with fertilizer application.
Seven sites in this survey included activity related to pre-existing minor drainage.
No new minor drainage was identified. Compliance with BMPs related to minor
drainage was sufficient to protect water quality on 100% of sites. A total of 64
applicable BMPs were evaluated with 93.8% implementation. Problems included
possibly using the 404 silvicultural exemption of the Clean Water Act for non-silvicultural objectives and minimizing the depth,
width, and number of ditches. However, since these were pre-existing drainage features, it is difficult to discern whether they
were dug prior to the implementation of the Clean Water Act.
Compliance with non-harvesting BMPs was sufficient to protect water quality on
96.6% of sites (86 of 89). One site rated excellent, 85 sites rated adequate, and three
sites rated inadequate with compliance to BMPs. Two sites rated inadequate were
due to machine planting on erodible soils and through ephemeral drains. The other
rated inadequate was due to erosion from firebreaks. All three inadequate sites were on industry lands in the Piedmont region of
the state.
A total of 513 applicable non-harvest BMPs were evaluated with 94.35% implementation. Twenty-nine individual practices were
not properly applied.
prescribed burning85.7 % Compliance
pesticide application100 % Compliance
minor drainage100 % Compliance
overall non-harvesting compliance96.6 % Compliance

7
Non-harvest Compliance Trends by CategoryNon-harvest compliance for chemical application and minor drainage was 100%, while mechanical site preparation reached a new
high compliance rate of 98.5%, (Table 2). Prescribed burning had the lowest compliance at 85.7%, but shows improvement over
the last survey.
TABLE 2
TABLE 1
Overall Non-Harvest Compliance By Year
Non-Harvest BMP Compliance Trends By Category
86.4%
1996
100
40
90
30
80
20
70
10
60
0
50
98%
2000
96%
2005
87.5%
2012
96.6%
2014
Perc
ent C
ompl
ianc
e
Survey Years
Survey Years1996 2000 2005 2012 2014
100
40
90
30
80
20
10
0
70
60
50
Perc
ent C
ompl
ianc
e
COMPLIANCE TRENDS
Non-Harvest Compliance TrendsOverall compliance for non-harvest activities for this survey was 96.6% (Table 1). This is near the all-time high of 98% for
South Carolina in 2000, but reforestation and minor drainage were not evaluated in that survey. The overall rating indicates
that landowners and forestry professionals are committed to protecting water quality through proper implementation of Best
Management Practices for Forestry.
The dip in compliance of 87.5% for the 2012 survey is most likely just due to sampling error. Only 16 sites were evaluated for non-
harvest activities in 2012 giving a sample size that does not lend itself to testing statistical significance.
Chemical Application Reforestation Minor Drainage
(data not collected)
Mechanical Site Prep Prescribed Burning

8
OTHER FINDINGS
In conjunction with the non-harvest monitoring, other information was gathered on other variables such as site stabilization,
reforestation trends, blowdown in Streamside Management Zones, and the relationship between length of SMZ and area of
harvest.
Site StabilizationThe degree of site stabilization was estimated one year post-harvest and two years post-harvest on both light and high traffic
areas. One year post-harvest, 79.2% of sites had a high degree of stabilization on light traffic areas (0-5% bare ground) (Table 3).
On high traffic areas (Table 4), such as log decks and main skid trails, 49.0% of sites had high stabilization with 0-5% bare ground
and 85.2% had less than 20% bare ground. Two years post-harvest, 96.0% of sites had a high degree of stabilization on light traffic
areas, and 79.9% of sites with high traffic had 0-5% bare ground and 94.6% of sites had less than 20% bare ground.
TABLE 3
TABLE 4
Site Stabilization: Light Traffic Areas
Site Stabilization: Decks and Skid Trails
1-Year Post-Harvest 2-Year Post-Harvest
% Bare Ground
% Bare Ground
Perc
enta
ge o
f Site
sPe
rcen
tage
of S
ites
100
40
40
90
30
30
80
80
20
20
10
10
0
0
<5%
0-5% 6-20% 21-80%
5-20% 21-40% 41-60% 61-80% 81-100%
70
70
60
60
50
50
79.2%
18.8%
2% 0%
96%
79.9%
14.8%
2.7% 2% .7% 0%
4%
49%
6.7%2.7% 4% 1.3%
1-Year Post-Harvest 2-Year Post-Harvest

9
ReforestationReforestation methods were noted on each site evaluated in this survey. A total of 77 sites had been reforested artificially by 2
years following harvest, with 70 of those being planted by one year post-harvest. Forty-nine sites were hand planted and 28 were
machine planted. Sixty-nine sites were allowed to regenerate naturally.
Planting spacing varied from site to site. The most common spacing was 8x10 with 58.3% of sites planted this way, which results
in 544 trees per acre (TPA). The next most common spacings were 6x12 (605 TPA), 5x12 and 6x10 (726 TPA), each performed on
3.4% of sites.
Of the original 151 sites surveyed, 115
were clearcuts and 36 thinning harvests.
Of the 115 sites eligible for reforestation, a
total of 77 were reforested. The ownership
class most likely to reforest after
harvesting was found to be forest industry
(Table 5). Of 21 clearcut sites owned by
forest industry, 90.5% (19 sites) were
reforested within two years post-harvest.
Non-industrial private landowners
owning more than 1,000 acres held the
next highest rate of reforestation at 75.0%
(15 of 20 clearcut sites). Non-industrial
private landowners owning fewer than
1,000 acres reforested on 58.9% of sites
(43 of 73 sites). Of the five publicly owned sites surveyed, only one was a clearcut. This site was not artificially reforested within
two years of harvest, but rather left to naturally regenerate.
Of the 77 sites artificially regenerated, 24.7% (19 sites) were owned by forest industry, 19.5% (15 sites) were owned by non-
industrial private landowners owning more than 1,000 acres, and 55.8% (43 sites) were owned by non-industrial private
landowners owning fewer than 1,000 acres (Table 6).
The conclusions drawn from the reforestation trends are that for forest industry, and largely the non-industrial private landowners
owning more than 1,000 acres, forests are a monetary investment, more so than for the average smaller landowner. For this
survey, Timber Investment Management Organizations (TIMOs) or Real Estate Investment Trust (REITs) are lumped into the
Industry category. These organization have financial returns at the top of their list of objectives, as many serve as a retirement
funds for their investors. Larger family-owned tree farms fit into the NIPF>1,000 category, but may have other objectives such as
wildlife or aesthetics in mind. With
either, reforestation is essential to
perpetuate the process.
Even with the opportunity of cost-
share, the NIPF<1000 class often
has fewer resources to reforest
than NIPF>1000 or Industry
landowners. Also, reforestation
is not always on their list of
landowner objectives.
% Of Eligible Stands Replanted By Ownership
Ownership ClassIndustry NIPF >1000 NIPF <1000
90.5%
75%
58.9%
100
40
90
30
80
20100
706050
Industry NIPF > 1000 NIPF < 1000
TABLE 6
% Of Sites Reforested By Ownership Class
55.8%
24.7%
19.5%

10
Blowdown In SMZsStreamside Management Zones (SMZs) are a crucial part of Best Management
Practices and essential to protect water quality. SMZs function to filter nutrients
and sediment before runoff reaches the stream channel and also provide shade
to the stream resulting in lower water temperature. SMZs also serve as habitat
and travel corridors for many species of bird, mammal, and amphibian. However,
often the residual trees left in SMZs are subject to be blown over due to moist soil
conditions, root patterns of the residual trees, and as a result of being exposed to
the wind when the rest of the adjacent stand has been clearcut.
For this survey, 42 sites contained SMZs. Of these, 27 had blowdown within the
SMZ. Seventy-five total trees were blown down on these 27 sites. Oak (Quercus
spp.) was the most common species downed by wind accounting for 44% (33 trees) of windthrow (Table 7). The next most
common species was sweetgum (Liquidambar styraciflua) with 25.3% (19 trees). The least common windthrown species were
yellow poplar (Liriodendron tulipifera), hickory (Carya spp.), and other hardwoods with 2.7% (2 trees) each.
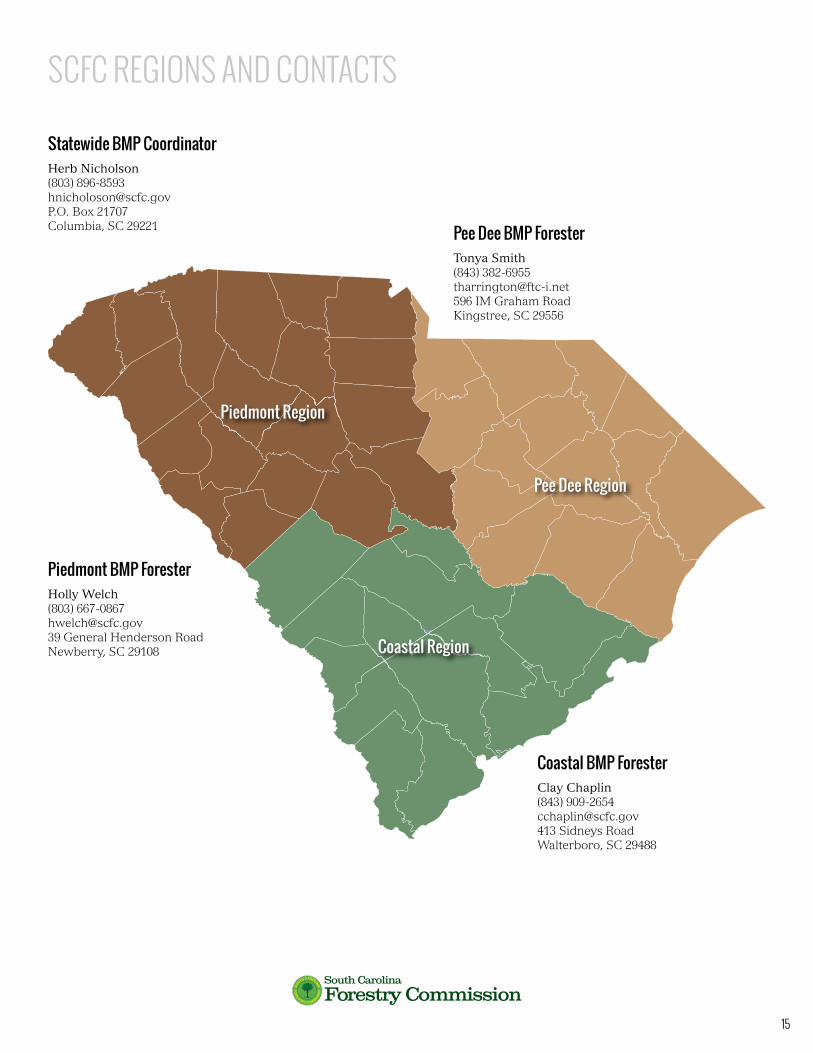
SMZ Length and Acres HarvestedForty-two sites in this survey contained Streamside Management Zones. The Piedmont region (see page 15 for a map of SCFC
regions) of the state contained 29 sites with SMZs, the Pee Dee region 11 sites, and the Coastal region 2 sites. The length of SMZs
on these sites varied from 200 feet to one mile long. The harvest area also varied from 10 acres to 185 acres.
In the Piedmont the average harvest containing an SMZ was 66.28 acres with an average SMZ length of 1,181 feet. The Pee Dee
was slightly higher with an average harvest area of 85.91 acres with an average SMZ length of 1,647.27 feet. The Coastal region
average harvest area with an SMZ was 67 acres with an 850-feet average SMZ. The statewide average harvest with an SMZ was 72
acres with a 1,287.33 foot SMZ.
The takeaway is that in the Piedmont region a harvest with an SMZ will occur 2.45 times more often than in the Pee Dee region
and 14.5 times more often than in the Coastal region. On average, a harvest in the Pee Dee region will have a longer associated
SMZ by 1.4 times than in the Piedmont region and almost 2 times as in the Coastal region.
TABLE 7
Oak Sweetgum Pine Maple Cedar Yellow Poplar Hickory Other HW
44%
25.3%
12%
6.7%
4%2.7% 2.7% 2.7%
% Blowdown By Species

11
CONCLUSION
The results of this study are a testament to the continued success of South Carolina’s Best Management Practices for Forestry
program. The high compliance and implementation rates are evidence that South Carolina’s voluntary approach to BMPs is well
received by landowners, loggers, and forestry professionals.
Strengths in BMP compliance are evident:
100% Compliance with Chemical Application and Minor Drainage
98.5% Compliance with Mechanical Site Preparation is the highest since monitoring began
An overall Non-harvest Compliance rate of 96.6%
This study will also be used to target areas identified as needing special attention and training programs and outreach will be
tailored accordingly.
Opportunities for improvement include:
Increased attention on firebreaks including the installation of waterbars and the use of mechanized equipment tying in the
firebreaks to water bodies.
Increased awareness of mechanical tree planting, especially in and around ephemeral streams
This survey also shows that the earth has a way of healing itself. After two years, 96% of sites with light traffic areas and nearly
80% of sites with high traffic areas had healed itself to less than 5% bare ground surface. These site were able to re-vegetate
naturally.
This survey was also able to tell us that oak is the predominate species susceptible to blowdown in SMZs around perennial
streams. This information could be used to guide selective harvesting within the SMZ.
The results of this survey will be used to further the compliance and implementation of South Carolina’s Best Management
Practices for Forestry and to continually improvement upon the coordination and delivery of the program throughout the state
keeping protection of water quality during forestry operations at the forefront.

12
APPENDIX
FOLLOW-UP BMP COMPLIANCE MONITORING FORM
Site ID: Visit Number: Date: Observer:
RATE ANY NEW ACTIVITY ON BMP MONITORING NON-HARVEST FORM All percentages to nearest 5%
SITE Y N SR NA 1. Has site been converted to non forest use 2. Artificial or natural regeneration 3. Spacing of artificial regeneration 4. Any new activity rated on nonharvest form
STREAMSIDE MANAGEMENT ZONES 5. Length of SMZ 6. Number of overstory trees blown down 7. Species down (pine, oak, other) 8. Sediment trails reaching stream 9. WQ impact related to SMZ failure?
STREAM CROSSSINGS 10. Crossing currently stable 11. Crossing blown-out,damaged,or altering water flow 12. WQ impact or sediment deposition from crossing failure
ROADS 13. Culverts stable and functioning 14. Waterbars and water control structures functioning 15. Wetland road use meet silvicultural exemption 16. Excessive erosion on roads 17. WQ impact from degradation of road system
TIMBER HARVESTING 18. Percent bare ground on light traffic areas 19. Percent bare ground on high traffic areas (decks, main skid trails. 20. Skid trail stabilization measures functioning 21. Excessive erosion on decks 22. Excessive erosion on trails or harvest area 23. WQ impact from degradation of harvesting activity
NON-HARVEST 24. Type Activitysite prep ___ presc burn __ fertilization ___ regen ___ minor drain ___
25. Percent bare on previously disturbed area:
26. WQ impact from degradation of non harvest activity
OVERALL 27. Have any new water quality impacts developed since last visit 28. Have any previous problems corrected naturally 29. Have any previous problems corrected artificially
NOTES AND OBSERVATIONS (include extreme weather events, excessive standing dead trees, etc.)

13
NON-HARVEST BMP COMPLIANCE MONITORING FORM Site ID:
LANDOWNER QUESTIONNAIRE Landowner Name Ownership ClassLandowner Address NIPF<1000 Industry Landowner City,State NIPF>1000 Public Landowner ZIP Landowner Phone
Y N NA Are you familiar with SC BMPs for Forestry? Did you rely on a forester during harvest? Was there a written contract for the harvest? Was BMP compliance required in the contract? Will you allow SCFC to include your property in the monitoring project? Did landowner request a copy of the completed form?
SITE Acres treated Waypoint Number Date Logged Latitude County Longitude Region Courtesy Exam Site ID Date of field evaluation Evaluator
Physiographic Region Terrain Type Blue Ridge Upland Clay Southern Piedmont Sandhills Carolina Sandhills Flatwoods Southern Coastal Bottomland Atlantic Coastal Carolina Bay
Dominant soil texture: Sand Clay Loam
Y N NA Is the site predominantly wetland?
SITE PREPARATION Type of Site Prep Mechanical Chemical Presc Fire None
Y N SR NA On slopes 6-10%, mechanical methods follow contour On slopes 11-20%, mechanical other than chopping follows countour Untreated strips 5-10’ wide left evert 100’ if erosion potential high On slopes 21-30%, only herbicide, fire, or low intensity mechanical On slopes over 30%, only herbicide, hand tools, or fire Logging debris and other litter left where accelerated erosion likely Minimized soil in windrows and piles Windrows periodically broken Planting beds only as high as necessary On slope >5%, beds follow contour and frequently broken Waterbars or other methods used to prevent erosion in firebreaks/lines Vegetation and soil disturbance limited in stabilized gullies Mechanical site prep avoided in primary SMZ Avoided significant soil disturbance in secondary SMZ Broadcast application of any pesticide avoided in SMZ Left vegetated buffer strip 10’ along public roads to slow runoff Overall, site preparatoin BMPs sufficiently protected water quality
(form continued on next page)

14
REFORESTATION Type of planting: Machine Hand None
Y N SR NA Steep, erodible sites hand planted Machine planting on contour with slopes >5% Avoided leaving bags or garbage on site Overall planting BMP sufficiently protected water quality
PRESCRIBED BURNING Prescribed burning present? Yes No Y N SR NAFire timed to prevent entire humus layer from being burned Firebreaks located on contour as much as possible Waterbars used in firebreak lines where needed Hand tools used to tie firebreak lines into stream channels Avoided too hot fire and exposed mineral soil Kept high intensity fire out of SMZs Avoided burning on severly eroded soils with less than 1/2” duff Avoided water controls that divert runoff into streams Overall prescribed burning suffiently protected water quality
PESTICIDES Pesticides applied on site? Yes No Y N SR NAPesticide containers properly disposed Avoided excessive drift Pesticide handling done away from water All spills cleaned up immediately Avoided applying pesticides to water bodies Avoided broadcast application within SMZ Avoided damage to trees in the primary SMZ Overall pesticide application sufficient to protect water quality
FERTILIZATION Fertilizer applied on site? Yes No Y N SR NAWater bodies protected with appropiate buffers Fertilizer containers properly disposed of Avoided applying fertilizer to water bodies Overall fertilizer application sufficient to protect water quality
MINOR DRAINAGE Minor drainage on site? Yes No Y N SR NANew minor drainage Minor drainage used only where necessary Depth, spacing, number of ditches minimized Designed to minimize maintenance Spoil does not impede entry of surface water into ditch Ditches empty into areas where runoff filtered before reaching channel Ditches maintained as needed to keep system functioning Avoided converting wetlands to upland Avoided emptying drainage ditches into perennial or intermittent streams Avoided re-dredging more than original depth, width Did not cause ponding with placement of fill Did not use 404 exemption for non-silvicultural objectives Overall minor drainage sufficient to protect water quality Overall Rating Excellent Adequate Inadequate COMMENTS (List major prolems if Inadequate/Noteworthy positive and negative aspects for all)
15
SCFC REGIONS AND CONTACTS
Statewide BMP CoordinatorHerb Nicholson(803) [email protected]. Box 21707Columbia, SC 29221 Pee Dee BMP Forester
Tonya Smith(843) [email protected] IM Graham RoadKingstree, SC 29556
Piedmont BMP ForesterHolly Welch(803) [email protected] General Henderson RoadNewberry, SC 29108
Coastal BMP ForesterClay Chaplin(843) [email protected] Sidneys RoadWalterboro, SC 29488
Piedmont Region
Pee Dee Region
Coastal Region
16
Compliance and Implementation Monitoring Report, 2011-2014
FORESTRY BMPsIN SOUTH CAROLINA
published by the South Carolina Forestry Commission, March 2015