Forest Management Framework for New York City · The Forest Management Framework comes at just the...
44
Implementing the Management Framework 1 Forest Management Framework for New York City
Transcript of Forest Management Framework for New York City · The Forest Management Framework comes at just the...
Implementing the Management Framework 1
Forest Management Framework for New York City

AuthorsClara C. PregitzerHelen M. ForgioneKristen L. KingSarah Charlop-PowersJennifer Greenfeld
AcknowledgementsBAND Foundation Doris Duke Charitable Foundation Ittleson FoundationJPB FoundationMayor’s Fund to Advance NY The New York Community Trust The Tiffany & Co. FoundationRobert Wilson Charitable TrustWildlife Conservation Society Climate Adaptation Fund
Neda ArabshahiHunter Armstrong Adrian BenepeLindsay CampbellGeorgina CullmanBram GuntherRichard Hallett Michelle JohnsonLiam KavanaghMina KimJesse KraussLaura LandauMarit LarsonLeila Mougoui BakhtiariShonet NewtonNancy Falxa SontiErika Svendsen
Natural Areas Conservancy Board of DirectorsAdrian BenepeKaren BrownMax JoelDavid LangerKaren McQuistonSarah R. MorosClare PeetersJulia RobbinsKC SahlEric SandersonShika SarafMitchell Silver, ex officioOmar SloweStacy SonnenbergCarter StricklandAndrew WallachTed Wolff
Please cite this report as follows:Pregitzer, Clara C., Helen M. Forgione, Kristen L. King, Sarah Charlop-Powers, and Jennifer Greenfeld. 2018. Forest Management Framework for New York City. Natural Areas Conservancy, New York, NY.
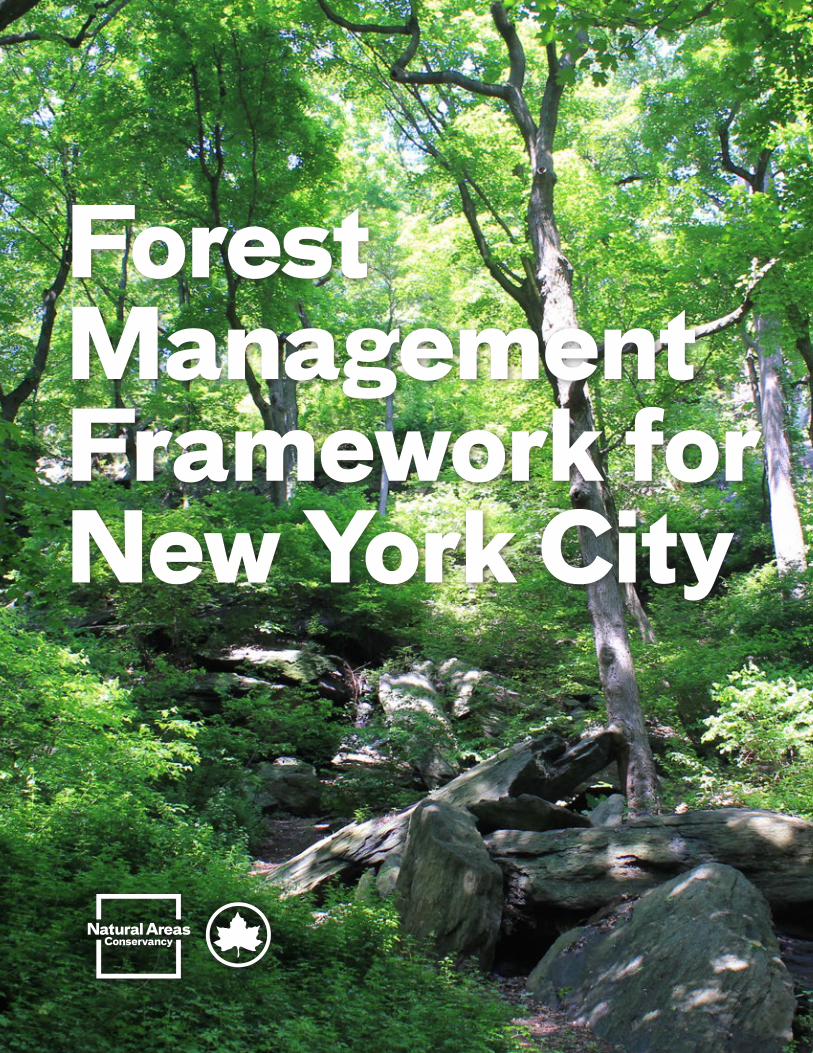
cover: Mature forest in Inwood Hill Park, Manhattan

Forest Management Framework for New York City

1234 Fifth Avenue | New York, NY 10029
April 2018
Dear New Yorkers,
The Natural Areas Conservancy (NAC) is proud to present a bold new vision for the restoration and long-term care of our city’s forests with our partners at the New York City Department of Parks andRecreation (NYC Parks). The Forest Management Framework is a roadmap for the next 25 years to invest in and take care of the agency’s 7,300 acres of forested natural areas. A sustained investment in this resource will:
ensure safe, high-quality public access to nature for every New Yorker and protect New York City’s biodiversity and unique forest communities.
Despite being the most densely populated city in the nation, New York has robust pockets of nature across every borough where people can lose themselves among the great trees and birdsong. Spending time in nature reduces stress, improves fitness, and refreshes the spirit. Our natural areas also provide clean air and water, cooler summer temperatures, and protection against storms and flooding. We want to ensure they continue to benefit future generations of New Yorkers.
NYC Parks realized the importance of our natural areas decades ago with the establishment of the Natural Resources Group, one of the first public divisions in the nation dedicated to natural areas restoration and conservation. More recently, the MillionTreesNYC program included the planting of over 500,000 trees in forested natural areas in all five boroughs and activated thousands of local stewards.
The NAC was formed in 2012 to build on the successes of NYC Parks’ natural areas management and to envision and advocate for their future. The NAC has produced valuable data on the health and condition of our natural areas and added expertise to the forest management of NYC Parks. We have also given fuller voice and a higher profile to the conservation of nature in New York City.
The Forest Management Framework comes at just the right time: our city is growing, and more people will need the open spaces of nature for recreation, renewal, and resilience in the face of climate change. Join us in our call to action: to make forests a resource on par with the other great cultural resources of our city.
Sincerely,
Sarah Charlop-Powers Executive Director, Natural Areas Conservancy

Mitchell J. Silver, FAICPCommissioner
TF
212.360.1305212.360.1345
E [email protected] City of New YorkParks & Recreation
The ArsenalCentral ParkNew York, NY 10065www.nyc.gov/parks
February 27, 2015
Dear Park Lovers:
When we at NYC Parks talk about our 30,000 acres of parkland, it is common to picture basketball courts, playgrounds, and the landscaped lawns of Central Park. But forested natural areas make up nearly a quarter of parkland in New York City—and they serve a vital purpose. These forests strengthen not only our city’s ecosystem, but also the health and well-being of the New Yorkers who use them for free, accessible exercise and relaxation.
You can find Parks forests in every borough, from Conference House Park on Staten Island’s southern tip to Pelham Bay Park at the northern border of the Bronx; in Riverside Park in Manhattan, Prospect Park in Brooklyn, and of course in Forest Park in Queens. And in all of our forests, you can find the work of our partner, the Natural Areas Conservancy, which since 2012 has supported the study and restoration of our natural areas through initiatives ranging from tree planting and trail blazing to data collection and creating tools for better management.
The new Forest Management Framework, a joint project of the Natural Areas Conservancy and NYC Parks, represents a significant step forward in improved management and resources for our natural areas. NYC Parks is excited by this framework’s potential to improve one quarter of our park system and the health and well-being of all New Yorkers. The frameworkprovides key insights into the state of our forests and recommends a 25-year investment to improve their long-term health. It is my hope and expectation that this framework will informforest management not only here in New York City, but in cities across the country and around the world.
Thank you,
Mitchell J. Silver, FAICP, Hon. ASLA

Executive Summary 9
A New Vision for Urban Forest Management 10
Forest Management Goals 12
Overview of NYC’s Forests 13
What Are the Conditions of NYC’s Forests? 14
Major Findings 15
Developing a Citywide Model 22
Implementing the Management Framework 25
Conclusion 31
Appendices 33
Notes 40
Contents

Figures 1 Invest in Forests to Improve Their Condition 9
2 NYC’s Land Cover 13
3 NYC’s Natural Areas 13
4 NYC Parks’ Forests 13
5 NYC’s Parks 14
6 NYC’s Forests by Borough 16
7 Most Common Plant Species by Forest Layer 16
8 Key Findings 17
9 NYC’s Forest Condition Index 22
10 Forest Condition Matrix 23
11 Forest Condition Drives Management Strategy 27
12 Staffing Vision 28
SidebarsTrails 18
Citywide Social Assessment of NYC’s Parks and Natural Areas 19
Who Takes Care of Urban Landscapes? 26
Aligning Forest Management across NYC— 29 Conservancy Engagement Program
Climate-Adapted Planting Palettes 29
AppendicesA Key Ecological Attributes of Healthy Urban Forests 33
B NYC’s Forest Management Budget 34
C NYC’s Parks in City Council Districts 36
D City Council Districts for NYC’s Forested Parks 37
E Rapid Site Assessment Checklist 38

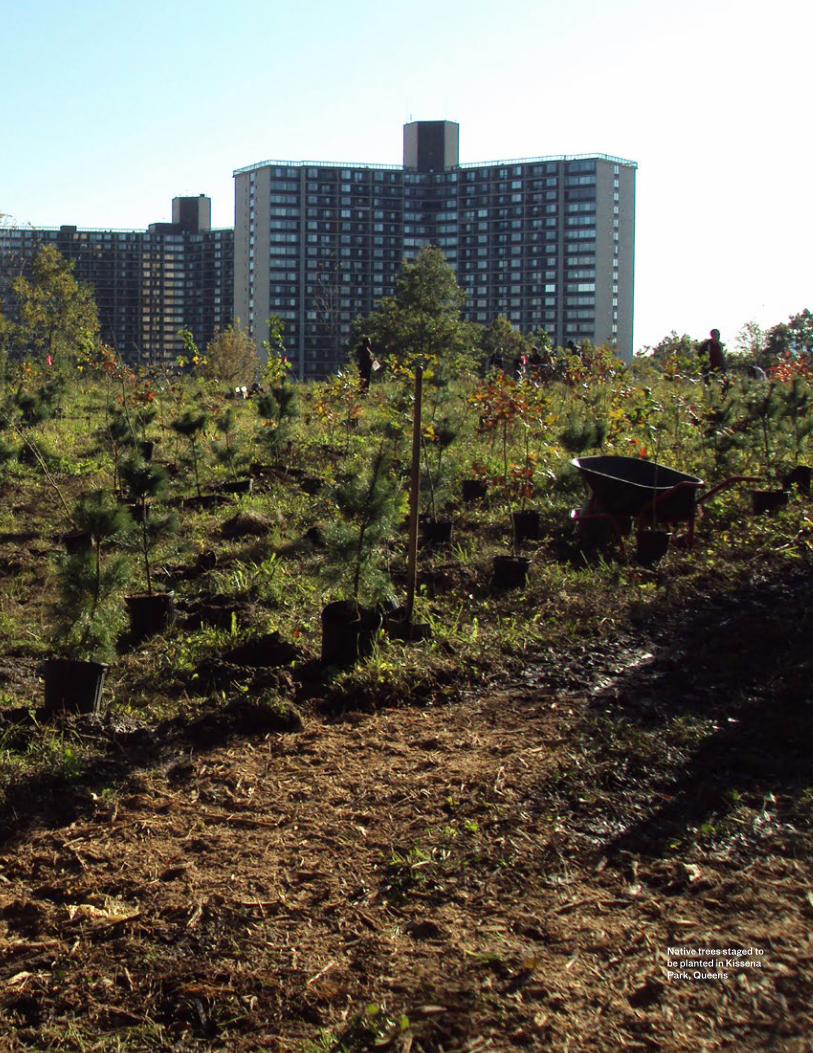
Native trees staged to be planted in Kissena Park, Queens

Forest Management Framework for New York City8
Volunteers planting trees at a forest restoration site

9Executive SummaryExecutive Summary
NYC’s forested natural areas provide important benefits to the city including high-quality recreation, enhanced biodiversity, and improved air and water quality. The Natural Areas Conservancy (NAC) and the New York City Department of Parks and Recreation (NYC Parks) have developed a 25-year Forest Management Framework intended to guide the restoration and management of NYC Parks’ 7,300 acres of forested natural areas. The framework, NYC’s first citywide forest management plan, is based on new comprehensive data that includes ecological conditions and visitor perceptions and experiences. The framework categorizes the condition of forests in more
than 50 parks across the five boroughs, based on metrics for ecological health and threat. Each condition category was correlated with best practices, staffing and contractual structures, and cost estimates. This approach facilitates the prioritization of future restoration activities, the ability to track changes in forest health over time, and the ability to estimate the level of investment needed to maximize ecological condition and visitor experience at the scale of a park, borough, or city. The framework calls for an investment of $385 million over 25 years to ensure that our city’s forests achieve their full potential for recreation and conservation.
FIGURE 1
Invest in Forests to Improve Their ConditionThrough increased financial investment and targeted forest management, NYC will improve the health of our forests over time. Healthy forests are less expensive to manage.
Executive Summary

Forest Management Framework for New York City10
NYC contains significant forested natural areas. NYC is 40.5% green—including landscaped parkland, private yards, cemeteries, and campuses, in addition to natural areas. The 7,300 acres of forested natural areas under NYC Parks’ jurisdiction represent an area eight times as large as Central Park. These are not just open spaces but gateways to nature and all its history, complexity, and wonder. Healthy forests support habitat for native wildlife such as great horned owls, downy woodpeckers, coyotes, and red-backed salamanders, and native wildflowers such as spotted joe pye weed and New York aster: all species that have long called NYC home.
The urban forest has never been more important for people. An unprecedented 80% of Americans live in urban areas,1 and communities are increasingly disconnected from the natural world. Across multiple demographics children are spending more time using screen-based electronics and less time out of doors than their peers did 30 years ago.2 Spending time in nature provides significant cognitive and emotional benefits, especially for youth in poor and underserved areas.3 High-quality urban nature has been shown to decrease crime and increase community cohesion.4 Safe access is therefore the first step toward realizing the benefits that nature provides for individuals and communities. As NYC grows in population, smart management of forested natural areas is critical.
Urban forests contribute to a healthy environment. Trees are vital for mitigating urban heat-island effects and can lower air temperatures by up to nine degrees Fahrenheit.5 NYC’s forested natural areas also naturally capture millions of gallons of stormwater each year and filter pollutants from that water.6 These forests are habitat for hundreds of species of resident birds and pollinators, as well as occupying a crucial location on the migratory paths of hundreds of additional species.
New data enables a new vision and leadership for forest conservation in NYC.In 2013 and 2014, the NAC conducted the first standardized assessment of 10,000 acres of forests and wetlands in 53 parks, including 7,300 acres of forested natural areas. These forests are incredibly diverse and are under threat from longstanding urban challenges such as fragmentation and the increased prevalence of invasive species, as well as the effects of climate change. The framework articulates management practices that directly address these threats and will restore and sustain healthy forests and secure their associated benefits over the long term.
The Forest Management Framework’s 25-year plan to restore and conserve NYC’s forests is grounded in robust ecological data, decades of professional expertise, and in-depth information about the staffing, costs, and practices associated with urban conservation activities. It includes guidelines for projecting costs, adapting best practices, encouraging local stewardship, and continued monitoring and research. If fully funded, the framework will ensure that 100% of the city’s forests are under active management, are healthy, and are meaningful to and provide essential benefits for communities.
A New Vision for Urban Forest Management

11A New Vision for Urban Forest Management
Healthy Forest A healthy forest is characterized by its native canopy and multiple horizontal layers, including shrubs and ground cover.
Unhealthy Forest An unhealthy forest is characterized by the dominance of invasive vines that can topple trees and disturb the canopy.

Forest Management Framework for New York City12
Reduce ecological threats; bring the proportion of invasive species under 10%
Promote healthy natural regeneration and biodiversity and the growth of native trees
Make forests resilient to climate change
Employ diverse and protective management strategies that are aligned with ecological conditions
Provide safe, well-marked trails in natural areas; use trail-building techniques that contribute to forest health
Help people find inspiration, reduce stress, improve fitness, and build communities
Create opportunities for green jobs and encourage environmental education
Increase collaboration between NYC Parks and other land managers, including park conservancies and other public agencies
Galvanize an informed, involved, and active community around forest management and land stewardship
Ensure NYC Parks Forever Wild protection guidelines continue to guard against forest fragmentation or inappropriate development
The Forest Management Framework will result in forests that are healthy, provide recreation and enjoyment for all New Yorkers, and are fully supported financially.
To achieve this vision, NYC Parks and its partners will need to commit $385 million over 25 years.
Forests Are Healthy People Benefit from Forests Forests Are Supported
To realize these goals we must:
Forest Management Goals

13
Landscaped
28.9% 55,360 ACRES
Overview of NYC’s Forests
FIGURE 2
NYC’s Land Cover: 40.5% of NYC Is Green
Built
59.5% 114,200 ACRES
Natural
11.6% 22,220 ACRES
MatureHardwood
MaritimeCoastal
SuccessionalHardwood
ForestedWetland
7,300 TOTAL ACRES
FIGURE 4
NYC Parks’ Forests: 60% of NYC’s Forests Are in NYC Parks
Overview of NYC’s Forests
Source: Natural Areas Conservancy Ecological Covertype Map7
Forests
10,500 ACRES
FIGURE 3
NYC’s Natural Areas: 11.6 % of NYC’s Land Cover Is Natural Areas
Wetlands
4,800 ACRES
Grasslands
5,700 ACRES
Source: Natural Areas Conservancy Ecological Covertype Map8
Source: Classification of Natural Areas Conservancy’s Ecological Assessment Plots9

Forest Management Framework for New York City14
FIGURE 5
NYC’s Parks
NYC Park
NYC Parks Natural Area
What Are the Conditions of NYC’s Forests?
Assessment of NYC’s Natural AreasUsing both remotely-sensed data and fieldwork, the NAC assessed the condition of 10,000 acres of natural areas under NYC Parks’ jurisdiction. Assessments were conducted in freshwater wetlands, saltmarshes, and 7,300 acres of forested natural areas. Field data on forest character and condition was collected in 53 parks from 1,156 sampling plots (see Appendix A). Data included size and health of trees, species composition, and soil condition.10 Working in partnership with the US Forest Service, the NAC also conducted a social assessment to better understand how park visitors perceive, use, and value urban natural areas.11 This assessment data forms the foundation of the Forest Management Framework.

15Major Findings
Major Findings
1. NYC’s forests are diverse and dominated by native trees. Forest canopies are mostly native (85%) and composed of 109 native tree species and 43 unique forest types.12 Some of the most common forest types include oak-hickory, oak–tulip tree, and successional sweetgum. Less common forest types include chestnut-oak and successional birch habitats. Vestiges of larger maritime-coastal forests, which are not commonly found elsewhere in the state, remain across the coastal areas of NYC.
2. The next generation is less healthy. Despite a high percentage of native trees in the canopy, native species are less prevalent in the midstory and understory layers. Invasive herbaceous species are common (present in 85% of plots), and invasive vines were found climbing on trees in 57% of forest plots. Invasive herbaceous species can prevent native seedlings from reaching the canopy, affecting ecosystem composition and function. Invasive vines can repress growth and shorten the lifespan of native trees. Without intervention, these challenges will negatively affect the health and species composition of mature trees in the future.
3. NYC’s most common forest type is also its most vulnerable. We found that 40% of NYC’s forests are successional hardwood forests, reflecting recent disturbance. These forest types typically have a higher stem density and have lower average tree diameters. Additionally, these successional forests have, on average, a 34% greater presence of invasive herbaceous species than mature hardwood forest types in NYC.
4. All forests need management, but not the same kind. Accurate data on forest conditions across the whole city has increased the level and scope at which we understand our forests and changed how we prioritize and align management activities. To achieve healthy forests, interventions such as low-density tree planting or more surgical invasive species removal can be applied in areas that are relatively healthy or to stands in transition. In contrast, forests that are relatively unhealthy and dominated by invasive species might require afforestation, essentially planting a forest from scratch.
5. Well-managed forests are more welcoming. Forests with fewer invasive vines offer higher visibility for visitors. Areas that receive regular maintenance, including formal trail systems and clear signage, feel safer and are more inviting.
Our first-ever citywide research shows incredible diversity and the need for an immediate increase in management activities.
Collecting data in Van Cortlandt Park, the Bronx

Forest Management Framework for New York City16
Canopy We found 85% of all overstory species measured were classified as native to NYC. Sweetgum was recorded as the most common species, accounting for 16.9% of all species measured, followed by northern red oak, accounting for 10.5% of all species, and the greatest proportion of basal area (21.6%). The most common invasive tree species recorded was black locust (5.3%), followed by Norway maple (1.7%). Standing dead trees can provide important habitat for birds and wildlife. We found that 10.9% of the standing trees in the canopy were dead.
MidstoryNon-native species were more prevalent in the midstory than in the canopy. We found that 80% of all midstory species were native. The five most abundant native midstory species were spicebush (12.5%), black cherry (7.5%), sweetgum (6.4%), red maple (6.4%), and sassafras (5.5%). The most common invasive species were crab apple (3%), Norway maple (2.3%), Japanese angelica tree (2.1%), and black locust (2.3%).
UnderstoryNon-native species were more prevalent in the understory, with the mean proportion of native species at 48%. The most frequently occurring understory plants were woody vines. These included natives such as poison ivy and Virginia creeper, as well as non-natives such as Japanese honeysuckle and oriental bittersweet. Of the 10 most abundant species in terms of relative cover, half were non-native. Invasive vines pose a significant threat to standing trees by repressing growth and shortening lifespans.
Poison Ivy
Mugwort*
Japanese Honeysuckle*
Multiflora Rose*
Virginia Creeper
All Other
Spicebush
Black Cherry
Sassafras
Sweetgum
Red Maple
All Other
Sweetgum
Northern Red Oak
Black Cherry
Red Maple
Sassafras
All Other
80% NATIVE
85% NATIVE
48% NATIVE
FIGURE 6
NYC’s Forests by BoroughThere are more than 10,500 acres of forested natural areas in all of the five boroughs of NYC. These forests are found on city, state, and federal property as well as on private property.
Borough of NYC Acres of Forest Percentage of Forests
Bronx 2,041 19%
Brooklyn 599 6%
Manhattan 365 3%
Queens 1,971 19%
Staten Island 5,566 53%
Total 10,542 100%
FIGURE 7
Most Common Plant Species by Forest Layer
Top 5 SpeciesTop 5 SpeciesTop 5 Species
* Invasive non-native species

17Major Findings
Forest Canopy In our assessment we found 213 tree species and that 85% of all tree species were native. This forest layer represents the most mature trees and is a representation of which tree species have successfully survived in a forest over time.
Midstory Trees and shrubs found in this layer are important for creating structure for wildlife habitat and make up the next generation of trees for the canopy. We found that 80% of trees in the midstory were native.
Understory While this layer held the greatest floristic diversity (561 species, or 73% of all species recorded in the study), the understory also had the lowest proportion of native species of all layers, with vines found to be the most frequently occurring type. Notably, 57% of NYC’s forest plots had invasive vines in canopy trees, suggesting that the management of vines as well as invasive tree species may be critical for maintaining native-dominated urban forests.
Forest Floor Organic matter including leaf litter and fallen trees and branches is an important component for nutrient cycling and habitat. Coarse woody debris was found in 38% of our plots, with the majority being recently fallen.
Soil We found soils to be highly variable, with soil pH ranging from 2.54 to 6.77 and texture ranging from 0% to 100% sand, both factors that could limit or enourage specific forest types and species presence. These patterns can help us better manage and understand our forest. In addition, 19% of our plots fell within soil classified as anthropogenic, something unique to the urban context.
Deer Browse High deer populations can cause significant damage to forest plants by eating vegetation or rubbing on saplings. In our assessment we found evidence of damage to vegetation by deer in 46% of our forest plots, with extreme prevalence in the borough of Staten Island, where 89% of plots showed evidence of deer browse.
Human Impacts Forests in the urban environment are exposed to greater human activity compared to more rural forests. We found that 80% of our plots had some evidence of human modification: 67% had human-generated trash, 27% were bisected by a path, and 9% contained park infrastructure such as a fence, bench, or hydrant.
FIGURE 8
Key Findings

Forest Management Framework for New York City18
TrailsThere are over 300 miles of trails within NYC’s natural areas. The networks are often confusing and mostly unmarked. NYC Parks and the NAC have been working together since 2016 to formalize trails and improve their condition across the entire city. This work includes establishing well-marked networks in each park to improve public access and safety, strengthening community engagement, and improving forest health. Unwanted and redundant social trails (“desire lines”) are closed using restoration techniques such as decompaction and planting. After formal networks are established, the public can access hiking maps for natural areas, and NYC Parks and the NAC recruit volunteers to work on trail improvement projects along the official paths. This work ultimately decreases forest fragmentation while also creating a better user experience in natural areas across NYC. Trail formalization and improvement are especially successful when coupled with larger forest restoration efforts.
Before and after maps of the 130-acre maritime forest in Marine Park, Brooklyn. Trail closures and plantings are in progress and will create the final trail system.
Before
After
Natural areas trail work in Forest Park, Queens

19
Citywide Social Assessment of NYC’s Parks and Natural AreasDespite the importance of urban natural areas to the health and well-being of New Yorkers, we have little systematic evidence about how park visitors perceive, use, and value parks. A better understanding of this can provide insight into how parks can best serve visitors in a rapidly changing environment.
The US Forest Service, the NAC, and NYC Parks conducted a citywide social assessment of NYC’s parks and natural areas to explore the social meaning of approximately 9,000 acres of NYC parkland, including almost 5,000 acres of natural areas.
In this study, the primary research question was the following: What are the uses, functions, and values of parkland and natural areas as conveyed through people’s park behaviors, descriptions, and narratives? In addition, researchers explored the differences in park use and social meaning according to site type and the gender of respondents. Drawing upon previous research, three data collection approaches were triangulated: direct observations of human activities, observations of material signs of human use, and 1,600 interviews with park users. The intent of this study was to capture why, how, when, and where urban residents engage with the outdoors in NYC.
Findings Urban parkland is a crucial form of “nearby nature” that provides
space for recreation, activities, socialization, and environmental engagement and helps people feel connected to place and to each other. These interactions produce vital cultural ecosystem services that may help to strengthen social resilience.
Urban parks support psychological, social, and spiritual well-being for a wide range of people who are seeking to connect with nature and a larger reality, as well as with the self and with others.
New Yorkers describe both landscaped and natural park areas as a space for relaxation. However, natural areas offer visitors a sense of refuge and attachment to place and space for walking and nature recreation activities, while landscaped park areas provide space for sports activities, socializing, and structured children’s play.
59% of park users interviewed in 2014 reported going into urban natural areas. Many of those who did not visit described a personal preference for recreating in other park areas, and others revealed a potential willingness to visit in the future. Those who did not visit natural areas cited concerns about safety, accessibility, or suitability for children.
Women are more likely to bring children to parks than men are and are more likely to seek out parks for specific amenities. In addition, women are less likely than men to visit natural areas, citing concerns about safety in forests and wetland areas.
People who participate in environmental stewardship groups are more likely to visit natural areas, suggesting that enhancement of stewardship programs may be a way to create a more inclusive experience for all New Yorkers in natural areas citywide.
Trail blazing in Bayswater Park, Far Rockaway, Queens
Conducting the social assessment in Marine Park, Brooklyn

Forest management in Bronx Park, the Bronx Photograph: Adam Stoltman


Forest Management Framework for New York City22
Since the formation of the Natural Resource Group in 1984, NYC Parks has managed its natural areas park by park. In contrast, the Forest Management Framework uses information about the range of biological conditions across forested natural areas to prioritize activities, plan for the future, and evaluate the success of restoration across the five boroughs. It also provides the opportunity to understand the condition of an individual area within a single park relative to all forests within that park, forest type, or city.
To understand and communicate the conditions of forests citywide, the forest assessment created two indices: one to represent ecological health and the other for ecological threat. These indices enable representations of health and threat status at the assessment plot level that can be compared among plots citywide.
This framework captures the full range and extent of conditions that exist within NYC’s forested natural areas. It allows land managers to anticipate and match the appropriate effort and resources required to improve forests across a broad range of current conditions, as well as to prioritize sites across all of NYC’s natural areas.
A forest assessment plot that is high on the health axis and low on the threat axis is in good condition and requires little management intervention. If a plot has a high health score but also a high threat score, this plot is at risk of decline in function and composition; management will be critical to protect its healthy attributes. A plot that is low on the health axis but high on the threat axis represents the most degraded forests. These forests require intensive management intervention to shift their trajectory toward sustained health. The costs for management are lowest in the healthiest and less threatened forests and highest in the least healthy and most threatened forests.
FIGURE 9
NYC’s Forest Condition IndexUsing field data collected across all of NYC’s forests, an ecological index was created to represent overall forest health and overall forest threat. Indices for ecological heath primarily represent desired vegetation conditions and are specific to different forest types. Threat indicators are relatively uniform across all forest types and only one index was created. All data was standardized to develop the index.
Ecological Health Index
Mature Hardwood Forest
Native Forest Canopy + Native Midstory + Native Tree Seedlings + Native Herbaceous Cover + Native Species Richness
Successional Hardwood Forest
Native Forest Canopy + Native Midstory + Native Tree Seedlings + Native Herbaceous Cover + Native Shrubs + Native Species Richness
Maritime Coastal Forest
Native Midstory + Native Tree Seedlings + Herbaceous Cover + Native Species Richness
Swamp and Floodplain Forest
Native Forest Canopy + Native Midstory + Native Tree Seedlings + Native Herbaceous Cover + Native Shrubs + Native Species Richness
Ecological Threat Index
All Forest Types Invasive Forest Canopy + Invasive Midstory + Invasive Vines on Trees + Invasive Tree Seedlings + Invasive Herbaceous Cover
Developing a Citywide Model

23Developing a Citywide Model
High Health / Low Threat Forests in this category are the highest quality. Less management intervention is needed, but monitoring is required to ensure that quality remains high and these forests are protected.
High Health / High Threat These forests are in transition. While they have many threats, they also contain many of the metrics we look for in high-quality forests. Management is required to protect and shift the trajectory of these stands.
Low Health / Low Threat Forests in this category have minimal threats, but desired structure and composition metrics are not met. Management can be used to accelerate the transition into high health, but monitoring over time with little intervention could result in improved health.
Low Health / High Threat Forests in this category are the most degraded in NYC and require the most management. Management actions could range from invasive species removal, tree planting, and afforestation and may take several years.
FIGURE 10
Forest Condition MatrixEach point on this figure represents the standardized condition score of an ecological assessment plot (total 1,156 plots) in one of 53 parks.
Low HealthHighThreat
HE
ALT
H S
CO
RE
THREAT SCORE
2.0
1.5
1.0
0.5
0.0
–0.5
–1.0
–1.5
–2.0
–2.5
1.51.00.50.0–0.5–1.0
We Want to Reduce Ecological Threats
We
Wan
t to
Incr
ease
Eco
logi
cal H
ealt
h
High HealthLow Threat
High HealthHigh Threat
Low HealthLow Threat

Forest Management Framework for New York City24
NAC field ecologists collecting forest data in the Staten Island Greenbelt

Implementing the Management Framework 25
The Forest Management Framework offers a systems approach to forest management. Ecological assessment of all forested natural areas has allowed the NAC to sort forest acreage according to health and threat (see Figure 10). The framework focuses on reducing threats, most notably removing invasive species that are the general underlying cause of poor forest health. It is easier to control threats than to directly improve baseline forest health. For example, we know how to remove invasive species, clear dumped material, and protect against browsing deer, but less straightforward actions are needed to increase leaf-litter depth or the basal area of native canopy trees. Other interventions do impact forest health directly, most notably the planting of native trees, which can increase the overall proportion of native seedlings.
The intensity of forest management strategies varies in relation to site condition as described by the ecological assessment; the most degraded sites require the most intensive form of work, usually “forest restoration,” while sites that require less intensive work but need hands-on attention fall into the category of “forest management” (see Figure 11). We use our knowledge about condition to tailor the management approach to specific conditions. Below, we describe the primary strategies.
Forest Restoration (Contractor)This strategy can include site clearing, invasive plant removal, soil decompaction, soil and compost amendment, and other activities. Contractors can use heavy machinery and work in difficult-to-access areas that are steep, wetland-adjacent, or otherwise impenetrable. Historically, NYC Parks has applied this tactic to the most difficult-to-manage areas, such as vinelands or former landfill sites that have few intact functional elements that might be damaged in the process of their work.
Forest Restoration (In-House) This strategy involves the assignment of in-house field crews to difficult restoration projects that are generally smaller in size than those assigned to contractors and are unlikely to require the use of heavy machinery or specialized techniques. The primary work here includes significant invasive plant removal and revegetating the site by planting native species. In-house crews are a great resource when working in or around areas of mixed native and invasive species.
Forest Management (In-House) These sites have a lower proportion of invasive plant cover than restoration sites and do not require full replacement of the vegetation community by planting. This strategy is applied in areas that were previously restored. The primary activity in management sites is invasive species removal, with a focus on
protecting existing native plants. This work can be performed by skilled professionals but also by volunteer participants with appropriate supervision.
Forest Management (Volunteer)Forest management sites that are easily accessible and do not require detailed training are appropriate for volunteers. A high staff-to-volunteer ratio during engagement events and outreach makes volunteer participation more expensive than other practices. However, volunteer opportunities are an investment in the future of NYC’s communities: volunteering gives New Yorkers valuable interactive experiences, improves long-term stewardship, and increases the constituency for the management of these spaces.
Forest Monitoring and Maintenance (In-House and Volunteer)Before and after conducting restoration and management, staff will use the Rapid Site Assessment Checklist (Appendix E) to conduct monitoring to document conditions. After management work is complete, maintenance entails periodic “sweeps” of large tracts of forest that are in generally good condition to check for invasive species in the understory. Regular monitoring and maintenance are critical to safeguarding the health of the highest-quality forests. For example, if a storm or other type of large disturbance were to impact an area, regular visits would identify threats so the area’s condition could be recategorized and a more intensive management strategy applied.
Planting (In-House, Contractor, and Volunteer)This strategy can be combined with any of the above. Just as management is customized to forest condition, so is planting. Most intensive planting is for only those acres where native regeneration is failing.
Staffing Vision Comprehensive forest management requires sufficient staffing of qualified professionals. The framework’s vision for a team of forest management professionals includes field crews, contract managers, monitoring experts, and experts in volunteer engagement (see Figure 12).
Management Over TimeForests are dynamic, and the framework reflects the need to adapt management strategies over time. The reduction of threats will eventually call for less intensive management strategies, reducing investment levels while resulting in an improvement in forest health that can be tracked through time.
Implementing the Management Framework

Forest Management Framework for New York City26
Who Takes Care of Urban Landscapes?The Stewardship Mapping and Assessment Project (STEW-MAP) aims to answer this question.
STEW-MAP surveys civic groups of two or more people who work to conserve, manage, monitor, transform, educate on, or advocate for the local environment. The STEW-MAP survey collects data across three categories: organizational characteristics (including year founded, mission, and budget); stewardship turf, or the area where each group works; and social networks, the other groups that serve as partners, members, and collaborators.
STEW-MAP databases and interactive maps enable the public, municipal agencies, and nonprofits to visualize where and how hundreds of civic environmental stewardship groups are working throughout a city or region. This tool highlights existing stewardship gaps and overlaps in order to strengthen organizational capacities, promote broader civic engagement with on-the-ground environmental projects, and build effective partnerships among stakeholders involved in urban sustainability and resilience. The map and database have facilitated collaborations, helped to connect previously siloed groups, and enabled groups to get recognition, resources, and power. STEW-MAP is critical to identifying and nurturing groups as they help care for these essential resources.
To learn more about STEW-MAP in NYC, visit www.nrs.fs.fed.us/stewmap.
Volunteers plant trees at Marine Park, Brooklyn

Implementing the Management Framework 27
High Threat Medium Threat Low Threat Very Low Threat
Acr
eage
Total Acres in Category 519 2,527 3,090 1,184
Eco
logi
cal
Con
dit
ion
s
Percent Invasive Herbaceous Cover ≥ 70% 40–70% 10–40% ≤ 10%
Invasive Vines on Trees**Where there are >350 trees/hectare
> 50% 20–50% 1–20% 0
Invasive Canopy Basal Area (m2/ha) > 10 4–10 .1–4 0
Invasive Midstory (stem count/hectare) > 500 100–500 1–100 0
Wor
k Ty
pe
an
d C
ost Work Type
Forest Restoration (Contractor)
Forest Restoration (In-House)
Forest Management
Forest Monitoring & Maintenance
Average Cost per Acre $42,076 $6,078$2,074 (in-house)
$28,500 (volunteer)$1,037
FIGURE 11
Forest Condition Drives Management StrategyThe assessed condition of the forest determines the management strategy, resources needed, and costs estimated.
Forest Restoration Forest Management Forest Monitoring and Maintenance
To qualify for Forest Monitoring & Maintenance and be in the Very Low Threat status forests must also have a minimum of 5,000 native tree seedlings/hectare, 100 native midstory stems/hectare, and 6 native herbaceous species present.
Forest Management Framework for New York City28
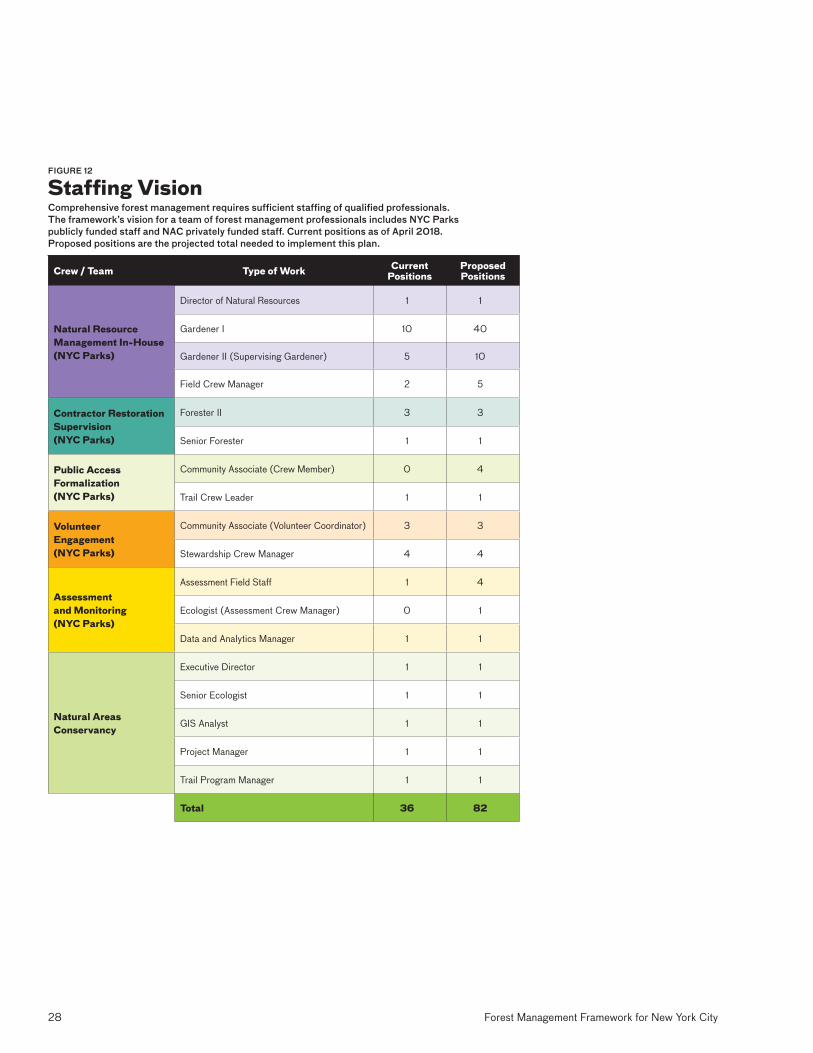
FIGURE 12
Staffing VisionComprehensive forest management requires sufficient staffing of qualified professionals. The framework’s vision for a team of forest management professionals includes NYC Parks publicly funded staff and NAC privately funded staff. Current positions as of April 2018. Proposed positions are the projected total needed to implement this plan.
Crew / Team Type of Work Current Positions
Proposed Positions
Natural Resource Management In-House (NYC Parks)
Director of Natural Resources 1 1
Gardener I 10 40
Gardener II (Supervising Gardener) 5 10
Field Crew Manager 2 5
Contractor Restoration Supervision (NYC Parks)
Forester II 3 3
Senior Forester 1 1
Public Access Formalization (NYC Parks)
Community Associate (Crew Member) 0 4
Trail Crew Leader 1 1
Volunteer Engagement (NYC Parks)
Community Associate (Volunteer Coordinator) 3 3
Stewardship Crew Manager 4 4
Assessment and Monitoring (NYC Parks)
Assessment Field Staff 1 4
Ecologist (Assessment Crew Manager) 0 1
Data and Analytics Manager 1 1
Natural Areas Conservancy
Executive Director 1 1
Senior Ecologist 1 1
GIS Analyst 1 1
Project Manager 1 1
Trail Program Manager 1 1
Total 36 82

29
Aligning Forest Management Across NYC—Conservancy Engagement ProgramAs a component strategy of the Forest Management Framework, the NAC is sponsoring a citywide Conservancy Engagement Program in 2018 and 2019. This free program will be available through a competitive application process to four nonprofit organizations who conduct forest management in NYC Parks’ natural areas.
NAC ecologists will communicate the process, steps, recommendations, best practices, and goals for forest management developed by the framework directly to these organizations. The chosen conservancies will receive scientific support, training, data tools, resources, and management recommendations from the NAC during an intensive three-month period. The iterative process of presentations, discussions, and trainings will culminate in specific management plans for each conservancy.
This important part of the framework will begin to create alignment of conservation efforts across the city and allow practitioners to track their management and stewardship activities over time. Working within the framework will also allow easy access to information on natural areas to plan forest restoration within existing conservancy programs and to engender future program support.
Climate-Adapted Planting PalettesDue to the heat-island effect in large cities, urban forests are experiencing the extremes of regional climate trends before surrounding rural areas. Climate change forecasts indicate that future weather conditions in NYC could be less suitable for some of its native tree species. At the same time, other native tree species that are more tolerant of heat and drought are predicted to thrive.
In order to ensure the health and resilience of our native forests, the NAC and NYC Parks have created climate-adapted planting palettes (lists) for forest restoration sites. These palettes are based on the kind of forest community the plantings will occur in and predicted resilience of individual tree species to future climate conditions. The quantities of less climate-adapted species will be reduced in future plantings while the more resilient tree species will be maximized. Strategies will also incorporate using local ecotypes and planting more genetically diverse populations to promote adaptation.
The tools created for this project can help guide practitioners of forest restoration through future plantings: from identifying the type of forest community the project is taking place in, to selecting tree species for planting that are appropriate for the site both now and in the future.
Conservancy engagement tour of Brooklyn Bridge Park, Brooklyn
Maritime forest restoration planting using climate-adapted palettes in Marine Park, Brooklyn

Forest Management Framework for New York City30
Measuring forest carbon in Van Cortlandt Park, the Bronx

31Conclusion
We value what we measure.Investment in and focus on NYC’s forested natural areas has fluctuated over the past three-and-a-half decades. But the time is right to adopt a proactive approach to managing these valuable but historically underresourced areas for the decades to come.
Focused on improving the data and expertise available for conservation, the vision and tools in the NAC’s Forest Management Framework create a foundation for a new long-term approach that will keep these wonderful places thriving. The framework celebrates the importance of our forests for expanded and meaningful recreation and enhanced community cohesion while also recognizing them as essential to protecting and restoring biodiversity and buffering the impacts of climate change.
In addition to guiding the work of the NAC and NYC Parks’ Natural Resources Group, the framework creates the ability to incorporate natural forests into a broad range of future planning. In 2018, the NAC launched a conservancy engagement program, providing technical support to nonprofits that manage forested parkland.
If we commit to activating the full breadth of the Forest Management Framework today, the next 25 years will bring more effective capital investments, more professional opportunities, more meaningful public engagement, and more sustainable healthy forests.
Conclusion
Forest Management Framework for New York City32
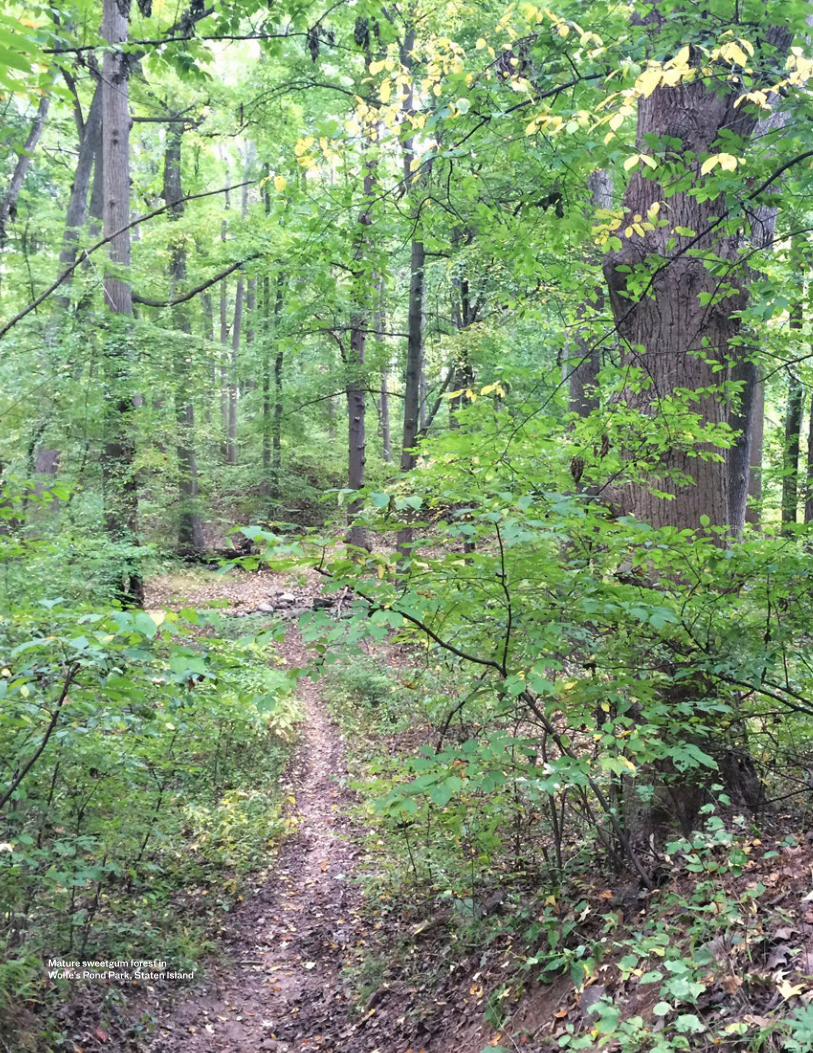
Mature sweetgum forest in Wolfe’s Pond Park, Staten Island

33Appendix A
APPENDIX A
Key Ecological Attributes of Healthy Urban ForestsAttributes, Indicators, and Field Measurements Used in NAC Forest Assessment
Attributes Indicators Field Measurements (10m radius plot, 4 1m x 1m subplots)
Forest Canopy Dominated by Native Species Relative basal area (m2/ha) of native tree species All trees ≥ 10cm DBH: species and DBH
Canopy Closure >50% to Help Limit Invasive Plant Growth % canopy closure Analysis of canopy photos and visual estimate of
% canopy closure in fixed-area plot (4 photos/plot)
Healthy Forest Canopy Proportion of trees with a healthy canopy Dieback, discoloration of foliage, defoliation, and vigor class estimations of trees >10cm DBH
Complex Vertical Structure Vegetation lifeforms in the understory, midstory, and overstory
Abundance and size class for woody plants (< 2cm DBH were sampled in 1m x 1m subplots)
Forest Understory Dominated by Native Species Diversity and relative cover of native herbaceous species % cover of all herbaceous plants and woody plants < 2cm DBH (1m x 1m subplots)
Soil Quality and Chemistry Suitable for Supporting Native Plants
Healthy range of pH, organic matter, macro- and micronutrients, limited heavy metals Soil sample collected at each forest plot
Structure in Forest Floor Leaf litter and downed woody material present on the forest floor
Leaf litter and duff depth measurements; % cover forest floor substrate; volume of fine, medium, and coarse woody material; decay class of coarse woody material
Limited Pest Damage to Plants Browse on vegetation (deer), missing leaf tissue (insect defoliation)
% herbivory classes for understory plants and trees/shrubs (2–10cm DBH)
Native Tree Regeneration Tree seedlings present in the understory Seedling % cover and individual count (1m x 1m subplot)
Limited Encroachment and Anthropogenic Alterations Dumping piles, desire lines, vandalism, trash % cover of any infrastructure, evident environmental
modification, or trash by category
No Invasive Vines Overtaking the Forest Canopy Species and stage class invasive vines in the understory, tree trunk, and tree canopy Vine presence on trees and stage (1, 2, 3)
Appendices

Forest Management Framework for New York City34
APPENDIX B
NYC’s Forest Management Budget
Restoration Planting Management Monitoring
In-House Restoration Acres
Contractor Restoration Acres In-House Planting Contractor Planting Volunteer Planting In-House
ManagementVolunteer
Management Maintenance Conservation (Monitoring)
Cost/Acre $6,078 $42,076 $75,543 $162,041 $99,177 $2,075 $28,534 $1,037 $35 Capital Funding
Expense Funding
Total Funding
Year Acres in Worktype Year Budget by Funding Type
1 63 89 26 0 9 140 16 0 685 1 $3,744,764 $3,970,545 $7,715,309
2 126 178 26 0 9 140 16 0 685 2 $3,857,107 $4,010,251 $7,867,358
3 126 178 44 22 22 276 31 155 685 3 $7,711,847 $7,610,110 $15,321,957
4 126 178 44 22 22 289 32 155 840 4 $7,943,203 $7,759,896 $15,703,098
5 126 178 44 22 22 291 32 307 995 5 $8,181,499 $8,016,989 $16,198,488
6 126 178 44 22 22 317 35 321 1,302 6 $8,426,944 $8,267,600 $16,694,544
7 126 178 44 22 22 209 23 323 1,623 7 $8,679,752 $7,763,044 $16,442,797
8 126 178 44 22 22 185 21 352 1,946 8 $8,940,145 $7,753,440 $16,693,585
9 126 178 44 22 22 185 21 232 2,298 9 $9,208,349 $7,709,565 $16,917,914
10 149 155 44 22 22 185 21 206 2,530 10 $8,223,006 $7,918,811 $16,141,817
11 174 130 44 22 22 185 21 206 2,736 11 $8,338,508 $8,021,539 $16,360,047
12 179 125 44 22 22 185 21 206 2,942 12 $8,468,682 $8,123,768 $16,592,450
13 183 121 48 24 24 193 21 206 3,148 13 $9,061,226 $8,833,801 $17,895,027
14 187 117 48 24 24 194 22 206 3,354 14 $9,265,266 $9,021,173 $18,286,439
15 191 113 49 24 24 194 22 214 3,560 15 $9,473,394 $9,220,945 $18,694,338
16 195 109 49 25 25 195 22 215 3,774 16 $9,685,670 $9,415,707 $19,101,377
17 199 105 50 25 25 196 22 216 3,989 17 $9,896,755 $9,614,055 $19,510,810
18 204 100 50 25 25 197 22 217 4,205 18 $10,044,135 $9,741,444 $19,785,579
19 208 96 50 25 25 198 22 218 4,422 19 $10,259,701 $9,945,372 $20,205,073
20 212 92 51 25 25 199 22 219 4,640 20 $10,478,424 $10,152,520 $20,630,943
21 217 87 34 17 17 60 7 220 4,859 21 $8,139,465 $6,798,098 $14,937,563
22 — 83 34 17 17 61 7 221 5,079 22 $8,287,590 $6,976,174 $15,263,765
23 — 79 9 4 4 15 2 67 5,300 23 $4,400,136 $2,602,038 $7,002,175
24 — 74 9 5 5 16 2 68 5,367 24 $4,428,571 $2,733,787 $7,162,359
25 — 71 10 5 5 17 2 17 5,435 25 $4,586,471 $2,787,602 $7,374,073
Total $199,730,611 $184,768,273 $384,498,883
*Capital costs increase by 3% per year
*Expense costs increase by 1% per year

35Appendix B
APPENDIX B
NYC’s Forest Management Budget
Restoration Planting Management Monitoring
In-House Restoration Acres
Contractor Restoration Acres In-House Planting Contractor Planting Volunteer Planting In-House
ManagementVolunteer
Management Maintenance Conservation (Monitoring)
Cost/Acre $6,078 $42,076 $75,543 $162,041 $99,177 $2,075 $28,534 $1,037 $35 Capital Funding
Expense Funding
Total Funding
Year Acres in Worktype Year Budget by Funding Type
1 63 89 26 0 9 140 16 0 685 1 $3,744,764 $3,970,545 $7,715,309
2 126 178 26 0 9 140 16 0 685 2 $3,857,107 $4,010,251 $7,867,358
3 126 178 44 22 22 276 31 155 685 3 $7,711,847 $7,610,110 $15,321,957
4 126 178 44 22 22 289 32 155 840 4 $7,943,203 $7,759,896 $15,703,098
5 126 178 44 22 22 291 32 307 995 5 $8,181,499 $8,016,989 $16,198,488
6 126 178 44 22 22 317 35 321 1,302 6 $8,426,944 $8,267,600 $16,694,544
7 126 178 44 22 22 209 23 323 1,623 7 $8,679,752 $7,763,044 $16,442,797
8 126 178 44 22 22 185 21 352 1,946 8 $8,940,145 $7,753,440 $16,693,585
9 126 178 44 22 22 185 21 232 2,298 9 $9,208,349 $7,709,565 $16,917,914
10 149 155 44 22 22 185 21 206 2,530 10 $8,223,006 $7,918,811 $16,141,817
11 174 130 44 22 22 185 21 206 2,736 11 $8,338,508 $8,021,539 $16,360,047
12 179 125 44 22 22 185 21 206 2,942 12 $8,468,682 $8,123,768 $16,592,450
13 183 121 48 24 24 193 21 206 3,148 13 $9,061,226 $8,833,801 $17,895,027
14 187 117 48 24 24 194 22 206 3,354 14 $9,265,266 $9,021,173 $18,286,439
15 191 113 49 24 24 194 22 214 3,560 15 $9,473,394 $9,220,945 $18,694,338
16 195 109 49 25 25 195 22 215 3,774 16 $9,685,670 $9,415,707 $19,101,377
17 199 105 50 25 25 196 22 216 3,989 17 $9,896,755 $9,614,055 $19,510,810
18 204 100 50 25 25 197 22 217 4,205 18 $10,044,135 $9,741,444 $19,785,579
19 208 96 50 25 25 198 22 218 4,422 19 $10,259,701 $9,945,372 $20,205,073
20 212 92 51 25 25 199 22 219 4,640 20 $10,478,424 $10,152,520 $20,630,943
21 217 87 34 17 17 60 7 220 4,859 21 $8,139,465 $6,798,098 $14,937,563
22 — 83 34 17 17 61 7 221 5,079 22 $8,287,590 $6,976,174 $15,263,765
23 — 79 9 4 4 15 2 67 5,300 23 $4,400,136 $2,602,038 $7,002,175
24 — 74 9 5 5 16 2 68 5,367 24 $4,428,571 $2,733,787 $7,162,359
25 — 71 10 5 5 17 2 17 5,435 25 $4,586,471 $2,787,602 $7,374,073
Total $199,730,611 $184,768,273 $384,498,883
*Capital costs increase by 3% per year
*Expense costs increase by 1% per year

Forest Management Framework for New York City36
APPENDIX C
NYC’s Parks in City Council Districts
Borough District Parkland Acreage
Natural Area
Acreage
Forested Natural Area Acreage NYC’s Parks with Natural Areas
Manhattan 5 40 3 0 Mill Rock Park
Manhattan 6 1,089 74 68 Central Park, Riverside Park
Manhattan 7 192 13 12 Fort Washington Park, Riverside Park
Manhattan 10 610 220 156 Fort Tryon Park, Fort Washington Park, Harlem River Park, Inwood Hill Park, Sherman Creek
Bronx 11 1,509 695 562Bronx Park, Raoul Wallenberg Forest, Riverdale Park, Seton Park, Spuyten Duyvil Shorefront Park, Van Cortlandt Park
Bronx 12 137 74 43 Givans Creek Woods, Pelham Bay Park, Seton Falls Park
Bronx 13 3,353 1,505 668 City Island Wetlands, Pelham Bay Park
Bronx 17 272 26 14 North Brother Island, South Brother Island
Bronx 18 434 134 17 Castle Hill Park, Harding Park Beautification Project, Pugsley Creek Park, Soundview Park
Queens 19 1,060 332 56 Alley Pond Park, Flushing Meadows Corona Park, Powell's Cove Park, Udall's Park Preserve
Queens 20 410 124 38 Flushing Meadows Corona Park, Kissena Corridor Park, Kissena Park
Queens 23 1,166 626 532 Alley Pond Park, Cunningham Park, Kissena Corridor Park
Queens 24 472 106 7 Flushing Meadows Corona Park
Queens 30 705 328 300 Forest Park, Highland Park
Queens 31 1,563 501 36Brant Point Wildlife Sanctuary, Brookville Park, Dubos Point Wildlife Sanctuary, Hook Creek Park, Idlewild Park, Jamaica Bay Park, Rockaway Beach and Boardwalk, Seagirt Ave. Wetlands, Vernam Barbadoes Peninsula
Queens 32 869 62 7Broad Channel American Park, Spring Creek Park, Spring Creek Park Addition, Sunset Cove Park
Brooklyn 39 528 110 75 Prospect Park
Brooklyn 42 265 92 6 Fresh Creek Nature Preserve, Spring Creek Park
Brooklyn 43 558 40 0 Calvert Vaux Park
Brooklyn 46 1,460 788 87Canarsie Park, Four Sparrow Marsh, Fresh Creek Nature Preserve, Marine Park, McGuire Fields, Paerdegat Basin Park
Staten Island 49 847 175 105 Clove Lakes Park, Eibs Pond Park, Graniteville Swamp Park, Shooters Island
Staten Island 50 3,537 2,000 1,208
Blood Root Valley, Bradys Pond Park, Deere Park, Freshkills Park, Great Kills Park, Greenbelt Native Plant Center, High Rock Park, Last Chance Pond Park, LaTourette Park, Meredith Woods, Ocean Breeze Park, Pralls Island, Reed's Basket Willow Swamp Park, Richmond Parkway, Saw Mill Creek Marsh, Staten Island Industrial Park, Willowbrook Park
Staten Island 51 2,832 1,824 1,235
Arden Woods, Bloomingdale Park, Blue Heron Park, Bunker Ponds Park, Conference House Park, Crescent Beach Park, Fairview Park, Freshkills Park, Great Kills Park, Hybrid Oak Woods Park, Isle of Meadows, Kingfisher Park, LaTourette Park, Lemon Creek Park, Long Pond Park, Richmond Parkway, Siedenburg Park, Wolfe’s Pond Park

37Appendix D
APPENDIX D
City Council Districts for NYC’s Forested Parks
Park Name City Council Districts
Alley Pond Park 19, 23
Arden Woods 51
Blood Root Valley 50
Bloomingdale Park 51
Blue Heron Park 51
Brady's Pond Park 50
Brant Point Wildlife Sanctuary 31
Broad Channel American Park 32
Bronx Park 11, 15
Brookville Park 31
Bunker Ponds Park 51
Calvert Vaux Park 43, 47
Canarsie Park 42, 46
Central Park 6
City Island Wetlands 13
Clove Lakes Park 49
Conference House Park 51
Crescent Beach Park 51
Cunningham Park 23
Deere Park 50
Douglaston Park Golf Course 23
Dubos Point Wildlife Sanctuary 31
Eibs Pond Park 49
Fairview Park 51
Flushing Meadows Corona Park 19, 20, 21, 24
Forest Park 29, 30
Fort Tryon Park 10
Fort Washington Park 7, 10
Four Sparrow Marsh 46
Fresh Creek Nature Preserve 42, 46
Freshkills Park 50, 51
Givans Creek Woods 12
Grand Central Parkway 23, 24
Graniteville Swamp Park 49
Great Kills Park 50, 51
High Rock Park 50
Highland Park 30
Hook Creek Park 31
Hybrid Oak Woods Park 51
Idlewild Park 31
Inwood Hill Park 10
Isle of Meadows 51
Jamaica Bay Park 31
Kingfisher Park 51
Kissena Corridor Park 20, 23
Kissena Park 20
Last Chance Pond Park 50
LaTourette Park & Golf Course 50, 51
Lemon Creek Park 51
Long Pond Park 51
Park Name City Council Districts
Marine Park 46
Meredith Woods 50
Mill Rock Park 5
North Brother Island 17
Ocean Breeze Park 50
Paerdegat Basin Park 46
Pelham Bay Park 12, 13
Powell's Cove Park 19
Pralls Island 50
Prospect Park 39
Pugsley Creek Park 18
Raoul Wallenberg Forest 11
Reed's Basket Willow Swamp Park 50
Richmond Parkway 50, 51
Riverdale Park 6, 7, 11
Rockaway Beach and Boardwalk 31, 32
Saw Mill Creek Marsh 50
Seagirt Ave. Wetlands 31
Seton Falls Park 12
Sherman Creek 10
Shooters Island 49
Siedenburg Park 51
Soundview Park 18
South Brother Island 17
Spring Creek Park Addition 32, 42
Spuyten Duyvil Shorefront Park 11
Staten Island Industrial Park 50
Udall's Park Preserve 19
Van Cortlandt Park 11
Vernam Barbadoes Peninsula 31
Willowbrook Park 50
Wolfe's Pond Park 51
Forest Management Framework for New York City38
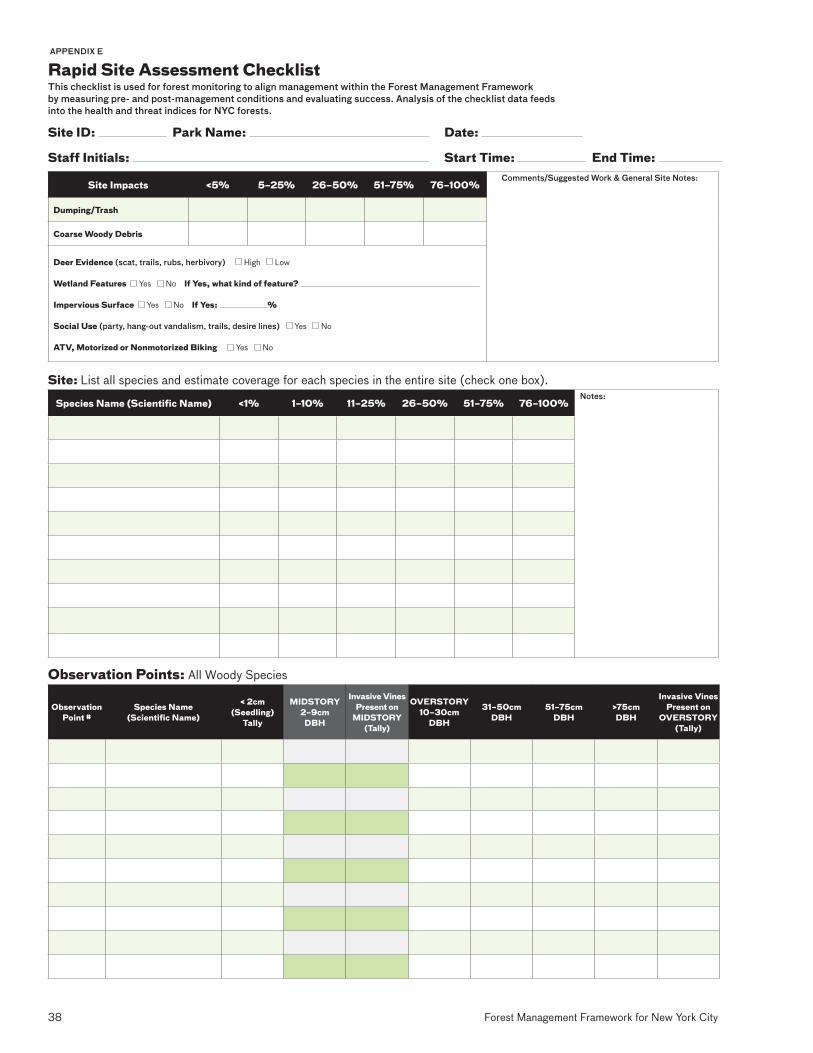
APPENDIX E
Rapid Site Assessment ChecklistThis checklist is used for forest monitoring to align management within the Forest Management Framework by measuring pre- and post-management conditions and evaluating success. Analysis of the checklist data feeds into the health and threat indices for NYC forests.
Site ID: Park Name: Date:
Staff Initials: Start Time: End Time:
Site Impacts <5% 5–25% 26–50% 51–75% 76–100%Comments/Suggested Work & General Site Notes:
Dumping/Trash
Coarse Woody Debris
Deer Evidence (scat, trails, rubs, herbivory) High Low
Wetland Features Yes No If Yes, what kind of feature?
Impervious Surface Yes No If Yes: %
Social Use (party, hang-out vandalism, trails, desire lines) Yes No
ATV, Motorized or Nonmotorized Biking Yes No
Site: List all species and estimate coverage for each species in the entire site (check one box).
Species Name (Scientific Name) <1% 1–10% 11–25% 26–50% 51–75% 76–100%Notes:
Observation Points: All Woody Species
Observation Point #
Species Name (Scientific Name)
< 2cm (Seedling)
Tally
MIDSTORY 2–9cm
DBH
Invasive Vines Present on
MIDSTORY (Tally)
OVERSTORY 10–30cm
DBH
31–50cm DBH
51–75cm DBH
>75cm DBH
Invasive Vines Present on
OVERSTORY (Tally)

39Appendix
Trail in Marine Park, Brooklyn, running through one of two remaining maritime forests in NYC

Forest Management Framework for New York City40
1. “How many people reside in urban or rural areas for the 2010 census?,” Frequently Asked Questions, United States Census Bureau, accessed April 26, 2016, http://ask.census.gov.
2. F. Thomas Juster, et al., Changing Times of American
Youth: 1981–2003 (Ann Arbor: Institute for Social Research, University of Michigan, November 2004).
3. Louise Chawla, “Benefits of Nature Contact for Children,” Journal of Planning Literature 30, no. 4 (November 2015): 433–52.
4. Netta Weinstein, et al., “Seeing Community for the Trees: The Links among Contact with Natural Environments, Community Cohesion, and Crime,” BioScience 65, no. 12 (December 2015): 1141–53.
5. “Using Trees and Vegetation to Reduce Heat Islands,” United States Environmental Protection Agency, accessed January 30, 2018, https://www.epa.gov/heat-islands/using-trees-and-vegetation-reduce-heat-islands.
6. David J. Nowak, “Institutionalizing Urban Forestry as a ‘Biotechnology’ to Improve Environmental Quality,” Urban
Forestry & Urban Greening 5, no. 2 (2006): 93–100, https://doi.org/10.1016/j.ufug.2006.04.002.
7. J. P. M. O’Neil-Dunne, S. W. MacFaden, H. M. Forgione, and J. W. T. Lu, Urban Ecological Land-Cover Mapping
for New York City: Final Report to the Natural Areas
Conservancy (Spatial Informatics Group, University of Vermont, Natural Areas Conservancy, and New York City Department of Parks & Recreation, 2014), http://naturalareasnyc.org/in-print/research/urbanecologicalmap_newyorkcity_report_2014.pdf.
8. O’Neil-Dunne, et al., Urban Ecological Land-Cover
Mapping.
9. O’Neil-Dunne, et al., Urban Ecological Land-Cover
Mapping. 10. Gregory J. Edinger, Timothy G. Howard, and Matthew D.
Schlesinger, Classification of Natural Areas Conservancy’s
Ecological Assessment Plots (Albany: New York Natural Heritage Program, 2016), http://naturalareasnyc.org/ in-print/research/nynhp_classification_of_nac_plots.pdf.
11. Helen M. Forgione, et al., “Advancing Urban Ecosystem Governance in New York City: Shifting Towards a Unified Perspective for Conservation Management,” Environmental
Science & Policy 62 (2016): 127–32, http://naturalareasnyc.org/content/3-in-print/2-research/esp.article.pdf.
12. D. S. Novem Auyeung, et al., Reading the Landscape:
Citywide Social Assessment of New York City Parks and
Natural Areas in 2013–2014 (New York: New York City Urban Field Station, March 2016), https://www.fs.fed.us/nrs/pubs/jrnl/2016/nrs_2016_auyeung_001.pdf.
Notes

41Appendix
Successional sweetgum forest in Alley Pond Park, Queens

Tulip-tree seedlings propagated at the Greenbelt Native Plant Center, Staten Island