Forest Inventory and Analysis · Cover photo: Forester Jason ... FIA-appropriated funding level,...
91
Layout Draft 2014 Annual Report 04/15/2015 1 Forest Inventory and Analysis Fiscal Year 2014 Business Report
Transcript of Forest Inventory and Analysis · Cover photo: Forester Jason ... FIA-appropriated funding level,...

Layout Draft 2014 Annual Report 04/15/2015
1
Forest Inventory and Analysis Fiscal Year 2014 Business Report

Layout Draft 2014 Annual Report 04/15/2015
2
Forest Inventory and Analysis Fiscal Year 2014 Business Report

Layout Draft 2014 Annual Report 04/15/2015
3
Disclaimer
USDA is an equal opportunity provider and employer. To file a complaint of discrimination, write: USDA,
Office of the Assistant Secretary for Civil Rights, Office of Adjudication, 1400 Independence Ave., SW,
Washington, DC 20250-9410 or call (866) 632-9992 (Toll-free Customer Service), (800) 877-8339 (Local
or Federal relay), (866) 377-8642 (Relay voice users).
Cover photo: Forester Jason Hewitt measures the diameter of a giant yellow-poplar tree
on the Joyce Kilmer Memorial Forest near Robbinsville, NC. (Photo courtesy of Marcus
Wood, Southern Research Station Forest Inventory and Analysis.)

Layout Draft 2014 Annual Report 04/15/2015
4
Contents
Executive Summary
Introduction
Changes From Previous Years’ Business Reports
Fiscal Year 2014 Program Overview
Outputs and Products
Program Resources
FIA Grants and Partners’ Contributions
FIA Data Availability
Quality Assurance
Regional Program Accomplishments for FY 2014
Northern Research Station FIA Program
Pacific Northwest Research Station FIA Program
Rocky Mountain Research Station, Interior West FIA Program
Southern Research Station FIA Program
National FIA Program Office Staff
FIA Data Requests and Access
Partners
FY 2014 Spatial Data Requests
FY 2014 Web Tools
Consultations by FIA Staff
National Inventory and Monitoring Applications Center
National Forest Collaboration
Other FIA Program Features
Forest Products, Utilization, and National Woodland Owner Studies
Ecosystem Health Indicator Surveys
Special Partnerships Spanning Cultures
Program Safety
Regional Safety Highlights for FY 2014
Northern Research Station FIA Safety Highlights
Pacific Northwest Research Station FIA Safety Highlights
Rocky Mountain Research Station, Interior West FIA Safety Highlights
Southern Research Station FIA Safety Highlights
Comparing FY 2013 Plans With FY 2014 Accomplishments and FY 2015 Plans

Layout Draft 2014 Annual Report 04/15/2015
5
Fiscal Year 2015 FIA Program Direction
Long-Term Strategic Direction
Conclusions
Glossary of Terms Used in Appendixes [16]
Appendix A. Contacts [16]
Appendix B. Tables [14]

Layout Draft 2014 Annual Report 04/15/2015
6
List of Figures and Tables Figure 1. FIA implementation status, FY 2014.
Figure 2. FIA program available funds and expenses by category, FY 2014.
Figure 3. FIA-appropriated funding level, FYs 2001–15 (projected).
Figure 4. FIA program employees by job group, FY 2014.
Figure 5. Grants and agreements by recipient group, FY 2014.
Figure 6. Availability of online FIA data, FY 2014.
Figure 7. Publication status of State reports, FYs 2009–14.
Figure 8. Maps of (A) historical spread of the beech bark disease (BBD) or beech scale
(2006) and (B) historical spread of hemlock woolly adelgid (2006).
Figure 9. Annual percent mortality (A) and net growth (B) of American beech, hemlock,
red maple, and sugar maple in overlapping and nonoverlapping HWA- and BBD-
infested areas.
Figure 10. Projected housing density change on private forest land in Guam between 2000
and 2030.
Figure 11. Interpolated (inverse distance weighting) Shannon’s diversity index of specific
gravity (unitless) for forests of the Eastern United States.
Figure 12. Mean carbon stocks (left) and sequestration (right) on national forest lands by
fifth-order watershed in the Pacific Northwest. Carbon in live trees, dead trees,
down dead wood, and live understory vegetation on forest and nonforest lands is
included.
Figure 13. A swath of high-resolution lidar 3-D forest canopy measurements acquired near
Tok, Alaska.
Figure 14. Examples of forest disturbance agents.
Figure 15. Pinyon jay (Gymnorhinus cyanocephalus).
Figure 16. Forest carbon stock changes (TgC yr–1
) resulting from land use dynamics (right
side) and forest dynamics within forest land uses (left side).
Figure 17. Demonstration map illustrating supply polygons within 50-, 75-, and 100-mile
radii for potential mill sites in Marshall County, AL. Plot locations are
approximate to protect privacy considerations.
Figure 18. Spatial variability in rate of change of the importance value [ΔIV = (IVsp2 –
IVsp1) / number of years between SP1 and SP2] of blackgum across the four
ecoregions of the Eastern United States.
Figure 19. Requests made to the FIA Spatial Data Services Center in FY 2014.
Figure 20. Number of recordable illness and injury incidents by FIA unit, FYs 2008–14.
Figure 21. Number of reportable motor vehicle accidents by FIA unit, FYs 2008–14.
Figure 22. Planned FIA implementation statu, FY 2015.
Figure A-1. FIA regions and headquarters.
Table 1. Overview of land area, FIADB forest area, RPA forest area, estimated P1 pixels,
and estimated P2 plots by region in FY 2014.
Table 2. Annual FIA appropriations and allocation of FIA-appropriated and State-
contributed funds for fieldwork only for FYs 2007–14.
Table 3. FIA grants and partners’ contributions, FYs 2000–14.
Table 4. Number of database retrievals using FIA Web applications by fiscal year.
Table 5. Number and hours of significant consultations by FIA staff, by customer group,
FY 2014.
Table 6. Base safety reference data, recordable incidents, and incident frequency by FIA
unit, FY 2014.

Layout Draft 2014 Annual Report 04/15/2015
7
Executive Summary
For more than 80 years, the Forest Inventory and Analysis (FIA) program has played
an integral role in providing the information vital to managing the Nation’s forest
resources. In recent years, an increased number of major decisions affecting the
Nation’s forests have been made with reference to and reliance on FIA findings and
forest resource evaluations. Contemporary topics include carbon sequestration, forest
product sector and employment trends, biomass availability, land cover and land use
change, pollutant effects, and fire risk.
In 1999 (Farm Bill, PL 105-185) and again in 2014 (Farm Bill PL 113-79), Congress
directed the Forest Service, an agency of the U.S. Department of Agriculture
(USDA), to reevaluate its statewide inventory mission and to make the transition
from an approach in which each State is surveyed periodically to one in which each
State is inventoried annually. FIA developed these plans in concert with its partners,
to carry out the congressional mandate. FIA’s Strategic Plan for Forest Inventory and
Analysis include a requirement for an annual business report that outlines the status
and progress of the national annual inventory program.
This annual business report, our 17th, tells the taxpayers, partners, and clients what
the program has accomplished with the financial resources provided and what the
program will accomplish in the coming year with budgeted financial resources. This
relationship with taxpayers, partners, and clients is integral to FIA’s continued
success, because accountability is our first priority. Some key findings of this annual
report are—
Annualized progress: In fiscal year (FY) 2014, FIA maintained annualized
inventory activity in all 50 States (excluding interior Alaska except for the Tanana
Valley). Because of travel restrictions and late budget allocations, FIA was not able to
maintain annual plot production at efficient levels in FY 2014. The total area
currently sampled represents about 90 percent of all U.S. forest lands, with interior
Alaska outside the Tanana Valley representing the remaining 10 percent of the
Nation’s forest area.
Funding: Total funding from all sources for the FIA program in FY 2014 was $77.7
million, a net increase of $1.8 million from FY 2013 (appropriated funding increased
$1.2 million). FY 2014 funding consisted of $66.8 million appropriated by Congress
plus $1.7 million in net adjustments from the previous fiscal year, special funding of
$1.4 million, and $7.8 million in partners’ funds. State partners’ funds are used to
maintain an annual measurement and 5-year State report cycles. In FY 2014, total
funding from all sources was 14 percent less than the amount needed for full program
implementation.
Partners’ support: Partners contributed $7.8 million to the program in FY 2014.
Using cost share, 36 States contributed $3.9 million toward buying down their

Layout Draft 2014 Annual Report 04/15/2015
8
measurement and reporting cycles to 5 years or to intensify their plot network.
Overall, partners’ contributions increased by $166,000 from FY 2013.
Grants and agreements: When external cooperators can complete critical FIA work
with equal quality for less cost, FIA contracts for these services—a total of $15.8
million was spent in this way in FY 2014. Text table 2 summarizes FIA funding
activity to and from States from FY 2007 through FY 2014 for data collection, and
appendix table B-5 provides details on all FIA grants.
Data availability: Data for 48 States and coastal Alaska are now on line and less than
2 years old. These data supplied information for 586 spatial data requests and 186,175
online data requests.
Five-year reports: By FY 2014, FIA had completed at least one 5-year report or
periodic report for 96 percent of the States and 100 percent of the islands since
annualized inventory began in 1999. In all, FIA had 234 publications, 87 of which
were peer reviewed in FY 2014.
Quality assurance: FIA field-checked 8 percent of all field plots measured in FY
2014 to ensure that FIA databases comprise only the highest quality data. All plots
are further checked for consistency when loaded into the FIA database.
Users groups: FIA relies heavily on periodic meetings with users and clients to
ensure that the program is providing the highest quality service and meeting its
planned objectives. In 2014, FIA held six regional and one national users group
meetings to gauge how well it is meeting the goals stated in the strategic plan and the
previous year’s annual report.
Personnel: FIA, directly and through cooperators, employed 570 people in FY 2014.
Cooperators are integral to the efficient delivery of the FIA program, comprising 204
of the 570 employees, or 33 percent of the total workforce. Of the total workforce,
178 were employed in information management, techniques research, or resource
analysis; they provided 945 consultations (7,987 hours) to help users and clients
effectively use FIA data.
Other program features: Although plot-based field surveys provide most FIA data,
additional questionnaires and surveys are conducted to report on timber product
output (TPO), logging utilization, fuelwood production, the characteristics and
management objectives of the Nation’s private woodland owners through the
National Woodland Owners Survey (NWOS), and several indicators of forest health.
Since FY 2000, FIA has collected such data from more than 62,500 surveys and
questionnaires. This information, in concert with FIA plot data, is critical to
monitoring the sustainability of the Nation’s forest resources.
New FIA Strategic Plan: On February 7, 2014, Congress passed the 2014 Farm Bill.
Section 8301 requires the FIA program to revise its previous strategic plan and submit the

Layout Draft 2014 Annual Report 04/15/2015
9
new plan to the Committee on Agriculture of the House of Representatives and the
Committee on Agriculture, Nutrition, and Forestry of the Senate. The new Strategic Plan
for Forest Inventory and Monitoring is forward looking and attempts to balance emerging
client demands for new information, tools, and values with necessary decisions on
priorities and budget constraints. The new strategic plan, like previous FIA strategic
plans, was developed in cooperation with partners and stakeholders and identifies the
base program, enhancements to the base, priorities for new programs, and areas for
increased flexibility in the future, and it addresses 11 specific provisions outlined in the
Farm Bill for FIA to consider.
A brief overview of provisions to be addressed in the new plan include (1) complete the
transition to a fully annualized forest inventory program; (2) implement an annualized
inventory of trees in urban settings; (3) report on renewable biomass supplies and carbon
stocks; (4) engage State foresters and other users in evaluating core FIA data; (5) improve
the timeliness of the TPO program and database; (6) foster greater cooperation among
FIA, research station leaders, and State foresters; (7) promote availability of and access to
non-Federal resources to improve information management; (8) collaborate with other
agencies to integrate remote sensing, spatial analysis techniques, and new technologies
into FIA; (9) understand and report on changes in land cover and use; (10) expand
existing programs to promote sustainable forest stewardship through increased
understanding of the more than 10 million family forest owners; and (11) implement
procedures to improve the statistical precision of estimates at the sub-State level.
The plan elaborates on six potential options for moving the program forward to fully
implement the Farm Bill provisions. More detail of the plan is provided in the Long-
Term Strategic Direction section at the end of this report.
Looking to 2015: FIA had a productive year in FY 2014 and looks forward to further
progress in FY 2015. Important goals for FY 2015 include—
• Continue annualized inventory of 50 States (including the Tanana Valley in
interior Alaska).
• Report U.S. forest carbon numbers to the United Nations Intergovernmental Panel
on Climate Change.
• Publish the translations of the U.S. Forest Resource Facts and Historical Trends
brochures in Chinese, French, Portuguese, Russian, and Spanish.
• Prepare a report on the Austin, TX urban study.
• Complete and print the Forest Atlas of the United States (FIAtlas).
• Post on the Web the FIA Strategic Plan for Forest Inventory and Monitoring
submitted to Congress.
• Complete at least 10 State 5-year reports.
• Publish NWOS report based on 2011 through 2013 survey data.
• Implement the new TPO data-collection system and publish the 2012 National
Pulpwood report.

Layout Draft 2014 Annual Report 04/15/2015
10
• Work with partners to improve land cover and land use classifications.
• Prepare FIA Database 6.0 User Guide and begin planning National Core Field
Guide 7.0.
• Maintain and improve the Forest Inventory Data Online system.
For additional detail, see Comparing FY 2013 Plans With FY 2014 Accomplishments
and FY 2015 Plans.
Layout Draft 2014 Annual Report 04/15/2015
11
Introduction
The Forest Inventory and Analysis (FIA) program of the Forest Service, an agency of the
U.S. Department of Agriculture (USDA), provides the information needed to assess the
status, trends, and sustainability of America’s forests. This business report, which
summarizes program activities in fiscal year (FY) 2014 (October 1, 2013, through
September 30, 2014), gives our customers and partners a snapshot of past activities,
current business practices, and future program direction. It is designed to increase our
accountability and foster performance-based management of the FIA program. (Note:
This business report does not include statistical information about the forests of the
United States. Those who want to obtain such information should contact the appropriate
regional or national FIA office listed in appendix A of this report or go to
http://www.fia.fs.fed.us.)
The FIA program has been the Nation’s continual forest census since 1930. We collect,
analyze, and report information on the status and trends of America’s forests: how much
forest exists, where it exists, who owns it, and how it is changing and also how the trees
and other forest vegetation are growing, how much has died or been removed, and how
the harvested trees have been used in recent years. This information can be used in many
ways, such as in evaluating wildlife habitat conditions, assessing sustainability of current
ecosystem management practices, monitoring forest health, supporting planning and
decisionmaking activities undertaken by public and private enterprises, and predicting the
effects of climate change. The FIA program combines this information with related data
on insects, diseases, and other types of forest damage to assess the current health and
potential risks to forests. These data are also used to project how forests are likely to
appear in 10 to 50 years under various scenarios to evaluate whether current forest
management practices are sustainable in the long run and to assess whether current
policies will enable our grandchildren and their grandchildren to enjoy America’s forests
as we do today.
Changes From Previous Years’ Business Reports
The FIA program continues to seek performance measures that accurately reflect the
program’s progress toward meeting the goal of annualized inventory in all 50 States. This
report includes more precise information about whether field plots were part of the base
7- to 10-year Federal program or were intensification plots (spatial or temporal).
Loss of State and Private Forestry (S&PF) funding: Because of shifts in funding
sources, at the direction of Congress, the program no longer receives an annual segment
of base funding from the S&PF Deputy Area of the Forest Service. All current funding is
provided by the Research and Development (R&D) Deputy Area of the Forest Service.
Information Resources Direction Board (IRDB) investments: —Major FIA
investments in information technology and delivery are reviewed and approved by the
IRDB. These investments are considered national FIA expenditures because they affect
the entire program and are accounted in theNational FIA Program Office budget in

Layout Draft 2014 Annual Report 04/15/2015
12
appendix tables B-2 and B-5.
Fiscal Year 2014 Program Overview
In FY 2014, the FIA program completed the 16th
year of implementing the annual
inventory system as outlined in the Strategic Plan for Forest Inventory and Monitoring,
written in response to the Agricultural Research, Extension, and Education Reform Act of
1998 (Public Law 105-185). The FIA program includes two basic sample levels: Phase 1
(P1), which consists of remote sensing for stratification to enhance precision, and Phase 2
(P2), which is based on the original set of FIA forest measurement plots (approximately
one plot per 6,000 acres). A subsample of P2 plots may also be measured for a broader
set of forest ecosystem indicators. The number of plots with various ecosystem indicators
is noted in appendix table B-9. By the end of FY 2003, our goal was to implement an
annual FIA program that measures at least 10 percent of all P2 sample locations per year
in the Western United States, and 15 percent of P2 sample locations per year in the
Eastern United States. Table 1 shows the overall distribution of P1 and P2 elements of the
FIA sample for the United States. The numbers in this table are for illustrative purposes
only and do not include possible additional plots that may be required because of partially
forested sample locations. This process can add 15 to 20 percent more plots that have to
be visited to collect data.
Table 1. Overview of land area, FIADB forest area, RPA forest area, estimated P1 pixels and estimated P2 plots by region in FY 2014.
FIADB = Forest Inventory and Analysis Database. FY = fiscal year. P1 = Phase 1. P2 = Phase 2. RPA = Resources Planning Act. *MODIS 250 m pixels at 15.4 acres each.
The base program includes annual compilations of the most recent year’s information,
with full State-level reporting at 5-year intervals. All States have the option to contribute
the resources necessary to bring the program up to the full sample intensity of 20 percent
per year, or to make other value-added contributions, such as funding new measurements
or additional sample locations. In FY 2014, the total appropriated funding was $10.8
million below the target level outlined in the FIA strategic plan1
to complete the transition
of the base program to full implementation. The following sections highlight current
1 U.S. Department of Agriculture, Forest Service. 2007. Forest Inventory and Analysis strategic plan: a
history of success, a dynamic future. FS-865. Washington, DC: U.S. Department of Agriculture, Forest
Service, Research and Development. 17 p.
Region
Land
area
Forest
area
(FIADB)
Forest
area
(RPA) Forest All P1* All P2
Mil. acres Mil. acres Percent Mil. pixels Plots
North 607 182 182 30 39.5 101,140
South 533 267 245 50 34.8 88,839
Interior West 548 154 125 27 35.6 91,282
Pacific Coast (California, Oregon, Washington) 204 85 84 42 13.2 33,944
Coastal Alaska 39 14 14 35 2.7 6,507
Interior Alaska 327 114 114 35 21.0 3,373
Islands (including Hawaii) 7 4 4 53 0.5 1,163
Total 2,264 821 768 33 147.2 326,247

Layout Draft 2014 Annual Report 04/15/2015
13
outputs and products, program resources, and partners’ contributions.
Outputs and Products
Appendix table B-1 shows some comparisons across FIA regional units in the rates,
costs, and performance of implementing the FIA program. In FY 2014, we were active in
49 States plus coastal Alaska (fig. 1), measuring 36,228 base P2 sample locations (15,395
forest and 20,833 nonforest) from the base grid, or 13 percent of the total. At the end of
FY 2014, all States were covered by some level of annual FIA program activity, but only
49 States (98 percent) were fully implemented, with interior Alaska having funding to
support only the Tanana Valley. Appropriated funding saw a modest increase of $1.2
million in FY 2014 and partners’ support increased $165,000. FIA’s congressional
mandate, under the Renewable Resources Research Act of 1978 (PL 95-307), states that
the Nation’s Trust Territories and Freely Associated States are to be treated as States for
research purposes. Since 2001, in compliance with this mandate, periodic inventories
have been completed in the Commonwealth of Puerto Rico, U.S. Virgin Islands,
Federated States of Micronesia, American Samoa, Guam, the Republic of Palau, the
Republic of the Marshall Islands, and the Commonwealth of the Northern Mariana
Islands, all of which are exempt from the annualized system and have periodic
inventories. Reinventory of the islands continued with work in Palau in 2014.
Figure 1. FIA implementation status, FY 2014.
FIA = Forest Inventory and Analysis. FY = fiscal year.
The FIA program produced 234 reports and publications in FY 2014, just 4 fewer than in
FY 2013. Of these publications, 87 were core publications consisting of reports specific
Annualized FIA
American Samoa
Guam
Palau
Puerto Rico
Virgin Islands
Commonwealth
of the Northern
Mariana Islands
Federated States
of Micronesia
Republic of the
Marshall Islands
Other Islands(periodics)
Not implemented
Periodic FIA

Layout Draft 2014 Annual Report 04/15/2015
14
to a complete survey unit, complete State, national forest, or national report. Core reports
include 5-year State reports as required by legislation. FIA also published 87 articles in
peer-reviewed journals and 21 articles in proceedings from scientific meetings and
conferences. FIA staff participated in 945 significant consultations with FIA customers,
requiring 7,987 hours of staff time—equivalent to more than four full-time staff
positions. The FIA technical staff met on several occasions to further refine the national
core FIA program, resulting in continued improvement of the FIA National Core Field
Guide and enhancement of Internet tools for accessing and analyzing FIA data, including
the National Information Management System (NIMS), which provides a single national
platform for processing FIA data and posting it on the Web. Our Internet resources
processed more than 186,175 data retrievals in which FIA customers obtained user-
defined tables, data downloads, and maps of interest. This number was nearly 83,000
more retrievals than in the previous year because the program brought a new interactive
timber product output (TPO) tool on line. It is expected that online retrievals will
continue on their upward track in 2015 and beyond.
Program Resources Congress appropriated funds for the FIA program in one Forest Service deputy area:
R&D, which had $66,805,000 in appropriated funds in FY 2014, a net increase of
$1,238,000 from FY 2013 (appendix table B-12). The previous S&PF Forest Resource
Inventory and Assessment budget line was permanently zeroed out at the end of FY
2013. In FY 2014, States and other partners provided an additional $7,833,329 for plot
intensification and other program enhancements. Total available program funding,
including $1,655,594 in preyear adjustments and $522,000 in special funding, was
$77,715,690 in FY 2014 (fig. 2).
In its annual appropriation, Congress intends for FIA to make funds available for cost-
sharing with States to help implement the FIA program. In turn, States take advantage of
FIA’s on-the-ground resources, contracted or dedicated, to contribute funds for additional
data collection to meet their local needs. Table 2 demonstrates the financial side of this
partnership. Nearly one-third of all FIA fieldwork is accomplished using these
partnerships.

Layout Draft 2014 Annual Report 04/15/2015
15
Table 2. Annual FIA appropriations and allocation of FIA-appropriated and State-contributed funds for fieldwork only for FYs 2007–14.
FIA = Forest Inventory and Analysis. FY = fiscal year.
Figure 2. FIA program available funds and expenses by category, FY 2014.
FIA = Forest Inventory and Analysis. FY = fiscal year.
Across FIA regions, cost and productivity figures differ because of the cyclical nature of
the current inventory system and because of differences among field units in operational
methods and ease of access to property. Rates of effective indirect expenses in FIA field
units in 2014 ranged from 9 to 14 percent across the country (appendix table B-2),
reflecting differences in both sources of funding and in research station indirect expense
assessment practices. The National FIA Program Office has a 66-percent rate of indirect
cost because that budget item includes the USDA overhead and programwide charges to
the Albuquerque Service Center ($6,234,000) and expenses related to the IRDB
($2,583,000) in FY 2014. Overall, the program’s indirect expenses were 21.5 percent of
the total expenses. Figure 3 shows the total appropriated funding for FIA from FY 2001
through FY 2014 and the FY 2015 target. Appendix table B-12 shows the trend data in
FIA performance measures for FY 2007 through FY 2014.
Category 2007 2008 2009 2010 2011 2012 2013 2014
Total FIA appropriation 63,605 64,641 65,536 71,817 71,452 69,186 65,567 66,805
6,146 5,590 6,971 7,278 8,002 7,475 5,338 7,098
18 18 19 20 17 18 16 17
341 311 367 364 471 415 334 418
10% 9% 11% 10% 11% 11% 8% 11%
5,824 3,783 4,594 5,039 6,192 5,567 3,962 3,919
41 41 44 45 40 41 38 36
142 92 104 112 155 136 104 109
Number of States contributing funds
Average contribution from States
State contributions for leveraged
data collection
FIA data collection grants to States
Fiscal Year
Thousand dollars
Average grants to participating
States
Number of States receiving grants
Percent of appropriated funding granted
to States for data collection
Total funds available ($77,715,690)
Salary42%
Travel3%
Office Space3%
Equipment & Other Direct
4%
Grants20%
Indirect expenses
17%
Partner funds expended
10%
EOY Balance1%
Expenses and EOY balance
FS Research Appropriation
86%
Returns, Adjustments,
Special Projects
2%
Special project funding
2%
Partner Funds received
10%

Layout Draft 2014 Annual Report 04/15/2015
16
Figure 3. FIA-appropriated funding level, FYs 2001–15 (projected).
FIA = Forest Inventory and Analysis. FY = fiscal year. * Dark blue bar (plus red shortfall bar) is estimated total funding ($77.7 million) required to deliver the full base FIA program in FY 2014 under the 2007 strategic plan.
In FY 2014, FIA Federal program staffing consisted of 366 Federal person-years of effort
(appendix table B-3a), the same as in FY 2013. Cooperators, especially State forestry
organizations, using grants and agreements, accomplish much of the work done by FIA,
and they added 204 employees for a total workforce of 570. The additional cooperator
employees included 158 State field employees, 7 information management specialists, 16
analysts, 20 researchers, and 1 administrative specialist. Cooperator employees constitute
36 percent of the total FIA workforce in FY 2014.
Of all Federal and cooperator FIA employees, approximately 63 percent were involved in
data collection and field support, 22 percent in analysis and information management, 8
percent in techniques research, 5 percent in program management and administration, and
1 percent in P1 production work (fig. 4).
70
.00
0
0
10
20
30
40
50
60
70
80
90
2001 2002 2003 2004 2005 2006 2007 2008 2009 2010 2011 2012 2013 2014 2015
Mill
ion
do
llars
funding level to fully implement the 2007 FIA Strategic Plan and transition to fully annualized inventory in all 50 States (shortfall in red)

Layout Draft 2014 Annual Report 04/15/2015
17
Figure 4. FIA program employees by job group, FY 2014.
FIA = Forest Inventory and Analysis. FY = fiscal year.
FIA Grants and Partners’ Contributions The complete FIA program envisioned by Congress was to be a Federal-State
partnership, in which both Federal and State partners contribute resources to accomplish
the work. Congressional guidance indicates that the base Federal commitment is an
inventory program that collects data from 10 percent of the sample locations in the
Western United States (10-year cycle) and 15 percent of the sample locations in the
Eastern United States (7-year cycle) annually, with comprehensive, analytical reports for
all States produced at 5-year intervals. The following discussion summarizes program
grants and partners’ contributions.
Grants and Agreements: Each year, FIA units enter into various grants and cooperative
agreements with partners to accomplish specialized work in support of the FIA mission.
In some cases, partners provide expertise that is not available within FIA; in other cases,
they share the workload. Appendix table B-5 lists 67 grants and agreements for FY 2014,
comprising $15,704,654. This number fluctuates from year to year, but it demonstrates
the reliance of the FIA program on collaborations with external partners to efficiently
complete the work. Most of these grants and agreements were with State agencies (45
percent) and university partners (32 percent) (fig. 5).
Administration5% Phase 1
production work2%
Phase 2 fieldwork (Federal)
35%
Phase 2 fieldwork
(State)28%
Information management
8%
Analysis14%
Techniques research
8%
EMPLOYEES (570)

Layout Draft 2014 Annual Report 04/15/2015
18
Figure 5. Grants and agreements by recipient group, FY 2014.
FY = fiscal year.
Additional cooperators included other Federal and Forest Service offices (8 percent) and
non-Federal partners (15 percent) supporting grant collaboration in data collection,
information management, and research in techniques development. We expect to
continue to make significant use of grants and agreements to augment FIA staff capacity
in the analysis and reporting of annual FIA data for individual States.
Partners’ Contributions: At their discretion, partners may contribute the resources that
are needed to bring the FIA program up to the full 20-percent measurement per year (5-
year cycle) that is described in the authorizing legislation. In addition to that choice, or as
an alternative, partners may choose to contribute resources for other purposes that add
value to the FIA program from their perspective, such as intensifying the base FIA
sample location grid to support analysis at finer spatial resolution, funding additional
types of measurements on FIA sample locations, or providing analyses or reporting
beyond that provided by FIA. The willingness of partners to contribute resources
demonstrates the inherent value of the FIA program as a flexible framework on which to
address other issues of interest.
Appendix table B-4 lists 83 partners that have contributed resources to the FIA program
in FY 2014, either to achieve the 20-percent level of cost-sharing envisioned by Congress
or to add value to FIA in other ways. These resources include staff time, vehicle use,
office space, equipment, travel costs, and other noncash items that support or add value to
the FIA program. Contributions are valued for reporting purposes in terms of what it
would have cost the Federal FIA staff to provide the same service, which may not
necessarily be the same as the actual cost to the partner making the contribution. Overall,
partners contributed $3.8 million toward the full 20-percent of target plots measured
annually. FIA program that was envisioned by Congress and another $4.0 million in
University32%
State agency45%
Other 15%
Forest Service8%

Draft 2014 Annual Report 02/26/15
19
contributions that add value to the FIA program, for a total of $7.8 million in partners’
contributions. These contributions amount to $165,000 more than partners contributed in
FY 2013. Experience has shown that as Federal funds decline, partners’ contributions
tend to follow. The source of partners’ contributions depends on the region of the country
and the ability of States and partners to contribute. In the West, where forest land
ownership is primarily Federal, the major cost-sharing partners tend to be Federal land
managers.
Since 2000, FIA has provided grants of nearly $169 million to efficiently carry out
annualized inventory and partners have contributed more than $116 million to leverage
Federal dollars to reduce inventory cycles and provide for other annual inventory
enhancements. Table 3 summarizes FIA grants and partners’ contributions by
organization.
Table 3. FIA grants and partners’ contributions, FYs 2000–14.
FIA = Forest Inventory and Analysis. FY = fiscal year. Note: Percentages may not add to totals because of rounding.
FIA Data Availability In 2014, FIA completed migrating its data and data-processing procedures to the new
Forest Service corporate servers in Kansas City, MO. The overall goal of this migration
was to move the Forest Service to a more reliable and modern infrastructure with
improved platform tools, better response times, better documentation and, of course,
lower total life cycle cost. Using optimized scheduling, the FIA units were able to
complete the initial migration with only minor data loading and access delays. Many
significant applications’ development challenges remain in the new corporate server
environment, but the first major hurdle is behind us. FIA has overcome the initial hurdles
of the migration and online data access has begun to return to normal levels that are
commensurate with FIA’s high customer service standards (appendix B-7).
The FIA program is designed to provide continually updated, accurate, and reliable
information on status and trends in the Nation’s forested resources. Obtaining current
information is one chief interest of FIA customers. Our program objectives include (1)
providing annual access to current data for all forested lands sampled as part of the
annual inventory system, and (2) producing analytical reports for all States on a 5-year
cycle.
Total FIA
grants
Average
annual grants
Total partner
contibutions
Average annual
contributions
States/islands 93,947,307 6,263,154 56% 83,928,015 5,595,201 72%
Universities 45,873,494 3,058,233 27% 6,696,928 446,462 6%
Forest Service 14,100,069 949,005 8% 22,103,262 1,473,551 19%
Other Federal 1,310,370 87,358 1% 3,490,511 232,701 3%
Other partners 13,614,246 907,616 8% 362,527 24,168 0.3%
Total 168,980,487 11,265,366 100% 116,581,243 7,772,083 100%
Dollars Dollars
Percent of
contributions
Percent of
grantsGroup
Draft 2014 Annual Report 02/26/15
20
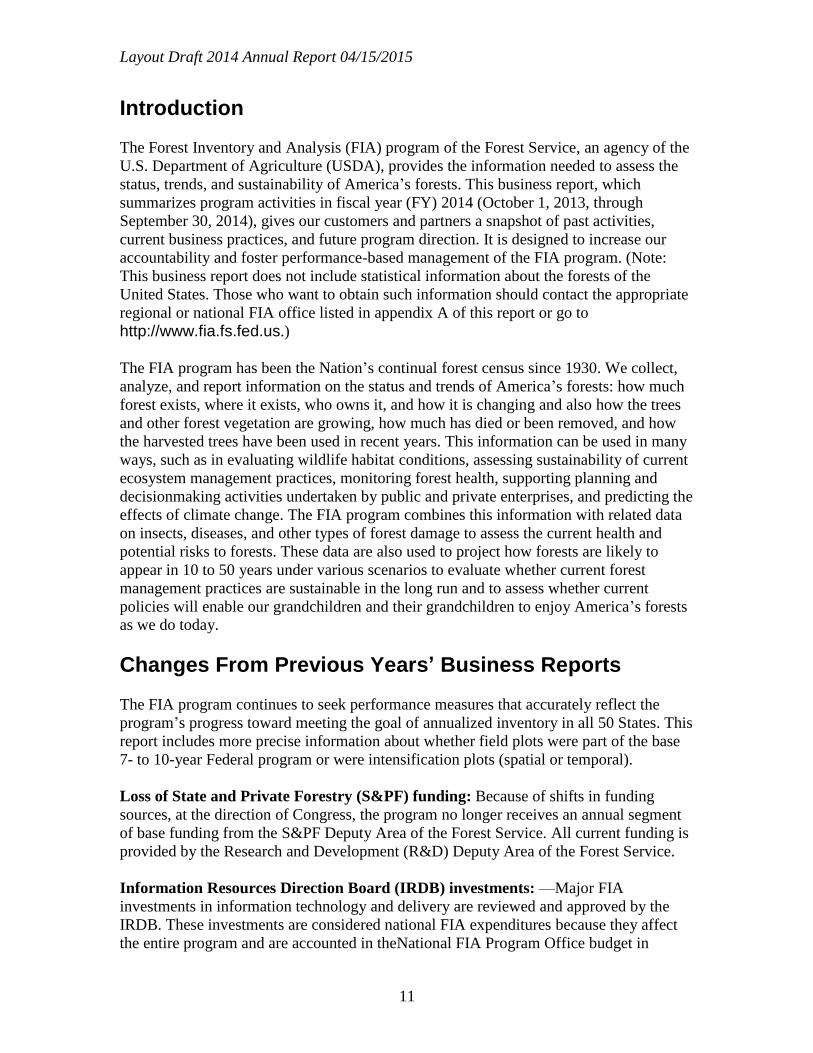
As we move through the transition to full program implementation, one key performance
measure is how well we are satisfying program objectives. Figure 6 shows, for each
State, the age of FIA data accessible in our public database as of September 30, 2014—
the end of FY 2014. Virtually all States now have data that are less than 2 years old
available in the database. Interior Alaska remains an outlier because of a continued lack
of funding to initiate the field inventory. FIA will experiment with opportunities in
Alaska with a project in the Tanana Valley in FY 2014. Some island data will be older
because the islands’ periodic inventory cycles are predominantly 10 years. Continued
improvements in data processing and NIMS are now paying dividends by enabling us to
establish a more routine loading schedule.
Figure 6. Availability of online FIA data, FY 2014.
FIA = Forest Inventory and Analysis. FY = fiscal year.
Figure 7 shows the age of the most recently published statewide FIA report for each
State. States with publications based on data that are less than 6 years old—the program
objective—are shaded light blue. States with publications 6 to 10 years old are shaded
medium blue, and States where the most recent publication reports are based on data
more than 10 years old are shaded dark blue. Only four States now have State reports
more than 6 years old, excluding interior Alaska (fig. 7). FIA made significant strides in
catching up with the backlog of 5-year reports in recent years and should soon complete
the process of full compliance with its legislative mandate. As noted earlier, some islands
will have reports more than than 6 years old because of longer inventory cycles. The
goal, however, is not to exceed 10 years in these areas.
Other islands(periodic)
American Samoa
Guam
Palau
Puerto Rico
Virgin Islands
Commonwealth
of the Northern
Mariana Islands
Federated States
of Micronesia
Republic of the
Marshall Islands
1 to 2 years old 3 to 5 years old More than 5 years old

Draft 2014 Annual Report 02/26/15
21
Figure 7. Publication status of State reports, FYs 2009–14.
FY = fiscal year. Dates are dates of publication, not dates of data shown in the publication.
Quality Assurance
FIA is committed to producing and delivering complete, accurate, and unbiased
information with known precision, representativeness, comparability, and accuracy. The
FIA Quality Assurance (QA) program supports this goal using a framework that
promotes consistency during all stages of the national core FIA inventory process. The
FIA National Core Prefield Guide and National Core Field Guide document the
protocols, ensuring consistent prefield and field collection of core program data items.
FIA’s national field data entry program, the Mobile Integrated Data Acquisition System
(MIDAS) is integrated into the overall FIA information management structure and
provides consistent logic and error checking in the field. The NIMS database and NIMS
Compilation System (NIMS-CS) provides additional error checks, and consistently
calculates a variety of derived variables using estimation equations that are described in
general technical reports. The National Quality Assurance Coordinator works with the
National FIA Program Office and the regional and national indicator advisors to provide
direction and coordination for the FIA QA program.
The FIA program promotes process transparency and consistency by extensively
documenting methods and procedures, including—
The FIA National Prefield Guide and rigorous QA protocols define a nationally
consistent process to collect information about FIA plots before field visits.
Less than 6 years old 6 to 10 years old More than 10 years old
Other islandsAmerican Samoa
Guam
Palau
Puerto Rico
Virgin Islands
Commonwealth
of the Northern
Mariana Islands
Federated States
of Micronesia
Republic of the
Marshall Islands

Draft 2014 Annual Report 02/26/15
22
Up-to-date FIA National Core Field Guides ensure consistent core program data
collection.
The field QACheck Procedures Guide promotes field QA consistency from region to
region
The Forest Inventory and Analysis Database: Database Description and User Guide
provides detailed information to users about published FIA data.
The Forest Inventory and Analysis Database (FIADB) displays standardized output
tables and is accompanied by detailed documentation in a recently updated Database
Description and User Guide.
The analytical QA[spelled out in the title?] Guide outlines steps for checking
compiled data for accuracy and completeness before releasing them to the public.
A National FIA QA Plan describes the overall QA process.
New and ongoing QA tasks in FY 2015 will be aimed at identifying errors and increasing
efficiency and consistency in the national inventory, include—
Expanding FIA analysts’ toolbox by distributing regionally developed analytical QA
error checking applications to FIA State analysts nationally.
Developing systematic edit checks of data before public release, including MIDAS
logic checks and NIMS load error checks.
Defining rigorous national cold check field and scoring procedures to allow for
equivalent field crew assessments across regions and crew types.
Documenting and implementing national data collection staff training standards.
Developing well defined prefield canopy cover measurement training procedures and
training material.
Developing and documenting NIMS tables and NIMS-CS, a consolidated FIA data
processing system.
Regional Program Accomplishments for FY 2014
This section provides information on FIA results, accomplishments, and outcomes
throughout the country by FIA unit. More detailed information is available at either the
provided links or from the respective FIA unit. (Contact information for each FIA unit
appears in appendix A at the end of this report.)
Northern Research Station FIA Program
Finding: Since remeasurement of the annualized FIA plot system has been completed
across the Eastern United States, the Northern Research Station (NRS) FIA program used
growth and mortality estimates to evaluate the impacts of two forest pests (beech bark
disease and hemlock woolly adelgid) at a regional scale. Before the annualized FIA
inventory, assessment of growth and mortality across multi-State scales was limited or
not possible because of long and inconsistent remeasurement periods.
Accomplishment: Given continued accumulation of nonnative insects and diseases in
forest ecosystems worldwide, assessing the impacts of these species at the regional level

Draft 2014 Annual Report 02/26/15
23
is a serious need. Although an extensive body of literature has been published on the
ecological impacts of invasive species in forest ecosystems, most studies have been
limited to sampling from individual stands. An approach that uses regional evaluation to
quantify individual and combined impacts of invading insect and disease species was
employed. Growth and mortality estimates were presented in duration (years) categories
for the groups of counties where the infestations of both pests overlap for comparison
with the counties that are uninfested or infested only by one pest (fig. 8). The results
document that invasions by beech bark disease and hemlock woolly adelgid have altered
the trajectory of species composition in forests through their effects on the growth and
mortality rates of the two late-successional tree species. Both growth and mortality of
host species are substantially different between pest infestation categories. Interestingly,
beech net growth appears to increase in response to HWA-induced hemlock mortality.
Similarly, hemlock net growth responds favorably to BBD-induced beech mortality (fig.
9).
Outcome: The results of the combined beech bark disease and hemlock woolly adelgid
impact analysis are currently in review (Morin et al. 2013). Regional impact studies for
other forest pests, including emerald ash borer, gypsy moth, and Dutch elm disease, are
currently under way. In addition, the NRS-FIA program is also exploring the use of
Tableau Software to enable users to explore inventory in a new and interactive way. A
tool for examining the impacts of emerald ash borer on the ash resource is now available
on line at
https://public.tableausoftware.com/views/eab_story/eab_story?:showVizHome=no#0.
Morin, R.S.; Liebhold, A.M. 2013. Two invasions collide: a pair of invasive insects intersect and
alter the trajectory of eastern forest composition. Forest Ecology and Management. (Accepted )
Contact: Randall Morin, [email protected]
Figure 8. Maps of (A) historical spread of BBD or beech scale (2006) and (B) historical spread of HWA (2006).
BBD = bark beetle disease. HWA = hemlock wooly adelgid.

Draft 2014 Annual Report 02/26/15
24
Figure 9. Annual percent mortality (A) and net growth (B) of American beech, hemlock, red maple, and sugar maple in overlapping and nonoverlapping HWA- and BBD-infested areas.
BBD = bark beetle disease. HWA = hemlock wooly adelgid. Note: Error bars represent 68 percent confidence intervals.
Finding: Housing density increases threaten private forest lands on U.S.-affiliated islands
and territories.
Accomplishment: The Forests on the Edge (FOTE;
http://www.fs.fed.us/openspace/fote/) project seeks to document and communicate the
impact of housing density changes on private forest land and to place this information in
the hands of decisionmakers. The latest FOTE report was a partnership between Forest
Service personnel from S&PF and NRS-FIA.

Draft 2014 Annual Report 02/26/15
25
Outcome: Data from Puerto Rico, Hawaii, Guam, the Commonwealth of the Northern
Mariana Islands, the U.S. Virgin Islands, and American Samoa were analyzed.
Projections of housing density (fig. 10) for the islands for the year 2030 were combined
with ownership information and satellite-derived land cover data to analyze potential
housing development impacts on private forest land. Urban and exurban housing
development frequently advances at the expense of private forest land. This sprawl is
particularly impactful on U.S.-affiliated islands in the Pacific and Caribbean Oceans
where we found private forest land to comprise anywhere from 46 to 87 percent of all
forest land, depending on the island. The shift from rural housing density to urban and
exurban housing density is forecast to impact anywhere from 3 to 25 percent of private
forest land across the islands.
Stein, S.M.; Carr, M.A.; Liknes, G.C.; Comas, S.J. 2014. Islands on the edge: housing
development and other threats to America’s Pacific and Caribbean island forests. A Forests
on the Edge report. Gen. Tech. Rep. NRS-137. Newtown Square, PA: U.S. Department of
Agriculture, Forest Service, Northern Research Station. 55 p.
Contact: Greg Liknes, [email protected]
Figure 10. Projected housing density change on private forest land in Guam between 2000 and 2030.

Draft 2014 Annual Report 02/26/15
26
Finding: Functional traits refine understanding of forest stand dynamics across large
scales.
Accomplishment: Plant functional traits (PFTs) have increased in popularity in recent
years to describe various ecosystems and biological phenomena while advancing general
ecological principles. For example, a tree’s functional trait of wood density has been used
to evaluate hypotheses of forest production such as declining growth and mortality with
increasing wood density. Across a series of studies, the distribution and contribution of
various PFTs in determining forest structure, live tree production (volume and biomass),
and tree mortality across the Eastern United States was examined. In total, 16 metrics
representing species specific gravity and their shade, flood, and drought tolerance were
used to develop a PFT profile for more than 23,000 permanent sample plots in the region.
Beyond investigating simply the mean value of these traits, measures of PFT complexity
were evaluated: the standard deviation, Shannon’s index (a measure of PFT diversity, fig.
11), and Gini coefficient (a measure of PFT inequality). Results from nonparametric
random forest models indicated that variables that formed the PFT profile contributed to
explaining broadscale patterns in the variability in forest structure (volume and biomass
of overstory live trees, maximum stand density index, and tree seedling abundance; R2
ranged from 0.09 to 0.78), production (volume [R2 = 0.16] and biomass accretion [R
2 =
0.11]), and to a lesser degree, tree mortality.
Outcome: This study confirmed aspects of the emerging theory of “fast-slow” plant
economics spectrums across temperate forest ecosystems. Stands with relatively low
wood density appear to occupy sites that have a concomitantly higher rate of tree
mortality, but with less biomass accretion relative to volume because of allocating
biomass or carbon to a greater tree volume. This work demonstrates the utility of
applying PFT profiles for understanding and predicting patterns of forest structure and
production and their role in critical ecosystem processes such as carbon sequestration,
while demonstrating the potential application of the plant economics spectrum theory in
refining our understanding of general patterns of forest stand production during stand
development.
Woodall, C.W.; Russell, M.B.; Walters, B.F.; D’Amato, A.W.; Zhu, K.; Saatchi, S.S. [In press]. Forest
production dynamics along a wood density spectrum in Eastern U.S. forests. Trees. DOI
10.1007/s00468-014-1083-1.
Russell, M.B.; Woodall, C.W.; D’Amato, A.W.; Domke, G.M.; Saatchi, S.S. 2014. Beyond mean
functional traits: influence of functional trait profiles on forest structure, production, and mortality
across the Eastern U.S. Forest Ecology and Management. 328: 1–9.
http://www.nrs.fs.fed.us/pubs/45970.
Contact: Christopher Woodall, NRS-FIA
Partners: University of Minnesota; Carnegie Institute; Jet Propulsion Laboratory

Draft 2014 Annual Report 02/26/15
27
Figure 11. Interpolated (inverse distance weighting) Shannon’s diversity index of specific gravity (unitless) for forests of the Eastern United States.
Pacific Northwest Research Station FIA Program Finding: The Pacific Northwest Research Station (PNW) FIA program saw small gains
in forest carbon in PNW forests as effects of tree growth and afforestation were offset by
fire, insects, cutting, and deforestation.
Accomplishment: A substantial portion of the carbon emitted by human activity is
apparently being stored in forest ecosystems in the Northern Hemisphere, but the
magnitude and cause are not precisely understood. The goal of these studies was to
directly track changes in forest carbon (fig. 12) using repeated inventory measurements
of non-Federal lands in Oregon and of national forests in Oregon and Washington.
Although net area of forest land increased in Oregon, the net effect on carbon was a
decrease because forest gains in low-carbon juniper forests were offset by losses in high-
carbon Douglas-fir forests. On non-Federal lands, carbon decreased significantly in
eastern Oregon because of the effect of western spruce budworm, but it increased
significantly in western Oregon because of growth on non-Federal public lands. On
national forest lands, carbon increases were higher on the west side of the Cascades and
primarily stayed in the live tree pool compared with lower increases on the east side,
where most of the increase was seen in the down wood pool. Carbon stores decreased
somewhat in eastside wilderness areas from the effect of fires.

Draft 2014 Annual Report 02/26/15
28
Figure 12. Mean carbon stocks (left) and sequestration (right) on national forest lands by fifth-order watershed in the Pacific Northwest. Carbon in live trees, dead trees, down dead wood, and live understory vegetation on forest and nonforest lands is included.
Note: Only watersheds with at least 5 plots in the sample are shown; the median number of plots per watershed was 23. Circle sizes indicate the standard error of the estimate for each watershed.
Outcome: The small impact of recent fires on carbon storage on national forests suggests
fires may not be a cause for concern, although investigation of longer term effects is
warranted. Better understanding of the magnitude of effects of land-use change,
management, and disturbance on carbon storage from repeated inventory measurements
will improve our ability to predict the effects of future changes in those drivers.
Gray, A.N.; Whittier, T.R.; Azuma, D.L. 2014. Regional estimation of forest carbon flux: adding
components of change to stock-difference assessments. Forest Science. 60: 317–326.
http://dx.doi.org/10.5849/forsci.12-139.
Gray, A.N.; Whittier, T.R. 2014. Carbon stocks and changes on Pacific Northwest national forests and
the role of disturbance, management, and growth. Forest Ecology and Management. 328: 167–178.
http://dx.doi.org/10.1016/j.foreco.2014.05.015.
Contact: Andrew Gray, [email protected]
Partners: Forest Service, Pacific Northwest Region (NFS Region 6); Oregon State
University

Draft 2014 Annual Report 02/26/15
29
Finding: To estimate forest attributes in small areas, composite methods that incorporate
information from both the area of interest and the entire population perform better than
traditional estimators.
Accomplishment: One challenge often faced in forest inventory is the estimation of
forest attributes for smaller areas of interest within a larger population. Small-area
estimation is a set of techniques to estimate forest attributes for small areas in which the
existing sample size is small and auxiliary information is available. The technique
combines information from direct estimation, using the available plots, and indirect
estimation, based on predictions from regional models. We compare the performance of
two families of small-area estimators with that of the direct estimator, multiple
regression, and imputation, both for stand-level prediction and regional prediction. The
predicted variables were total stem volume, basal area, quadratic mean diameter, tree
density, and height of the dominant trees.
Outcome: In general, the composite estimators performed better than the indirect
estimators in terms of bias, and better than the direct estimators in terms of precision. The
best performing estimator was not clear across all variables. The choice of estimator
should be evaluated for each particular case, depending on the variable of interest and the
available auxiliary information.
Goerndt, M.E.; Monleon, V.J.; Temesgen, H. 2011. Using small area estimation and LiDAR-derived
auxiliary variables to estimate attributes for selected forests stands. Canadian Journal of Forest
Research. 41: 1189–1201. http://www.treesearch.fs.fed.us/pubs/46164.
Goerndt, M.E.; Monleon, V.J.; Temesgen, H. 2013. Small area estimation of county-level forest
attributes using ground data and remote sensed auxiliary information. Forest Science. 59: 536–548.
http://www.ingentaconnect.com/content/saf/fs/2013/00000059/00000005/art00004.
Contact: Vicente Monleon, [email protected]
Partner: Oregon State University
Finding: Linked remote-sensing products dramatically reduced variability in vegetation
estimates for logistically difficult-to-reach environments in Alaska.
Accomplishment: In this study, we demonstrate that sample strips of LIDAR (Light
Detection and Ranging) in combination with Landsat can be used to predict forest
attributes more precisely than from Landsat alone. Although LIDAR and Landsat can
each be used alone in vegetation mapping, the cost of wall-to-wall LIDAR may exceed
users’ financial resources, and Landsat may not support the desired level of prediction
precision. We compare fitted linear models and k nearest neighbors (kNN) methods to
link field measurements, LIDAR, and Landsat. We also compare 900 and 8,100 m2
resolutions to link LIDAR to Landsat. An approach with LIDAR and Landsat together
reduced estimates of residual variability for biomass by up to 36 percent relative to using
Landsat alone. Linear models generally performed better than kNN approaches, and
when linking LIDAR to Landsat, using 8,100 m2 resolution performed better than 900
m2.

Draft 2014 Annual Report 02/26/15
30
Outcome: Combining remotely sensed data for forest inventory attribute prediction
shows great promise for Alaska and will be extended in interior Alaska inventory pilot
work in 2014 and 2015. New sensors may include improved LIDAR New sensors may
include improved LIDAR capability(fig. 13).
Strunk, J.; Temesgen, H.; Andersen, H.E.; Packalen, P. 2014. Prediction of forest attributes with field
plots, Landsat, and a sample of LiDAR strips: a case study on the Kenai Peninsula, Alaska.
Photogrammetric Engineering and Remote Sensing. 80(2): 143–150.
Contact: Hans Andersen, [email protected]
Partners: Oregon State University; University of Eastern Finland
Figure 13. A swath of high-resolution lidar 3-D forest canopy measurements acquired
near Tok, Alaska.
Draft 2014 Annual Report 02/26/15
31
Rocky Mountain Research Station, Interior West FIA Program
Finding: Understanding trends in forest disturbance caused by fire, harvest, stress,
weather, and conversion is important for many forest management decisions and for
scientific investigations. After a decade of collaborative work among the Forest Service,
the National Aeronautics and Space Administration (NASA), University of Maryland and
other partners, the North American Forest Dynamics (NAFD) project has processed
historic Landsat data to provide a comprehensive annual, wall-to-wall analysis of U.S.
disturbance history during the past 25 or more years. Substantial progress has also been
made to identify a specific causal agent through time, and nationwide datasets will soon
be available for exploring spatial and temporal patterns in U.S. forests.
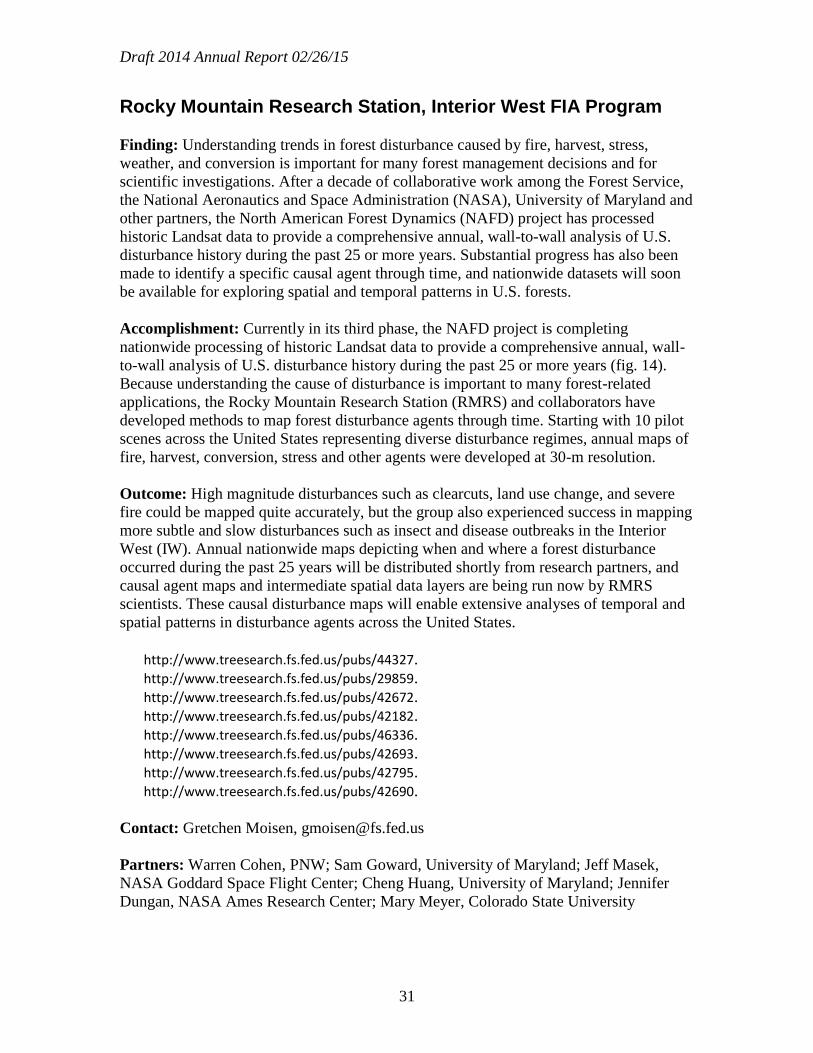
Accomplishment: Currently in its third phase, the NAFD project is completing
nationwide processing of historic Landsat data to provide a comprehensive annual, wall-
to-wall analysis of U.S. disturbance history during the past 25 or more years (fig. 14).
Because understanding the cause of disturbance is important to many forest-related
applications, the Rocky Mountain Research Station (RMRS) and collaborators have
developed methods to map forest disturbance agents through time. Starting with 10 pilot
scenes across the United States representing diverse disturbance regimes, annual maps of
fire, harvest, conversion, stress and other agents were developed at 30-m resolution.
Outcome: High magnitude disturbances such as clearcuts, land use change, and severe
fire could be mapped quite accurately, but the group also experienced success in mapping
more subtle and slow disturbances such as insect and disease outbreaks in the Interior
West (IW). Annual nationwide maps depicting when and where a forest disturbance
occurred during the past 25 years will be distributed shortly from research partners, and
causal agent maps and intermediate spatial data layers are being run now by RMRS
scientists. These causal disturbance maps will enable extensive analyses of temporal and
spatial patterns in disturbance agents across the United States.
http://www.treesearch.fs.fed.us/pubs/44327.
http://www.treesearch.fs.fed.us/pubs/29859.
http://www.treesearch.fs.fed.us/pubs/42672.
http://www.treesearch.fs.fed.us/pubs/42182.
http://www.treesearch.fs.fed.us/pubs/46336.
http://www.treesearch.fs.fed.us/pubs/42693.
http://www.treesearch.fs.fed.us/pubs/42795.
http://www.treesearch.fs.fed.us/pubs/42690.
Contact: Gretchen Moisen, [email protected]
Partners: Warren Cohen, PNW; Sam Goward, University of Maryland; Jeff Masek,
NASA Goddard Space Flight Center; Cheng Huang, University of Maryland; Jennifer
Dungan, NASA Ames Research Center; Mary Meyer, Colorado State University
Draft 2014 Annual Report 02/26/15
32
Figure 14. Examples of forest disturbance agents. (a) Harvesting (b) Disease (c) Transportation
(d) Fire (e) Insects (f) Development
Photos courtesy of and printed by permission: a: USDA Forest Service Southern Research Station Archive, Bugwood.org (5484305). b: Daniel Miller, USDA Forest Service, Bugwood.org (1306007). c: USDA Forest Service Southern Research Station Archive, Bugwood.org (5483973). d: USDA Forest Service Southern Research Station Archive, Bugwood.org (5484319). e: William M. Ciesla, Forest Health Management International, Bugwood.org (5509422). f: Randy Cyr, Greentree, Bugwood.org (1238348).
Finding: Pinyon-juniper woodlands in the Great Basin are used differently by pinyon
jays(fig. 15) based on structure of the stand.
Accomplishment: Increased stand density and widespread encroachment of pinyon-
juniper woodlands into adjacent shrubland communities is generating concern from
resource managers in the Interior West. Woodland encroachment can compromise
shrubland species’ habitat and increased stem densities can alter fire behavior, forage
availability, and woodland habitat quality. Beginning in 2012, the IW-FIA program
partnered with the National Park Service (NPS) and the Great Basin Bird Observatory
(GBBO) to investigate pinyon jay (Gymnorhinus cyanocephalus) use of pinyon-juniper
woodlands in the Great Basin of the United States. Pinyon jays are known to be the main
dispersal agents for pinyon pine and closely associated with pinyon-juniper woodlands in
general. Pinyon jay populations have been steadily declining during the past half-century,
however, even while pinyon-juniper woodland extent has increased. We had three
primary goals for this research: (1) to identify habitat preferences of pinyon jays and to
assess how the birds’ feeding and seed-caching behavior affects the infill and expansion
processes of pinyon-juniper woodlands, (2) to quantify suitable habitat for pinyon jays
across the Great Basin, and (3) to provide landscape-scale pinyon jay habitat data to
resource managers to better inform their woodland management decisions.

Draft 2014 Annual Report 02/26/15
33
Outcome: To better understand how pinyon jays influence in-fill and expansion in
pinyon-juniper woodland communities, we measured forest and understory structure at
sites used by pinyon jays in southern Idaho and east-central Nevada and compared mean
shrub cover, canopy cover, and basal area of dead trees between sites used for nesting,
roosting, foraging, and seed caching activities. Mean canopy cover was lowest at seed
caching sites while basal area of standing dead trees was higher at these locations than at
other activity sites. Mean shrub cover was greater and basal area of dead trees was less at
foraging sites than at other locations. Canopy cover was highest and shrub cover lowest
at nesting sites. Our results suggest that pinyon jays prefer open, sparsely stocked or
recently disturbed areas for seed caching, stands of moderately stocked seed producing
trees that have an intact understory shrub layer for foraging, and mature, densely stocked
stands for nesting and roosting activities. We found that preferred foraging habitat
appears to be limited in pinyon-juniper woodlands found within the portion of the Great
Basin found in Nevada. Further data collection and analysis are planned in 2015,
including nest productivity, comparisons of biodiversity between activity sites, and
physical conditions under which pinyon pine recruitment is occurring.
Contact: Chris Witt, [email protected]
Partners: GBBO;NPS
Figure 15. Pinyon jay (Gymnorhinus cyanocephalus). (Photo courtesy of Wallace Keck, National Park Service.)
Finding: In 2014, the FIA program published the first report on New Mexico’s forest
resources since 2001. Updated information on forest status and trends is critical for forest
managers in a variety of public and private organizations. The RMRS WI-FIA program
collaborated with New Mexico State Forestry, with support from the American Recovery
and Reinvestment Act, to accelerate the implementation of New Mexico’s forest
inventory and provide the data for this report. The most important forest health trends in
New Mexico are increasing tree mortality and declining tree growth.

Draft 2014 Annual Report 02/26/15
34
Accomplishment: The public, forest managers, and scientists now have access to the
most comprehensive inventory of forest health trends in New Mexico’s history. New
Mexico’s forest land covers 24.8 million acres, of which 44 percent is privately owned
and more than one-half consists of piñon and juniper woodlands. New Mexico has nearly
7 billion live trees, with gambel oaks as the most prevalent (1.7 billion). Aspen forests
cover more than 380,000 acres in New Mexico, and the area of aspen has not changed in
the past decade. For many timber species, growth rates exceed mortality rates, and only
ponderosa pines are growing faster than they are dying. The State’s most important piñon
and juniper species—which may be important for firewood, biomass, and pine nut
production—also showed positive net growth. Overall mortality was highest on forests
managed by the Forest Service. Most tree mortality in New Mexico can be linked to
insects, wildfires, and disease—all of which are related to drought. During the past
decade, the volume of wood harvested has decreased by more than one-half throughout
the State and by 95 percent on lands managed by the Forest Service.
Outcome: The report New Mexico’s Forest Resources, 2008–2012, summarizes the most
recent inventory of New Mexico’s forests based on field data collected from more than
3,000 forest areas between 2008 and 2012. The report describes the growth and mortality
rates of trees across the State; effects of droughts; status of aspen; impacts of insects,
diseases, and other damaging agents; extent of wildfires; and effects of invasive and
noxious weeds. The complete report is available at
http://www.treesearch.fs.fed.us/pubs/46050. Researchers will continue to study forest
health trends and plan to publish updates every 5 years.
Contact: Sara Goeking, [email protected]
Partners: John Shaw, Chris Witt, Mike Thompson, Chuck Werstak, RMRS-Inventory
and Monitoring Program; Michael Amacher, RMRS-Forest and Woodland Ecosystems
Program; Mary Stuever, New Mexico State Forestry; Todd Morgan, Colin Sorenson,
Steven Hayes, Chelsea McIver, University of Montana, Bureau of Business and
Economic Research
Southern Research Station FIA Program
Finding: Carbon sequestration in forests provides an important offset to carbon dioxide
emissions. Over time, southern forests are expected to change because of various biotic
and abiotic factors, including land use, weather, insects, disease, and fire. Projected
changes indicate that carbon accumulation in southern forests will continue into the
future, but at a slower rate because of the net effects of forest aging and shifts in land use.
Accomplishment: During the past century, forest regrowth in Europe and North America
expanded forest carbon (C) sinks and offset carbon emissions, but future carbon
accumulation is uncertain because of the effects of land use changes, management,
disturbance, and climate change. Dissecting and understanding the complexities around
carbon stock change are essential for informing policy (fig. 16). Using a completely

Draft 2014 Annual Report 02/26/15
35
remeasured land use and forest inventory, researchers demonstrated that forests in the
Southeastern United States yielded a net sink of carbon during a 5-year period (2007
through 2012) because of net land use change (+6.48 TgC yr–1
) and net forest
accumulation (+75.4 TgC yr–1
). Forests disturbed by weather, insects, disease, and fire
show positive forest carbon changes (+1.56, +1.4, +5.48 TgC yr–1
, respectively). Forest
cutting was the only disturbance causing net decreases in carbon (–76.7 TgC yr–1
), but
those decreases were offset by forest accumulation (+143.77 TgC yr–1
). Projected carbon
stock changes indicate a gradual slowing of carbon accumulation with forest aging (a
reduction of 9.5 percent during the next 5 years) but were highly sensitive to land use
change in which small shifts in land use transitions resulted in a 40.6-percent decrease in
carbon accumulation.
Outcome: Policymakers need insight into forest carbon dynamics as they anticipate
emissions futures and goals. This work highlights the complementary nature of FIA data
and the Southern Forest Futures Project and their combined role in addressing timely
questions about forests and carbon at a policy-relevant scale.
Coulston, J.W.; Wear, D.N.; Vose, J.M. [N.d.]. Complex forest dynamics indicate potential for slowing
carbon accumulation. Scientific Reports. Manuscript in review.
Contact: John Coulston, [email protected]
Partner: Center for Integrated Forest Science and Synthesis
Figure 16. Forest carbon stock changes (TgC yr–1
) resulting from land use dynamics (right side)
and forest dynamics within forest land uses (left side).
Note: Line thickness is proportional to the flow.

Draft 2014 Annual Report 02/26/15
36
Finding: A method and approach to determine optimum locations for new wood pellet
mills have been devised and implemented in forestry consulting work. The initial steps
involve identifying target stands using effective density analysis on stands within 50-, 75-
and 100-mile circular polygons. Models are then applied to these data to derive output
and sustainability under various economic and mill competition scenarios.
Accomplishment: Where to locate and build wood utilization facilities in the South is an
important economic decision for forest industry companies. Recent interest in biomass
utilization for products such as wood pellets has created renewed demand for reliable
ways to estimate resource availability and sustainability. A process utilizing FIA data has
been developed that identifies optimum areas based on current stand volumes inside
circular polygons stratified by effective density volume classes for specific species (fig.
17). These classes are further stratified into quadratic mean diameter classes for each
sample plot where the quadratic mean diameter serves as a surrogate for age. The classes
can then be used in growth and harvesting models that are fine tuned to address various
economic and resource scenarios. Finally, further refinement considers competition from
nearby mills (based on their capacity) that may overlap into and across the polygons. The
result is a system that provides a conservative assessment of resource sustainability that
spans the necessary number of years needed for mill operation.
Outcome: To date, application of this methodology has resulted in sizeable investments
and has helped create more than 300 forest sector jobs, both directly and indirectly.
Contact: James F. Rosson, Jr., [email protected]
Figure 17. Demonstration map illustrating supply polygons within 50-, 75-, and 100-mile radii for potential mill sites in Marshall County, AL. Plot locations are approximate to protect privacy considerations.

Draft 2014 Annual Report 02/26/15
37
Finding: Scientists with the Southern Research Station (SRS)-FIA partnered with
university collaborators to design and conduct novel analyses using broadscale inventory
data to look for changes in the range of tree species. Using these methods, they detected
potentially climate-related range shifts for one common tree species.
Accomplishment: Range response to projected climate change, based on suitable habitat,
has been modeled and mapped for many eastern North American tree species. Model
projections reveal drastic shifts in the spatial distribution for many species in response to
changing climatic conditions. In an attempt to understand the potential impact of climate
change on tree species ranges in the Eastern United States, teams of researchers from the
Forest Service FIA program, Purdue University, and the University of Alabama have
advanced tree range shift research by using broadscale inventory data. The researchers
were interested in documenting current changes in certain tree species populations along
range boundaries in the Eastern United States. The population dynamics of two species,
sugar maple (Acer saccharum) and blackgum (Nysaa sylvatica), were examined in detail.
No contraction of the southern range of sugar maple was detected; however, blackgum
was determined to be undergoing a range-shift, with its southern range contracting and
northern range expanding (fig. 18). The work was documented in the journals Botany and
Climatic Change, respectively.
Outcomes: This research yielded an excellent baseline for tree range for specific tree
species, in anticipation of future research and potential effects of climate change. In
addition, findings related to blackgum range suggest several potentially fruitful areas for
future research, including similar studies involving specialist tree species, and more
detailed study of factors contributing to range contraction in southern ranges.
Hart, J.L.; Oswalt, C.M.; Turberville, C.M. 2014. Population dynamics of sugar maple through the
southern portion of its range: implications for range migration. Botany. 92: 563–569.
Desprez, J.; Iannone, B.V., III; Yang, P. [and others]. Northward migration under a changing climate: a
case study of blackgum (Nyssa sylvatica). Climatic Change. 126: 151–162.
Contact: Christopher M. Oswalt, [email protected]
Partners: Purdue University; The University of Alabama

Draft 2014 Annual Report 02/26/15
38
Figure 18. Spatial variability in rate of change of the importance value [ΔIV = (IVsp2 – IVsp1) / number of years between SP1 and SP2] of blackgum across the four ecoregions of the Eastern United States.
CHR = Central Hardwood Region. FPTR = Forest-Prairie Transition Region. NHR = Northern Hardwood Region. SPHR = Southern-Pine Hardwood Region.
National FIA Program Office Staff
The National FIA Program Office helps guide and coordinate the FIA field units in
implementing the enhanced FIA program. Most of the National Office accomplishments
include making presentations, preparing policy white papers and budget justifications,
and providing input to reports for national and international organizations.
Other FY 2014 accomplishments in collaboration with field units—
Provided budget coordination, briefings, and guidance for FIA field units.
Facilitated one FIA management team meeting, six conference calls, and dozens
of briefings for internal and external partners, customers, collaborators, and
supporters.
Collaborated with the Society of American Foresters and helped organize the
ninth national users group meeting for FIA customers, which was held in New
Orleans, LA, in March 2014.
Published the Forest Inventory and Analysis Fiscal Year 2013 Business Report.
Worked with field units and partners to draft a new FIA strategic plan in response
to the proposed Farm Bill. Plan drafted on time and delivered to USDA for
submission to Congress.
Completed a memorandum of understanding (MOU) with the NPS guiding FIA
operations on NPS lands.

Draft 2014 Annual Report 02/26/15
39
Worked with global resource data strategy team representing the Forest Service
on the Interagency Council on Agricultural and Rural Statistics Land Use
Working Group.
Continued providing support for coding and testing the National Vegetation
Classification System algorithm for use with FIA data, in cooperation with FIA
by NatureServe.
Continued to work with the United Nations Food and Agriculture Organization on
the global Forest Resources Assessment and oversight of the Global Remote
Sensing Project to estimate and monitor area changes of the world’s forests.
Continued to oversee collaborative work with NASA on land cover and land use
tracking in the United States.
Participated in SilvaCarbon, a flagship program under U.S. fast-start financing for
Reducing Emissions from Deforestation and Forest Degradation Plus, or REDD+,
which is a U.S. contribution to the Forest Carbon Tracking task of the
intergovernmental Group on Earth Observations.
Worked with Mexico to develop a remote field data entry system and proposed a
workshop providing an overview of the FIA MIDAS. This collaboration will
continue in FY 2015.
Drafted a report on 10-year activities of the North American Forestry
Commission Inventory Working Group.
Participated in Forest Service Safety Journey training engagement sessions.
Contacts: Greg Reams, [email protected]; Brad Smith, [email protected]
FIA Data Requests and Access
The FIA Spatial Data Services (SDS) Team provides spatial data services to clients and
operates as a virtual Spatial Data Services Center with staff located at FIA units
throughout the country.
Partners
MOU agreements continue to be put in place for those clients for whom access to the
confidential data is critical for projects that clearly benefit FIA. Most data requests do not
require a MOU and are handled by SDS personnel working with the client to provide the
information needed. New partners include the Cary Institute of Ecosystem Studies, the
University of Maryland, Utah State University, and RTI International. MOUs remain in
place with a variety of partners from academia, industry, and government.

Draft 2014 Annual Report 02/26/15
40
FY 2014 Spatial Data Requests
In FY 2014, 586 requests were active (fig. 19). National or multiregional data requests
accounted for 10 percent of the total number of requests. Of the requests received, 99
percent were completed by the end of the fiscal year and 1 percent remain in progress.
Figure 19. Requests made to the FIA Spatial Data Services Center in FY 2014.
586 Requests FIA = Forest Inventory and Analysis. IW = Interior West. NFS = National Forest System. NGO = nongovernmental organization. NRS = Northern Research Station. PNW = Pacific Northwest Research Station. SRS = Southern Research Station.
Requests are cataloged by type and are nearly evenly divided among knowledge,
summary, and spatial types (fig. 21). In FY 2014, public agencies were the largest group
of spatial data requestors, with 37 percent of all new requests, followed by academia,
with 27 percent and industry with 16 percent.
FY 2014 Web Tools
The FIA program has been serving data to the public since 1996 through a variety of Web
tools. FY 2014 was particularly challenging because a number of technical issues at the
national data center caused the tools to be unreliable and unstable for 47 days; as a result,
Web traffic during that time was down about 50 percent.
by unit by type
by requestor
Academia27%
State9%
NFS6%
Other Federal22%
NGO5%
Industry16%
Other15%
Spatial33%
Knowledge28%
Summary39%
PNW11%
IW3%
SRS67%
NRS19%

Draft 2014 Annual Report 02/26/15
41
The first database retrieval program FIA released (1996) was the FIA Data Base
Retrieval System (DBRS). The DBRS enabled the public to query regional FIA datasets
into Eastwide Forest Inventory Database and Westwide Forest Inventory Database
formats. In 2002, the Forest Inventory Mapmaker program was introduced, enabling the
public to generate estimates from national FIA data in the newly created FIADB. The
current generation of data retrieval programs produces estimates and their associated
sampling errors. The Forest Inventory Data Online (FIDO) system was introduced in
2008 and the EVALIDator Web application was introduced in 2009.
Based on analysis of the FY 2014 Internet protocol addresses using FIDO, the breakdown
of users was academia, 26 percent; corporate, 19 percent; government (State and Federal
combined), 17 percent; nongovernmental organizations (NGOs), 1 percent; others from
outside the United States, 3 percent; and indeterminate, 34 percent. The total number of
FIDO retrievals was 57,567.
The analysis of the FY 2014 Internet protocol addresses using EVALIDator reveals a
different breakdown in user categories: academia, 17 percent; corporate, 7 percent; State
and Federal governments combined, 49 percent; NGOs, less than 1 percent; external to
the United States, 2 percent; and indeterminate, 25 percent. The total number of
EVALIDator users was 33,759. A larger percentage of EVALIDator users are from
Federal and State agencies.
Both FIDO and EVALIDator are being actively “crawled” by various Web search
engines—with a significant number of page hits resulting from this activity that are not
included in the previous totals.
In 2009, a Web application was developed that allowed for querying of the National
Woodland Owner Survey (NWOS) database. In FY 2014, 4,502 retrievals were
completed. The FIA DataMart was revised in FY 2009 to include the ability to download
FIADBs by State as Microsoft Access database files. The Access databases contain a
reporting tool (the EVALIDator-PC) that enables the user to generate reports. These
reports are not included in table 4 but undoubtedly number in the thousands or tens of
thousands. These State databases are included on digital versatile discs, or DVDs, that are
distributed with each NRS State’s 5-year report.
In FY 2010, users downloaded 18,026 ZipTM
files that contained data from one or more
FIADB tables. In FY 2011, 24,576 ZipTM
files for a single file were downloaded. In FY
2011, users downloaded 2,544 ZipTM
files containing the entire set of text files for a
given State. In FY 2013, 1,512 ZipTM
files were downloaded. In FY 2014 a total of 7,383
files (State and individual files combined) were downloaded from FIA’s DataMart.
In 2003, the FIA Mapmaker program added a module that enabled the user to download
FIA data in Forest Vegetation Simulator (FVS format). This feature was lost with the
retirement of the Mapmaker program in 2009. The FVS format is now available through
a tool developed by the Forest Management Service Center. The FIA2FVS program is

Draft 2014 Annual Report 02/26/15
42
used to extract data fields from the FIADB into an FVS-ready database. The FIA2FVS
program is available for download at http://www.fs.fed.us/fmsc/fvs/software/data.shtml.
The National Reporting and Data Distribution, or NRDD Team has been providing
webinars and in-person trainings on FIA data and Web tools since 2010. Information on
training and webinars is available from Liz LaPoint at [email protected].
Table 4. Number of database retrievals using FIA Web applications by fiscal year.
FIA = Forest Inventory and Analysis. FY = fiscal year.
Consultations by FIA Staff Consulting with FIA customers is a growing part of our business. Just as we have
increased the amount of information (both data and analyses) made available on the Web,
our FIA staff are increasingly in demand by customers seeking either to understand more
about the FIA program and our results, or seeking to address a specific question not
obviously addressed through other means. Questions pertaining to a single administrative
unit (e.g., to a single State or national forest) often are referred to partners within that
administrative unit (e.g., State foresters and national forest analytical staff) who can often
provide better context and who prefer to maintain their contacts with their customers.
When questions span multiple administrative units, FIA staff will try to help the customer
find an answer. FIA does not compete with private-sector consultants; rather, we answer
questions about our methods and help customers (including private consultants) use FIA
data to answer their own or their clients’ questions. Appendix table B-6 shows the
number of significant consultations that FIA staff provided in FY 2013, by unit and by
type of customer. A significant consultation is defined as any dialogue with a customer
outside of FIA that requires more than 1 hour to address, and which is not part of our
normal course of business in collecting, analyzing, and reporting on FIA information.
Combined, FIA staff addressed 934 significant consultations, which required 7,987 staff
hours to complete (table 5)—equivalent to 4 full-time staff years. Of the consultations,
412 were conducted with other government agencies, such as State agencies and other
Federal agencies, accounting for 53 percent of the time. The staff also had internal
discussions within the Forest Service. Other major client groups included academic
clients (approximately 22 percent of the consultations and 13 percent of the time),
industry (16 percent of the consultations and 10 percent of the time), and NGOs (7
percent of the consultations and 7 percent of the time). The data also show some regional
variations. For example, State government organizations are consistently the major
clients throughout the country. FIA data indicate that industry and academic customers
are the second most prominent clients (appendix table B-6).
2004 2005 2006 2007 2008 2009 2010 2011 2012 2013 2014
Number of
retrievals26,548 56,475 24,335 26,615 59,609 90,974 101,643 132,413 94,027 103,211 186,175

Draft 2014 Annual Report 02/26/15
43
Table 5. Number and hours of significant consultations by FIA staff, by customer group,
FY 2014.
FIA = Forest Inventory and Analysis. FY = fiscal year. NGO =
nongovernmental organization. NIPF = nonindustrial private forest.
National Inventory and Monitoring Applications Center
The National Inventory and Monitoring Applications Center (NIMAC) was formed in
2006 during the merger of the North Central and Northeastern Research Stations.
Although NIMAC is part of the NRS-FIA program, it is responsible for providing
national technical assistance on planning, conducting, processing, and analyzing forest
inventories to FIA’s broad range of customers, which include the NFS, other Federal
agencies, State governments, and other countries.
National Forest Collaboration
In FY 2002, the Deputy Chief for R&D and the Deputy Chief for the NFS signed an
internal MOU providing for permanent inclusion of all national forest lands within the
FIA program. This inclusion was a significant step forward for FIA customers,
guaranteeing the availability of consistent FIA information across the entire United
States. Under the terms of the agreement, NFS provides permanent funding to help cover
the cost of the FIA program on their lands, and in return the FIA program agrees to
implement the program in a manner consistent with other forested lands within the same
State, and to load FIA data into the NFS vegetation database—FSVEG for use in forest
planning and other landscape and regional assessments. FIA also provides advice for and
assistance in developing forest and regional sampling protocols linked to FIA, and
collaborates with national forests that want to contribute additional resources for
additional sampling.
NFS continues to fund FIA’s NIMAC to develop the Design and Analysis Toolkit for
Inventory and Monitoring (DATIM). The design tool helps identify inventory
information needs, sampling designs (including intensification of FIA samples), and the
development of Monitoring Plans as part of NFS Forest Plans, as required by the new
Planning Rule. The analytical tools enable NFS to quickly analyze an enhanced form of
existing FIA data that better serves their needs by adding NFS attributes computed using
Customer
group Number Percent Hours Percent
Academic 206 22 1,068 13
Government 412 44 4,223 53
Industry 145 16 802 10
NGOa
63 7 572 7
NIPFb
25 3 46 1
Media 23 2 192 2
Other 60 6 1,085 14
Total 934 100 7,987 100

Draft 2014 Annual Report 02/26/15
44
the FVS. These analyses can be localized using a Geographic Information System, or
GIS, and map attributes can be used in the analysis. DATIM received additional funding
to develop online training modules for each of its tools. Version 1.5 was released in 2014,
while version 2 is currently in development. These versions are currently available only
to Forest Service employees. We hope to make version 4 available to all FIA customers
by 2016.
With support from NIMAC, Region 8 used the design tool to determine intensification
plans for about one-half of the national forests in the Region. SRS-FIA has supported the
Region with these intensifications through agreements with State partners. Funding has
limited further intensification at this time. The design tool will be used for evaluating
existing inventories and planning additional intensifications. Regions 8 and 9 are
interested in working with the existing and intensified FIA data to develop status and
trend reports for all national forests. A contractor worked with the NRS and SRS to load
intensification data to FIADB and to validate NFS estimation units.
In 2013, PNW-FIA Information Management and Reporting staffs worked with the
Pacific Northwest Region (NFS Region 6) to conduct extensive quality assurance and
load Region 6 intensification data into FSVeg. The Pacific Southwest Region (NFS
Region 5) has expressed strong interest and support for an FIADB load and the project
will be evaluated as a priority in 2015. Regions 5 and 6 continue to work with PNW to
collaborate in crew training, contract administration, data collection and data processing.
Regions 1 and 4 have collaborated with IW-FIA and Region 10 with PNW-FIA to further
expand current FIA protocols to include collecting information on all land types, not just
the forested portion. Both regions are using an intensification system that integrates with
the IW-FIA base data yet enables the regions to use NFS applications to collect
intensified data and store them in the NFS vegetation database, FSVeg.
FIA is collaborating on an agencywide effort to improve inventory, monitoring, and
assessment, such as developing National Management Questions, which will be used to
drive information needs. As part of the USDA all-land approach and the new Planning
Rule, FIA data will be more heavily used by NFS and by other partners. For example,
each national forest must now complete a Climate Scorecard—a significant portion of
which can be addressed using FIA data. In collaboration with NASA and R&D Climate
Change, FIA has provided the Scorecard results for all forests.
Based on feedback from the nine NFS regions, FIA is meeting many of the needs of NFS
partners. The development of streamlined vegetation and down woody material (DWM)
protocols for use on all plots has helped the western regions define and collect a
consistent set of regional variables on NFS lands to meet their needs. More effort is
needed in getting FIA data from NFS lands into the hands of NFS staff, and in
developing data presentations, analyses, and reports tailored to the specific needs of NFS
managers. The DATIM developers are working to help automate this process and to
create a more comprehensive and accessible datamart FIA will continue to work on these
issues in FY 2015. Increasing demands from NFS customers for additional forest
planning data and increasing emphasis on individual forest and regional forest monitoring

Draft 2014 Annual Report 02/26/15
45
plans will likely require changes in current financial arrangements with NFS. Stronger
funding support at the national level, including additional NFS funding for requirements
beyond the core FIA program, would be needed.
The NFS inventory specialists continue to have the following priorities for the FIA
program:
• Implement the annual system in all States.
• Collect data on all lands, including reserved lands and rangelands.
• Collect a full suite of vegetation and associated information.
• Transfer data from the National Information Management System into FSVEG
within 1 year from the end of the data collection season.
• Follow standard protocols across all NFS lands.
• Allow for a la carte protocols with local and regional funding support.
• Allow for increasing the intensity of the core grid as needed.
• Provide an inventory compilation and analysis package that meet NFS business
needs.
NFS has participated in the process to help define the updated FIA strategic plan.
Other FIA Program Features
Forest Products, Utilization, and National Woodland Owner Survey Studies FIA is charged with monitoring and reporting on the status, condition, and trends of all
the Nation’s forests. Although plot-based field surveys provide most of this information,
additional questionnaire and field-based surveys are conducted to report on TPO,
fuelwood production, and characteristics and management objectives of the Nation’s
private woodland owners. The number of surveys is listed in appendix table B-8,
followed by a brief overview of each survey type.
Primary mill surveys: FIA conducts TPO studies to estimate industrial and
nonindustrial uses of roundwood in a State. To estimate industrial uses of roundwood, all
primary wood-using mills in a State are canvassed. TPO questionnaires are designed to
determine location, size, and types of mills in a State; the volume of roundwood received
by species and geographic origin; and the volume, type, and disposition of wood residues
generated during primary processing.
Logging utilization studies: Logging utilization studies provide the information to
convert TPO volumes to inventory volume. Utilization factors developed from the data
translate a standard unit of product (1,000 board feet of sawlogs, one cord of pulpwood,
etc.) into a common volume unit and type of tree harvested. Estimates are made of how
much product came from sawtimber growing stock, poletimber growing stock, and
nongrowing stock sources such as cull trees, dead trees, saplings, and limbwood. The
Draft 2014 Annual Report 02/26/15
46
overall process provides a cross-section of logging operations to characterize the sites
logged, trees cut, products taken, and residues left behind. More detailed information on
forest products studies may be found in Smith (1991), Blyth and Smith (1979), and
Morgan et al. (2005). Additional information and online data from all these surveys are
available at http://www.fia.fs.fed.us.
Fuelwood surveys: Studies of fuelwood production from roundwood are necessary to
provide information to forest managers and users about the fuelwood harvest and its
effect on the resource. The amount and source of fuelwood harvested from forest land,
urban areas, fence rows, windbreaks, or other sources are estimated from these studies.
National Woodland Owner Survey: The NWOS, the social complement to FIA’s
biophysical forest inventory, has been busy processing the latest data, working on
publications and other products, and planning for the future. This work is made possible
through our joint venture with the University of Massachusetts Amherst, which has
enabled us to create the Family Forest Research Center
(http://www.familyforestresearchcenter.org) and through which most NWOS personnel
are employed.
The data from the latest (2011 through 2013) iteration of the NWOS have been fully
processed. During this last iteration, we received responses from nearly 11,000
ownerships and had a cooperation rate of close to 50 percent. Data entries, along with
logic checks and quality assurance measures, have been completed and a final dataset has
been generated. We are now working to build new tables in the FIA NIMS to
permanently store this information.
With completion of data processing, attention is being turned to generating and
disseminating the results. A general technical report that fully documents the design,
implementation, and estimation techniques will soon be published. An estimation engine,
and automated tools for generating tables and summary documents have been created.
The final tables, including rerunning of the 2006 NWOS data for better comparisons, will
be completed soon and a peer-reviewed journal article summarizing the results will be
submitted. Other products being worked on are a revamped NWOS Table Maker
program, a short brochure summarizing the results for landowners, a one-page document
summarizing the results for policymakers, two-page State-level summaries aimed at
forestry agencies and other conservation professionals, and a series of peer-reviewed
journal articles examining specific topics, such as landowner engagement.
Planning for the next iteration of NWOS is also progressing with the Office of
Management and Budget, or OMB, approval package recently submitted. The proposal
for the next iteration of the NWOS includes strong trend data in addition to using science
modules to explore new topics, such as climate change, wildfire, and invasive species,
and expanding to new populations, such as urban forest owners. We expect to begin
collecting ownership survey data for the next cycle in 2017.

Draft 2014 Annual Report 02/26/15
47
For updates and more information about NWOS, visit http://www.fia.fs.fed.us/nwos.
Other feature references:
Blyth, J.E.; Smith, W.B. 1979. Minnesota logging utilization factors, 1975–1976—development,
use, implications. Res. Bull. NC-48. St. Paul, MN: U.S. Department of Agriculture, Forest Service,
North Central Forest Experiment Station. 8 p.
Butler, B.J. 2008. Family forest owners of the United States. Gen. Tech. Rep. NRS-27. Newtown
Square, PA: U.S. Department of Agriculture, Forest Service, Northern Research Station. 72 p.
Morgan, T.A.; Spoelma, T.P.; Keegan, C.E.; Chase, A.L.; Thompson, M.T. 2005. Montana logging
utilization, 2002. Res. Pap. RMRS-52. Fort Collins, CO: U.S. Department of Agriculture, Forest
Service, Rocky Mountain Research Station. 12 p.
Smith, W.B. 1991. Assessing removals for North Central forest inventories. Res. Pap. NC-299. St.
Paul, MN: U.S. Department of Agriculture, Forest Service, North Central Forest Experiment
Station. 48 p.
Ecosystem Health Indicator Surveys
FIA began implementing a nationwide, field-based forest ecosystem health indicator
monitoring effort in the 1990s, and it currently collects forest health measures in 47
States. Most indicators are well documented in terms of sampling protocols, data
management structures, and estimation procedures (Bechtold and Patterson 2005). Field
data and indicators from most sample years are available on line with numerous
analytical examples published both internally and externally. Field protocols associated
with each indicator are available in the National Core Field Guide (USDA Forest Service
2006). Next, we briefly describe the indicators and follow that with an overview of the
current direction FIA is taking to improve their functionality.
Crown condition: Tree crowns are an important component of net primary production
and deteriorating foliage is a visible sign of stress that often precedes reduced growth and
increased mortality. For this indicator, measurements are recorded on all sampled trees
greater than 12.7-cm diameter at breast height, including uncompacted live crown ratio,
crown diameter (for some years), crown density, foliage transparency, crown dieback,
crown light exposure, and canopy position. The crown indicator is described in
Schomaker et al. (2007).
Lichen communities: Long-term observation of epiphytic (i.e., tree-dwelling) lichen
communities indicates changes in air quality, climate, and land use. For this indicator,
field crews observe the presence of lichen species, estimate the abundance of each
species, and collect specimens for identification by a specialist. Lichen community
measurements are made within a 37-m radius of each plot center (~ 0.38-ha area). The
lichen indicator is described in Will-Wolf (2011).
Forest soils: Environmental stressors that interfere with soil function have the potential
to influence the productivity, species composition, and hydrology of forest ecosystems.
For this indicator, crews complete ocular estimates of the percentage and type of soil

Draft 2014 Annual Report 02/26/15
48
compaction or erosion, and they check for the presence of restrictive layers within the top
50 cm of soil. The crew then collects five soil samples—three forest floor samples to
measure organic matter and carbon content, and a mineral soil core collected at two
depths: 0 to 10 cm and 10 to 20 cm. Soil samples are sent to the laboratory immediately
after collection and stored for future physical and chemical analysis. The soils indicator is
described in O’Neill et al. (2005).
Vegetation diversity: The vegetation diversity and structure indicator is designed to
evaluate the composition, abundance, and spatial arrangement of all vascular plants and
for assessing wildlife habitat, site productivity, and the effects of invasive species. For
this indicator, crews with previous botanical experience record both species and overall
structural data for vascular plants, including their total canopy cover and cover in
different height zones (0 to 2 m, 2 to 5 m, and more than 5 m). Specimens of species not
readily identified in the field are collected for future identification by a specialist. The
vegetation indicator is described in Schulz et al. (2010).
Down woody material: The DWM indicator is designed to estimate detrital
aboveground biomass in the form of coarse woody debris, fine woody debris, litter, and
duff pertaining to important fire, wildlife, and carbon issues. For this indicator, coarse
woody debris (greater than 7.5 cm in diameter) is sampled on a series of transects across
the plot totaling 88 m in length. Fine woody debris between 2.5 and 7.5 cm is sampled on
a series of transects totaling 12 m in length. Fine woody debris less than 2.5 cm is
sampled on a series of transects totaling 7 m in length. Duff and litter depth
measurements are taken at 12 points located on the plot. The DWM indicator is described
in Woodall and Monleon (2008).
Ozone injury: Ozone is a widely dispersed pollutant that reduces tree growth, changes
species composition, and predisposes trees to insect attack and disease. Because ozone
injury causes direct foliar injury to particular forest plant species, these species are used
as bioindicators to identify the presence and severity of local air pollution. Ozone injury
is not observed directly on the FIA plot network because indicator species are not always
present and openings in the canopy are necessary to obtain useful results. For this
indicator, crews evaluate up to 30 individual bioindicator plants for amount and severity
of ozone damage. The ozone injury indicator is briefly described in Will-Wolf and Jovan
(2008).
Other indicators: Other key indicators of forest health such as tree mortality and growth
and the abundance of invasive and nonnative tree species are found in the basic plot data
and subsequent remeasurements.
Bechtold, W.A.; Patterson, P.L., eds. 2005. The enhanced Forest Inventory and Analysis program—
national sampling design and estimation procedures. Gen. Tech. Rep. SRS-80. Asheville, NC: U.S.
Department of Agriculture, Forest Service, Southern Research Station. 85 p.
O’Neill, K.P.; Amacher, M.C.; Perry, C.H. 2005. Soils as an indicator of forest health: a guide to the
collection, analysis, and interpretation of soil indicator data in the Forest Inventory and Analysis
program. Gen. Tech. Rep. NC-258. St. Paul, MN: U.S. Department of Agriculture, Forest Service,
North Central Research Station. 53 p.

Draft 2014 Annual Report 02/26/15
49
Schomaker, M.E.; Zarnoch, S.J.; Bechtold, W.A.; Latelle, D.J.; Burkman, W.G.; Cox, S.M. 2007.
Crown condition classification: a guide to data collection and analysis. Gen. Tech. Rep. SRS-102.
Asheville, NC: U.S. Department of Agriculture, Forest Service, Southern Research Station. 78 p.
Schulz, B.K.; Bechtold, W.A.; Zarnoch, S.J. 2010. Sampling and estimation procedures for the
vegetation diversity and structure indicator. Gen. Tech. Rep. PNW-GTR-781. Portland, OR: U.S.
Department of Agriculture, Forest Service, Pacific Northwest Research Station. 53 p.
U.S. Department of Agriculture, Forest Service. 2013. Forest Inventory and Analysis national core
field guide (Phase 3), version 6.0. Washington, DC: U.S. Department of Agriculture, Forest Service,
Forest Inventory and Analysis. http://www.fia.fs.fed.us/library/field-guides-methods-
proc/. (October 2013).
Will-Wolf, S. 2011. Analyzing lichen indicator data in the Forest Inventory and Analysis program.
Gen. Tech. Rep. PNW-GTR-818. Portland, OR: U.S. Department of Agriculture, Forest Service,
Pacific Northwest Research Station. 62 p.
Will-Wolf, S.; Jovan, S. 2008. Lichens, ozone, and forest health—exploring cross-indicator analyses
with FIA data. In: McWilliams, W.; Moisen, G.; Czaplewski, R., eds. 2008 Forest Inventory and
Analysis symposium. October 21–23, 2008. Park City, UT. Proc. RMRS-P-56CD. Fort Collins, CO:
U.S. Department of Agriculture, Forest Service, Rocky Mountain Research Station:
Woodall, C.W.; Monleon, V.J. 2008. Sampling protocols, estimation procedures, and analytical
guidelines for down woody materials indicator of the Forest Inventory and Analysis program. Gen.
Tech. Rep. 22. Newtown Suare, PA: U.S. Department of Agriculture, Forest Service, Northern
Research Station. 68 p.
Beyond Standing Trees: The Evolution of FIA Ecosystem Health Indicators
For more than a decade, FIA has conducted a so-called Phase 3 inventory program in
which a subset of Phase 2 plots were sampled to characterize aspects of the forest other
than standing trees using the previously listed indicators. FIA is now in the process of
developing revised sampling techniques for these indicators, which will now be called
ecosystem health indicators in response to fluctuating budgets, emergent user needs, and
evolving forest health science.
Some revised indicators (DWM, understory vegetation, and crown conditions) were
implemented in FY 2013 in a “Phase 2 Plus Program/Ecosystem Indicator Program”
(included, but not separate, in appendix B-7). The P2 sampling scheme facilitates the
collection of a national core set of indicator information on more plots for less cost than
the original Phase 3 protocols, with sampling as a systematic subsample of each subpanel
that can change in response to budgetary fluctuations (i.e., flexibility) without
compromising long-term analytical capabilities. Although the revised protocols collect
less detailed information on each sampled plot, substantially more plots are sampled,
potentially increasing the statistical power of future forest health analysis.
These changes represent a first step for FIA to take the opportunity to address current
budget realities and adapt for the future to continue to meet customer needs. FIA will
work closely with clients to ensure a successful transition from the current Phase 3
program to a fully integrated Phase 2 Plus/Ecosystem Indicator Program that continues to

Draft 2014 Annual Report 02/26/15
50
provide a comprehensive survey of forest biomass, carbon pools, and ecosystem health in
addition to the “traditional” function of the FIA program.
The next FIA strategic plan, finalized in FY 2014, continues to promote the evolution of
more efficient ecosystem indicator implementation strategies.
Special Partnerships Spanning Cultures
There are an estimated18 million acres of Tribal forest lands located on 305 reservations
across 24 states, based on FIA data and reported in the 2013 report “Assessment of Indian
Forests and Forest Management in the United States”
(http://www.fs.fed.us/spf/tribalrelations/pubs_reports/ ). For management, tribes need a
broad spectrum of information, from timber to fuel loading to wildlife habitat to surveys
of forest stewardship objectives. Tribes realize these needs have environmental, social
and economic consequences related to forest sustainability and the unique place of forests
in tribal life.
FIA is committed to developing partnerships with Tribes and has assisted many tribes in
assessing resource status, historical conditions, resource availability, and regional context
for tribal forests. Recent efforts have included:
partnering with the Alaskan Native Tanana Chiefs to begin implementation of a
forest inventory in the Tanana Valley;
partnering with native Pacific Islanders to conduct inventory and monitoring
work in the tropical Pacific Islands;
partnering with Ojibwa Tribes of the Great Lakes to assess the supply and quality
of paper birch within the in the territories ceded in the treaties of 1836, 1837,
1842 and 1854;
creating custom databases for the Quinault Indian Nation and Sealaska
Corporation in Alaska and Tribal Lands in Nevada;
providing data to quantify woodland resources for the San Carlos Apache Tribe
allowing managers to make informed decisions about tree-cutting regulations; and
partnering with the Eastern Band of Cherokee Reservation (EBCNR) to conduct a
timber cruise following the Red Tail fire to locate hot spots where the wildfire
resulted in significant damage to the timber.
FIA will continue to explore partnerships with Tribes to better serve this community of
users.
Program Safety
FIA takes safety very seriously and considers it a top priority. People in FIA cover
hundreds of thousands of miles in travel each year while conducting business and they
work in very difficult terrain across all types of plant and forest communities. FIA
remains focused on creating an entire workforce culture that seeks to protect FIA and our

Draft 2014 Annual Report 02/26/15
51
partner employees from daily exposure to hazards that threaten safety and health. Table 6
summarizes the program’s safety record for FY 2014. Figures 20 and 21 show program
safety trends by incident type for FY 2008 through FY 2014 followed by regional safety
highlights for FIA units in FY 2014.
Table 6. Base safety reference data, recordable incidents, and incident frequency by FIA unit, FY 2014.
FIA = Forest Inventory and Analysis. FY = fiscal year. a Based on appendix table B-3 number of Federal employee estimated full-time equivalents (FTEs).
b Based on appendix table B-3 number of Federal employees times 2,080 hours per FTE; small
percentage of overtime not included in estimate.
Standard safety training is mandatory and is conducted at each field unit. Safety training
and equipment are provided for headquarters offices, field offices, and field crews,
including driver training, first aid kits, cell phones, etc. In regions with special
circumstances, such as the need for aircraft, access to large areas of wilderness, or
exposure to potentially dangerous wildlife or remote difficult-to-access areas, additional
training and equipment are provided. Information on specific safety training and criteria
are available on line at http://www.fia.fs.fed.us.
As a demonstration of our commitment to safety, FIA units have now completed three
consecutive annual safety engagements as part of the ongoing Chief’s Safety Journey,
giving all employees a voice toward improving policies and procedures around safety.
Figure 20. Number of recordable illness and injury incidents by FIA unit, FYs 2008–14. FIA = Forest Inventory and Analysis. FY = fiscal year. NRS = Northern Research Station. PNW = Pacific Northwest Research Station. RMS = Rocky Mountain Research Station. SRS = Southern Research Station.
Notes: Work-related injury or illness resulting in any of the following: death, days away from work, restricted work or transfer to another job, medical treatment beyond first aid, and loss of consciousness. Value for SRS for FYs 2009 and 2010 is zero.
Figure 21. Number of reportable motor vehicle accidents by FIA unit, FYs 2008–14. FIA = Forest Inventory and Analysis. FY = fiscal year. NRS = Northern Research Station. PNW = Pacific Northwest Research Station. RMS = Rocky Mountain Research Station. SRS = Southern Research Station.
Notes: Any occurrence involving the use of a government-owned or government-leased motor vehicle (automobile, truck, or bus) that results in a total combined damage exceeding $500 or more. This definition
Category PNW IW SRS NRS NO Total
Base data
Federal FTE equivalentsa
88 95 83 97 4 366
Total estimated hours workedb
183,664 197,787 171,808 200,928 7,280 761,467
Total vehicle miles driven 316,144 618,223 697,000 743,292 - 2,374,659
Total flight hours logged 149 25 - - - 174
Recordable incidents by class
Time lost illness/injury incidents 8 8 1 - - 17
Motor vehicle accidents - 1 9 - - 10
Aircraft accidents - - - - - -
Safety incident frequency rate
Time lost illness/injury rate per 100 FTEs 9.1 8.4 1.2 - - 4.6
Motor vehicle accidents per million miles driven - 1.6 12.9 - - 4.2
Aircraft accidents per 100,000 flight hours - - - - - -
FIA Unit

Draft 2014 Annual Report 02/26/15
52
also applies to privately owned vehicles when used on official government business. Value for PNW for FY 2008 is zero. Value for PNW and SRS for FY 2009 is zero.
Regional Safety Highlights for FY 2014 Northern Research Station FIA Safety Highlights
NRS-FIA entered 2014 with the field Data Collection group winning the NRS Director’s
Safety Culture award, a worthy highlight for a unit committed safety awareness. NRS-
FIA was able to hire a full-time dispatcher that accommodated pre-landowner contact and
post-landowner contact check-ins to provide increased safety during face-to-face contacts
and decreased response time during emergencies. Six successful SPOT drills were
conducted during 2014.
The NRS-FIA Safety team continues to pursue the possibility of deploying aerosol
defense sprays to field employees for defense against wild and domesticated animals.
NRS-FIA had another black bear incident with a threatening charge lasting for an
extended period of time in FY 2014.
The St. Paul Wellness Committee continues with active NRS-FIA involvement, with
many employees involved in the weekly walking club and many participating in the
health assessment. Many employees take wellness seriously as can be evidenced through
the many fitness facility memberships. The Newtown Square Safety Committee
purchased LED (light-emitting diode) signage to highlight safety tips and important
messages.
NRS-FIA continues to promote wellness by encouraging sedentary employees to get up
and move throughout the day, providing one employee with yellow-tinted computer
glasses to prevent additional eye strain, responding to employees’ requests for wireless
mice, acquiring ergonomically friendly keyboards, and securing a standup station for one
employee.
Safety training continues at all levels of NRS-FIA with completion of the annual
cardiopulmonary resuscitation (CPR) /first aid/driver’s training. Self-defense training is
being scheduled for field employees in preparation for upcoming urban field data
collection. NRS-FIA continues to have staff involved in safety committees at the unit and
station levels.
Job hazard analyses (JHAs) were updated and included on the NRS-FIA Web site. In
anticipation of conducting wood utilization studies, a new JHA was created, approved,
and posted on the NRS-FIA Web site. The general driving JHA was revised to reflect that
fire extinguishers are no longer carried in Government vehicles. As part of the JHA-
required personal protection equipment (PPE), steel-toed safety boots will be made
available to field employees as a proactive measure to prevent foot and ankle injuries on
active logging sites.

Draft 2014 Annual Report 02/26/15
53
Pacific Northwest Research Station FIA Safety Highlights
The PNW Resource Monitoring and Assessment Program’s FIA unit continues its
commitment to a culture of safety and wellness to improve the lives of employees by
strengthening our program of work. This year, empowered and engaged employees
provided valuable input to refine our existing safety systems using annual safety surveys,
improved near-miss reporting, and using the Safety Program Evaluation Checklist
(SPEC) review. Ideas shared by team members have led to creative work improvement
projects and our dedicated safety committee members and management team help bring
ideas to fruition using analysis and action.
Preparation and Learning: Our group has a full scope of safety training, but, as a
response to employees’ requests for additional training, several courses have been added
permanently or piloted. Along with first aid and CPR, hands-on defensive- driving
training has been incorporated as part of our intern orientation, and wilderness survival
training was offered as a pilot for some of our employees. Our field crews in Alaska have
at least one certified Wilderness Emergency Medical Technician per crew, setting a
precedent for additional employees to be trained in advanced medical response. Staff in
northern Washington participated in Forest Service-sponsored safety training related to
riding and handling stock animals.
We refined near-miss reporting systems by improving the questions and moving the
anonymous employee submission to our Safety SharePoint site. This venue enables
employees to view all submitted near misses and has created a more user friendly format
for analyses. We recognized that most near misses take place while driving, followed by
hiking and then encounters with wildlife (including insects). The new categories that
were recently added to the near-miss report helped identify that incidents occurring while
collecting data in the field are most likely to occur while measuring downed woody
material transects, followed closely by measuring tree lengths. These discoveries help
increase situational awareness while employees complete their daily tasks.
Strategic Risk and Awareness: We conducted a “What-If” Scenario Challenge,
stimulating field staff to consider potential actions given a hazardous situation and typical
resources. The “winning” field crew of this contest analyzed how they would react to a
fire in the backcountry on that given day, providing a realistic (but hypothetical) scenario
for which to practice their communication and backcountry safety training.
We continue to update our JHAs annually. This year we worked with the PNW Station
Safety and Health Manager, Tammy Verhunc, on a pilot template JHA that includes risk
analysis; we explored the hazards of working in areas where wildfire may become active.
Our team also created a new JHA for canoe travel on flat water.
We reformatted our field notes to include dedicated space for a crew to document
information regarding worksite hazards. This format was developed to ensure future
crews are aware of these situations when planning reentry either this season or at the next
cycle.

Draft 2014 Annual Report 02/26/15
54
Agreements: Our check-in and check-out system for all staff was further refined,
incorporating input from both office and field employees for streamlining the process and
closing perceived gaps. This refinement sparked an initiative to improve communication
between remote field staff and NFS units where they may be working or passing through
while conducting the inventory. Now crews have points of contact at each NFS unit and
notify them while working in the area to help improve response times if an emergency
arises.
Our crews in Alaska face unique challenges when traveling by helicopter. We have
mitigated safety issues by implementing a dedicated flight follower for helicopter
operations while conducting fieldwork in interior Alaska instead of relying on a remote
dispatch unit hundreds of miles away in Anchorage. We also outfitted a significant
mobile emergency/trauma kit for use at the base of helicopter operations. Our helicopter
contract was amended to include an onsite, on-duty helicopter mechanic for daily
maintenance and safety inspections at our remote base locations.
Alaska office staff stay current on safety issues in urban situations by working with
Anchorage municipality to try to install crosswalks across the busy street between the
office building and the parking lots.
The Anchorage Lab conducted an analysis of egress routes from the Lab building in the
event of an emergency that requires exiting to higher ground. The analysis included an
assessment of access feasibility and hazards of all available routes that one could follow
to get out of the low-lying area where the Anchorage Lab is located. We also participate
in the “Great Alaska Shakeout” earthquake drill and awareness, which takes place
annually in October. The Anchorage Lab also updated its phone tree list to be kept in
emergency kits.
The safer we are, the more successful we are: The concept of wellness and safety
going hand in hand has become commonly accepted, and, in FY 2014, many of our
employees successfully completed the third annual PNW Station Wellness Challenge,
which takes place in the late winter and spring. Our wellness plan is becoming more
consistently used as employees and managers have come to value wellness and work-life
balance as integral pieces of a productive and healthy workforce.
Finally, this experience was our first using the new “conversation- and discussion-based
SPEC review” and we piloted an approach for electronically filing our documentation.
This project engaged a representative from all teams in our program, and not only did we
score an “Outstanding” rating, but we also received kudos from the Station Safety and
Health Manager for “the best SPEC binder assembled by a program since [she] started
conducting these reviews.” This review process gives a baseline of the success of our
safety program. It enables us to identify areas in which we are excelling (like providing
and evaluating safety training) and areas that could be improved (such as safety training
attendance tracking). Reflecting on the SPEC review, learning from other FIA units
around the country, compiling results from the most recent safety survey and continuing

Draft 2014 Annual Report 02/26/15
55
to focus on near-miss reports will help direct our efforts toward an even safer and
healthier FY 2015. Rocky Mountain Research Station, Interior West FIA Safety Highlights
The Rocky Mountain Research Station, Interior West FIA program is committed to
developing a proactive safety culture by modeling and reinforcing safety as our core
value. This goal requires building trust, learning from mistakes, understanding human
performance and careful, intentional response to people, situations, and accidents. During
the past year, the unit has continued to focus on sharing our personal safety stories in the
program’s safety newsletter and through facilitated learning analyses.
As we continued on our Forest Service safety journey, the unit focused on five work
improvement projects: (1) improving building access, (2) office ergonomics, (3) plot
planning, (4) field equipment, and (5) fitness and wellness in the field. The teams,
composed of leadership and employees, have made great progress. The two office-related
projects and one field-related project have been completed. The building access team
reviewed the safety of employees and guests accessing the building. Upon full review,
the team initiated the extension of the building guards’ hours, added electronic access to
the most direct entrance, added emergency information cards at all egress points,
improved lighting at exit doors, replaced a solid door with a door with a window so that
people can maintain situational awareness when exiting, and installed a monitor for the
closed-circuit surveillance at the door. The ergonomics team collected research findings
and tested new ergonomic equipment, such as standup and adjustable-height desks. The
team developed an infographic, combining proper workstation setup, recommended
stretches and exercises, and refined the process by which employees can request
ergonomic equipment. The field equipment team was tasked with improving field
equipment, including communications tools. The team developed a spreadsheet of all
field equipment that included the weight of the equipment to allow for more precise
planning and packing. The team researched available communications equipment and
purchased new satellite phones and tracking devices with text messaging capabilities. In
addition, the team focused on reducing the weight of field equipment and packs by
researching the possibility of e-readers. After a field trial, the team is planning to provide
an e-reader to crew leaders that will help eliminate the need for crews to carry hardcopy
manuals, identification books, reference materials, and cameras. Two additional field
projects focused on improving employee fitness and plot planning are in process, and the
field equipment project team decided to continue work as the need arises.
The unit also worked diligently to reduce vehicle-backing accidents and associated costs.
The unit developed window stickers for not only FIA employees, but also for the entire
RMRS, to serve as a visual reminder for vehicle operators every time they get behind the
wheel. The stickers include four short but important messages: (1) Backing—Use a
spotter or GOAL (Get Out And Look), (2) seatbelts, (3) no distractions, and (4) slow
down. Some of the unit’s older field vehicles were equipped with aftermarket rearview
cameras as well. The unit did not have any vehicle-backing accidents reported during the
fiscal year.

Draft 2014 Annual Report 02/26/15
56
In addition to reviewing accident trends, learning summaries, and required safety
training, spring field training included additional information about health and fitness,
extreme nutrition, preventing falls, communication, and long work days. Although
driving remains our highest risk activity, most injuries are associated with slips, trips, and
falls that happen while employees are hiking. Proper conditioning, cross training muscle
groups, stretching, varying workloads, and proper equipment (good quality hiking boots
and hiking poles) are key to preventing these injuries. Injury-free FIA field work requires
much more than just skill, strength, and proper equipment. It takes attention to aerobic
fitness, core strength, balance, flexibility, endurance, and rest. We plan to focus on our
FIA athletes’ total fitness and wellbeing throughout the next year. Employees are our
most successful defense against accidents and injuries. We must make sure we are
physically and mentally prepared for the risks in which we are exposed.
Southern Research Station FIA Safety Highlights The SRS-FIA unit remains committed to developing a proactive safety culture and
ensuring the safety of our employees. We continue to promote training, trust, and
building a model that reinforces safety during everyday operations.
The past year brought four new members and a new chair to our Safety Committee.
Safety Committee charter modifications included adding a second standing seat on the
committee reserved for a Data Acquisition Section employee, to better represent field-
related concerns, and a standing seat for a representative of the National Federation of
Federal Employees. Although we went through normal changes and challenges
associated with a change in personnel, the addition of these members will add to the
strength of the committee during the new 2 years.
Looking at our goals for 2014, which included scheduling another field meeting,
deploying smartphones, certifying trainers for CPR/first aid, and continuing to make our
reporting processes more efficient, we made progress in some areas but work remains in
others. Because of budget issues, we were not able to schedule another field meeting;
however, the Safety Engagements planned for early 2015 will bring our field personnel
together again. We were able to deploy smartphones to our field supervisors and crews.
In doing so, we made available in real time to our field-going personnel a tremendous
amount of safety-related information, such as weather alerts and tidal information for our
employees working on the coast. Our Safety and Occupational Health Specialist has
obtained certification as a CPR/first aid trainer, and we have identified a backup who will
also receive certification. The SRS-FIA Safety Committee has been looking at safety
reporting procedures within the unit and ways to reduce potential pitfalls. In 2015, to
achieve more consistency and structure, we are going to adopt a Safety Management
Systems (SMS) approach and make training available to everyone to familiarize them
with this approach.
During the year, we updated our SPOT procedure to bring us inline with SRS policy that
was released early in the year. In the future, we are very hopeful that the next generation

Draft 2014 Annual Report 02/26/15
57
of SPOT devices will provide a texting capability or the ability to work with our
smartphones to provide expanded functionality. In the absence of texting capability, we
have opted to include employees’ cell phones for notifications, so that employees that
deploy their SPOT device have confirmation those messages have been sent.
The tick research project that we are jointly running with the University of Tennessee
(UT) Department of Entomology and Plant Pathology began producing samples as soon
as it hit the field. Our field crews have done an excellent job of pulling ticks, storing
them, and shipping them to our office for processing before sending them to UT
researchers. This project has tremendous mutual benefit for the Forest Service and for
UT—(1) limited screening of ticks may provide field personnel with important
information related to their risk of disease, and (2) a better understanding of seasonal
abundance and distribution of ticks will benefit UT and, ultimately, everyone who is at
risk of disease from tick bites.
Our field crews drove nearly 700,000 miles with no major accidents this year. We could
not be more pleased with the safety of our drivers. Although we did have a vehicle
incident increase from one to nine, most of these were because of chipped windshields
caused by rocks. This increased incident count should not detract from the fact our field
crews covered more acres of land that any other FIA unit without a major accident.
Two SRS-FIA employees produced safety videos, which were shown at the fall SRS
Leadership Team meeting and then made available on line at the SRS intranet Web site.
One dealt with PPE and other suggestions for preventing tick bites, and one detailed the
safety checks one should always conduct before driving a vehicle. Other highlights from
2014 include updating our JHAs and adding them to the SRS-FIA Web site, revising our
Safety Committee charter, and conducting an inventory of boating safety equipment. In
the office environment, we obtained megaphones to alert occupants in the case of
emergency because our new telephone system does not have public announcement
capability.
In addition, many office employees have begun using various desk and table
configurations to allow for some time standing while at work, and the Unit Wellness
Committee successfully competed for SRS funds to purchase exercise equipment, which
is now housed at our Knoxville headquarters.
Looking ahead to FY 2015, we hope to (1) integrate the SMS approach throughout our
unit, (2) continue the safety journey with the next Chief’s Safety Engagement meeting in
January 2015, and (3) review and update our check-in/check-out policy.
Comparing FY 2013 Plans With FY 2014 Accomplishments and FY 2015 Plans In the FY 2013 business report for FIA, we included a section stating our plans for FY
2014. In the following table we show how our actions in FY 2014 matched our plans
from FY 2013 and our plans for FY 2015.

Draft 2014 Annual Report 02/26/15
58
In the FY 2013 business report, we said that in FY 2014 we would—
In FY 2014, we—
In FY 2015, we will—
Base Inventory and Reporting
Continue base inventories in 49 States and coastal Alaska, contingent on FY 2014 budget. Publish 5-year State reports for Arizona, Arkansas, California, Georgia, Nevada, New Hampshire, New Mexico, North Carolina, Ohio, Oregon, Texas, Utah, and Washington; publish a status update for American Samoa. Conduct 2014 interior Alaska, Tanana Valley inventory pilot. Continue remeasuring U.S.-affiliated Pacific Islands, finishing Guam in late 2013 and the Republic of Palau in early 2014. Continue implementing modified protocols for down wood, vegetation, and crowns in the East. Continue implementing protocols for remeasuring soils in NRS. Continue working on comprehensive, user-friendly ecosystem indicator database. Develop, refine, and test
Continued base inventories in 49 States and initiated inventory in Tanana Valley, Alaska. Published 5-year State reports for California, Kentucky, New Hampshire/Vermont (combined), New Mexico, Ohio, Texas, and Virginia. Delayed reports are for Arizona, Arkansas, Nevada, North Carolina, Oregon, Utah, and Washington and for American Samoa. The interior Alaska pilot tested protocols on 100 plots for the Tanana Valley. The work was conducted under partnerships with the State of Alaska and NASA Goddard. Completed remeasurements in Guam and the Republic of Palau. Continued implementing modified protocols for down wood, vegetation, and crowns in the East. Continued implementing protocols for remeasuring soils in NRS. Developed three levels of protocols at varying levels of plot intensity and circulated them among clients for
Continue base inventories in 49 States, coastal Alaska, and Tanana Valley inventory in interior Alaska as budget allows. Publish 5-year State reports for Arizona, Arkansas, Colorado, Connecticut/ Rhode Island/ Massachusetts (combined), Florida, Georgia, Indiana, Iowa, Louisiana, Maine, Minnesota, Mississippi, Missouri, Nevada, New York, North Carolina, Oregon, South Carolina, Utah, and Washington, and for American Samoa. Continue the interior Alaska inventory pilot on a smaller scale in 2015. Approximately 30 to 40 plots are planned. Remeasure the Commonwealth of the Northern Mariana Islands in 2015. Propose recommendations for incorporating modified protocols nationally and submit change proposals as needed. Continue implementing modified protocols for soils in the North. Use client feedback to work up recommendations on ecosystem indicators.

Draft 2014 Annual Report 02/26/15
59
modified ecosystem indicator protocols. Implement the “national standard FIA reporting templates” for all annual reporting. With the passage of the Farm Bill, complete a new strategic plan for FIA in full collaboration with partners and users.
feedback. Published annual State reports using the national standard FIA reporting template. The National FIA Program Office completed draft and submitted the revised strategic plan to Forest Service OBPA office on time.
Initiate standard FIA reporting templates for 5-year reports to be used nationally. Respond to questions from Congress and stakeholders regarding the new strategic plan.
National Woodland Owner Surveys and Timber Products Surveys
Implement and thoroughly test the national TPO data management and processing system nationally. Publish a national pulpwood report and begin work on national TPO data query system. Deploy beta version of a large corporate forest ownership questionnaire survey. Complete processing of the 2012–13 NWOS data and submit products that summarize the data. Incorporate NWOS data into FIA’s NIMS database and online access tools. Begin planning for the next (FY 2015) NWOS, including commencement of the OMB review process. Continue to work with partners to further the analysis of NWOS.
Data for the South, Alaska, California, Idaho, and Nevada have been successfully processed and incorporated into the national TPO structure. Published 2010 National Pulpwood Report. Formalized the beta version of the large corporate forest ownership survey for testing. Completed processing of all 2011 through 2013 NWOS data, peer reviews for tables, documentation, and a brochure submitted for publication. Initiated the process for incorporating NWOS data into NIMS and loaded test tables. Completed planning for next NWOS survey. It includes new modules for urban, public, and corporate forest owners; climate change; invasive species; wildfire; landowner values; and decisionmaking. Worked with multiple partners to create new TIMO and REIT variables that will soon be added to NIMS.
Continue to load and process all regional TPO data into the national TPO data management and processing system. Publish 2012 National Pulpwood Report; begin work on 2013 National Pulpwood Report. Deploy the national TPO data query system. Implement the beta version of the large corporate forest ownership survey. Publish the NWOS tables, documents, and other basic materials. Launch the revised NWOS online data access tool and incorporate NWOS data into FIA’s NIMS. Submit NWOS review package to OMB. Continue to work with partners to further the analysis of NWOS.

Draft 2014 Annual Report 02/26/15
60
Pilot Studies
Continue to implement regional ICE project working with RSAC to develop new FIA product lines addressing enhanced land cover/land use objectives in upcoming strategic plan. Publish report on Colorado urban inventory pilot. Finish iTree compilation and finalize Urban FIA report for PNW region that includes all five States. Extend Landtrender analyses to the rest of Oregon and all of Washington. Pilot height subsampling to model tree heights based on diameter class.
In collaboration with RSAC, SRS-FIA aligned the ICE land classification system to be compatible with FIA land use definitions, IPCC land use definitions, and other land cover-based classification systems. FIA worked with RSAC on tool and database development and on a training system for ICE. Because of processing delays in handling the iTree analysis, urban analysis for Colorado has been temporarily removed from the RMRS-IW FIA work plan until an agreement for timely iTree analysis can be developed. Implemented Urban FIA in Austin, TX, and Baltimore, MD. Prepared General Technical Reports describing the urban inventory results for all five Pacific States. Published GNN maps on line that cover all of California, Oregon, and Washington, for a time-series 1984–2012. The maps are used for Northwest Forest Plan Effectiveness Monitoring, carbon monitoring, and many other applications. Developed models using Landtrender to estimate carbon flux from remeasured FIA field plots as a function of land use, management, and disturbance. Completed and delivered CONUS data in early FY 2014. Results from 2014 demonstrated efficiencies would be achieved by subsampling crowns in addition to the tree height measurements.
SRS-FIA will implement the ICE project in California, Maryland, New Hampshire, Texas, Vermont, and Utah. Determine cause for Colorado delays processing iTree data and move to get preliminary data to RMRS-IW-FIA unit. Process the data and prepare report on Urban FIA pilot work in Colorado. Publish an urban report for Austin, TX and continue urban activity in Austin and Baltimore. Expand monitoring to Milwaukee, WI, Providence, RI, and Houston, TX. Project complete. In FY 2015, FIA will develop new uncertainty measures for GNN imputation maps based on bootstrapping, which can help guide map users. Complete full production of NLCD Tree Canopy Cover data for CONUS and conduct NLCD Tree Canopy Cover project within California, Oregon, and Washington. Pilot complete.

Draft 2014 Annual Report 02/26/15
61
Extend RMRS-IW-FIA tree core collection and processing to PNW for spatiotemporal patterns of growth related to climate. Pilot submeter accuracy GPS coordinate collection.
The RMRS-IW-FIA tree core collection exceeded 20,000 catalogued samples. PNW-FIA collected approximately 500 Douglas-fir cores. Published several climate-/water-related papers. Implemented pilot study in California, Oregon, and Washington. Field crews collected more than 500 samples from P2 plots for inclusion the RMRS-IW-FIA study. Collected GPS coordinates (submeter accuracy) on every subplot visited in PNW for 2014. Postprocessing will take place in the office after the field season concludes.
Prepare tree ring samples for lab processing and climate sensitivity analysis. Field crews in California, Oregon, and Washington will continue to sample during the 2015 field season. Development of the tree-ring database will continue, with continuing growth and climate analysis and internal testing of an FIA database extension in which all ring records will be accessible by plot, species, growth year, etc. The GPS protocol will continue with some minor adjustments to clarify offset from subplot center when necessary. NEW: Complete publications and datasets resulting from the collaborative NAFD project, mapping annual forest disturbance and cause during the past 25 years (RMRS). Contact: Gretchen Moisen, IW-FIA. NEW: Continue collaborative work under the LCMS, an interagency effort to integrate disturbance data (RMRS, PNW). Contact: Gretchen Moisen, IW-FIA.
Forest Carbon
Initiate pilot project (with NASA, etc.) to test the utility of airborne LIDAR/ hyperspectral/thermal remote-sensing data for estimating aboveground carbon stocks in the Tanana Valley of interior Alaska. Initiate development of a prototype MRV (monitoring, reporting, and verification) system—using a combination of FIA plot data,
Initiated the interior Alaska pilot project in the Tanana Valley State Forest and Tetlin NWR. Partnered with NASA-Goddard to collect high-resolution, airborne LIDAR-hyperspectral-thermal imagery as a strip sample (9-km spacing between strips) covering the entire Tanana watershed (135,000 km2). Contracted to collect LIDAR (as a strip sample) over 6 different sites distributed throughout the lower 48
Compile and analyze the field remote-sensing data collected in the Tanana Valley in 2014. Statistical estimators for a multilevel sampling design—using both field and remote-sensing data—will be developed and used to report status of forest resources. In cooperation with the University of Washington, will establish 250 to 300 (total) specialized plots within the LIDAR strips that will be used to
Draft 2014 Annual Report 02/26/15
62
airborne LIDAR sampling, and Landsat time series data—to retrospectively estimate carbon stocks back to a 1990 baseline. Evaluate the impacts of a refined woodland delineation on the National Greenhouse Gas Inventory of forest carbon stocks. Complete evaluation a forest floor carbon estimation approach using P3 soils information and explore potential application to the National Greenhouse Gas Inventory. Evaluate the implications of a refined “managed land” delineation of U.S. forests and implications regarding the National Greenhouse Gas Inventory. Initiate research exploring potential use of Landsat imagery to stratify forest inventories across the 1990s for greenhouse gas inventories per a NASA-CMS grant.
(Colorado, Maine, Minnesota, New Jersey, Oregon, and South Carolina). In the 2015 National Greenhouse Gas Inventory, a series of refinements was adopted:
1. A definition of forest land consistent with FAO FRA and RPA, which required developing a maximum in situ height model based on FIA plots and climate information.
2. A new approach for “imputing” P3 measurements so that forest floor carbon estimates derived from the P3 soils inventory could be seamlessly included in the national inventory.
3. A refined “managed land” delineation following IPCC good practice guidance that was developed in cooperation with EPA and university cooperator.
Research relevant to forest carbon baselines continued throughout the FIA program both within USDA and with our partner Federal agencies. Notably, a number of FIA scientists continued multiyear NASA research projects. FIA led an effort that included White House CEQ, State Department, EPA, USGS, and NOAA on disturbance attribution for carbon reporting.
FIA co-led the carbon projections for the United States for— 1. Adoption of a refined forest
carbon accounting
develop LIDAR-biomass predictive models. NEW: Continue implementing the ForCaMF, helping NFS include carbon assessment in the planning process as mandated by the Climate Change Performance Scorecard and the new Planning Rule. Contact: Gretchen Moisen, IW-FIA. NEW: Initiate collaborative project translating forest change to carbon emissions/removals linking disturbance products, biomass maps, and carbon cycle modeling in a comprehensive carbon monitoring framework (RMRS). Contact: Gretchen Moisen, IW-FIA. A number of improvements are expected for the 2016 National Greenhouse Gas Inventory:

Draft 2014 Annual Report 02/26/15
63
framework that focuses more on annual inventory data within a “backcasting” and “forecasting” model driven by changes in stand age, forest area, and carbon densities.
2. The ability to estimate the effect of land use change on our forest carbon baselines.
3. The ability to attribute changes in forest carbon to disturbances.
4. The incorporation of P3 soils carbon information.
5. Refinement of live tree biomass estimates through development of new belowground biomass equations that incorporate climatic variables.
6. Increased flexibility to include emerging data from the ICE program and P2+ efforts. Delivery to USDA, White House CEQ, and EPA. Documentation is in two papers (scientific reports paper listed previously, and Wear and Coulston—submitted to PNAS).
Experimental Forests and Ranges
Limited activity on select forests regionally may be conducted in FY 2014 as part of ongoing studies.
SRS installed approx. 150 plots on three southern experimental forests; examined their representativeness to the broader southern landscape; examined methods to extend knowledge gained to the broader southern landscape. Published two peer-reviewed papers on this effort.
Projects will continue on an ad hoc basis.
Information Management and Distribution—FIDO

Draft 2014 Annual Report 02/26/15
64
Develop automated QA scoring system and reporting to document FIA data quality.Conduct training webinars. Make necessary changes to implement “growth accounting” for attributes that customarily change between measurements. Continue to update documentation, databases, and tools to support users’ changing needs. Complete and post an addendum to FIADB User Guide 1.5.1.06. Begin work on FIADB User Guide based on version 6.0 of the National Core Field Guide. Implement EVALIDator general online tool improvements.
Throughly documented field and analytical QA check procedures. Provided detailed scoring application specifications to Information Management. Developed SRS prototype system but it has not been deployed nationally. Completed necessary changes. Conducted national training webinars and locally focused on FIA.edu data workshops. Completed and posted an addendum to FIADB User Guide 1.5.1.06. Completed and posted FIADB 6.0.1 User Guide based on version 6.0 of the National Field Guide. Modified EVALIDator to use growth accounting for ratio estimates using net growth, removals, or mortality.
Complete FIA process documentation for distribution. Developers will design check-scoring application and analytical QA tools. SRS will initiate a beta version in FY 2015. Implement growth accounting; enhance GRMs by adding macroplot remeasurement, biomass estimates, and carbon estimates. Conduct data outreach via Web, tools, and hands-on workshops. Conduct training webinars as needed. Begin work on FIADB User Guide based on version 7.0 of the National Field Guide. Continue to implement EVALIDator general online tool improvements.
Information Management and Distribution—MIDAS
Continue implementing National Core Field Guide version 6.0 for field data collection (modify as necessary). Assess user needs and upcoming changes for implementation in National Core Field Guide version 7.0. Prepare for implementing more complete ownership information.
Implemented National Core Field Guide version 6.0 for field data collection.
Continued work with the CIO to update MIDAS to improve data error and anomaly checks.
Continued work on a national information system for plot ownership information.
Prepare for implementing more complete ownership information. Begin programming MIDAS for changes to be implemented in version 7.0 of the National Core Field Guide.
Information Management and Distribution—NIMAC
Conduct FIA field training in Vietnam for representatives from Vietnam. Conduct FIA portable-data recorder
NIMAC and other FIA units provided technical assistance on monitoring and processing forest carbon data to Bangladesh (new), Columbia,
Conduct posttraining review with representatives in Mexico.

Draft 2014 Annual Report 02/26/15
65
programming training for representatives from Canada and Mexico in Houston, TX. Process and make completed panels of data available with EVALIDator for Missouri and Wisconsin and complete the Web applications using FIDO for Wisconsin. NIMAC will continue to assist Indiana as needed with data processing software and creating EVALIDator databases for their use. NIMAC will release the second versions of DATIM for use and will begin developing version 3 for use within the Forest Service. NIMAC will continue to provide technical assistance and software tools in three continents (Africa, Asia, and South Americas) as part of the SilvaCarbon effort. Conduct FIA training for representatives from Honduras in Knoxville, TN.
Ecuador, Peru, and Vietnam and in regional workshops in Asia and Latin America as part of the interagency SilvaCarbon effort. Also provided technical assistance to Honduras and Mexico. Completed December 2013.[unclear which project was completed] Processed and made the second remeasured panel of data available to Wisconsin DNR. NIMAC continued to provide assistance to Indiana DNR on an as-needed basis. Version 1.5 of DATIM was installed on Forest Service servers. Version was nearly complete and is being installed now. NFS continues to fund its development and restored some of the reduced funding. The data are available in PC EVALIDator. Because of continued delays in FIDO, we agreed to drop FIDO. Provided Missouri with their first three panels of data in PC EVALIDator. NIMAC has two new agreements: (1) Massachusetts DCR is funding NIMAC to make its permanent plot data from the 1950s to the present available for analysis in PC EVALIDator and (2) the Northeastern Region of the U.S. Fish & Wildlife Service is having NIMAC develop an intensive forest inventory system for the 500,000+ acres of refuges. In collaboration with the FAO of the U.N., NIMAC has developed data collection and data processing software for international use.
Process and make completed panels of data available with EVALIDator for Missouri and Wisconsin and continue to provide assistance to Indiana DNR on an as-needed basis. NIMAC will deliver Massachusetts inventory data in PC EVALIDator and will train them on how to load new data and analyze the database using PC EVALIDator. Release the second and third versions of DATIM for use within the Forest Service and will begin developing version 4 for all FIA customers. NIMAC will complete the information needs and sampling and plot designs for the U.S. Fish & Wildlife Service in the Northeastern Region. NIMAC will continue to provide technical assistance and software tools in three continents (Africa, Asia, and South America) as part of the SilvaCarbon effort.

Draft 2014 Annual Report 02/26/15
66
Information Management and Distribution—NIMS-CS
Continue implementing NIMS-CS and FIADB version 6.0 at the data center.
Implemented NIMS-CS and FIADB version 6.0 at the national data center. Began detailed documentation of NIMS-CS data tables.
Continue implementing NIMS-CS and FIADB version 6.0 at the national data center. Continue the effort to document NIMS-CS data tables. Begin work to implement NIMS-Cs and FIADB version 7.0.
FIA Atlas Project
Complete new policy and technical reviews with WO and USDA. Complete design and layout of remaining features. Print FIAtlas for release at IUFRO World Congress in Salt Lake City, UT. Develop prototype Web delivery tools.
Delivered briefings to WO and USDA leadership, including the Under Secretary and his Deputy. Completed design and layout of three-fourths of the features matching new WO standards. Released Web portal at IUFRO World Congress. Selected ESRI as online data delivery solution and developed three features in partnership.
Complete new policy and technical reviews with WO and USDA. Complete design and layout of remaining features. Print FIAtlas. Complete development and delivery of companion Web content through increased collaboration with ESRI.
Collaboration and Partnerships
Continue collaborative stewardship of the FIA program by holding users group meetings in all regions of the country and at the national level and holding regional management team meetings in all regions of the country. Pending final Farm Bill legislation, release final FIA strategic plan with regional user input in March 2014. Begin planning for FIA Science Symposium in 2015.
Held a total of two users group and management team meetings in all regions of the country. NRS held a regional management team meeting in 2014. Completed the new FIA strategic plan with regional user input and delivered to agency and USDA on time. Organized the steering committee, identified potential venues and dates, and developed draft agenda for FIA Science Symposium.
Continue collaborative stewardship of the FIA program by holding users group meetings in all regions of the country and at the national level and holding regional management team meetings in all regions of the country. Answer questions regarding the strategic plan for Congress and stakeholders. Finalize FIA Science Symposium arrangements, organize invited and proposed sessions and papers, publish proceedings, prepare to host meeting in early FY 2016.
CEQ = Council on Environmental Quality. CIO = chief information officer. CMS = Change Monitoring System.
CONUS = contiguous United States. DATIM = Design and Analytical Tools for Inventory and Monitoring. DCR = =
Department of Conservation and Recreation. DNR = Department of Natural Resources. EPA = Environmental

Draft 2014 Annual Report 02/26/15
67
Protetion Agency. FAO =Food and Agriculture Organization of the United Nations. FIA = Forest Inventory and
Analysis. FIADB = Forest Inventory and Analysis Database. FIDO = Forest Inventory Data Online. ForCaMF = Forest
Carbon Management Framework. FRA = Forest Resources Assessment. FY = fiscal year. GNN = Global Nearest
Neighbor. GPS = Global Positioning System. GRM = Growth, Removals, Mortality. ICE = Image-Based Change
Estimation. IPPC = Intergovernmental Panel on Climate Change. IUFRO = International Union of Forest Research
Organizations. IW = Interior West. Landsat = a remote sensing platform. LCMS = Landscape Change Monitoring
System. MRV = [?]. NAFD = North American Forest Dynamics. NASA = National Aeronautics and Space
Administration. NCLD = National Landcover Dataset. NFS = National Forest System. NIMAC = National Inventory
and Monitoring Applications Center. NIMS = National Information Management System. NIMS-CS = NIMS
Compilation System. NLCD = National Land Cover Dataset. NOAA = National Oceanic and Atmospheric
Administration. NRS = Northern Research Station. NWOS = National Woodland Owner Survey. OMB = Office of
Management and Budget. OPBA = Office of Planning and Budget Analysis. P1 = Phase one. P2 = Phase two. P3 =
Phase three. PNAS = Proceedings of the National Academy of Sciences. PNW = Pacific Northwest Research Station.
QA = quality assurance. REIS = Regional Economic Information System. RMRS = Rocky Mountain Research Station.
RPA = Resources Planning Act. RSAC = Remote Sensing Applications Center. TIMO = Timberland Investment
Management Organization. TPO = timber product output. USDA = U.S. Department of Agriculture. USGS = U.S.
Geological Survey. WO = Washington Office.

Draft 2014 Annual Report 02/26/15
68
Fiscal Year 2015 FIA Program Direction The FY 2015 budget, as in many recent years, has considerable uncertainties. The FY
2015 budget totals $70.0 million, all in R&D, which approximates the FIA budget high-
water mark in FY 2010 of $71.8 million. The FIA program will continue inventory
operations in 49 States, coastal Alaska, and the Tanana Valley of interior Alaska (fig. 22).
Other major activity planned for 2015 includes full compliance of State 5-year reports,
completing publication of the recent iteration of the NWOS, modernizing the program’s
TPO operations and reporting, continued implementation of the Image-Based Change
Estimation, or ICE, project for improving land cover and land use classification, and
publishing the FIAtlas. FY 2015 funding also continues to eliminate all but ad hoc
support for FIA-related research at Experimental Forests and Ranges for long-term
monitoring needs.
Figure 22. Planned FIA implementation status, FY 2015.
FIA = Forest Inventory and Analysis. FY = fiscal year.
Long-Term Strategic Direction
The FIA program initially intended to implement the Strategic Plan for Forest Inventory
and Analysis by achieving a base Federal program of 10 percent per year in the West and
15 percent per year in the East by FY 2003. Aggressive partners’ financial support has
enabled FIA to achieve full implementation and 5-year cycles throughout most States
from the Great Plains eastward. This support has been impacted as Federal budgets
continue to fluctuate, causing partners to provide less matching funding. Stronger Federal
Other islands(periodic)
Not implemented
American Samoa
Guam
Palau
Puerto Rico
Virgin Islands
Commonwealth
of the Northern
Mariana Islands
Federated States
of Micronesia
Republic of the
Marshall Islands
Annualized FIA
Periodic FIA

Draft 2014 Annual Report 02/26/15
69
support is needed to continue and expand as partners find exceptional value in leveraging
Federal resources to provide improved information and service to their constituents.
The Government Performance and Results Act (GPRA) of 1993 directs Federal entities to
develop long-term goals and performance measures to monitor progress toward those
goals. Although intended for application at the agency level, the GPRA framework also
provides an excellent tool for guiding progress at the project level. The following table
shows our key goals, performance measures, and benchmarks for the FIA program for
2008 through 2014 and targets for a fully implemented program. In future business
reports, we will repeat this table to show how we are progressing toward our goals.
In late 2013, FIA began drafting a new strategic plan to update the current plan that was
published in 2007 in response preliminary language that eventually formed the text of the
recently passed Farm Bill and its requirements for FIA. The new plan is forward looking
and attempts to balance emerging client demands for new information, tools, and values
with necessary decisions on priorities and budget constraints. The new FIA strategic plan
was developed in cooperation with partners and stakeholders and identifies the base
program, potential enhancements to the base, priorities for new programs, and areas for
increased flexibility in the future. The final plan was delivered to the agency and USDA
in mid-2014 for review and submission to Congress.
Passage of the 2014 Farm Bill and FIA Requirements: On February 7, 2014, Congress
passed the Agricultural Act of 2014 (Public Law 113-79), also referred to as the 2014
Farm Bill. Section 8301of this legislation requires the Forest Inventory and Analysis
program to revise its previous Strategic plan, approved by Congress in 1999, and submit
the new plan to the Committee on Agriculture of the House of Representatives and the
Committee on Agriculture, Nutrition, and Forestry of the Senate within 180 days of the
passage of the law.
Farm Bill provisions to be addressed in the revised strategic plan:
1. Complete the transition to a fully annualized forest inventory program and
include inventory and analysis of interior Alaska. 2. Implement an annualized inventory of trees in urban settings, including the
status and trends of trees and forests, and assessments of their ecosystem
services, values, health, and risk to pests and diseases. 3. Report information on renewable biomass supplies and carbon stocks at the
local, State, regional, and national levels, including by ownership type. 4. Engage State foresters and other users of information from the forest inventory
and analysis in reevaluating the list of core data variables collected on forest
inventory and analysis plots with an emphasis on demonstrated need. 5. Improve the timeliness of the TPO program and accessibility of the annualized
information on that database. 6. Foster greater cooperation among the FIA program, research station leaders, and
State foresters and other users of information from the forest inventory and
analysis.

Draft 2014 Annual Report 02/26/15
70
7. Promote availability of and access to non-Federal resources to improve
information analysis and information management. 8. Collaborate with the Natural Resources Conservation Service, NASA, National
Oceanic and Atmospheric Administration, and U.S. Geological Survey to
integrate remote sensing, spatial analysis techniques, and other new technologies
in the FIA program. 9. Understand and report on changes in land cover and use. 10. Expand existing programs to promote sustainable forest stewardship through
increased understanding, in partnership with other Federal agencies, of the more
than 10,000,000 family forest owners, their demographics, and the barriers to
forest stewardship. 11. Implement procedures to improve the statistical precision of estimates at the sub-
State level.
FIA Backdrop: During its entire history of more than 80 years, FIA has cost the U.S.
taxpayers a grand total of about $1 billion. During that time, billions of dollars have been
invested by forest industries and tens of thousands of jobs created from logging; primary
wood processing; and manufacturing, construction, and retail sales of wood-based
products. Since 2000, FIA has provided grants totaling in excess of $168 million to
partners, including States, dozens of universities, and NGOs, to collect data, conduct
research, and perform analyses to improve program efficiency and support client
information needs. Since 2000, FIA partners have contributed more than $116 million to
leverage the program to collect and process more data and information to meet local
needs. FIA is a proven, cost-efficient partnership program that has consistently delivered
significant value added to the taxpayers for more than eight decades. The following
summaries outline the range of implementation opportunities provided in the new
strategic plan. In the coming year, Congress will review these options, ask questions, and
suggest adjustments that will determine its future support for the FIA program.
OPTIONS A and B, Status quo Option: This option maintains the 7-year East (15
percent), 10-year West (10 percent) paradigm for measurement, and these combined
options place the program at the previous strategic plan target funding level.
OPTION C, National Core Option: This option maintains the 7-year East (15
percent), 10-year West (10 percent) paradigm for measuring base plots with improved
remote-sensing support plus continuing the timber product output and ownership
studies with enhancements and urban forest survey.
OPTIONS D and E, Full Farm Bill Option: This option implements the full 5-year
(20 percent) measurement program nationally for base plots with improved remote
sensing, continued timber product output and ownership studies with enhancements,
and all the other items except small-area estimation based on sample intensification.
OPTION F, Leveraged Partner Option: This option is a partner opportunity.
Currently States and other partners contribute more than $7 million annually to
intensify data collection, research, and analyses to improve estimates for smaller
planning areas. FIA processes, maintains, and distributes the enhanced data and
information.

Draft 2014 Annual Report 02/26/15
71
___________________________________________________________________________________ FIA = Forest Inventory and Analysis. NRIS = Natural Resource Information System. 1 Revised percentages based on new congressional target of $77,761,000 (prior to 2014 Farm Bill).
Goal Performance measure
2009 level (%)
2010 level (%)
2011 level (%)
2012 level (%)
2013 level (%)
2014 level (%)
Target level (%)
Inputs
Maintain sufficient
funding to support
the base Federal
FIA program1
Percentage of total
Federal funding
necessary for
annualized inventory
received
87
90
92
89
85
100
Outputs
Include 100
percent of U.S.
forest lands in the
FIA sample
population
Percentage of
Nation’s forest land
included in the target
FIA sample
population
100 100 100 100 100 100 100
Keep fieldwork
current
Percentage of States
actively engaged in
the annualized
inventory program
94
98
100
100
100
100
Make data
accessible to
national forest
customers
Percentage of
national forest land
for which FIA data
are loaded into NRIS
92 100 100 100 100 100
Outcomes
Keep analysis
current
Percentage of States
with FIA State
report less than 6
years old
76 74 92 88 90 100
Keep online data
current
Percentage of States
with FIA online data
less than 2 years old
90 84 92 92 96 100
Customer
satisfaction
Percentage of
customers rating
service as
satisfactory or better
85 87 87 87 87 100
Partners’
participation
Partners’ financial
contributions
expressed as
percentage of total
program funds
9 10 11 13 10 20
Draft 2014 Annual Report 02/26/15
72
Conclusions We continue to operate in a new era of partnership and collaboration in which Federal
and State agencies and other colleagues work together to plan, manage, implement, and
continually improve the FIA program. We are gathering and disseminating information
on a wider array of ecological attributes, while continuing to serve our traditional
customers who require timely information on forest resources. We are increasing the
timeliness of our surveys and of our reporting to provide a continually updated, publicly
accessible information base that includes meaningful reports, analyses, and elemental
data for others to use. We are exploring and using the latest technology to expand the
scope of our products and to deliver them more efficiently. We are also openly reporting
on our progress, accomplishments, successes, and challenges.
In summary, we are committed to working collaboratively with our partners to deliver the
best program possible with the resources that we have at our disposal. We hope this
report gives you a transparent view of the business practices of the FIA program, and we
encourage you to help us improve the program with your feedback

Draft 2014 Annual Report 02/26/15
73
Glossary of Terms Used in Appendixes base Federal FIA program. A level of FIA program delivery that includes sampling 10
percent of base grid (Phase 2) plots per year in the Western United States, 15 percent of
base grid plots per year in the Eastern United States with data compiled and made
available annually and complete State analyses done every 5 years. A subsample of these
plots also provides data on key ecosystem health indicators.
base grid plots sampled. The base grid consists of one sample location per
approximately 6,000 acres (Phase 2) and one location per approximately 96,000 acres
provides data on key ecosystem health indicators. Some partners chose to intensify
beyond the base grid.
buy down. Plots installed at State expense to reach 20 percent implementation level of
the base grid.
core reports. A class of publications that summarizes forest status and trends for a
complete administrative unit, such as a whole State or a national forest. Examples include
survey unit reports, State statistical or analytical reports, or national forest reports.
Congressionally required 5-year State reports are part of the FIA’s core reporting.
direct expenses. All expenses directly attributable to the FIA unit incurred as a part of
doing FIA business. Excludes indirect business costs (such as rent, telephones, and
administrative overhead outside the FIA unit staff), which are included in the “effective
indirect expenses” definition. Includes work done for other units as a normal part of FIA
business and the following items:
equipment. Costs for durable goods used for FIA. Includes the following—
computer/telecommunications. Computer hardware, software, communications
costs.
imagery. Aerial photos, satellite imagery data files.
field equipment. Measurement tools and equipment, such as data recorders, carried
by field crews.
other. Any cost that does not fit into one of the previous equipment categories.
vehicles. All vehicle costs, including items such as operating costs, depreciation, and
leases.
grants and agreements. Cost of cooperative grants and agreements that directly
support the FIA mission.
office space and utilities. Charges for rent, lease, or other real estate costs for FIA

Draft 2014 Annual Report 02/26/15
74
staff, plus utilities.
other direct expenses. Any cost that does not fit into one of the previous categories,
including training costs, unemployment, office supplies, postage, awards, moving
expenses, and other expenses related to delivering the FIA program.
publications. Costs for laying out, editing, printing, and distributing publications.
salary. Includes direct salary and costs, plus benefits charged to the FIA unit, broken
into the following categories:
administration. Program manager, project leader, and clerical staff.
analysts. Staff who analyze data and write publications.
Phase 1 production. Aerial photo-interpreters, satellite image analysts engaged
in Phase 1 stratification.
data collection. All staff spending at least 50 percent of their time measuring
regular plots.
field support. Field-crew supervisors who spend less than 50 percent of their
time measuring plots; others involved in supporting and coordinating field crews.
information management. Programmers, data compilers, computer system
support staff.
QA (quality assurance) crews. All staff spending at least 50 percent of their time
doing QA fieldwork.
techniques research. Mainly research staff who conduct FIA-related research on
methods and techniques.
travel. Broken into the following categories:
field/QA travel. Travel costs for field crews and QA crews.
office travel. Travel costs for all staff except field crews and QA crews.
effective indirect expenses. Indirect expenses include items such as research station
management and administrative salaries, operating expenses, research station budget
shortfalls, and other items for which the FIA unit is assessed by their research station.
Each station has its own means for determining these assessments. Rather than
reporting the different rates, we simply calculate the “Effective Indirect Expenses”
item by subtraction:

Draft 2014 Annual Report 02/26/15
75
Effective indirect expenses = (total available funds) – (total direct FIA expenses +
end of year balance)
effective indirect rate. Effective indirect expenses divided by total available funds,
which is not necessarily the same as the standard station overhead rate; instead this
rate reflects the total indirect cost as a fraction of the total funds available to FIA.
ecosystem indicators. Data collected on a subset of Phase 2 sample locations, previously
referred to as Phase 3, measured for a more extended set of ecosystem attributes,
including tree crown condition, lichen community diversity, soil data, and down woody
debris.
FRIA (Forest Resource Inventory and Assessment). An account created by Congress
within the State and Private Forestry portion of the Forest Service budget to provide
funds to support forest inventory and analysis collaboration with States. This account was
permanently zeroed out in FY 2013.
FY (end-of-the-year) balance. Funds reported in the previous fiscal year business report
as unspent at the end of that fiscal year and presumably available for use in the current
fiscal year.
intensification. Plots installed at the expense of State, National Forest System, or other
partner to achieve higher quality estimates for smaller areas or to buy the base Federal
sample down to a 5-year cycle.
management meetings held. Number of national or regional management team meetings
held by each Forest Inventory and Analysis (FIA) unit. A management team for each FIA
region consists of partners who share in funding and implementing the FIA program. The
team typically consists of representatives from the FIA unit, NFS regional offices, S&PF
offices, and State forestry agencies.
NGO (nongovernmental organization). A class of customers with whom FIA staff are
asked to consult. Includes environmental organizations, professional societies, and other
generally nonprofit organizations.
NIPF (nonindustrial private forest land owners). Private individuals or organizations
that own forest land for purposes other than industrial operations.
percentage of full funding. Total available funds divided by the funding needed to fully
implement the base Federal program for a given year’s target funding.
percentage of region covered by annual FIA. Sum of forested acres in States currently
implementing annual FIA, divided by the total number of forested acres in each FIA
region; a measure of the degree to which the FIA region has moved from periodic to
annual inventory.
Draft 2014 Annual Report 02/26/15
76
percentage of total plots sampled. Total number of base grid plots sampled divided by
the total number of plots in the base grid. In the East, the current target is 15 percent and
in the West 10 percent annually as set by Congress.
Phase 1. Stratification of the land base into forested and nonforested classes by using
remotely sensed imagery (aerial photographs or satellite imagery). Done to increase the
efficiency of fieldwork and estimation.
Phase 2. A set of sample locations, approximately 1 for every 6,000 acres of land,
measured for basic mensurational forest attributes.
Phase 3. This term is no longer used; see ecosystem indicators.
publications. Number of publications per unit, by type of publication, as reported in
official agency attainment reports. Publications are among the major outputs of the FIA
program. Types of publications include the following:
core reports. A report pertaining to reporting inventory results for a complete
geographic entity. Includes the following:
national forest reports. A complete analysis for a single national forest.
national report. A report for the entire Nation, such as the Resource Planning
Act report.
regional reports. A report for a group of States or other contiguous unit larger
than a single State, such as a regional assessment.
State resource reports. A complete statistical or analytical summary of the
forested resources within a single State.
State timber product output (TPO) reports. A complete analysis of TPO data
for a single State.
other. Publications that do not fit into any of the previous categories, such as
abstracts, books, or other government publications.
other station publications. A manuscript published by the Forest Service, for
example, a general technical report.
peer-reviewed journal articles. An article appearing in a refereed or peer-
reviewed journal.
proceedings papers. An article appearing in the proceedings from a meeting or
symposium.

Draft 2014 Annual Report 02/26/15
77
significant consultations. Cases in which an FIA staff person spent at least 1 hour in
discussion, analysis, or research to address a specific question or need raised by an
external FIA program customer, and which is not part of our normal course of business in
collecting, analyzing, and reporting FIA information.
total available funds. Total funds available for delivering the FIA program, including
funds appropriated by Congress for the FIA program, other funds made available by
Forest Service partners, and previous year carryover funds. These funds are a measure of
Federal funding for the base Federal program.
users group meetings held. Number of users group meetings sponsored or attended by
each FIA unit. A users group meeting is an open meeting in which a complete regional
cross-section of FIA partners and customers are invited to attend. Users group meetings
differ from the usual smaller meetings with one or two partners that all FIA units call as a
normal course of business.

Draft 2014 Annual Report 02/26/15
78
Appendix A. Contacts For information about the status and trends of America’s forests, please contact the
appropriate office below.
All our regional Internet home pages and a wealth of statistical and other information are
available through the national FIA home page at http://www.fia.fs.fed.us.
Northern FIA Program
Program Manager, FIA
USDA Forest Service
NorthernResearch Station
1992 Folwell Avenue
St. Paul, MN 55108
651–649–5139
Rocky Mountain Interior West FIA Program
Program Manager, FIA
USDA Forest Service
Rocky Mountain Research Station
507 25th Street
Ogden, UT 84401
801–625–5407
Southern FIA Program (includes Commonwealth of
Puerto Rico and the U.S. Virgin Islands)
Program Manager, FIA
USDA Forest Service
Southern Research Station
4700 Old Kingston Pike
Knoxville, TN 37919
865–862–2000
Pacific Northwest FIA Program
Program Manager, RMA (FIA)
USDA Forest Service
Pacific Northwest Research Station
620 SW Main St., Suite 400
Portland, OR 97205
503–808–2034
National FIA Program Office
National Program Leader, FIA
USDA Forest Service
201 14th
Street, SW
Washington, DC 20250
703–605–4177

Draft 2014 Annual Report 02/26/15
79
Figure A-1 FIA regions and headquarters.
FIA = Forest Inventory and Analysis.
Appendix B. Tables Table B-1. Performance measures for the FY 2014 FIA program.
Table B-2. Financial statement for the FY 2014 FIA program Federal funds.
Table B-3a. Federal staffing (FTEs) for the FY 2014 FIA program.
Table B-3b. Estimate of cooperator staffing funded by FIA grants and agreements (FTEs) for the FY
2014 FIA program.
Table B-3c. Estimate of total Federally funded staffing (FTEs) for the FY 2014 FIA program.
Table B-4. Partners’ contributions toward implementing FIA in FY 2014.
Table B-5. Grants and agreements entered into by FIA units, FY 2014.
Table B-6. Number and hours of significant consultations by FIA staff by customer group, FY 2014.
Table B-7. FIA data access by online tools and Spatial Data Services Center requests, FYs 2003–14.
Table B-8. Mill, fuelwood, and ownership surveys processed and utilization sites visited, FYs 2000–
14.
Table B-9. Forest health indicator, year of initiation, and number of samples collected, FYs 2000–14.
Table B-10. Status of FIA special project areas excluded from annualized inventory.
Table B-11. Land and forest area and FIA annualized implementation status by State and region, FYs
2007–14.
Table B-12. FIA summary statistics and performance measures, FYs 2007–14.
National Headquarters
Field Headquarters
Pacific
Caribbean
Hawaii
American Samoa
Commonwealth
of the Northern
Mariana Islands
Federated States
of Micronesia
Guam
Palau
Republic of the
Marshall Islands
Commonwealth
of Puerto Rico
Virgin Islands
Rocky Mountain
Interior West
FIA Region
Northern FIA Region
Pacific
Northwest
FIA Region
Southern FIA Region

Table B-1. Performance measures for the FY 2014 FIA programPacific Interior National
Northwest Westa Southern Northern Office TotalTotal available federal funds, FY 2014 $13,291,460 $14,206,767 $16,408,134 $15,723,000 $10,253,000 $69,882,361
Total appropriated federal funds, FY 2014 $13,280,000 $13,316,000 $14,428,000 $15,528,000 $10,253,000 $66,805,000 Estimated % of FY 2014 full fundingb 89%/76% 89% 86% 89% 92% 86%
Contributions from partners: Supporting the 20% FIA program $670,000 $294,695 $1,844,842 $1,014,485 $0 $3,824,022 Value-added contributions $360,508 $775,802 $571,523 $2,301,474 $0 $4,009,307 Total contributions $1,030,508 $1,070,497 $2,416,365 $3,315,959 $0 $7,833,329Total all available funds, FY 2014 $14,321,968 $15,277,264 $18,824,499 $19,038,959 $10,253,000 $77,715,690
Base grid plots sampled (Federal 7/10 cycle): Forestb 2,193 2,377 5,534 5,291 - 15,395 Nonforest 2,359 6,495 4,302 7,677 - 20,833 Total base plots 4,552 8,872 9,836 12,968 - 36,228
Spatial and temporal intensification plots sampled: Forestb 1,147 - 1,476 1,771 - 4,394 Nonforest 44 - 705 2,512 - 3,261 Total intensification plots 1,191 - 2,181 4,283 - 7,655
Base grid plots sampled (Federal and partner): Forest b 3,340 2,377 7,010 7,062 - 19,789 Nonforest 2,403 6,495 5,007 10,189 - 24,094 Total base grid plots 5,743 8,872 12,017 17,251 - 43,883
Forest plots with one or more health indicato 3,299 2,416 1,115 396 7,226
Number of quality assurance plots (field checked) Forest 160 227 702 440 - 1,529 Nonforest 2 19 277 485 - 783 Total quality assurance plots 162 246 979 925 - 2,312 Percent forested quality assurance plots 5% 10% 10% 6% 8%
Special Study plots sampled: Forestb 156 95 160 39 - 450 Nonforest 5 12 4 2 - 23 Total Special Study plots 161 107 164 41 - 473
Total base grid plots and percent sampledc : Total base grid plots 41,463 91,341 89,205 101,342 323,351 Average percent of land with forest cover 37% 23% 46% 30% 36% Estimated percent of base grid sampled 14% 11% 13% 17% 13%Percentage of States with annual FIA activity 100% 100% 100% 100% 100%
Number of publications: National forest reports - 9 - - 9 State/island resource reports - - 12 23 - 35 State timber product output reports - 3 13 2 - 18 Regional reports - - 4 1 - 5 National reports 1 - 10 1 1 13 5-Year State reports - 1 3 3 - 7 Subtotal--core reports 1 13 42 30 1 87
Peer-reviewed journal articles 15 15 23 34 - 87 Proceedings articles - 8 6 7 - 21 Other station publications 8 5 - 4 - 17 Other publications 3 3 - 15 1 22 Total, all reports 27 44 71 90 2 234
Number of publications per federal FTE 0.31 0.46 0.86 0.93 0.57 0.64
Consulting activities: Number of significant consultations 101 224 450 208 33 1,016 Total hours of significant consultations 810 1,561 2,349 3,102 166 7,987
Meetings: User-group meetings held 2 3 0 1 1 7 Management meetings held 2 1 2 1 1 7
a A unit of the Rocky Mountain Research Station.b Includes only plots where trees were measured, excludes denied access and hazardous plots where no trees measured.c Base grid targets shown are 20 percent of samples per year as stated in the Farm Bill. Congressional conference notes recommended annual federal targets of 15 percent in the East and 10 percent in the West. Interior Alaska as well as the Caribbean and Pacific Island inventories are periodic and excluded from the annualized mandate in compliance with Congressional recommendations.

Table B-2. Financial statement for the FY 2014 FIA program Federal funds
Pacific Interior National Northwest West Southern Northern Office Total
Available funds: - - - - - - - - - - - - - - - - - - - - - - - - - - - - - - Dollars - - - - - - - - - - - - - - - - - - - - - - - - - - - - - Previous year end-of-year balance (100,716) 185,500 263,134 59,500 0 407,418Post-year adjustmentsa 112,176 (185,500) 1,186,000 135,500 0 1,248,176
Subtotal pre-year adjustments 11,460 0 1,449,134 195,000 0 1,655,594FY appropriated funds
Research (base) 13,107,000 13,142,000 14,253,000 15,528,000 10,253,000 66,283,000R&D funds added to baseb 173,000 174,000 175,000 522,000
Subtotal appropriated funds 13,280,000 13,316,000 14,428,000 15,528,000 10,253,000 66,805,000Special project fundingc 0 890,767 531,000 0 0 1,421,767
TOTAL AVAILABLE FEDERAL FUNDS 13,291,460 14,206,767 16,408,134 15,723,000 10,253,000 69,882,361Direct expenses:
Salary-- 6,764,894 7,820,403 7,815,757 9,742,459 416,000 32,559,513Administration 555,220 724,242 580,262 432,950 416,000 2,708,674Phase 1 production 16,758 0 223,450 319,288 0 559,496Field support 1,112,189 902,952 1,048,567 1,018,103 0 4,081,811Data collection 1,893,056 2,530,270 611,351 2,288,648 0 7,323,325Quality assurance 352,446 733,606 1,595,709 610,483 0 3,292,244Information management 1,011,917 942,084 857,382 1,553,283 0 4,364,666Analysis 1,245,810 1,194,048 2,011,963 2,606,659 0 7,058,480Techniques research 577,498 793,201 887,073 913,045 0 3,170,817
Travel-- 583,533 565,881 563,037 452,106 25,000 2,189,557Office travel 111,548 43,109 78,043 69,743 25,000 327,443Field/quality assurance crew travel 471,985 522,772 484,994 382,363 0 1,862,114
Equipment-- 484,138 737,590 319,380 512,104 0 2,053,212Imagery 0 25,401 0 12,487 0 37,888Vehicles 208,731 457,931 243,770 261,747 0 1,172,179Field equipment 133,939 31,458 0 58,569 0 223,966Information technology/communications 141,468 72,541 0 70,948 0 284,957Other 0 150,259 75,610 108,353 0 334,222
Publications 2,253 5,287 7,526 14,510 6,000 35,576Grants and agreementsd 2,203,123 2,222,736 5,760,296 2,482,499 3,036,000 15,704,654
Field work/data 1,542,617 1,363,954 5,075,296 1,713,844 20,000 9,715,711Information management 125,000 21,392 1,941,000 2,087,392Research 660,506 858,782 560,000 747,263 1,075,000 3,901,551
Office space and utilities 829,389 554,431 521,653 561,347 0 2,466,820Other direct expenses 565,315 271,007 136,648 54,675 0 1,027,645
Total direct expenses 11,432,645 12,177,335 15,124,297 13,819,700 3,483,000 56,036,977Effective indirect expenses
Total effective indirecte 1,871,478 1,641,672 1,278,134 1,900,000 6,770,000 13,461,284Total effective indirect rate 14.1% 11.6% 7.8% 12.1% 66.0% 19.3%
End of year (EOY) balance (12,663) 387,760 5,703 3,300 0 384,100TOTAL FEDERAL EXPENSE 13,291,460 14,206,767 16,408,134 15,723,000 10,253,000 69,882,361a Some bookkeeping is not completed until after the new FY begins, which may affect beginning balances. These adjustmentsincluding items such as carryover, return of fire transfer, return of unused prior year grants, Station adjustments, etc. are accounted for here.
c Incudes special funding from NASA and other Federal partners to support FIA monitoring projects.d Grants and Agreements include general allocation of grants to basic thematic categories. e Program-wide charges for Albuquerque Service Center included in National Office indirect expense.
b Mid-year additions to base funding from FIA Washington Office account.

Table B-3a. Federal staffing (FTEs) for the FY 2014 FIA programPacific Interior National
Northwest West Southern Northern Office* TotalAdministration 5.9 7.1 6.0 4.0 2.5 25.5Phase 1 production work 0.2 0.0 3.6 4.0 0.0 7.8Field support 14.9 12.6 9.8 9.5 0.0 46.8Data collection 34.7 38.5 8.6 28.8 0.0 110.6Quality assurance 5.0 8.8 19.6 7.6 0.0 41.0Information management 10.4 8.4 7.9 14.5 0.0 41.2Analysis 11.7 12.9 19.4 22.5 0.0 66.5Techniques research 5.5 6.8 7.7 5.7 1.0 26.7 Total 88.3 95.1 82.6 96.6 3.5 366.1* Techniques person is in unit funded by National Office at Research Triangle Park, NC.
Pacific Interior National Northwest West Southern Northern Office Total
Administration 0.1 1.0 0.0 0.0 1.1Phase 1 production work 0.0 0.0 0.7 0.0 0.7Field support 0.9 1.7 12.0 3.1 0.0 17.7Data collection 10.7 21.9 77.0 30.2 0.0 139.8Quality assurance 0.0 0.2 0.3 0.0 0.5Information management 0.0 0.0 1.0 0.2 6.0 7.2Analysis 2.5 5.6 5.0 3.0 16.1Techniques research 5.0 8.5 5.0 2.0 20.5 Total 19.2 38.9 90.0 44.5 11.0 203.6
Table B-3c. Estimate of total federally funded staffing (FTEs) for the FY 2014 FIA programPacific Interior National
Northwest West Southern Northern Office TotalAdministration 6.0 8.1 6.0 4.0 2.5 26.6Phase 1 production work 0.2 0.0 3.6 4.7 0.0 8.5Field support 15.8 14.3 21.8 12.6 0.0 64.5Data collection 45.4 60.4 85.6 59.0 0.0 250.4Quality assurance crew 5.0 9.0 19.6 7.9 0.0 41.5Information management 10.4 8.4 8.9 14.7 6.0 48.4Analysis 14.2 18.5 19.4 27.5 3.0 82.6Techniques research 10.5 15.3 7.7 10.7 3.0 47.2 Total 107.5 134.0 172.6 141.1 14.5 569.7
Table B-3b. Estimate of cooperator staffing funded by FIA grants and agreements (FTEs) for the FY 2014 FIA program

Table B-4. Partner contributions toward implementing FIA in FY 2014
Unit PartnerContributions
toward the base program
Contributions that add
value- - - - - - - - - Dollars - - - - - - - - -
Interior West Colorado State Forest Service 195,510 0USDA Forest Service Region 1 0 73,800USDA Forest Service Region 2 0 0USDA Forest Service Region 3 0 0USDA Forest Service Region 4 0 25,628
NASA (North American Forest Dynamics Project) 0 149,198
WO Forest Service (for NFS/FIA Carbon study) 0 390,500WO Forest Service (LANDFIRE) 0 96,000Utah Department of Natural Resources 0 1,502University of Montana, Bureau of Business and Economics Research 99,185 0
North Carolina State 39,174IW total 294,695 775,802
National Office 0NO total 0 0
Northern Connecticut Dept of Cons. 500 0Delaware Department of Agriculture 7,770 0Illinois Division of Forest Resources 23,359 0Indiana Department of Natural Resources 59,019 0Iowa Department of Natural Resources 17,645 0Kansas State Forest Service 34,938 0Maine Forest Service 284,819 233,905Maryland Department of Natural Resources Forest Service 12,300 0Massachusetts Department of Conservation and Recreation 8,200 15,000Michigan Division of Forest Management 40,200 0Michigan State University 0 18,750Minnesota Department of Natural Resources 148,724 398,041Missouri Department of Conservation 67,492 0NASA 0 61,790Nebraska Department of Forestry, Fish, and Wildlife 5,853 0New Hampshire Department of Resources & Economic Development 20,400 0New Jersey Forest Service 3,667 0New York Department of Environmental Conservation 19,890 0North Dakota Forest Service 7,200 0Ohio Department of Natural Resources 11,345 0Pennsylvania Department of Conservation & Natural Resources 43,000 5,035Resources Planning Act 0 20,000Rhode Island Department of Environmental Management 3,069 0South Dakota Department of Forestry and Nat. Res. Mgmt. 18,826 0University of Massachusetts 0 53,750University of Missouri 0 18,037University of Minnesota 0 50,321University of Nevada Las Vegas 0 5,348USDA Forest Service Research and Development 0 300,000USDA Forest Service National Forest System 1,667 399,079USDA Forest Service State & Private Forestry 67,000 16,000Vermont Department of Forests, Parks & Recreation 8,600 0

Table B-4. Partner contributions toward implementing FIA in FY 2014
Unit PartnerContributions
toward the base program
Contributions that add
value- - - - - - - - - Dollars - - - - - - - - -
University of Maine 0 18,750West Virginia Division of Forestry 49,300 0American Forest Foundation 0 49,991US Fish and Wildlife Services 0 68,219Enviormental Protection Acency 0 37,626Wisconsin Department of Natural Resources 49,702 515,582Appalachian State 0 10,000University of New Hampshire 0 6,250
NRS total 1,014,485 2,301,474
Pacific Northwest USDA Forest Service Region 5 State and Private Forestry for Palau Forest Inventory 12,000
Palau Forestry Department, Palau Bureau of Agriculture 12,000USDA Forest Service PSW Research Station Grant Award from State and Private Forest Health Program Toward Re-measurement of Hawaii FIA plots for Koa Moth Research
60,027
USDA Forest Service, PNW Research Directors Office for the Civil Rights Advisory Group Research Grant 20,500
University of Guam contributions towards Intensified Grid Plots for Guam Micronesia Challenge 10,000
USDA Forest Service, Region 5 State and Private Forestry Forest Health Program, towards Intensified Grid Plots for Guam Micronesia Challenge
30,000
USDA Forest Service Region 6 for Region Add On Project 45,841USDA Forest Service Region 5 for Region Add On Project 30,140USDA Forest Service, Region 10, Non-forest FIA plot measurements 140,000
USDA Forest Service, Washington Office, Alaska interior pilot inventory 670,000
PNW total 670,000 360,508
Southern Alabama Forestry Commission 130,113 40,000Arkansas Forestry Commission 111,678 122,937Carpenter's Elementary School - signage outdoor learning center 59,600Florida Department of Agriculture and Consumer Services 119,772 0Georgia Forestry Commission 162,069 0International Institute of Tropical Forestry (IITF) 0 100,000Kentucky Division of Forestry 87,867 0Mississippi Forestry Commission 128,891 0North Carolina Dept of Agriculture and Consumer Services 0 40,000Oklahoma Department of Agriculture and Forestry 125,862 11,328South Carolina Forestry Commission 101,597 28,762Tennessee Department of Agriculture 0 0Texas A&M Forest Service 396,530 68,896University of Georgia - Biomass Equation Project 0 0University of Tennessee - "C" Carbon Project modeling 20,387 0University of Tennessee - Information Mgt - Cooperative 0 100,000Virginia Department of Forestry 117,405 0VPI - Assessing NFTP Inventory using FIA Forest Inventory 2,500 0VPI - FIA Biomass & Carbon Data Base 63,000 0VPI - Knowledge Synthesis & Systems Integration Volume & Biomass 249,029 0
VPI - Legacy Data Project 0 0VPI - RPA Land Use Modeling 28,142 0

Table B-4. Partner contributions toward implementing FIA in FY 2014
Unit PartnerContributions
toward the base program
Contributions that add
value- - - - - - - - - Dollars - - - - - - - - -
SRS total 1,844,842 571,523
Grand total, all FIA units 3,824,022 4,009,307

Table B-5. Grants and agreements entered into by FIA units, FY 2014Unit Amount Recipient Purpose
Dollars Interior West 753,626 Colorado State Forest Service Implementation of annual FIA
150,000 North Carolina State University FVS Processing for the Forest Carbon Mgt Framework215,618 University of Montana Timber Product Output (various studies)380,007 Utah State University Forest Carbon Framework (multiple studies)45,000 Utah State University Increment Core Analysis
427,098 Private Contractors (multiple) Implementation of annual FIA10,650 Student Conservation Association Implementation of annual FIA37,580 USFS TEAMS Implementation of annual FIA
135,000 RMRS, Forest and Woodland Ecosystems FIA Soils Indicator Lead and sampling (incl. equip replacement)47,000 RMRS, Forest and Woodland Ecosystems Metegenomics/FIA Study21,157 WO FIA IUFRO
IW total 2,222,736
National Office20,000 Auburn University Tree planting data
125,000 Redcastle Resources Inc RSAC FIA projects200,000 Eastern Forest Environmental Threat Center SRS 4854 EFETAC ISA15,000 Conservation Biology Institute Protected Areas Database50,000 Society of American Foresters Diversity Logic - Carbon Workshop & Silviculture Publication18,000 Society of American Foresters National Users Group
1,858,000 University of Nevada Las Vegas UNLV database agreement400,000 Virginia Tech University Knowledge Synthesis & Systems Integration Volume, Biomass,
Carbon325,000 Remote Sensing Aplication Center FIA Atlas support25,000 Virginia Tech University Forest Inventory & Analysis Report Simulator Phase II
NO total 3,036,000
Northern 17,680 Access Ability Inc. Prefield document imaging services40,000 Appalachian State Carbon Pool Science Understory3,825 Chestnut Ridge Forestry Illinois Missouri Plots
24,169 Chestnut Ridge Forestry New York Plots55,834 Chestnut Ridge Forestry West Virginia Plots30,103 Daniel Huberty North Dakota Plots98,724 Daniel Huberty Kansas Plots37,900 Glenn Summers West Virginia Plots43,000 Government Printing Office Atlas Project85,675 Indiana Department of Natural Resources Implementation of annual FIA
755,653 Maine Forest Service Implementation of annual FIA 21,045 Mark Webb Ohio Plots75,000 Michigan State University FIA Biomass Study
374,897 Minnesota Department of Natural Resources Implementation of annual FIA76,000 Northern Research Station Grand Rapids Soil analyses52,234 Quercus Consultations Inc Nebraska Plots15,300 Rocky Mountain Research Lichen Chemestry Model46,295 South Dakota Dept. of Forestry & Nat. Res.
Mgmt.Implementation of annual FIA
27,997 University of Maine Evaluation for Assessing Current and Future Carbon Stock75,000 University of Maine FIA Biomass Study
128,452 University of Massachusetts NWOS/Family Forest Research Center 14,913 University of Minnesota JAVA Script Visualization Student45,910 University of Minnesota FIA Biomass Estimation Data Access83,900 University of Minnesota Carbon Pool Science (mineral) and Test P3 Remeasurements36,051 University of Missouri Agent Based Modeling36,073 University of Missouri Small Area Estimates21,392 University of Nevada Las Vegas Information Management Support25,667 University of New Hampshire Maximum Stand Density Biomass Carbon at National Scale
100,000 University of New York Syracuse Enhancing ITREE Spatial Simulation33,810 Wilfred Previant Implementation of annual FIA, Michigan
NRS total 2,482,499
Pacific Northwest 1287187 Alaska Boat/Helicopter Contract Implementation of FIA, Alaska 6828 Oregon Department of Forestry Land use, development zone study
223000 University of Montana Implementation of FIA, Timber Product Output studies11800 E.R. Analytical Inc. (2 contracts) Forest health elemental analyses1800 Various contractors (Stone) Alaska forest health implementation7080 Rick Shory Lichen Database development5000 University of AK Vegetation Database development (AKEPIC)

Table B-5. Grants and agreements entered into by FIA units, FY 2014Unit Amount Recipient Purpose
15000 Oregon State University Lichen and bryophyte indicators and roles in forests1215 Utah State University Forest carbon management framework for the national forest system
19964 University of Alaska Growth, mortaility, and climatic impacts via tree ring analysis52218 University of Guam Guam's forest inventory and analysis (FIA) program and Micronesia
challenge's terrestrial monitoring program's forest inventory32519 University of Hawaii FVS-OPCOST: user-friendly FVS simulator to estimate costs of all
types of forest fuels management31950 Arctic Wild LLC Implementation of FIA, Alaska 4378 Sound Telecomm Contract Implementation of FIA, Safety check-in services
15000 Student Conservation Alliance Implementation of FIA1431 USFS Regional Horse Packing Implementation of FIA3451 SPOT LLC Implementation of FIA, Safety check-in services, SPOT devices3000 Satcom Global Implementation of FIA, Safety check-in services, satellite phones
255998 Oregon State University National Biomass Study144002 University of Hawaii Implementation of FIA, Fieldwork and Forest Products Output 18000 University of Washington Carbon monitoring systems integrating field and remote sensing 37520 Oregon State University Support for the landscape change monitoring system24782 Oregon State University Spatial monitoring of forestconditions over regional landscapes
30,000 USDA Forest Service, RMRS Growth and mortality responses to climate via tree ring analysisPNW total 2,203,123
Southern 390,338 Alabama Forestry Commission Implementation of Annual FIA335,035 Arkansas Forestry Commission Implementation of Annual FIA20,000 Auburn, Purdue, Idaho Tree seedling planting survey25,000 Carpenter's Elementary School signage - outdoor learning center
245,000 Coweeta Hydrologic laboratory SRS 4353 ISA359,316 Florida Department of Agriculture and Consumer
ServicesImplementation of Annual FIA
487,985 Georgia Forestry Commission Implementation of Annual FIA65,000 International Institute of Tropical Forestry (IITF) Experimental Forest Study
263,603 Kentucky Division of Forestry Implementation of Annual FIA386,709 Mississippi Forestry Commission Implementation of Annual FIA361,739 North Carolina Dept of Agric. and Consumer
ServicesImplementation of Annual FIA
314,736 Oklahoma Dept of Agriculture Food and Forestry Implementation of Annual FIA304,790 South Carolina Forestry Commission Implementation of Annual FIA327,890 Tennessee Department of Agriculture Implementation of Annual FIA
1,189,477 Texas A&M Forest Service Implementation of Annual FIA & Urban Forestry50,000 University of Tennessee "C" Carbon Project Modeling
100,000 University of Tennessee Information Management - Cooperative research10,000 Virginia Tech University Assessing NFTP Inventory using FIA Forest Inventory Data
140,000 Virginia Tech University FIA Biomass & Carbon Data Base 353,678 Virginia Tech University Implementation of Annual FIA30,000 Virginia Tech University RPA Land Use Modeling
SRS total 5,760,296
Grand total 15,704,654
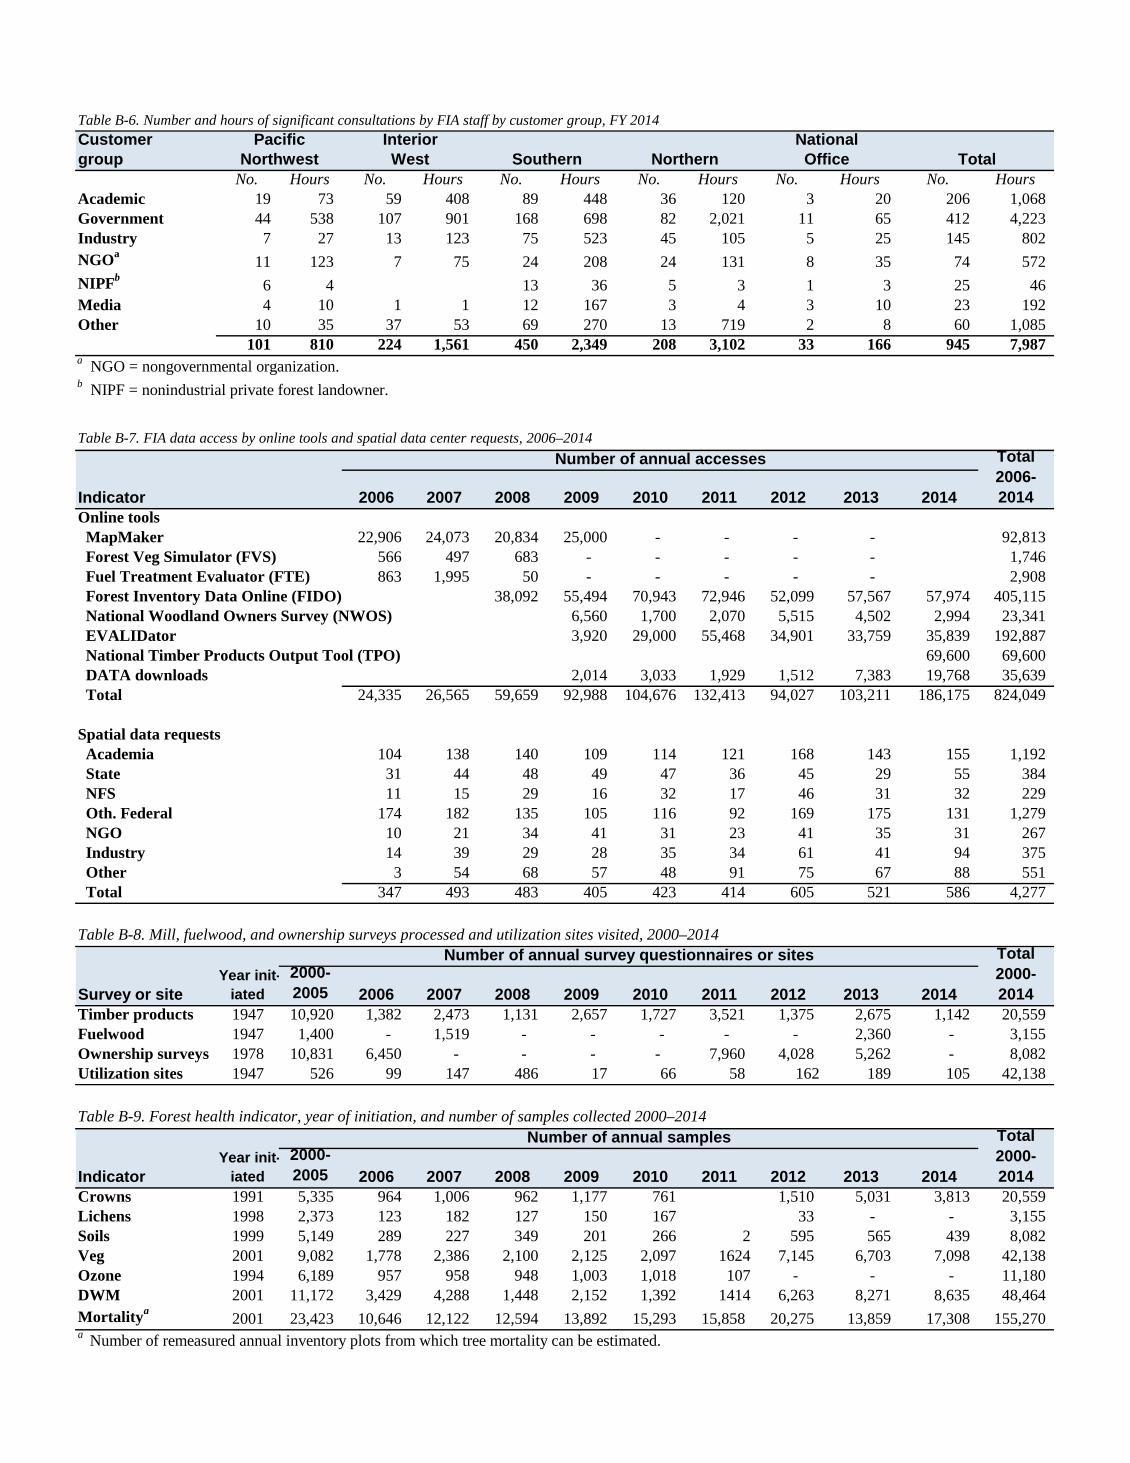
Table B-6. Number and hours of significant consultations by FIA staff by customer group, FY 2014Customer group
No. Hours No. Hours No. Hours No. Hours No. Hours No. HoursAcademic 19 73 59 408 89 448 36 120 3 20 206 1,068 Government 44 538 107 901 168 698 82 2,021 11 65 412 4,223 Industry 7 27 13 123 75 523 45 105 5 25 145 802 NGOa 11 123 7 75 24 208 24 131 8 35 74 572 NIPFb 6 4 13 36 5 3 1 3 25 46 Media 4 10 1 1 12 167 3 4 3 10 23 192 Other 10 35 37 53 69 270 13 719 2 8 60 1,085
101 810 224 1,561 450 2,349 208 3,102 33 166 945 7,987 a NGO = nongovernmental organization.b NIPF = nonindustrial private forest landowner.
Indicator 2006 2007 2008 2009 2010 2011 2012 2013 2014Online tools MapMaker 22,906 24,073 20,834 25,000 - - - - 92,813 Forest Veg Simulator (FVS) 566 497 683 - - - - - 1,746 Fuel Treatment Evaluator (FTE) 863 1,995 50 - - - - - 2,908 Forest Inventory Data Online (FIDO) 38,092 55,494 70,943 72,946 52,099 57,567 57,974 405,115 National Woodland Owners Survey (NWOS) 6,560 1,700 2,070 5,515 4,502 2,994 23,341 EVALIDator 3,920 29,000 55,468 34,901 33,759 35,839 192,887 National Timber Products Output Tool (TPO) 69,600 69,600 DATA downloads 2,014 3,033 1,929 1,512 7,383 19,768 35,639 Total 24,335 26,565 59,659 92,988 104,676 132,413 94,027 103,211 186,175 824,049
Spatial data requests Academia 104 138 140 109 114 121 168 143 155 1,192 State 31 44 48 49 47 36 45 29 55 384 NFS 11 15 29 16 32 17 46 31 32 229 Oth. Federal 174 182 135 105 116 92 169 175 131 1,279 NGO 10 21 34 41 31 23 41 35 31 267 Industry 14 39 29 28 35 34 61 41 94 375 Other 3 54 68 57 48 91 75 67 88 551 Total 347 493 483 405 423 414 605 521 586 4,277
Survey or site2000-2005 2006 2007 2008 2009 2010 2011 2012 2013 2014
Timber products 1947 10,920 1,382 2,473 1,131 2,657 1,727 3,521 1,375 2,675 1,142 20,559 Fuelwood 1947 1,400 - 1,519 - - - - - 2,360 - 3,155 Ownership surveys 1978 10,831 6,450 - - - - 7,960 4,028 5,262 - 8,082 Utilization sites 1947 526 99 147 486 17 66 58 162 189 105 42,138
Indicator2000-2005 2006 2007 2008 2009 2010 2011 2012 2013 2014
Crowns 1991 5,335 964 1,006 962 1,177 761 1,510 5,031 3,813 20,559 Lichens 1998 2,373 123 182 127 150 167 33 - - 3,155 Soils 1999 5,149 289 227 349 201 266 2 595 565 439 8,082 Veg 2001 9,082 1,778 2,386 2,100 2,125 2,097 1624 7,145 6,703 7,098 42,138 Ozone 1994 6,189 957 958 948 1,003 1,018 107 - - - 11,180 DWM 2001 11,172 3,429 4,288 1,448 2,152 1,392 1414 6,263 8,271 8,635 48,464 Mortalitya 2001 23,423 10,646 12,122 12,594 13,892 15,293 15,858 20,275 13,859 17,308 155,270 a Number of remeasured annual inventory plots from which tree mortality can be estimated.
Table B-7. FIA data access by online tools and spatial data center requests, 2006–2014Number of annual accesses Total
2006-2014
Year init-iated
Number of annual samples
Total 2000-2014
Total 2000-2014
Table B-8. Mill, fuelwood, and ownership surveys processed and utilization sites visited, 2000–2014
Table B-9. Forest health indicator, year of initiation, and number of samples collected 2000–2014
Number of annual survey questionnaires or sitesYear init-
iated
TotalNorthernNationalOfficeNorthwest
Pacific Southern
InteriorWest

Table B-10. Status of FIA special project areas excluded from annualized inventoryNumber Year of Year of Total Total Available
Forest Percent of major current published Phase 2 Phase 3 onlineRegion and area area forest islands inventory report plotsa plots dataPacific (PNW): - - - - - Acres - - - - -
American Samoa 48,434 43,631 90 4 2013 2004 21 YesGuam 135,660 63,833 47 1 2013-2014 2004 46 YesPalau 110,028 90,685 82 10 2014 2007 54 YesCommonwealth of the Northern Mariana Islands 75,546 51,009 68 3 2004 2011 35 YesFederated States of Micronesia 161,917 143,466 89 4 2005-2006 2011 73 YesMarshall Islands 33,182 23,230 70 10 2008 2011 44 YesHawaiib 4,141,469 1,990,000 48 8 2010-2019 1988 685 No
Atlantic (SRS):
Commonwealth of Puerto Rico 2,191,815 1,213,205 55 4 2009 2013 287 182 YesU.S. Virgin Islands 82,164 45,163 55 3 2009 2013 48 62 YesTotal 6,980,215 3,664,222 604 47 1,293 244a Partial suite of Phase 3 data collected on all plots in Pacific region. b Hawaii plans to implement annualized design.
Land area in inventory

Table B-11. Land and forest area and FIA annualized implementation status by State and region, FY
Region and State
Bureau of the Census land area
Forest land area
defined by current FIADB
Forest land area defined by 2012 RPA Assessment
Annual inventory entry date
State annualized as of 2013
YearNorthern 606,841 182,325 182,299 24 Connecticut 3,099 1,712 1,712 2003 Yes Delaware 1,247 340 340 2004 Yes Illinois 35,532 4,848 4,848 2001 Yes Indiana 22,929 4,830 4,830 1999 Yes Iowa 35,749 3,014 3,014 1999 Yes Kansas 52,326 2,502 2,502 2001 Yes Maine 19,739 17,660 17,660 1999 Yes Maryland 6,252 2,461 2,461 2004 Yes Massachusetts 4,992 3,024 3,024 2003 Yes Michigan 36,185 20,127 20,127 2000 Yes Minnesota 50,961 17,371 17,371 1999 Yes Missouri 43,995 15,472 15,472 1999 Yes Nebraska 49,167 1,576 1,576 2001 Yes New Hampshire 5,730 4,832 4,832 2002 Yes New Jersey 4,707 1,964 1,964 2004 Yes New York 30,161 18,966 18,966 2002 Yes North Dakota 44,161 760 734 2001 Yes Ohio 26,151 8,088 8,088 2001 Yes Pennsylvania 28,635 16,782 16,782 2000 Yes Rhode Island 662 360 360 2003 Yes South Dakota 48,519 1,911 1,911 2001 Yes Vermont 5,899 4,591 4,591 2003 Yes West Virginia 15,384 12,155 12,155 2004 Yes Wisconsin 34,661 16,980 16,980 2000 YesSouthern 533,031 267,214 244,716 13 Alabama 32,413 22,877 22,877 2001 Yes Arkansas 33,303 18,755 18,755 2000 Yes Florida 34,447 17,461 17,461 2001 Yes Georgia 36,809 24,768 24,768 1998 Yes Kentucky 25,271 12,472 12,472 1999 Yes Louisiana 27,650 14,712 14,712 2000 Yes Mississippi 30,031 19,542 19,542 2007 Yes North Carolina 31,115 18,588 18,588 2003 Yes Oklahoma 43,901 12,646 12,256 2008 Yes South Carolina 19,239 13,120 13,120 1998 Yes Tennessee 26,390 13,942 13,942 1999 Yes Texas 167,188 62,425 40,318 2000 Yes Virginia 25,274 15,907 15,907 1998 YesInterior West 547,691 154,093 124,614 8 Arizona 72,700 18,643 10,795 2001 Yes Colorado 66,331 22,837 19,995 2002 Yes Idaho 52,892 21,448 21,247 2004 Yes Montana 93,149 25,573 25,169 2003 Yes Nevada 70,260 11,169 8,121 2010 Yes New Mexico 77,631 24,840 16,615 2008 Yes Utah 52,589 18,135 11,866 2000 Yes Wyoming 62,140 11,448 10,807 2010 YesPacific Northwest 573,389 215,182 214,605 5 Alaska, Coast 39,041 14,426 14,426 2004 Yes Alaska, Int. 326,575 114,151 114,151 California 99,699 32,618 32,057 2001 Yes Hawaii 4,110 1,748 1,748 2010 Yes Oregon 61,432 29,804 29,787 2001 Yes Washington 42,532 22,435 22,435 2002 Yes
TOTAL 2,260,953 818,814 766,234 - 50Forest area performance measure, excluding interior AK 100%Forest area performance measure, including interior AK 86%State activity performance measure, includes all active States 100%AK = Alaskaa Based on area defined as forest in FIADB plus area defined as forest by 2012 RPA Assessment.
Thousand acres

Table E-1. FIA summary statistics and performance measures, 2007–20142007 2008 2009 2010 2011 2012 2013 2014
AVAILABLE PROGRAM FUNDS Apropriated funds1 63,605 64,641 65,536 71,817 71,452 69,186 65,567 66,805 Other federal funds2 1,272 1,559 3,320 930 856 528 2,668 1,422 Total federal funds 64,877 66,200 68,856 72,747 72,308 69,714 68,235 68,227 Total partner funds 7,204 6,505 6,494 7,516 9,109 10,129 7,772 7,833 Total available funds 72,081 72,705 75,350 80,263 81,417 79,843 76,007 76,060 % Full federal appropriated funding 82% 83% 84% 92% 92% 89% 84% 86%PROGRAM EXPENSES AND BALANCES Administration 3,031 2,785 2,999 3,262 3,233 2,735 2,854 3,036 Image processing 1,300 1,198 1,102 916 724 519 589 597 Field support 3,175 3,357 3,003 3,594 3,917 3,946 4,151 4,082 Data collection3 23,630 22,989 25,243 26,162 27,057 24,387 22,559 23,590 Information management3 7,431 6,108 7,623 7,476 6,794 6,740 5,933 6,737 Analysis 4,518 5,147 5,354 5,357 6,105 6,570 6,695 7,058 Research3 4,799 5,033 5,881 6,903 5,444 6,075 6,690 7,072 Miscellaneous/other 3,454 3,406 3,909 4,473 4,417 3,882 3,652 3,864 Total direct expense 51,338 50,023 55,115 58,143 57,692 54,854 53,124 56,037 Total Indirect expenses 13,194 13,586 12,653 14,189 13,958 14,180 14,704 13,461
Indirect rate 20.7% 21.0% 19.3% 19.8% 19.5% 20.5% 22.4% 20.2% Total federal expense 64,532 63,609 67,768 72,332 71,650 69,034 67,828 69,498 Fire Transfer4 2,318 Total EOY balance 345 273 1,089 415 658 680 407 384 Total federal funds 64,877 66,200 68,856 72,747 72,308 69,714 68,235 69,882 Other measures % States with annual activity 90 94 94 100 100 100 100 100 % States with FIADB 1-2 yrs old 90 90 90 88 94 94 94 96 Federal employees 387 389 381 392 397 372 366 366 Other employees 179 173 201 205 201 203 184 204 Total employees 566 562 582 596 598 575 550 570 P2/3 base forest plots 19,880 18,208 21,545 19,272 21,233 19,673 21,263 19,789 P2/3 base nonforest plots 24,757 29,351 21,996 25,238 27,568 27,131 27,683 24,094 Total plots 44,637 47,559 43,541 44,510 48,801 46,804 48,946 43,883 All QA plots 3,664 4,860 3,597 4,020 4,550 4,417 5,465 2,312 Percent QA plots 8% 10% 8% 9% 9% 9% 11% 5% All publications 135 172 206 203 204 272 238 234 Journal publications 37 65 38 74 62 90 90 87 Percent journal publications 27% 38% 18% 36% 30% 33% 38% 37% Consultations, number 1,571 1,659 1,399 991 1,753 848 824 945 Consultations, hours 5,767 6,656 8,603 10,381 8,584 8,807 8,124 7,987 User/mangement meetings 16 10 11 10 14 15 12 14 Spatial data requests filled 493 483 405 423 414 605 605 586 Online accesses 26,565 59,659 92,988 104,676 132,413 94,027 94,027 186,175 1 Net of rescissions.2 Includes return of previous year carryover, return of fire transfers and additional Forest Service Research commitments.3 Includes federal grants and agreements.4 Prior to 2008, fire transfer included in "Indirect expenses".