Forest Ecology and Management - University of Vermont et al. 2013 FEM.pdf · Potential increases in...
10
Potential increases in natural disturbance rates could offset forest management impacts on ecosystem carbon stocks John B. Bradford a,⇑ , Nicholas R. Jensen b , Grant M. Domke c , Anthony W. D’Amato b a USGS, Southwest Biological Science Center, Northern Arizona University, P.O. Box 5614, Flagstaff, AZ 86011, United States b University of Minnesota, Department of Forest Resources, 115 Green Hall, 1530 Cleveland Ave. N, St. Paul, MN 55108, United States c USDA Forest Service, Northern Research Station, 1992 Folwell Ave., St. Paul, MN 55108, United States article info Article history: Received 27 March 2013 Received in revised form 28 June 2013 Accepted 24 July 2013 Available online 28 August 2013 Keywords: Forest inventory Harvest intensity Simulation Carbon pools Superior National Forest abstract Forested ecosystems contain the majority of the world’s terrestrial carbon, and forest management has implications for regional and global carbon cycling. Carbon stored in forests changes with stand age and is affected by natural disturbance and timber harvesting. We examined how harvesting and distur- bance interact to influence forest carbon stocks over the Superior National Forest, in northern Minnesota. Forest inventory data from the USDA Forest Service, Forest Inventory and Analysis program were used to characterize current forest age structure and quantify the relationship between age and carbon stocks for eight forest types. Using these findings, we simulated the impact of alternative management scenarios and natural disturbance rates on forest-wide terrestrial carbon stocks over a 100-year horizon. Under low natural mortality, forest-wide total ecosystem carbon stocks increased when 0% or 40% of planned harvests were implemented; however, the majority of forest-wide carbon stocks decreased with greater harvest levels and elevated disturbance rates. Our results suggest that natural disturbance has the poten- tial to exert stronger influence on forest carbon stocks than timber harvesting activities and that main- taining carbon stocks over the long-term may prove difficult if disturbance frequency increases in response to climate change. Published by Elsevier B.V. 1. Introduction As atmospheric carbon dioxide concentrations continue to in- crease, scientists and land managers are exploring mitigation op- tions that maximize the amount of carbon stored in terrestrial ecosystems (Malmsheimer et al., 2008). About 60% of the world’s terrestrial carbon is contained in forest ecosystems, so the re- sponse of forests to changes in climate or disturbance regime can have implications for regional and global carbon cycling (Winjum et al., 1992; Dale et al., 2001; Ryan et al., 2010; McKinley et al., 2011). The amount of carbon stored within a forest does not re- main fixed through time; as trees mature and increase in size, cor- responding carbon stocks also increase, and these relationships between forest age and ecosystem carbon pools are well recog- nized. In temperate forests, forest carbon stocks typically increase with age until becoming relatively stable after 100–150 years, while net ecosystem carbon balance often peaks much earlier and gradually declines to near zero (Pregitzer and Euskirchen, 2004; Bradford and Kastendick, 2010; Williams et al., 2012). Dis- turbance events (natural or anthropogenic) that alter forest stand age will influence site-level carbon stocks and fluxes (Kashian et al., 2006; Gough et al., 2007; Gough et al., 2008; Nave et al., 2010). Likewise, landscape to regional disturbance regimes or management strategies that alter forest age–class distributions over large areas will ultimately drive changes in landscape to re- gional carbon stocks (Heath and Birdsey, 1993a; Pregitzer and Euskirchen, 2004; Mouillot and Field, 2005; Birdsey et al., 2006; Depro et al., 2008a; Scheller et al., 2011). With changes to global climate already occurring (Bernstein et al., 2007), natural disturbance regimes are also expected to be- come more frequent and of higher intensity (Westerling, 2006; Lit- tell et al., 2009; Schelhaas et al., 2010). Stand-replacing natural disturbance events such as wildfire, insect and pathogen out- breaks, and windstorms typically result in short-term losses in for- est carbon stocks, potentially shifting forests from carbon sinks to carbon sources (Kurz et al., 2008b; McKinley et al., 2011; Scheller et al., 2011; Stinson et al., 2011) and potentially influencing cli- matic conditions via other mechanisms, notably altered albedo and energy balance (Randerson et al., 2006; Anderson et al., 2010). Likewise, the frequency (or rate) of disturbance across large areas can also dramatically alter the potential for carbon storage. At regional scales, increases in disturbance frequency can result in widespread loss of forest carbon stocks (Kurz et al., 2008b; Rogers et al., 2011), while decreases in disturbance frequency are 0378-1127/$ - see front matter Published by Elsevier B.V. http://dx.doi.org/10.1016/j.foreco.2013.07.042 ⇑ Corresponding author. Tel.: +1 928 523 7766. E-mail address: [email protected] (J.B. Bradford). Forest Ecology and Management 308 (2013) 178–187 Contents lists available at ScienceDirect Forest Ecology and Management journal homepage: www.elsevier.com/locate/foreco
Transcript of Forest Ecology and Management - University of Vermont et al. 2013 FEM.pdf · Potential increases in...

Forest Ecology and Management 308 (2013) 178–187
Contents lists available at ScienceDirect
Forest Ecology and Management
journal homepage: www.elsevier .com/ locate/ foreco
Potential increases in natural disturbance rates could offset forestmanagement impacts on ecosystem carbon stocks
0378-1127/$ - see front matter Published by Elsevier B.V.http://dx.doi.org/10.1016/j.foreco.2013.07.042
⇑ Corresponding author. Tel.: +1 928 523 7766.E-mail address: [email protected] (J.B. Bradford).
John B. Bradford a,⇑, Nicholas R. Jensen b, Grant M. Domke c, Anthony W. D’Amato b
a USGS, Southwest Biological Science Center, Northern Arizona University, P.O. Box 5614, Flagstaff, AZ 86011, United Statesb University of Minnesota, Department of Forest Resources, 115 Green Hall, 1530 Cleveland Ave. N, St. Paul, MN 55108, United Statesc USDA Forest Service, Northern Research Station, 1992 Folwell Ave., St. Paul, MN 55108, United States
a r t i c l e i n f o
Article history:Received 27 March 2013Received in revised form 28 June 2013Accepted 24 July 2013Available online 28 August 2013
Keywords:Forest inventoryHarvest intensitySimulationCarbon poolsSuperior National Forest
a b s t r a c t
Forested ecosystems contain the majority of the world’s terrestrial carbon, and forest management hasimplications for regional and global carbon cycling. Carbon stored in forests changes with stand ageand is affected by natural disturbance and timber harvesting. We examined how harvesting and distur-bance interact to influence forest carbon stocks over the Superior National Forest, in northern Minnesota.Forest inventory data from the USDA Forest Service, Forest Inventory and Analysis program were used tocharacterize current forest age structure and quantify the relationship between age and carbon stocks foreight forest types. Using these findings, we simulated the impact of alternative management scenariosand natural disturbance rates on forest-wide terrestrial carbon stocks over a 100-year horizon. Underlow natural mortality, forest-wide total ecosystem carbon stocks increased when 0% or 40% of plannedharvests were implemented; however, the majority of forest-wide carbon stocks decreased with greaterharvest levels and elevated disturbance rates. Our results suggest that natural disturbance has the poten-tial to exert stronger influence on forest carbon stocks than timber harvesting activities and that main-taining carbon stocks over the long-term may prove difficult if disturbance frequency increases inresponse to climate change.
Published by Elsevier B.V.
1. Introduction
As atmospheric carbon dioxide concentrations continue to in-crease, scientists and land managers are exploring mitigation op-tions that maximize the amount of carbon stored in terrestrialecosystems (Malmsheimer et al., 2008). About 60% of the world’sterrestrial carbon is contained in forest ecosystems, so the re-sponse of forests to changes in climate or disturbance regime canhave implications for regional and global carbon cycling (Winjumet al., 1992; Dale et al., 2001; Ryan et al., 2010; McKinley et al.,2011). The amount of carbon stored within a forest does not re-main fixed through time; as trees mature and increase in size, cor-responding carbon stocks also increase, and these relationshipsbetween forest age and ecosystem carbon pools are well recog-nized. In temperate forests, forest carbon stocks typically increasewith age until becoming relatively stable after �100–150 years,while net ecosystem carbon balance often peaks much earlierand gradually declines to near zero (Pregitzer and Euskirchen,2004; Bradford and Kastendick, 2010; Williams et al., 2012). Dis-turbance events (natural or anthropogenic) that alter forest stand
age will influence site-level carbon stocks and fluxes (Kashianet al., 2006; Gough et al., 2007; Gough et al., 2008; Nave et al.,2010). Likewise, landscape to regional disturbance regimes ormanagement strategies that alter forest age–class distributionsover large areas will ultimately drive changes in landscape to re-gional carbon stocks (Heath and Birdsey, 1993a; Pregitzer andEuskirchen, 2004; Mouillot and Field, 2005; Birdsey et al., 2006;Depro et al., 2008a; Scheller et al., 2011).
With changes to global climate already occurring (Bernsteinet al., 2007), natural disturbance regimes are also expected to be-come more frequent and of higher intensity (Westerling, 2006; Lit-tell et al., 2009; Schelhaas et al., 2010). Stand-replacing naturaldisturbance events such as wildfire, insect and pathogen out-breaks, and windstorms typically result in short-term losses in for-est carbon stocks, potentially shifting forests from carbon sinks tocarbon sources (Kurz et al., 2008b; McKinley et al., 2011; Schelleret al., 2011; Stinson et al., 2011) and potentially influencing cli-matic conditions via other mechanisms, notably altered albedoand energy balance (Randerson et al., 2006; Anderson et al.,2010). Likewise, the frequency (or rate) of disturbance across largeareas can also dramatically alter the potential for carbon storage.At regional scales, increases in disturbance frequency can resultin widespread loss of forest carbon stocks (Kurz et al., 2008b;Rogers et al., 2011), while decreases in disturbance frequency are

J.B. Bradford et al. / Forest Ecology and Management 308 (2013) 178–187 179
estimated to increase ecosystem carbon stocks by nearly 100% insome regions (Hudiburg et al., 2009).
Similarly, forest management, specifically timber harvesting,can influence forest carbon stocks by both removing carbon fromthe ecosystem (in harvested material) and by shifting carbon intodetrital pools where it is subsequently returned to the atmospherevia decomposition (McKinley et al., 2011). The ecosystem-levelconsequences of carbon removal and elevated decomposition de-pend, in large part, on the silvicultural system employed. In Minne-sota, the relative intensity of silvicultural systems used hasdecreased over the last decade, and while other regenerationmethods are utilized, clearcutting and other even-aged approachesremain the predominant system employed among all forest man-agement organizations (D’Amato et al., 2009). Forest managementpractices applied over large areas can alter regional carbon stocksand these effects can be assessed by examining changes in regionalforest age distribution. As with natural disturbance, the frequencyand intensity of harvesting influence the resulting age distributionand dictate the magnitude of carbon stock change (Birdsey et al.,2006; Depro et al., 2008a; Nunery and Keeton, 2010; Heath et al.,2011a). Although a number of studies have examined the potentiallandscape- to regional-scale consequences of forest harvestingpractices (e.g. Depro et al., 2008b; Nunery and Keeton, 2010; Heathet al., 2011a; McKinley et al., 2011; Stinson et al., 2011; Peckhamet al., 2013), and other work has characterized how natural distur-bance regimes can alter forest carbon dynamics over large areas(e.g. Kurz et al., 2008a; Kurz et al., 2008b; Hudiburg et al., 2009;Rogers et al., 2011), few studies have contrasted the relative mag-nitude of these consequences or have attempted to propagateuncertainty through the calculations (although see Williamset al., 2012). In particular, few studies have assessed how changesin disturbance regimes may interact with actual, planned harvestregimes to impact carbon stocks and cycling. Since any attemptsto utilize forest harvesting as a tool for enhancing ecosystem car-bon stocks must occur in the context of climate change and associ-ated intensifying forest disturbances (Dale et al., 2001; Millar et al.,2007), understanding the simultaneous carbon consequences ofboth harvesting and natural disturbance regimes is crucial.
To better understand the landscape-scale impact of timber har-vesting practices on forest carbon stocks and to place those im-pacts in the context of potential alterations in the naturaldisturbance regime, we simulated varying levels of both harvestingand natural disturbance across the Superior National Forest (SNF),in northeastern Minnesota. Our specific objectives were (1) tocharacterize the current age structure across eight forest typeson the SNF and their relationships to carbon stocks, and (2) touse the forest type-age class–carbon stock relationships to simu-late the consequences of low and high natural disturbance ratesconcurrent with 0%, 40%, 100%, and 200% rates of the annualplanned harvest levels for forest-wide carbon storage over the next100 years.
2. Methodology
2.1. Study location
The SNF occupies approximately 812,000 ha of forest land innortheastern Minnesota, of which 292,000 ha is designated as wil-derness in the Boundary Waters Canoe Area Wilderness (BWCAW).The climate is composed of short, mild summers and long, coldwinters (July avg. 19 �C, January avg. �15 �C), and receives approx-imately 60–80 cm of precipitation annually (PRISM, 2010). Soilsrange from shallow, nutrient-poor sands of glacial outwash andareas of exposed granitic bedrock to silty-loams in bedrock cracksand depressions (Prettyman, 1978). Forests across this area consist
of eight dominant community types: red/white pine (Pinus resinosaAiton/P. strobus L.), jack pine (Pinus banksiana Lamb.), spruce/fir (Pi-cea glauca (Moench) Voss/Abies balsamea (L.) Mill.), lowland conifer(Picea mariana (Mill.) Britton, Sterns & Poggenb./Thuja occidentalisL.), upland hardwood (Quercus rubra L./Acer rubrum L.), lowlandhardwood (Fraxinus nigra Marsh.), northern hardwood (Acer sac-charum Marsh.), and aspen/birch (Populus tremuloides Michx./Bet-ula papyrifera Marsh.).
2.2. Forest inventory data
We utilized data collected by the USDA Forest Service, ForestInventory and Analysis (FIA) program, which maintains and peri-odically measures plots that are systematically distributed approx-imately every 2430 ha across the 48 conterminous states of the US,to estimate current forest conditions and develop forest type-ageclass–carbon stock relationships. Each plot containing a forest landuse is comprised of a series of smaller plots (i.e., subplots) wheretree- and site-level attributes – such as diameter at breast height(dbh) and tree height – are measured at regular temporal intervals(Bechtold and Patterson, 2005). Estimates of live tree abovegroundcarbon (bole, top and limbs, stump, coarse roots, and saplings)were calculated from tree attributes (Woudenberg et al., 2010)on 1,683 FIA plots within the three counties in which the SNF re-sides; St. Louis, Lake, and Cook counties (Fig. 1). Estimates of car-bon in standing (Smith et al., 2003) and downed dead wood(Smith et al., 2004), forest floor (Smith and Heath, 2002), andunderstory vegetation (Birdsey, 1996) were developed from mod-els based on geographic area and forest type, and in some cases,live tree stand density, stand age, and growing stock volume. Esti-mates of carbon in soil organic matter (but not forest floor), arebased on the STATSGO soil database (USDA Soil Conservation Ser-vice, 1991) and regional forest types (Amichev and Galbraith,2004) and assumed to remain constant across stand age in eachforest type (Heath et al., 2003). Estimates of carbon in forest eco-system pools are based on regional averages and reflected the bestavailable data at the time of analysis. The uncertainty associatedwith the models and/or model coefficients used to develop compo-nent estimates is beyond the scope of this study. That said, Heathand Smith (2000) conducted an uncertainty analysis on estimatesof forest carbon developed using many of the component modelsused in this study. This study assumes that soil organic carbon(SOC) is unchanged by harvest or disturbance scenarios (Naveet al., 2010), so this pool has been excluded from results where itcould mask any potential management influences. Estimates ofstand age for each forest type were based on tree cores from twoor three dominant or co-dominant site trees from the overstoryof each plot. The variance of stand age estimates increases withincreasing stand heterogeneity and therefore may have large errors(U.S. Department of Agriculture, 2010).
2.3. Model approach
Forest harvesting and natural disturbance scenarios were exam-ined using the Forest Age Class Change Simulator (FACCS). FACCScombines estimates of stand age distributions (assuming standsare even-aged as indicated by D’Amato et al., 2009) over large for-ested areas with relationships between age and carbon stocks toestimate carbon stocks over large study areas. By altering standage distribution in response to prescribed disturbance or harvestrates, FACCS calculates the potential impact on carbon stocks. FAC-CS utilizes estimates of stand age, forest land area, and carbonstocks by forest type to estimate forest-wide age distributionsand carbon stock changes in response to specified harvest and dis-turbance regimes over a target planning horizon (Domke et al.,2012). In particular, the model links estimates of forest land area

Fig. 1. The Superior National Forest and approximate Forest Inventory and Analysis plot locations within Lake, Cook, and St. Louis counties, Minnesota.
180 J.B. Bradford et al. / Forest Ecology and Management 308 (2013) 178–187
by age class and forest type to continuous forest type specific ageclass–carbon yield curves to build a matrix of forest carbon esti-mates over space and time. FACCS estimates are constrained bytwo basic assumptions: (1) the land area (and the proportion ofarea in each forest type) remains fixed throughout the planninghorizon, and (2) harvest activities and incorporated disturbancerates are applied forest-wide and simulated on an annual basis.Harvest scenarios were based on the SNF Land and Resource Man-agement Plan (henceforth ‘‘forest plan’’), and included 40%, 100%,and 200% of the planned harvest rates, each simulated with simul-taneous natural disturbance rates of 1% or 3%. Forest disturbancerates were applied uniformly across the entire area by individualage classes in the model. Within each age class, the disturbancerate was applied randomly across the area in that age class. The de-sign allows area to be disturbed multiple times throughout theplanning horizon. Scenarios were examined over a 100-year plan-ning horizon and carbon stocks are presented at 10, 20, 50, and100 years in the simulations.
2.4. Curve fitting of pools/types
To incorporate continuous forest type specific age class–carbonyield curves for this study area into FACCS, we quantified the rela-tionships between carbon pools and stand age for the eight forest
Table 1Summary of forest type inventory data from Superior National Forest, MN.
Forest type Area (ha) FIA plots (#) Harvest propo
Red/white pine 51,244 73 13.1Jack pine 64,598 68 14.2Spruce/fir 74,224 142 7.7Lowland conifer 170,288 345 5.5Upland hwd 40,347 43 0.6Lowland hwd 26,991 114 0.5Northern hwd 36,632 95 1.2Aspen–birch 347,517 769 57.3Total 811,841 1649 100.0
a Harvest proportions calculated using a combination of reported pulpwood and sawtb Maximum annual harvest volume (Mm3) taken from Table TMB-11 in the SNF Land
types using field- and model-based estimates from FIA plots acrossCook, Lake, and St. Louis counties. These stand age–carbon poolrelationships were analyzed using 19 candidate statistical regres-sion models, including linear, power, exponential increase, andexponential increase to a maximum functions, all with and withoutintercept terms (Bradford and Kastendick, 2010). Akaike’s informa-tion criterion (AICC) values and weight of evidence for each model(wi) were used to determine the best-fitting model for each carbonpool following Burnham and Anderson (2001), which was utilizedin FACCS to represent how carbon stocks relate to stand age in eachforest type. Statistical analysis was performed using nlin procedurein SAS version 9.1 (SAS, 2001).
2.5. Management and disturbance scenarios
Actual harvest volumes on the SNF from 2004–2009 weresummed and organized into the eight forest type classes. These to-tal harvest volumes were then averaged over this six-year periodand the percentage of each forest type contribution to total harvestvolumes were calculated (Table 1). The forest plan specifies the an-nual maximum harvest volumes at 0.241 M m3 (102 million boardfeet). Annual harvest goals by forest type for these scenarios werethen calculated by applying the actual annual six-year harvest pro-portion of each forest type to the 0.241 M m3 maximum harvest
rtiona (%) Max. harvestb (Mm3) FIA Forest type codes
0.032 102, 1030.034 1010.018 121, 1220.013 125, 126, 1270.001 401, 409, 503, 9620.001 517, 701, 702, 704, 706, 7080.003 801, 805, 8090.138 901, 902, 904, 9050.241
imber volumes harvested from 2004–2009.and Resource Management Plan EIS.

Fig. 2. Simulated age distributions of eight forest types on the Superior National Forest resulting from harvest and disturbance scenarios. Rotated kernel density plots depict therange and distribution of stand ages, and interior boxplots show the 25th and 75th quartiles and medians. Letters indicate statistical difference of Kolmogorov–Smirnov tests.
J.B. Bradford et al. / Forest Ecology and Management 308 (2013) 178–187 181
volume, and declaring the resulting harvest amounts to representthe 100% forest plan harvest amounts. The 40% and 200% harvestrates are simply those percentages of the 100% harvest goals. Theeffective annual harvest rates for the entire Superior NF rangedfrom 0.05–0.35% of forest area. Rotation lengths assigned to eachforest type in the model were based on minimum harvestable agesspecified in the forest plan.
The Boundary Waters Canoe Area Wilderness (BWCAW) is des-ignated as ‘reserved’ forest land, and receives no active forest man-agement activity; therefore, acreage under reserved status on theSNF was treated as ‘no action’ acreage in all scenarios with harvest-ing and was not subject to harvests in the model. All other SNF for-est land (not reserved status) was treated as ‘general forest’management areas, and received management consistent with thatdesignation in the forest plan.
Two levels of natural mortality were included in oursimulations of harvest effects on carbon storage. A lower natural
mortality rate of 1% was assumed to mimic the small, patchy dis-turbances resulting from individual tree death and localized mor-tality from wind and pests (Ravenscroft et al., xxxx; Shinnemanet al., 2010). An elevated mortality rate of 3% was selected to reflectthe magnitude of recent disturbance events on the SNF, such as the1999 Blowdown, and 2006 Cavity Lake and 2007 Ham Lake wild-fires (Fites et al., 2007; Woodall and Nagel, 2007; Nelson et al.,2009). With both mortality levels, the simulated rates were appliedannually across all age classes and forest types, resetting the af-fected areas to the initial age class in the same forest type, regard-less of management activity.
2.6. Uncertainty estimation
We quantified the magnitude of uncertainty in forest-wide car-bon stock estimates introduced by variation in the relationship be-tween stand age and carbon stocks. We calculated 95% confidence
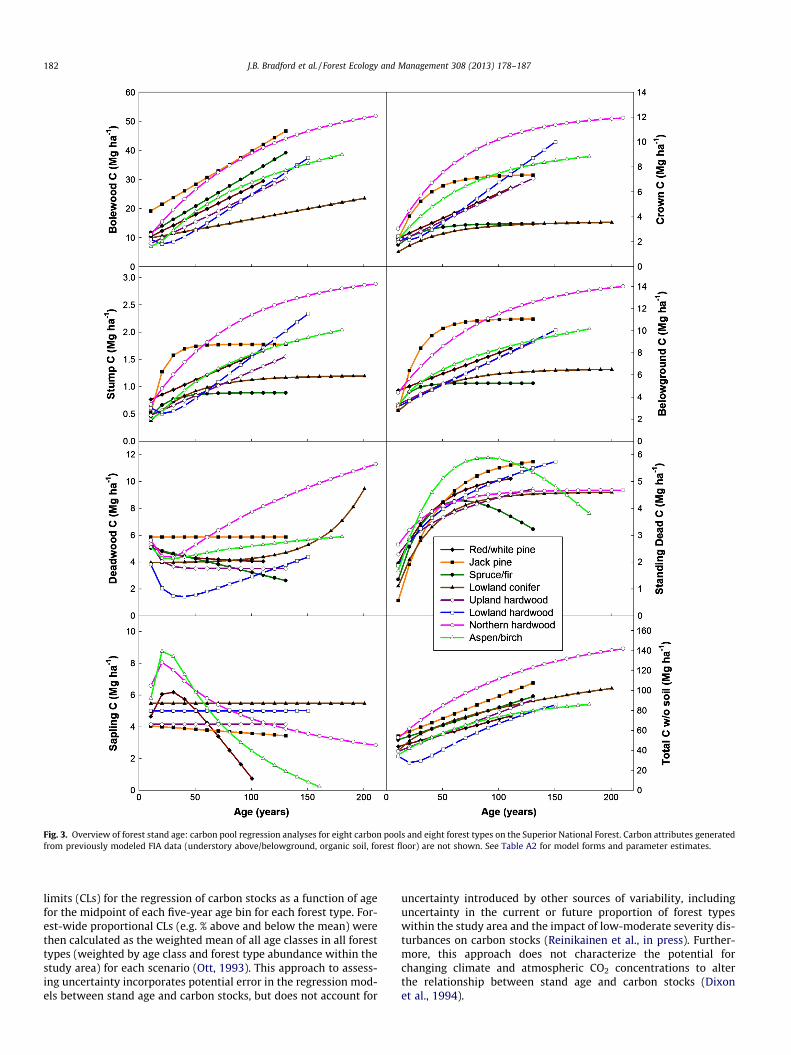
Fig. 3. Overview of forest stand age: carbon pool regression analyses for eight carbon pools and eight forest types on the Superior National Forest. Carbon attributes generatedfrom previously modeled FIA data (understory above/belowground, organic soil, forest floor) are not shown. See Table A2 for model forms and parameter estimates.
182 J.B. Bradford et al. / Forest Ecology and Management 308 (2013) 178–187
limits (CLs) for the regression of carbon stocks as a function of agefor the midpoint of each five-year age bin for each forest type. For-est-wide proportional CLs (e.g. % above and below the mean) werethen calculated as the weighted mean of all age classes in all foresttypes (weighted by age class and forest type abundance within thestudy area) for each scenario (Ott, 1993). This approach to assess-ing uncertainty incorporates potential error in the regression mod-els between stand age and carbon stocks, but does not account for
uncertainty introduced by other sources of variability, includinguncertainty in the current or future proportion of forest typeswithin the study area and the impact of low-moderate severity dis-turbances on carbon stocks (Reinikainen et al., in press). Further-more, this approach does not characterize the potential forchanging climate and atmospheric CO2 concentrations to alterthe relationship between stand age and carbon stocks (Dixonet al., 1994).

Fig. 4. Comparison of initial forest-wide carbon stocks (excluding soil organic matter) to simulated 100-year carbon stores with multiple harvest levels and disturbance rates.Error bars indicate variability in total carbon (thick lines around entire bars).
J.B. Bradford et al. / Forest Ecology and Management 308 (2013) 178–187 183
3. Results and discussion
3.1. Forest age and carbon stock relationships
Current estimated age structure differs among the eight foresttypes on the SNF (Fig. 2). Red/white pine, lowland hardwood,northern hardwood, and aspen/birch age structures exhibit uni-modal age distributions with the majority of forest type area resid-ing near the mean stand ages (65.3 ± 28.8, 67.5 ± 26.1, 57.1 ± 23.4,and 54.1 ± 27.5, respectively). Jack pine stands were the youngest,with a mean age of 51.7 ± 26.9, while lowland conifer were the old-est, with a large portion of area in older age classes (77.5 ± 36.1).Spruce/fir and upland hardwood forest types both display reason-ably uniform age distributions (52.7 ± 29.5 and 59.8 ± 35.2). By theend of the 100-year simulations, these age distributions were allimpacted by the harvest and disturbance scenarios. Without har-vesting and under low disturbance (1%), the estimated age distri-butions of all eight forest types widened beyond their initial agerange to include substantially older age classes (Fig. 2). Maximumharvesting (100%) with low disturbance similarly altered age dis-tribution in forest types receiving lower harvest proportions, yetshifted the majority of estimated forest land area of more heavilyharvested systems into younger age classes (Fig. 2). Increasingthe annual disturbance rate to 3% decreased estimated age distri-butions of all eight forest types, regardless of harvest levels(Fig. 2). 3% annual disturbance generated age distributions withmean stand ages of less than 50 years.
Although the predicted age class–carbon relationships varyacross carbon stocks and forest types, significant relationships withstand age were found for all carbon pools except SOC (in all foresttypes), understory above/belowground in upland hardwoods, andsapling carbon in spruce/fir and lowland conifer (Table A2). Carbonpools comprising live trees (bolewood, crown) increased with agefor all eight forest types (Fig. 3). Estimated deadwood carbon dis-played mixed results across forest types, showing strong increaseswith age in northern hardwood and lowland conifer, slight de-creases in spruce/fir, upland hardwood, and red/white pine, and re-mained mostly constant in the other three systems. Estimatedcarbon in standing dead trees increased with age in all forest typesuntil either reaching the predicted maximum or gradually declin-ing at older ages. Estimated carbon in the sapling pool showedthe strongest response to stand age in aspen/birch, northern hard-wood, and red/white pine forest types, where a large increase in
younger forests eventually declines with age. Overall, the esti-mated total forest carbon (excluding SOC) was positivelyassociated with stand age in all eight forest types (Fig. 3).
Other studies examining carbon accumulation rates in this re-gion have found similar patterns in forest age–carbon stock rela-tionships. Bradford and Kastendick (2010) measured carbonstocks in chronosequences of red pine and aspen–birch ecosystemsin northern Minnesota and described very similar forest age–carbon relationships. These relationships were subsequently foundto be consistent with other field measurements of forest carbon inthe region (Bradford, 2011). Additionally, work by Domke et al.(2012), which incorporated age–carbon model estimates for treecomponents in northern Minnesota were similar to estimates oftree carbon in this study.
3.2. Forest-wide carbon pools
Estimated carbon stock density (Mg C ha�1) ranged from a lowof 158 Mg C ha�1 in upland hardwoods to 336 Mg ha�1 in the low-land conifer type. The proportion of estimated total carbon stockdensity contributed by each carbon pool was similar across alleight forest types (Fig. 4). Soil organic matter was the largest poolin all forest types, storing 60–78% (97–262 Mg C ha�1) of the totalcarbon on a site. The remaining pools contribute an estimated7–21% (23–43 Mg C ha�1, aboveground), 4–12% (8–29 Mg C ha�1,forest floor), 3–6% (8–12 Mg C ha�1, deadwood), and 1–5%(5–9 Mg C ha�1, belowground) to total carbon storage per hectare.In lowland conifer and spruce/fir forests, forest floor carbon wasgreater than the estimated aboveground carbon, 34.6 and29.3 Mg ha�1 compared to 24.6 and 23.4 Mg ha�1, respectively.This large contribution of forest floor carbon is likely due to thepresence of peat substrates in these communities.
Our estimates of forest carbon density were consistent withother studies in the northern Lake states (Bradford, 2011) andupper Midwest (Peckham et al., 2013). In a review of carbon stocksacross the United States, Heath et al. (2011b) reports the northernnational forest system region contains approximately172 Mg C ha�1, which falls within our estimates for the SNF. Incomparing the contribution of individual carbon stocks however,Heath et al. (2011b) report greater amounts of aboveground bio-mass than the mean 33 Mg C ha�1 in this study. This may be dueto their utilization of Jenkins et al. (2004) biomass equations,which result in differences due, in part, to estimation procedures.

Tabl
e2
Tota
lfo
rest
-wid
eca
rbon
stoc
kch
ange
son
the
Supe
rior
Nat
iona
lFo
rest
unde
rva
ryin
gdi
stur
banc
ean
dha
rves
ting
scen
ario
saf
ter
100-
year
sim
ulat
ions
.
Car
bon
pool
Init
ial
(Tg
C)
1%D
istu
rban
ce3%
Dis
turb
ance
No
har
vest
40%
har
vest
100%
har
vest
200%
har
vest
No
har
vest
40%
har
vest
100%
har
vest
200%
har
vest
TgC
%D
TgC
%D
TgC
%D
TgC
%D
TgC
%D
TgC
%D
TgC
%D
TgC
%D
Abo
vegr
oun
d24
.53
26.6
28.
625
.39
3.5
24.1
1�
1.7
22.7
0�
7.4
20.0
8�
18.1
19.6
9�
19.7
19.2
8�
21.4
18.7
3�
23.6
Bel
owgr
oun
d5.
315.
585.
15.
330.
55.
06�
4.7
4.75
�10
.64.
24�
20.2
4.15
�21
.74.
06�
23.5
3.93
�25
.9D
eadw
ood
8.00
8.22
2.8
8.06
0.7
7.87
�1.
67.
65�
4.3
7.17
�10
.37.
12�
11.0
7.07
�11
.76.
99�
12.6
Fore
stfl
oor
14.6
715
.47
5.5
14.8
61.
314
.18
�3.
313
.49
�8.
111
.36
�22
.511
.18
�23
.810
.99
�25
.110
.77
�26
.6So
ilor
gan
ic14
2.46
142.
460.
014
2.46
0.0
142.
460.
014
2.46
0.0
142.
460.
014
2.46
0.0
142.
460.
014
2.46
0.0
Tota
lec
osys
tem
194.
9619
8.35
1.7
196.
100.
619
3.68
�0.
719
1.04
�2.
018
5.31
�5.
018
4.60
�5.
318
3.85
�5.
718
2.88
�6.
2
184 J.B. Bradford et al. / Forest Ecology and Management 308 (2013) 178–187
In this study, live tree estimates were developed using the compo-nent ratio method (Woodall et al., 2011), which for most speciesresults in lower estimates of biomass and carbon compared to Jen-kins et al. (Domke et al., 2012).
3.3. Disturbance and harvest effects on carbon storage
Under the low (1%) natural mortality rate, forest-wide total eco-system carbon stocks increased with 0% and 40% harvest levels(1.7% and 0.6%, respectively, compared to current values) at theend of the 100-year harvest simulations (Table 2). In scenarios sim-ulating harvesting of 100% and 200% of the forest plan harvest rate,estimated total carbon stocks decreased by 0.7% and 2.0%, respec-tively, over the 100-year simulation (Fig. 5). Because harvestingpractices on the SNF (including the management plan) do not allo-cate harvesting to forest types exactly proportional to their abun-dance in the forest, individual forest types and carbon pools didnot always follow the same pattern as these forest-wide estimates.In simulations of 0% harvest, estimated jack pine belowground car-bon decreased 1.4%, estimated spruce/fir deadwood and below-ground stocks decreased 10.2% and 1.1%, and all lowland coniferstocks (SOC) dropped by 1.6–7.4% (Table A1). Additionally, foresttypes receiving a higher proportion of the overall harvest (aspen/birch, jack pine, and red/white pine, Table 1) reflected greaterreductions in carbon stocks than forest types receiving less har-vesting. The upland hardwood, lowland hardwood, and northernhardwood forest types only contribute an estimated 2.3% of the to-tal harvest volumes, and as a result are only minimally impactedby harvest level, increasing carbon stocks even at 200% of theplanned harvest levels.
Simulating an elevated rate of natural disturbance (3%) resultedin reductions to carbon stocks across all forest types and carbonpools, with the exception of spruce/fir deadwood (Table 2). Thisnegative response of carbon stocks to disturbance was reflectedacross all harvest levels, although forest types receiving the largerproportion of harvesting (aspen/birch, jack pine, and red/whitepine) again showed greater reductions. Estimated forest-wide totalecosystem carbon stocks decreased by 5% under elevated distur-bance and no harvesting. Increasing the harvest rate to 200% ofthe forest plan lowered storage by an estimated 6.2% of currentstocks (Table 2).
In the absence of disturbance or harvesting, the potential forforest carbon stocks to increase over the next several decadeshas been estimated at the regional scale, including the Pacificnorthwest (Hudiburg et al., 2009; Rogers et al., 2011) and north-east (Nunery and Keeton, 2010) and Lake states (Bradford, 2011;Peckham et al., 2013), as well as the national scale (Depro et al.,2008b; Heath et al., 2011a). However, these studies typically didnot assess the combined impact of harvesting and disturbance.Our results suggest that even at an annual natural disturbance rateof 1%, forest carbon stocks can increase when harvesting is limitedto 40% or less of the planned rate (Fig. 4).
Including natural disturbance in our estimates of harvesting im-pacts on carbon stocks also indicates that the potential for en-hanced carbon stocks may be lower than other studies haveestimated in the absence of disturbance. Under a 1% natural distur-bance rate, we estimated an increase of only 1.7% in the no harvestscenario. By contrast, other studies focusing on the potential for al-tered forest management practices, have estimated potential re-gional carbon stock increases of 15–50% over the next 50–100 years in the absence of harvesting (Heath and Birdsey,1993b; Hudiburg et al., 2009; Nunery and Keeton, 2010). Our lowerpotential highlights the need to recognize limitations imposed bynatural disturbances when calculating potential future carbonstocks.

Fig. 5. Timeline of forest-wide total carbon stocks (excluding soil organic matter) on the Superior NF under four harvest-level and disturbance rate scenarios.
J.B. Bradford et al. / Forest Ecology and Management 308 (2013) 178–187 185
Furthermore, our results indicate the relatively modest altera-tions in the natural disturbance regime may have larger impactson regional forest carbon dynamics than harvesting, even acrossa wide range of harvesting intensities. The role of disturbance indefining site-level forest carbon stocks and cycling is well recog-nized (Pregitzer and Euskirchen, 2004) and the potential impactof disturbance regime on potential future forest carbon stocks overlarge areas is receiving increased attention (Kurz et al., 2008a).Rogers et al. (2011) estimated that wildfires could decrease ecosys-tem carbon in the Pacific Northwest by approximately 20% com-pared to scenarios without fire, and that the magnitude anddirection of change relative to current conditions depends on cli-matic conditions, which dictate total area burned. By contrast,we found that the difference between 1% and 3% natural distur-bance equated to approximately 6.5% decrease in total carbonstocks, and that this difference was greatest when harvest intensitywas low.
Despite the recognized importance of natural disturbances fewstudies have attempted to characterize the relative impact ofsimultaneous changes in harvesting practices and disturbance re-gimes (although see Kurz et al., 2008b). Our results suggest thatvariation in harvest intensity could alter total forest-wide carbonstocks by �2% to 2% under a 1% natural disturbance regime, andby �5% to �6.2% under a 3% natural disturbance regime. Thus,the capacity of forest harvesting practices to facilitate carbon up-take by forests within the Superior National Forest may be possibleonly when natural disturbance rates are relatively modest. Ifchanging climatic conditions elevate the frequency and intensityof natural disturbances as anticipated (Dale et al., 2001; Westerlinget al., 2006; Rogers et al., 2011), forests may become carbonsources, and the impact of harvesting practices on the magnitudeof that source may be very limited.
While these results suggest that disturbance has a larger influ-ence on carbon stocks than timber harvesting, examining theresulting age distributions from these scenarios offers insight intothe driver of these changes. Disturbance scenarios the distributionof stand ages for all forest types to younger age classes, subse-quently lowering carbon stocks forest-wide, whereas timber har-vesting only affects a fraction of the same area and only inmerchantable ages and forest types. The influence of timber har-vesting on carbon stocks on the SNF is related to the amount of ac-tual harvest activities occurring. Comparing the current harvest
rates on the SNF to other landowners in northeastern Minnesotareveals that SNF harvest rates are fairly low; ownership contribu-tions to the total annual harvest volumes from 2007–2011 in Cook,Lake, and St. Louis counties are as follows: county, 0.632 Mm3
(39%;431,872 ha), private, 0.501 Mm3 (31%;578,605 ha), state,0.262 Mm3 (16%;285,706 ha), SNF, 0.205 Mm3 (13%,849,869 ha),and other, 0.034 Mm3 (2%,45,179 ha) (Miles, 2012). Nevertheless,the impacts of doubling the harvest rates on the SNF were second-ary to the magnitude of change in carbon stocks with increasingnatural disturbance rates (Fig. 5).
Several factors that may impact future carbon stocks on the SNFare not accounted for in this study. While this analysis assesses for-est-wide carbon stock response to shifting stand age distributions,changing climatic conditions and atmospheric CO2 concentrationsmay fundamentally altered the relationship between age and car-bon. In particular, if warming temperatures and higher CO2 con-centrations increase growth rates in the region (Wythers et al.,2013; Peters et al., in press), carbon may accumulate faster inregrowing stands, potentially diminishing the impact of wide-spread harvests or natural disturbances. However, warmer temper-atures may also accelerate decomposition rates, potentiallydecreasing the substantial amount of carbon stored in soils (David-son and Janssens, 2006). Thus, this work provides insight into therelative impact of potential harvesting operations and natural dis-turbances on carbon, and should not be interpreted as a forecast offuture forest-wide carbon stocks. In addition, the relationships be-tween stand age and carbon stocks utilized in this work are basedon age estimates from FIA methods that include measuring age inonly a few trees per plot. While such biases may impact these re-sults, we anticipate the effects are relatively modest, because biasin age determination is likely most prevalent in older stands (agedetermination in young, actively re-growing stands is probablymore easily assessed by a few trees), where carbon stocks arechanging relatively slowly in older stands (Fig. 3, Bradford andKastendick, 2010).
Results presented here about the relative influence of naturaldisturbances and forest management practices suggest thatincreasing disturbance frequency has the potential to nullify man-agement impacts on forest carbon. If natural disturbance rates in-crease substantially above the approximately 1% rates observedover the past several decades (McCarthy, 2001), our results indi-cate that maintaining or increasing forest-wide carbon stocks will

186 J.B. Bradford et al. / Forest Ecology and Management 308 (2013) 178–187
be very challenging. Seeking a balance between disturbance andmanagement may be the key to maintaining carbon stocks and for-est-wide planning efforts may need to account for disturbance im-pacts when setting harvest levels. Although increased rates ofdisturbance may dictate reduced harvest rates, a complete lack ofharvesting would prevent opportunities for creating forest condi-tions that are more resistant and resilient to disturbance events(Millar et al., 2007).
Acknowledgments
Any use of trade, product, or firm names is for descriptive pur-poses only and does not imply endorsement by the U.S.Government.
Appendix A. Supplementary material
Supplementary data associated with this article can be found, inthe online version, at http://dx.doi.org/10.1016/j.foreco.2013.07.042.
References
Amichev, B.Y., Galbraith, J.M., 2004. A revised methodology for estimation of forestsoil carbon from spatial soils and forest inventory data sets. EnvironmentalManagement. 33 (Suppl. 1), S74–S86.
Anderson, R.G., Canadell, J.G., Randerson, J.T., Jackson, R.B., Hungate, B.A., Baldocchi,D.D., Ban-Weiss, G.A., Bonan, G.B., Caldeira, K., Cao, L., Diffenbaugh, N.S., Gurney,K.R., Kueppers, L.M., Law, B.E., Luyssaert, S., O’Halloran, T.L., 2010. Biophysicalconsiderations in forestry for climate protection. Frontiers in Ecology and theEnvironment 9, 174–182.
Bechtold, W.A., Patterson, P.L., 2005. The enhanced forest inventory and analysisprogram: national sampling design and estimation procedures. US Departmentof Agriculture Forest Service, Southern Research Station.
Bernstein, L., Bosch, P., Canziani, O., Chen, Z., Christ, R., Davidson, O., 2007. Climatechange 2007: Synthesis Report, Summary for Policymakers.
Birdsey, R.A. 1996. Carbon storage for major forest types and regions in thecoterminous United States. In: Sampson, N.; Hair, D., eds. Forests and globalchange. Volume 2: forest management opportunities for mitigating carbonemissions. Washington, DC: American Forests: 1-25, Appendixes 2-4.
Birdsey, R., Pregitzer, K., Lucier, A., 2006. Forest carbon management in the UnitedStates: 1600–2100. Journal of Environment Quality 35, 1461.
Bradford, J.B., 2011. Potential influence of forest management on regional carbonstocks: an assessment of alternative scenarios in the northern Lake states, USA.Forest Science 57, 479–488.
Bradford, J.B., Kastendick, D.J., 2010. Age-related patterns of forest complexity andcarbon cycling in pine and aspen ecosystems of northern Minnesota, USA.Canadian Journal of Forest Research 40, 401–409.
Burnham, K.P., Anderson, D.R., 2001. Kullback–Leibler information as a basis forstrong inference in ecological studies. Wildlife Research 28, 111–119.
Dale, V.H., Joyce, L.A., McNulty, S., Neilson, R.P., Ayres, M.P., Flannigan, M.D., Hanson,P.J., Irland, L.C., Lugo, A.E., Peterson, C.J., Simberloff, D., Swanson, F.J., Stocks, B.J.,Wotton, B.M., 2001. Climate change and forest disturbances. BioScience 51,723–734.
D’Amato, A.W., Bolton, N.W., Blinn, C.R., Ek, A.R., 2009. Current status and long-termtrends of silvicultural practices in Minnesota: a 2008 assessment. Departmentof Forest Resources, College of Food, Agricultural and Natural Resource Sciences,University of Minnesota.
Davidson, E.A., Janssens, I.A., 2006. Temperature sensitivity of soil carbondecomposition and feedbacks to climate change. Nature 440, 165–173.
Depro, B.M., Murray, B.C., Alig, R.J., Shanks, A., 2008a. Public land, timber harvests,and climate mitigation: quantifying carbon sequestration potential on U.S.public timberlands. Forest Ecology and Management 255, 1122–1134.
Depro, B.M., Murray, B.C., Alig, R.J., Shanks, A., 2008b. Public land, timber harvests,and climate mitigation: quantifying carbon sequestration potential on USpublic timberlands. Forest Ecology and Management 255, 1122–1134.
Dixon, R.K., Brown, S., Houghton, R.A., Solomon, A.M., Trexler, M.C., Wisniewski, J.,1994. Carbon pools and flux of global forest ecosystems. Science 263, 185–190.
Domke, G.M., Becker, D.R., D’Amato, A.W., Ek, A.R., Woodall, C.W., 2012. Carbonemissions associated with the procurement and utilization of forest harvestresidues for energy, northern Minnesota, USA. Biomass and Bioenergy 36, 141–150.
Fites, J.A., Reiner, A., Campbell, M., Taylor, Z., 2007. Fire behavior and effects,suppression, and fuel treatments on the Ham Lake and Cavity Lake fires. In: U.S.Department of Agriculture, Forest Service.
Gough, C.M., Vogel, C.S., Harrold, K.H., George, K., Curtis, P.S., 2007. The legacy ofharvest and fire on ecosystem carbon storage in a north temperate forest.Global change biology 13, 1935–1949.
Gough, C.M., Vogel, C.S., Schmid, H.P., Curtis, P.S., 2008. Controls on annual forestcarbon storage: lessons from the past and predictions for the future. BioScience58, 609–622.
Heath, L.S., Birdsey, R.A., 1993a. Carbon trends of productive temperate forests ofthe coterminous United States. Water, Air, & Soil Pollution 70, 279–293.
Heath, L.S., Birdsey, R.A., 1993b. Carbon trends of productive temperate forests ofthe coterminous United States. Water Air and Soil Pollution 70, 279–293.
Heath, L.S., Smith, J.E., Birdsey, R.A., 2003. Carbon trends in U.S. forestlands: acontext for the role of soils in forest carbon sequestration. In: Kimble, J.M.,Heath, L.S., Birdsey, R.A., Lal, R. (Eds.). The potential of U.S. forest soils tosequester carbon and mitigate the greenhouse effect. Boca Raton, CRC Press,2003. p. 35–45.
Heath, L.S., Smith, J.E., Skog, K.E., Nowak, D.J., Woodall, C.W., 2011a. Managed forestcarbon estimates for the US greenhouse gas inventory, 1990–2008. Journal ofForestry 109, 167–173.
Heath, L.S., Smith, J.E., Woodall, C.W., Azuma, D.L., Waddell, K.L., 2011b. Carbonstocks on forestland of the United States, with emphasis on USDA Forest Serviceownership. Ecosphere 2.
Hudiburg, T., Law, B., Turner, D.P., Campbell, J., Donato, D., Duane, M., 2009. Carbondynamics of Oregon and northern California forests and potential land-basedcarbon storage. Ecological Applications 19, 163–180.
Jenkins, J.C., Chojnacky, D.C., Heath, L.S., Birdsey, R.A., 2004. Comprehensivedatabase of diameter-based biomass regressions for North American treespecies. United States Department of Agriculture, Forest Service, NortheasternResearch Station.
Kashian, D.M., Romme, W.H., Tinker, D.B., Turner, M.G., Ryan, M.G., 2006. Carbonstorage on landscapes with stand-replacing fires. BioScience 56, 598–606.
Kurz, W.A., Dymond, C.C., Stinson, G., Rampley, G.J., Neilson, E.T., Carroll, A.L., Ebata,T., Safranyik, L., 2008a. Mountain pine beetle and forest carbon feedback toclimate change. Nature 452, 987–990.
Kurz, W.A., Stinson, G., Rampley, G.J., Dymond, C.C., Neilson, E.T., 2008b. Risk ofnatural disturbances makes future contribution of Canada’s forests to the globalcarbon cycle highly uncertain. Proceedings of the National Academy of Sciences105, 1551–1555.
Littell, J.S., McKenzie, D., Peterson, D.L., Westerling, A.L., 2009. Climate and wildfirearea burned in western US ecoprovinces, 1916–2003. Ecological Applications19, 1003–1021.
Malmsheimer, R.W., Heffernan, P., Brink, S., Crandall, D., Deneke, F., Galik, C., Gee, E.,Helms, J.A., McClure, N., Mortimer, M., 2008. Forest management solutions formitigating climate change in the United States. Journal of Forestry 106, 115–173.
McCarthy, J., 2001. Gap dynamics of forest trees: a review with particular attentionto boreal forests. Environmental Reviews 9, 1–59.
McKinley, D.C., Ryan, M.G., Birdsey, R.A., Giardina, C.P., Harmon, M.E., Heath, L.S.,Houghton, R.A., Jackson, R.B., Morrison, J.F., Murray, B.C., Pataki, D.E., Skog, K.E.,2011. A synthesis of current knowledge on forests and carbon storage in theUnited States. Ecological Applications 21, 1902–1924.
Miles, P., 2012. Forest inventory EVALIDator web application version 1.5. 00. In: USForest Service, Northern Research Station. <http://www.apps.fs.fed.us/Evalidator/tmattribute.jsp.
Millar, C.I., Stephenson, N.L., Stephens, S.L., 2007. Climate change and forests of thefuture: managing in the face of uncertainty. Ecological Applications 17, 2145–2151.
Mouillot, F., Field, C.B., 2005. Fire history and the global carbon budget: a 1�� 1� firehistory reconstruction for the 20th century. Global Change Biology 11, 398–420.
Nave, L.E., Vance, E.D., Swanston, C.W., Curtis, P.S., 2010. Harvest impacts on soilcarbon storage in temperate forests. Forest Ecology and Management 259, 857–866.
Nelson, M.D., Healey, S.P., Moser, W.K., Hansen, M.H., 2009. Combining satelliteimagery with forest inventory data to assess damage severity following a majorblowdown event in northern Minnesota, USA. International Journal of RemoteSensing 30, 5089–5108.
Nunery, J.S., Keeton, W.S., 2010. Forest carbon storage in the northeastern UnitedStates: net effects of harvesting frequency, post-harvest retention, and woodproducts. Forest Ecology and Management 259, 1363–1375.
Ott, R.L., 1993. An introduction to statistical methods and data analysis. WadsworthPublishing Company, Belmont (CA).
Peckham, S.D., Gower, S.T., Perry, C.H., Wilson, B.T., Stueve, K.M., 2013. Modelingharvest and biomass removal effects on the forest carbon balance of theMidwest, USA. Environmental Science & Policy 25, 22–35.
Peters, E.B., Wythers, K.R., Zhang, S., Bradford, J.B., Reich, P.B. Potential climatechange impacts on temperate forest ecosystem processes. Canadian Journal ofForest Research (in press).
Pregitzer, K.S., Euskirchen, E.S., 2004. Carbon cycling and storage in world forests:biome patterns related to forest age. Global Change Biology 10, 2052–2077.
Prettyman, D.H., 1978. Soil Survey of Kawishiwi Area, Minnestoa: Parts of Lake andCook Counties in Superior National Forest. Forest Service, Minnestoa.
PRISM, 2010. PRISM Climate Group. In: Oregon State University. <http://www.prism.oregonstate.edu>.
Randerson, J.T., Liu, H., Flanner, M.G., Chambers, S.D., Jin, Y., Hess, P.G., Pfister, G.,Mack, M.C., Treseder, K.K., Welp, L.R., Chapin, F.S., Harden, J.W., Goulden, M.L.,Lyons, E., Neff, J.C., Schuur, E.A.G., Zender, C.S., 2006. The impact of boreal forestfire on climate warming. Science 314, 1130–1132.
Ravenscroft, C., Scheller, R.M., Mladenoff, D.J., White, M.A., Forest restoration in amixed-ownership landscape under climate change. Ecological Applications vol.20, p. 327–346.

J.B. Bradford et al. / Forest Ecology and Management 308 (2013) 178–187 187
Reinikainen, M., D’Amato, A.W., Bradford, J.B., Fraver, S. Influence of canopydisturbance, forest age, stocking, and composition on sub-boreal aspenmixedwood carbon stores. Canadian Journal of Forest Research (in press).
Rogers, B.M., Neilson, R.P., Drapek, R., Lenihan, J.M., Wells, J.R., Bachelet, D., Law,B.E., 2011. Impacts of climate change on fire regimes and carbon stocks of theU.S. Pacific Northwest. Journal of Geophysical Research: Biogeosciences 116, n/a–n/a.
Ryan, M.G., Harmon, M.E., Birdsey, R.A., Giardina, C.P., Heath, L.S., Houghton, R.A.,Jackson, R.B., McKinley, D.C., Morrison, J.F., Murray, Brian C., Pataki, Diane E.,Skog, Kenneth E., 2010. A synthesis of the science on forests and carbon for U.Sforests. Issues in Ecology 13, 1–16.
SAS, 2001. System for Windows. Version 8.02 of the SAS System for Windows.Copyright � 1999–2001 SAS Institute Inc. Cary, NC (USA).
Schelhaas, M.J., Hengeveld, G., Moriondo, M., Reinds, G.J., Kundzewicz, Z.W., terMaat, H., Bindi, M., 2010. Assessing risk and adaptation options to fires andwindstorms in European forestry. Mitigation and Adaptation Strategies forGlobal Change 15, 681–701.
Scheller, R.M., Hua, D., Bolstad, P.V., Birdsey, R.A., Mladenoff, D.J., 2011. The effectsof forest harvest intensity in combination with wind disturbance on carbondynamics in Lake states Mesic forests. Ecological Modelling 222, 144–153.
Shinneman, D.J., Cornett, M.W., Palik, B.J., 2010. Simulating restoration strategies fora southern boreal forest landscape with complex land ownership patterns.Forest Ecology and Management 259, 446–458.
Smith, J.E., Heath, L.S. 2002. A model of forest floor carbon mass for United Statesforest types. Res. Pap. NE-722. Newtown Square, PA: U.S. Department ofAgriculture, Forest Service, Northeastern Research Station. 37 p.
Smith, J.E., Heath, L.S., Jenkins, J.C. 2003. Forest volume-to-biomass models andestimates of mass for live and standing dead trees of U.S. forests. Gen. Tech. Rep.NE-298. Newtown Square, PA: U.S. Department of Agriculture, Forest Service,Northeastern Research Station. 57 p.
Smith, J.E., Heath, L.S., Woodbury, P.B., 2004. How to estimate forest carbon for largeareas from inventory data. Journal of Forestry. 102, 25–31.
Stinson, G., Kurz, W.A., Smyth, C.E., Neilson, E.T., Dymond, C.C., Metsaranta, J.M.,Boisvenue, C., Rampley, G.J., Li, Q., White, T.M., Blain, D., 2011. An inventory-based analysis of Canada’s managed forest carbon dynamics, 1990–2008. Globalchange biology 17, 2227–2244.
USDA Soil Conservation Service. 1991. State soil geographic (STATSGO) data basedata use information. Misc. Publ. 1492. Fort Worth, TX: U.S. Department ofAgriculture, Soil Conservation Service, National Soil Survey Center.
USDA Soil Conservation Service. 1991. State soil geographic (STATSGO) data basedata use information. Misc. Publ. 1492. Fort Worth, TX: U.S. Department ofAgriculture, Soil Conservation Service, National Soil Survey Center. U.S.Department of Agriculture, F.S., 2010. National core field guide, volume 1:field data collection procedures for phase 2 plots, version 4.0 and Addendum.In: U.S. Department of Agriculture, Forest Service, Washington, DC (USA).
Westerling, A.L., 2006. Warming and earlier spring increase western U.S forestwildfire activity. Science 313, 940–943.
Westerling, A.L., Hidalgo, H.G., Cayan, D.R., Swetnam, T.W., 2006. Warming andearlier spring increase western U.S. forest wildfire activity. Science 313, 940–943.
Williams, C.A., Collatz, G.J., Masek, J., Goward, S.N., 2012. Carbon consequences offorest disturbance and recovery across the conterminous United States. GlobalBiogeochemical Cycles 26, GB1005.
Winjum, J.K., Dixon, R.K., Schroeder, P.E., 1992. Estimating the global potential offorest and agroforest management practices to sequester carbon. Water, Air, &Soil Pollution 64, 213–227.
Woodall, C.W., Nagel, L.M., 2007. Downed woody fuel loading dynamics of a large-scale blowdown in northern Minnesota, USA. Forest Ecology and Management247, 194–199.
Woodall, C.W., Heath, L.S., Domke, G.M., Nichols, M.C., 2011. Methods and equationsfor estimating aboveground volume, biomass, and carbon for trees in the USforest inventory, 2010. Gen Tech Rep NRS 88.
Woudenberg, S.W., Conkling, B.L., O’Connell, B.M., LaPoint, E.B., Turner, J.A.,Waddell, K.L., 2010. The forest inventory and analysis database: databasedescription and users manual version 4.0 for Phase 2. US Department ofAgriculture, Forest Service, Rocky Mountain Research Station.
Wythers, K.R., Reich, P.B., Bradford, J.B., 2013. Incorporating temperature-sensitiveQ10 and foliar respiration acclimation algorithms modifies modeled ecosystemresponses to global change. Journal of Geophysical Research: Biogeosciences118, 77–90.