Forest carbon and safeguards in Acre
39
System of Incentives for Environmental Services SISA of the State of Acre Accounting of Forest Carbon and Monitoring of Safeguards Rio Branco, May 14, 2015 Pavel Jezek, IMC
-
Upload
pavel-jezek -
Category
Environment
-
view
18 -
download
0
Transcript of Forest carbon and safeguards in Acre

System of Incentives for Environmental Services SISA of the State of Acre
Accounting of Forest Carbon and Monitoring of Safeguards
Rio Branco, May 14, 2015Pavel Jezek, IMC

Deforested area, water bodies, forest, non-forest, river beach, urban area
Land Use of the State of Acre

Sustainable Economy for the People, Benefitting from Environmental Services

Conservação do solo Cultura e conhecimento tradicional
Conhecer- Dados e informações dos serviços ambientais - Estudos básicos- Análises Integradas- Zoneamentos
Valorar-Análise Custo de oportunidade- Valor de mercado- Análise de Custo de reposição- Serviços Ecossistêmicos
Criar ativo-Estruturar sistemas (nacionais, sub-nacionais e Locais)- Cooperação Governamental- Setor Privado
Produtor Rural Provedor Beneficiário
Law Nº 2.308 from 2010
Promote the Supply of Environmental Services, Turning The Providers into Beneficiaries
água
biodiversidade Regulação do clima Beleza cênica Carbono
System of Incventives for Environmental Services SISA of the State of Acre
IDEN
TIF
ICA
DO
EM
CA
DA
ETA
PA

Instituições criadas pela Lei 2.308/2010.
Institutional Arrangement of the SISA

Benefit sharing through existing programs• Financial Ressources and Commercial
Management Instruments: State Forest Fund FEF and Company for Development of Environmental Services CDSA;
• Benefits for services related to conservation, as well as, flux (emmission) reduction of forest carbon;
• Benefit sharing through existing programs (sustainable land use, extractivism, small scale agriculture, sustainable lifestock;)
• Indigenous communities, Conservation Units;
• Settlement Projects, Private Properties; • Transition to low carbon emission
economy.
Jurisdictional ISA Carbon Program

1995
1996
1997
1998
1999
2000
2001
2002
2003
2004
2005
2006
2007
2008
2009
2010
2011
2012
2013
2014
2015
2016
2017
2018
2019
2020
0
200
400
600
800
1000
1200
1400
Deforestation (km2)
Desmatamento (km2)
Des
mta
men
to (k
m2)
Fonte: INPE (2012)
1st Phase 2nd Phase
ISA Carbon ProgramCreditting Periods
Program Initiation Program Creation by Law 2.308 from 2010
Inicia em 2006 quando as políticas adotadas no periodo de 1999 a 2006 se refletem na queda das taxas de desmatamento
Inicia em 2010 a partir da criação do programa pela Lei do SISA e vai até 2020 compatível com o Plano Nacional de Mudança Climática e do PPCD/AC
1er. Período de Creditação (2006 - 2010)
1er. Período de Creditação (2011 - 2020)
O Potencial de reduções atingida pelo programa em 15 anos (1a e 2da fases) deve chegar a 183,9 MtcO2

• Regulation of National Climate Change Plan PNMC in progress (is taken in consideration);
• Local Deforestation Prevention and Control Plan PPCD of Acre defines reduction goals;
• Program phase: 1 Before SISA Law (2010)2 After SISA Law .
Reference Level, National and Local Policies
19951996
19971998
19992000
20012002
20032004
20052006
20072008
20092010
20112012
20132014
20152016
20172018
20192020
-
200
400
600
800
1,000
1,200
1,400
Km2 / ano Reduções NR Estadual NR Federal
Reference Level 1st phase: 602 km2
Reference Level 2nd phase: 496 km2

A partir da implementação das estratégias do governo o Acre teria as seguintes reduções:• Na primeira fase (2006 –
2010) o estado já deixou de emitir aprox. 79MtCO2 do desmatamento com relação ao nível de referencia.
• Na segunda fase, o estado teria um potencial de redução de 141 MtCO2
• O Programa nas duas fases teria um potencial de aprox. 220MtCO2 de reduções.
Performance of Reduction of DeforestationReduction of Emissions of the ISA Carbon Program
19951996
19971998
19992000
20012002
20032004
20052006
20072008
20092010
20112012
20132014
20152016
20172018
20192020
-
200
400
600
800
1,000
1,200
1,400
Km2 / ano Reduções NR Estadual NR Federal
Emissões reduzidas79 MtCO2
Estimativa de potencial de reduções:141 MtCO2

Notes:The State of Acre preserves the alignment with national policies (PNMC, FREL, PPCD/AC, SISA);
PRODES is used as oficial data source and UCEGEO as local policy and control tool;
Further Notes:Reference levels of average deforestation rate in Acre from 1996 to 2005 602 km²/a and from 2001 to 2010 496 km²/a Average carbon mass according to SALIMON et al 2011 123,5 tC/ha for the forests types of the State of Acre;


Anual Deforestation Rate (km²/a) x 100 ha/km² x 123,5 tCe/ha x 44/12 tCO2/tC = Total Anual Reduction of Emissions (tCO2/a)

Tabela - Desflorestametno anual no Estado do acre segundo PRODES DE 2006 A 2014 com as respectivas reduções de emissões em tCO2 com relação ao nível de referência.
Ano FlorestalNível de
Referencia (km2)Desflorestamento Verificado (km2)
Redução relacionado ao NR
(km2)
Redução relacionado ao NR
(ha)Redução (123 tC/ha)
Redução de Emissões tCO2 (Fator de
Conversão 3,67)
Total de Emissões Reduzidas
(MtCO2)
2006 602 398 204 20.400 2.509.200 9.208.764 9,21
2007 602 184 418 41.800 5.141.400 18.868.938 18,87
2008 602 254 348 34.800 4.280.400 15.709.068 15,71
2009 602 167 435 43.500 5.350.500 19.636.335 19,64
2010 602 259 343 34.300 4.218.900 15.483.363 15,48
2011 496 280 216 21.600 2.656.800 9.750.456 9,75
2012 496 305 191 19.100 2.349.300 8.621.931 8,62
2013* 496 221 275 27.500 3.382.500 12.413.775 12,41
2014** 496 312 184 18.400 2.263.200 8.305.944 8,31
Total 117.998.574 118,0
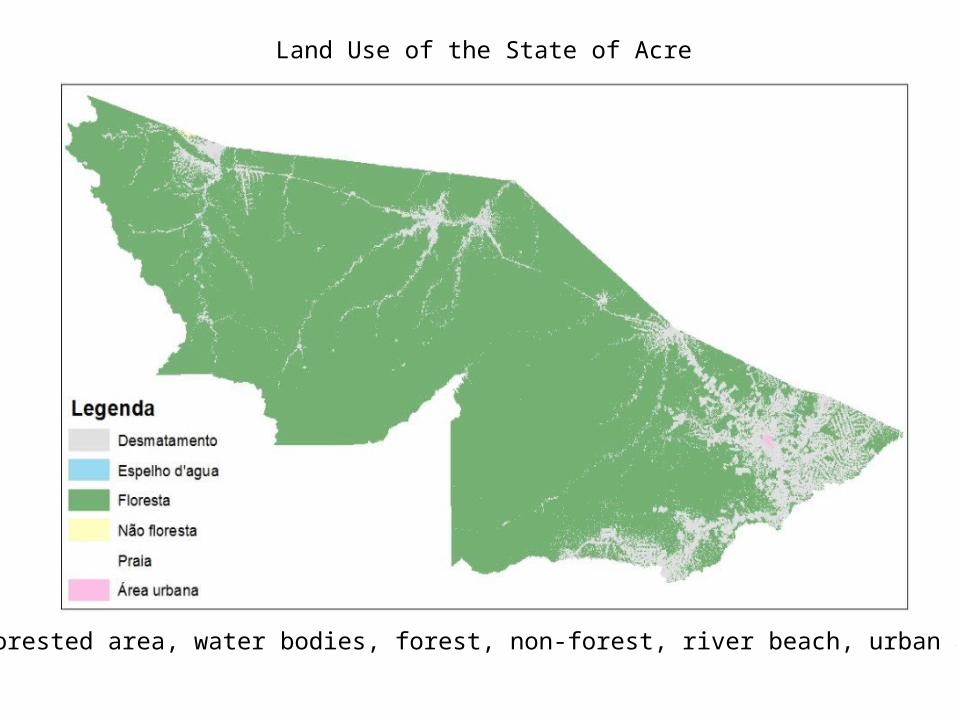
Ano
REs Reserva Técnica LiquidoReserva Proj.
Privados Pagamento por
performance/KFW Saldo
(MtCO2) 10% MtCO2 (MtCO2) REs Esforço Proprio REs
2006 9,21 0,92 8,29 8,3
2007 18,87 1,89 16,98 17,0
2008 15,71 1,57 14,14 14,1
2009 19,64 1,96 17,67 17,7
2010 15,48 1,55 13,94 1,53 12,4
2011 9,75 0,98 8,78 0,98 7,8
2012 8,62 0,86 7,76 0,86 0,5 0,5 5,9
2013 12,41 1,24 11,17 1,24 5,02 4 0,9
2014 8,31 0,83 7,48 0,83 6,6
Total 118,00 11,80 106,20 3,91 5,52 6,03 90,7

Years
Estimated total GHG emission reductions
and/or removals (tCO2e) (from above
table)
Estimated REDD+ GHG credits issued by non-VCS programs or
projects (tCO2e)
Estimated GHG credits issued by non-forest
activities in same boundary (tCO2e)
Estimated emission reductions and/or removals
from nested jurisdictions and projects (tCO2e)
(Scenario 2 only)
Estimated net GHG emission
reductions and/or removals
attributed to the jurisdiction
(tCO2e)
2006
9.208.764 0 0 9.208.764
2007 18.868.938 0 0 18.868.938 2008 15.709.068 0 0 15.709.068 2009 19.636.335 0 0 19.636.335 2010 15.483.363 1.530.000,00 0 0 13.953.363
2011
9.750.456 0
975.046 8.775.410
2012
8.621.931 1.000.000,00 0
862.193 6.759.738
2013 12.413.775 9.020.000,00 0
1.241.378 2.152.398
2014
8.305.944 1.000.000,00 0
830.594 6.475.350
2015 14.373.352 900.000 0
1.437.335 12.036.017
2016 15.175.010 0
1.517.501 13.657.509
2017 15.896.503 0
1.589.650 14.306.853
2018 16.545.846 0
1.654.585 14.891.262
2019 17.130.255 0
1.713.026 15.417.230
2020 17.656.223 0
1.765.622 15.890.601
TOTAL 214.775.763
13.450.000 0
13.586.930 187.738.834


Reduções de
Emissões
Verificadas/out
ros ativos
Programa ISA Carbono/outros
Programas
System of Registry


Redução do desmatamento
Registro na MARKIT Remuneração
Ano florestal Linha de base (2001-2010)
Taxa anual de desmatamento
no AcreReducao do
desmatamentoReducao de emissoes por
desmatamentoRE remuneradas
REM IRE contribuicao propria REM I
RE remuneradas REM II
RE contribuicao propria REM II
Registrado por ano
Ano de remuneracao Parcelas REM I Parcela
REM II
km2/a km2/a km2/a MtCO2e MtCO2e MtCO2e MtCO2e MtCO2e MtCO2e EUR mi R$ mi EUR mi R$ mi
2009-2010 602 259 343 15,48 1,53 1,53
2010-2011 496 280 216 9,75
2011-2012 496 305 191 8,62 0,5 0,5 1 2012 1,9 5,7
2012-2013 496 221 275 12,41 2,55 1,53 2,47 2,47 9,02 2013 9,3 27,9 9 27
2013-2014 496 312 184 8,31 (0,95) (0,95) 2014 (4,8) (14,4)
2014-2015 2015
Acumulado 54,57 11,55 11,2 33,6 9 27
Disponivel 43,02
1 tCO2e = USD 5
Global REDD for Early Movers (REM Program of the KFW German Development Bank) Result-based contribution for REDD- Readiness of the State of Acre
Institutionalization of social and environmental safeguards
REDD+ SES in Acre

Instituições criadas pela Lei 2.308/2010.
Institutional Arrangement of the SISA
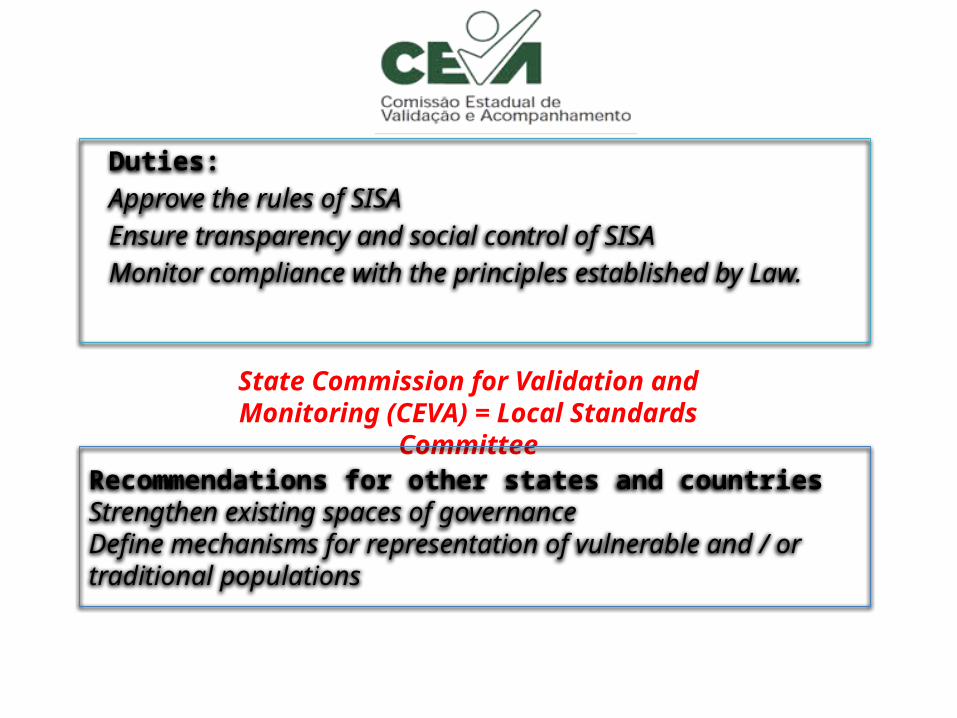
Duties: Approve the rules of SISA Ensure transparency and social control of SISA Monitor compliance with the principles established by Law.
State Commission for Validation and Monitoring (CEVA) = Local Standards Committee
Recommendations for other states and countries Strengthen existing spaces of governance Define mechanisms for representation of vulnerable and / or traditional populations

Created in 2010 by Law 2308, represents the instance of participation of the civil society in monitoring of the implementation of actions of the System of Incentives for Environmental Services - SISA in the State of Acre.

Attributions of CEVA
• Ensure transparency and social control of programs, subprograms, action plans and projects;
• Review and approve the proposed supplementary rules SISA; • Opine on terms of reference for hiring independent external audits
of the SISA and define, together with BMI, the minimum requirements for approval of the same;
• Analyze the results of independent audits and recommend the permanent improvement of the SISA;
• Prepare and submit annual reports of its activities to the Group of Councils;
• Request information and documents related to planning, management and implementation of programs, subprograms and projects linked to SISA.

Monitoring, Reporting, and Verification


Principles of the REDD+ SES
Principle 1 - Os Land rights respected by SISA e seus Programas;
Principle 2 – Equitative benefit sharing among the stakeholders;
Principle 3 - SISA and its programs improve the livelihood security, especially for vulnerable groups;
Principle 4 - - SISA and its programs contribute to good governance;
Principle 5 - SISA and its programs maintain biodiversity and ecosystem services;
Principle 6 – All stakeholders participate effectively in SISA and its programs
Principle 7 - SISA and its programs comply with local, national laws and relevant intenational agreements

Consultation workshops; workshops for review and validation; workshops on strategic and operational planning; Sectoral preparatory meetings; support the organization and implementation of special and regular meetings of CEVA
What events were organized with the CEVA?
Meetings and Workshops for Awareness and Training
With whom were organized events?
- NGOs working in Acre (national, regional and local); - Government institutions (federal, state and local); - Associations and organizations representing the private sector; - Indigenous farmers, gatherers, men and women, and youth; - CEVA.

CEVA and Indigenous Working Group
• Prior to their creation, the collegiate of councils had the opportunity to participate in the public consultation of Acre indicators and preparatory meetings for the electoral process and the Workshop Learning Exchange and Acre;
• After their creation, participation refers to meetings and workshops for discussion and validation of Acre indicators and their monitoring plan, as well as events for institutional strengthening (planning workshops, workshop in Guatemala, with IMAFLORA workshop and regular and extraordinary meetings .
Meetings and Workshops for Awareness and Training

• Monitoring and evaluation of the implementation of the governance structure of social and environmental standards for REDD+ in long term for the SISA;
• Search for ensuring compliance with social and environmental safeguards of the SISA, from the validation of the monitoring process related to compliance of the principles and criteria of these standards in the implementation in Acre;
• Participation in Exchange and Learning Workshops of the International Initiative for strengthening and capacity building;
• Possibility of continuity of strategic cooperation with IMAFLORA.
Opportunities for CEVA as the Local Standards Committee


Monitoring and Assessment Manual (IMAFLORA, 2013)

http://www.imc.ac.gov.brPublic Consultation of the Safeguard Evaluation Report
7th october to 7th november 2014


HighlightsThe participatory workshops on adjustment of international indicators contributed to disseminate the knowledge about environmental services and safeguards, still support for capacity building is required (CARE cooperated in facilitation with IMC, CEVA, Indigenous Working Group, monitoring manual and capacity building supported by IMAFLORA);
The institutionalization process required legal and policy knowledge, discussion on local scale details, and at the same time, a global partnership vision was created (cooperation CEVA, IMC as executive secretary);
The CEVA exchanges information as “extended arm” to the councils, assuming their role responsibly and turning to be a key participation and monitoring instrument of the SISA;
The recommendations from the public consultations are incorporated in the final report and form the base for the action plan to approach the identified gaps in the self-evaluation (compliance of gender justice, land right definition, transparency, participatory decision processes etc.);

Where are we now?The availability and compliance of safeguard instruments at jurisdictional level are monitored by CEVA and IMC;
After accomlishing the 10 steps of REDD+ SES, Acre will implement na Action Plan to fill the identified gaps (transparency, gender equity, participation, monitoring of biodiversity) and to consolidate the Safeguard Information System SIS;
CEVA and IMC are ready to monitor the compliance of safeguards and the benefits from environmental services at project level (example: Free, Prior, and Informed Consent FPIC protocole).

Future steps: SISA and SIS will be enhanced by validation and verification, formalizing instruments and procedures of monitoring, and improving cooperation and commercial opportunities;
Scenarios for REDD+ implementation and finance:Participation has to be intensified in regulated and voluntary markets, pledging for additional state budget for CEVA activities as part of SISA operation, and capacity building, as well as external consultancy services should be realized for support;
Initiatives and safeguard information systems: Private SISA-nested initiatives with safeguard implementation should be stimulated, involving an increasing number of actors;
Thank you!