Forest Biomass Estimation Using Texture Measurements of High ...
14
IEEE TRANSACTIONS ON GEOSCIENCE AND REMOTE SENSING, VOL. 51, NO. 6, JUNE 2013 3371 Forest Biomass Estimation Using Texture Measurements of High-Resolution Dual-Polarization C-Band SAR Data Md. Latifur Rahman Sarker, Janet Nichol, Huseyin Baki Iz, Baharin Bin Ahmad, and Alias Abdul Rahman Abstract—Recent synthetic aperture radar (SAR) sensors with a capability of providing data with varying spatial resolutions, polarizations, and incidence angles have attracted greater in- terest for forest biomass and carbon storage estimation. This study investigates the capability of RADARSAT-2 fine-beam dual- polarization (C-HV and C-HH) data for forest biomass estimation in complex subtropical forest, with different types of process- ing: 1) raw intensity data (both polarizations separately and as polarization ratio) and 2) texture parameters of both po- larizations (separately, jointly, and as polarization ratio). Field data (diameter at breast height and height) were collected from 53 field plots and converted to biomass (dry weight) using a newly developed allometric model. Finally, biomass estimation models were developed between SAR signatures from different processing steps and field plot biomass using stepwise multiple regression. All biomass estimation models using radar intensity data (C-HV, C-HH, and ratio of C-HV and C-HH) proved ineffective, but texture parameters derived from intensity data showed potential. We were able to estimate forest biomass amounts up to 360 t/ha with a goodness of fit of 0.78 (adjusted r 2 ) and an rmse of 28.68 t/ha using the combination of texture parameters of both polarizations (C-HV and C-HH). However, goodness of fit could be improved to 0.91 (adjusted r 2 ) and an rmse of 26.95 t/ha for biomass levels up to 532 t/ha using the ratio of texture parameters of C-HV/C-HH. The result is very encouraging and indicates that the dual-polarization C-band SAR sensor has a potential for the estimation of forest biomass, particularly using the polarization ratio of texture measurements, and biomass estimation can be improved substantially beyond the previously stated saturation level for C-band SAR. Index Terms—Carbon storage capacity, forest biomass, RADARSAT-2, texture measurement, texture ratio. Manuscript received July 29, 2011; revised March 19, 2012 and July 15, 2012; accepted August 30, 2012. Date of publication November 16, 2012; date of current version May 16, 2013. This work was supported in part by the Hong Kong Research Grants Council under General Research Fund Grant PolyU5281/09E and in part by Universiti Teknologi Malaysia under Grant FAVF-4D059. M. L. R. Sarker is with the Department of Remote Sensing, Universiti Teknologi Malaysia, Johor Bahru 81310, Malaysia, and also with the De- partment of Geography and Environmental Studies, University of Rajshahi, Rajshahi 6100, Bangladesh (e-mail: [email protected]). J. Nichol and H. B. Iz are with the Department of Land Surveying and Geo- Informatics, The Hong Kong Polytechnic University, Kowloon, Hong Kong (e-mail: [email protected]; [email protected]). B. B. Ahmad is with the Department of Remote Sensing, Universiti Teknologi Malaysia, Johor Bahru 81310, Malaysia (e-mail: baharinahmad@ utm.my). A. A. Rahman is with the Department of Geoinformatics, Universiti Teknologi Malaysia, Johor Bahru 81310, Malaysia (e-mail: [email protected]). Color versions of one or more of the figures in this paper are available online at http://ieeexplore.ieee.org. Digital Object Identifier 10.1109/TGRS.2012.2219872 I. I NTRODUCTION E STIMATION of forest biomass at regional and global scales is essential for understanding and monitoring ecosystem response to climate change for greenhouse gas in- ventories, terrestrial carbon accounting, and climate change modeling [1]–[4]. Traditional methods of forest biomass es- timation are the most accurate but are time consuming and destructive and, as a result, are limited only to small areas [5]. Remote sensing offers an effective alternative method for forest biomass and carbon inventory at local, regional, and global scales [6], [7]. Studies have been conducted for forest biomass estimation using optical sensors [8]–[12], synthetic aperture radar (SAR) sensors [13]–[18], Lidar [19], and multisensors [20], [21] with varying degrees of success. Among the different types of sensors, SAR shows great potential for forest biomass estimation because of its sensitivity to the plant canopy coupled with penetration ability [7]. Past studies have indicated that L-band cross polarization (L-HV) is the most suitable available choice (as no P-band spaceborne SAR is planned), but C-band SAR is also effective for less woody biomass. Research works [1], [2], [7], [22] have shown that, on average, C-band data saturate below 50 t/ha, L-band data saturate at less than 100t/ha, and P-band data saturate at less than 200 t/ha of biomass. The new generation of spaceborne SAR sensors, i.e., L-band PALSAR (no longer operational), C-band RADARSAT-2, X-band TerraSAR, and Cosmo Skymed, has provided new op- portunities for forest biomass estimation using SAR because of the ability to provide data with varying spatial resolutions, po- larizations, and incidence angles. Although the new SAR data are more attractive than the previous generation of spaceborne SAR, i.e., JERS-1, ERS-1/-2, and RADARSAT-1, previous studies indicated that improvement of forest biomass estimation not only depends on the SAR data but also requires effective SAR data processing [22] such as texture measurement. Texture measurement is the most important source of information in high-resolution SAR images [23], [24], and image texture is capable of identifying different aspects of forest stand structure, including age, density, and leaf area index [25]. Texture is a function of local variance in the image which is related to the spatial resolution and the size of the dominant scene objects [26]. In forested landscapes, texture is depen- dent on the size and spacing of tree crowns, such that, on 0196-2892/$31.00 © 2012 IEEE
Transcript of Forest Biomass Estimation Using Texture Measurements of High ...

IEEE TRANSACTIONS ON GEOSCIENCE AND REMOTE SENSING, VOL. 51, NO. 6, JUNE 2013 3371
Forest Biomass Estimation Using TextureMeasurements of High-Resolution
Dual-Polarization C-BandSAR Data
Md. Latifur Rahman Sarker, Janet Nichol, Huseyin Baki Iz, Baharin Bin Ahmad, and Alias Abdul Rahman
Abstract—Recent synthetic aperture radar (SAR) sensors witha capability of providing data with varying spatial resolutions,polarizations, and incidence angles have attracted greater in-terest for forest biomass and carbon storage estimation. Thisstudy investigates the capability of RADARSAT-2 fine-beam dual-polarization (C-HV and C-HH) data for forest biomass estimationin complex subtropical forest, with different types of process-ing: 1) raw intensity data (both polarizations separately andas polarization ratio) and 2) texture parameters of both po-larizations (separately, jointly, and as polarization ratio). Fielddata (diameter at breast height and height) were collected from53 field plots and converted to biomass (dry weight) using a newlydeveloped allometric model. Finally, biomass estimation modelswere developed between SAR signatures from different processingsteps and field plot biomass using stepwise multiple regression.All biomass estimation models using radar intensity data (C-HV,C-HH, and ratio of C-HV and C-HH) proved ineffective, buttexture parameters derived from intensity data showed potential.We were able to estimate forest biomass amounts up to 360 t/hawith a goodness of fit of 0.78 (adjusted r2) and an rmse of28.68 t/ha using the combination of texture parameters of bothpolarizations (C-HV and C-HH). However, goodness of fit couldbe improved to 0.91 (adjusted r2) and an rmse of 26.95 t/ha forbiomass levels up to 532 t/ha using the ratio of texture parametersof C-HV/C-HH. The result is very encouraging and indicates thatthe dual-polarization C-band SAR sensor has a potential for theestimation of forest biomass, particularly using the polarizationratio of texture measurements, and biomass estimation can beimproved substantially beyond the previously stated saturationlevel for C-band SAR.
Index Terms—Carbon storage capacity, forest biomass,RADARSAT-2, texture measurement, texture ratio.
Manuscript received July 29, 2011; revised March 19, 2012 and July 15,2012; accepted August 30, 2012. Date of publication November 16, 2012; dateof current version May 16, 2013. This work was supported in part by theHong Kong Research Grants Council under General Research Fund GrantPolyU5281/09E and in part by Universiti Teknologi Malaysia under GrantFAVF-4D059.
M. L. R. Sarker is with the Department of Remote Sensing, UniversitiTeknologi Malaysia, Johor Bahru 81310, Malaysia, and also with the De-partment of Geography and Environmental Studies, University of Rajshahi,Rajshahi 6100, Bangladesh (e-mail: [email protected]).
J. Nichol and H. B. Iz are with the Department of Land Surveying and Geo-Informatics, The Hong Kong Polytechnic University, Kowloon, Hong Kong(e-mail: [email protected]; [email protected]).
B. B. Ahmad is with the Department of Remote Sensing, UniversitiTeknologi Malaysia, Johor Bahru 81310, Malaysia (e-mail: [email protected]).
A. A. Rahman is with the Department of Geoinformatics, UniversitiTeknologi Malaysia, Johor Bahru 81310, Malaysia (e-mail: [email protected]).
Color versions of one or more of the figures in this paper are available onlineat http://ieeexplore.ieee.org.
Digital Object Identifier 10.1109/TGRS.2012.2219872
I. INTRODUCTION
E STIMATION of forest biomass at regional and globalscales is essential for understanding and monitoring
ecosystem response to climate change for greenhouse gas in-ventories, terrestrial carbon accounting, and climate changemodeling [1]–[4]. Traditional methods of forest biomass es-timation are the most accurate but are time consuming anddestructive and, as a result, are limited only to small areas [5].Remote sensing offers an effective alternative method for forestbiomass and carbon inventory at local, regional, and globalscales [6], [7]. Studies have been conducted for forest biomassestimation using optical sensors [8]–[12], synthetic apertureradar (SAR) sensors [13]–[18], Lidar [19], and multisensors[20], [21] with varying degrees of success.
Among the different types of sensors, SAR shows greatpotential for forest biomass estimation because of its sensitivityto the plant canopy coupled with penetration ability [7]. Paststudies have indicated that L-band cross polarization (L-HV)is the most suitable available choice (as no P-band spaceborneSAR is planned), but C-band SAR is also effective for lesswoody biomass. Research works [1], [2], [7], [22] have shownthat, on average, C-band data saturate below 50 t/ha, L-banddata saturate at less than 100t/ha, and P-band data saturate atless than 200 t/ha of biomass.
The new generation of spaceborne SAR sensors, i.e., L-bandPALSAR (no longer operational), C-band RADARSAT-2,X-band TerraSAR, and Cosmo Skymed, has provided new op-portunities for forest biomass estimation using SAR because ofthe ability to provide data with varying spatial resolutions, po-larizations, and incidence angles. Although the new SAR dataare more attractive than the previous generation of spaceborneSAR, i.e., JERS-1, ERS-1/-2, and RADARSAT-1, previousstudies indicated that improvement of forest biomass estimationnot only depends on the SAR data but also requires effectiveSAR data processing [22] such as texture measurement. Texturemeasurement is the most important source of information inhigh-resolution SAR images [23], [24], and image texture iscapable of identifying different aspects of forest stand structure,including age, density, and leaf area index [25].
Texture is a function of local variance in the image which isrelated to the spatial resolution and the size of the dominantscene objects [26]. In forested landscapes, texture is depen-dent on the size and spacing of tree crowns, such that, on
0196-2892/$31.00 © 2012 IEEE

3372 IEEE TRANSACTIONS ON GEOSCIENCE AND REMOTE SENSING, VOL. 51, NO. 6, JUNE 2013
Fig. 1. Study area and distribution of field plots.
high-resolution images, if a pixel falls on a tree, its neighbormay also fall on the same tree, resulting in a low local vari-ance. As the resolution increases to a level comparable to thedominant tree crown size, local variance increases, and thisshould be particularly true in tropical forests with high speciesdiversity where stands are heterogeneous [27]. The advantageof texture is that it can maximize the discrimination of spatialinformation independently of tone (i.e., backscatter), and thispotentially increases the biomass range that can be measuredwith SAR data by increasing the saturation level [28], [29].Previous research indicates that texture parameters are veryuseful for land cover and vegetation classification [30], [31],but image texture and its relation with forest biomass have notyet been fully investigated [17], [25], [28] probably due to thedifficulty of selecting appropriate texture measures along withwindow size [32], [33] as well as the previous unavailabilityof high-resolution spaceborne SAR which is believed to be asource of better texture information in SAR images [28].
However, considering the necessity of forest biomass esti-mation and the opportunity to investigate texture measurementin combination with the data from new SAR sensors, thispaper examines advanced SAR (RADARSAT-2) data for forestbiomass estimation using different types of texture parametersand processing techniques. The C-band RADARSAT-2 SARwas selected because the L-band PALSAR is no longer avail-able and Cosmo Skymed and TerraSAR are X-band. AlthoughRADARSAT-2 uses C-band, it can provide data with differentpolarizations with varying incidence angles as well as highspatial resolution, and our approach is to utilize the benefits ofspatial resolution and wavelength, considering the observationsof previous studies [28], [34], [35] about RADARSAT-2; allof which mentioned that C-band SAR can provide excellenttexture properties for biomass estimation when it is acquiredat a high spatial resolution.
A. Objectives
This paper aims to improve the estimation of forest biomassusing SAR data. Other more specific objectives are the follow-ing: 1) to develop an allometric model which will be usefulfor future biomass estimation in Hong Kong and other places
in the subtropical evergreen forest zone; 2) to investigate theefficiency of SAR intensity and SAR texture parameters ofboth polarizations individually, jointly, and as a ratio for theestimation of forest biomass; 3) to investigate the different typesof texture measurements of SAR data both individually andjointly for forest biomass estimation; and 4) to find a best fitmodel for forest biomass estimation using multiscale texturemeasurement of high-resolution dual-polarization C-band SAR.
II. STUDY AREA AND DATA
A. Study Area and Forest
The study area for this research is the Hong Kong SpecialAdministrative Region (Fig. 1) which lies on the southeastcoast of China and just south of the Tropic of Cancer. Thetotal land area of Hong Kong is 1100 km2 which includes235 small outlying islands. Approximately 40% of the total areais designated as country parks which are reserved for naturalvegetation under the management of the Agriculture, Fisheriesand Conservation Department (AFCD).
The forests of Hong Kong were subtropical, dense, and lush,dominated by evergreen trees belonging to the oak and laurelfamilies. By the late 1940s, Hong Kong was largely barren andwithout trees due to the widespread cutting of fuel during theSecond World War. However, during the 1950s, 1960s, 1970s,and up to the early 1980s, hardy and fast-growing pioneerspecies such as Chinese Red Pine, Acacia, and Brisbane Boxwere widely planted. Because of the extensive tree plantationof native and nonnative (including Machilus species, Lophoste-mon, Eucalyptus species, Acacia species, Pine, Castonopisis,and Malaluca), prohibition of tree cutting, and the naturalgrowth of new young forests, the forest succession is ongoing.As a result, the native subtropical evergreen broad leaf foresthas been replaced by a complex patchwork of regenerating sec-ondary forest in various stages of development and plantations.
B. Data
A dual-polarization (HV and HH) C-band fine-beam image(January 1, 2009) from the RADARSAT-2 SAR satellite imagewith approximate resolution of 10.4 to 6.8 m in range and

SARKER et al.: FOREST BIOMASS ESTIMATION USING TEXTURE MEASUREMENTS 3373
Fig. 2. Overall methodology.
7.7 m in azimuth directions was used in this study. The inci-dence angle of the data was 34.2◦.
III. METHODOLOGY
This study comprises two parts, i.e., allometric model devel-opment for field biomass and SAR image processing (Fig. 2).Field measurement of DBH and height was carried out in53 plots, and the field DBH data were converted into fieldbiomass using a newly developed allometric model. SARintensity data were converted into backscattering coefficient,and texture measurements were carried out for each polariza-tion. After geometric correction, all texture parameters weredivided into five processing groups: 1) intensity images (HVand HH individually and as ratio); 2) texture parameters ofHV polarization; 3) texture parameters of HH polarization;4) texture parameters of HV and HH polarizations jointly; and5) ratio of texture parameters of HV and HH polarizations. Themean intensity of SAR data was extracted using an area ofinterest mask corresponding to the 53 field plots, and multiplelinear regression was performed between SAR parameters andfield plot biomass. The aforementioned methodology is detailedin the following.
A. Allometric Model Development
The complex history of Hong Kong forest makes it difficultto find an effective existing allometric model which includes arepresentative sample of trees. Therefore, an allometric modelwas developed by harvesting 75 trees (from 14 dominantspecies) in four DBH classes (less than 10 cm, 10–15 cm,15–20 cm, and 20 cm and above). The harvested trees wereseparated into fractions including leaves, twigs, small branches,large branches, and stem. The measurements of DBH, height,fresh weight, and dry weight (DW) were taken for all harvestedtrees following the procedures of previous studies [5], [6], [36].Tree parameters such as DBH and DW were used for thedevelopment of the allometric model considering DW as thedependent variable and DBH and height as independent vari-ables. Twelve regression models used by previous researchers[6], [36], [37] were tested, and the best fit model (InDW =a+ b ∗ InDBH) was found using the log-transformed DBHand DW as dependent and independent variables, respectively,in the least square regression model. The bias of the modelwas corrected according to Baskerville’s method [38] multi-plying by the correction factor “exp (mse/2 or S2
ε/2).” Theperformance of the allometric model (Table I) was highly

3374 IEEE TRANSACTIONS ON GEOSCIENCE AND REMOTE SENSING, VOL. 51, NO. 6, JUNE 2013
TABLE IBEST FIT ALLOMETRIC MODEL
TABLE IIFIELD BIOMASS/DW DISTRIBUTION IN GENERAL AND BASED ON PLOT SETTINGS
satisfactory considering the adjusted r2 (0.93), fit index (0.90),rmse (13.52 t/ha), and p-value (0.0005), and in view of the greatvariety of tree species, this performance is similar to that ofseveral other studies [6], [36].
B. Field Plot Measurement and Field Biomass Estimation
Because forest area of Hong Kong is mostly inaccessibledue to topographic conditions, random or stratified samplingcould not be used for field plot selection. Therefore, after fieldinvestigation and consultation with AFCD ecologists, purposivesampling was conducted for the selection of 53 field plots tocover a variety of tree stands (from low to high biomass), andall the plots were established on flat and steady slope areasavoiding rugged terrain. Circular plots with a 15-m radius weredetermined considering the image resolution, orthorectificationerror, and GPS positioning error, and plots were positionedwithin a homogeneous area of forest and at least 15 m distant
from other features such as roads, water bodies, and otherinfrastructure. A Leica GS5+ GPS was used to determinethe center of each plot using Differential Global PositioningSystem (DGPS) mode for accuracy within ±3 m. Both DBHand tree height were measured for all trees within the circularplot region. The measured DBH of each tree as well as each plotwas converted into plot biomass (Table II) using the allometricmodel developed for this study area.
Finally, from the initial investigation and considering thediversity of tree species and growing stage of some plots, wedivided the field plot biomass into two different plot settings(Table II): 1) 53-plot setting, where the maximum biomass is532 t/ha and the forest structure and species composition ofsome plots are heterogeneous, and 2) 45-plot setting, wherethe maximum biomass is 360 t/ha and the forest structure andspecies composition in the plots are more homogeneous. Bothplot settings were used for data analysis for all processingcombinations.

SARKER et al.: FOREST BIOMASS ESTIMATION USING TEXTURE MEASUREMENTS 3375
TABLE IIIFORMULA OF TEXTURE MEASUREMENTS USED IN THIS STUDY
C. SAR Data Processing
1) Calculation of Backscattering Coefficient: Before tex-ture measurement, the image was converted from digital num-ber to a calibrated backscattering coefficient
Calibrated value =DN2 +B
A(1)
where “DN” is a complex number, calibrated value is the sigmanought in power, B is the offset, and A is the gain. The sigmanought in power image was then converted to scaled intensityto use as an input for texture measurement mainly because thescaled intensity image provides a better dynamic range over lowbackscattering targets [30]. Subsequently, conversion to sigmanought in power and sigma nought in decibels was carried outfor model development.

3376 IEEE TRANSACTIONS ON GEOSCIENCE AND REMOTE SENSING, VOL. 51, NO. 6, JUNE 2013
Fig. 3. Accuracy of different models using different intensity data.
Fig. 4. Comparison of accuracy among intensity (HH, HV, and HV/HH) andHH texture parameters.
2) Texture Analysis: Image texture is characterized as thespatial variability in image tone and arises from the heterogene-ity in target properties giving rise to different neighboring pixelvalues for the same apparent target type [28]. Several methodsand techniques for describing texture based on statistical mod-els have been developed [29]–[31]; however, three groups oftexture algorithms were selected because these are commonlyused, easy to implement, and can provide complementary in-formation in the forest biomass estimation model.
The first group is the gray-level co-occurrence matrix(GLCM) [26]-based texture measurements (column 1 inTable III) which considers the relation between two neighbor-ing pixels in one offset, as the second-order texture. In this
Fig. 5. Comparison of accuracy among intensity (HH, HV, and HV/HH),HH texture, and HV texture parameters.
texture algorithm, the gray value relationships in a target aretransformed into the co-occurrence matrix space by a givenkernel mask such as 3 ∗ 3, 5 ∗ 5, and 7 ∗ 7. The secondgroup of texture algorithms (column 2 in Table III) is the sumand difference histogram (SADH) [39], where the sum anddifference of two random variables with the same variancesare decorrelated and the principal axes of their associatedjoint probability function are defined. Two maximum likelihoodtexture classifiers are presented depending on the type of objectused for texture characterization. The third group is model-based log form texture algorithms (column 3 in Table III)reported by Oliver [40] and Oliver and Quegan [35] whichpresented a correlated K-distribution model for SAR imagepixels with parameters defining spatial correlation lengths inx- and y-dimensions along with a spatial frequency componentin one direction to model periodic variation in the autocorre-lation function. Texture measures extracted by this algorithmare based on SAR-specific statistics of pixel values in therectangular window of user-specified dimensions.
All texture algorithms were carried out using small tomedium window sizes (from 3 × 3 to 9 × 9) consideringthe resolution of the image and the forest structure of thisstudy area. Four texture measurement directions (0◦, 45◦, 90◦,and 135◦) were specified for the processing and texture mea-surements used in the research are named TEX for GLCM-based texture measurement, HISTEX for SADH-based textureparameter, SARTEX for model-based log form texture parame-ter, and ALLTEX for all texture classes together. The texturemeasurement was performed before geometric correction sothat the original image resolution can be used for better tex-ture measurement. No filtering was performed before texturemeasurement as there is always a tradeoff between specklesuppression and preservation of the detailed features [41].
SARKER et al.: FOREST BIOMASS ESTIMATION USING TEXTURE MEASUREMENTS 3377
TABLE IVRESULTS OBTAINED FROM HV TEXTURE PARAMETERS USING DIFFERENT MODELS
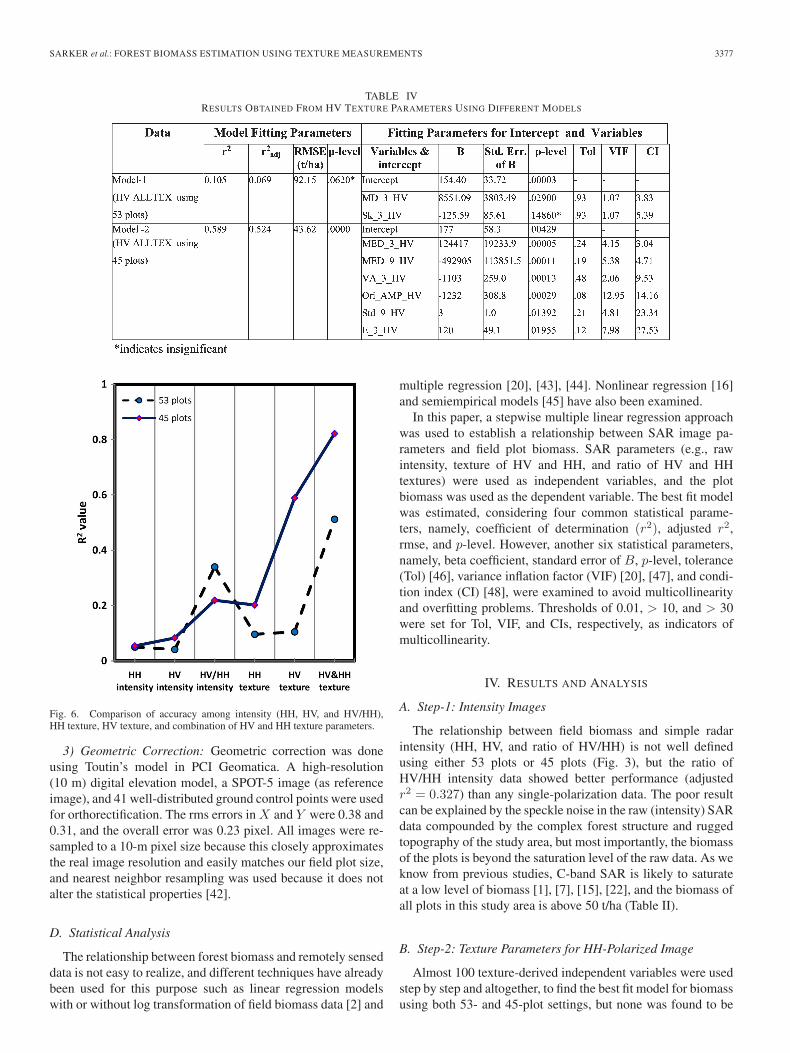
Fig. 6. Comparison of accuracy among intensity (HH, HV, and HV/HH),HH texture, HV texture, and combination of HV and HH texture parameters.
3) Geometric Correction: Geometric correction was doneusing Toutin’s model in PCI Geomatica. A high-resolution(10 m) digital elevation model, a SPOT-5 image (as referenceimage), and 41 well-distributed ground control points were usedfor orthorectification. The rms errors in X and Y were 0.38 and0.31, and the overall error was 0.23 pixel. All images were re-sampled to a 10-m pixel size because this closely approximatesthe real image resolution and easily matches our field plot size,and nearest neighbor resampling was used because it does notalter the statistical properties [42].
D. Statistical Analysis
The relationship between forest biomass and remotely senseddata is not easy to realize, and different techniques have alreadybeen used for this purpose such as linear regression modelswith or without log transformation of field biomass data [2] and
multiple regression [20], [43], [44]. Nonlinear regression [16]and semiempirical models [45] have also been examined.
In this paper, a stepwise multiple linear regression approachwas used to establish a relationship between SAR image pa-rameters and field plot biomass. SAR parameters (e.g., rawintensity, texture of HV and HH, and ratio of HV and HHtextures) were used as independent variables, and the plotbiomass was used as the dependent variable. The best fit modelwas estimated, considering four common statistical parame-ters, namely, coefficient of determination (r2), adjusted r2,rmse, and p-level. However, another six statistical parameters,namely, beta coefficient, standard error of B, p-level, tolerance(Tol) [46], variance inflation factor (VIF) [20], [47], and condi-tion index (CI) [48], were examined to avoid multicollinearityand overfitting problems. Thresholds of 0.01, > 10, and > 30were set for Tol, VIF, and CIs, respectively, as indicators ofmulticollinearity.
IV. RESULTS AND ANALYSIS
A. Step-1: Intensity Images
The relationship between field biomass and simple radarintensity (HH, HV, and ratio of HV/HH) is not well definedusing either 53 plots or 45 plots (Fig. 3), but the ratio ofHV/HH intensity data showed better performance (adjustedr2 = 0.327) than any single-polarization data. The poor resultcan be explained by the speckle noise in the raw (intensity) SARdata compounded by the complex forest structure and ruggedtopography of the study area, but most importantly, the biomassof the plots is beyond the saturation level of the raw data. As weknow from previous studies, C-band SAR is likely to saturateat a low level of biomass [1], [7], [15], [22], and the biomass ofall plots in this study area is above 50 t/ha (Table II).
B. Step-2: Texture Parameters for HH-Polarized Image
Almost 100 texture-derived independent variables were usedstep by step and altogether, to find the best fit model for biomassusing both 53- and 45-plot settings, but none was found to be

3378 IEEE TRANSACTIONS ON GEOSCIENCE AND REMOTE SENSING, VOL. 51, NO. 6, JUNE 2013
Fig. 7. Scatter plots between model-predicted biomass and observed biomass using combination of HH and HV texture data.
TABLE VRESULTS OBTAINED FROM HH AND HV TEXTURE PARAMETERS JOINTLY USING DIFFERENT MODELS

SARKER et al.: FOREST BIOMASS ESTIMATION USING TEXTURE MEASUREMENTS 3379
Fig. 8. Comparison of accuracy among intensity (HH, HV, and HV/HH),HH texture, HV texture, combination of HV and HH texture, and ratio of HVand HH texture parameters.
robust and can only explain about 14% (adjusted r2 = 0.144and r2 = 0.202) of the variation in biomass. Using 53 plots,no texture parameters were found to be significant. On theother hand, using the 45-plot setting, TEX (adjusted r2 = 0.144and r2 = 0.202) showed better performance than HISTEX andSARTEX but was equal to ALLTEX (adjusted r2 = 0.144 andr2 = 0.202). The goodness of fit of HH-polarized texture datawas very similar to intensity of HH and HV data but waslower than the ratio of intensity images (Fig. 4). Generally,HH-polarized data are known to be less sensitive to biomass[49], [50], and after texture analysis, still poor results wereobtained from the HH-polarized SAR data. It was evident thatadding more and more parameters using different processingtechniques was unable to significantly improve the sensitivityof HH polarization data.
C. Step-3: Texture Parameters for HV-Polarized Data
Similar to HH-polarized data processing, 100 texture param-eters were used for HV data. All texture measurements (TEX,HISTEX, SARTEX, and ALLTEX) showed poor performance(with highest adjusted r2 = 0.07 and r2 = 0.105), and nomodel was found to be significant using 53 plots probablybecause of the higher field biomass levels represented by the53-plot data, although it is commonly believed that HV-polarized SAR data have better sensitivity for biomass esti-mation [1], [7], [15], [51]. However, significant improvement(adjusted r2 = 0.52) (Fig. 5 and Model-2 in Table IV) wasobserved using 45 plots with HV-polarized data compared tointensity (adjusted r2 = 0.20) and texture of HH-polarized data(adjusted r2 = 0.14). This tells us that HV-polarized SAR datahave the potential to predict biomass and this can be increasedusing texture parameters with a goodness of fit of more than50% using the less complex 45-plot setting.
The performance (adjusted r2) of the different texturemodules varied significantly (TEX = 0.49, HISTEX = 0.28,and SARTEX = 0.041), but all texture modules together(ALLTEX = 0.52) outperformed individual texture modulesusing 45 plots, probably due to each individual texture measure-ment providing complementary information in the model. Thebest model was found using all texture modules together withsix variables (Model-2 in Table IV). The model, intercept, andvariables were significant, but moderate multicollinearity wasevident considering the set thresholds for VIF and CI. Sincethis best model can only define about 52% of the variabilityof field biomass and it also shows moderate multicollinearityeffects, we decided to investigate other processing methods.
D. Step-4: Combination of Texture Parameters for HV andHH-Polarized Data
To investigate the complementarity of information fromboth polarizations (HH and HV), approximately 200 inde-pendent texture variables (100 from each polarization) wereused. The performance of the biomass estimation increased(Figs. 6 and 7) significantly using both polarization texturesjointly (HH and HV) although the magnitude of the improve-ment was different with respect to plot settings.
The combination of both polarized texture (HH and HV)data obtained the highest goodness of fit (adjusted r2) of 0.449compared with the previously obtained highest goodness of fitfrom intensity (0.327), texture of HH (0.079), and texture ofHV (0.069) using the 53-plot setting. On the other hand, thehighest goodness of fit (adjusted r2) of 0.789 was obtainedfrom the texture of both HH and HV polarization data using the45-plot setting compared with previous highest accuracies of0.201 from intensity, 0.144 from texture of HH, and 0.524 fromtexture of HV data. The increases in goodness of fit (Fig. 6) ob-tained using dual-polarization texture data are 27.17%, 82.40%,and 84.63% compared to intensity, texture of HH, and textureof HV data, respectively, using 53 plots, and 74.52%, 81.74%,and 33.58%, compared to intensity, texture of HH, and textureof HV, respectively, using 45 plots.
The performance of the individual texture modules also var-ied according to the number of plots used. Using 45 plots, thelowest goodness of fit (r2 = 0.408 and adjusted r2 = 0.315)was achieved using SARTEX, while the highest goodness offit (r2 = 0.882 and adjusted r2 = 0.789) was obtained fromALLTEX (Model-2 in Table V), and the second highest good-ness of fit (r2 = 0.75 and adjusted r2 = 0.722) was obtainedfrom HISTEX. An almost similar pattern of goodness of fit wasobtained using 53 plots, but the goodness of fit was significantlylower (highest r2 = 0.512 and adjusted r2 = 0.449) (Model-1in Table V) than that for the 45-plot setting. In both plot settings,the best results were achieved from the combination of alltexture modules “ALLTEX.”
The best fitting model (Model-1 in Table V) using 53 plotswas obtained from six independent variables, while seven inde-pendent variables (Model-2 in Table V) were used in the best fitmodel using 45 plots. Both models (Models 1 and 2 in Table V)are significant, and no multicollinearity effect was suspected(considering the Tol, VIF, and CI). However, the model using

3380 IEEE TRANSACTIONS ON GEOSCIENCE AND REMOTE SENSING, VOL. 51, NO. 6, JUNE 2013
Fig. 9. Scatter plots between model-predicted biomass and observed biomass using the ratio of (HV and HH) texture data.
TABLE VIRESULTS OBTAINED FROM THE RATIO OF TEXTURE PARAMETERS (HV/HH) USING DIFFERENT MODELS

SARKER et al.: FOREST BIOMASS ESTIMATION USING TEXTURE MEASUREMENTS 3381
53 plots (Model-1 in Table V) can only predict 45% of thevariability of the dependent variable (DW), while the modelusing 45 plots (Model-2 in Table V) has the potential to estimatebiomass up to 80% goodness of fit using dual-polarization SAR.Despite this high performance, we have proceeded for furtherinvestigation using the polarization ratio of texture parameters(Section IV-E) considering the potential advantages which maybe realized from raw polarization ratio for minimizing foreststructural effects [51] and topographic effects [52].
E. Step-5: Ratio of Texture Parameters for HV andHH-Polarized Data
At the final stage of this analysis, we used the ratio of dual-polarization (HV and HH) texture parameters because ratiois a simple image fusion/combination method which has theadvantage of being unaffected by multiplicative calibrationerrors [35]. Furthermore, the ratio of backscattering can po-tentially reduce topographic effects [51], [52] and forest-type-dependent structural effects [43], [51] and thereby increase thestrength of correlations [2], [53]. We assumed that the ratio ofdual-polarization texture parameters may have similar advan-tages, resulting in an increase in the saturation level as wellas an improvement of the biomass estimation. Since the ratiocombines HH and HV texture parameters together, only 100 in-dependent variables were used compared with 200 independentvariables in the previous stage (Step-4 in Section IV-D).
Significant improvement was achieved for both plot settingsusing the ratio of texture images compared to intensity, HHtexture, HV texture, and combination of HH and HV textureimages (Figs. 8 and 9). The highest performance (adjusted r2)of 0.907 and 0.877 were achieved using this ratio for the 53-(Model-1 in Table VI) and 45- (Model-2 in Table VI) plotsettings, respectively. The increases in performance (Fig. 8) are63.94%, 91.28%, 92.39%, and 50.49% compared to the bestperformance of intensity, HH texture, HV texture, and com-bined HH and HV texture images, respectively, using 53 plots,and 77.08%, 83.58%, 40.25%, and 10.03% using 45 plots. Inboth cases, the improvement is highly significant particularlyin the case of 53 plots, where the performance improvement isreally large from an adjusted r2 of 0.449 (highest from Step-4)to 0.907.
Using the ratio of texture images, the performance of indi-vidual textures was variable, but the highest goodness of fitwas achieved using all texture modules together (ALLTEX)which indicates that the different texture modules consistentlyprovide complimentary information for biomass estimation.The ALLTEX texture model with nine independent variables(Model-2 in Table VI) achieved the highest goodness of fit(adjusted r2 = 0.907 and rmse = 26.95 t/ha) using 53 plots.The model and all variables were significant, and all parametersfor the multicollinearity test (Tol, VIF, and CI) were far belowthe set threshold levels. Similarly, for the 45 plots, the ALLTEXtexture module achieved a highly significant result with a good-ness of fit of 0.877 (adjusted r2) and rmse of 21.55 t/ha. Thismodel used eight independent variables (Model-1 in Table VI),and the model, intercept, and all variables are significant withno apparent multicollinearity effect.
V. DISCUSSION
The high accuracies obtained in this analysis are promisingsince C-band SAR has previously been considered less effectivefor biomass estimation than L-band or P-band SAR but maybe explained by the high quality of the data in terms of polar-ization, incidence angle, and spatial resolution, in combinationwith the many different processing techniques applied. Ourfinding from the raw intensity data is that backscattering ofC-band SAR data is saturated at low biomass levels despitethe fact that we used high-resolution data. The problem of thissaturation and the reason for this are well established frommany previous studies [1], [2], [7], [50].
However, the main contribution of this paper is to usethe texture parameters of dual-polarization SAR in differentprocessing steps for the estimation of forest biomass. Fromthis endeavor, we found that, similar to raw intensity of HHpolarization, texture parameters of HH polarization were lesssuitable for forest biomass estimation. Although we used ap-proximately 100 texture images, the result is almost the sameas for raw HH polarization. The texture parameters of HVpolarization showed improvement over HH polarization textureparameters and also over raw intensity of HV polarization.The different effectiveness between the HH and HV polariza-tion texture parameters cannot be directly compared with thefindings of previous studies, but in principle, it agrees with otherresearchers who found that HH polarization is less sensitive forforest biomass estimation than HV polarization [1], [15], [50].
The use of texture parameters from both image channels (HHand HV) in the model jointly without ratio (i.e., HH and HV)and with ratio (i.e., HV/HV) showed substantial improvementfor biomass estimation performance in both plot settings, buttexture polarization ratio (adjusted r2 = 0.90) greatly surpassesthe performance of all other processing steps. This is a verysignificant improvement and indicates that the ratio of textureparameters of RADARSAT-2 dual-polarization data is veryeffective for biomass estimation and is adequately robust torepresent the high species diversity and high biomass presentin the 53-plot setting.
This image processing technique was not directly appliedbefore for forest biomass estimation, but the basic principle,i.e., use of both polarizations together and polarization ratio,was used in many studies for land use/land cover mapping aswell as forest biomass estimation, and our results agree withfindings of previous researchers who found improvement frommultifrequency, multipolarization, and multisensor data in theform of ratio or other combination [20], [52], [54], [55].
However, until more details are known about the interactionbetween forest parameters and radar backscatter, the physicalinterpretation of our results can only be inductive, based onour observations. While the many parameters and processingapproaches examined here are unlikely to represent biomassindividually, the use of multiple regression identifies the dif-ferent contributions of the key components and may explain thehigh correlations achieved. Despite being unable to explain theresult physically, we believe that the good result is an outcomeof the selection of data and processing techniques together andcan be explained as follows: 1) the use of dual-polarization

3382 IEEE TRANSACTIONS ON GEOSCIENCE AND REMOTE SENSING, VOL. 51, NO. 6, JUNE 2013
high-resolution C-band SAR data which are believed to be agood source of image texture; 2) the use of texture measurementwhich has the ability to discriminate spatial information, aswell as to reduce those forest structural differences which areindependent of biomass; 3) the use of complementary infor-mation from both polarization texture parameters together asthis information can improve performance compared with anysingle-channel data; 4) the use of texture polarization ratiowhich gives us complementarities and advantages of reducingother effects such as forest structural differences, differencesin the radar incidence angle, and topographic effects; theseadvantages of the use of ratio are likely to be particularlyeffective in our study area due to the heterogeneity of speciesand forest structure and complexity of the terrain; and 5) finally,the use of texture algorithms with multiple window sizes whichproduced uncorrelated texture parameters and this uncorrelatedindependent variable played an important role in the modelbuilding, explaining part of the variability of the dependentvariable (field biomass).
VI. CONCLUSION AND RECOMMENDATION
This study set out to improve forest biomass estimation fromRADARSAT-2 SAR data, using intensity data and texture pa-rameters with different data combinations. Our results suggestthat the forest biomass estimation capacity of C-band can begreatly improved beyond the commonly stated saturation levelsusing the texture parameters of high-resolution SAR images,particularly using the ratio of texture parameters. Conclusionscan be made as follows.
1) The direct relationships between C-band SAR backscat-tering and forest biomass are still not good for forestbiomass estimation despite the use of high resolution anddual polarizations. However, texture measurement of thehigh-resolution C-band SAR data showed improvementparticularly using HV polarization, although texture pa-rameters of HH polarization data remain less effectiveand similar to the raw HH polarization data.
2) Notable improvement for forest biomass estimation canbe achieved using the texture measurements of bothpolarizations jointly. However, the performance of thisprocessing technique varies with the level of biomass andforest conditions and probably with topography.
3) The performance can be further improved using the tex-ture ratio of this new C-band SAR data, and the mainconclusion is that texture parameters of dual-polarizationdata have the potential for estimating biomass, but theratio of polarization texture parameters has even greaterpotential to improve forest biomass estimation and in-crease saturation levels.
4) The performance of the three groups of texture measure-ments was inconsistent, but all texture models togetheroutperformed all individual texture models. Although wefound it difficult to make any clear recommendation as towhich individual group of texture measurements is betterthan any other group, our suggestion is to select texturealgorithms from different groups (maybe not all algo-
rithms from all groups) in order to get complementaryinformation in the model.
5) Finally, it is important to mention here that we obtainedthe best results after all of these five steps of processingand we only propose two best models (one for 45-plotsetting and the other for 53-plot settings), but in fact,many models can be developed considering the numberand selection of variables. We used only one study areato test our processing, but it is likely that this processingcan be used in other study area as we have not used anylocal parameters in the model. We assume that differentbest models are likely to emerge in different study areas,as their texture parameters would be different, but thebest model for other areas can be identified using theprocedure described in this paper.
REFERENCES
[1] M. C. Dobson, F. T. Ulaby, T. LeToan, A. Beaudoin, E. S. Kasischke, andN. Christensen, “Dependence of radar backscatter on coniferous forestbiomass,” IEEE Trans. Geosci. Remote Sens., vol. 30, no. 2, pp. 412–415,Mar. 1992.
[2] K. J. Ranson and G. Sun, “Mapping biomass of a northern forest usingmultifrequency SAR data,” IEEE Trans. Geosci. Remote Sens., vol. 32,no. 2, pp. 388–396, Mar. 1994.
[3] R. A. Houghton, “Above ground forest biomass and the global carbonbalance,” Global Change Biol., vol. 11, no. 6, pp. 945–958, Jun. 2005.
[4] D. L. Skole and C. J. Tucker, “Tropical deforestation and habitat fragmen-tation in the Amazon: Satellite data from 1978 to 1988,” Science, vol. 260,no. 5116, pp. 1905–1910, Jun. 1993.
[5] Q. M. Ketterings, R. Coe, M. van Noordwijk, Y. Ambagau’, andC. A. Palm, “Reducing uncertainty in the use of allometric biomassequations for predicting above-ground tree biomass in mixed secondaryforests,” Forest Ecol. Manage., vol. 146, no. 1–3, pp. 199–209, Jun. 2001.
[6] S. Brown, A. J. R. Gillespie, and A. E. Lugo, “Biomass estimation meth-ods for tropical forests with applications to forest inventory data,” ForestSci., vol. 35, no. 4, pp. 881–902, Dec. 1989.
[7] T. Le Toan, A. Beaudoin, J. Riom, and D. Guyon, “Relating forestbiomass to SAR data,” IEEE Trans. Geosci. Remote Sens., vol. 30, no. 2,pp. 403–411, Mar. 1992.
[8] P. S. Thenkabail, N. Stucky, B. W. Griscom, M. S. Ashton, J. Diels,B. Van der Meer, and E. Enclona, “Biomass estimations and carbon stockcalculations in the oil palm plantations of African derived savannas usingIKONOS data,” Int. J. Remote Sens., vol. 25, no. 23, pp. 5447–5472,2004.
[9] D. Zheng, J. Rademacher, J. Chen, T. Crow, M. Bresee, J. Le Moine, andS.-R. Ryu, “Estimating aboveground biomass using Landsat 7 ETM+ dataacross a managed landscape in northern Wisconsin, USA,” Remote Sens.Environ., vol. 93, no. 3, pp. 402–411, Nov. 2004.
[10] P. Muukkonen and J. Heiskanen, “Biomass estimation over a large areabased on standwise forest inventory data and ASTER and MODIS satellitedata: A possibility to verify carbon inventories,” Remote Sens. Environ.,vol. 107, no. 4, pp. 617–624, Apr. 2007.
[11] A. Garcia-Martin, F. Perez-Cabello, J. de la Riva Fernandez, andR. M. Lloveria, “Estimation of crown biomass of Pinus spp. from LandsatTM and its effect on burn severity in a Spanish fire scar,” IEEE J. Sel.Topics Appl. Earth Observ. Remote Sens., vol. 1, no. 4, pp. 254–265,Dec. 2008.
[12] J. E. Nichol and M. L. R. Sarker, “Improved biomass estimation using thetexture parameters of two high-resolution optical sensors,” IEEE Trans.Geosci. Remote Sens., vol. 49, no. 3, pp. 930–948, Mar. 2011.
[13] S. Wu, “Potential application of multipolarization SAR for pine-plantationbiomass estimation,” IEEE Trans. Geosci. Remote Sens., vol. GE-25,no. 3, pp. 403–409, May 1987.
[14] A. Luckman, J. Baker, M. Honzak, and R. Lucas, “Tropical forest biomassdensity estimation using JERS-1 SAR: Seasonal variation, confidencelimits, and application to image mosaics,” Remote Sens. Environ., vol. 63,no. 2, pp. 126–139, Feb. 1998.
[15] E. Mougin, C. Proisy, G. Marty, F. Fromard, H. Puig, L. Betoulle, andJ. P. Rudant, “Multifrequency and multipolarization radar backscatteringfrom mangrove frosts,” IEEE Trans. Geosci. Remote Sens., vol. 37, no. 1,pp. 94–102, Jan. 1999.

SARKER et al.: FOREST BIOMASS ESTIMATION USING TEXTURE MEASUREMENTS 3383
[16] J. R. Santos, C. C. Freitas, L. S. Araujo, L. V. Dutra, J. C. Mura,F. F. Gama, L. S. Soler, and S. J. S. Sant’Anna, “Airborne P-bandSAR applied to the aboveground biomass studies in the Brazilian trop-ical rainforest,” Remote Sens. Environ., vol. 87, no. 4, pp. 482–493,Nov. 2003.
[17] H. Wang and K. Ouchi, “Accuracy of the K-distribution regression modelfor forest biomass estimation by high-resolution polarimetric SAR: Com-parison of model estimation and field data,” IEEE Trans. Geosci. RemoteSens., vol. 46, no. 4, pp. 1058–1064, Apr. 2008.
[18] F. Garestier and T. Le Toan, “Estimation of the backscatter vertical profileof a pine forest using single baseline P-band (Pol-)InSAR data,” IEEETrans. Geosci. Remote Sens., vol. 48, no. 9, pp. 3340–3348, Sep. 2010.
[19] Z. J. Bortolot and R. H. Wynne, “Estimating forest biomass usingsmall footprint LiDAR data: An individual tree-based approach thatincorporates training data,” ISPRS J. Photogramm. Remote Sens., vol. 59,no. 6, pp. 342–360, 2005.
[20] P. Hyde, R. Nelson, D. Kimes, and E. Levine, “Exploring LiDAR–RaDARsynergy—predicting aboveground biomass in a Southwestern Ponderosapine forest using LiDAR, SAR and InSAR,” Remote Sens. Environ.,vol. 106, no. 1, pp. 28–38, Jan. 2007.
[21] J. Amini and J. T. S. Sumantyo, “Employing a method on SAR and opticalimages for forest biomass estimation,” IEEE Trans. Geosci. Remote Sens.,vol. 47, no. 12, pp. 4020–4026, Dec. 2009.
[22] M. L. Imhoff, “Radar backscatter and biomass saturation: Ramificationfor global biomass inventory,” IEEE Trans. Geosci. Remote Sens., vol. 33,no. 2, pp. 511–518, Mar. 1995.
[23] F. T. Ulaby, F. Kouyate, B. Brisco, and T. H. L. Williams, “Tex-tural information in SAR images,” IEEE Trans. Geosci. Remote Sens.,vol. GE-24, no. 2, pp. 235–245, Mar. 1986.
[24] F. Dell’Acqua and P. Gamba, “Texture-based characterization of urbanenvironments on satellite SAR images,” IEEE Trans. Geosci. RemoteSens., vol. 41, no. 1, pp. 153–159, Jan. 2003.
[25] I. Champion, P. Dubois-Fernandez, D. Guyon, and M. Cottrel, “Radarimage texture as a function of forest stand age,” Int. J. Remote Sens.,vol. 29, no. 6, pp. 1795–1800, Mar. 2008.
[26] R. M. Haralick, K. Shanmugam, and I. Dinstein, “Textural features forimage classification,” IEEE Trans. Syst., Man, Cybern., vol. smc 3, no. 6,pp. 610–621, Nov. 1973.
[27] C. E. Woodcock and A. H. Strahler, “The factor of scale in remote sens-ing,” Remote Sens. Environ., vol. 21, no. 3, pp. 311–332, Apr. 1987.
[28] A. J. Luckman, A. C. Frery, C. C. F. Yanasse, and G. B. Groom, “Texturein airborne SAR imagery of tropical forest and its relationship to forestregeneration stage,” Int. J. Remote Sens., vol. 18, no. 6, pp. 1333–1349,1997.
[29] T. M. Kuplich, P. J. Curran, and P. M. Atkinson, “Relating SAR imagetexture to the biomass of regenerating tropical forests,” Int. J. RemoteSens., vol. 26, no. 21, pp. 4829–4854, Nov. 2005.
[30] E. Podest and S. Saatchi, “Application of multiscale texture in classifyingJERS-1 radar data over tropical vegetation,” Int. J. Remote Sens., vol. 23,no. 7, pp. 1487–1506, Apr. 2002.
[31] R. J. Dekker, “Texture analysis and classification of ERS SAR images formap updating of urban areas in the Netherlands,” IEEE Trans. Geosci.Remote Sens., vol. 41, no. 9, pp. 1950–1958, Sep. 2003.
[32] D. Chen, D. A. Stow, and P. Gong, “Examining the effect of spatialresolution and texture window size on classification accuracy: An urbanenvironment case,” Int. J. Remote Sens., vol. 25, no. 11, pp. 2177–2192,Jun. 2004.
[33] D. Lu, “Aboveground biomass estimation using Landsat TM data in theBrazilian Amazon,” Int. J. Remote Sens., vol. 26, no. 12, pp. 2509–2525,Jun. 2005.
[34] K. L. Castro, G. A. Sanchez-Azofeifa, and B. Rivard, “Monitoring sec-ondary tropical forests using space-borne data: Implications for CentralAmerica,” Int. J. Remote Sens., vol. 24, no. 9, pp. 1853–1894, Jan. 2003.
[35] C. Oliver and S. Quegan, Understanding Synthetic Aperture RadarImages. Raleigh, NC: SciTech Publication, 2004, p. 479.
[36] J. P. M. Overman, H. J. L. Witte, and J. G. Saldarriaga, “Evaluation ofregression models for above-ground biomass determination in Amazonrainforest,” J. Trop. Ecol., vol. 10, no. 2, pp. 207–218, May 1994.
[37] C. B. M. Arevalo, T. A. Volk, E. Bevilacqua, and L. Abrahamson, “Devel-opment and validation of aboveground biomass estimations for four Salixclones in central New York,” Biomass Bioenergy, vol. 31, no. 1, pp. 1–12,Jan. 2006.
[38] G. L. Baskerville, “Use of logarithmic regression in the estimation of plantbiomass,” Can. J. Forest Res., vol. 2, no. 1, pp. 49–53, Mar. 1972.
[39] M. Unser, “Sum and difference histograms for texture classification,”IEEE Trans. Pattern Anal. Mach. Intell., vol. PAMI-8, no. 1, pp. 118–125,Jan. 1986.
[40] C. J. Oliver, “Optimum texture estimators for SAR clutter,” J. Phys. D,Appl. Phys., vol. 26, no. 11, pp. 1824–1835, Nov. 1993.
[41] A. N. Nyoungui, E. Tonye, and A. Akono, “Evaluation of speckle filteringand texture analysis methods for land cover classification from SARimages,” Int. J. Remote Sens., vol. 23, no. 9, pp. 1895–1925, Jan. 2002.
[42] G. M. Foody, D. S. Boyd, and M. E. J. Cutler, “Predictive relations oftropical forest biomass from Landsat TM data and their transferabilitybetween regions,” Remote Sens. Environ., vol. 85, no. 4, pp. 463–474,Jun. 2003.
[43] M. C. Dobson, F. T. Ulaby, L. E. Pierce, T. L. Sharik, K. M. Bergen,J. Kellndorfer, J. R. Kendra, E. Li, Y. C. Lin, A. Nashashibi,K. Sarabandi, and P. Siqueira, “Estimation of forest biophysical charac-teristics in northern Michigan with SIR-C/X-SAR,” IEEE Trans. Geosci.Remote Sens., vol. 33, no. 4, pp. 877–895, Jul. 1995.
[44] P. A. Townsend, “Estimating forest structure in wetlands using multi-temporal SAR,” Remote Sens. Environ., vol. 79, no. 2/3, pp. 288–304,Feb. 2002.
[45] T. Castel, F. Guerra, Y. Caraglio, and F. Houllier, “Retrieval biomass ofa large Venezuelan pine plantation using JERS-1 SAR data. Analysis offorest structure impact on radar signature,” Remote Sens. Environ., vol. 79,no. 1, pp. 30–41, Jan. 2002.
[46] D. A. Belsley, E. Kuh, and R. E. Welsch, Regression Diagnostics: Iden-tifying Influential Data and Sources of Collinearity. New York: Wiley,1980, p. 292.
[47] M. H. Kutner, C. J. Nachtsheim, J. Neter, and W. Li, Applied LinearStatistical Models, vol. 5th. Boston, MA: McGraw-Hill Irwin, 2005,p. 1396.
[48] C. M. Douglas, E. A. Peck, and G. G. Vining, Introduction to LinearRegression Analysis, vol. 4th. Hoboken, NJ: Wiley, 2006.
[49] E. Rignot, J. Way, C. Williams, and L. Viereck, “Radar estimates ofaboveground biomass in boreal forests of interior Alaska,” IEEE Trans.Geosci. Remote Sens., vol. 32, no. 5, pp. 1117–1124, Sep. 1994.
[50] E. S. Kasischke, N. L. Christensen, Jr., and L. L. Bourgeau-Chavez,“Correlating radar backscatter with components of biomass in loblollypine forests,” IEEE Trans. Geosci. Remote Sens., vol. 33, no. 3, pp. 643–659, May 1995.
[51] K. J. Ranson, S. Saatchi, and G. Sun, “Boreal forest ecosystem character-ization with SIR-C/XSAR,” IEEE Trans. Geosci. Remote Sens., vol. 33,no. 4, pp. 867–876, Jul. 1995.
[52] J. Shi and J. Dozier, “Mapping seasonal snow with SIR-C/X-SAR inmountainous areas,” Remote Sens. Environ., vol. 59, no. 2, pp. 294–307,Feb. 1997.
[53] G. M. Foody, R. M. Green, R. M. Lucas, P. J. Curran, M. Honzak,and I. Do Amaral, “Observations on the relationship between SIR-Cradar backscatter and the biomass of regenerating tropical forests,” Int. J.Remote Sens., vol. 18, no. 3, pp. 687–694, Feb. 1997.
[54] P. A. Harrell, E. S. Kasischke, L. L. Bourgeau-Chavez, E. M. Haney, andN. L. Christensen, Jr., “Evaluation of approaches to estimating above-ground biomass in southern pine forests using SIR-C data,” Remote Sens.Environ., vol. 59, no. 2, pp. 223–233, Feb. 1997.
[55] J. E. S. Fransson and H. Israelsson, “Estimation of stem volume in borealforests using ERS-1 C- and JERS-1 L-band SAR data,” Int. J. RemoteSens., vol. 20, no. 1, pp. 123–137, Jan. 1999.
Md. Latifur Rahman Sarker was born inGaibandha, Bangladesh, in 1968. He received theM.S. degree in geodesy and geoinformatics from theRoyal Institute of Technology (KTH), Stockholm,Sweden, in 2005 and the Ph.D. degree in biomassestimation using remote sensing techniques fromThe Hong Kong Polytechnic University, Kowloon,Hong Kong, in 2010.
He is currently a Senior Lecturer with the De-partment of Remote Sensing, Universiti TeknologiMalaysia, Johor Bahru, Malaysia. He is also with the
Department of Geography and Environmental Studies, University of Rajshahi,Rajshahi, Bangladesh. His research interests involve the application of opticaland synthetic aperture radar (SAR) data for land use/land cover mapping andbiomass estimation, vegetation mapping, wavelet image fusion of SAR andoptical data, texture processing, artificial neural network, water and air qualitymonitoring, and feature extraction.

3384 IEEE TRANSACTIONS ON GEOSCIENCE AND REMOTE SENSING, VOL. 51, NO. 6, JUNE 2013
Janet Nichol received the B.Sc. degree from theUniversity of London, London, U.K., the M.A.degree from the University of Colorado, Boul-der, and the Ph.D. degree from Aston University,Birmingham, U.K.
She subsequently worked in the U.K., Nigeria,Singapore, and the Republic of Ireland. Since 2001,she has taught and undertaken research at the De-partment of Land Surveying and Geo-Informatics,The Hong Kong Polytechnic University, Kowloon,Hong Kong. She has background in physical geog-
raphy, with specialization in remote sensing, and ecology. She has publishedover 80 peer-reviewed journal papers and several book chapters and acted asEditor and Reviewer for many scientific journals. Her research interests are inthe application of remote sensing techniques to environmental assessment andmonitoring, including urban climate and climate change, quaternary climatechange, vegetation mapping, air quality monitoring, and aspects of imageprocessing.
Huseyin Baki Iz received the Ph.D. degree fromthe Geodetic Science Department, The Ohio StateUniversity, Columbus, in 1987.
He is currently a Professor of geodetic scienceand spatial analysis with the Department of LandSurveying and Geo-Informatics, The Hong KongPolytechnic University, Kowloon, Hong Kong. Hisrecent research interests involve global mean sealevel variations, kinematic geodesy, and selenodesy.
Baharin Bin Ahmad received the B.Sc. degree fromNewcastle University, Newcastle upon Tyne, U.K.,the M.Sc. degree from the Curtin University ofTechnology, Perth, Australia, and the Ph.D. degreefrom the University of New South Wales, Sydney,Australia.
He is currently teaching in the Department of Re-mote Sensing, Universiti Teknologi Malaysia, JohorBahru, Malaysia. He has background in surveyingscience, with specialization in remote sensing. Hisrecent research interests involve application of radar
data, forest encroachment mapping, and landslide susceptibility mapping.
Alias Abdul Rahman received the M.Sc. degreefrom ITC, Enschede, The Netherlands, in 1992 andthe Ph.D. degree from the University of Glasgow,Glasgow, U.K., in 2000.
He is currently a Professor of 3-D geographicinformation system (GIS) with Universiti TeknologiMalaysia, Johor Bahru, Malaysia, where he is alsoan Academic Staff Member and the Dean of theFaculty of Geoinformation and Real Estate. Healso gives lecture at Stuttgart Technology Univer-sity of Applied Sciences, Stuttgart, Germany; Yildiz
Technical University, Istanbul, Turkey; Technische Universiteit Delft, Delft,The Netherlands; and UNESCO-IHE, Delft. His main research interest is3-D GIS. He has produced two books with Springer Verlag and more than100 technical papers on the subject and other related subjects.
Dr. Rahman is currently the Chair of Working Group II/5 “Multidimensionaland Mobile Data Models” of Commission II of the International Society forPhotogrammetry and Remote Sensing.