
Forensic engineering in geotechnics, the Dutch ap- -2 ... ECSMGE Edinburgh 2015 Dutch... ·...
6
3499 Proceedings of the XVI ECSMGE Geotechnical Engineering for Infrastructure and Development ISBN 978-0-7277-6067-8 © The authors and ICE Publishing: All rights reserved, 2015 doi:10.1680/ecsmge.60678 Forensic engineering in geotechnics, the Dutch ap- proach on CPT interpretation Forensic Ingénierie en Géotechnique, l’approche Hollandais de l’interprétation CPT E. de Jong *1 1 Geobest B.V., Mijdrecht, The Netherlands * Corresponding Author ABSTRACT In the Dutch geotechnical engineering practise it is common to perform a large number of Cone Penetration Tests (CPT) at every new building site. Especially since the development of electric registration methods in the early 1980’s, CPT’s have be come the “working horse” among site investigation techniques. Nowadays we trust the information of CPT’s in such a manner that we only perform additional boreholes for very specific reasons. CPT’s are cheap, easy to perform and have a well known result and reliability. Since the nineteen sixties over 5 million CPT’s have been carried out in the Netherlands, and of course, every now and again we encounter “strange” results. Sometimes these results can be explained with a new calibration of the equipment itself, but most of the time we are dealing with ir- regularities in the actual soil conditions. These irregularities, especially in deeper soil formations, can have a geological explanation, an anomaly to a geotechnical engineer is sometimes a logical consequence for a geologist. However, in recent years we perform a large num- ber of CPT’s for urban regeneration projects and highway extensions that show irregularities at lesser depths and are frequen tly the result of earlier manmade alterations in the subsoil. This paper describes over 25 years of personal experiences with “explaining” the results of CPT’s carried out in different parts of the Netherlands, both on a geological and historical perspective. RÉSUMÉ Dans la pratique de la Géotechnique ingénierie Hollandaise il est usage de réaliser un grand nombre de Conus Penetration Tests (CPT) sur chaque nouveau chantier. Surtout depuis le développement des méthodiques d’enregistrement électrique au début des a nnées 1980’s, les CPT sont devenus les chevaux de travail parmi les techniques d’ investigation sur location. Aujourd‘hui nous avon s une telle confiance dans l’information des CPT que seulement pour des raisons spéciales on fait des forages complémentaires. Les CPT ne sont pas cher, facile á réaliser et donnent un bon et fiable résultat. Depuis les années ‘60 plus de 5 million de CPT ont été réaliser en Hollande et évidemment de temps en temps il y a des résultats étranges. Parfois ces résultats peuvent être expliquer par un nouveau étalonnage de l’appareil lui même, mais souvent on á faires á des irrégularités dans la condition du sol même. Ces irrégularités, spécialement en forma- tions terrestres les plus profondes, ce qui est une anomalie pour un ingénieur géotechnique mais parfois une conséquence logique pour un géologue. Néanmoins dans les années récentes nous réalisons un grand nombre de CPT pour des projets de réalisation urbaines e t exten- sions d’autoroutes qui montrent des anomalies dans les formations terrestres les moins profondes et qui sont la plus part du temps les con- séquences de changement dans le sol, causer par l’homme. Ce document décrit 25 ans d’expériences personnelles en expliquant des résul- tats des CPT exécutés dans différents parts de la Hollande, vue du perspectif géologique et historique. 1 INTRODUCTION Since the first Cone Penetration Tests were per- formed in the 1930’s, this measurement technique has developed into a reliable, cost effective and worldwide accepted standard test for soil investiga- tions in soft soils. Since 2012 an international stand- ard is available; EN-ISO-22476-1 “geotechnical in- vestigation and testing – Field testing – Part 1: Elec- trical cone and piezocone penetration test”. A cone penetration test (CPT) is an in-situ test where a cone penetrometer (the cone) on the end of a series of rods is pushed vertically from a hydraulic rig into the ground at a constant rate of 20 mm per second, to depths of up to 100 m (depending soil conditions).
Transcript of Forensic engineering in geotechnics, the Dutch ap- -2 ... ECSMGE Edinburgh 2015 Dutch... ·...

3499
Proceedings of the XVI ECSMGEGeotechnical Engineering for Infrastructure and DevelopmentISBN 978-0-7277-6067-8
© The authors and ICE Publishing: All rights reserved, 2015doi:10.1680/ecsmge.60678
In the case of the latter, it’s important to refer that its determination is obtained from several testing equipments through different methodologies and for different levels of axial strain, namely “intermediate” (10-4 a 10-3) for the LWD and DMT case and high (> 10-2) for DPSH case (Cruz 2010; Monaco et al. 2009; Sabatini et al. 2002), as shown in Figure 7.
Figure 7. Shear Modulus degradation as function of strain.
The applied characterization methodology revealed great efficiency on the general quality of the results, runtime (the runtime at each testing site never ex-ceeded 2 hours) and costs, which revealed to be very competitive when compared with the commonly used methodologies. 4 FINAL CONSIDERATIONS
Based in two successful characterization campaign to the rehabilitation of railway lines in operation new approaches to evaluate ballast layers, superficial lay-er of the foundation and also deeper were presented and discussed.
In the case of ballast, 2D Georadar profiling proved to be a useful surveying tool, allowing to dis-cern between clean and contaminated ballast, while 3D profiles allow for the evaluation of volumes of clean and contaminated ballasts, although taking more time for processing and interpret.
For evaluations of upper foundation layer, LWD tests combined with sampling for laboratorial charac-terization represented a time-effective evaluation of the compaction levels and deformability modulus. In depth, stiffness (and strength) evolution can be con-tinuously checked through dynamic tests in moderate to highly compacted materials or DMT tests for low
compaction levels and problematic zones, where dy-namic tests are too rough for the evaluation.
The experimental framework revealed to be ad-vantageous and guaranteed a detailed characteriza-tion with high quality data, performed in short peri-ods of times, adequate for interventions in under operation railway lines, and also with associated competitive costs when compared with other charac-terization methodologies more commonly used.
REFERENCES
Castro, G. 1988. Penetrómetros. Penetrómetro estático tipo holandês (CPT). Penetrómetros dinâmicos (SPT e PDL ou (DPL). Informação Técnica, Geotecnia, ITG 11 - LNEC, Lisboa. Cruz, N. “Modelling geomechanics of residual soils by DMT tests”. 2010. PhD Dissertation presented to Faculdade de Engenharia da Universidade do Porto. Portugal. (http://nbdfcruz.drupalgardens.com/content/script) Cruz, N., Devincenzi, M. & Viana da Fonseca, A. 2006a. “DMT experience in Iberian transported soils”. Proc. 2nd International Flat Dilatometer Conference, Washington, D.C., pp. 198-204. Cruz, N. Viana da Fonseca, A. Santos, J. 2006b. “Compaction con-trol and stiffness evaluation of earthfills, by DMT”. Geotechnical Luso-Brazilian Conference. Curitiba, Brasil. Fortunato, E. 2005. Renovação de plataformas ferroviárias. Estudos relativos à capacidade de carga. PhD Dissertation presented to Faculdade de Engenharia da Universidade do Porto. Gravesen, S. (1960). “Elastic semi-infinite medium bounded by a rigid wall with a circular hole”. Laboratoriet for Bygninsteknik, Danmarks Tekniske Hojskole, Meddelelse No. 10, Copenhagen. ISO22476-2, Geotechnical Investigation and Testing – Field Test-ing – Part 2: Dynamic Probing 2003. ISO/TS 22476-11 Geotechnical Investigation and Testing — Field testing — Part 11: Flat Dilatometer Test 2004. Lutenegger, A. J., Kabir, M. G. (1988). “Dilatometer C-reading to help determine stratigraphy”. Proc. of Int. Symposium on Penetra-tion Testing, ISOPT-1, Orlando, FL, Vol. 1, pp. 549-554. Marchetti, S. (1980). “In-situ tests by flat dilatometer.” J. Ge-otechnical. Eng. Div. ASCE, 106, GT3, 299-321. Marchetti, S., Monaco, P., Totani, G., Calabrese, M. (2001). “The flat dilatometer test (DMT) in soil investigations”.Technical Committee 16. International Society for Soil Mechanics and Ge-otechnical Engineering (ISSMGE). Monaco, P., Marchetti, S.; Totani, G.; Marchetti, D. (2009). “Inter-relationship between small strain modulus G0 and operative modu-lus”. International Conference on Performance-Based Design in Earthquake Geotechnical Engineering, Tokyo. Muromachi T.; Kobayash, S. (1982)." Comparative study of static and dynamic penetration tests currently used in Japan". Proc. 2nd European Symposium On Penetration Tests, ESOPT-2, Amster-dam, Netherlands. Sabatini, P.J., Bachus, R.C., Mayne, P.W., Schneider, J.A. & Zet-tler, T.E. (2002). “Evaluation of soil and rock properties”. Tech-nical Manual. FHWA-IF-02-034. Federal Highway Admin., Wash-ington.
Forensic engineering in geotechnics, the Dutch ap-proach on CPT interpretation
Forensic Ingénierie en Géotechnique, l’approche Hollandais de l’interprétation CPT
E. de Jong*1 1 Geobest B.V., Mijdrecht, The Netherlands
* Corresponding Author
ABSTRACT In the Dutch geotechnical engineering practise it is common to perform a large number of Cone Penetration Tests (CPT) at every new building site. Especially since the development of electric registration methods in the early 1980’s, CPT’s have become the “working horse” among site investigation techniques. Nowadays we trust the information of CPT’s in such a manner that we only perform additional boreholes for very specific reasons. CPT’s are cheap, easy to perform and have a well known result and reliability. Since the nineteen sixties over 5 million CPT’s have been carried out in the Netherlands, and of course, every now and again we encounter “strange” results. Sometimes these results can be explained with a new calibration of the equipment itself, but most of the time we are dealing with ir-regularities in the actual soil conditions. These irregularities, especially in deeper soil formations, can have a geological explanation, an anomaly to a geotechnical engineer is sometimes a logical consequence for a geologist. However, in recent years we perform a large num-ber of CPT’s for urban regeneration projects and highway extensions that show irregularities at lesser depths and are frequently the result of earlier manmade alterations in the subsoil. This paper describes over 25 years of personal experiences with “explaining” the results of CPT’s carried out in different parts of the Netherlands, both on a geological and historical perspective. RÉSUMÉ Dans la pratique de la Géotechnique ingénierie Hollandaise il est usage de réaliser un grand nombre de Conus Penetration Tests (CPT) sur chaque nouveau chantier. Surtout depuis le développement des méthodiques d’enregistrement électrique au début des années 1980’s, les CPT sont devenus les chevaux de travail parmi les techniques d’ investigation sur location. Aujourd‘hui nous avons une telle confiance dans l’information des CPT que seulement pour des raisons spéciales on fait des forages complémentaires. Les CPT ne sont pas cher, facile á réaliser et donnent un bon et fiable résultat. Depuis les années ‘60 plus de 5 million de CPT ont été réaliser en Hollande et évidemment de temps en temps il y a des résultats étranges. Parfois ces résultats peuvent être expliquer par un nouveau étalonnage de l’appareil lui même, mais souvent on á faires á des irrégularités dans la condition du sol même. Ces irrégularités, spécialement en forma-tions terrestres les plus profondes, ce qui est une anomalie pour un ingénieur géotechnique mais parfois une conséquence logique pour un géologue. Néanmoins dans les années récentes nous réalisons un grand nombre de CPT pour des projets de réalisation urbaines et exten-sions d’autoroutes qui montrent des anomalies dans les formations terrestres les moins profondes et qui sont la plus part du temps les con-séquences de changement dans le sol, causer par l’homme. Ce document décrit 25 ans d’expériences personnelles en expliquant des résul-tats des CPT exécutés dans différents parts de la Hollande, vue du perspectif géologique et historique.
1 INTRODUCTION
Since the first Cone Penetration Tests were per-formed in the 1930’s, this measurement technique has developed into a reliable, cost effective and worldwide accepted standard test for soil investiga-tions in soft soils. Since 2012 an international stand-ard is available; EN-ISO-22476-1 “geotechnical in-
vestigation and testing – Field testing – Part 1: Elec-trical cone and piezocone penetration test”. A cone penetration test (CPT) is an in-situ test where a cone penetrometer (the cone) on the end of a series of rods is pushed vertically from a hydraulic rig into the ground at a constant rate of 20 mm per second, to depths of up to 100 m (depending soil conditions).
Geotechnical Engineering for Infrastructure and Development
3500
During a standard test, the forces on the cone and the friction sleeve above the cone, are measured eve-ry 20 mm to obtain detailed information about the soil conditions. The almost instant results can be used to determine soil parameters including soil type, soil density, in-situ stress conditions and shear strength for use in geotechnical design. The most common cones used are the standard cone and the piezocone, the latter measuring porewa-ter pressure. A large number of special cones have been developed over the years that can be run con-currently with the standard cone test to cope with dif-ferent geological environments, to evaluate a huge range of soil parameters, as well as to take samples and install geotechnical instrumentation. The Advantages of CPT can be summarized as follows:
Greater delineation of strata, as readings taken every 20 mm;
Repeatable, high quality and reliable results available in real time;
Electronic data transfer means more managea-ble data handling;
Test is quiet, produces no vibrations and creates minimal soil disturbance;
High productivity (up to 150 m tested per day); Instant results allow on-site selection of the best
locations for sampling, testing and monitoring; Huge range of cones for geotechnical investiga-
tions, contaminated land studies and unexplod-ed ordnance detection;
CPT platform can be used for obtaining high quality samples and installing instrumentation.
The down side is that test results do not always meet our expectations. Due to all kind of disturb-ances test results show irregularities that need further study to understand why the CPT-result is the way it is. The mentioned irregularities can be the result of incorrect measuring or processing of the data, the re-sult of “unknown” geological site conditions or the result of manmade alterations to the soil conditions. Explaining CPT-results is a type of forensic engi-neering that is common in the Netherlands where ap-proximately 1000 tests are performed every day.
2 CPT-INTERPRETATION
For a correct interpretation of CPT results one needs to understand the theoretical back-ground of the soil behaviour during execution of the test, one needs to understand the vulnerability of the test equipment (cones, data acquisition and transport) and one should consider the “human errors” that can occur during processing of the data. Furthermore we should consider geological circumstances that influence CPT-data and the more recent history of the site with respect to previous building activities or other manmade changes to the soil conditions. Lunne et al (1997) is considered the definitive textbook on CPT execution and interpretation. How-ever, the book primarily covers “normal” CPT-results and does not consider all external influences that have been mentioned previously.
2.1 Data acquisition and processing
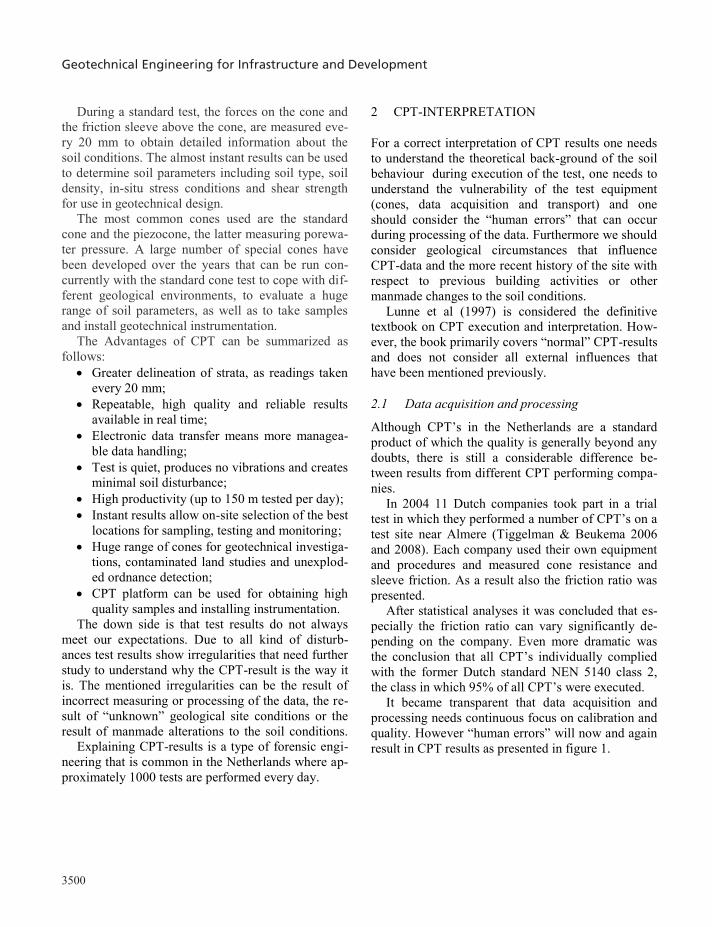
Although CPT’s in the Netherlands are a standard product of which the quality is generally beyond any doubts, there is still a considerable difference be-tween results from different CPT performing compa-nies. In 2004 11 Dutch companies took part in a trial test in which they performed a number of CPT’s on a test site near Almere (Tiggelman & Beukema 2006 and 2008). Each company used their own equipment and procedures and measured cone resistance and sleeve friction. As a result also the friction ratio was presented. After statistical analyses it was concluded that es-pecially the friction ratio can vary significantly de-pending on the company. Even more dramatic was the conclusion that all CPT’s individually complied with the former Dutch standard NEN 5140 class 2, the class in which 95% of all CPT’s were executed. It became transparent that data acquisition and processing needs continuous focus on calibration and quality. However “human errors” will now and again result in CPT results as presented in figure 1.
Figure 1. Typical data-processing failure (“meter” peaks due to stops for positioning next rod). The blue line represents the cone resistance (tip), the dotted redline shows the local friction and the green line on the right the friction ratio.
2.2 Geological influences
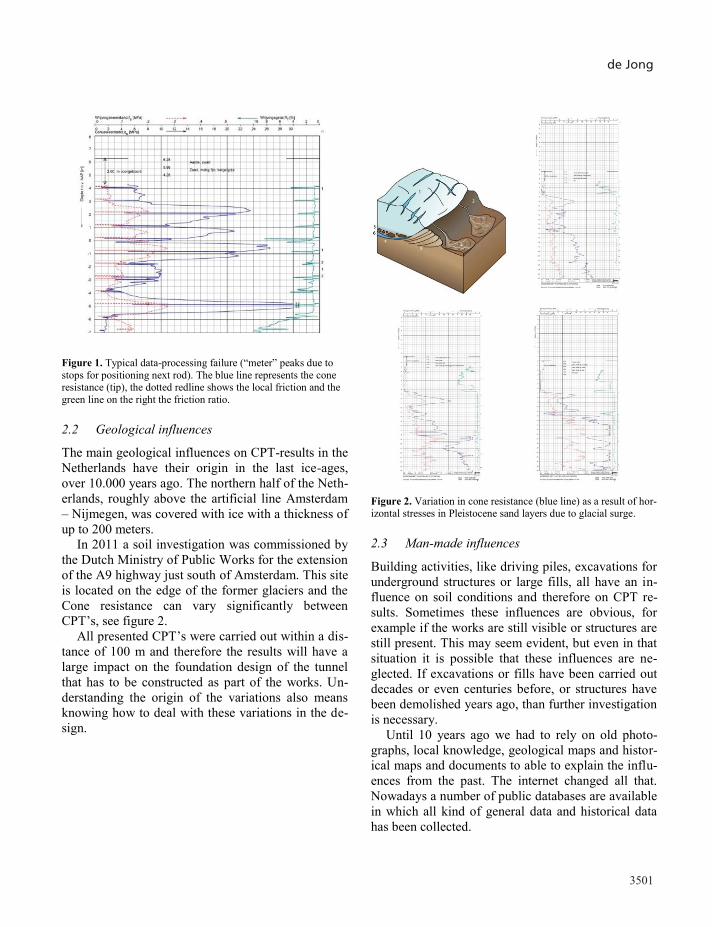
The main geological influences on CPT-results in the Netherlands have their origin in the last ice-ages, over 10.000 years ago. The northern half of the Neth-erlands, roughly above the artificial line Amsterdam – Nijmegen, was covered with ice with a thickness of up to 200 meters.
In 2011 a soil investigation was commissioned by the Dutch Ministry of Public Works for the extension of the A9 highway just south of Amsterdam. This site is located on the edge of the former glaciers and the Cone resistance can vary significantly between CPT’s, see figure 2. All presented CPT’s were carried out within a dis-tance of 100 m and therefore the results will have a large impact on the foundation design of the tunnel that has to be constructed as part of the works. Un-derstanding the origin of the variations also means knowing how to deal with these variations in the de-sign.
Figure 2. Variation in cone resistance (blue line) as a result of hor-izontal stresses in Pleistocene sand layers due to glacial surge.
2.3 Man-made influences
Building activities, like driving piles, excavations for underground structures or large fills, all have an in-fluence on soil conditions and therefore on CPT re-sults. Sometimes these influences are obvious, for example if the works are still visible or structures are still present. This may seem evident, but even in that situation it is possible that these influences are ne-glected. If excavations or fills have been carried out decades or even centuries before, or structures have been demolished years ago, than further investigation is necessary. Until 10 years ago we had to rely on old photo-graphs, local knowledge, geological maps and histor-ical maps and documents to able to explain the influ-ences from the past. The internet changed all that. Nowadays a number of public databases are available in which all kind of general data and historical data has been collected.
3501
During a standard test, the forces on the cone and the friction sleeve above the cone, are measured eve-ry 20 mm to obtain detailed information about the soil conditions. The almost instant results can be used to determine soil parameters including soil type, soil density, in-situ stress conditions and shear strength for use in geotechnical design. The most common cones used are the standard cone and the piezocone, the latter measuring porewa-ter pressure. A large number of special cones have been developed over the years that can be run con-currently with the standard cone test to cope with dif-ferent geological environments, to evaluate a huge range of soil parameters, as well as to take samples and install geotechnical instrumentation. The Advantages of CPT can be summarized as follows:
Greater delineation of strata, as readings taken every 20 mm;
Repeatable, high quality and reliable results available in real time;
Electronic data transfer means more managea-ble data handling;
Test is quiet, produces no vibrations and creates minimal soil disturbance;
High productivity (up to 150 m tested per day); Instant results allow on-site selection of the best
locations for sampling, testing and monitoring; Huge range of cones for geotechnical investiga-
tions, contaminated land studies and unexplod-ed ordnance detection;
CPT platform can be used for obtaining high quality samples and installing instrumentation.
The down side is that test results do not always meet our expectations. Due to all kind of disturb-ances test results show irregularities that need further study to understand why the CPT-result is the way it is. The mentioned irregularities can be the result of incorrect measuring or processing of the data, the re-sult of “unknown” geological site conditions or the result of manmade alterations to the soil conditions. Explaining CPT-results is a type of forensic engi-neering that is common in the Netherlands where ap-proximately 1000 tests are performed every day.
2 CPT-INTERPRETATION
For a correct interpretation of CPT results one needs to understand the theoretical back-ground of the soil behaviour during execution of the test, one needs to understand the vulnerability of the test equipment (cones, data acquisition and transport) and one should consider the “human errors” that can occur during processing of the data. Furthermore we should consider geological circumstances that influence CPT-data and the more recent history of the site with respect to previous building activities or other manmade changes to the soil conditions. Lunne et al (1997) is considered the definitive textbook on CPT execution and interpretation. How-ever, the book primarily covers “normal” CPT-results and does not consider all external influences that have been mentioned previously.
2.1 Data acquisition and processing
Although CPT’s in the Netherlands are a standard product of which the quality is generally beyond any doubts, there is still a considerable difference be-tween results from different CPT performing compa-nies. In 2004 11 Dutch companies took part in a trial test in which they performed a number of CPT’s on a test site near Almere (Tiggelman & Beukema 2006 and 2008). Each company used their own equipment and procedures and measured cone resistance and sleeve friction. As a result also the friction ratio was presented. After statistical analyses it was concluded that es-pecially the friction ratio can vary significantly de-pending on the company. Even more dramatic was the conclusion that all CPT’s individually complied with the former Dutch standard NEN 5140 class 2, the class in which 95% of all CPT’s were executed. It became transparent that data acquisition and processing needs continuous focus on calibration and quality. However “human errors” will now and again result in CPT results as presented in figure 1.
Figure 1. Typical data-processing failure (“meter” peaks due to stops for positioning next rod). The blue line represents the cone resistance (tip), the dotted redline shows the local friction and the green line on the right the friction ratio.
2.2 Geological influences
The main geological influences on CPT-results in the Netherlands have their origin in the last ice-ages, over 10.000 years ago. The northern half of the Neth-erlands, roughly above the artificial line Amsterdam – Nijmegen, was covered with ice with a thickness of up to 200 meters.
In 2011 a soil investigation was commissioned by the Dutch Ministry of Public Works for the extension of the A9 highway just south of Amsterdam. This site is located on the edge of the former glaciers and the Cone resistance can vary significantly between CPT’s, see figure 2. All presented CPT’s were carried out within a dis-tance of 100 m and therefore the results will have a large impact on the foundation design of the tunnel that has to be constructed as part of the works. Un-derstanding the origin of the variations also means knowing how to deal with these variations in the de-sign.
Figure 2. Variation in cone resistance (blue line) as a result of hor-izontal stresses in Pleistocene sand layers due to glacial surge.
2.3 Man-made influences
Building activities, like driving piles, excavations for underground structures or large fills, all have an in-fluence on soil conditions and therefore on CPT re-sults. Sometimes these influences are obvious, for example if the works are still visible or structures are still present. This may seem evident, but even in that situation it is possible that these influences are ne-glected. If excavations or fills have been carried out decades or even centuries before, or structures have been demolished years ago, than further investigation is necessary. Until 10 years ago we had to rely on old photo-graphs, local knowledge, geological maps and histor-ical maps and documents to able to explain the influ-ences from the past. The internet changed all that. Nowadays a number of public databases are available in which all kind of general data and historical data has been collected.
de Jong

Geotechnical Engineering for Infrastructure and Development
3502
In The Netherlands we are fortunate to have ac-cess to the following public information:
www.ahn.nl: this website presents the ground-level of the whole of the country related to NAP, the Dutch ordinance date. The accuracy of this information is quite astonishing, every 5 m a level is available with an accuracy of 5 cm;
www.dinoloket.nl: a large part of all soil inves-tigations done in the past 30 years have been collected in this database, including groundwa-terlevels. In general there is at least one CPT or borehole within a maximum distance of 500 m to every possible location in the country. The site also contains geological information;
www.waterbase.nl: With the amount of water in The Netherlands you would expect us to have a system that monitors and present the actual wa-ter levels;
www.watwaswaar.nl: the title of this websites translates to “what was where” and contains a large number of historical maps, from the mid-dle-ages to more recent years;
A large number of websites show historical photographs, f.e.www.beeldbank.amsterdam.nl, the archive of the city of Amsterdam.
This also means that geotechnical engineers in The Netherlands have no excuse, they you should use this information when relevant. In the next para-graphs some examples are given.
2.3.1 Gelredome stadium Vitesse FC Arnhem
For the design and construction of the Gelredome stadium, home to footballclub Vitesse, an extensive soil investigation was carried out, consisting of nu-merous CPT’s and several boreholes. This multifunc-tual stadium has a pitch that can be shoved to the outside of the actual structure in order to limit the damage to the grass and to make optimal use of the indoor space. As a result of this design the settlement requirements for the foundation were very strict. The CPT result on the right site of figure 3 was very un-welcome.
After several discussions between the structural designer and the geotechnical engineer it became clear that the “disturbed” CPT had been executed on the exact position of a borehole, that had been carried out only two years prior to the CPT.
Figure 3. Variation in cone resistance (solid line) as a result of dis-turbance due to a former borehole. Since the disturbance was limited to this 323 mm borehole there was no need to change the design and the stadium was completed successfully.
2.3.2 Industrial area Rotterdam Noord-West
In the 1980’s the municipality of Rotterdam started developing the industrial area Noord-West (north-west). This area had been a polder since the year 1600 and had been filled during a period of 20 years (between 1960 and 1980) with material dredged from the port of Rotterdam. A typical CPT for this area is shown in figure 4.
Figure 4. CPT-result Rotterdam Noord-West.
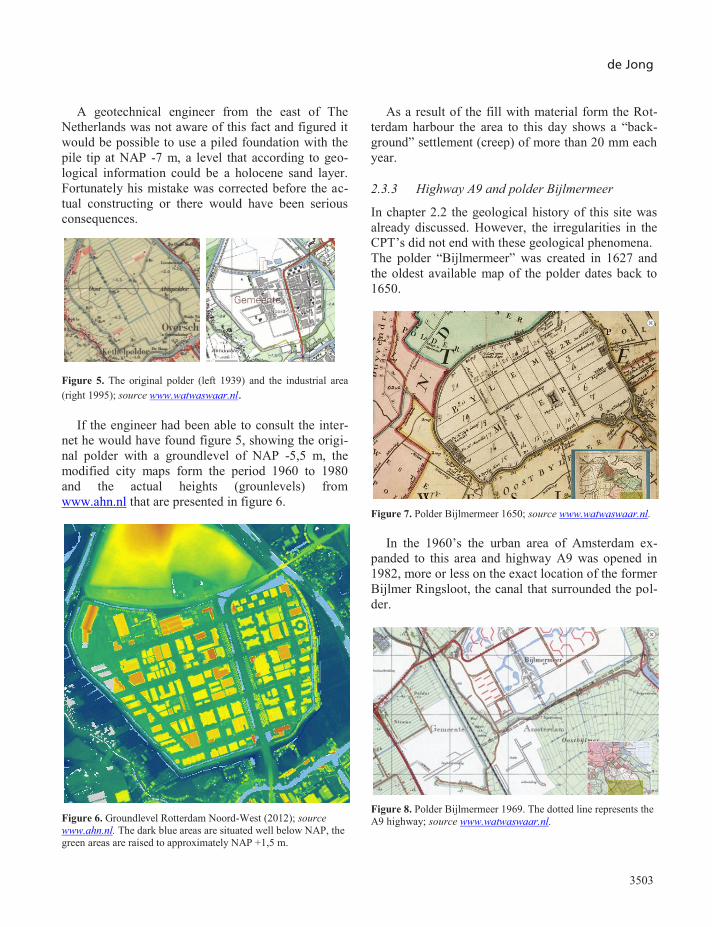
A geotechnical engineer from the east of The Netherlands was not aware of this fact and figured it would be possible to use a piled foundation with the pile tip at NAP -7 m, a level that according to geo-logical information could be a holocene sand layer. Fortunately his mistake was corrected before the ac-tual constructing or there would have been serious consequences.
Figure 5. The original polder (left 1939) and the industrial area (right 1995); source www.watwaswaar.nl.
If the engineer had been able to consult the inter-net he would have found figure 5, showing the origi-nal polder with a groundlevel of NAP -5,5 m, the modified city maps form the period 1960 to 1980 and the actual heights (grounlevels) from www.ahn.nl that are presented in figure 6.
Figure 6. Groundlevel Rotterdam Noord-West (2012); source www.ahn.nl. The dark blue areas are situated well below NAP, the green areas are raised to approximately NAP +1,5 m.
As a result of the fill with material form the Rot-terdam harbour the area to this day shows a “back-ground” settlement (creep) of more than 20 mm each year.
2.3.3 Highway A9 and polder Bijlmermeer
In chapter 2.2 the geological history of this site was already discussed. However, the irregularities in the CPT’s did not end with these geological phenomena. The polder “Bijlmermeer” was created in 1627 and the oldest available map of the polder dates back to 1650.
Figure 7. Polder Bijlmermeer 1650; source www.watwaswaar.nl.
In the 1960’s the urban area of Amsterdam ex-panded to this area and highway A9 was opened in 1982, more or less on the exact location of the former Bijlmer Ringsloot, the canal that surrounded the pol-der.
Figure 8. Polder Bijlmermeer 1969. The dotted line represents the A9 highway; source www.watwaswaar.nl.
3503
In The Netherlands we are fortunate to have ac-cess to the following public information:
www.ahn.nl: this website presents the ground-level of the whole of the country related to NAP, the Dutch ordinance date. The accuracy of this information is quite astonishing, every 5 m a level is available with an accuracy of 5 cm;
www.dinoloket.nl: a large part of all soil inves-tigations done in the past 30 years have been collected in this database, including groundwa-terlevels. In general there is at least one CPT or borehole within a maximum distance of 500 m to every possible location in the country. The site also contains geological information;
www.waterbase.nl: With the amount of water in The Netherlands you would expect us to have a system that monitors and present the actual wa-ter levels;
www.watwaswaar.nl: the title of this websites translates to “what was where” and contains a large number of historical maps, from the mid-dle-ages to more recent years;
A large number of websites show historical photographs, f.e.www.beeldbank.amsterdam.nl, the archive of the city of Amsterdam.
This also means that geotechnical engineers in The Netherlands have no excuse, they you should use this information when relevant. In the next para-graphs some examples are given.
2.3.1 Gelredome stadium Vitesse FC Arnhem
For the design and construction of the Gelredome stadium, home to footballclub Vitesse, an extensive soil investigation was carried out, consisting of nu-merous CPT’s and several boreholes. This multifunc-tual stadium has a pitch that can be shoved to the outside of the actual structure in order to limit the damage to the grass and to make optimal use of the indoor space. As a result of this design the settlement requirements for the foundation were very strict. The CPT result on the right site of figure 3 was very un-welcome.
After several discussions between the structural designer and the geotechnical engineer it became clear that the “disturbed” CPT had been executed on the exact position of a borehole, that had been carried out only two years prior to the CPT.
Figure 3. Variation in cone resistance (solid line) as a result of dis-turbance due to a former borehole. Since the disturbance was limited to this 323 mm borehole there was no need to change the design and the stadium was completed successfully.
2.3.2 Industrial area Rotterdam Noord-West
In the 1980’s the municipality of Rotterdam started developing the industrial area Noord-West (north-west). This area had been a polder since the year 1600 and had been filled during a period of 20 years (between 1960 and 1980) with material dredged from the port of Rotterdam. A typical CPT for this area is shown in figure 4.
Figure 4. CPT-result Rotterdam Noord-West.
A geotechnical engineer from the east of The Netherlands was not aware of this fact and figured it would be possible to use a piled foundation with the pile tip at NAP -7 m, a level that according to geo-logical information could be a holocene sand layer. Fortunately his mistake was corrected before the ac-tual constructing or there would have been serious consequences.
Figure 5. The original polder (left 1939) and the industrial area (right 1995); source www.watwaswaar.nl.
If the engineer had been able to consult the inter-net he would have found figure 5, showing the origi-nal polder with a groundlevel of NAP -5,5 m, the modified city maps form the period 1960 to 1980 and the actual heights (grounlevels) from www.ahn.nl that are presented in figure 6.
Figure 6. Groundlevel Rotterdam Noord-West (2012); source www.ahn.nl. The dark blue areas are situated well below NAP, the green areas are raised to approximately NAP +1,5 m.
As a result of the fill with material form the Rot-terdam harbour the area to this day shows a “back-ground” settlement (creep) of more than 20 mm each year.
2.3.3 Highway A9 and polder Bijlmermeer
In chapter 2.2 the geological history of this site was already discussed. However, the irregularities in the CPT’s did not end with these geological phenomena. The polder “Bijlmermeer” was created in 1627 and the oldest available map of the polder dates back to 1650.
Figure 7. Polder Bijlmermeer 1650; source www.watwaswaar.nl.
In the 1960’s the urban area of Amsterdam ex-panded to this area and highway A9 was opened in 1982, more or less on the exact location of the former Bijlmer Ringsloot, the canal that surrounded the pol-der.
Figure 8. Polder Bijlmermeer 1969. The dotted line represents the A9 highway; source www.watwaswaar.nl.
de Jong
Geotechnical Engineering for Infrastructure and Development
3504
The new highway A9 will be situated in a tunnel for which large excavations are necessary. As a result the material present at excavation level, approximately NAP -5 m, became of considerable interest to the ge-otechnical engineers.
Figure 9. CPT former Bijlmer Ringsloot.
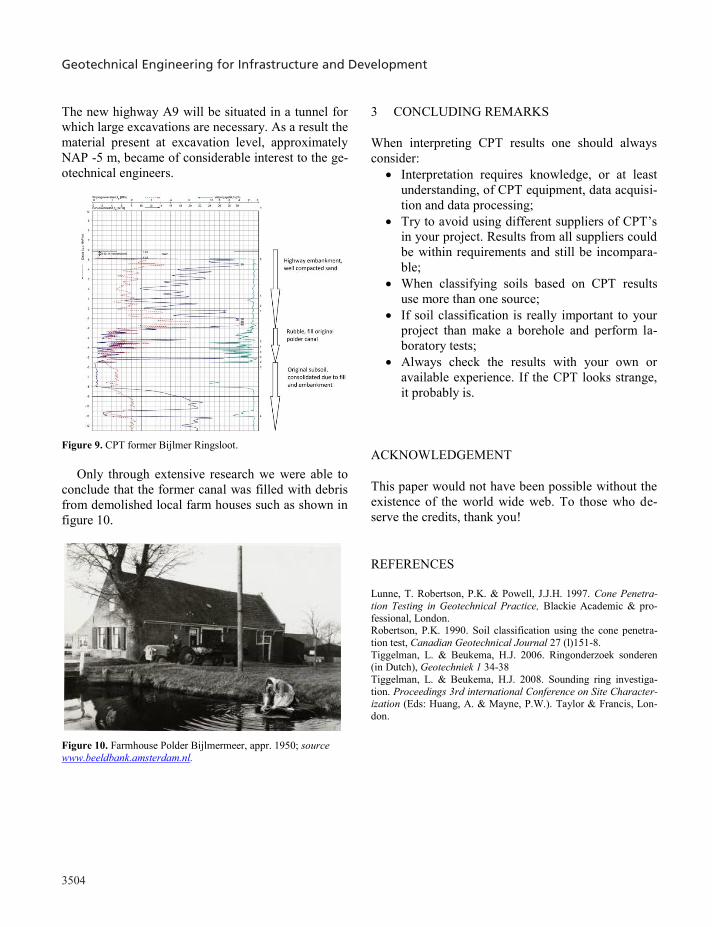
Only through extensive research we were able to
conclude that the former canal was filled with debris from demolished local farm houses such as shown in figure 10.
Figure 10. Farmhouse Polder Bijlmermeer, appr. 1950; source www.beeldbank.amsterdam.nl.
3 CONCLUDING REMARKS
When interpreting CPT results one should always consider:
Interpretation requires knowledge, or at least understanding, of CPT equipment, data acquisi-tion and data processing;
Try to avoid using different suppliers of CPT’s in your project. Results from all suppliers could be within requirements and still be incompara-ble;
When classifying soils based on CPT results use more than one source;
If soil classification is really important to your project than make a borehole and perform la-boratory tests;
Always check the results with your own or available experience. If the CPT looks strange, it probably is.
ACKNOWLEDGEMENT
This paper would not have been possible without the existence of the world wide web. To those who de-serve the credits, thank you!
REFERENCES
Lunne, T. Robertson, P.K. & Powell, J.J.H. 1997. Cone Penetra-tion Testing in Geotechnical Practice, Blackie Academic & pro-fessional, London. Robertson, P.K. 1990. Soil classification using the cone penetra-tion test, Canadian Geotechnical Journal 27 (l)151-8. Tiggelman, L. & Beukema, H.J. 2006. Ringonderzoek sonderen (in Dutch), Geotechniek 1 34-38 Tiggelman, L. & Beukema, H.J. 2008. Sounding ring investiga-tion. Proceedings 3rd international Conference on Site Character-ization (Eds: Huang, A. & Mayne, P.W.). Taylor & Francis, Lon-don.
Soil behaviour type index: a tool to measure ground improvement after vibrocompaction
Indice de comportement du sol : un outil pour mesurer l’amélioration du sol après vibrocompactage
J.M. Debats*1 and G. Scharff2 1 Vibroflotation Group, Aix en Provence, France
2 Solétanche-Bachy Pieux, Aix en Provence, France * Corresponding Author
ABSTRACT The efficiency of vibrocompaction works is commonly assessed by use of post-treatment cone penetration tests (CPTs), with pre-compaction CPTs providing an assessment of the pre-treatment density of the ground. Post-treatment CPTs can be checked against a specified acceptance criterion, and a ground improvement factor can be derived from the comparison of pre- and post-CPT profiles. The presence of layers with higher fines content may however make it difficult to determine the actual improvement factor and the influence of depth on the cone resistance shall also be considered. A new tool is proposed to assess the improvement of the ground, based on Robert-son’s normalised cone resistance and friction ratio and the associated notion of soil behaviour type index (Ic): plotting the normalised cone resistances of all pre- and post-CPTs of a specified zone of a site as a function of all corresponding values of Ic a comparison of post- and pre-compaction normalised cone resistances is made which, when compared to the conventional averaging approach, proves to be a more precise estimate of the ground improvement factor.
RÉSUMÉ L’efficacité des travaux de vibrocompactage est généralement mesurée à l’aide d’essais de pénétration statique (CPT), des es-sais avant compactage fournissant une évaluation de la densité du terrain vierge. Les CPT après traitement peuvent être comparés à un cri-tère de réception, cependant que la comparaison des essais avant et après traitement permet de déterminer le facteur d’amélioration du sol. La présence de couches avec une teneur en fines plus élevée peut rendre difficile la détermination de ce facteur ; les effets de la profondeur doivent également être pris en compte. On propose ici un nouvel outil pour décrire l’amélioration du sol, basé sur les résistances en pointe et rapport de frottement normalisés de Robertson ainsi que sur la notion associée d’indice de comportement du sol (Ic) : les résistances en pointe normalisées de tous les pré- et post-CPT d’une zone d’un chantier sont représentées dans un graphique en fonction des valeurs cor-respondantes de Ic. Une comparaison des résistances normalisées après et avant traitement peut ainsi être effectuée qui, comparée à l’approche conventionnelle basée sur des moyennes, s’avère fournir une estimation plus précise du facteur d’amélioration.
1 INTRODUCTION
1.1 Vibrocompaction quality control
Vibrocompaction is a deep compaction technique for densifying sandy soils in situ by means of an electric or hydraulic vibrating unit. Under the influence of simultaneous vibration and saturation the loose sand particles are re-arranged into a denser state and the lateral confining pressure within the sand mass is in-creased (Debats & Sims 1997; Johnson & Debats 2002; Lauzon et al. 2006; Berthier et al. 2009).
The vibrocompaction technique is most suitable
for medium to coarse grained sand with less than 10% material finer than around 70µm and with less than 2% clay content (particle size smaller than 2µm). Cohesive soils consisting of silty and clayey material are considered to not respond to vibratory compaction.
The efficiency of vibrocompaction works is com-monly assessed by use of post-treatment cone pene-tration tests (CPTs), with pre-compaction CPTs providing an assessment of the pre-treatment density of the ground.
Post-treatment CPTs can be checked against a specified acceptance criterion and a ground im-