Foreign Investment in the Andean Countries · Development (CID) teams of Harvard University and the...
33
Foreign Investment in the Andean Countries Joaquin Vial CID Working Paper No. 85 January 2002 Copyright 2002 Joaquin Vial and the President and Fellows of Harvard College at Harvard University Center for International Development Working Papers
Transcript of Foreign Investment in the Andean Countries · Development (CID) teams of Harvard University and the...

Foreign Investment in the Andean Countries
Joaquin Vial
CID Working Paper No. 85
January 2002
Copyright 2002 Joaquin Vial and the President and Fellows of
Harvard College
at Harvard University Center for International Development
Working Papers

FOREIGN INVESTMENT IN THE ANDEAN COUNTRIES1
Joaquín Vial2
Executive Summary
This work provides a general picture of the evolution of Foreign Direct Investment (FDI) in the Andean countries. Then, following a brief review of FDI determinants in developing countries, it systematically examines the Andean countries’ most important deficiencies in attracting FDI to dynamic and nontraditional sectors, based on the results of a survey conducted with executives of foreign companies installed in the Andean countries. The data clearly demonstrate grave deficiencies in essential state functions (administration of justice, probity and efficiency of the state institutions) that impede investments in general. Major problems can also be seen in various regulatory spheres (customs, foreign trade procedures, non-salary labor costs, steps for initiating new businesses) that offer a relatively unattractive picture for developing new activities. Finally, serious deficiencies can be seen in infrastructure and other aspects linked to logistics and transport. The document concludes with a set of recommendations grouped into three categories: (i) market orientation, recommending that Colombia and Venezuela target their investment attracting policy on access to the North American market and that the three remaining countries put special emphasis on the connection to markets of eastern South America. (ii) Institutional strengthening, geared to eliminating the uncertainty and instability factors linked to the deficient operation of state institutions, as well as revising bureaucratic procedures that act as a break on new business creation. (iii) A systematic review of each country’s policies with respect to developing export platforms, to adjust them to what international experience indicates are the conditions for their successful development.
1 I would like to thank Marilene Da Costa, Magdalena Frei, Davide Canavesio and José Orihuela for their efficient information processing work. 2 Center for International Development at Harvard University. Address correspondence to [email protected]

2
TABLE OF CONTENTS I. INTRODUCTION...................................................................................................................... 3
II. GENERAL ASPECTS.............................................................................................................. 5
1. EVOLUTION OF FOREIGN DIRECT INVESTMENT IN THE ANDEAN COUNTRIES......................... 5 2. COMPOSITION OF FOREIGN DIRECT INVESTMENT IN THE ANDEAN COUNTRIES ..................... 7 3. AGGREGATE FOREIGN INVESTMENT FLOWS IN THE NINETIES.............................................. 10
III. WHAT FACTORS MOBILIZE FDI?: THE INTERNATIONAL EVIDENCE............. 13
IV. STRENGTHS AND WEAKNESSES OF THE ANDEAN COUNTRIES FOR ATTRACTING FOREIGN DIRECT INVESTMENT. ....................................................... 17
V. CONCLUSIONS Y RECOMMENDATIONS...................................................................... 21
BIBLIOGRAPHIC REFERENCES .......................................................................................... 27 ANNEX I ................................................................................................................................... 28 FOREIGN DIRECT INVESTMENT FLOWS BY SECTOR .................................................................. 28 ANNEX II.................................................................................................................................. 29 FOREIGN DIRECT INVESTMENT FLOWS.......................................................................... 29 ANNEX III ................................................................................................................................ 30 SUMMARY OF RESULTS OF REGRESSIONS WITH THE SURVEY RESPONSES ........ 30 ANNEX IV ................................................................................................................................ 32 RELATIVE CONDITION OF TRANSPORT SYSTEMS ....................................................... 32

3
I. INTRODUCTION
The contribution that Foreign Direct investment (FDI) can make to the development of
poorer countries is now widely recognized. It is seen in general as an important
instrument for acquiring capital, technology, access to markets, etc. It is for these reasons
that many governments in recent decades have made efforts to make their countries more
attractive to investments by multinational corporations. This has not always been the
case, especially in the Latin American countries. In the sixties and seventies, the
environment was in fact negative, since many countries perceived FDI as the mechanism
through which the wealthy countries appropriated for themselves the income from the
national resources that these countries possessed. This led, among other things, to the
nationalization of mining and petroleum companies, foundries and refineries in that
period.
Greater acceptance of the need for foreign technologies and capital changed that
perception in the eighties and nineties, as the region’s economies began integrating more
into the world economy, bringing down the barriers to the trade of goods, services and
capital of all kinds.
The change in the political climate and a set of reforms aimed at providing legal security
and expediting foreign investments have translated into a strong growth of FDI in the
region’s countries, which has coincided with a similar growth all over the world,
propelled by the globalization processes. In recent periods, some questioning of the most
optimistic vision of this process has emerged, but from a totally different angle:
Hausmann and Fernández (2001) have sustained that the strong increase in FDI in the
Latin American countries is rather a reflection of the weaknesses of their financial and
capital markets, making this modality preferable to those who want a more active trade
linkage in the region.
This work analyzes what conditions the countries in the Andean Community of Nations
(CAN)—Bolivia, Colombia, Ecuador, Peru and Venezuela—offer to attract FDI,

4
especially to those areas that permit the diversification of the productive structure of
these economies, reducing dependence on natural resources. This document pulls
together the main results of the joint work carried out by the Center for International
Development (CID) teams of Harvard University and the teams of the academic
organizations collaborating in the Andean Competitiveness Project (PAC) of the Andean
Development Promotion Corporation (CAF) and CID. The reports prepared by the
working groups in each of the countries and the conceptual framework developed by
Shatz (2001) are found in: http://www.cid.harvard.edu/andes/
The document is organized into four parts, as well as this introduction. The first
describes the more general aspects of the evolution of FDI in the Andean countries with
respect to the world trends of this variable. The second analyzes the determinants of
foreign investment and their implications for the Andean countries, closely following the
work of Howard Shatz (2001) for the PAC. The third part analyzes the strengths and
weaknesses that the Andean countries present in attracting FDI in sectors other than the
traditional ones, based on the information provided by a foreign investment survey
conducted in the five countries. The document concludes with a section aimed at
presenting conclusions and recommendations for a public policy agenda to improve the
region’s attractiveness to FDI.

5
II. GENERAL ASPECTS
In this section, we explore three themes. First, we will briefly describe the evolution of
FDI in the region, then we will analyze its composition and characteristics, especially
with respect to other regions. We finally discuss in greater depth the rise of FDI in the
Latin American countries in the nineties.
1. Evolution of Foreign Direct Investment in the Andean Countries
Chart 1 shows the information on Foreign Direct Investment Flows to a selected group of
Latin American countries, including the five belonging to the Andean Community of
Nations (CAN). The figures are presented as a percentage of the Gross Domestic Product
(GDP) as a way to recognize the influence that the economy’s size has on the size of
investment flows.
Chart 1. FDI Flows to Latin America
(Percentage of GDP)
Country 1960-74 1975-89 1990-98 Bolivia -1.3% 0.4% 4.6% Colombia 0.5% 0.9% 2.4% Ecuador 1.4% 0.5% 2.5% Peru 0.1% 0.3% 3.1% Venezuela -0.5% 0.1% 2.5% Argentina 0.2% 0.4% 2.2% Brazil 0.6% 0.6% 1.2% Chile -0.2% 0.6% 5.1% Mexico 0.6% 0.8% 2.3% Uruguay 0.0% 0.6% 0.5% Andean average 0.0% 0.4% 3.0% Average of the rest 0.2% 0.6% 2.3% Total average 0.1% 0.5% 2.6% Source: World Bank: World Development Indicators 2000 and central banks of each country.

6
The figures demonstrate a similar process between the Andean region and the other main
Latin American economies: a strong increase in FDI as a percentage of GDP has taken
place over the course of the period. Both the orders of magnitude and the direction of the
change are similar. One interesting aspect to highlight is that virtually all countries
reveal a similar evolution with the single exceptions of Uruguay and to some degree
Brazil, which, although receiving increasing FDI flows relative to the size of their
economies, are doing so much more slowly than the rest of the region.
To put these figures in perspective, it is useful to compare them to equivalent figures for
other countries. Chart 2 shows similar trends for diverse groups of countries for the past
two sub-periods analyzed.3 It can be seen that the FDI flows for the Latin American
countries are somewhat higher than for the other regions considered (except East Asia),
but all countries show the same pattern of growth for this type of financing in the
nineties.
Chart 2. Foreign Direct Investment Flows for Groups of Countries
(Percentage of the GDP) Regions receiving FDI 1975-89 1990-98 European Union 0.60% 1.10% Latin America and the Caribbean 0.70% 1.90% Medium-Income Countries 0.60% 1.50% Medium-to-High-Income Countries 0.70% 1.70% Pacific and East Asian Countries n.a. 2.70% Source: World Bank, World Development Indicators 2000.
A more complete image is obtained by examining the figures of cumulative investment
flows over time in the different countries.
Chart 3 clearly demonstrates the strong increase that FDI has experienced in the world
and in the developing countries in particular. It also reveals that the phenomenon
3 Note that the averages in this last case correspond to overall figures for the region as a whole, unlike Chart 1, where all countries are equally weighted, independent of their size.

7
occurring in the Andean countries is part of a global trend. In this context, the greater
investment flows in the region that appear in Chart 2 can be explained by a “catching up”
or convergence process toward stock rates relative to GDP that is similar to those of other
countries, thus recovering the setbacks evidenced in the mid-eighties.
Chart 3. Cumulative Foreign Investment (stocks) by region (Percentages of the GDP)
Region 1985 1998 World 6.2% 14.2% Developed Countries 5.9% 12.7% Developing Countries 7.2% 18.9% Latin America 9.1% 18.4% Andean Countries 4.6% 17.1% Source: Howard Shatz, 2001. Table 2
One important conclusion that emerges from examining these charts is that the total FDI
volume that the Andean countries have received can be considered normal, considering
their size. They are not countries that stand out for having investment levels below
regional or world averages at the end of the nineties.
2. Composition of Foreign Direct Investment in the Andean Countries
A second aspect to analyze is the composition of the FDI with respect to the sectors to
which it is directed. The respective information is scarcer and is not systematized, with
differences in the way each country classifies the sector in which the investment is made.
Chart 4 demonstrates quite a bit of heterogeneity in the results, but the importance of the
primary sector (agriculture, mining, petroleum) is evident as a destination of foreign
investment. Another result to stress is the strong weight of investment in services, an
important proportion of which is explained by the privatization of public companies in
8
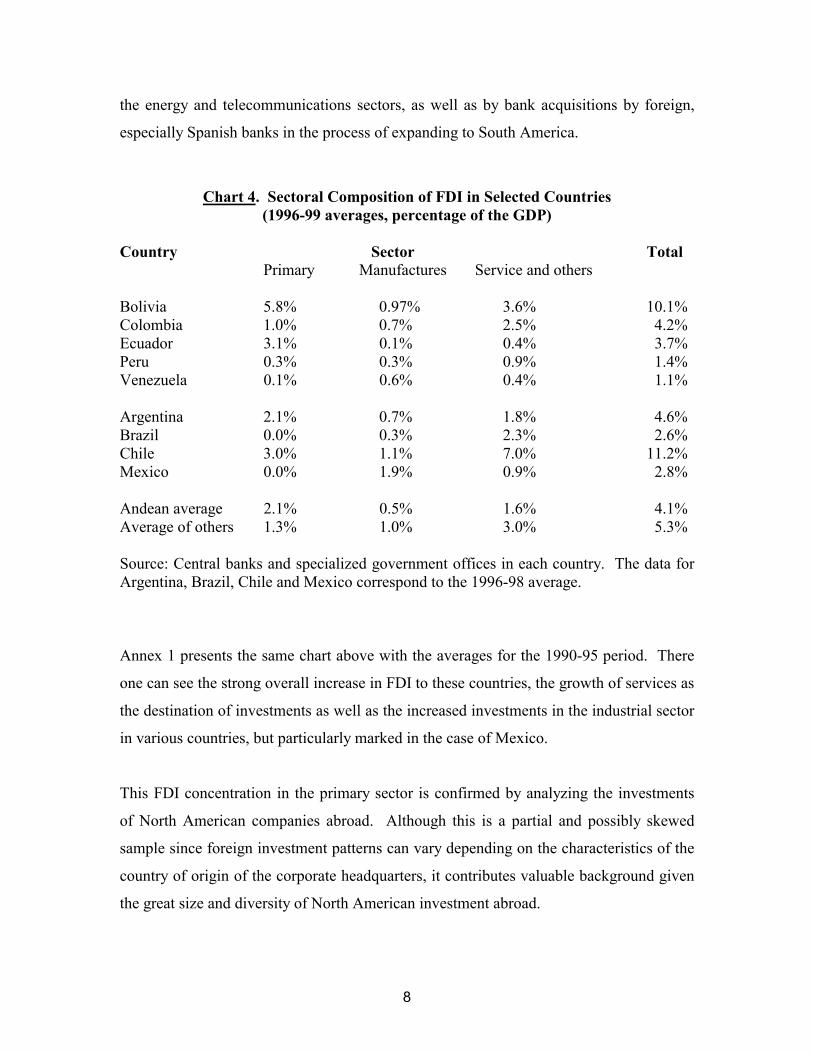
the energy and telecommunications sectors, as well as by bank acquisitions by foreign,
especially Spanish banks in the process of expanding to South America.
Chart 4. Sectoral Composition of FDI in Selected Countries (1996-99 averages, percentage of the GDP)
Country Sector Total Primary Manufactures Service and others Bolivia 5.8% 0.97% 3.6% 10.1% Colombia 1.0% 0.7% 2.5% 4.2% Ecuador 3.1% 0.1% 0.4% 3.7% Peru 0.3% 0.3% 0.9% 1.4% Venezuela 0.1% 0.6% 0.4% 1.1% Argentina 2.1% 0.7% 1.8% 4.6% Brazil 0.0% 0.3% 2.3% 2.6% Chile 3.0% 1.1% 7.0% 11.2% Mexico 0.0% 1.9% 0.9% 2.8% Andean average 2.1% 0.5% 1.6% 4.1% Average of others 1.3% 1.0% 3.0% 5.3% Source: Central banks and specialized government offices in each country. The data for Argentina, Brazil, Chile and Mexico correspond to the 1996-98 average.
Annex 1 presents the same chart above with the averages for the 1990-95 period. There
one can see the strong overall increase in FDI to these countries, the growth of services as
the destination of investments as well as the increased investments in the industrial sector
in various countries, but particularly marked in the case of Mexico.
This FDI concentration in the primary sector is confirmed by analyzing the investments
of North American companies abroad. Although this is a partial and possibly skewed
sample since foreign investment patterns can vary depending on the characteristics of the
country of origin of the corporate headquarters, it contributes valuable background given
the great size and diversity of North American investment abroad.

9
The evidence that emerges from Chart 5 is very clear: more than 50% of the FDI of North
American companies that goes to the Andean countries is earmarked for companies
engaging in mining activities or in the petroleum industry. This figure is significantly
larger than that of the rest of the South American or even Latin American region. In
contrast, North American FDI in the Asian countries flows to the rest of the economy in a
percentage similar to the world total.
Chart 5. Composition of the Cumulative FDI of North American Companies in 1999
(percentage of the regional total)
Country Petroleum Metals Rest Total Latin America 3.9% 1.4% 94.7% 100.0% South America 8.5% 3.3% 88.2% 100.0% Andean countries 27.1% 5.2% 67.8% 100.0% - Colombia 24.1% n.a. n.a. 100.0% - Ecuador 53.2% - 0.1% 46.9% 100.0% - Peru 10.6% n.a. n.a. 100.0% - Venezuela 30.3% 1.5% 68.1% 100.0% Asia 13.6% 0.9% 89.5% 100.0%
Source: US Department of Commerce, Bureau of Economic Analysis. http://www.bea.doc.gov The information on the North American companies also sheds light on the motivations
behind the investments by these companies. If the destination of their sales is examined,
it is clear that the domestic market is more preponderant as the final destination of the
sales in the case of the South American and Andean countries in particular than in the
other groups of countries.
The most noteworthy aspect of the figures in Chart 6 is the low participation of exports
within the total sales of North American company subsidiaries operating out of the
Andean countries. Although the local market is the main destination of the sales of these
companies practically everywhere, the participation of exports in the sales of these
companies is particularly low in South America and the Andean countries.

10
Chart 6. Destination of the sales of North American Company Subsidiaries (Percentage of the total, 1998)
Country Local Market Exports U.S. Other markets Total Latin America 67.3% 16.2% 16.5% 32.7% South America 82.5% 4.0% 13.6% 17.5% Andean countries 83.3% 3.9% 12.7% 16.7% - Colombia 83.2% 4.6% 12.2% 16.8% - Ecuador 70.8% 13.3% 15.9% 29.2% - Peru 58.9% 6.2% 34.9% 41.1% - Venezuela 94.3% 1.0% 4.7% 5.7% Asia 69.3% 11.0% 19.6% 30.7% World total 65.5% 10.6% 23.9% 34.5%
Source: US Department of Commerce, Bureau of Economic Analysis. http://www.bea.doc.gov
3. Aggregate Foreign Investment Flows in the Nineties
The nineties marked a pronounced change in the evolution of FDI in the region, as shown
in the charts in the previous section. The majority of observers have interpreted this as
positive news, considering that such flows, in addition to being more stable, are
accompanied by important externalities in the areas such as new technologies, access to
markets, etc. (Aitken, B., G. Hanson, G. and A. Harrison, 1997; Borensztein, E., J. De
Gregorio and J. Lee, 1998).4 This sentiment, however, is not unanimous. Voices have
been raised noting that the growing weight of FDI within capital flows is rather a
symptom of weakness of the institutions and under-development of the financial markets,
which prevent these countries from gaining access to the other financing sources that
predominate in more developed and stable countries (Hausmann, R. and E. Fernández-
Arias, 2001).
The interpretation of their results by these last authors is unquestionably controversial
and is based on only one of the reasons that justify FDI. Although one motive of FDI is

11
to make up for market deficiencies that make it more efficient to retain control than to
trade with companies in the country receiving the investment, there are also other
important motivations (Caves, 1996). Among them are possession of “unique” assets that
the firm is unwilling to share and the difficulty of selling some services internationally
(electricity or the provision of telecommunications services, for example). In a context in
which product differentiation and innovation have been gaining importance and large
corporations are adopting strategies in the framework of global competition for markets
(CEPAL 2001), it is reasonable to expect FDI to take on increased relative importance.
It is also important to point out that the difficulties of access to international financial
markets, legal insecurity and the degree of integration of the majority of developing
countries with the rest of the world were much more problematic in the sixties and
seventies than is currently the case. A literal interpretation of the H-F results would
suggest that total capital flows should increase given these changes (which has effectively
occurred) and that the FDI component should shrink within the total, which is precisely
the opposite of what has happened.5
What factors could help explain this growth of FDI in the Latin American countries?
A first element to consider is the change of political climate and greater receptivity
toward foreign capital, whether in the form of FDI or other modalities. The most evident
proof of this is the modification of the Cartagena Agreement by the CAN member
countries (Bolivia, Colombia, Ecuador, Peru and Venezuela), which replaced Decision 24
with Decision 291 in March 1998, consecrating the principle of nondiscrimination toward
foreign investors and a broad and flexible framework for attracting foreign investment.
A second factor to consider is the process of reforms through which these countries have
passed, which began at the end of the seventies in some Southern Cone countries and was
expanded and consolidated in the eighties and nineties. In general terms, these reforms
4 It is interesting to mention that the previous debate in general has a less optimistic vision regarding the contributions of FDI to development. See, for example, Caves (1996), Ch. 9.

12
have facilitated greater trade and financial opening, reduced state intervention in the
economy and, in general, created a much more propitious environment for development
of the private sector (IDB, 1997). The greater internationalization of these economies
and the privatization processes have been important factors explaining these high
investment flows.
The combination of these factors has permitted the massive arrival of foreign companies
to operate services that were traditionally in state hands and in which prior experience in
managing such businesses, as well as the large amounts of capital required, created a
huge advantage for the foreign companies.
Additionally, the figures show an important increase in investments that, though smaller,
were also attracted by the new business climate to invest in natural resource sectors. In
these cases, it seems unquestionable that the greater receptivity to FDI played an
important role in getting foreign capital to return to the same sectors in which there had
been massive nationalizations in previous decades.
Another important element, underscored in a recent CEPAL study (2001), is the role
played by the corporate strategy of businesses that have taken advantage of the region’s
more favorable setting following the reforms of the nineties, the new moment created by
recent currency devaluations and the difficult access to credit for local companies
(Hausmann and Fernández, 2001) to establish themselves and gain spaces in the region.
A relatively new phenomenon in the region is the emergence of a significant
maquiladora industry in Mexico and some Caribbean and Central American countries,
which are using the advantages of better access to the North American market since the
creation of NAFTA, their proximity and the existence of abundant labor to attract sizable
investments in the export manufacturing sector.
5 See Annex II for more background on net capital flows to the main countries of the region.

13
Nonetheless, as can be seen in the charts from the previous section, FDI in Latin America
is still very concentrated in production for supplying small and not very dynamic
domestic markets, with the sole exception of the area closest to the United States.
III. WHAT FACTORS MOBILIZE FDI?: THE INTERNATIONAL EVIDENCE6
Available information demonstrates that what is called the “gravitational model,” which
explains capital flows based on distance from corporate headquarters and size of end
market, amply dominates all other hypotheses. This poses a complex dilemma for
governments seeking to attract FDI with development-promotion goals in mind when the
countries have small markets and are relatively distant from the developed countries in
which the headquarters of the multinational companies are located. Nonetheless, actions
can be taken on these factors: since relative distance is determined by transport costs, a
good, efficiently managed infrastructure can compensate for greater physical distance.
Furthermore, the closeness of high traffic routes is a factor that helps in this regard, as the
Singapore case demonstrates.7 Market size can also be affected through trade agreements
that expand the reference area for the investments, as well as for investments in
infrastructure and agreements to simplify border procedures and transport facilities
between countries. The boom in maquila investment in Mexico after NAFTA and the
increases in FDI within the European Community in the nineties are two examples that
illustrate how trade agreements can expand the relevant markets.
Given the importance of these variables in investment decisions, the priority that the
government and the private sector of the respective countries give to the development of
infrastructure and functioning of transport markets as well as the physical and economic
integration with neighboring countries are fundamental. The protectionism for the
production of goods that characterized Latin America at the beginning of the second half
of last century has been successfully dismantled. Nonetheless, important vestiges remain
6 This section is based mainly on Shatz (2001). 7 The CIF-FOB ratio values in Singapore’s international trade is similar to that of Great Britain, even though its merchandise travels far greater distances. This is partly explained by the fact that

14
in numerous regulations for air, land and water transport for both cargo and passengers.
If the problems of scale derived from the small size of the local markets are added, the
peremptory need arises to promote a modernizing agenda for these markets to improve
the general competitiveness of these countries.
Other relevant factors have a significant effect on Foreign Direct investment decisions,
but are less important than local market size and distance from corporate headquarters.
Particularly relevant are, first, the education levels of the labor force, and within that
secondary and university education, and second, the country’s general infrastructure, both
in transport and in energy and communications. And finally, the general climate of
opening to international trade and receptivity to FDI are factors that play a positive role.
Following Shatz (2001), it seems very useful to distinguish between two types of FDI for
purposes of analyzing their determinants, because some variables we have mentioned
play a different role depending on the type of investment. One important distinction is
among investment mainly aimed at export, whether back to the country of the corporate
headquarters or to third countries; investment mainly to supply the country’s local
market; and investment in service or infrastructure sectors normally subject to specific
sectoral regulations.
i. Foreign Investment geared to export: contrary to what might be thought, this
is a small fraction of FDI, except in the case of a few very small countries or
those very close to large consumer markets. If the information of North
American companies is taken as a reference, the world average of the
percentage of sales that go to markets other than the local market in which the
affiliate is found is 34.5%. In the case of affiliates located in Europe, exports
represent 36.7%, those of Japan only 8.7%, and in Asia-Pacific, excluding
Japan, 39.2%. Even at that, the percentage of exports by South American
affiliates is particularly low: 17.5%. Within the Andean countries the
Singapore is in the middle of one of the most intense maritime traffic routes. See Radelet and Sachs (1998).

15
situation is quite dissimilar: at one extreme we have the case of Peru, in which
41.1% of the sales of North American affiliates relates to exports, followed by
Ecuador with 29.2% and Colombia (17.8%). Venezuela, on the other hand, is
distinguished precisely by the absence of foreign investments for export
(5.7%).8
The evidence reported by Shatz (2001) indicates that the distance between the
country of the subsidiary’s origin and the market for which the investment is
earmarked is among the relevant factors for attracting FDI for exports. In this
case, the company can opt to set up part of the stages of the productive
process abroad, making use of specific cost advantages in the recipient
country. This type of integration is the origin of “intra-firm” trade and is part
of the decision to optimize production when the distances are relatively less
between the different production centers. This would be the case, for
example, of investments by North American companies in Mexico, Central
America and the Caribbean, and by German companies in Eastern European
countries.
The distance between the manufacturing plant and the end market also plays
an important role when the transportation costs of the end product are high. In
this case we could have assembly or manufacturing plants in the end market
that are vertically integrated with company headquarters and specialize in
assembling the most critical parts, in which the production supplies the market
of the country in which the affiliate is located and large nearby consumer
centers. The issue of transport costs is also linked to distance. Such costs
appear as a very relevant factor in the export investment decision.
Another important factor that appears in the literature and is backed by
empirical evidence is the proximity of the large cities to the ports. The
8 No information is available about the end market for the sales of North American companies operating in Bolivia.

16
combination of access facilities to international transport that an important
port provides and the economies of scale and externalities associated with the
presence of a large urban center seems to be a determining factor in the
decision of companies to set up manufacturing plants for export.
The unit cost of labor—in other words, wages corrected for productivity—
also appears as a factor of major relevance, as do the costs and facilities for
trading internationally (level of opening of the economy). In this same line,
the existence of trade agreements that facilitate commerce appears as a
relevant factor.
The effective tax rates and incentives to export do not seem to play a decisive
role in investment decisions, even if they are very frequently mentioned as
important factors. This suggests that they alone are not enough and other
conditions linked to infrastructure and facilities of access to relevant markets
are required.
ii. Foreign Direct Investment geared to the local market: this constitutes the great
majority of FDI, according to the evidence presented above. In this case, the
distance between the country of origin of the investment operates in the
inverse sense: the greater the distance and difficulties of access, the more
probable that the firms will opt to install an affiliate to provide access to that
market instead of turning to international trade. That is why this variable
(distance) usually appears with a positive sign in aggregated studies of foreign
investment determinants.
In any case, the size of the end market is the fundamental variable for this type
of decision.
iii. Foreign Direct Investment in infrastructure and services: this is a relatively
new area that has been developing alongside the state’s withdrawal from

17
producing and distributing infrastructure services. What is particular to this
type of investment is its vulnerability to regulation and to changes of attitude
by the government and supervisory entities. The so-called “obsolete deal” is a
real danger in this kind of activity. Nonetheless, the privatization and
concession experiences in Latin America seem to suggest that institutional
weaknesses and risk of future failure to comply do not affect the amount of
the investments, but rather the number of bidders and the price at which the
assets are valued. In practice, very few bidding processes have had to be
suspended for lack of bidders, except in cases of investment projects of
doubtful private profitability.
IV. STRENGTHS AND WEAKNESSES OF THE ANDEAN COUNTRIES FOR ATTRACTING
FOREIGN DIRECT INVESTMENT. A survey targeted to executives of foreign companies operating in the respective
countries was designed based on the conceptual framework described above to evaluate
their perceptions of categories that appear relevant: labor aspects, fiscal and incentive
systems, general conditions of the country, transport conditions and regulations.
The two key variables, which are market size and distance from large markets, are well
known and relatively easy to measure, even though aspects linked to logistics can play a
very important role and will be the object of other studies in the context of the CAF and
Harvard joint work on the Andean Competitiveness Project.
To put the survey results in perspective, it is useful to note that the region presents
disadvantages with respect to market size, because, in addition to the market
fragmentation derived from the difficult Andean geography, the low average income
levels and its very unequal distribution leave these countries with markets that are not
attractive for installing large-scale industrial plants. On the other hand, although the
distances to the North American market are not as great as those of the Asian producers,
for example, the low cargo volume, competition problems and deficiencies in the

18
logistics and infrastructure chains are obstacles that increases the region’s “economic
distances” from the large markets.
The survey was taken during the last quarter of 2000, except for Peru, which required
more time due to the low response rates attained during the most intense period of the
political crisis. In total, 223 responses were obtained, 68 of them in Colombia, 43 in
Venezuela, 41 in Peru, 36 in Ecuador and 35 in Bolivia. From the viewpoint of the origin
of the surveyed investors, a majority corresponds to North American companies (79).9
1. Motives leading to the decision to invest: This question was applied in
identical form in 3 of the 5 countries. In the case of Colombia it was
discarded because previous surveys had explored this theme and in the
case of Peru the local team modified the options in such a way that some
of the criteria lost comparability. The evidence contributed by the survey
clearly shows that local market access is the dominant variable in the
investment decisions of the surveyed companies. In a ranking of 0 to 7,
local market access obtained an average of 5.7 in Bolivia, 4.1 in Ecuador
and 6.4 in Venezuela. Access to regional markets follows it in the three
cases with averages between 3 and 4. Prior studies for Colombia show a
similar pattern (Steiner and Salazar, 2001) and the evidence from the
survey done in Peru also coincides. This tends to confirm the findings of
Shatz (2001), which are based exclusively on information from North
American companies.
2. Isolation and transport conditions: distance and transport costs play a
very important role in foreign investment decisions and, as we have seen
9 Given the greater availability of information an foreign investments by North American companies, the hypothesis of significant differences in the perceptions of executives from these companies relative to the others was studied, and was rejected for all questions except two, with 95% reliability. This does not mean that the information on investments made by companies from that country are representative of the entire FDI. We can only affirm that the perceptions of the executives of North American companies about the country of destination do not differ from those of the executives from other countries, at least in the case of the Andean countries.

19
previously, it is very difficult to get industries installed with the objective
of exporting to third countries when transport costs are high. Physical
distance is not alterable, but transport costs depend, among other things,
on infrastructure, the characteristics of the specific transport markets and
the functioning of related services such as customs, ports, etc. In the
survey, the foreign investors were asked to evaluate these characteristics
relative to those of developed countries; the picture that emerged is
generally negative, but with significant diversity. In Bolivia, the road
infrastructure is unanimously perceived as very deficient,10 and is
followed with a very negative perception of the functioning of the land
transport market in general. In Colombia, one sees a very negative
evaluation of the air transport market and it is followed by the transport
security conditions. In Ecuador, the functioning of customs and
procedures for foreign trade operations, road infrastructure and security
conditions in transport appear as critical points. In Peru, the evaluation of
these aspects tends to be less negative than in the other countries, but
problems with the functioning of customs and ports stand out. In
Venezuela, transport security and the functioning of customs and ports
appear as the three most serious problems needing solutions.
3. General conditions of the countries: those surveyed were asked to
compare general conditions affecting the “business climate” in each
country with that of the developed countries. Here it was made clear that
the weakness of basic state institutions is a phenomenon common to all 5
countries of the region. The issue of corruption appears as the most
serious in all countries, followed by efficiency of the state institutions and
administration of justice, also in all countries. On this plane, the responses
by country are virtually undistinguishable, with the sole exception of
10 This is the only question that obtained unanimity in one country.

20
Colombia, which appears marginally better in this question.11 Personal
security appears as a critical theme in Venezuela and Ecuador. Health
conditions are a serious problem in Bolivia, Ecuador and Venezuela. The
provision of energy in Ecuador is not perceived as reliable and there are
serious problems of expeditious, cheap and quality telecommunications
access in Bolivia and especially Ecuador.12
4. Regulations: Although they are generally evaluated as worse than in the
developed countries, the situation is not as negative as the issue of the
country’s general conditions. The permits and other steps needed to open
businesses, as well as the procedures for foreign trade operations are the
most serious problems in this sphere in Bolivia, Ecuador and Venezuela.
The environmental regulations are perceived as an obstacle in these three
countries, although not as serious as the two other problems mentioned
above.
5. Labor market: the remunerations level is not perceived as a serious
problem in these countries, although it is seen as a concern in Colombia,
especially regarding the excessive costs that the norms impose on social
benefits, layoffs, working days and others. The availability of local
executives is a significant problem in Bolivia and Ecuador.
6 Financial and currency market: not all countries responded to all
questions in this category. The theme that emerged as most deficient is
access to funds in the local financial market (Bolivia, Ecuador and
Venezuela; there are no responses for Colombia).
The survey requested that each country be compared with the other countries of the
region in each category. Certainly this comparison is less relevant, since competitiveness
11 Paradoxically, when these same comparisons are requested for the other countries of the region, Colombia systematically receives the poorest evaluation.

21
for those who want to insert into successful segments of the world economy should be
measured with respect to those who are today successful in that field and not those that
prior analysis indicates are not doing well. More information in this regard can be found
in each of the reports of the respective countries.
Perhaps one of the most worrisome results to emerge from this survey is the lack of
progress perceived on virtually all fronts in which there are important deficits in the
region. In each of the themes surveyed, a question was included about whether progress
is perceived in recent periods (this set of questions was not included in the questionnaire
applied in Colombia) and in virtually none of them were statistically significant positive
responses obtained.
V. CONCLUSIONS AND RECOMMENDATIONS
The preceding analysis shows a paradoxical result: a very negative evaluation of the
conditions that attract FDI is perceived yet high FDI flows have gone to these countries
in the nineties, to the point that accumulated FDI stock represents a “normal” percentage
relative to the GDP compared with other groups of countries. One possible explanation
for this apparent contradiction is that FDI in these cases must be moving into extremely
profitable activities or, in the case of the privatizations that explain a high percentage of
FDI amounts in these years, the foreigners very probably beat the value of the assets way
down in the purchasing offer. This could explain why the majority of foreign investment
coming into these countries is concentrated on supplying the local market, possibly with
very little competition. It would also explain the bias that FDI has historically had in
favor of natural resources in these countries.
Although the problems of these countries are similar, it is useful to divide them into two
groups, according to the ease of access to major international markets. As Shatz (2001)
shows, this is a very important variable to get investments to develop export-oriented
12 Ecuador has lagged in privatizing these kinds of services.

22
industrial activities or services, which are the ones that will permit a break with the
traditional dependence of these countries on natural resources. Clearly the group made
up of Colombia and Venezuela is very close to the Gulf ports of the United States, which
gives them the possibility of easy access to this market, and could become an articulating
axis of a strategy to attract FDI. The other three countries are significantly further away
and the distance to the North American market could not be considered a special
advantage around which a FDI policy could be articulated. For this group, access to the
markets of eastern South America—Brazil and Argentina—seems to be a strategy that
could provide more dividends in the short run.
The market of the Andean Community as such has been a factor for attracting foreign
investments, but in still small amounts and in sectors that are not very dynamic. The
characteristics of these countries, with a geography that makes transport enormously
difficult, breaks up the markets and obstructs competition, means that this will not be a
source of great dynamism in the immediate future (Gallup, 2000). On the other hand, the
setting does not facilitate the development of dynamic and competitive activities since the
consumers of these countries are not very sophisticated or demanding, which is not
surprising after decades of protectionism (Porter, 1998). Nonetheless, as the plans
underway for physical integration progress and some of these countries see success in
their effort to insert themselves into dynamic segments of world trade, they could become
a factor that helps attract investments to the other countries of the Andean Community.
A strategy aimed at strengthening access to markets must have at least three components:
development of the relevant infrastructure that allows for effectively cutting economic
distances; revision of the norms and institutions that regulate merchandise transit to and
from the markets of destination of choice; and, third, active negotiation of access
facilities to the markets to which it aspires to gain access. Our study in general confirms
that there are infrastructure deficiencies linked to foreign trade and makes it evident that
much needs to be done to reduce the obstacles derived from the customs and port
operations. These themes should be prioritized in the programs to modernize public
institutions that many of these countries are undertaking, at times with support from

23
multilateral credit organizations. With respect to international negotiations, in addition to
the themes of free trade, investment protection and dual tax treaties currently on the
agenda, it is necessary to put a high priority on incorporating air traffic agreements to be
able to move rapidly to a free sky zone that would help improve the quality and price of
these services in the region.
A second theme that appears very forcefully in these surveys and other studies is the
weakness of institutions that are fundamental to the good functioning of the markets in
the countries of the Andean region. This is a distinctive factor of the region, as can be
appreciated in Chart 7, which shows the results of regressions of the answers reported in
the Global Competitiveness Report for 2000 in some selected variables, controlling for
the per-capita income level (expressed in PPP) and one dummy variable for the Andean
countries and another for the Latin America countries excluding the Andean ones. The
standard deviation values appear in parentheses. Those coefficients that are significantly
different from zero with a 95% probability appear in bold.

24
Chart 7. Institutional Weakness and Andean Countries
Dependent Variable
GDP per cap
NewLatinam13
Andean14
R2 Aj.
Independence of public employees .0000743 (8.69e-06)
-.0794721 (.255646)
-.6489897 (.2820112)
0.6434
Protection of property rights .0000971 (9.32e-06)
.2111743 (.2742246)
-.6080189 (.3025055)
0.7099
Stability of legal institutions .0000778 (.0000104)
.1475823 (.3050852)
-.5811267 (.3365487)
0.5628
Judicial independence .0000897 (.0000121)
-.5330643 (.355888)
-1.773935 (.3925912)
0.6645
Irregular payments to judges .0001124 (.0000118)
-.4667142 (.3458376)
-1.869528 (.3815039)
0.7478
Possibility of suing the Government .0000856 (.0000111)
-.1882649 (.3274858)
-1.150794 (.3612596)
0.6277
Government respect for commitments .0000554 (9.76e-06)
.0395871 (.2869799)
-.5116541 (.3165763)
0.4328
Financial honesty of politicians .0000928 (.0000139)
-.3022541 (.409281)
-.9457181 (.4514902)
0.5369
Informal economic activity -.0000821 (.0000107)
.43481 (3140973)
1.380862 (.3464902)
0.6597
Retention of talent in the country .0000781 (8.75e-06)
.4229728 (.2573541)
-.4993419 (.2838951)
0.6377
Protection of intellectual property .000096 (8.65e-06)
.1153641 (.2544642)
-.5328203 (.2807071)
0.7340
Intensity of competition in local market .0000292 (6.75e-06)
.0679732 (.1984308)
-.7759162 (.2188951)
0.4289
Competition has local origin .0000188 (7.22e-06)
.0991808 (.2124019)
-.5716767 (.234307)
0.2158
Ease of starting up new businesses .0000417 (9.63e-06)
-.5033764 (.2831103)
-1.016133 (.3123075)
0.4482
Discriminating buyers
.0000896 (6.04e-06)
-.0310697 (.177765)
-.8722436 (.196098)
0.8495
Numerous local suppliers .0000433 (6.23e-06)
.0101729 (.1832454)
-.5677468 (.2021435)
0.5686
Competition among local suppliers .0000785 (6.06e-06)
.049587 (.1782382)
-.65876 (.1966199)
0.8038
Strict regulatory standards .0000953 (5.98e-06)
-.1431211 (.1757747)
-.7340346 (.1939024)
0.8626
Buyers seek the newest products .0000735 (5.55e-06)
-.1305372 (.1631966)
-.7959646 (.1800271)
0.8248
Effectiveness of anti-trust actions .0000793 (7.53e-06)
.0519058 (.2215258)
-.4214283 (.2443718)
0.7123
13 NEWLATINAM: dummy variable for the Latin American countries excluding the 5 CAN countries (Bolivia, Colombia, Ecuador, Peru and Venezuela). 14 ANDEAN: dummy variable that take a value of 1 for the CAN countries.

25
These results confirm that if the Andean countries aspire to attract national and foreign
investment, they have a pending task to develop and strengthen their public services,
particularly those aspects they say are related to administration of justice and to contracts
and property rights. This chart also shows that this is not an impossible or very long-term
task; other Latin American countries exist that are perceived as much more solid among
the executives that answered the Global Competitiveness Report questionnaire and
lessons can be learned from their systems and experiences.
Faced with these challenges, the selection of other instruments to attract FDI clearly has a
lower priority, since these problems seriously prevent the economic system from
functioning well in general and thus go far beyond being an obstacle to FDI.
Nonetheless, it is usually argued that it is necessary in some developing countries to
adopt special measures that permit the development of export platforms for manufactured
products and services, without waiting to resolve the above-mentioned deficiencies.15
This type of platform must not discriminate between local and foreign investors and
insofar as cost or market access advantages exist, they should be a factor that attracts
foreign investments, with their contributions of capital, technologies and know-how.
Various types of export platforms exist, which for purposes of presentation can be
grouped into three categories: Export Processing Zones (EPZ), Export Warehousing
(EW) and Duty Exempt Systems (DES). The experience of the Asian countries shows
that one or more of these instruments have intervened in all cases of successful export
development, (Radelet, 1999). That experience also shows that these instruments are
useless without an appropriate macroeconomic context.
EPZs permit infrastructure and services to be concentrated in an area exempt from
payment of customs duties and in which expeditious customs procedures are typically
15 See Radelet (1999) for a complete discussion of the justification, experiences and conditions for success in applying these instruments.

26
applied and the bureaucratic steps are simplified. In some cases, they also include
additional tax incentives. One reason why this kind of instrument usually fails is that the
authorities try to use them as mechanisms for promoting backward zones within the
country. If the EPZ does not have adequate infrastructure, access to good services and a
profound and diversified human resources market, it loses its reason to exist.
Furthermore, to the degree that progress is not made in eliminating the distortions that
damage competitiveness in the rest of the country, it is very difficult for strong linkages
to be developed with local suppliers that will permit the benefits from the export activity
to trickle down to the rest of the economy.
The EWs have similar characteristics, but circumscribed to a specific industrial
establishment. Their advantages are more limited and it is harder to build the services
network to facilitate their development, but they have the virtue of not being limited to a
particular zone.
The SEAs are frequently used instruments (drawbacks or tax recovery mechanisms) and
have been applied in almost all Latin American countries at some point. They are
accepted by the WTO norms insofar as they do not contain implicit subsidies.
In countries that suffer acute problems of corruption and weak public institutions, it is
essential that whatever instrument is adopted be applied based on general norms, without
exceptions or special cases, and with ample information and transparency. In addition, it
is essential that the commitments adopted in these spheres be effectively complied with,
and it should not happen, as sometimes does, that when the state treasury has financial
problems, major delays occur in devolving export duties, for example.
In this context, it seems important for the Andean countries to systematically review their
export platform promotion policies, evaluating whether they fulfill the minimum
conditions for success, especially in the context of a broader definition of the objectives
of their trade and investment promotion strategies.

27
BIBLIOGRAPHIC REFERENCES
Aitken, B., G. Hanson y A. Harrison. 1997: “Spillovers, Foreign Investment and Export Behavior.” Journal of International Economics, 43, pp. 103-32. Borenztein, E., J. De Gregorio and J-W Lee. 1998: “How does Foreign Direct Investment Affect Economic Growth?” Journal of International Economics. 45, pp. 115-135. Caves, R. 1996: Multinational Enterprise and Economic Analysis. 2nd Edition. Cambridge University Press. CEPAL. 2001: La inversión extranjera en América Latina y el Caribe, 2000. CEPAL. Gallup, J. 2000. “Geography and Socioeconomic Development.” Mimeo. http://www.cid.harvard.edu/andes/. Hausmann, R, and E. Fernández-Arias. 2001: “Foreign Direct Investment: Good Cholesterol?” Foreign Direct Investment Versus Other Flows to Latin America. Development Centre Seminars. OECD Publications. IDB. 1997: “Latin America after a Decade of Reforms.” Economic and Social Progress in Latin America. 1997 Report. The Johns Hopkins University Press. Porter, M. 1998: “The Competitive Advantage of Nations.” The Free Press. Radelet, S. and J. Sachs. 1998: “Shipping Costs, Manufactured Exports, and Economic Growth.” Presented at the annual meeting of the American Economics Association. January 1998. Radelet, S. 1999: “Manufactured Exports, Export Platforms and Economic Growth.” HIID. Agosto. http://www.hiid.harvard.edu/caer2/ Shatz, H. 2001: “Expanding Foreign Direct Investment in the Andean Countries.” CID Working Paper No. 64. March 2001. Steiner, R. and N. Salazar. 2001: “La inversion extranjera en Colombia: Cómo atraer más?” Mimeo. May. http://www.cid.harvard.edu/andes/ World Bank. 2000. World Development Indicators.

28
ANNEX I
Foreign Direct Investment Flows by Sector (Average 1990 - 95, in percentage of GDP) Country Sector
Primary Manufactures Services and
others Total Bolivia 1.8 0.4 0.5 2.8 Colombia 0.8 0.4 0.4 1.7 Ecuador 1.9 0.3 0.3 2.5 Peru 0.3 0.1 1.5 1.9 Venezuela 0.0 0.4 0.7 1.1 Argentina 0.2 0.4 0.7 1.3 Brazil n.a. n.a. n.a. n.a. Chile 2.5 0.6 0.9 4.0 Mexico 0.0 0.6 0.4 1.0 Average Andean 1.0 0.3 0.7 2.0 Average Rest 0.9 0.5 0.7 2.1 Note: The data for Argentina, Brazil, Chile and Mexico correspond to 1996 – 1998 averages.

29
ANNEX II
Source: IMF: International Financial Statistics and Central Banks of each country.
FOREIGN DIRECT INVESTMENT FLOWS (FDI/GDP ratios) Andean Countries Group Other Latin American Countries Group Total Bolivia Colombia Ecuador Peru Venezuela Average Argentina Brazil Chile Mexico Uruguay Average Average 1960 - 74 -1.3% 0.5% 1.4% 0.1% -0.5% 0.02% 0.2% 0.6% -0.2% 0.6% 0.0% 0.2% 0.1%1975 - 89 0.4% 0.9% 0.5% 0.3% 0.1% 0.44% 0.4% 0.6% 0.6% 0.8% 0.6% 0.6% 0.5%1990 - 98 4.6% 2.4% 2.5% 3.1% 2.5% 3.04% 2.2% 1.2% 5.1% 2.3% 0.5% 2.3% 2.6%Memo: 1990 - 1995 2.2% 1.5% 2.1% 2.3% 1.5% 1.92% 1.8% 0.4% 3.4% 2.0% 0.4% 1.6% 1.8%1996 - 1998 8.4% 3.5% 3.2% 4.6% 3.8% 4.72% 2.9% 2.2% 7.8% 3.0% 0.7% 3.3% 4.0% 1979-1981 0.8% 0.4% 0.4% 0.2% 0.1% 0.37% 0.5% 0.6% 0.7% 0.6% 1.3% 0.7% 0.5%1982-1984 0.5% 1.3% 0.4% 0.0% 0.1% 0.46% 0.3% 0.8% 0.9% 0.5% 0.0% 0.5% 0.5%
TOTAL CAPITAL FLOWS (TCF/GDP ratios) Andean Countries Group Other Latin American Countries Group Total Bolivia Colombia Ecuador Peru Venezuela Average Argentina Brazil Chile Mexico Uruguay Average Average 1960 - 74 3.9% 2.6% 2.0% 1.1% -0.8% 1.75% 0.5% 1.8% 2.2% 1.7% 0.7% 1.4% 1.6%1975 - 89 7.0% 1.9% 5.5% 4.0% -0.6% 3.56% 1.8% 2.1% 5.6% 1.7% 3.0% 2.8% 3.2%1990 - 98 8.7% 4.7% 6.7% 7.1% 1.5% 5.73% 7.9% 3.1% 10.2% 5.7% 3.6% 6.1% 5.9%Memo: 1990 - 1995 6.9% 2.9% 5.7% 6.7% 0.5% 4.55% 6.7% 2.6% 7.4% 7.1% 2.3% 5.2% 4.9%1996 - 1998 11.4% 7.5% 9.1% 8.7% 1.6% 7.67% 10.1% 4.4% 13.3% 4.6% 6.6% 7.8% 7.7%
NON-FDI CAPITAL FLOWS (TCF-FDI/GDP ratios) Andean Countries Group Other Latin American Countries Group Total Bolivia Colombia Ecuador Peru Venezuela Average Argentina Brazil Chile Mexico Uruguay Average Average 1960 - 74 5.2% 2.1% 0.5% 1.1% -0.3% 1.73% 0.3% 1.2% 2.4% 1.1% 0.7% 1.1% 1.4%1975 - 89 6.6% 1.0% 5.0% 3.7% -0.7% 3.12% 1.3% 1.5% 5.1% 0.9% 2.5% 2.3% 2.7%1990 - 98 4.1% 2.3% 4.1% 4.0% -1.1% 2.70% 5.6% 2.0% 5.1% 3.5% 3.1% 3.8% 3.3%Memo: 1990 - 1995 4.7% 1.4% 3.6% 4.4% -0.9% 2.63% 4.8% 2.2% 4.0% 5.1% 1.8% 3.6% 3.1%1996 - 1998 3.0% 4.1% 5.9% 4.1% -2.2% 2.95% 7.1% 2.2% 5.5% 1.5% 5.8% 4.4% 3.7%

30
ANNEX III
SUMMARY OF RESULTS OF REGRESSIONS WITH THE SURVEY RESPONSES
(Each country was represented with a dummy variable that took values 1 for that country)
Comparison with developed countries Labor Aspects Bolivia Colombia Ecuador Peru Venezuela Average - Salary costs -0.50 -1.11 -0.11 -0.47 -0.72 -0.58 (0.16) (0.14) (0.15) (0.15) (0.11) - Non-salary costs -0.85 -1.09 -0.50 -0.56 -0.97 -0.79 (0.16) (0.13) (0.15) (0.15) (0.11) - Skills and capacity of workers -1.26 -0.20 -1.14 -0.50 -0.85 -0.79 (0.14) (0.12) (0.13) (0.13) (0.09) - Willingness and capacity to learn -0.85 n.a. -0.56 -0.38 -0.55 -0.58 (0.16) (0.15) (0.15) (0.11) - Labor discipline -1.12 n.a. -1.00 -0.51 -0.82 -0.86 (0.17) (0.17) (0.16) (0.12) - Availability and capacity of executives -0.91 -0.44 -0.81 -0.45 -0.53 -0.63 (0.15) (0.13) (0.15) (0.15) (0.11) Fiscal System and Special Incentives Bolivia Colombia Ecuador Peru Venezuela Average - General tax rates -0.71 -0.90 -1.26 -0.75 -0.68 -0.86 (0.16) (0.13) (0.15) (0.15) (0.11) - Expeditious access to hard currency market -0.61 n.a. n.a. -0.28 -0.70 -0.53 (0.16) (0.15) (0.11) - Ability to remit dividends and capital -0.66 -0.53 -1.12 -0.22 -0.67 -0.64 (0.16) (0.14) (0.16) (0.15) (0.11) - General subsidy system -1.13 -0.31 -1.35 -0.96 -1.09 -0.97 (0.16) (0.14) (0.16) (0.17) (0.11) - Tax incentives or specific subsidies -1.37 -0.49 -1.38 -1.00 -1.19 -1.09 (0.18) (0.16) (0.19) (0.18) (0.12) - Existence of export processing zones -1.29 -1.02 -1.35 -0.90 -0.93 -1.10 (0.19) (0.16) (0.18) (0.20) (0.13) - Access to funds in the local financial market n.a. n.a. -1.62 -0.76 -1.47 -1.28 (0.17) (0.18) (0.13) - Investment protection system -1.38 -0.89 n.a. -0.63 -1.09 -1.00 (0.19) (0.16) (0.19) (0.13) - Dual tax agreements n.a. n.a. n.a. -0.61 -1.52 -1.07 (0.17) (0.12)

31
General Conditions Bolivia Colombia Ecuador Peru Venezuela Average - Efficiency of state institutions -1.83 -1.27 -1.97 -1.51 -1.78 -1.67 (0.15) (0.13) (0.15) (0.15) (0.10) - Absence of corruption -1.91 -1.84 -1.97 -1.59 -1.68 -1.80 (0.11) (0.09) (0.11) (0.10) (0.08) - Equity and efficiency in administration of justice -1.80 -1.30 -1.89 -1.54 -1.75 -1.65 (0.15) (0.13) (0.15) (0.15) (0.10) - General sense of personal security -0.94 -0.55 -1.33 -0.77 -1.83 -1.08 (0.15) (0.13) (0.15) (0.15) (0.10) - Health conditions in general -1.65 -0.68 -1.74 -1.08 -1.49 -1.33 (0.15) (0.13) (0.15) (0.15) (0.11) - Reliability of energy provision -1.03 -0.60 -1.57 -0.49 -0.85 -0.91 (0.16) (0.13) (0.16) (0.15) (0.11) - Telecommunications access, quality and cost -1.26 -0.80 -1.64 -0.64 -0.93 -1.05 (0.16) (0.14) (0.16) (0.16) (0.11) Regulations Bolivia Colombia Ecuador Peru Venezuela Average - Environmental -1.24 -0.94 -1.17 -0.89 -0.76 -1.00 (0.18) (0.15) (0.18) (0.17) (0.12) - Taxes -1.18 -0.90 -1.25 -0.92 -0.75 -1.00 (0.18) (0.16) (0.18) (0.18) (0.12) - Labor laws -1.35 n.a. -1.35 -0.63 -1.48 -1.20 (0.15) (0.15) (0.15) (0.10) - Export procedures -1.47 -0.72 -1.32 -0.55 -1.20 -1.05 (0.17) (0.15) (0.17) (0.17) (0.12) - Import procedures -1.45 -0.68 -1.63 -0.76 -1.24 -1.15 (0.15) (0.13) (0.15) (0.15) (0.10) - Permits and procedures for opening businesses -1.32 -0.72 -1.35 -0.86 -1.28 -1.11 (0.17) (0.14) (0.17) (0.17) (0.11) - Regulations of the specific sector in which working -1.22 n.a. -1.12 -0.70 -1.10 -1.03 (0.17) (0.17) (0.17) (0.12)
Note: The responses were classified so that –2 means conditions much worse than in developed countries, -1 somewhat worse, and 0 equal to or better. Thus, a coefficient with a higher absolute value means that the gap is greater. The standard variances appear in parentheses.

32
ANNEX IV
RELATIVE CONDITION OF TRANSPORT SYSTEMS
(Simple average of the responses)
Bolivia Colombia Ecuador Peru Venezuela Customs and foreign trade procedures 1.65 2.11 1.36 1.92 1.58 Functioning of ports 1.77 n.a. 1.64 2.03 1.54 Road infrastructure 1.00 2.42 1.31 2.09 1.69 Land transport market 1.28 n.a. 1.75 2.03 1.84 Sea transport market 1.85 2.19 2.06 2.31 2.06 Air transport market 1.90 1.21 1.77 2.33 2.19 Transport security 1.77 1.81 1.36 2.08 1.35 Comparison with developed countries: 1 much worse; 2 somewhat worse; 3 similar or better