
Foreign Direct Investment in India and Role of Tax Havens · FSI - Financial Secrecy Index FTS -...
48
Foreign Direct Investment in India and Role of Tax Havens 2017
Transcript of Foreign Direct Investment in India and Role of Tax Havens · FSI - Financial Secrecy Index FTS -...

1
Foreign Direct Investment in India
and
Role of Tax Havens
2017

This document is for private circulation and is not a priced publication. Reproduction of this publication for educational and other non-commercial purposes is authorised, without prior written permission, provided the source is fully acknowledged.
Copyright @2017 Centre for Budget and Governance Accountability (CBGA), New Delhi; and Institute for Studies in Industrial Development (ISID), New Delhi
Author: Suraj Jaiswal (CBGA)For more information about the study, please contact: [email protected]
Study Supervisor: Prof. K.S. Chalapati Rao (ISID)
Designed by: Saksham Enterprises
Published by: Centre for Budget and Governance Accountability (CBGA) B-7 Extension/110A (Ground Floor), Harsukh Marg, Safdarjung Enclave, New Delhi-110029 Tel: +91-11-49200400/401/402 Email: [email protected]: www.cbgaindia.org
and
Institute for Studies in Industrial Development (ISID)Address - P.B. No. 75134, Institutional Area Phase II Vasant Kunj, New Delhi - 110 070Website: www.isid.org.in
Financial support for the study: This study has been carried out with support from Financial Transparency Coalition (FTC).
Views expressed in this report are those of the author and do not necessarily represent the positions of CBGA, ISID or FTC.

AcknowledgementsThe author would like to express his gratitude to Prof. K.S. Chalapati Rao, who provided guidance throughout the development of this study and also shared the ISID FDI dataset created by him, without which this paper would not have been possible. The author is also thankful to Jitin Asudani and Chandni Sood, who carried out the analysis of select Indian Double Tax Avoidance Agreements along with related Indian domestic taxation laws specifically for this study, which forms the basis of the taxation part of this paper.
The author would like to thank Sakshi Rai, Neeti Biyani, Amol Kulkarni, Sona Mitra and Nilachala Acharya for their valuable feedback on the draft version.
Any omissions or errors remaining, however, are those of the author.

ContentsList of Abbreviations 4
Executive Summary 5
1. Introduction 6
2. Review of Literature 8
3. Methodology and Data 13
4. Findings on the Nature of FDI into India 16
5. What Explains the Role of Tax Havens in FDI to India 25
6. Recent Developments 30
7. Concluding Remarks 33
Bibliography 34
Annexure 42

4
List of AbbreviationsAEoI - Automatic Exchange of Information
DIPP - Department of Industrial Policy and Promotion
DTAA - Double Tax Avoidance Agreement
EIBI - Export Import Bank of India
EoI - Exchange of Information
FATF Financial Action Task Force
FDI - Foreign Direct Investment
FII - Foreign Institutional Investor
FPI - Foreign Portfolio Investment
FSI - Financial Secrecy Index
FTS - Financial and Technical Services
GAAR - General Anti-Avoidance Rule
GDP - Gross Domestic Product
GoI - Government of India
IFF - Illicit Financial Flow
LTCG - Long Term Capital Gain
MNC - Multinational Corporation
NRI - Non Resident Indian
ODI - Outward Directed Investment
OECD - Organisation for Economic Co-operation and Development
PE - Permanent Establishment
PIB - Press Information Bureau
RFDI - Realistic Foreign Direct Investment
SEBI Securities and Exchange Board of India
SIT - Special Investigation Team
STCG - Short Term Capital Gain
TJN - Tax Justice Network
TRC - Tax Residency Certificate
UN - United Nations
UNCTAD - United Nations Conference on Trade and Development
VAT - Value Added Tax

5
Executive SummaryForeign Direct Investment (FDI) has gained increased traction from governments across the world as a tool to facilitate economic growth, especially by capital scarce developing countries. Increasingly, this has prompted governments to provide incentives of various kinds to foreign investors in order to attract FDI. One such incentive takes the form of Double Tax Avoidance Agreements (DTAAs) which are aimed at facilitating investment and trade between the signatory jurisdictions. However, findings in the last few years suggest that DTAAs are being used to route capital flows, especially through jurisdictions known as tax havens. In this context, the present study looks at the foreign direct investment in India during the period of 2004-14. The study makes use of a dataset, which identifies the ultimate controlling or parent entity/company of individual foreign investment inflows to India and the country that entity/company is based, i.e. its home country. These details of where the actual investor is based helps in identifying the investment flows which come directly from their home country to India, i.e. the host country, against those investment flows which are routed through a different country/jurisdiction to take advantage of some regulatory arbitrage.
Next, for the investment inflows which are routed through a third jurisdiction, we try to explain the choice of jurisdiction to route the investment flows to India based on two factors – the tax regime and the secrecy level of that transit jurisdiction. Our assumption being that an investment is routed through a particular jurisdiction if it provides certain benefits in terms of taxation, or the secrecy level of a jurisdiction is helpful in tax avoidance/evasion in the host country.
Our findings suggest that close to two-thirds of FDI inflows to India come through a country other than the home country of the foreign investor. Majority of the funds are routed through jurisdictions which are commonly known as tax havens and / or secrecy jurisdictions. In fact, there is a strong positive correlation between routing of funds and the level of secrecy offered by the respective jurisdictions. We also find that jurisdictions which are used for routing capital flows have lower effective tax rates for investments in India compared to the home country of the investors, thereby creating an incentive for treaty shopping. The most likely tax benefit for the routing of investments is ‘short term capital gains taxes’. Since, short term capital gains taxes are applicable only for inflows which are rather short term in nature and hence more likely to be portfolio investment instead of FDI, the removal of such tax benefit to select jurisdictions is unlikely to affect the inflows of realistic FDI, i.e. the inflows which are associated with besides long term investment, features like technology transfer, superior managerial practices, etc. Lastly, we discuss some of the changes, both domestic and global, that have taken place in the areas related to FDI and capital flows in the last few years.

6
I. IntroductionThe last few decades have seen a tremendous growth of Foreign Direct Investment (FDI) globally with increasing number of governments actively pursuing policies to attract FDI, particularly in developing countries where FDI has come to be seen as an essential component for economic growth. On its part, India has been seeking to attract larger amounts of FDI ever since opening up its economy in 1991. Highlighting the importance attached to FDI by policymakers, the then Finance Minister said in 2005 that “India must open the doors for more FDI ...such steps would ‘work wonders’ as it did in China”.1 More recently, the current Finance Minister in his budget speech noted:
Our Government has already undertaken substantive reforms in FDI policy in the last two years. More than 90 per cent of the total FDI inflows are now through the automatic route. ... Further liberalisation of FDI policy is under consideration and necessary announcements will be made in due course. (Budget Speech 2017-18)
The Indian government has provided many incentives for attracting FDI, such as establishing Special Economic Zones (SEZs) where companies are entitled to certain benefits, exemption from duty on import, income tax exemptions, value added tax (VAT) rebate on export, opening up of many sectors for FDI, etc2. One such policy refers to Double Tax Avoidance Agreement (DTAA)3 which is mainly aimed at promoting trade and investment by eliminating double taxation4 and making tax regulations more consistent. India adopted this policy quite early and signed the first such agreement in 1969 with Egypt. Currently, India is party to 92 DTAAs5 with various countries.
1 The Indian Express (2005): China example, we need more FDI: FM2 There is an overlap between the incentives for FDI and for domestic investment; all the incentives listed are not necessarily exclusively for FDI, and maybe applicable also for domestic investments.3 Also known as Double Tax Agreement/Code/Treaty (DTA/DTC/DTT)4 There are four major ways in which a country can treat the foreign income earned by its residents • Exemption: Foreign income is outside the purview of domestic taxation • Credit: Foreign income is taxed at domestic rates, though the taxes paid in foreign country are credited • Deduction: Foreign incomes are taxable though income considered is net of taxes paid abroad • Treating as Domestic Income: Entire foreign income is treated as domestic incomeBy entering into DTAA, both the jurisdictions basically confirm how they will treat the income earned on cross border capital flows. By dividing the taxation rights between the signatory jurisdictions, double taxation of same income is avoided.5 http://www.incometaxindia.gov.in/Pages/international-taxation/dtaa.aspx (Last accessed on April 4th 2017) There are four major ways in which a country can treat the foreign income earned by its residents • Exemption: Foreign income is outside the purview of domestic taxation • Credit: Foreign income is taxed at domestic rates, though the taxes paid in foreign country are credited • Deduction: Foreign incomes are taxable though income considered is net of taxes paid abroad • Treating as Domestic Income: Entire foreign income is treated as domestic incomeBy entering into DTAA, both the jurisdictions basically confirm how they will treat the income earned on cross border capital flows. By dividing the taxation rights between the signatory jurisdictions, double taxation of same income is avoided.
7
While the stated goals of DTAAs are promoting trade and investment, among others; they have come under criticism for facilitating treaty shopping6 and round-tripping7, due to the disproportionately huge FDI inflows from jurisdictions like Mauritius, Singapore and Cyprus, which are regarded as tax havens. Along with their role in tax avoidance, there are concerns that these jurisdictions are also being used for tax evasion and black money8, which has been highlighted in various reports9 including by government agencies and news outlets. In response to these concerns, the Government of India (GoI) has been trying to amend its treaties. After several years of negotiations, India in 2016 finally succeeded in amending the treaties with Mauritius, Singapore and Cyprus.
While it has been acknowledged by commentators and policymakers that DTAAs with the aforementioned jurisdictions were abused for treaty shopping, round-tripping and facilitating black money flows, there is a dearth of India-specific literature on this subject. Though GoI has now amended its DTAAs with Mauritius, Singapore and Cyprus, a better understanding of the nature and scope of this subject could be useful in preventing future repetition of such cases. It could also be of use for other developing countries. Against this background, this paper analyses FDI inflows to India, especially the inflows from jurisdictions considered as tax havens. By using a unique database which attempts to identify the ultimate parents/controlling interests of the inward FDI, the paper provides a quantitative estimate of inflows that are routed through a third country. The DTAAs of select jurisdictions along with Indian tax law are then analysed to find the effective tax rates applicable on the investments coming from such jurisdictions. The objective is to find out if there exist any linkages between differential tax regimes arising out of DTAA with a particular country and routing of investment inflows to India through that country.
6 In Treaty Shopping, one investor routes his/her investment through a third jurisdiction to take advantage of DTAA between that jurisdiction and the destination jurisdiction where investment is made; thus avoiding/reducing the tax payment in destination jurisdiction. For detail see Avi-Yonah (2010)7 In case of Round Tripping, a domestic investor first takes fund/capital outside the country and then routes it back as foreign investment to take advantage of benefits available to foreign investors. While it has a direct negative consequence on the tax revenue for government, this channel can also be used for illegal activities such as Money Laundering. For details see Aykut et al (2017)8 Black money is a widely used colloquial term in India and its use can have different meanings in different contexts. Generally it indicates the proceeds from illegal activities, including bribery and corruption, tax evasion as well as funds involved in criminal activities. However, in certain cases in can also refer to funds from tax avoidance.9 See GoI (2012): White paper on black money; Joint Committee On Stock Market Scam And Matters Relating Thereto (Thirteenth LOK SABHA); Cobham and Jansky (2017); NIFM (2012)

8
II. Review of LiteratureThe character of FDI has historically been dynamic, and it has continuously evolved with the global economic processes. Correspondingly, literature on the subject has also evolved. Two early attempts to understand FDI, which have significant influence on subsequent theories, can be attributed to Stephen Hymer and John H. Dunning. Hymer (1960)10 noted that there is a difference between how portfolio capital moves across countries compared to how FDI moves. While for the former, interest rate differential can be a major determinant, FDI can flow in both directions at the same time and, hence, it is more likely to be influenced by other factors. He proposed that an MNC’s decision to expand abroad is based on the control of foreign corporation, diversification, integration of processes, expanding the expertise of the firm and so on (Buckley 2006). And, since firms investing overseas have to compete with the domestic firms that have some inherent advantages in terms of knowledge of local culture, language, legal system and so on, foreign firms need to bring with themselves superior technology, innovation, marketing and management skills, new products and/or cheaper source of financing. This view, that FDI by multinational corporations (MNCs) are associated with transfer of superior technology and skills, is also supported by Graham and Krugman (1989) and Sodersten and Reed (1994).
Another influential approach towards FDI came from John Dunning who studied American firms in Britain and found them to be more productive than British firms (Dunning 1958). Subsequently, combining some other developments on the nature of FDI by other academics, such as evolutionary product cycle theory (Vernon 1966), role of technological differences between countries, and internalisation theory (Buckley and Casson 1976) among others, he proposed that MNCs’ activities for overseas expansion can be explained in terms of four motivations (Dunning 1977, 1993) -
1. Market Seeking2. Resource Seeking3. Efficiency Seeking4. Strategic Asset Seeking
The theory put forward by John Dunning, which subsequently came to be known as OLI (Ownership – Location – Internalisation) theory postulates that a firm would engage in FDI if the following three conditions are met:
1. The investing firms own certain advantages like technology, managerial abilities, marketing skills, etc
2. Investing in a particular country (location) provides certain benefits, such as resources, labour, political and legal environment
3. Internalisation of certain process is beneficial
10 Though Hymer completed and submitted his PhD dissertation in 1960, it was published posthumous only in 1976 with the help from his dissertation adviser Charles P Kindleberger. Because of this reason, in many places this publication is also quoted as Hymer (1976).

9
The above mentioned characteristics of FDI in both the approaches are of particular importance for this study, since the conceptual understanding of FDI, as described above, is different from the way it is defined for reporting purposes. The current global norms of reporting define FDI as ‘ownership of at least 10 per cent of equity or voting power’ (IMF 2009, p. 101). Because of this difference, there are possibilities that even non-FDI capital flows can be classified as FDI, which may have significant implications for government policies and impact.
From the policy making perspective, acceptance of FDI by governments as a tool for economic growth has varied over time. Whereas the 1990s are regarded as the period which saw most governments terming FDI as positive, it was preceded by the period of the 1970s and 1980s when governments were highly critical of it (Dunning 1994). The reasons for criticism or scepticism of FDI by governments are varied, such as limitations of FDI and requirements of other linkages (Hirschman 1958), loss of national sovereignty and constraint on policy making (Kobrin 2001), and negative impact on domestic industries and terms of trade (Singer 1950; Prebisch 1950). Nonetheless, FDI seems to have growing support as policy makers across the world are promoting it through various incentives (UNCTAD 2014).
The incentives for FDI can take many forms, such as tax exemptions11, regulatory exemptions, subsidised land, power and other inputs, etc. There is a significant amount of literature which focusses on the relationship between FDI and incentives. The support for incentives comes from economic theories where a firm is taken to be profit maximising, either by increasing revenue or by reducing cost, or both. By providing incentives, governments aim to reduce cost and hence make it more lucrative for firms to invest. However, a growing set of literature shows that the main determinants of FDI are not incentives. Surveys of business people conducted by many business firms and non-governmental organisations find that the most important factors for FDI are market size, political and macroeconomic stability, GDP growth, infrastructure, and skilled human resource (World Bank 2010; Kawaguchi 1994). Similar results have also been found in the empirical studies by Lim (2001), and Kumar and Pradhan (2002). James (2013) argues that investment incentives produce little additional FDI, hence governments should focus more on domestic fundamentals that are crucial for attracting FDI. The investment incentives have also come under criticism for promoting tax competition among countries. Sauvé and Soprana (2016) observe:
The recent escalation of investment incentives does raise legitimate ‘beggar-thy-neighbour’ or ‘race-to-the-bottom’ concerns when looked at from a world welfare perspective. Indeed, if a government offers generous tax incentives to foreign investors to (re-)locate their production or commercial presence in its territory, that host country’s quest to attract foreign investments, with a view to creating jobs, transferring knowledge, and increasing the overall welfare of its citizens, may prompt other governments to outbid it by offering even more generous incentive packages, thus triggering a “race-to-the-bottom” with FDI over-subsidisation as the main outcome12.
11 Since, taxes lower the final monetary profit to the company, they are considered a disincentive to investment as firms are regarded to be a profit maximising entities. However, there are others who disagree with this view and point out the necessity and the benefits of tax revenue, which can be used by governments for infrastructure building, skill upgrading, health and education which will be beneficial for the economic growth as well as overall welfare (see Ocampo and Fitzgerald 2016).12 Sauvé and Soprana (2016, p: 7)

10
Notwithstanding the arguments and evidence for limited effectiveness of incentives, increasing number of governments across the world are providing incentives to FDI. Between 2003 and 2013, direct incentives to FDI have shown a marked increase with the aim of employment generation, export promotion and technology transfer (UNCTAD 2014).
One such investment incentive takes the form of Double Tax Avoidance Agreements which have also increased in recent times. Pickering (2013) lists the prime motivations for DTAAs as promoting investment, skill and technology transfer, political and diplomatic reasons, and reducing cross border tax avoidance/evasion by co-operating with foreign tax officials. For developing countries though, she adds, the first three are the major reasons. Elaborating on these aspects, she notes:
Frequently, developing countries commence negotiations for a tax treaty primarily because they feel pressured to do so by another country. The pressure may come in the form of diplomatic or political representations, or from the tax administration or revenue officials from the other country or directly from taxpayers resident in the other country13
Such DTAAs, which are signed either because of political pressure or with the intent to promote FDI, lead to shifting of taxation rights. Easson (2000) argues that when the agreement is signed between a capital exporting country and a capital importing country, the overall taxing rights and tax revenue shifts from the poorer (capital importing) to richer (capital exporting) country. Van der Bruggen (2002) also argues on similar lines that due to imbalances between the income flows between developed countries and developing countries, DTAAs lead to one-sided revenue sacrifice.
The past few decades have seen a growing phenomenon where capital does not flow directly from a capital exporting country to a capital importing country, but is routed through jurisdictions where the capital does not engage in any significant real economic activity (Haberly and Wójcik 2015). Mostly, these jurisdictions are characterised by low tax rates, lax regulation for operation, but strict rules for confidentiality and information protection. These jurisdictions are commonly known as ‘tax havens’.
There are two slightly different ways of classifying tax havens. In the narrower sense, tax havens are looked at purely on the basis of low tax rates and other direct monetary costs of conducting business. However, there are commentators who take a broader view of tax havens and also take into account various other non-tax aspects such as domestic rules on transparency, exchange of information and co-operation with other jurisdictions (OECD 1998, 2000; TJN 2016). This paper uses the wider classification as the secrecy aspect related to confidentiality and information disclosure can have an impact on the total tax implication14.
The literature on the role of tax havens and its impact on non-tax haven jurisdictions has focused on various different aspects. For example, working with datasets on corporate earnings, Cobham and Jansky (2017) estimate global annual corporate tax revenue loss to be as high
13 Pickering (2013, p: 18)14 Correlation between secrecy and tax avoidance/evasion is discussed in section V

11
as $500 billion. While looking at the wealth that is kept tax-free in tax havens, Henry (2012) estimates the magnitude of such wealth to be in the range of $21-32 trillion. Comparing the tax paid by MNCs that have subsidiaries in tax havens against those that do not, Jansky and Prats (2013) find that the former pay 30 per cent less tax compared to the latter. Working with the data on credit and debt, Zucman (2014) estimates the magnitude of household wealth in tax havens to be $7.6 trillion. The United Nations Conference on Trade and Development (UNCTAD 2015) focusses on developing countries and finds that these countries lose $70-120 billion tax revenue annually.
One noteworthy aspect here is that the term ‘tax havens’ groups a large number of countries together. However, within this category there is a considerable difference based on their specific characteristics in terms of financial and regulatory aspects which makes it more conducive for investment of certain kinds or for certain countries. For example, while the role of Mauritius in FDI to India is well known, other similar cases of bi-lateral association of a tax haven and a non-tax-haven can also be found, like Hong Kong and China, British Virgin Islands (BVI) and China, Netherlands and Brazil, Cyprus and Russia, etc. Buckley et al (2007) consider this role played by tax havens in routing of capital flows, and note that tax havens are used as a platform for FDI for the purpose of rent seeking in terms of escape from taxes and regulations, and value seeking in terms of capital market and legal services available in tax havens. They further note that in many developing countries, underdevelopment of financial and legal institutions creates the situation where tax havens can promote foreign investments, though it can also lead to round-tripping. There is another aspect of routing of funds which can be explained on the basis of need for regional headquarters by global corporations. These regional headquarters are meant to coordinate the functioning of subsidiaries in a group of countries characterised by common socio-political, legal and economic backgrounds (Yeung et al 2001; Ghemawat 2005). Examples of such regional headquarters can be Singapore for Southeast Asia and the Pacific, Hong-Kong for East Asia, Dubai for the Middle East, and so on.
There are some researchers who argue that tax havens are used for legitimate tax planning activities, and their role in substantial tax revenue loss is somewhat exaggerated. Dharmapala (2008) argues that even with use of tax havens by MNCs, the corporate tax collection in countries such as USA and UK has not fallen; on the contrary it has increased. Desai et al (2004, 2006) in fact argue that tax havens lead to increase in efficiency and even mitigate tax competition. They add that tax havens enable tax planning that reduces the investment cost, thus the presence of tax havens can promote investment in non-tax havens. This view is supported by Hong and Smart (2007) who argue that the increased investment due to effective international tax planning involving tax havens can offset the revenue erosion effect.
Nonetheless, there seems to be a growing acceptance of the view that tax havens have an overall negative spillover, which can be gauged by the growing political initiatives by various governments and international organisations. For example, the Organisation for Economic Co-operation and Development’s initiative on harmful tax practices (OECD 1998) has gathered significant momentum and resulted in the Base Erosion and Profit Shifting (BEPS) Project15,
15 BEPS project is an initiative undertaken by OECD at the behest of G20. The project aims to create a multinational framework to deal with the various aspects of international tax evasion and avoidance. For details, see - http://www.oecd.org/tax/beps/beps-about.htm

12
which is backed by G20 countries. BEPS project is aimed at curbing various kinds of tax avoidance practices used by MNCs (OECD 2013). To address the secrecy aspects of the tax havens, OECD has restructured the Global Forum on Transparency and Exchange of Information for Tax Purposes16 (Global Forum hereafter), which aims to facilitate a better and effective framework for exchange of information between jurisdictions.
In India’s case, the roles of Mauritius, Singapore and Cyprus has been known and was even acknowledged by government officials. This prompted the government to renegotiate the DTAAs with these jurisdictions, which were finally amended in 2016. While the exact impact of these jurisdictions on tax revenue loss in India is not known, Cobham and Jansky (2017) estimate that corporate tax revenue loss in India related to all tax havens used by MNCs could have been as high $40 billion or 2.3 per cent of the GDP in 2013. To the best this author’s knowledge, there are no attempts to relate routing of funds through tax havens, their secrecy aspect and the tax treaty in the Indian case. The paper relies on a methodology developed by Rao and Dhar (2011) and further extended by Rao and Dhar (2016) which provides an indication of the roots of the foreign investors. Details of this methodology are discussed in the next section.
16 See - http://www.oecd.org/tax/transparency/

13
III. Methodology and DataIn India, the Department of Industrial Policy and Promotion (DIPP) under the Ministry of Commerce and Industry publishes the Secretariat for Industrial Assistance (SIA) Newsletter that provides aggregate statistics of FDI inflows at the level of country, sector and mode of entry. Earlier, the reporting was on the basis of approvals only. Since September 2004, it started providing individual tranche-wise details, namely investor’s name, country of the investor, name of the investee company in India, the item of manufacture/service and the amount of actual inflow. A sample of this dataset is shown below:
Based on the periodic SIA Newsletter (shown above), Rao and Dhar (2016) developed a dataset, hereafter referred to as the ‘ISID FDI Dataset’17, on which this study is based. In this dataset, the authors attempted to identify parent company/entity and/or the controlling interests of individual investments reported in the SIA Newsletter, using publicly available information from a large variety of data sources.18 Referring to the location of such ultimate interests, they added an additional indicator as the ‘Home country’ for each individual investment. A comparison of the home country with the officially reported ‘Immediate’ source country19 shows whether a certain investment flow which is reported to have come from country A, actually came from it or a third country B.
The dataset covers almost a decade: September 2004 to March 2014 (hereafter referred to as 2004-14). In view of the extensive data requirements, the exercise was at the first stage limited to all those remittances/tranches which individually amounted to at least $5 million. At the second stage, other tranches of inflows, which have the same combination of investors and investees, were also taken into account. In all, 8,851 individual tranches20 were analysed
17 The authors shared the dataset for specific use in this study18 While certain misclassifications cannot be ruled out, the authors underline that “it is probably the closest to what private researchers can achieve using public information sources”.19 Provided in the SIA newsletter20 The selected tranches include 2900 recipient Indian companies

14
which accounted for $174 billion out of the total $205 billion FDI equity inflows reported for the period. The dataset thus covers a large proportion (84 per cent) of the inflows. Following the above approach, the selected inflows have been placed into three groups:
1) Direct Flows – when the reported country and the home country are the same2) Routed Flows – when the reported country and the home country are different3) Un-Identified Flows – when either the reported country or the home country are not
identified
The dataset also contained some inflows, amounting to $4.4 billion, which were attributed to Non-Resident Indians (NRIs). These inflows have been left out of the analysis as their source countries are not reported. There are some cases where country details are not clear; these have been reclassified by us as ‘Un-Reported’21.
The following diagram illustrates the data preparation for this study, starting from the data given in the SIA Newsletter:
Individual Tranches*>= $5 mn (Total: $17 8 bn**)
Other Smaller Tranches ($27 bn**)
Non-Resident Indians($4 bn)
Foreign Investors($174 bn)
Both Home andReported Countries are
identified ($164 bn)
Either Home or Reported Country is Unidentified ($10 bn)
Foreign Direct Investment into India(Total during 2004-05 to 2013-14 = $304 billion)
Direct Flows($45 bn)
Routed Flows ($119 bn)
Un-I de nti fi ed Fl ows($10 bn)
Equity Inflows (Approval, Acquisition and Automatic routes)
($208 bn)
Reinvested Earnings + Other Capital
($85.8 bn)
Equity Capital ofUnincorporated Bodies
($10.3 bn)
*Including smaller ones with the same investor-investee combinations**Excludes inflows during April-August 2004 due to data unavailability. Sum of unavailable data amounts to $3 bn
21 These are the cases where the entries in the ‘Country’ column are: ‘–‘, Acquisition of Share, Country Details Awaited, Island JE 24WA, Nuova FourB S.r.l, Unindicated Country. Total FDI inflows from this category amount to $9 billion.
15
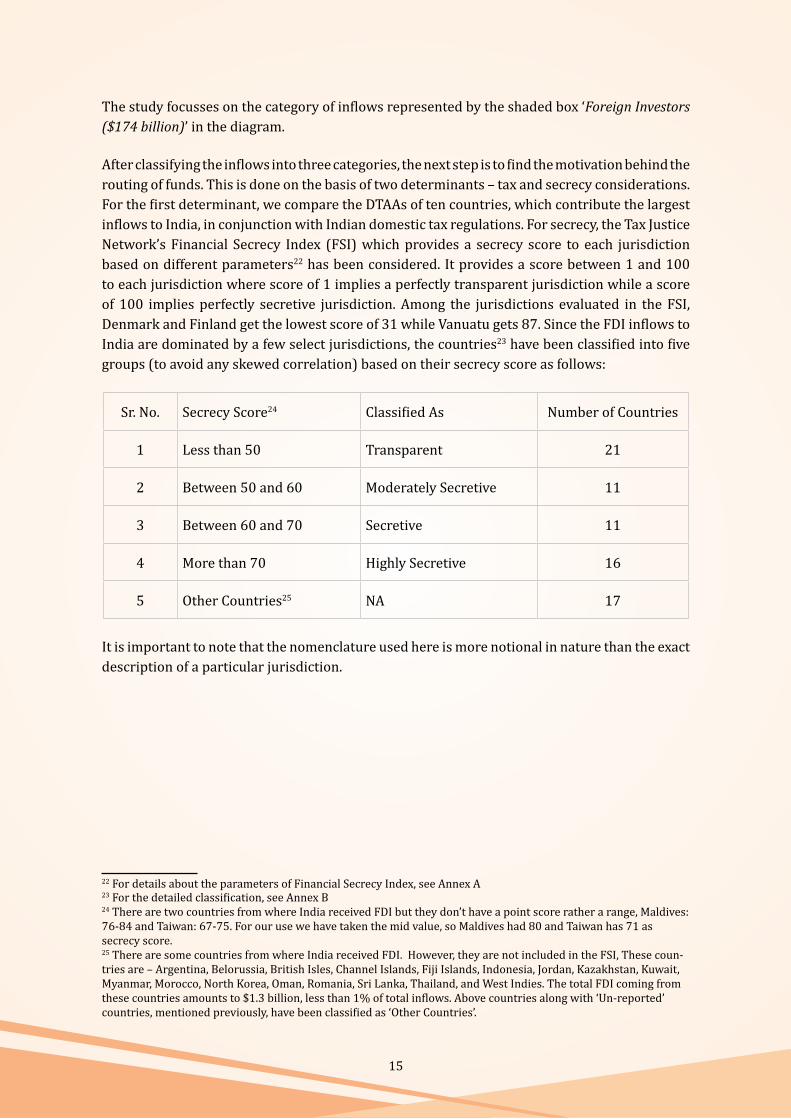
The study focusses on the category of inflows represented by the shaded box ‘Foreign Investors ($174 billion)’ in the diagram.
After classifying the inflows into three categories, the next step is to find the motivation behind the routing of funds. This is done on the basis of two determinants – tax and secrecy considerations. For the first determinant, we compare the DTAAs of ten countries, which contribute the largest inflows to India, in conjunction with Indian domestic tax regulations. For secrecy, the Tax Justice Network’s Financial Secrecy Index (FSI) which provides a secrecy score to each jurisdiction based on different parameters22 has been considered. It provides a score between 1 and 100 to each jurisdiction where score of 1 implies a perfectly transparent jurisdiction while a score of 100 implies perfectly secretive jurisdiction. Among the jurisdictions evaluated in the FSI, Denmark and Finland get the lowest score of 31 while Vanuatu gets 87. Since the FDI inflows to India are dominated by a few select jurisdictions, the countries23 have been classified into five groups (to avoid any skewed correlation) based on their secrecy score as follows:2425
Sr. No. Secrecy Score24 Classified As Number of Countries
1 Less than 50 Transparent 21
2 Between 50 and 60 Moderately Secretive 11
3 Between 60 and 70 Secretive 11
4 More than 70 Highly Secretive 16
5 Other Countries25 NA 17
It is important to note that the nomenclature used here is more notional in nature than the exact description of a particular jurisdiction.
22 For details about the parameters of Financial Secrecy Index, see Annex A23 For the detailed classification, see Annex B24 There are two countries from where India received FDI but they don’t have a point score rather a range, Maldives: 76-84 and Taiwan: 67-75. For our use we have taken the mid value, so Maldives had 80 and Taiwan has 71 as secrecy score.25 There are some countries from where India received FDI. However, they are not included in the FSI, These coun-tries are – Argentina, Belorussia, British Isles, Channel Islands, Fiji Islands, Indonesia, Jordan, Kazakhstan, Kuwait, Myanmar, Morocco, North Korea, Oman, Romania, Sri Lanka, Thailand, and West Indies. The total FDI coming from these countries amounts to $1.3 billion, less than 1% of total inflows. Above countries along with ‘Un-reported’ countries, mentioned previously, have been classified as ‘Other Countries’.

16
IV. Findings on the Nature of FDI into India
FDI inflows to India have seen a tremendous growth in the decade of 2000 and thereafter. While hovering around the $2 billion annual mark in the late 1990s, it has seen a steady increase in the new century (Chart I). The breakaway point was 2006-07 which saw FDI shoot up to $22 billion from $9 billion in the previous year. Since then, it has grown to $36 billion during 2013-14, the latest year of this study, making India one of the largest recipient countries of FDI globally.
Chart I: Foreign Direct Investment in India, 2004-14
Changes in the FDI reporting Methodology
0
5
10
15
20
25
30
35
40
45
50
$ U
S bi
llion
FIPB/Automatic/ Acquisition Reinvested earnings
Equity capital of unincorporated bodies Other capital
Source: Based on Rao and Dhar 2016, Table I
There can be multiple reasons behind this increase. A part of this growth can be attributed to the change in methodology in 2000-01, when India adopted the international norms for reporting FDI and started including the reinvested earnings along with equity capital of unincorporated bodies and other capitals in the FDI statistics, which has a significant impact on the total FDI numbers (see Chart I). However, even without the change in methodology, the fresh equity inflows grew more than 10 times between 2004 and 2011. Another important factor behind the increase seems to be the rising trend in global FDI flows. Between 2004 and 2014, total global FDI inflows increased from less than $700 billion to $1320 billion while peaking at $1909 billion in 200726. India attracted a proportionately bigger share of this global FDI growth as it not only increased the FDI inflows in absolute terms but it also increased its share in the total global FDI inflows from less than 0.9% in 2004-05 to around 2.5% in 2013-1427 while reaching the high of 2.9% in 2009-10 and 2011-12. This increase can be due to changes in government policies, like enactment of Special Economic Zones (SEZ) Act and changes in the FDI policy in 2005 (Rao and Dhar 2016).
26 UNCTAD Statistics, Foreign direct investment: Inward and outward flows and stock, annual, 1970-2016Accessed at: http://unctadstat.unctad.org/wds/TableViewer/tableView.aspx?ReportId=9674027 Numbers are approximate as UNCTAD uses calendar year for reporting while Indian numbers are reported for April – March period. Also, UNCTAD reports net inflows (net of repatriations and disinvestments).
Changes in the FDI reporting
Methodology

17
Along with the high growth during this period, another well-known feature of FDI in India is the role of Mauritius and, more recently, that of Singapore and Cyprus, as sources of inward FDI. The case of Mauritius is of particular importance because it contributed close to 40 per cent of total FDI during this period as is visible from the following graph:
Chart II: Shares of Top 10 Reported Source Countries for FDI into India, 2004-14
Maur39
ritius9%
Singapor13%
re
Ja8
Swi
Other10%
apan8%
UK6%
itzerland1%
K%
Un-Report5%
Nether5%
USA4%
Cyprus4%
Ger3
France2%
ted
rlands%
rmany3%
Source: Author’s calculation based on the ISID FDI Dataset
The top two jurisdictions, Mauritius and Singapore, together contributed more FDI to India than the rest of the world combined. A look at the trend suggests that over the years Mauritius has been ceding ground to Singapore (Chart III).
Chart III: Trend of FDI into India and the Top Source Countries, 2004-14
46
56 5551
3840
3734
44
21
0
10
20
30
40
50
60
2004‐05 2005‐06 2006‐07 2007‐08 2008‐09 2009‐10 2010‐11 2011‐12 2012‐13 2013‐14
Percen
t of T
otal In
flows to In
dia
Mauritius Singapore Japan UK Netherlands USA Cyprus
Source: Author’s Calculation based on the ISID FDI Dataset

18
Mauritius, which contributed more than half of the annual FDI during 2005-08, slipped to second place in 2013-14 pointing towards the growing role of Singapore. The FDI coming from these two countries has received considerable attention. Given the size of their domestic economies, such huge volumes of outward FDI are hard to explain. For example, in 2008-09, the FDI from Mauritius in India was more than $10.1 billion, while the GDP of Mauritius for the same year was only $9.9 billion.28 Since India is only one of the many destinations and there are other countries in South-East Asia and Africa which also receive FDI from Mauritius, the total FDI outflow from Mauritius is likely to be much higher than the country’s annual GDP. Based on these factors, there has been a growing acknowledgment that Mauritius, along with Singapore, Cyprus and other such countries, is being used for tax avoidance/evasion and round-tripping.29In fact, the Economic Survey of India (2015-16) noted that:
[T]hese inflows need perhaps to be examined more closely to determine whether they constitute actual investment or are diversions from other sources to avail of tax benefits under the Double Tax Avoidance Agreement that these countries have with India.30
Though this phenomenon of routing foreign funds into India has been well-known for quite some time; to the best knowledge of author, the first such exercise to identify the real source of funds was carried out by Rao and Dhar (2011) focussing on the period between 2004 and 2009. The authors extended the exercise to cover the period till March 2014 as a part of their study ‘India’s Inward FDI Experience during the Post-liberalisation Period with Emphasis on the Manufacturing Sector’, 2016. The ISID FDI dataset developed for the above studies highlights the distinction between the reported countries and the ultimate home country. Examples presented in Table I make this distinction clear.
Table I: Some Cases Illustrating the Identification of Home CountriesReported Ultimate Parent/Control Investee Indian
CompanyInvestor Country Investor Country
Vodafone Mauritius Ltd Mauritius Vodafone Group Plc UK Bharti Infotel LtdKKR Mauritius Cement Investments Ltd Mauritius KKR & Co., LP USA Dalmia Cement Bharat
LtdDeutsche Asia Pacific Investment Holdings Ltd Singapore Deutsche Bank AG Germany Deutsche Investments
Pvt LtdEssar Energy Holdings Ltd Mauritius Essar Group India Essar Oil LtdTwinstar Holdings Ltd Mauritius Vedanta Group India Sesa Goa LtdSerco International SARL Luxembourg Serco Group PLC UK Serco BPO Pvt LtdGS Investment Partners (Mauritius) IV Ltd Mauritius Goldman Sachs USA Tikona Digital Networks
Pvt LtdRelay BV Netherlands Diageo PLC UK United Spirits LtdWalt Disney Co (South East Asia) Pte Ltd Singapore Walt Disney Co. USA UTV Software
Communications Ltd
28 Data taken from World Bank website: http://databank.worldbank.org/data/reports.aspx?source=2&coun-try=MUS29 After the renegotiation of India-Mauritius DTAA in 2016, Finance Minister Arun Jaitley noted that it will curb the round tripping and generation of Black Money (Economic Times 2016a).30 Ministry of Finance(2015-16, p: 133):Economic Survey

19
Sanlam Emerging Markets (Mauritius) Ltd Mauritius Sanlam Ltd South
AfricaShriram Financial Ventures Chennai Pvt Ltd
Abbott Asia Holdings Ltd UK Abbott Laboratories USA Abbott Healthcare Pvt
LtdDeutsche Bank Trust Co USA Deutsche Bank AG Germany Anant Raj Industries LtdClaymore Investments (Mauritius) Pte Ltd Mauritius Temasek Holdings Singapore GMR Energy Ltd
TMI Mauritius Ltd Mauritius Telekom Malaysia BHD Malaysia Idea Cellular Ltd
Oberon Ltd Mauritius Farallon Capital Management LLC USA Indiabulls Financial
Services Pvt LtdSource: Compiled from ISID FDI Dataset
The (above) identification of reported country and home country of FDI in India is instrumental in moving beyond the notional claim of misuse of tax havens by providing quantitative figures for the nature of funds. The findings of this study reveal some interesting aspects of FDI in India as is evident from Chart IV.
Chart IV: FDI into India based on Home Country, 2004-14
USA27%
India17%
UK12%%
Other15%
Japan9%
Ge
Unidenti�ie1%
ermany5%
Franc4%
Malays3%
Singap3%
India+2%
Hong Kon2%d
ce
sia
pore%
ng
Source: Author’s Calculation based on the ISID FDI Dataset
While Mauritius and Singapore are regarded as the top contributors of FDI, USA becomes the top contributor of FDI in India in terms of FDI inflows based on their home country with a share of 27 per cent, which is in line with the global prominence of USA as the leading international investor. Interestingly however, the next biggest contributors of FDI in India are in fact companies based in India, far outweighing the contribution of other major economies like UK, Japan and Germany. There is another group named ‘India+’, which refers to investments by those overseas investors/companies which have India-related owners/shareholders as private equity investors. The extent of ownership/control details being unclear, these were not clubbed with the ‘India’ category.

20
The classification in this case refers to the control of funds and not to the origin of funds. For instance, while it shows that 17 per cent of FDI coming to India is controlled by India-based companies or investors, a part of the funds may have been raised31 overseas. On the other hand, the above findings do reinforce the possibility of ‘round-tripping’32 to some extent. In view of the complex nature of fund raising and the near impossibility for individual researchers to obtain the required information, it would not be possible to pinpoint the exact source and nature of the funds. At this point, it can be said that India-controlled FDI is likely to be a combination of funds raised overseas and round-tripping. The period 2004-2014 also coincided with a huge increase in Illicit Financial Flows (IFFs)33 moving out of India – from $19 billion in 2004 to $83 billion in 2013 (Kar and Spanjers 2015). India’s outward direct investment (ODI) flows also increased from $2 billion in 2004 to $12 billion in 2014.34 An increase in the above two types of flows does not necessarily provide evidence of round-tripping, as other factors, most likely opening of economy and relaxation in the outward flow of funds, may also have contributed to the growing outflows; but they can contribute to such a possibility.
Next, we look at the routing of funds, meaning comparing the inflows invested directly from the home countries against those which came through other jurisdictions.
Chart V: Overall Distribution of FDI into India based on Route, 2004-14
countr
Routed through a 3rd
y, 68%
Directly from Home
country, 26%
Un-Identified, 6%
Source: Author’s Calculation based on the ISID FDI Dataset
It is apparent that only about one-fourth of the FDI came directly, while close to 70 per cent of the funds were routed through other jurisdictions. The remaining 6 per cent consists of inflows about which either the details of the reported country or of the home country were not available. More than two-thirds of the FDI coming to India comprises of either the funds that were first shifted to an entity (or more than one entity) in another jurisdiction before finally being invested in India, or the funds available with functional subsidiaries/affiliates in other jurisdictions. This
31 Funds could have been raised through stock market, bank loan, institutional or individual investors, etc.32 A report by Export-Import Bank of India (2014) has noted earlier that “Round-tripping is a major reason for Mau-ritius being a source as well as destination for FDI”, however it doesn’t give any estimates for the same.33 Illicit financial flows (IFFs) are illegal movements of money or capital from one country to another, where the funds are illegally earned, transferred, and/or utilised (Kar and Spanjers 2015).34 Based on UNCTAD (2016): World Investment Report, Annex Table 02

21
process of routing, however, does not necessarily have to be done in one single step involving just one entity in one jurisdiction. The exercise of identifying the ultimate parent entity for FDI inflows suggests a much more complex sequencing of fund flow and equally complex corporate structure involving multiple entities in multiple jurisdictions. This is illustrated in Annex C.
Further, we look into the details of reported source countries and their characteristics related to the secrecy aspect, as given in Chart VI.
Chart VI: FDI inflows based on the Classification of the Reported Source Countries
Highly Secrective
42%
Secretive19%
Moderatley Secrective
16%
Transparent17%
NA6%
Source: Author’s Calculation based on ISID FDI Dataset
From the above figure, it is clear that 61 per cent of the inflows came through either ‘Highly Secretive’ or ‘Secretive’ jurisdictions, while only 33 per cent came from countries which are relatively transparent. More importantly, there is a clear positive correlation between the secrecy level of the source country and the nature of capital flows into India from that country, as evident from Chart VII.
Chart VII: Secrecy Level of Reported Source Country and Routing of Inflows, 2004-14
93.8%75.6%
28.3%50.9%
0%
20%
40%
60%
80%
100%
Highly Secrective Secretive Moderatley Secrective
Transparent
Secrecy Level of Reported Jurisdiction
Routed Through Direct In�lows Un-Identi�ied
Source: Author’s Calculation based on the ISID FDI Dataset

22
The picture above shows that capital inflows from countries with high secrecy level are more likely to be routed flows. In the case of countries with very high secrecy, the extent of routed capital is greater than 90 percent, as opposed to less than 30 per cent in the case of very low secrecy countries. Looked at in a different manner, close to 80 per cent of routed funds seem to have come from highly secretive or secretive jurisdictions. On the other hand, 70 per cent of the inflows directly from home countries are from the jurisdictions categorised as moderately secretive or transparent. If only the identified inflows, for which both the home country and reported countries were identified, are taken into account, the share of routed funds would be even larger. The extent of routing decreases with a decrease in the secrecy level, though there is slight increase in routing with jurisdictions classified as ‘Transparent’. Two major contributor jurisdictions in this category are UK and the Netherlands, which together accounted for 67 per cent of the inflows in this category. Although both these jurisdictions have a low secrecy score, they find mention as tax havens in the works of some other researchers and commentators (BBC 2014; Oxfam 2016). Their low secrecy scores but relatively higher share of routed funds can be explained by their peculiar political and regulatory structures. For example, though as a separate jurisdiction UK has a low score, it has intricate political and regulatory connections to its British Crown Dependencies and Overseas Territories which include Jersey, Cayman Islands and British Virgin Islands, among others, which are known for their secrecy; and this can provide a convenient way for routing of funds. In the case of the Netherlands, it provides many special financial provisions such as Special Financial Institutions, Innovation Box, along with the benefit of large number of DTAAs.35
A closer analysis of individual countries provides a better picture of routing of capital inflows, as is visible from the following graph:
Chart VIII: Top 10 Reported Source countries and Nature of Inflows, 2004-14
97 94 90 83
4834
26
5 4 00%
10%
20%
30%
40%
50%
60%
70%
80%
90%
100%
% of T
otal In
flow
Routed Inflows Direct Inflows Un‐Identified
Source: Author’s Calculation based on the ISID FDI Dataset
Well-known tax havens and secrecy jurisdictions, as expected, have a higher share of routed funds. Mauritius, Singapore and Cyprus all three have shares in excess of 90 per cent.
35 For details see - FSI (2015): The Narrative Report on Netherlands; The Narrative Report on the UK

23
One major difference between inflows coming directly from home countries and routed capital flows is the purpose and nature of FDI. As mentioned in the literature review, FDI refers to those cross-border investment flows which are associated with technology transfer, management innovations, marketing techniques and so on (ownership advantages in Dunning’s OLI framework). However, the current international reporting norms, based on the IMF Balance of Payment manual classification, define FDI as cases of cross-border investment where ‘direct investor directly owns equity that entitles it to 10 per cent or more of the voting power in the direct investment enterprise’ (IMF 2009, p. 101). This definition focusses on the operational aspect of classifying FDI while ignoring the important functional aspects of FDI mentioned above. Due to this approach, even those capital inflows that are aimed at rent seeking or are speculative in nature, and hence should be categorised as portfolio investment, are instead termed as FDI. This neglect of the distinguishing features is of particular importance to developing countries as such investments do not carry with them the expected FDI-specific benefits. An ownership threshold of 10 per cent does not necessarily indicate either the capacity or commitment on the part of investors to bring such benefits. In India, moreover, there are multiple cases where the capital inflows were categorised as FDI in the reported statistics, even when the investor share was less than 10 per cent (Rao and Dhar 2011). This lapse raises concerns about the data quality, and also highlights the possibility of FII/FPI being categorised as FDI. However unlike FDI, FII/FPI36 are driven by a different set of factors, like domestic stock market performance, exchange rate volatility, domestic output growth, emerging market equity performance and interest rate differential (Dua and Garg 2013).
Notwithstanding the concerns that raise the question whether all inflows reported as FDI can really be categorised as such, this analysis follows the official classification. However, it takes the help of the existing literature and research on the subject to see if the reported FDI inflows conform to the functional aspects of FDI. Based on the same dataset37 that is used for this paper, a reclassification of the fund inflows into two categories - Realistic FDI38 and Non-Realistic FDI, has been done by Rao and Dhar (2016). Realistic FDI (RFDI) is defined as fund flows which follow the theoretical classification of FDI that is motivated by one or more of following purposes – Market seeking, Labour seeking, Efficiency seeking and Strategic Asset Seeking, irrespective of the threshold of ownership/voting share. These are the funds which are supposed to deliver the specific benefits of FDI. Those funds which do not come under RFDI are classified as Non-RFDI.
Based on the above classification, the total RFDI in the period of the study amounts to only $95 billion out of a total $178 billion in consideration. The top ten countries contributing to RFDI are:
1. USA2. Japan3. UK
36 Foreign Institutional Investors (FII) are those entities who are registered in one country and make investment in others, some examples include - hedge funds, insurance companies, pension funds and mutual funds. Foreign Port-folio Investors (FPI) are those who generally invest in financial assets in other countries. The exact/legal definition may differ across countries.37 One minor difference between both the datasets is the NRI inflows. While this paper excludes the NRI inflows, Rao (2016) includes it. The NRI funds in consideration amount to a total of $4.4 billion or about 2.4%.38 The inflows which are likely to possess the attributes like long term interest, advanced technology, managerial techniques, etc. are classified as Realistic FDI (RFDI), while the remaining funds are classified as Non-RFDI.

24
4. Germany5. France6. Malaysia7. Switzerland8. Hong Kong 9. UAE10. Norway
The relation between RFDI and routing of funds is clear from the above list, as eight out of top ten contributors of RFDI to India have low to very low proportion of routed funds while the jurisdictions with high share of routed funds contribute little to no RFDI. Mauritius, Cyprus and Luxembourg do not feature in the top 20 countries39 for RFDI; and Singapore’s contribution to RFDI comes to only $1.3 billion as against $23 billion of FDI reported in official statistics.
39 For the list of top 20 countries for RFDI, see Annex D

25
V. What explains the role of Tax Havens in FDI to India
Establishing a subsidiary, which does not engage in any real economic activity, in one or more jurisdictions is likely to have some monetary as well as non-monetary costs associated with it. Given the profit maximising motivations of corporations and business firms, it can be inferred that establishing subsidiaries in tax havens provides firms the benefit that exceeds the associated costs. Existing literature40 on the use of subsidiaries in tax havens shows an extensive use of such subsidiaries by MNCs and other investors. These subsidiaries are aimed at not only utilising the low tax rates in that particular tax haven but also for minimising tax payments in other jurisdictions, primarily in two ways:
• Use of Double Tax Avoidance Agreements (DTAAs): When the jurisdictions differ in terms of tax base,41 tax rates or other related regulations, it creates an opportunity to minimise tax liability by shifting the income to the jurisdiction with lower tax rates through treaty shopping (Odari 2015).
• Abusive Transfer Pricing: Transfer pricing refers to the valuation of transactions between affiliated enterprises42 (IMF 2009, p. 41). When transfer price differs from the commensurate market price, it is known as abusive transfer pricing. MNCs with multiple subsidiaries can shift income from a high tax jurisdiction to a low tax jurisdiction by assigning a misappropriate valuation to the intra-corporate transactions, thus lowering their overall tax liability (Bhat 2009).
The minimal cost of establishing a shell company and low or zero tax rates in tax havens provides incentives to the MNCs such that a subsidiary can be incorporated in a particular tax haven specifically to exploit the taxation framework resulting from the DTAA network.
To assess the role of DTAAs in influencing the inflows to India, we look at the effective tax rates for different incomes arising out of inflows to India from different jurisdictions. Since India not only receives FDI from other countries, but is also a source of Outward Direct Investment, a comprehensive view also requires analysing how India treats the income earned overseas by its residents. In this paper however, we focus only on the first aspect, i.e., treatment of income earned in India by overseas entities.
A non-resident is liable to pay tax in India if he/she has43:
40 The literature on various aspects of corporate tax avoidance and tax havens is growing rapidly. An overview can be found in - Otto et al (2015); Zucman (2014); Dharmapala (2008); OECD (1998, 2013); Gravelle (2015); Phillips et al (2016).41 Tax Base is defined on two aspects – first, which categories of income/property are taxed; and second, at what threshold. For example, In case of income tax in India, salary income is taxable but not the income earned from agriculture. So, here salary income forms the part of tax base but not agriculture income. Secondly, within salary in-come, those earning below 250,000 INR annually are exempted from income tax. So here again, only a salary above 250,000 INR annually forms the tax base while one falling below that limit does not.42 Affiliated enterprises are those which have common ownership or control. Also known as related entities, sister companies, etc.43 Section 5(2) of the Income-tax Act, 1961

26
Income received or deemed to be received in India, or Income accruing44 or arising in India, or Income deemed to accrue or arise in India
The charge of income-tax on non-residents arises from the domestic tax law only, i.e., Income Tax Act, 1961. However, in the case of countries which have DTAAs with India, it is the interplay of the Indian domestic tax law read with the Double Taxation Agreements, whichever is more beneficial45 for the tax-payer. Also, where a specific provision is made in the tax treaty, such a provision will prevail over the general provisions contained in the domestic tax law or the general provisions of DTAA. Where a DTAA specifically provides for a particular mode of computation of income, the same should be followed, irrespective of the provisions in the domestic tax law. However, where there is no specific provision in the tax treaty, it is the Income Tax law that will govern the taxation of income.46
Depending on the provisions of the DTAA, for an income arising out of a cross-border investment, three different tax rates are possible - tax rate in country A, tax rate in country B or the tax rate mentioned in the treaty. In such a scenario, the effective rate is the one which is the lowest of all the above three as investors look to minimise tax outgo.
To find out whether the tax outgo is a determinant in the routing of funds, we look at the effective tax rates for the main forms of incomes for the top ten countries identified on the basis of the magnitude of FDI reported. The result of this analysis is given in Table II.
The top three jurisdictions in terms of routed funds have effective short-term capital gains tax rate of zero per cent. In other words, such gains are exempt from tax either in India or in the respective home country. In the case of the Netherlands, the fourth largest country in terms of routed funds, capital gains taxes are exempt under certain conditions. Two other countries, namely Spain and France, where capital gains taxes are also exempted under specific conditions, are reported47to be the new preferred locations to route capital flows to India (FDI Intelligence 2017). This seems to suggest that one of the major factors, or possibly the most important factor, in routing of funds through these jurisdictions, is the provision related to exemption of capital gains taxes.
44 The law further explains - all income accruing or arising, whether directly or indirectly, through or from any busi-ness connection in India, or through or from any property in India, or through or from any asset or source of income in India, or through the transfer of a capital asset situated in India’, are deemed to accrue or arise in India. Business connection is akin to the concept of a permanent establishment discussed in tax treaty.45 In order to avail beneficial provisions of the tax treaty, the non-resident is required to obtain a tax residency cer-tificate (TRC) from the Government of its source country indicating specific particulars. If the TRC does not mention prescribed particulars, the non-resident is required to furnish Form 10F for disclosing the same.46 Circular No. 333 [F. No. 506/42/81-FTD], dated 2 April 198247 Based on the interview with many tax consultants and other professionals working in this field, an Economic Times report (Sep 08, 2016) says – “Foreign portfolio investors (FPIs) in India have been scrambling to find safe tax havens ever since Mauritius lost its pole position after India’s renegotiations around capital gains and may have finally zeroed in on six destinations where they can register their pooling vehicles. FPIs are looking at France, Spain, and Denmark, and to some extent even Netherlands, where they can register their investment vehicles before they pump money in Indian equities. On the other hand Ireland and Luxembourg seem promising for locations from where debt investments can be made in India”.There are a number of other private tax consultants who have prepared report for potential clients arguing how shift-ing to Netherlands can be beneficial if one plans to invest in India. For example, see - http://www.taxatwork.com/files/Downloads/TaW_Update%20India%20Mauritius%20Treaty%202016.pdf

27
Table II: Effective Tax Rates on Income in India for different Resident Countries (in per cent)48
CountriesNature of Income and Effective Tax rate Applicable
Proportion of Routed FundsInterest Royalty FTS48 Long/Short Term Capital
gain
India- Domestic 5* 10* 10* Nil/15 -Mauritius 5* 10* 10 Nil 97.2%Cyprus 5* 10 10 Nil 94.4%Singapore 5* 10 10 Nil 90.4%
Netherlands 5* 10 / 10* 10 / 10* (Nil/ 10*/15*/ 40*)^ 83.1%Spain 5* 10 10** (Nil/ 10*/ 15*/ 40*)^^*** 53.3%UK 5* 10* 10** (Nil/ 10*/ 15*/ 40*) **** 48.0%USA 5* 10* 10** Nil/ 10*/ 15*/ 40* 26.4%Germany 5* 10 10 Nil/ 10*/ 15*/ 40* 5.3%France 5* 10 10** (Nil/ 10*/ 15*/ 40*)^^*** 3.9%Japan 5* 10 10 (Nil/ 10*/ 15*/ 40*)^^*** 0.2%
Source: Compiled by CBGA on the basis of analysis of individual DTAAs and domestic regulationNotes:* Denotes that these rates are prescribed in India’s domestic law. Rate to be further increased by
applicable surcharge and cess. For foreign companies, surcharge @ 2% applies if taxable income > INR 10 million but <= INR 100 million; surcharge @ 5% applies if taxable income > INR 100 million. Cess @3% applies irrespective of the threshold of taxable income
**Rates may be further increased by surcharge and cess***Subject to certain conditions****In the case of listed shares, long-term capital gain (LTCG) is exempt if securities transaction tax
has been paid on acquisition and sale of shares; short-term capital gain (STCG) is taxable at 15% (plus surcharge and cess). For unlisted shares, LTCG is taxable at 10% (plus surcharge and cess); STCG is taxable at 40% (plus surcharge and cess) ^Gains from transfer of unlisted shares of Indian entity are taxable in India only if they comprise of at least 25% shares in the Indian entity. However, if sale of shares (listed or unlisted) may be taxed in India, if transferor is Dutch tax resident and transferee is Indian tax resident
^^Gains from share transfer of Indian entity will be taxable in India only if, Property of Indian entity consists, directly or indirectly, principally of immoveable property
situated in India; or Gains are from shares that form part of at least 10% stock in Indian entity
-Multiple rates indicate different rates for different types (LTCG / STCG, listed / unlisted)-For a brief discussion on dividends, see Annex E
While jurisdictions like Mauritius do provide some treaty benefits, there are some other determinants as well. For example, to avail the benefits of DTAAs, the entity concerned needs to provide Tax Residency Certificate (TRC) of the resident country49 to the host country’s authorities. TRC is taken as the proof that the said entity has legitimate business in the resident country and it has not been incorporated there merely to take advantage of the DTAA. The criteria for defining legitimate business may include a minimum threshold for number of
48 FTS will be taxable in India only if services provided satisfy ‘make available’ test i.e. service recipient is able to ap-ply/ utilise the service in future without recourse to service provider. If the make available test is not satisfied then FTS will not be taxable in India unless service provider has a permanent establishment/ place of business in India, in which case taxes at 40 per cent (plus surcharge and cess) will be levied on net income.49 Resident country is the one from where investment is coming from while Host country is one where investment is going to

28
employees, expenditure, revenue, some criteria for board members and so on. Countries like Mauritius generally have lax rules for providing TRCs, which makes it relatively easier for shell companies to obtain it.50
DTAAs which have one of the stated aims of facilitating foreign investment can also create a situation where the potential return is higher to a foreign investor than to a domestic one, and in such cases it becomes more beneficial for domestic investors to engage in round-tripping and enjoy the same benefits as available to foreign investors (Boisot and Meyer 2008; IMF 2004). Studies estimate that the share of round-tripping in the overall FDI can be significantly high. For example, in the case of China the extent of round-tripping was estimated to be around 40 per cent (Geng 2004). Data and information unavailability is a big constraint in assessing the extent of round-tripping in India’s case. However, the fact that 17 per cent of the reported FDI was found to have direct control from India based entities is something that raises the suspicion of round-tripping.
In the case of abusive transfer pricing, tax havens work in two ways. First, low tax rates allow the MNCs to lower their tax liability by shifting the income there (OECD 1998), and second, the secrecy and confidentiality provisions make it much harder for the authorities of host governments to access information that can be used in anti-abuse regulations (Kudrle and Eden 2003). For example, for applying anti-abuse regulations in the case of transfer pricing it is necessary that both the parties involved in the transaction be identified as related parties. However, the secrecy laws resulting in lack of information on ownership and control make it much harder for the host country to identify the ownership of the entity in tax havens, in the absence of which anti-abuse regulations cannot be applied.
There are some arguments that this secrecy aspect, which allows suspicious funds to misuse the provisions meant for FDI, can be overcome with exchange of information agreements. Since most DTAAs do contain provisions for exchange of information (EOI), this should deter the abuse of DTAAs (Barthel et al 2009). However, there are two constraints in this approach. First, the provisions related to EOI might itself be filled with loopholes that prohibit or limit the exchanging of information. Second, there are various challenges in the implementation and execution, as has been the case with India which has hardly used its EOI agreements and had many difficulties in proper implementation (Jaiswal and Biyani 2016). Thus, EOI agreements alone are not sufficient to overcome the secrecy issues with tax havens.
While the current paper focusses on the routing of FDI with tax avoidance as its major determinant, there are other aspects of tax haven usage which cater to strictly illegal and criminal activities, such as black money, tax evasion, money laundering, drugs and arms trafficking etc. Raymond Baker (2005) estimated the magnitude of IFFs flowing through tax havens in the early 2000s to be as high as $1 trillion annually. He also found that in the case of Switzerland, less than 0.01 per cent of such fund flows are detected by the authorities. Since globalisation has increased rapidly and capital movements have become much easier during the past 15 years, the quantum of
50 Acceptance of Tax residency Certificate as a sufficient proof of residency is a contentious issue and it was the ba-sis of a legal tussle in India which came to be known as the Azadi Bacho Andolan case. For details see - http://judis.nic.in/supremecourt/imgs1.aspx?filename=19427- Also refer to http://ilt.taxmann.com/articles/international%20taxation%20megazine/oct%202015/Pages%20from%20IT%20V13P4%20(All%20Issue)-3.pdf

29
IFFs facilitated by tax havens and secrecy jurisdictions are likely to be much larger today. In the past few years, there has been a continuous stream of revelations where financial institutions operating in tax havens have been found aiding criminal activities51 (Christensen 2006; Shaxson 2011).
The Special Investigation Team (SIT) on black money, which was formed by the Government of India on the directives of the Supreme Court, explicitly mentions the abuse of shell companies,52 beneficial ownership53 and trade-based money laundering in black money generation. The report notes:
Use of shell companies to provide accommodation entries to launder black money has been observed in a number of high profile cases investigated or under investigation in the recent past.
And
….. Trade based money laundering through mispricing of imports/exports is a major means of taking money out of this country. (PIB 2015)
SIT then recommended various provisions for detecting shell companies and new rules for defining and declaring beneficial ownership. However, these are applicable only for domestic companies/legal entities. When the shell companies exist overseas it becomes much harder to identify such cases. Shell companies in secrecy jurisdictions are particularly more vulnerable for misuse since their ownership information is protected by the secrecy laws.
Data and information unavailability is the biggest constraint in analysing as to what extent capital flows are motivated by illegal objectives. Focussing only on the tax avoidance part, our findings suggest that large FDI inflows from jurisdictions considered as tax havens can be motivated by the situation created by the combination of domestic tax regulations and double tax avoidance agreements, which help in minimising the total tax outgo for an investor/MNC. We also find that the current regulations54 are more beneficial for overseas investors than for domestic investors which create incentives for round-tripping. Furthermore, jurisdictions which have higher degree of routed funds, coincidently, also have higher secrecy levels. This simultaneous presence of both factors is consistent with previous literature on this subject which highlights that the secrecy aspect is necessary to a certain extent to fully exploit the loopholes in tax regulations.
51 There have been multiple news reports which highlight and reveal how the tax havens are used for crime related activities in many developed countries, for example–- The Guardian (20th March 2017): British banks handled vast sums of laundered Russian money- Financial Times (6th April 2016): How laundered money shapes London’s property market52 Refers to those companies or subsidiaries who don’t engage in any real economic/trading activities and are es-tablished merely for as an upfront for financial or taxation purposes.53 It refers to the natural person(s) who ultimately owns/controls a legal entity, such as company, trust, foundation. See - https://www.rbi.org.in/scripts/NotificationUser.aspx?Id=7816&Mode=0 54 Applicable for the period of study, prior to the negotiation of DTAAs with Mauritius, Singapore and Cyprus in 2016

30
VI. Recent DevelopmentsThe last few years have seen a number of changes in the fields related to FDI in India. The changes have happened at both levels – domestic as well as international. On the domestic front, India has seen a number of changes in the FDI policy55 such as opening of many new sectors for FDI or raising the limit for FDI in certain sectors. From the point of view of this study, following long-drawn negotiations spanning close to a decade, India finally amended its DTAAs with Mauritius, Singapore and Cyprus in 2016. These amendments will result in the change of effective tax rates applicable on the investments in India from these jurisdictions. The following table provides a comparison of the new effective tax rates against the previous tax rates:
Table III: New Effective tax rates after the amendment of DTAAs (in per cent)565758
Nature of income
Pre-renegotiation (prior to April 1, 2017)
Post-renegotiation (post April 1, 2017)
Mauritius Singapore Cyprus Mauritius Singapore Cyprus
Interest56 5 5 5 5 5 5
Royalty57 10 10 10 10 10 10
FTS 10 10 10 10 10 10LTCG/STCG58 0 0 0 0/ 10/ 15/ 40 0/ 10/ 15/ 40 0/ 10/ 15/ 40
Source: Compiled by the CBGA TeamNote: Rate to be further increased, wherever applicable, by surcharge and cess. For foreign companies, surcharge @ 2% applies if taxable income > INR 10 million but <= IN R 100 million; surcharge @ 5% applies if taxable income > INR 100 million. Cess @3% applies irrespective of threshold of taxable income
The change effectively meant withdrawal of zero effective tax rates for short term capital gains, possibly the biggest factor behind the large magnitude of routed fund flows through the jurisdictions mentioned above. There is a grandfathering provision in the amended DTAAs, meaning that while these new rates have been announced and are being implemented from 1st April 2017, fund flows between 1st April 2017 and 31st March 2019 will have to pay only 50 per cent of the applicable rate, and only after that all provisions of the amended DTAAs will become fully applicable. For example, if the new applicable rate if 15 per cent, for the flows till 31st March, the rate applicable will be 7.5 per cent, and only from 1st April 2019, the rate of 15 per cent will be payable. While the exact impact of these changes can only be gauged once the new rates have fully become effective; based on the finding of this study, it can be argued that the amendments should result in reducing the extent of routed funds from above three countries. However, there are still other jurisdictions which have similar kinds of provisions in their
55 For example, see - http://pib.nic.in/newsite/PrintRelease.aspx?relid=146338http://pib.nic.in/newsite/PrintRelease.aspx?relid=158262http://www.pib.nic.in/PressReleseDetail.aspx?PRID=151611556 5% (plus applicable surcharge and cess) tax rate is applicable on borrowings in foreign currency made before July 1, 2020, else tax rate of 20% / 40% (plus surcharge and cess) will be applicable.57 For applicability of flat 10% tax rate, the recipient should also be the beneficial owner of such income58 Income from transfer of shares acquired prior to April 1, 2017 is exempt from tax in India. From April 1, 2017 to March 31, 2019, income from gains on share transfer to be taxed at 50% of tabulated tax, provided Transferor is not a shell/ conduit entity. Affairs of transferor are not arranged with primary purpose to take advan-tage of benefit of lower taxation of 50% of applicable tax rates.

31
respective DTAAs and also have a high proportion of routed funds – e.g., the Netherlands and Spain. It was earlier reported that India had requested the Netherlands to resume negotiations on amending their bilateral tax treaty as the government extends its efforts to plug loopholes in such accords to curb misuse. The Dutch tax treaty, which allows exemption from capital gains and a lower rate of tax on dividends, has led to the proliferation of holding company structures (Economic Times 2016b). However, later news reports, quoting government officials from the Netherlands, said that “India is unlikely to amend its tax treaty with the Netherlands as it did with Mauritius, Singapore and Cyprus and this could shape the investment strategy of foreign portfolio investors and private equity funds investing in India” (Economic Times 2017). This creates a potential loophole for future abuse, as the latest DIPP data shows that for 2016, the Netherlands is already reported as the fourth largest source of FDI in India59 ahead of USA and UK.
As to the impact of these amendments on FDI, it is unlikely that realistic FDI inflows would get significantly affected as their focus will not be on capital gains, since capital gains taxes are applicable only for those inflows which have prime focus on the appreciation of asset value In contrast, FDI inflows which are here for market access, production or resources, are unlikely to be affected from changes in capital gains taxes. For one thing, the rates that are more relevant to them, namely royalties, interest and financial and technical services (FTS), have not changed. Secondly, it is always open for them to route such investments to their affiliates in tax havens. There need not have to be a direct relationship between the ‘source’ of FDI and the location of the ‘recipients’ of royalties and FTS.
The other important dimension which we have not discussed here is the issue of bilateral investment treaties (BITs). India has recently started the process of renegotiation of BITs by terminating the existing treaties with 58 countries and is reported to have requested 25 other countries to sign joint interpretative statements to clarify ambiguities in the treaty texts. Incidentally, the Netherlands is one of them.60 In December 2015, it came out with a model treaty for bilateral investments.61 India has also recently become a signatory62 to the multilateral Base Erosion and Profit Shifting (BEPS)63 project, an initiative by OECD and G20. This initiative is aimed at creating a global regulatory framework with the aim of curbing many different ways of tax avoidance, such as digital economy, controlled foreign companies, abusive transfer pricing, treaty abuse, etc.64 Unlike the domestic regulations which are limited within the national boundaries, the BEPS initiative is likely to have far reaching consequence for multinational corporations (MNCs) from the point of taxation regulations. These regulations are more likely to affect the decisions by MNCs which are motivated by merely tax concerns rather than economic/business motivations. The provisions such as Country by Country Reporting (CBCR) will provide the governments previously inaccessible information about the MNCs,
59 http://dipp.nic.in/English/Publications/SIA_Newsletter/2017/jan2017/index.htm (Last Accessed: 30th May 2017)60 The Wire (16th June 2017): Remodelling India’s Investment Treaty Regime61 For the text of the model treaty, please see: https://www.mygov.in/sites/default/files/master_image/Model%20Text%20for%20the%20Indian%20Bilateral%20Investment%20Treaty.pdf (Last accessed: 21st June 2017)62 Business Line (2017): India signs OECD pact to plug tax treaty loopholes63 BEPS is an umbrella term to refer to various tax avoidance methods adopted by MNCs which takes advantage of mismatches in tax regulations among different countries.64 For details, see – OECD BEPS Actions at http://www.oecd.org/tax/beps/beps-actions.htm

32
and this should lead to curbing the processes of tax avoidance/evasion. Consequently, it will be interesting to see how these changes will impact the MNCs operation especially in case of cross border business processes and capital flows.
Another important global development is in the field of exchange of information. To fight against tax evasion/avoidance, countries engage in exchange of information with each other. Under this, two signatory jurisdictions exchange the information of partner jurisdiction’s taxpayers with each other. For example, if country A has an exchange of information agreement with country B, then country A will provide the information of B’s taxpayers who have assets in country A to country B, and vice versa. Beginning 2017, the Global Forum will facilitate exchange of information between the member countries on automatic basis65. Because of this initiative, governments will have access to a large quantity of previously inaccessible financial information about its taxpayers who have assets in foreign countries This can have impact on the funds which were results of round tripping.
All these developments will have corresponding changes on the tax and regulatory structure, along with changes in the secrecy framework provided by the tax havens. Consequently, it is the interplay of all these changes which will determine future pattern of cross-border capital flows.
65 See - http://www.oecd.org/tax/automatic-exchange/

33
VII. Concluding RemarksGovernments across the globe are trying to attract foreign direct investment in their respective countries, and this trend is particularly strong in case of developing countries. The reason for this focus on FDI is the expected benefits, such as new investments, increase in production capacity, job creation, management innovation, technology transfer. To facilitate FDI, countries provide many incentives to the investors, directly or indirectly. By eliminating the possibility of double taxation and making the tax regulation consistence, DTAAs are supposed to promote cross border investment and trade. However, recent examples suggest that DTAAs, and especially those with countries known as tax havens are being abused for treaty shopping, which will lead to tax avoidance in the host/destination countries.
India has been a prime example of such treaty shopping abuse where more than half of FDI is reported to have come from two small countries, namely Mauritius and Singapore. The study finds that more than 90 per cent of investment coming through these two jurisdictions is infact by the investors which are based in some other country. Zero effective tax rates for capital gains for these jurisdictions arising out of their DTAAs with India seems to be the biggest reason for routing of investment through these jurisdictions. However, there are other dimensions to the routing of funds as well, for example close to 20 per cent of all the FDI in India is controlled by entities/companies based in India, and this raises the suspicion that at least part of these funds can be due to round tripping. Moreover, both Mauritius and Singapore are also known for their secrecy regulation, which make it hard for Indian government authorities to access information regarding the details of foreign investors coming though these jurisdictions. The fact that there are number of cases globally where the secrecy regulation of jurisdictions are misused to carry illegal/criminal activity in other jurisdiction also posit questions about the nature of large fund flowing through these jurisdictions.
Indian government has taken note of the treaty shopping abuse and in 2016, managed to amend the DTAAs with Mauritius, Singapore and Cyprus. The amended DTAAs provide a grandfathering clause for 2 years, and the full applicable tax rates will apply from 1st April 2019. The full impact of these changes can only be ascertained once all these changes have become fully applicable. However, there are many other developments, such as new BITSs, BEPS and automatic exchange of information, which also can have impact on the cross border capital flows and hence on the foreign direct investments. Based on all these changes, it will be interesting to see that how the future FDI inflows in India changes.

34
VIII. BibliographyAvi-Yonah, Reuven S (2010): Rethinking Treaty Shopping: Lessons for the European Union. C. H. Panayi, co-author. In Tax Treaties: Building Bridges between Law and Economics, 21-50. Amsterdam: IBFD, 2010.
Aykut, Dilek; Sanghi, Apurva and Kosmidou, Gina (2017): What to Do When Foreign Direct Investment Is Not Direct or Foreign. Macroeconomics and Fiscal Management Global Practice Group, World Bank GroupAccessed at: http://documents.worldbank.org/curated/en/319451493385113949/pdf/WPS8046.pdf
Baker, Raymond (2005): Capitalism’s Achilles Heel: Dirty Money and How to Renew the Free-Market System. Wiley Publication USA
Barthel, Fabian; Busse, Matthias and Neumayer, Eric (2009): The Impact of Double Taxation Treaties on Foreign Direct Investment: Evidence from Large Dyadic Panel Data. Western Economic Association InternationalAccessed at: http://personal.lse.ac.uk/barthel/docs/dtt_fdi.pdf
BBC (2014): UK ‘a tax haven for multinationals’. April 28th 2014. Accessed at: http://www.bbc.com/news/business-27187398
Bhat, Ganapati (2009): Transfer Pricing, Tax Havens and Global Governance. Deutsches Institut für EntwicklungspolitikAccessed at: https://www.files.ethz.ch/isn/102933/2009-07e.pdf
Boisot, Max and Meyer, Marshall W. (2008): Which Way through the Open Door? Reflections on the Internationalization of Chinese Firms. Management and Organization Review 4:3 349–365
Bruggen, Edwin Van Der (2002): Tax Treaty Renegotiations by Developing Countries: A Case Study Using Comparative Analysis to Assess the Feasibility of Achieving Policy Objectives. Asia-Pacific Tax Bulletin, July/August
Buckley, Peter J. (2006): Stephen Hymer: Three phases, one approach? International Business Review 15 (2006) 140–147
Buckley, Peter J. and Casson, M.C. (1976): The Future of the Multinational Enterprise. Journal of International Business Studies (2003) 34, 219–222
Buckley, Peter J.; Clegg, Jeremy; Cross, Adam R.; Liu, Xin; Voss, Hinrich and Zheng, Ping (2007): The determinants of Chinese outward foreign direct investment. Journal of International Business Studies, 38 (4). pp. 499-518

35
Business Line (2017): India signs OECD pact to plug tax treaty loopholes. June 8th 2017Accessed at: http://www.thehindubusinessline.com/economy/india-signs-oecd-pact-to-plug-tax-treaty-loopholes/article9723060.ece
Christensen, John (2006): Follow The Money: How Tax Havens Facilitate Dirty Money Flows and Distort Global Markets. Tax Justice Network. Accessed at:http://www.taxjustice.net/cms/upload/pdf/Follow_the_Money_-_RGS-IBG__final_31-AUG-2006.pdf
Cobham, Alex and Jansky, Petr (2017): Global distribution of revenue loss from tax avoidance. United Nations University. World Institute for Development Economics ResearchAccessed at: https://www.wider.unu.edu/publication/global-distribution-revenue-loss-tax-avoidance
Dagan, Tsilly (2000): The Tax Treaties Myth. Journal of International Law and Politics, Vol. 32, No. 939, 2000
Desai, Mihir A.; Foley, C Fritz and Hines Jr., James R. (2004): Economic Effects of Regional Tax Havens. National Bureau of Economic ResearchAccessed at: http://www.nber.org/papers/w10806
- (2006): Do Tax Havens Divert Economic Activity? Economics Letters, 90, 219-224. Accessed at: http://www.bus.umich.edu/otpr/WP2005-2.pdf
Dharmapala, Dhammika (2008): What Problems and Opportunities are created by Tax Havens? Oxford Review of Economic Policy. Vol. 24, No. 4, 2008, pp.661-679
Dharmapala, Dhammika and Hines, James R (2006): Which Countries Become Tax Havens? National Bureau of Economic ResearchAccessed at: http://www.nber.org/papers/w12802
Dunning, John H. (1958): American investment in British manufacturing industry. Ruskin House Publication
- (1977): Trade, location of economic activity and the MNE: A search for an eclectic approach. In B. Ohlin, P. O. Hesselborn, & P. M. Wijkman, The international allocation of economic activity (pp. 395–418). London: Macmillan.
- (1993): Multinational enterprises and the global economy. Wokingham, England and Reading, Mass.: Addison Wesley
- (1994): Re-evaluating the benefits of foreign direct investment. University of Reading, Department of Economics in Reading, EnglandAccessed at http://unctad.org/en/PublicationChapters/iteiitv3n1a3_en.pdf

36
- (2001): The Eclectic (OLI) Paradigm of International Production: Past, Present and Future. International Journal of the Economics of Business Vol. 8, Issue 2, 2001
Dua, Pami and Garg, Reetika (2013): Foreign Portfolio Investment Flows to India: Determinants and Analysis. Centre for Development Economics, Department of Economics, Delhi School of EconomicsAccessed at Accessed at: http://www.cdedse.org/pdf/work225.pdf
Easson, Alex (2000): Do We Still Need Tax Treaties?. Bulletin for International Fiscal Documentation,
Economic Times (2016a): Revised tax treaty with Mauritius to curb round tripping: FM. May 11 2016. Accessed at:http://economictimes.indiatimes.com/news/economy/policy/revised-tax-treaty-with-mauritius-to-curb-round-tripping-fm/articleshow/52227874.cms
- (2016b): After Mauritius, now government wants to amend Dutch tax treaty; asks Netherlands to resume talks. May 31st 2016. Accessed at: http://economictimes.indiatimes.com/news/economy/policy/after-mauritius-now-government-wants-to-amend-dutch-tax-treaty-asks-netherlands-to-resume-talks/articleshow/52495938.cms
- (2017): India may leave tax treaty with Netherlands unchanged. Jan 11 2017. Accessed at: http://economictimes.indiatimes.com/news/economy/foreign-trade/india-may-leave-tax-treaty-with-netherlands-unchanged/articleshow/56464679.cms
Export Import Bank of India (2014): Outward Direct Investment from India: Trends, Objectives and Policy Perspectives. Accessed at: https://www.eximbankindia.in/Assets/Dynamic/PDF/Publication-Resources/ResearchPapers/5file.pdf
FDI Intelligence (2017): New tax havens surface for Indian funds. May 10th 2017Accessed at: http://www.fdiintelligence.com/News/New-tax-havens-surface-for-Indian-funds?utm_campaign=June+enews+issue+1&utm_source=emailCampaign&utm_medium=email&utm_content=
Financial Action Task Force (2014): Transparency and Beneficial Ownership. Accessed at: http://www.fatf-gafi.org/media/fatf/documents/reports/Guidance-transparency-beneficial-ownership.pdf
FSI (2015): Narrative Report on United Kingdom. Tax Justice Network. Accessed at: http://www.financialsecrecyindex.com/PDF/UnitedKingdom.pdf

37
- (2015): Narrative Report on Netherlands. Tax Justice Network. Accessed at: http://www.financialsecrecyindex.com/PDF/Netherlands.pdf
Ghemawat, Pankaj (2005): Regional Strategies for Global Leadership. Harvard Business ReviewAccessed at: https://hbr.org/2005/12/regional-strategies-for-global-leadership
Geng, Xiao (2004): Round-Tripping Foreign Direct Investment and the People’s Republic of China. Asian Development Bank. Accessed at: https://www.adb.org/sites/default/files/publication/157240/adbi-rp58.pdf
Graham, Edward M. and Krugman, Paul R. (1989): Foreign Direct Investment. Institute for International Economics, Washington USA
Haberly, Daniel and Wójcik, Dariusz (2015): Tax Havens and The Production of Offshore FDI: An Empirical Analysis. Journal of Economic Geography, Volume 15, Issue 1, 1 January 2015, Pages 75–101
Henry, James S (2012): The Price of Offshore Revisited. Tax Justice Network. Accessed at: https://www.taxjustice.net/cms/upload/pdf/Price_of_Offshore_Revisited_120722.pdf
Hymer, Stephen (1960): The International Operations of National Firms: a Study of Direct Foreign Investment. MIT Press
Hirschman, A. (1958): The Strategy of Economic Development. New Haven: Yale University Press
Hong, Qing and Smart, Michael (2007): In Praise of Tax Havens: International Tax Planning and Foreign Direct Investment. European Economic Review. Volume 54, Issue 1, January 2010, Pages 82–95
IMF (2004): Issues Paper (DITEG) # 13 Round TrippingAccessed at: https://www.imf.org/External/NP/sta/bop/pdf/diteg13.pdf
- (2009): Balance of Payments and International Investment Position Manual, Sixth EditionAccessed at: https://www.imf.org/external/pubs/ft/bop/2007/pdf/bpm6.pdf
Indian Express (2005): China example, we need more FDI: FM. The Indian Express. Nov 28, 2005 Accessed at: http://archive.indianexpress.com/oldStory/82845/
James, Sebastian (2013): Tax and Non-Tax Incentives and Investments: Evidence and Policy Implications. The World BankAccessed at: https://papers.ssrn.com/sol3/papers.cfm?abstract_id=2401905

38
Jaiswal, Suraj and Biyani, Neeti (2016): India’s Experience with Exchange of Information Agreements. Centre for Budget and Governance Accountability. New Delhi, IndiaAccessed at: http://www.cbgaindia.org/wp-content/uploads/2016/05/Indias-Experience-with-Exchange-of-Information-Agreements-Web-Publication.pdf
Jansky, Petr and Prats, Alex (2013): Multinational Corporations and the Profit-Shifting Lure of Tax Havens. Christian AidAccessed at: http://www.christianaid.org.uk/Images/CA-OP-9-multinational-corporations-tax-havens-March-2013.pdf
Kar, Dev and Spanjers, Joseph (2015): Illicit Financial Flows from Developing Countries: 2004-2013. Global Financial Integrity, Washington, USAAccessed at: http://www.gfintegrity.org/wp-content/uploads/2015/12/IFF-Update_2015-Final-1.pdf
Kawaguchi, O (1994): Foreign Direct Investment in East Asia: Trends, determinants and policy implications. World BankAccessed at: http://documents.worldbank.org/curated/en/926171468914941155/pdf/multi-page.pdf
Kobrin, Stephen J (2001): Sovereignty@Bay: Globalization, Multinational Enterprise, And The International Political System. The Oxford Handbook of International Business, Oxford University Press
Kudrle, Robert T. and Eden, Lorraine (2003): The Campaign Against Tax Havens: Will It Last? Will It Work?. Stanford Journal of Law, Business and Finance 9:37-68
Kumar, N. and Pradhan, J. P (2002): FDI, externalities and growth in developing countries: some empirical explorations and implications for WTO negotiations on investment. Research and Information System for Developing Countries, New DelhiAccessed at: https://www.ris.org.in/images/RIS_images/pdf/dp27_pap.pdf
Lim, D. W (2001): Determinants of and the relation between FDI and growth: a summary of the recent literature. International Monetary FundAccessed at: https://www.imf.org/external/pubs/ft/wp/2001/wp01175.pdf
Lucas Jr., Robert E. (1988): On the Mechanics of Economic Development. Journal of Monetary Economics 22 (1988) 3-42
National Institute of Financial Management (2012): Study on Unaccounted Income / Wealth Both Inside and Outside the Country. New DelhiAccessed at: http://static.financialexpress.com/frontend/fe/pdf/Black_Money.pdf

39
Ocampo, José Antonio and Fitzgerald, Edmund (2016): Doing Business Should Stop Promoting Tax Competition. Project SyndicateAccessed at: https://www.project-syndicate.org/commentary/world-bank-doing-business-report-taxation-by-jose-antonio-ocampo-and-edmund-fitzgerald-2016-11
Odari, Edgar (2015): Tax Drainage: Kenya/Mauritius DTA and its potential impact on tax base erosion in Kenya. Tax Justice Network Africa. Nairobi, KenyaAccessed at: http://new.trapca.org/wp-content/uploads/2016/04/TWP1407-The-Kenya-Mauritius-DTAA-and-Its-Potential-Impact-on-Tax-Base-Erosion.pdf
OECD (1998): Harmful Tax Practices: An Emerging Global Issue. OECD Publishing. Accessed at: https://www.oecd.org/tax/transparency/44430243.pdf
- (2000): Towards Global Tax Co-operation: Progress in Identifying and Eliminating Harmful Tax Practices.Accessed at: http://www.oecd.org/ctp/harmful/2090192.pdf
- (2013): Action Plan on Base Erosion and Profit Shifting. OECD Publishing. Accessed at: https://www.oecd.org/ctp/BEPSActionPlan.pdf
Otto, Farny; Franz, Michael; Philipp, Gerhartinger; Lunzer, Gertraud; Martina, Neuwirth and Martin, Saringer (2015): Tax Avoidance, Tax Evasion and Tax Havens. Gerechtigkeit Muss SeinAccessed at https://media.arbeiterkammer.at/wien/PDF/studien/Studie_tax_avoidance.pdf
Oxfam (2016): The Netherlands: a tax haven. The undisputed European champion in facilitating corporate tax avoidanceAccessed at https://www.oxfam.org/en/research/netherlands-tax-haven
Phillips, Richard; Gardner, Matt; Kitson, Kayla; Robins, Alexandria and Surka, Michelle (2016): Offshore Shell Games 2016 - The Use of Offshore Tax Havens by Fortune 500 Companies. Citizens for Tax JusticeAccessed at: http://ctj.org/pdf/offshoreshellgames2016.pdf
PIB (2015): Recommendations of SIT on Black Money as Contained in the Third SIT Report, 24th July 2015. Press Information bureau, Government of IndiaAccessed at: http://pib.nic.in/newsite/PrintRelease.aspx?relid=123677
Pickering, Ariane (2013): Why Negotiate Tax Treaties. Department of Economic and Social Affairs, United NationsAccessed at: http://www.un.org/esa/ffd/tax/2013TMTTAN/Paper1N_Pickering.pdf
Prebisch, Raúl (1950): The Economic Development of Latin America and Its Principal Problems. United Nations

40
Rao, K S Chalapati & Dhar, Biswajit (2016), “Analysis of India’s FDI Inflows during 2004-05 to 2013-14” in Rao, K S Chalapati, India’s Inward FDI Experience during the Post-liberalisation Period with Emphasis on the Manufacturing Sector. A research project sponsored by the Indian Council of Social Science Research, Institute for Studies in Industrial Development, New Delhi
Rao, K S Chalapati & Dhar, Biswajit (2011): India’s FDI Inflows -Trends and Concepts. Institute for Studies in Industrial Development, New Delhi.Accessed at: http://isid.org.in/pdf/FDI_2011.pdf
Sauvé, Pierre and Marta Soprana (2016): Disciplining Investment Incentives: A Lost Cause?.International Centre for Trade and Sustainable Development (ICTSD) and World Economic ForumAccessed at: http://e15initiative.org/wp-content/uploads/2015/09/E15-Investment-Sauve-and-Soprana-Final.pdf
Securities and Exchange Board of India (2013): Guidelines on Identification of Beneficial Ownership. Accessed at: https://www.cdslindia.com/downloads/sebicirculars/Guidelines%20on%20Identification%20of%20Beneficial%20Ownership.pdf
Shaxson, Nicholas (2011): Treasure Islands: Tax Havens and the Men who stole the World. Random House Publication
Singer, H.W. (1950): The Distribution of Gains between Investing and Borrowing Countries. American Economic Review, Volume 40
Sodersten, Bo and Reed, Geoffrey (1994): International Economics. Macmillan Press Ltd
Tax Justice Network (2016) - Financial Secrecy Index 2015 – MethodologyAccessed at: http://www.financialsecrecyindex.com/PDF/FSI-Methodology.pdf
The Wire (2017): Remodelling India’s Investment Treaty Regime. 16th June 2017 Accessed at: https://thewire.in/52022/remodeling-indias-investment-treaty-regime/
UNCTAD (2014): World Investment Repot. United Nations PublicationAccessed at: http://unctad.org/en/PublicationsLibrary/wir2014_en.pdf
- (2015): World Investment Repot. United Nations PublicationAccessed at: http://unctad.org/en/PublicationsLibrary/wir2015_en.pdf
Vernon, Raymond (1966): International investment and international trade in the product cycle. The Quarterly Journal of Economics, vol. 80, issue 2, pages 190-207

41
World Bank (2010): World Investment and Political Risk. Multilateral Investment Guarantee Agency World Bank GroupAccessed at: https://www.miga.org/documents/wipr10ebook.pdf
- (2011): Multipolarity: The New Global Economy. Global Development Horizons 2011, Washington, USAAccessed at: http://siteresources.worldbank.org/INTGDH/Resources/GDH_CompleteReport2011.pdf
Yeung, Henry Wai-chung; Poon, Jessie and Perry, Martin (2001): Towards a Regional Strategy: The Role of Regional Headquarters of Foreign Firms in Singapore. Urban Studies, Vol. 38, No. 1, 157–183, 2001 Accessed at: https://courses.nus.edu.sg/course/geoywc/publication/Urban_Studies.pdf
Zucman, Gabriel (2014): Taxing across Borders: Tracking Personal Wealth and Corporate Profits. Journal of Economic Perspectives—Volume 28, Number 4—Fall 2014—Pages 121–148

42
IX. AnnexureAnnex A
Financial Secrecy Index – A Brief Methodology
The Financial Secrecy Index (FSI) uses a combination of qualitative data and quantitative data to create a measure of each jurisdiction’s contribution to the global problem of financial secrecy. Qualitative data based on laws, regulations, cooperation with information exchange processes and other verifiable data sources, is used to prepare a secrecy score for each jurisdiction. Secrecy jurisdictions with the highest secrecy scores are more opaque in the operations they host, less engaged in information sharing with other national authorities and less compliant with international norms relating to combatting money-laundering. Lack of transparency and unwillingness to engage in effective information exchange makes a secrecy jurisdiction a more attractive location for routing illicit financial flows and for concealing criminal and corrupt activities.
Below is the list of indicators to calculate the secrecy score –
A: Knowledge of Beneficial Ownership
Indicator 1: Banking SecrecyIndicator 2: Registers of Trusts and FoundationsIndicator 3: Company Beneficial Ownership
B: Corporate Transparency
Indicator 4: Publicly Available Company OwnershipIndicator 5: Publicly Available Financial AccountsIndicator 6: Country By Country Reporting
C: Efficiency of Tax and Financial Regulation
Indicator 7: Reporting Payments to Non-ResidentsIndicator 8: Efficiency of Tax AdministrationIndicator 9: Avoids Promoting Tax EvasionIndicator 10: Harmful Legal Vehicles
D: International Standards and Cooperation
Indicator 11: Anti Money LaunderingIndicator 12: Automatic Information ExchangeIndicator 13: Bilateral TreatiesIndicator 14: International Transparency CommitmentsIndicator 15: International Judicial Co-Operation
**Reproduced from Tax Justice Network (2016): Financial Secrecy Index 2015 – Methodology

43
Annex B
Countries and Their Secrecy Category
Highly Secretive (Secrecy Score: 70-100)
1. Mauritius 7. St Vincent 13. Bahamas2. Switzerland 8. Taiwan** 14. Maldives**3. UAE 9. St Kitts & Nevis 15. Uruguay4. Hong Kong 10. Panama 16. Belize5. Malaysia 11. Liberia6. Seychelles 12. Bahrain
Secretive (Secrecy Score: 60-69)
17. Singapore 21. Bermuda 25. Philippines18. USA 22. Jersey 26. USVI19. Cayman Islands 23. Turkey 27. Gibraltar20. BVI 24. Saudi Arabia 28. Channel Islands
Moderately Secretive (Secrecy Score: 50-59)
29. Japan 33. Russia 37. Israel30. Cyprus 34. China 38. Brazil31. Germany 35. Chile 39. Malta32. Luxembourg 36. Austria
Transparent (Secrecy Score: 0-50)
40. UK 47. Poland 54. South Africa41. Netherlands 48. Belgium 55. Norway42. France 49. Australia 56. Mexico43. Spain 50. Canada 57. New Zealand44. South Korea 51. Ireland 58. Iceland45. Italy 52. Denmark 59. Czech Republic46. Sweden 53. Finland 60. Hungary
NA (Not in FSI)
62. Indonesia 68. Jordan 74. Sri Lanka63. Oman 69. North Korea 75. Kuwait64. Morocco 70. Kazakhstan 76. Belorussia65. Thailand 71. Argentina 77. Fiji Islands66. West Indies 72. Myanmar67. British Isles 73. Romania
*Source: Based on Tax Justice Network (2015): Financial Secrecy Index**There are two countries from where India receives FDI but they don’t have a point score rather a range, Maldives: 76-84 and Taiwan: 67-75. For our use we have taken the mid value, so Maldives had 80 and Taiwan has 71 as secrecy score.

44
Annex C
Organisational Structure of Group XYZ
India
Jersey Jersey
Cyprus
India
Cyprus
UK
Cyprus
Mauritius
UK
Mauritius
Bahamas
UK
UK
A India B India C
A
Notes: -• The boxes represent a legal company; the hexagon boxes are the “Operating Companies66” • Country names alongside shows the jurisdiction where that particular company is based• Based on Rao & Dhar (2011): India’s FDI Inflows -Trends and Concepts
66 The term ‘Operating Companies’ has been lifted directly from the investor report in which this structure was given. Author understands that it is to refer to those companies which engage in real economic activity, as opposed to shell/holding companies which are created merely for finance/taxation purposes.

45
Annex D
Countries and Realistic FDI (2004-14)
Investor’s Headquarter RFDI ($ mil) Share in Total (%)
USA 25,308 26.6Japan 15,884 16.7UK 11,837 12.5Germany 7,029 7.4France 6,555 6.9Malaysia 4,182 4.4Switzerland 2,716 2.9Hong Kong 2,360 2.5UAE 1,719 1.8Norway 1,552 1.6Netherlands 1,429 1.5Italy 1,355 1.4Singapore 1,345 1.4Spain 1,110 1.2Russia 1,102 1.2South Korea 936 1.0Belgium 884 0.9Denmark 799 0.8South Africa 753 0.8Sweden 695 0.7Others excluding Unidentified 5,457 5.7Total 95,013 100.0
Source: Reproduced from – Rao and Dhar (2016)Note: Aggregates may not tally due to rounding off

46
Annex E
Dividends in India
Under Indian tax laws, dividend distribution by domestic companies attracts dividend distribution tax (DDT) in the hands of the company at 20 per cent (approximately including surcharges and cess). Correspondingly, such dividend income is tax exempt in the hands of the recipient shareholders. Since such dividend income is tax-free in the hands of the shareholder (including non-resident shareholder) under provisions of the Indian tax law itself, the question of considering its taxability/exemption under the relevant tax treaty does not arise. Furthermore, Indian tax laws also deem certain other prescribed distributions such as distribution of assets to shareholders, capital reduction payment, asset/cash distribution on liquidation of company, advancement of loan to registered shareholder (who is also the beneficial shareholder) as dividend subject to certain conditions. While all stated examples other than advancement of loan also attracts DDT levy on the company and thereby exempts the recipient shareholder from tax incidence, it is only the loan advancement transaction which does not trigger DDT levy on the company. Accordingly, such a loan is treated as taxable dividend in the hands of the recipient shareholder.

47
About CBGA
CBGA is an independent, non-profit policy research organisation based in New Delhi. It strives to inform public discourses through rigorous analysis of government budgets in India; it also tries to foster people’s participation on a range of policy issues by demystifying them.
For further information about CBGA’s work, please visit: www.cbgaindia.org or write at: [email protected]
Please visit the open data portal on budgets in India at:www.openbudgetsindia.org
About ISID
The Institute for Studies in Industrial Development (ISID) is a national-level policy research organization in the public domain and is affiliated to the Indian Council of Social Science Research (ICSSR). The Institute’s research and academic activities are organized under the broad thematic areas of industrial development, corporate sector, trade, investment and technology, employment, labour and social sector and media studies.
For further information about ISID’s work, please visit:Website: www.isid.org.in
Supported by: