Foreign Currency Debt, Financial Crises and Economic ...
38
1 Foreign Currency Debt, Financial Crises and Economic Growth: A Long Run View * Michael D. Bordo Rutgers University and NBER Christopher M. Meissner University of California, Davis and NBER David Stuckler University of Oxford March 27, 2009 Abstract: What are the costs of hard currency liabilities? After being implicated in the global financial instability of the late 1990s, the costs are widely believed to be large, and as a result many emerging markets have pushed to minimize currency mismatches. We study the growth effects of exposure to foreign currency debt using data from two periods of international financial integration (1880-1913 and 1973-2002) for over 45 countries. Hard currency debt is associated with increased risks of currency and debt crises in both periods, especially when a country’s macroeconomic financial fundamentals are weak. We find the risk of financial crisis associated with hard currency debts translated into significantly diminished growth rates. However, we also find evidence that strong financial development and policy credibility attenuate the crisis risks associated with high exposure to hard currency debt, which has implications for eastern European countries where large current account deficits and high levels of hard currency debt are believed to pose financial risks. In this region some countries have adopted flexible exchange rates and avoided foreign currency debt. Several others have built up large net foreign currency liabilities and are exposed to a significant likelihood of a financial crisis in the near future. * Comments on an early draft from Pedro Elosegui are greatly appreciated. Corresponding author: Christopher M. Meissner, [email protected] . The usual disclaimer applies.
Transcript of Foreign Currency Debt, Financial Crises and Economic ...
1
Foreign Currency Debt, Financial Crises and Economic
Growth: A Long Run View*
Michael D. Bordo
Rutgers University and NBER
Christopher M. Meissner
University of California, Davis and NBER
David Stuckler
University of Oxford
March 27, 2009
Abstract:
What are the costs of hard currency liabilities? After being implicated in the global financial instability of the late 1990s, the costs are widely believed to be large, and as a result many emerging markets have pushed to minimize currency mismatches. We study the growth effects of exposure to foreign currency debt using data from two periods of international financial integration (1880-1913 and 1973-2002) for over 45 countries. Hard currency debt is associated with increased risks of currency and debt crises in both periods, especially when a country’s macroeconomic financial fundamentals are weak. We find the risk of financial crisis associated with hard currency debts translated into significantly diminished growth rates. However, we also find evidence that strong financial development and policy credibility attenuate the crisis risks associated with high exposure to hard currency debt, which has implications for eastern European countries where large current account deficits and high levels of hard currency debt are believed to pose financial risks. In this region some countries have adopted flexible exchange rates and avoided foreign currency debt. Several others have built up large net foreign currency liabilities and are exposed to a significant likelihood of a financial crisis in the near future.
* Comments on an early draft from Pedro Elosegui are greatly appreciated. Corresponding author: Christopher M. Meissner, [email protected]. The usual disclaimer applies.
2
1. Introduction
Foreign currency liabilities are often perceived as a financial weakness in
emerging markets. After being credited with exacerbating the severity of financial crises
in the 1990s, unhedged exposures to debts denominated in foreign currency have
substantially diminished. Some LDCs now issue local-currency denominated debt on
international markets while lenders have increasingly participated in domestic bond
markets (Burger and Warnock, 2006 ).1 Improved liquidity and depth have expanded the
development of local financial markets, and the accumulation of reserves, especially in
East Asia, has offered significant insurance against instability.
Nonetheless, hard currency debt contracts and their potential financial risks have
not been eliminated. Exchange rate policy is crucial for management of these debts. Soft
pegs, which carry implicit guarantees for exchange rate stability, often lead to
complacency and ‘excessive’ borrowing in foreign currency. Recommendations for
reforming exchange rate policy after the 1997 meltdown focused on two options. Free-
floating exchange rates would give disincentives to those who would borrow in foreign
currency. Monetary union could eliminate currency mismatches altogether. Significant
improvement along these lines have been made, but not all countries have learned the
lessons.
The global financial crisis of 2008 and 2009 has exposed fault lines. Large
reserves have thus far helped maintain stability in East Asia. However, countries in
eastern Europe, particularly the Baltic states, which post-1997 established pegged
exchange rates and built up significant proportions of private debt and other liabilities
payable in Euros, dollars and Swiss francs, are widely regarded to be facing a ‘perfect
storm’.2
1 The GEMLOC project launched in 2008 at the World Bank’s IFC aims to track the investibility in domestic local currency denominated asset markets and to support these markets. They report that as of 2008 70 percent of emerging market debt was denominated in local currency debt. 2 Amongst many others see Gros (2009) Gligorov and Landesmann (2009) or Stokes (2009).
3
Can stability be maintained in these countries even in the face of foreign currency
debt? Are there still other vulnerabilities besides foreign currency debt? Our analysis
based on the experience of over 1,700 country years spanning two periods of open
international financial integration1880 to 1913 and 1972 to 2002, suggests the answers
may be affirmative on both accounts. 3
We first investigate the empirical relationship between financial crises, foreign
currency debt and economic growth. All else equal, we find foreign currency liabilities
increase financial fragility and appear to increase the likelihood of currency and debt
crises. The impact of foreign currency liabilities is largest when it is accompanied by
large foreign-borrowing binges, when banking systems are prone to crisis, and when
reserves are low. Currency and debt crises lead to significant output losses.
We highlight the following additional points:
1) Risk of a crisis can be small even when liabilities are payable in hard currency
if financial systems are solid and countries have good reputations in international capital
markets. This implies that intermediate pegs can be a viable strategy
2) Minimizing foreign currency financing is not a sufficient condition to eliminate
financial crises. Countries with weak fundamentals, low reserves and which borrow
excessively can discover the sudden pain of financial crises all too easily.
2. Foreign Currency Financing in Two Periods of Globalization: Policy,
Observations and Implications
2.1 Policy and Architecture for Foreign Currency Debt
Close observation of the Asian and Mexican crises in the 1990s led Eichengreen
and Hausmann (1999) to cite external borrowing in foreign currency as catalyst for
financial crisis. In several South East Asian countries, as in Mexico in 1994 and
3 Goldstein and Turner (2004) call attention to the mismatch issue. A currency mismatch is measured as the value of foreign currency obligations relative to foreign currency assets and streams of revenues. Financial development and prudent borrowing are other routes to avoiding these costs as we will illustrate. 5 Reinhart and Rogoff (2008) recently emphasized domestic debt markets.
4
Argentina in 2001/2002 pegged exchange rates provided an implicit guarantee.
Households, domestic banks, and non-financial firms alike, built up significant short-term
debt denominated in US dollars. Many local banks borrowed in dollars and lent long into
the domestic economy expecting payment in local currency.
Those involved seem to dismiss or ignore the idea that dollar liabilities would
increase due to a sharp depreciation because. They seemingly overestimated the capacity
or willingness of the government to maintain a fixed exchange rate. Yet in Thailand
South Korea, Indonesia, Malaysia, Russia and Argentina, amongst many others, the
government failed to uphold these pegs in the face of sudden stops to capital inflows.
This wreaked havoc on the balance sheets of domestic financial and non-financial firms
leading to successive credit crunches and output losses.
The policy prescriptions from this era of financial turbulence were many. As
regards foreign currency debt one option involved enhancing or constructing local
currency markets. Foreign participation in these markets could rise so as to tap surplus
country wealth. Self-insurance via reserve accumulation was an option taken by many of
the East Asian counties. This limited net inflows and unsustainable net foreign asset
positions.
A related pair of options included changing strategy on exchange rate policy.
Following a free float would discourage the policy-induced moral hazard thought to be at
play in the 1990s (Eichengreen, 2002). The side effect would be deeper domestic debt
markets. There is no doubt that beefing up domestic debt markets has helped alleviate
some of the ostensible excess reliance on foreign currency debt. However, floating does
not seem to be an option for most small open developing economies (Calvo and Reinhart,
2002). De facto pegged exchange rates are alive and well. The second option on
exchange rates was then to rid the country of the exchange rate. Nations were urged to
consider hard peg currency boards or even monetary union. Unfortunately, Argentina
demonstrated that when an economy is vulnerable to shocks and lacks the capacity to
make necessary quick adjustments policy can change. The political costs of the ultra-
credible currency board were too large for a country like Argentina. Monetary Union, as
in Europe, was the remaining option. So far, relatively few countries in the world have
taken the option to ‘dollarize’ or ‘euroize’ though the European Monetary Union is
5
expanding somewhat. Still some observers are betting that membership in the EMU may
not be permanent for the weakest members (Feldstein, 2009).
2.2 The origins of foreign currency debt
Since at least 1800 foreign debt has typically been denominated in only a handful
of key currencies. A high ratio of foreign currency liabilities to total international
liabilities was called ‘original sin’ by Eichengreen and Hausmann because the currency
denomination aspect of the contract was ostensibly unrelated to fundamentals. Rich and
poor countries, institutionally weak nations and countries of the world with strong
property rights alike issue much of their debt on international markets in foreign currency
(Flandreau and Sussman 2005 and Bordo and Meissner 2007a).
Out of the spotlight in much of the literature is domestically issued debt.5 As it
turns out, domestically issued liabilities have also frequently carried indexation or foreign
currency clauses. The assumption that the international market is the only one of interest
is misplaced. Exchange rate indexation clauses in domestic debt generate distributional
issues when the exchange rate depreciates. These matter whenever capital market
imperfections exist (Bordo and Meissner 2006, 2007a). In the rest of our study we look at
total debt outstanding whenever possible.
Before 1914, in the first wave of financial globalization, countries financed
themselves with foreign currency debt. Like today, most debt sold in external markets
(e.g., London, Paris, and Berlin) was denominated in the currency of the financial
leaders. Private and sovereign debt contracts often demanded repayment in a fixed weight
of precious metal such as gold.
However this was by no means the rule within this period. Many emerging
markets managed place significant amounts of long term debt payable in local currency;
and although the ‘emerging’ countries were commonly regarded as possessing
underdeveloped or weak financial systems and dubious institutional foundations they still
managed to have significant amounts domestic currency debt.6 Foreign investors were not
always shy of holding such debt in their portfolios (Flandreau and Sussman 2005). These
6 Reinhart and Rogoff (2008) reach a similar conclusion.
6
countries included Argentina, Brazil, Chile, Italy, Russia, Spain, and Portugal. By
contrast, other countries that would eventually become mature industrialized economies,
and which were already leaders in terms of the quality of their institutions, their financial
development, their protection of creditors, and the degree of structural change maintained
heavy exposure to hard currency debt. These markets included the Australasian colonies,
Canada, the United States, and Scandinavia. For this paper we rely on high quality data
on the currency denomination of total public debt for 18 countries prior to 1913. These
include bonds issued both domestically and externally, and in some respects these data
have better coverage than current data which has been used to explore the question.7 For
the recent past (1973-2002) we rely on data for internationally issued obligations only.
New evidence from the recent decades of financial integration also shows that
developing country governments are quite able to market substantial proportions of their
total debt in local currency (Burger and Warnock, 2006 and Reinhart and Rogoff, 2008).
It appears also that foreign investors may be increasingly willing to hold developing
country local currency debt. So are countries that reduce exchange rate exposure the most
guaranteed financial stability? Or do additional factors need to accompany a break away
from foreign currency debt?
2.4 Original Sin? A long run view of hard currency debt’s origins and consequences
Theoretical models are generally ambiguous about the effect of exchange rate
depreciation and foreign currency debt. In sticky price macroeconomic models, nominal
depreciation in the face of hard currency debt is likely to be contractionary as debt
repayments increase. The expansionary effect of increased exports and decreased imports
can however offset this impact. This is the traditional view.
Cespedes, Chang and Velasco 2004 study an IS-LM model and find that the net
impact on income of a surprise devaluation depends on capital market imperfections, the
share of home goods in total consumption, the fraction of total debt denominated in hard
currency and the ratio of debt to net worth. Krugman (1999) and Aghion, Bachhetta and
7 Reinhart and Rogoff (2008) have also improved the twentieth century data for domestic debt.
7
Banerjee (2000) also derive conditions under which real depreciation can be
contractionary.
From a micro perspective, Jeanne (2000) argues that when foreign currency debt
solves a moral hazard problem it may be efficient solution, but when there is adverse
selection it is sub-optimal. Caballero and Krishnamurthy (2003) show that when there is
financial under-development agents opt for inefficient levels of foreign currency debt.
The theoretical ambiguity in the predicted effect and rationale for foreign currency debt
stands in stark contrast to the policy paradigm developed after 1997 and a general
tendency to applaud the minimization of such debt.
What does the empirical work show? Previous work in a long-run comparative
vein (e.g., Bordo and Meissner 2006) finds that foreign currency debt alone does not
always generate a higher likelihood of a financial crisis.8 Several important countries in
the nineteenth century did not have severe financial instability or debt defaults even with
significant foreign currency liabilities relative to their total obligations; on the other hand,
many countries with low to intermediate ratios of hard currency debt to total debt did
have frequent and severe financial crises.
In the late twentieth century, our research documents that many advanced
countries exhibited significant amounts of hard currency debt outstanding relative to their
total external debt liabilities, but most have avoided being plagued by severe crises. On
the other hand, emerging markets which also have a high percentage of their external
debt denominated in foreign currency frequently fell victim to debt crises and had high
financial instability. Bebczuk, Galindo and Panizza (2006) find that foreign currency debt
is directly associated with low growth when the real exchange rate depreciates. Arteta
(2003) uses data on currency denomination of deposits and private sector credit and finds
that dollarized banking systems are not significantly more prone to crises. Bleakley and
Cowan (2008), in a sample of Latin American countries, found no evidence that firms’
investment decisions are affected by hard currency debt even in the face of depreciation.
The lesson appears to be that sound debt management at the micro or macro level,
financial development and sustainable fiscal positions, has allowed countries to escape
financial turmoil even in the face of a high percentage of debt outstanding payable in
8 This paper uses information on public debt only.
8
foreign currency. Reserve accumulation and strong export capacity can also help avoid
the volatility associated with foreign currency debt. So even if countries have not yet
developed the foundations of good finances, they can in the meantime minimize the risks
of choppy financial waters by limiting their currency mismatches.
3. International Financial Flows, Hard Currency Debt, Crises and Economic
Growth: A Brief Conceptual Framework
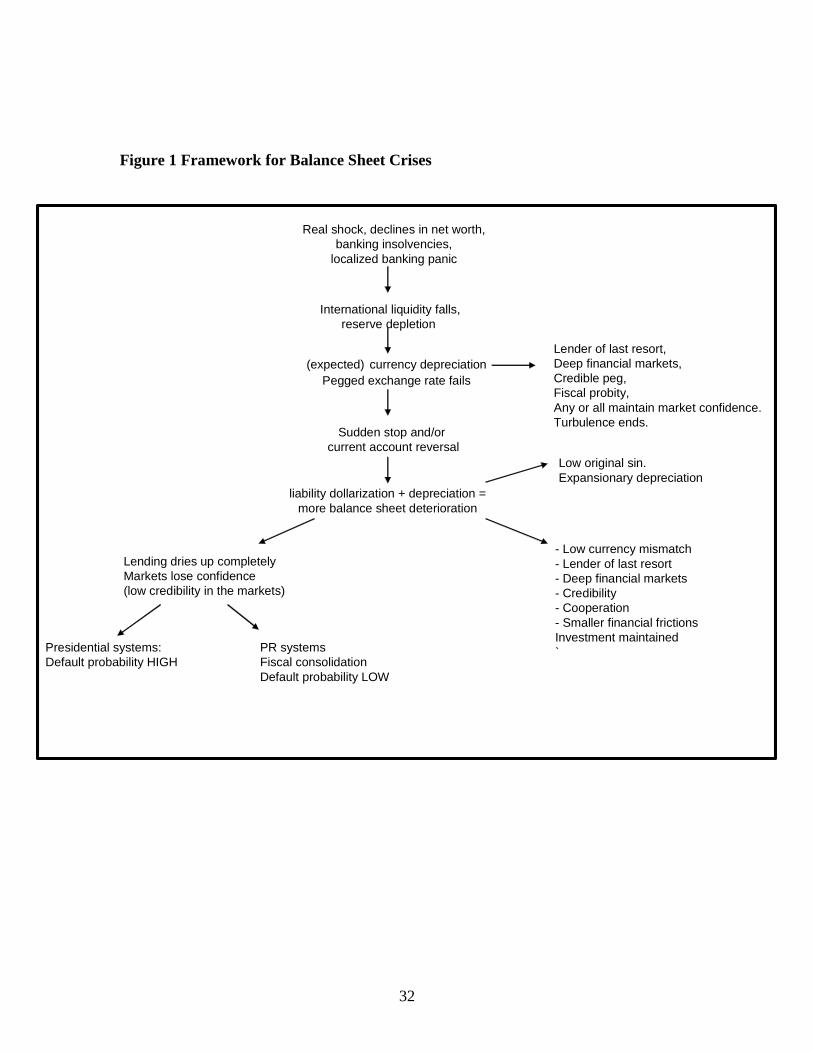
Our framework for the empirical analysis that follows highlights the links
between foreign currency debt, financial crises and economic growth and follows
Mishkin (2003) and Jeanne and Zettlemeyer (2005).9 This approach brings a balance
sheet view of the credit channel transmission mechanism to the open-economy. Balance
sheets, net worth and informational asymmetries are key ingredients. Moreover the
development of the financial system is crucial. The diagram in Figure 1 presents our
chain of logic described below.
The basic framework for an emerging market suggests the following:
• Sudden stops or reversals in capital inflows are more likely when the
capital account is liberalized or a country receives an unusually large level
of capital inflows. The likelihood of a sudden stop is exacerbated by high
levels of foreign currency debt relative to total borrowing and low levels
of internationally tradable production relative to total output.10
• Large capital inflows, sudden stops and current account turnarounds are
often subsequently associated with a speculative attack on the currency or
sharp currency drops. Currency crises are especially likely when policy
makers have low credibility or low reserve positions. If foreign currency
exposure is heavy, expectations that debt might not be repaid in the case of
a depreciation may form lead to a self-fulfilling liquidity crunch.
9 Mishkin’s informal analysis follows a stream of literature from the late 1990s on the links between net worth, exchange rate depreciation, and crises. 10 Calvo, Izquierdo and Mejia (2004) and Bordo, Cavallo and Meissner (2008) find direct empirical evidence for this proposition.
9
• All else equal, foreign currency debt exposure in the face of a sudden and
large depreciation of the exchange rate makes private and public debt
default more likely. Private agents’ balance sheets are impaired. A credit
crunch ensues. The economy sinks deeper into recession and revenues fall
giving rise to a further round of disintermediation and so forth.
Governments and private agents become more likely to default in such a
scenario. Growth is slow until the financial system is repaired and
investment recovers,
4. Empirical Evidence: The Potential Costs of Hard Currency Debt
The goal of this section is to test the logic proposed just above and in Figure 1.
These empirical tests then provide a way to measure the impact of hard currency debt on
economic growth. We present evidence that large capital inflows have often contributed
to the likelihood of a currency crisis. These sharp and sudden depreciations were also
likely to give way to debt crises when foreign currency debt was a significant percentage
of the outstanding total and other pre-existing weaknesses were present. A higher
propensity to have a crisis depends on these other controls that proxy for financial
development and management.
This is the backbone of our evidence that hard currency debt alone is not to blame
for financial crises. Hard currency debt combined with good financial development is
associated with a relatively low propensity to experience debt crises in both periods of
globalization. Strong financial development limits the probability of a currency crisis and
the likelihood of a default in the event of a sharp currency drop.
On the other hand, when other weaknesses in fundamentals are present, even
relatively low exposure to foreign currency debt with a sharply depreciating exchange
rate is associated with a substantial risk of a crisis. Decreasing dependence on foreign
currency debt may not be sufficient to lead to financial stability.
We then focus on the economic costs of hard currency debt. We discuss how
original sin and poor financial development together are often indirectly associated with
10
temporarily lower economic growth and possibly to negative level effects on income
because they hasten financial crises. These factors together are quite possibly responsible
for significantly lower standards of living in countries that rely on foreign currency
denominated capital inflows to help in the development process.
4.1 The association between Foreign Capital Inflows and Financial Crises
The first step in testing the above framework is to see whether foreign capital
flows are key determinants of currency crises. We also condition on a (limited) number
of important factors.11 We control for international and year-specific factors using the
short term discount rate at the Bank of England in Britain (1880-1913) and later the yield
on short-term US treasury bills (1973-2002). We also condition on the lagged level of the
ratio of net capital inflows to GDP measured as the (negative) of the change in the ratio
of the net international investment position to GDP, the ratio of hard currency
government debt outstanding to total government debt (1880 - 1913) or the within
country average ratio of foreign currency debt to total debt issued on international
markets (this is based on the Eichengreen, Hausmann and Panizza data covering 1973-
1992).12 We call the latter variable “original sin”. The ratio of gold reserves to monetary
notes in circulation (1880-1913) or foreign currency reserves to the money supply (1973-
2002), and the presence of a banking crisis in the previous year.13
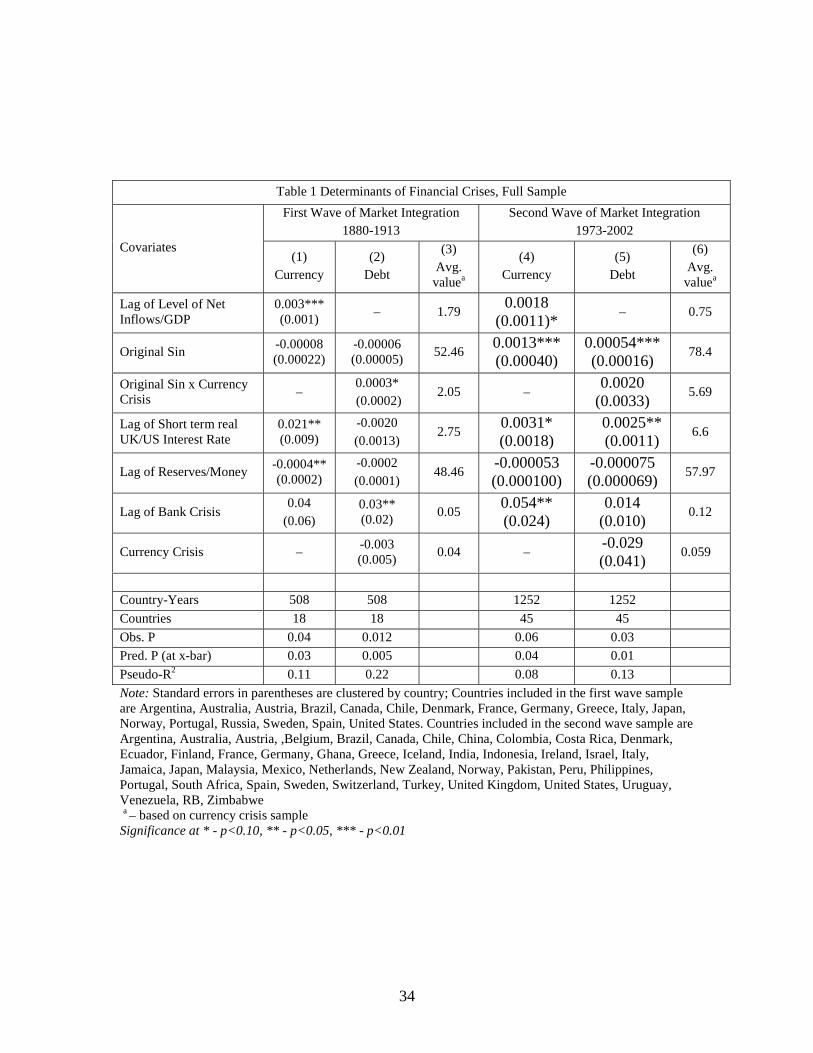
In column 1 and 4 of Table 1, we estimate a probit model where the dependent
variable is one if there was a currency crisis and zero otherwise. Column 1 is for the
period 1880-1913 and covers the experience of 18 countries listed below Table 1 while
11 Previous work (e.g., Bordo and Meissner, 2006) has used other determinants. Many of these are not significantly associated with crises in probit estimations hence we exclude them. All data used in the following exercises are described in the data appendix. 12 A nation’s NIIP may be show a decline (what we would record as a net inflow) for two reasons: measured liabilities increase or foreign assets fall. Since the intertemporal budget constraint must bind, the latter would still imply that a current account turnaround and exchange rate depreciations would be necessary at some point. This is the root cause of financial crises when balance sheets matter. 13 The use of averages for the original sin variable arises so that we can bring the data forward to 2002. Similar data has not been compiled systematically for the 1998-2002 period to the best of our knowledge. Results appear stable when restricting the sample to 1973-1992 and letting the original sin variable vary by year. This is true because the original sin variable is highly persistent.
11
column 4 covers 45 listed countries between 1973 and 2002. Columns 1 and 4 of Table 1
show that a large inflow of capital relative to GDP has a positive association with a
currency crises—this marginal effect is statistically significant at the 95 percent level pre-
1913 and the 90 percent level post-1973. The coefficient on the ‘original sin’ variable is
not statistically significant in the first period but it is positive and statistically significant
in the second period. Higher interest rates in the financial centers are associated with a
higher chance of a currency crisis. Lower levels of reserves predict higher probabilities of
a currency crash in both periods, but this result is only statistically significant in the first
period. Finally, between 1973 and 2002 there is some evidence that a banking crisis in
the previous year is associated with crises in the current year.
4.2 Debt Crises and Hard currency Debt
The next link in our framework in Figure 4 relates currency depreciation, liability
“dollarization” and the other fundamentals to debt default. Results from a pair of probit
models are shown (column 2 and column 5 in Table 1) which use an indicator for the first
year in which a country defaulted (partially or in whole) on its sovereign debt obligations
as a dependent variable. Here we also find evidence consistent with our framework.
First we see that the marginal impact of a higher ratio of hard currency debt to
total debt outstanding, without a currency crash, is associated with a higher probability
of having a debt crisis only after 1972 (Columns 2 and 5 of Table 1). In both periods
having a currency crisis amplifies the positive association between hard currency debt
and a debt default. We illustrate the impact on predicted probabilities below in Table 2.
The interpretation is that depreciation increases the real burden of foreign currency debt
making default more likely.
The following conclusions can be made based on these regressions: foreign
currency debt is likely to be associated with debt crises after large foreign capital inflows.
Such inflows would be associated with a significantly increased external debt burdens,
16 Banking crises could also be endogenous to financial turmoil as balance sheet implode. Such fragility however suggest weak regulatory regimes or vulnerabilities in the first place however.
12
and these are seen in column 1 and 4 to heighten the possibility of a currency crisis. The
interaction in columns 2 and 5 of Table 1 of the hard currency debt ratio and the currency
crisis indicator shows these inflows limit the “sustainability” of a high ratio of hard
currency debt outstanding to total debt.
In terms of proxies for financial development, we have several findings. First, a
banking crisis in the previous year is a positive and statistically significant determinant of
debt crises.16 Low reserves relative to the money stock are also related to a higher
likelihood of having a debt crisis, but in neither period is this coefficient statistically
significant.17 We find strong support that original sin and balance sheets matter, but we
also find evidence that strong financial systems are important for explaining the (lack of)
incidence of major financial meltdowns.
4.3 Interactions between fundamentals and hard currency debt on the likelihood of
a debt crisis
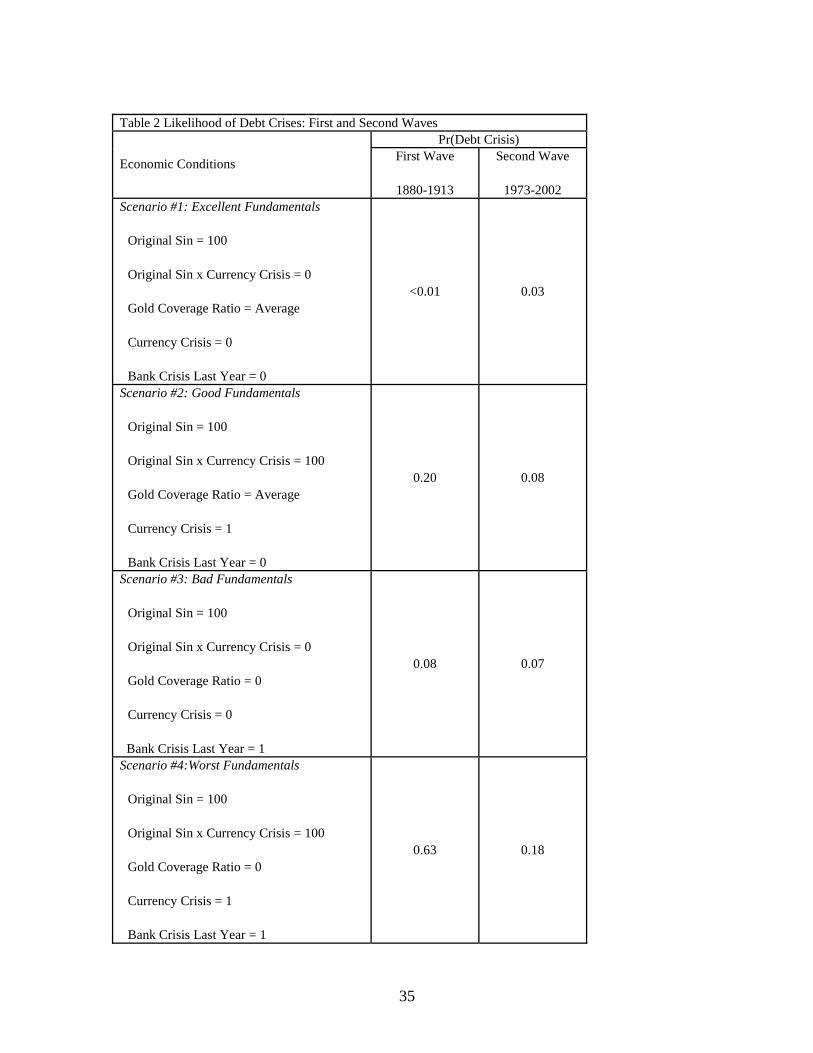
In Table 2 we illustrate the impact of hard currency debt ratios on predicted probabilities
of debt crises. We also probe into the interactions between hard currency debt and other
fundamentals. Table 4 evaluates our probit models using the estimated coefficients, a 100
percent hard currency debt ratio and a range of values for the other included covariates
which are associated with financial development and financial robustness. These results
indicate that the fragility induced by hard currency debt can be overcome to some extent
with better fundamentals.
Define “excellent fundamentals” as an observation with the sample average
reserve to money stock ratio, no banking crisis in the previous year, and no currency
crisis this year. Next, define “good fundamentals” as a country that has “excellent
fundamentals” but falls victim to a currency crisis. A country with “bad fundamentals”
has a banking crisis in the previous year and no international reserves. Finally the “worst
fundamentals” situation occurs with no reserves and a twin banking and currency crisis.
17 Currency crises in the absence of hard currency debt are associated with a lower likelihood of a crisis in the second period until the ratio of hard currency liabilities is sufficiently high.
13
Finally, let the level of net capital inflows and the short-term interest rate be held at the
sample mean.
The following conclusions are evident from Table 2 :
1) Scenario #1 “Excellent fundamentals” shows that a 100 percent hard currency
debt to total debt ratio is associated with a small likelihood of a debt crisis in both
periods.
2) Scenarios 2 and 4, which allow for currency crises, demonstrate that
depreciation with hard currency liabilities significantly raises the predicted likelihood of
having a debt crisis above that of scenario 1. This is the case both for countries with good
fundamentals and bad fundamentals. The predicted probability of a debt crisis in the
recent period is 0.2 or 0.63 in the earlier period with the “worst fundamentals”. Having
strong reserves and no banking crisis reduces these probabilities by 2/3 as seen in
Scenario 2.
3) Scenario 3 shows that avoiding currency crises is crucial. Even with weak
fundamentals and all debt denominated in foreign currency the predicted probability of a
debt crisis is roughly 0.08 post 1972.
3) A 100 percent ratio of hard currency debt relative to total debt (or international
debt later on), combined with a move from the best to the worst fundamentals (a move
from scenario #1 to scenario #4), raises the predicted probability of suffering a debt crisis
by over 70 times in the first period and nearly six fold in the second period.
4.4 Foreign Currency Debt, Financial Crises, and Economic Growth
We have now established that hard currency debt can be associated with financial
fragility. In this section, we examine whether such forms of debt have an impact on per
14
capita incomes via financial crises. This chain of logic will allow for a measure of the
growth losses implied by foreign currency liabilities via their impact on crises.
We follow closely Bordo and Meissner (2007b) who investigate the relation
between financial flows and growth.18 Specifically we present a series of basic cross-
country growth regressions which include as key explanatory variables net capital
inflows and episodes of financial crisis. By including financial crises we can recursively
track the impact on growth of hard currency debt via the crisis variable.
4.5 Multivariate Growth Regressions: Tracking the Growth costs of Liability
Dollarization
We explore growth in real per capita GDP in non-overlapping five year periods
for the sample 1880-1913 and then for the 1973-2002 sample. Between 1880 and 1913
we use a set of twelve countries for which we have savings data and then a set 18
countries (the same twelve as before plus six other countries) when we drop the savings
variable from our regressions.20 For the period 1973-2002 we look at the experience of 49
countries.
Our key control variables are the level of net capital inflows/GDP and the number
of years that witnessed a financial crisis during the five year period divided by five. The
coding for the crisis year dummy takes the sum of indicators for the first years of a
currency, debt or banking crises in any year and averaging this value within the five-year
period. Based on evidence from our probit models above, hard currency debt--the focus
of this study—is a key determinant of crises. If so, then such variables may have an
indirect effect on growth.
To capture the direct impact of global capital market integration, as we have done
in previous work, we used the average of the ratio of the net capital inflows to GDP in the
18 Ranciere, Tornell and Westerman (2006) carry out an exercise that similar in approach. There the focus is the growth impact of crises which are a function of capital market liberalization. 20 The set of twelve countries includes: Argentina, Australia, Canada, Denmark, France, Germany, Italy, Japan, Norway, Spain, Sweden, United States. See the previous footnote for the full sample of 19 countries.
15
five year period. Of course, in an open economy, investment is the sum of two
components: net foreign borrowing and net national saving. Hence we also include the
five year average of the ratio of domestic savings to GDP.21
The other explanatory variables are standard and based on Mankiw, Romer and
Weil (1992) and later papers that study economic growth empirically. We include the
following controls in Table 3: the logarithm of GDP per capita in the initial year of the
five year period, the five year average of the population growth rate, the five year average
of the percentage of the population enrolled in primary school, and the level of exports
divided by GDP or imports plus exports divided by GDP in the latter period.
Regressions are of the form
where all variables are averaged over non-overlapping five year periods themselves
indexed by t, Growth is the average annual growth of real per capita output, Δ
ln(population) represents the (five-year average) of the annual log differences in
population levels, the 0 subscript on GDP per capita stands for the initial year of the five
year period, μi is a set of country “fixed effects,” δ is a vector of quinquennial period
indicators, and ε is an idiosyncratic error term for each country within each five year
period.22
21 Where we do include savings, we do not adjust the savings variable downward for countries with capital outflows because the main capital suppliers are already excluded form the data set. Also the current account data is not directly comparable with the Stone data which would make a proper adjustment difficult. Data on saving are from Taylor (2002) who calculated the ratio of saving to GDP as the current account surplus divided by GDP plus the ratio of investment to GDP. We also used the investment ratio instead of borrowing and domestic saving and found that the investment ratio was not statistically significant in the growth regressions. 22 We correct the standard errors for heteroscedasticity by using robust standard errors. We also cluster these at the country level.
( ) itti
i
itit
itit
itit
it
population
GDPPopulation
GDP
Exports
EnrolGDP
Savingcrisis
GDP
ForeignKGrowth
εδμααα
ααααα
+++⎟⎟⎠
⎞⎜⎜⎝
⎛+Δ+⎟
⎠⎞
⎜⎝⎛
++⎟⎠⎞
⎜⎝⎛++⎟
⎠⎞
⎜⎝⎛+=
0
765
43210
ln)ln(
)(
16
In columns I to IV of Table 3, we present results from regressions of the growth
equation above for 1880-1913 and 1973-2002. Columns I and III leave out national
saving which slightly expands the sample in the first wave of globalization.
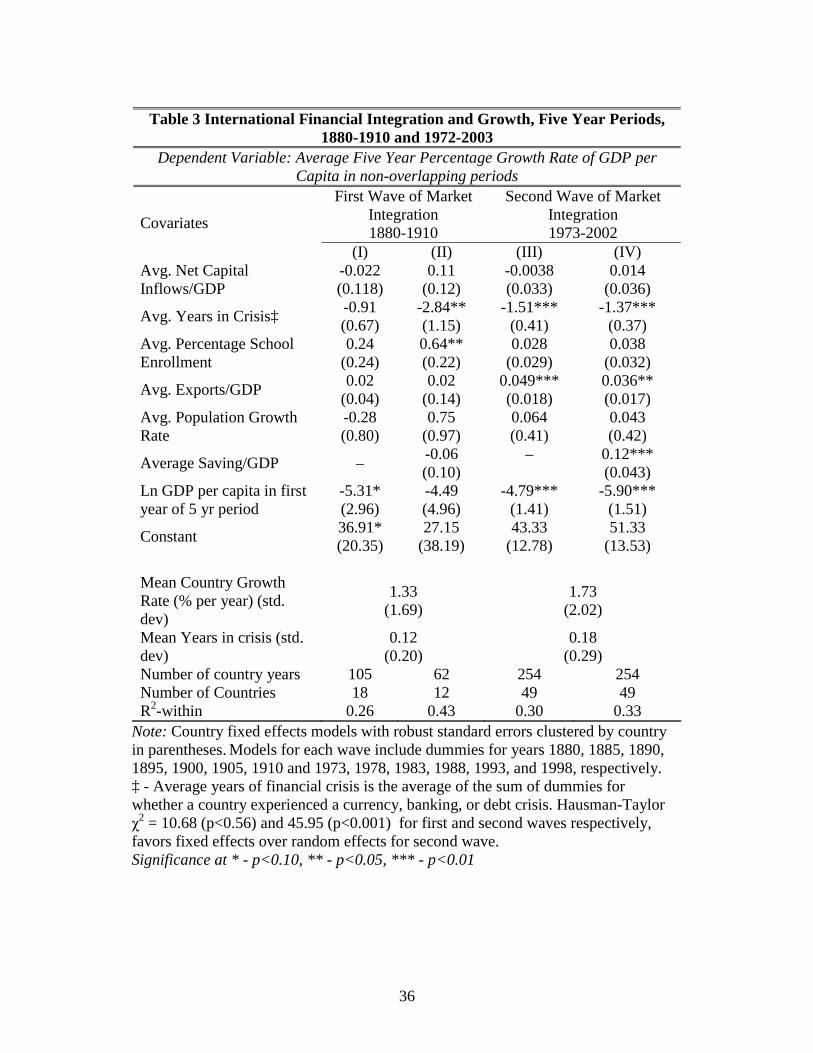
The results on the standard growth controls (especially initial GDP and schooling)
are in line with expectations from the rest of the empirical growth literature. Domestic
saving is positive and statistically significant only in the second period (in the first period
it is not statistically significant). School enrolment and trade exposure are positively
related to growth in both periods. Initial GDP has a negative coefficient and it is
statistically significant implying conditional convergence; population growth rates are not
statistically significant.
Turning to capital flows, there is no evidence of any association between
international capital inflows and economic growth. In no case is the coefficient on net
capital inflows statistically significant. It does appear that the inflows variable is
negatively correlated with savings since when savings is omitted the point estimate of
this variable is negative. When saving is included the point estimate on inflows becomes
positive.
Moving on to crises, the weight of the evidence from Table 3 is that periods
plagued by crises are bad for growth within the five year periods in which they occur.
The point estimate on the average number of years in the five year period spent in crisis
suggests average growth falls from by one to two percentage points in these periods. The
average annual growth rate is 1.73 suggesting a loss of at least a full year’s growth for
one year crisis events. Crises represent significant temporary negative shocks to growth
which are likely to have a long-run negative level effect on income per capita.24
4.6 The Quantitative Impact of Hard Currency Debt on Growth
Finally we investigate the quantitative impact on economic growth of hard
currency debt. The combined evidence from Tables 1 and 3 suggests that hard currency
24 Further unreported growth regressions show that lagged crisis indicators are not associated with above-average growth rates.
17
debt, by triggering financial crises, could be responsible for significant reductions in
economic growth arising from those crisis events. How large could such an impact be?
We first look at the predicted probabilities of having a debt crisis at various values of the
fundamentals. We focus on debt crises but one could focus simply on currency crises or
banking crises. All of these are associated with temporarily lower growth. Debt crises
however, make for an explicit link from depreciation and hard currency debt to growth.
In Table 2 we exhibit the predicted probabilities of debt crises based on the probit
models of Table 1 columns 2 and 5. A country with “excellent fundamentals” would not
have a crisis with predicted probability of 0.98 and would have a debt crisis with a
predicted two percent chance.25 Now look at the predicted values of growth, as a function
of predicted crisis probabilities using the following equation from our growth regressions.
This is given by
where ( ).Φ is the cumulative distribution function of the standard normal used in the
probit model (i.e., the predicted probability of having a debt crisis at given levels of the
covariates z and estimated coefficients) and the variables in X are the controls used in the
growth regressions besides the crisis variable.
Suppose a country has “excellent fundamentals” (n.b., this kind of country has
100 percent hard currency debt). Using the estimated coefficient on the crisis variable,
2α̂ , from column IV of Table 3 (i.e., the 1973-2002 period), and the predicted probability
of a crisis from column 2 of Table 2, the contribution to the predicted growth rate from a
crisis is a decline of 0.03 percentage points (-0.03 = -1.37*.02). In this case, hard
currency debt hardly seems injurious.26
Next we look at how hard currency debt interacts with other control variables to
form a volatile combination of fundamentals and low growth. A high ratio of hard
25 This assumes one crisis per five year period that lasts one year. The effects will be larger if crises last longer or crises are serially correlated as the raw data suggest. 26 Other covariates in the probit are defined at the sample means.
( ) ( ) ( ) ( )( ){ }( ).ˆˆˆ
ˆ10ˆ1ˆˆˆˆ
2
22
zX
zzXcrisisEXGrowthE
βαα
ββαααα
Φ+
=Φ−⋅+Φ⋅+=+=
18
currency debt to total debt, combined with poor fundamentals, is in fact associated with
significantly lower growth.
Consider a country with the “worst fundamentals.” This implies a 100 percent
hard currency debt. In the first and second periods respectively, our models predict a loss
in growth of just over two percentage points (-1.78 = -2.84*0.63) and 0.28 percentage
points (-0.28 = -1.37*0.21). Both of these impacts are economically significant given
mean growth rates of per capita income are 1.33 and 1.7 in the respective time periods.
Consider also a thought experiment that raises hard currency debt from 50 percent
of the total to 100 percent of the total. Let fundamentals be the “worst” (i.e., hold reserves
at zero, with the country experiencing a currency crisis this year and a banking crisis in
the previous year). Next calculate the predicted probabilities of a debt crisis under these
two debt ratios using the probit model of column V of Table 1. Finally use the
coefficients on the crisis variable in the growth regressions of columns II and IV in Table
3.
In the case of this doubling of hard currency debt, we find the growth rate would
drop by 0.91 percentage points in the first period and 0.28 percentage points in the
second period.27 A doubling of the reliance on hard currency debt when accompanied by
weak fundamentals is associated with significant losses in economic growth although the
impact is stronger in the first period of globalization.
Another way of looking at this result is available. Between 1973 and 2002 a
halving of the hard currency debt ratio, assuming “poor fundamentals”, could eliminate
much of the reduction to expected growth we found above and which we attributed to
hard currency debt. On the other hand, in the first wave of globalization, we find that
such a reduction in the hard currency debt only eliminates half of the lower expected
growth that arises from 100 percent hard currency debt. Even though the expected
negative growth impact is lower in the second period, hard currency debt plays a much
stronger role in accounting for the poor growth performance associated with crises in the
second wave of globalization.
27 To arrive at this number, subtract the predicted probability of crisis with a 50 percent ratio of hard currency debt (0.31 or 0) from that when there is a 100 percent hard currency ratio (0.63 or 0.21). Then multiply this difference by the crisis coefficient in the growth regression (i.e. -2.84 or -1.37).
19
Our results from the second period generate a strong non-linearity in the debt
crisis model (but not in the currency crisis model). With the worst fundamentals and a 50
percent hard currency debt ratio, the predicted probability of a debt crisis is nearly zero.
The predicted probabilities of a debt crisis do not rise above 0 until hard currency debt
ratios rise above 90 percent. This is due to the fact that most countries have in fact had in
the past 100 percent ratios of hard currency debt to total international debt and currency
crisis before defaulting.
We turn now to an out of sample forecast for Eastern Europe. This non-linearity
turns out to be crucial in understanding why our models predict that countries in Eastern
Europe (in our subsample) should be safe from a debt default associated with their
foreign currency debt exposure. However, currency crises may be a problem and other
systemic features of the international financial landscape may yet lead to a debt crisis
outcome.
5. Eastern Europe and the Global Credit Storm, 2009.
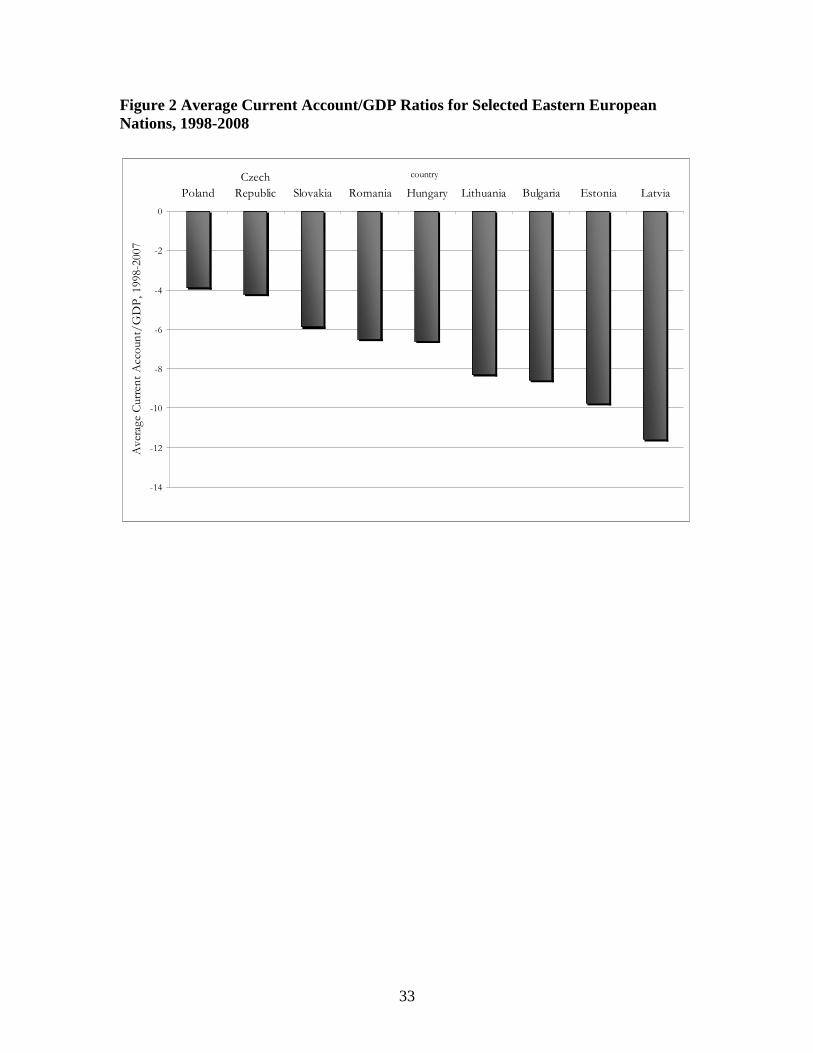
The outbreak of the global credit crunch in 2008 has put many countries in
Eastern European on the radar screen of global capital market analysts. Significant and
persistent current account deficits since 1998 seen in Figure 2 are seen as one potential
weakness. Commentators have also pointed out that national balance sheets are
increasingly composed of foreign currency obligations. Households in Hungary are
reported to have favored mortgages in Swiss francs due to the lower interest rates and
overall foreign currency exposure of private borrowing may be up to 70 or 80 percent of
all liabilities in Estonia and Latvia.
Optimists who would demonstrate that Eastern Europe is not likely to become the
latest episode in the current global meltdown cite the fact that overall exposure by
developing country creditors to Eastern Europe is relatively small as a percentage of
source countries’ GDP. This makes the possibility that one potential channel for
contagion may be restricted. Sovereign debt is also not deemed to be excessive, and some
countries as of 2008 have floating exchange rates (e.g., Poland, Czech Republic and
Hungary) which should automatically have dampened the build up of foreign liabilities as
20
their currencies have slid and wobbled in the past two years. Slovakia has just joined the
Euro and so its currency mismatches may be more limited. Still particular countries in the
are on the shortlist for the next financial crisis headline due to their exchange rate policies
and external debt positions. The Baltic nations and Bulgaria have intermediate to hard
pegs for instance and significant foreign currency liabilities. Specific financial
institutions based in Austria and Italy are cited as precariously exposed to Eastern
Europe. This makes for the potential that eastern troubles become inflict damage on
western European economies as these losses get mopped up by domestic authorities via
bailouts.
5.1 Out of Sample Forecast: Is Foreign Currency Debt a Problem for Growth in the
East?
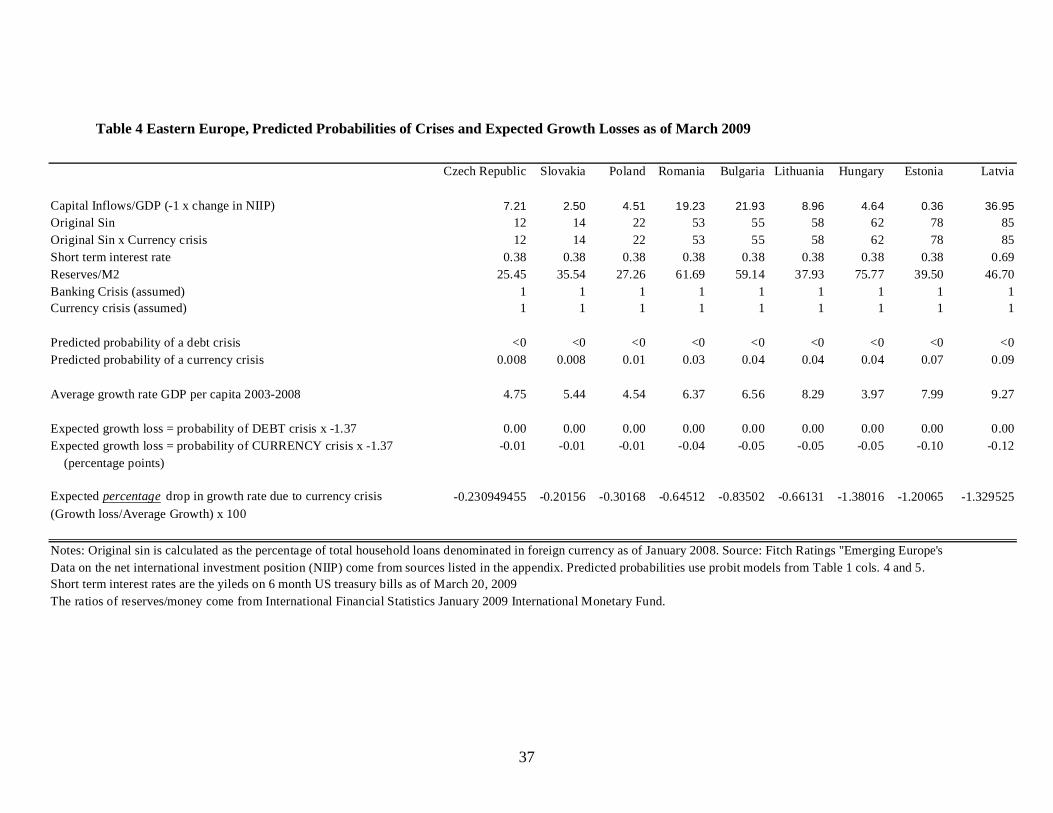
Using recent data for 2008 and our models from Tables 1 and 3, we attempt to
gauge the risk of a debt and currency crises in several Eastern European nations and the
expected growth impact of such a crisis. Table 4 lists the values of explanatory variables
used in the probit models for several Eastern European countries (Czech Republic,
Slovakia, Poland, Romania, Bulgaria, Lithuania, Hungary, Estonia and Latvia), the
predicted probability of a debt default and a currency crisis, the average growth rate of
per capita GDP from 2003 to 2008, the expected reduction in growth in percentage points
(equal to the average growth rate for 2002-2008 multiplied by the predicted probability of
having a debt crisis), and the expected loss of average growth in percentage terms.
Table 4 shows the forecast risks of debt crises are low and for currency crises the
risks are moderate to low. In this way, expected growth should be near trend. What
account for this rosy scenario?
Since no country is reported to have above a 90 percent ratio of hard currency
debt to total debt, predicted probabilities of debt crises are near zero.28 Currency crises
are predicted to somewhat likely in the following countries: Bulgaria (0.04), Lithuania
(0.04), Hungary (0.04), Estonia (0.07) and Latvia (0.09). In favour of many of these
28 The ratio of foreign currency debt to GDP is roughly 70 percent in Latvia and Estonia (Rosenberg, 2008). This could be cause for alarm as well.
21
countries, international interest rates are also much lower than their long-run average and
reserve positions are fairly strong.
Table 4 shows Estonia and Latvia are most at risk of a currency crisis and are
forecast to lose the most in terms of economic growth due to such a crisis.29 These
countries have the highest levels of foreign currency financing, have built up large
negative international investment positions and have quasi-currency board systems that
may not withstand the pressures of adjustment. Still losses in expectation growth rates
should only be down by less than 2 percent (not percentage points).
The largest countries in this subsample, the Czech Republic, Slovakia and Poland
have low ratios of foreign currency debt to the total (c. 12-14%) and overall net external
indebtedness is fairly low. All of these countries are also floating their currencies which
may be helping speed the adjustment process. Indeed Poland has recently been able to cut
interest rates. Contrast this with the Baltic states where interest rates are jumping upwards
and liquidity is disappearing. Floats may also have limited the amount of build-up of
large foreign currency liabilities unlike in the Baltic countries where pegs have been the
long-standing policy. It would appear that some of the larger countries examined here
have learnt from the past by limiting currency mismatches and floating their exchange
rates sufficiently to obviate moral hazard.
Still, if the recent past has taught us anything fundamentals are not the only factor
in generating crises. Contagious spillovers and sudden stops of inflows, perhaps arising
from margin calls on already weakened Western European banks, are not fully accounted
for in these models. Hence likelihood of a crisis may be somewhat higher than is
reflected in our calculations and further turmoil could be possible.
6. Conclusions and Comparisons over Two period of Financial Globalization:
Implications for International Financial Architecture
29 The Baltics seem intent on maintaining their pegs. Latvia has entered into an IMF program as of early 2009 but has not been forced to devalue. Lithuania still is aiming to join the European Monetary Union in 2010. 33 We also carried out tests (which are left unreported), using the current account relative to GDP as a measure of the net inflow or outflow of capital.
22
We have attempted to make comparisons over the long run to gauge the impact of
hard currency liabilities on financial crises and economic growth. We find strong
evidence that foreign currency liabilities, capital inflows and sudden stops are associated
with crises that lower growth temporarily.
The obvious remedies and lessons from the 1990s have been to buildup domestic
debt markets and reserves, float or choose a hard peg. All of these help diminish the
currency mismatch. Indeed, the data show, and our model supports the idea that major
countries in Eastern Europe have done much to alleviate the potential for financial stress
due to exposure to foreign currency debt. Foreign currency financing has not been totally
eliminated, but it appears to be on the wane. Still the Baltic nations have not been so
fortunate and may yet find that international conditions and political forces will catalyze
a sudden stop, currency depreciation and inability to meet obligations.
Still hard currency debt is only one piece of the puzzle. Countries in our sample
have demonstrably been able to complement good financial development with hard
currency liabilities to avoid major financial crises. The US, Australia, Canada and the
Scandinavian countries lived with significant currency mismatches in the nineteenth
century but managed to steer clear of too many meltdowns. Today a large set of small but
developed countries (Iceland perhaps being an exception due to its apparently lax
financial regulation) have done the same.
Finally while countries have now started to minimize currency mismatches,
uneven development, mis-guided and unregulated credit booms, sudden stops and
contagion still lurk in the shadows. In other words, one piece of the puzzle of financial
stability has certainly been put in place. Pieces yet to be placed include: an international
lender of last resort, balanced liberalizations in environments of best-practice financial
regulation, sovereign debt restructuring mechanisms, and implementation of standard
accounting principles so as to increase transparency. So far, the credit crunch and
financial turmoil have mainly affected the developed countries, but there are prospects
for further turmoil in the developing world. The absence of a durable and complete
international financial architecture is increasingly likely to become more evident.
23
Data Appendix
Most of the data underlying this paper was used in our previous work (Bordo and
Meissner 2007a and 2007b and Bordo and Meissner 2006) and is explained thoroughly in
those sources. The bulk of the macro historical data set is that used in Bordo et. al.
(2001). Even more expansive data descriptions and sources are listed in the working
paper versions of our earlier work on crises in NBER working papers 11173 and 11897
and available upon request from the authors.
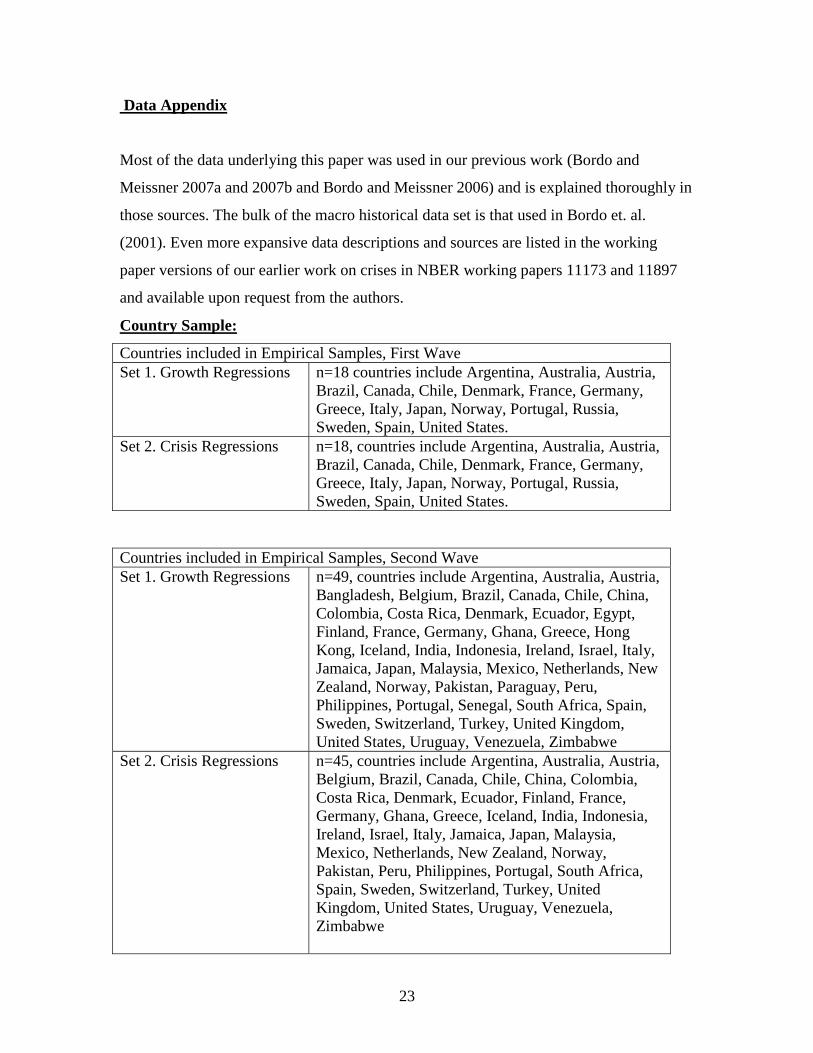
Country Sample:
Countries included in Empirical Samples, First Wave Set 1. Growth Regressions n=18 countries include Argentina, Australia, Austria,
Brazil, Canada, Chile, Denmark, France, Germany, Greece, Italy, Japan, Norway, Portugal, Russia, Sweden, Spain, United States.
Set 2. Crisis Regressions n=18, countries include Argentina, Australia, Austria, Brazil, Canada, Chile, Denmark, France, Germany, Greece, Italy, Japan, Norway, Portugal, Russia, Sweden, Spain, United States.
Countries included in Empirical Samples, Second Wave Set 1. Growth Regressions n=49, countries include Argentina, Australia, Austria,
Bangladesh, Belgium, Brazil, Canada, Chile, China, Colombia, Costa Rica, Denmark, Ecuador, Egypt, Finland, France, Germany, Ghana, Greece, Hong Kong, Iceland, India, Indonesia, Ireland, Israel, Italy, Jamaica, Japan, Malaysia, Mexico, Netherlands, New Zealand, Norway, Pakistan, Paraguay, Peru, Philippines, Portugal, Senegal, South Africa, Spain, Sweden, Switzerland, Turkey, United Kingdom, United States, Uruguay, Venezuela, Zimbabwe
Set 2. Crisis Regressions n=45, countries include Argentina, Australia, Austria, Belgium, Brazil, Canada, Chile, China, Colombia, Costa Rica, Denmark, Ecuador, Finland, France, Germany, Ghana, Greece, Iceland, India, Indonesia, Ireland, Israel, Italy, Jamaica, Japan, Malaysia, Mexico, Netherlands, New Zealand, Norway, Pakistan, Peru, Philippines, Portugal, South Africa, Spain, Sweden, Switzerland, Turkey, United Kingdom, United States, Uruguay, Venezuela, Zimbabwe
24
Crisis Dating:
As in Bordo et. al ( 2001) we date currency and banking crises using both qualitative and
quantitative evidence. For all countries besides Austria-Hungary, Russia, New Zealand,
South Africa, Mexico, Turkey, Egypt, Uruguay and India we have relied on the dates of
Bordo et. al. in both periods. We have tried to date currency crises for the 19th century,
when possible, by using an approach based on the exchange market pressure (EMP)
methodology which looks at changes in reserves, the exchange rate and the interest rate.
Currency crises past 1997 have been updated using the dates from Kaminsky (2006).
Banking crises are listed in
Debt crisis dates are based on Beim and Calomiris (2001). Only private lending to
sovereign nations is considered when building those default dates. Not every instance of
technical default is included in the chronology, the authors identified periods (six months
or more) where all or part of interest/principal payments were suspended, reduced or
rescheduled. Some of those episodes are outright debt repudiations, while others were
reschedulings agreed upon mutually by lenders and borrowers. Also data is taken from a
spreadsheet underlying Reinhart, Rogoff and Savastano (2003). Post 1997 we code the
following as debt crises: Pakistan (1999), Ecuador (1999) Indonesia (1999), and
Argentina (2001).
Capital Inflows
Our measure of international capital market integration for the 1880-1913 period
is based on Stone’s (1999) total capital calls on the London market which includes public
and private issues of debt purged of any refinancing issues.33 The conventional wisdom
for the period is that these gross flows were roughly equal to net flows for the capital
importers (cf. Obstfeld and Taylor 2004).34
The data for 1973-2002 are based on Lane and Milesi-Ferretti (2006). We use the
change in the net economic position (NEP) as a measure of net inflows of foreign capital.
34 The correlation between Stone’s flows and the current account deficits is 0.69.
25
Ratio of International Reserves to Money
Source: International financial statistics IMF.
Hard Currency Debt Ratios
For the 1880-1913 period, we collected data from various national sources on
hard currency debt for domestic governments (cf. Bordo and Meissner, 2007a) and
augmented and compared this with similar data made available by Flandreau and Zúmer
(2004). What we refer to as hard currency debt (or original sin) is debt that carried a gold
clause or was made payable at a fixed rate in a foreign currency issued domestically or
externally.35 Our measure of original sin, OS, is the ratio of this quantity to total public
debt outstanding:
⎟⎟⎠
⎞⎜⎜⎝
⎛−= 0,
icountry by issued Securities
icountry by icurrency in issued Securities1maxiOS .
For the current period we rely on data underlying Eichengreen, Hausman and Panizza
(2005) and thank the authors for making these data available to us. These data reflect
public and private obligations issued on external or international markets only and
exclude totally domestic debt issues. Note that these data are within country averages for
the period 1972-1997.
Data for Table 4 Foreign Currency Debt/Total Debt is calculated as the percentage of total household loans denominated in foreign currency as of January 2008. Source: Fitch Ratings see "Emerging Europe's Current Account Deficits: Mind the Gap!" (2008); Short term interest rates are the yields on 6 month US treasury bills as of March 20, 2009. Data on the net international investment position (NIIP) come from the statistical services of the respective countries listed in the table. The following applies:
35 The data appendices and the text in our previous work on crises has more to say about the structure of this debt.
26
NIIP for Czech Republic is for June 2008 and June 2007; NIIP for Slovakia is year end 2007 and 2008. growth rate for GDP between 2007 and 2008 was extrapolated as 8 percent since final 2008 figures for GDP were not yet available. NIIP for Poland is for 2006 and 2007; NIIP for Romania is for year end 2007 and 2008; NIIP for Bulgaria is as of June 2007 and 2008; NIIP for Lithuania is as of year end 2007 and 2008; NIIP for Hungary is year end 2006 and 2007; NIIPs for Estonia and Latvia are year end 2007 and 2008. The ratios of reserves/money come from International Financial Statistics January 2009 International Monetary Fund. Country specific notes: Czech Republic: Notes: Reserves and M2 as of Oct. 2008; Slovakia: Reserves and M2 as of August 2008; Poland; Reserves and M2 as of September 2008 Romania reserves, M2,as of October 2008; Bulgaria reserves, M2, as of October 2008; Lithuania reserves, money as of October 2008 Hungary reserves, M2, exchange rate as of October 2008; Estonia reserves, M2, exchange rate as of October 2008; Latvia reserves, M2 exchange rates as of October 2008.
27
References Aghion, Philippe, Bachhetta, Philippe and Banerjeee, Abhijit. (2000) “A Simple Model of Monetary Policy and Currency Crises.” European Economic Review 44 (4-6) pp. 728-738. Arteta, Carlos (2003) “Are Financially Dollarized Countries More Prone to Costly Crises?” Board of Governors of the Federal Reserve System, International Finance Discussion Papers no. 763. Bebczuk, Ricardo, Galindo, Arturo and Panizza, Ugo (2006) “An Evaluation of the Contractionary Devaluation Hypothesis” Inter-American development bank working paper no. 582. Bekaert, Geert Campbell Harvey, and Christian Lundblad (2005) “Does Financial Liberalization Spur Growth?,” Journal of Financial Economics vol 77 (1) pp. 3-55. Beim, David O. & Calomiris, C.W. (2001) Emerging Financial Markets New York: MacGraw-Hill. Bleakley, Hoyt and Kevin Cowan (2008) “Corporate Dollar Debt and Depreciations: Much Ado About Nothing?” Review of Economics and Statistics vol. 90 (4) pp. 612-626. Bordo, Michael D., Barry Eichengreen, Daniela Klingebiel. Maria-Soledad Martinez-Peria, (2001). “Is the Crisis Problem Growing More Severe?” Economic Policy 32, pp. 51--75. Bordo, Michael, Alberto Cavallo and Christopher M. Meissner (2008) “Sudden Stops: Determinants and Output Effects in the First Era of Globalization, 1880-1913” manuscript UC Davis. Bordo, Michael D. and Christopher M. Meissner (2007a) “Financial Crises, 1880-1913: The Role of Foreign Currency Debt” in Sebastian Edwards, Gerardo Esquivel, and Graciela Márquez eds. The Decline of Latin American Economies: Growth, Institutions, and Crises pp. 139-194. Chicago: University of Chicago Press Bordo, Michael D. and Christopher M. Meissner ( 2007b) “ Foreign Capital and Economic Growth in the First Era of Globalization” NBER Working Paper 13577. November. Bordo, Michael D. and Christopher M. Meissner (2006) “The Role of Foreign Currency Debt in Financial Crises: 1880-1913 vs. 1972-1997” Journal of Banking and Finance 60 pp. 3299-3329. Bordo, Michael D., Meissner, C.M. and Redish, A., 2005. “How ‘Original Sin’ was overcome: the evolution of external debt denominated in domestic currencies in the United States and the British Dominions 1800-2000.” in Barry Eichengreen and Ricardo
28
Hausmann (Eds.), Other People’s Money University of Chicago Press, Chicago, pp. 122--153. Burger, John D., and Francis E. Warnock, 2006. "Local Currency Bond Markets," IMF Staff Papers 53 (Special Issue): 115-132. Caballero, Ricardo J. and Arvind Krishnamurthy (2003) “Excessive Dollar Debt: Financial Underdevelopment and Underinsurance” Journal of Finance vol. 58 (2) pp. 867-893. Calvo, G. A., A. Izquierdo and L.-F. Mejia (2004). "On the Empirics of Sudden Stops:
The Relevance of Balance-Sheet Effects." National Bureau of Economic Research Working Paper Series No. 10520.
Calvo, Guillermo A. and Carmen M. Reinhart. (2002) “Fear Of Floating," Quarterly Journal of Economics, v107(2,May), 379-408 Céspedes, Luis Felipe, Roberto Chang, and Andres Velasco (2004). “Balance Sheets and Exchange Rate Policy.”American Economic Review 94 (4) pp. 1183-1193. Clemens, Michael A. and Jeffrey G. Williamson (2004), "Wealth Bias in the First Global Capital Market Boom, 1870-1913," Economic Journal, 114 (April): 304-337 Cottrell, P. L. (1975) British overseas investment in the nineteenth century. London: Macmillan. Eichengreen, Barry (2002) Financial Crises: And What to do About Them. Oxford University Press: New York. Eichengreen, B., Hausmann, R., 1999. Exchange Rates and Financial Fragility, in: Federal Reserve Bank of Kansas City (Ed.), New Challenges for Monetary Policy, pp. 329--368.
Eichengreen, B., Hausmann, R., Panizza, U., 2003. Currency Mismatches, Debt Intolerance, and Original Sin: Why they are not the Same and Why it Matters. NBER working paper 10036, Cambridge.
Eichengreen, B., Hausmann, R. Panizza, U., 2005. The Pain of Original Sin, in: Eichengreen, B., Hausmann, R. (Eds.), Other People’s Money. University of Chicago Press, Chicago, pp. 13--47. Feldstein, Martin (2009) “Reflections on Americans’ views of the Euro ex ante” vox EU
http://www.voxeu.org/index.php?q=node/2867
29
Fishlow, Albert (1986) “Lessons from the Past, Capital Markets and International Lending in the 19th Century and the Interwar Years,” in Miles Kahler (ed.), The Politics of International Debt, Ithaca: Cornell University Press. Fitch Ratings (2008) Emerging Europe’s Current Account Deficits: Mind the Gap! Fitch
Research: New York. Flandreau, M., and Frederic Zúmer, (2004) The Making of Global Finance. OECD: Paris. Flandreau, M., Sussman, N., 2005. Old Sins. in: Eichengreen, B. and Hausmann, R. (Eds.), Other People’s Money, University of Chicago Press, Chicago, pp 154--89. Gligorov, Vladimir and Michael A. Landesmann (2009) “The crisis in Eastern Europe: What is to be done?” VOX EU web portal. 16 March, 2009. http://www.voxeu.org/index.php?q=node/3274. Goldstein, Morris and Philip Turner (2004), Controlling Currency Mismatches in Emerging Market Economies Washington: Institute of International Economics. Gros, Daniel (2009) “Collapse in Eastern Europe? The rationale for a European Financial Stability” Roubini Global Monitor. 1 March, 2009 http://www.rgemonitor.com/globalmacro-monitor/255737/collapse_in_eastern_europe_the_rationale_for_a_european_financial_stability Jeanne, Olivier (2000) “Foreign Currency Debt and the Global Financial Architecture” European Economic Review 44 pp. 719-727. Jeanne, Olivier and Jeromin Zettlemeyer (2005) “Original Sin, Balance Sheet Crises and International Lending” in Barry Eichengreen and Ricardo Hausmann (eds.), Other People’s Money pp. 95-121. Chicago: University of Chicago Press. Kaminsky, Graciela (2006) “Currency crises: Are they all the same?” Journal of International Money and Finance. Vol.25 (3) pp. 503-527. Krugman, Paul (1999) “Balance Sheets, the Transfer Problem and Financial Crises” in P. Isard, A. Razin and A. Rose International Finance and Financial Crises. Kluwer. Lane, Philip, and Gian Maria Milesi-Ferretti (2006” “The External Wealth of Nations Mark II: Revised and Extended Estimates of Foreign Assets and Liabilities, 1970–2004” IMF working paper WP/06/69. Mankiw, Greg, David Romer and David N. Weil (1992) “A Contribution to the Empirics of Economic Growth” Quarterly Journal of Economics vol. 107 (2) pp. 407- 437.
30
Mauro, Paolo, Nathan Sussman and Yishay Yafeh (2006) Emerging Markets and Financial Globalization: Sovereign Bond Spreads in 1870-1913 and Today. Oxford: Oxford University Press. Mishkin, F. S., (2003) “Financial Policies and the Prevention of Financial Crises in Emerging Market Countries” pp. 93-130. in Martin Feldstein (Ed.) Economic and Financial Crises in Emerging Markets. Chicago: University of Chicago Press. Obstfeld, Maurice, and Alan M. Taylor. 2004. Global Capital Markets: Integration, Crisis, and Growth. Cambridge: Cambridge University Press. Ranciere, Romain, Aaron Tornell and Frank Westerman (2006) “Decomposing the Effects of Financial Liberalization: Growth vs Crises.” Journal of Banking and Finance 30 (12) pp. 3331-3348.
Reinhart, Carmen, Kenneth Rogoff (2008) “The Forgotten History of Domestic Debt,” unpublished working paper, University of Maryland.
Reinhart, Carmen, Kenneth Rogoff and Miguel Savastano (2003), “Debt Intolerance,”
Brookings Papers on Economic Activity 1, pp.1-74. Rosenberg, Christoph (2008) “Foreign Currency Borrowing More Risky for Eastern Europe” IMF website http://www.imf.org/external/pubs/ft/survey/so/2008/car102808a.htm Rousseau, Peter and Richard Sylla (2003) “Financial Systems, Economic Growth, and Globalization" (with Richard Sylla). In Bordo, M., A. Taylor, and J. Williamson, eds., Globalization in Historical Perspective. Chicago: University of Chicago Press for the National Bureau of Economic Research, 2003, pp. 373-413. Stokes, Mary (2009) “Eastern Europe: On Crisis Watch” Roubini Global Monitor. http://www.rgemonitor.com/euro-monitor/255488/eastern_europe_on_crisis_watch Stone, Irving (1999) The Global Export of Capital from Great Britain, 1865-1914. New York: St-Martin’s Press. Svedberg, P. (1978) “The portfolio direct composition of private foreign investment in 1914 revisited.” Economics Journal, 88, pp.763-777. Taylor, Alan M. (2002) “A Century of Current Account Dynamics” Journal of International Money and Finance vol 21 (6) pp. 725-748. Williamson, J (1964) American Growth and The Balance of Payments University of North Carolina Press: Chapel Hill.

31
32
Figure 1 Framework for Balance Sheet Crises
Real shock, declines in net worth, banking insolvencies,
localized banking panic
International liquidity falls,reserve depletion
Sudden stop and/or current account reversal
(expected) currency depreciationPegged exchange rate fails
liability dollarization + depreciation =more balance sheet deterioration
Lending dries up completelyMarkets lose confidence (low credibility in the markets)
Presidential systems: Default probability HIGH
PR systems Fiscal consolidationDefault probability LOW
- Low currency mismatch- Lender of last resort - Deep financial markets - Credibility - Cooperation - Smaller financial frictions Investment maintained`
Lender of last resort,Deep financial markets,Credible peg,Fiscal probity, Any or all maintain market confidence.Turbulence ends.
Low original sin. Expansionary depreciation
33
Figure 2 Average Current Account/GDP Ratios for Selected Eastern European Nations, 1998-2008
-14
-12
-10
-8
-6
-4
-2
0
PolandCzech
Republic Slovakia Romania Hungary Lithuania Bulgaria Estonia Latviacountry
Ave
rage
Cur
rent
Acc
ount
/GD
P, 1
998-
2007
34
Note: Standard errors in parentheses are clustered by country; Countries included in the first wave sample are Argentina, Australia, Austria, Brazil, Canada, Chile, Denmark, France, Germany, Greece, Italy, Japan, Norway, Portugal, Russia, Sweden, Spain, United States. Countries included in the second wave sample are Argentina, Australia, Austria, ,Belgium, Brazil, Canada, Chile, China, Colombia, Costa Rica, Denmark, Ecuador, Finland, France, Germany, Ghana, Greece, Iceland, India, Indonesia, Ireland, Israel, Italy, Jamaica, Japan, Malaysia, Mexico, Netherlands, New Zealand, Norway, Pakistan, Peru, Philippines, Portugal, South Africa, Spain, Sweden, Switzerland, Turkey, United Kingdom, United States, Uruguay, Venezuela, RB, Zimbabwe a – based on currency crisis sample Significance at * - p<0.10, ** - p<0.05, *** - p<0.01
Table 1 Determinants of Financial Crises, Full Sample
First Wave of Market Integration 1880-1913
Second Wave of Market Integration 1973-2002
Covariates (1)
Currency (2)
Debt
(3) Avg. valuea
(4) Currency
(5) Debt
(6) Avg. valuea
Lag of Level of Net Inflows/GDP
0.003*** (0.001)
– 1.79 0.0018
(0.0011)* – 0.75
Original Sin -0.00008 (0.00022)
-0.00006 (0.00005)
52.46 0.0013*** (0.00040)
0.00054*** (0.00016)
78.4
Original Sin x Currency Crisis
– 0.0003* (0.0002)
2.05 – 0.0020
(0.0033) 5.69
Lag of Short term real UK/US Interest Rate
0.021** (0.009)
-0.0020 (0.0013)
2.75 0.0031* (0.0018)
0.0025** (0.0011)
6.6
Lag of Reserves/Money -0.0004** (0.0002)
-0.0002 (0.0001)
48.46 -0.000053 (0.000100)
-0.000075 (0.000069)
57.97
Lag of Bank Crisis 0.04
(0.06) 0.03** (0.02)
0.05 0.054** (0.024)
0.014 (0.010)
0.12
Currency Crisis – -0.003 (0.005)
0.04 – -0.029 (0.041)
0.059
Country-Years 508 508 1252 1252
Countries 18 18 45 45
Obs. P 0.04 0.012 0.06 0.03
Pred. P (at x-bar) 0.03 0.005 0.04 0.01
Pseudo-R2 0.11 0.22 0.08 0.13
35
Table 2 Likelihood of Debt Crises: First and Second Waves
Pr(Debt Crisis)
Economic Conditions First Wave
1880-1913
Second Wave
1973-2002 Scenario #1: Excellent Fundamentals
Original Sin = 100
Original Sin x Currency Crisis = 0
Gold Coverage Ratio = Average
Currency Crisis = 0
Bank Crisis Last Year = 0
<0.01 0.03
Scenario #2: Good Fundamentals
Original Sin = 100
Original Sin x Currency Crisis = 100
Gold Coverage Ratio = Average
Currency Crisis = 1
Bank Crisis Last Year = 0
0.20 0.08
Scenario #3: Bad Fundamentals
Original Sin = 100
Original Sin x Currency Crisis = 0
Gold Coverage Ratio = 0
Currency Crisis = 0
Bank Crisis Last Year = 1
0.08 0.07
Scenario #4:Worst Fundamentals
Original Sin = 100
Original Sin x Currency Crisis = 100
Gold Coverage Ratio = 0
Currency Crisis = 1
Bank Crisis Last Year = 1
0.63 0.18
36
Note: Country fixed effects models with robust standard errors clustered by country in parentheses. Models for each wave include dummies for years 1880, 1885, 1890, 1895, 1900, 1905, 1910 and 1973, 1978, 1983, 1988, 1993, and 1998, respectively. ‡ - Average years of financial crisis is the average of the sum of dummies for whether a country experienced a currency, banking, or debt crisis. Hausman-Taylor χ2 = 10.68 (p<0.56) and 45.95 (p<0.001) for first and second waves respectively, favors fixed effects over random effects for second wave. Significance at * - p<0.10, ** - p<0.05, *** - p<0.01
Table 3 International Financial Integration and Growth, Five Year Periods, 1880-1910 and 1972-2003
Dependent Variable: Average Five Year Percentage Growth Rate of GDP per Capita in non-overlapping periods
First Wave of Market Integration 1880-1910
Second Wave of Market Integration 1973-2002
Covariates
(I) (II) (III) (IV) Avg. Net Capital Inflows/GDP
-0.022 (0.118)
0.11 (0.12)
-0.0038 (0.033)
0.014 (0.036)
Avg. Years in Crisis‡ -0.91 (0.67)
-2.84** (1.15)
-1.51*** (0.41)
-1.37*** (0.37)
Avg. Percentage School Enrollment
0.24 (0.24)
0.64** (0.22)
0.028 (0.029)
0.038 (0.032)
Avg. Exports/GDP 0.02
(0.04) 0.02
(0.14) 0.049*** (0.018)
0.036** (0.017)
Avg. Population Growth Rate
-0.28 (0.80)
0.75 (0.97)
0.064 (0.41)
0.043 (0.42)
Average Saving/GDP – -0.06 (0.10)
– 0.12*** (0.043)
Ln GDP per capita in first year of 5 yr period
-5.31* (2.96)
-4.49 (4.96)
-4.79*** (1.41)
-5.90*** (1.51)
Constant 36.91* (20.35)
27.15 (38.19)
43.33 (12.78)
51.33 (13.53)
Mean Country Growth Rate (% per year) (std. dev)
1.33 (1.69)
1.73 (2.02)
Mean Years in crisis (std. dev)
0.12 (0.20)
0.18 (0.29)
Number of country years 105 62 254 254 Number of Countries 18 12 49 49 R2-within 0.26 0.43 0.30 0.33
37
Table 4 Eastern Europe, Predicted Probabilities of Crises and Expected Growth Losses as of March 2009
Czech Republic Slovakia Poland Romania Bulgaria Lithuania Hungary Estonia Latvia
Capital Inflows/GDP (-1 x change in NIIP) 7.21 2.50 4.51 19.23 21.93 8.96 4.64 0.36 36.95
Original Sin 12 14 22 53 55 58 62 78 85Original Sin x Currency crisis 12 14 22 53 55 58 62 78 85Short term interest rate 0.38 0.38 0.38 0.38 0.38 0.38 0.38 0.38 0.69Reserves/M2 25.45 35.54 27.26 61.69 59.14 37.93 75.77 39.50 46.70Banking Crisis (assumed) 1 1 1 1 1 1 1 1 1Currency crisis (assumed) 1 1 1 1 1 1 1 1 1
Predicted probability of a debt crisis <0 <0 <0 <0 <0 <0 <0 <0 <0Predicted probability of a currency crisis 0.008 0.008 0.01 0.03 0.04 0.04 0.04 0.07 0.09
Average growth rate GDP per capita 2003-2008 4.75 5.44 4.54 6.37 6.56 8.29 3.97 7.99 9.27
Expected growth loss = probability of DEBT crisis x -1.37 0.00 0.00 0.00 0.00 0.00 0.00 0.00 0.00 0.00Expected growth loss = probability of CURRENCY crisis x -1.37 -0.01 -0.01 -0.01 -0.04 -0.05 -0.05 -0.05 -0.10 -0.12 (percentage points)
Expected percentage drop in growth rate due to currency crisis -0.230949455 -0.20156 -0.30168 -0.64512 -0.83502 -0.66131 -1.38016 -1.20065 -1.329525(Growth loss/Average Growth) x 100
Notes: Original sin is calculated as the percentage of total household loans denominated in foreign currency as of January 2008. Source: Fitch Ratings "Emerging Europe's Data on the net international investment position (NIIP) come from sources listed in the appendix. Predicted probabilities use probit models from Table 1 cols. 4 and 5.Short term interest rates are the yileds on 6 month US treasury bills as of March 20, 2009The ratios of reserves/money come from International Financial Statistics January 2009 International Monetary Fund.

38