
FOREIGN BORN SCIENTISTS: MOBILITY PATTERNS FOR SIXTEEN ... · FOREIGN BORN SCIENTISTS: MOBILITY...
25
NBER WORKING PAPER SERIES FOREIGN BORN SCIENTISTS: MOBILITY PATTERNS FOR SIXTEEN COUNTRIES Chiara Franzoni Giuseppe Scellato Paula Stephan Working Paper 18067 http://www.nber.org/papers/w18067 NATIONAL BUREAU OF ECONOMIC RESEARCH 1050 Massachusetts Avenue Cambridge, MA 02138 May 2012 The authors acknowledge support from Regione Piemonte for the GlobSci project and from the IPE Program, National Bureau of Economic Research. The views expressed herein are those of the authors and do not necessarily reflect the views of the National Bureau of Economic Research. NBER working papers are circulated for discussion and comment purposes. They have not been peer- reviewed or been subject to the review by the NBER Board of Directors that accompanies official NBER publications. © 2012 by Chiara Franzoni, Giuseppe Scellato, and Paula Stephan. All rights reserved. Short sections of text, not to exceed two paragraphs, may be quoted without explicit permission provided that full credit, including © notice, is given to the source.
-
Upload
vuongkhanh -
Category
Documents
-
view
220 -
download
0
Transcript of FOREIGN BORN SCIENTISTS: MOBILITY PATTERNS FOR SIXTEEN ... · FOREIGN BORN SCIENTISTS: MOBILITY...
NBER WORKING PAPER SERIES
FOREIGN BORN SCIENTISTS:MOBILITY PATTERNS FOR SIXTEEN COUNTRIES
Chiara FranzoniGiuseppe Scellato
Paula Stephan
Working Paper 18067http://www.nber.org/papers/w18067
NATIONAL BUREAU OF ECONOMIC RESEARCH1050 Massachusetts Avenue
Cambridge, MA 02138May 2012
The authors acknowledge support from Regione Piemonte for the GlobSci project and from the IPEProgram, National Bureau of Economic Research. The views expressed herein are those of the authorsand do not necessarily reflect the views of the National Bureau of Economic Research.
NBER working papers are circulated for discussion and comment purposes. They have not been peer-reviewed or been subject to the review by the NBER Board of Directors that accompanies officialNBER publications.
© 2012 by Chiara Franzoni, Giuseppe Scellato, and Paula Stephan. All rights reserved. Short sectionsof text, not to exceed two paragraphs, may be quoted without explicit permission provided that fullcredit, including © notice, is given to the source.

Foreign Born Scientists: Mobility Patterns for Sixteen CountriesChiara Franzoni, Giuseppe Scellato, and Paula StephanNBER Working Paper No. 18067May 2012JEL No. F32,J24,O30
ABSTRACT
We report results from the first systematic study of the mobility of scientists engaged in research ina large number of countries. Data were collected from 17,182 respondents using a web-based surveyof corresponding authors in 16 countries in four fields during 2011. We find considerable variationacross countries, both in terms of immigration and emigration patterns. Switzerland has the largestpercent of immigrant scientists working in country (56.7); Canada, and Australia trail by nine or morepercent; the U.S. and Sweden by approximately eighteen percent. India has the lowest (0.8), followedclosely by Italy and Japan. The most likely reason to come to a country for postdoctoral study or workis professional. Our survey methodology also allows us to study emigration patterns of individualswho were living in one of the 16 countries at age 18. Again, considerable variation exists by country.India heads the list with three in eight of those living in country when they were 18 out of countryin 2011. The country with the lowest diaspora is Japan. Return rates also vary by country, with emigrantsfrom Spain being most likely to return and those from India being least like to return. Regardlessof country, the most likely reason respondents report for returning to one’s home country is familyor personal.
Chiara FranzoniPolitecnico di MilanoDipartimento di Ingegneria Gestionale (DIG)Piazza Leonardo da Vinci, 32Milano ITALY [email protected]
Giuseppe ScellatoDepartment of Production Systems and Business EconomicsPolitecnico di Torino10129 Turin, [email protected]
Paula StephanDepartment of EconomicsAndrew Young School of Policy StudiesGeorgia State UniversityBox 3992Atlanta, GA 30302-3992and [email protected]

3
1. Introduction
Scientists are known to be a highly mobile group.1 A recent study of postdoctoral
researchers working in Europe in the life sciences, for example, found that 43 percent were
working in a country different than that of origin (Empirica 2005). In the United States, 41.6
percent of those with doctorates working in a science and engineering occupation in 2009 were
born outside the United States (National Science Board, 2012, table 3-28). Currently,
approximately 48 percent of all PhDs awarded in the United States go to those who are either
temporary or permanent residents. Almost 60 percent of all postdocs working in the United
States are on a temporary visa. (Stephan 2012). Moreover, highly productive scientists are even
more mobile than the underlying scientific population. Hunter et al. (2009), for example, found
that 50 percent of all the highly-cited PhD physicists in the world work in a different country
than that in which they were born. Levin and Stephan (1999) found exceptionally productive
scientists and engineers working in the United States, defined by a number of measures, to have
a higher probability of being foreign born and foreign educated than the underlying population of
U.S. scientists.
Despite the importance of the foreign born, it is difficult to make cross-country
comparisons regarding the role of the foreign born and their country of origin because of
problems that arise in collecting consistent data across countries.2 Moreover, most countries
have an incomplete picture of the migration patterns of scientists born in their country because of
difficulty in tracking individuals working outside their country of origin.3
2. The GlobSci Survey
To provide consistent cross-country data on active researchers, we surveyed
corresponding authors of articles published in 2009 in four fields of science who were studying
or working in one of 16 “core” countries.4 The four fields are biology, chemistry, earth and
environmental sciences, and materials. They were chosen in part because 95 percent or more of
1 See, for example, Auriol (2010); Auriol (2007) and Emperica (2005). 2 Two recent studies have gathered data on mobility of doctorate holders: Careers of Doctorate Holders (CDH) developed by OECD and UNESCO (Auriol, 2010) and the MORE study (2011), funded by the European Commission. The CDH study focuses on all doctorate holders; data reported vary by date, depending upon country. 3 By way of example, the National Science Foundation’s Survey of Doctorate Recipients does not track individuals. trained in the United States who subsequently leave the United States 4 The sixteen core countries are Australia, Belgium, Brazil, Canada, Denmark, France, Germany, India, Italy, Japan, Netherlands, Spain, Sweden, Switzerland, UK, U.S.

4
all articles published in these disciplines contain the corresponding author’s email address.5 The
survey was administered during the period February to June of 2011. Collectively these core
countries produce about 70 percent of all articles published in these fields.6 The only high-
producing country not represented in the GlobSci survey is China, where efforts to field the web-
based survey proved unsuccessful. For each specific discipline, we chose articles from a
randomly picked selection of journals in each quartile of the Impact Factor distribution. (See
Appendix for a discussion of the sampling methodology, survey administration and response rate
bias; go to http://www.dig.polimi.it/uploads/media/GlobSci_survey.pdf to see a copy of the
questionnaire).
Table 1 - Response rates by country
Core country Panels Total Answers
Of which complete
Of which dropout
Total Response
Rate
Complete Response
Rate % % Belgium 706 302 244 58 42.8 34.6 Brazil 1,537 762 692 70 49.6 45.0 Canada 2,455 1,020 897 123 41.5 36.5 Denmark 513 227 208 19 44.2 40.5 France 3,839 1,618 1,367 251 42.1 35.6 Germany 4,380 1,326 1,147 179 30.3 26.2 India 1,380 627 484 143 45.4 35.1 Italy 2,779 1,917 1,759 158 69.0 63.3 Japan 5,250 1,860 1,678 182 35.4 32.0 Netherlands 1,036 391 345 46 37.7 33.3 Spain 2,303 1,228 1,080 148 53.3 46.9 Sweden 882 353 301 52 40.0 34.1 Switzerland 919 356 320 36 38.7 34.8 UK 3,695 1,355 1,183 172 36.7 32.0 U.S. 14,059 5,165 4,512 653 36.7 32.1 Total 47,304 19,183 16,827 2,356 40.6 35.6
Response rates by country are given in Table 1. The overall response rate of 35.6 percent
(unadjusted for non-deliverables) is 10 to 25 points higher than that for most web-based surveys
5 In 2009 the estimated number of records that did not report email address for corresponding author was 0.9% in biology, 3.6% in chemistry, 2.9% in earth and environmental sciences and 4.5% in materials science. 6 SCImago.

5
(Sauermann and Roach 2011b).7 The median country response rate was approximately the same.
This resulted in 16,827 completed responses; an additional 2,356 respondents answered part but
not all of the questions posed (40.6 percent of the sample). Response rates vary somewhat by
country, being highest for Italy (63.3 percent) and lowest for Germany (26.2 percent). Ten
countries had overall response rates between 32.0 and 36.5 percent. Differences likely reflect in
part the degree to which similar populations of scientists have been surveyed in the recent past
by other, unrelated studies.8 (See Appendix for more details concerning response rate.)
3. Immigration Patterns: Country of work or study 2011
Country of origin was determined by asking the respondent to report country of residence
at age 18. Data for the 17,182 (36.3 percent of the sample) scientists for whom country of origin
and country of residence in 2011 could be determined are summarized in the left hand panel
(columns 1-3) of the Table 2 and show considerable variation in the percent foreign working or
studying in country. Switzerland heads the list. More than one out of two scientists studying or
working in Switzerland in 2011 lived abroad at age 18. Canada is a distant second, being 9.8
percentage points lower, followed closely by Australia (44.5 percent), and then by the United
States with 38.4 percent and Sweden with 37.6. A number of countries have an extremely low
percent of foreign scientists studying or working in the country. Particularly notable is the
virtual absence of foreign scientists studying or working in India, followed closely by Italy with
3.0 percent, Japan with 5.0 percent, Brazil with 7.1 percent and Spain with 7.3 percent.
For many countries, “neighbors” are the most likely source of immigrants (column 3).
For example, Germany is the most likely country of origin of immigrant scientists in the
Netherlands as well as immigrant scientists studying or working in Belgium, Denmark, Sweden
and Switzerland. Argentina, Columbia and Peru are important source countries for those
working or studying in Brazil. The United States is a major source country for foreigners
working or studying in Canada. For foreign scientists working or studying in Japan the most
likely countries of origin are China and South Korea. But cultural/language ties also matter: the
UK is the top source country for Australia and is tied for top place as the source country for
7 Walsh, Cohen and Cho (2007) find in a sample of U.S. scientists that undelivered emails accounted for approximately 3.2 percent. Sauermann and Roach (2011b) find that undelivered emails accounted for 6.3 percent in a sample of junior U.S. scientists. 8 Haeussler (2001) and Sauermann and Roach (2011a) provide two recent examples.

6
foreigners in Canada; Argentina is the major source country for Spain. But geography and
language do not always dominate. The top source country for the U.S. is China. The top source
country for the UK is Germany, followed by Italy.
Table 2 - Mobility Patterns for Sixteen Countries
(1) (2) (3) (4) (5) (6) (7) (8) Country of work or study in 2011 Obs. 17,182
Share outside country at 18
Countries supplying 10% or more of foreign workforce
Country of origin at 18 Obs. 15,115
Share currently outside country
Destination countries with more than 10% of natives abroad
Share with inter- national experience
Rate of return of those with intern- national experience
(number) % (%) (number) % (%) % % Australia (629)
44.5 UK (21.1) China (12.5)
Australia (418)
18.3 U.S. (45.8) UK (24.7)
62.9 70.8
Belgium (253)
18.2 Germany (15.2) France (15.2) Italy (13.0)
Belgium (261)
21.7 France (30.0) U.S. (20.0) UK (10.2)
52.8 58.9
Brazil (702)
7.1 Argentina (16.0) France (14.0) Columbia (12.0) Peru (12.0)
Brazil (700)
8.3 U.S. (34.0) Canada (15.7) Germany (15.5)
51.1 83.7
Canada (902)
46.9 UK (13.5) U.S (13.5) China (10.9)
Canada (613)
23.7 U.S. (70.1) 66.8 64.4
Denmark (206)
21.8 Germany (24.4)
Denmark (183)
13.3 UK. (37.5) U.S. (36.4)
54.3 75.4
France (1380)
17.3 Italy (13.8)
France (1303)
13.2 U.S. (22.8) UK (14.5) Canada (14.0)
59.2 77.7
Germany (1187)
23.2 None Germany (1254)
23.3 U.S. (29.5) Switzerland (19.1) UK (18.0)
58.0 59.9
India (525)
0.8 *
India (806)
39.8 U.S. (75.1) 75.1 47.1

7
Italy (1792)
3.0 France (13.0) Germany (11.1) Spain (11.1)
Italy (1938)
16.2 U.S. (25.0) UK (19.7) France (15.5) Germany (10.7)
40.0 59.5
Japan (1707)
5.0 China (33.7) S. Korea (11.6)
Japan (1676)
3.1 U.S. (51.4) 39.5 92.0
Netherlands (347)
27.7 Germany (14.6) Italy (12.5)
Netherlands (339)
26.4 U.S. (22.9) UK (19.5) Germany (18.8)
53.1 50.3
Spain (1185)
7.3 Argentina (12.6) France (10.3) Italy (10.3)
Spain (1175)
8.4 U.S. (31.0) Germany (16.2) UK (15.5) France (14.1)
63.1 86.7
Sweden (314)
37.6 Germany (11.9) Russian F. (10.2)
Sweden (226) 13.9 U.S. (23.8) UK (13.8) Germany (11.5)
53.9 74.2
Switzerland (330)
56.7 Germany (36.9)
Switzerland (209)
33.1 U.S. (34.2) Germany (29.5)
78.4 57.8
UK (1205)
32.9 Germany (15.2) Italy (10.4)
UK (1090)
25.1 U.S. (46.9) Canada (16.6) Australia (16.6)
56.4 55.4
U.S. (4518)
38.4 China (16.9) India (12.3)
U.S. (2924)
5.0 Canada (32.2) UK (16.3) Australia (10.1) Germany (10.0)
19.2 74.2
*Number of foreigners is too small to provide meaningful statistics
Countries also vary in the degree of diversity of immigrants who work in country,
measured by the percent of immigrant researchers from the top-four source countries (four-
country concentration rate, given in Table 3). High concentration rates indicate less diversity.
Countries with the highest concentration rates are Japan and Switzerland (approximately six out
of ten immigrant scientists working or studying there hail from one of four countries). Brazil
and Belgium are not far behind, with concentration rates in the 50’s. Countries with lower
concentration rates, reflecting more diversity, include Denmark, Australia, Canada, the United
States, Italy, the Netherlands, and Spain. The countries with the highest amount of diversity are
Germany and Sweden, where only about one out of three immigrants come from one of four
countries.
8
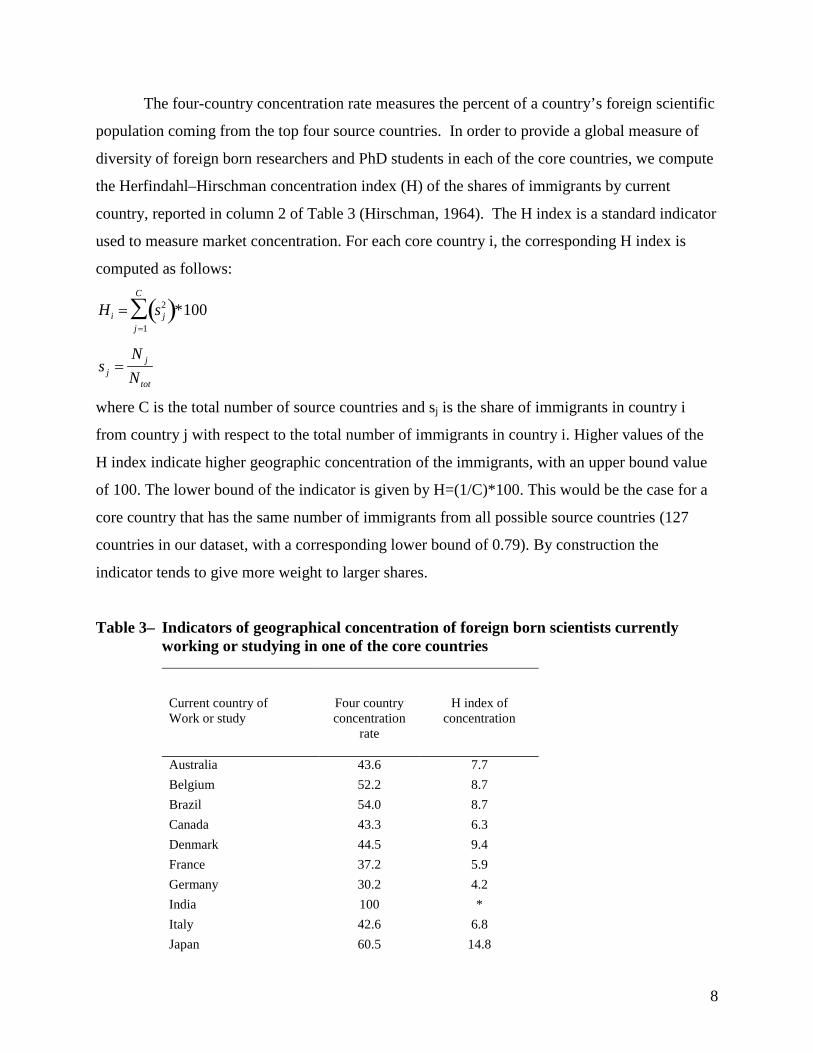
The four-country concentration rate measures the percent of a country’s foreign scientific
population coming from the top four source countries. In order to provide a global measure of
diversity of foreign born researchers and PhD students in each of the core countries, we compute
the Herfindahl–Hirschman concentration index (H) of the shares of immigrants by current
country, reported in column 2 of Table 3 (Hirschman, 1964). The H index is a standard indicator
used to measure market concentration. For each core country i, the corresponding H index is
computed as follows:
Hi = s j2( )
j =1
C
∑ *100
s j =N j
Ntot
where C is the total number of source countries and sj is the share of immigrants in country i
from country j with respect to the total number of immigrants in country i. Higher values of the
H index indicate higher geographic concentration of the immigrants, with an upper bound value
of 100. The lower bound of the indicator is given by H=(1/C)*100. This would be the case for a
core country that has the same number of immigrants from all possible source countries (127
countries in our dataset, with a corresponding lower bound of 0.79). By construction the
indicator tends to give more weight to larger shares.
Table 3– Indicators of geographical concentration of foreign born scientists currently working or studying in one of the core countries
Current country of Work or study
Four country concentration
rate
H index of concentration
Australia 43.6 7.7 Belgium 52.2 8.7 Brazil 54.0 8.7 Canada 43.3 6.3 Denmark 44.5 9.4 France 37.2 5.9 Germany 30.2 4.2 India 100 * Italy 42.6 6.8 Japan 60.5 14.8
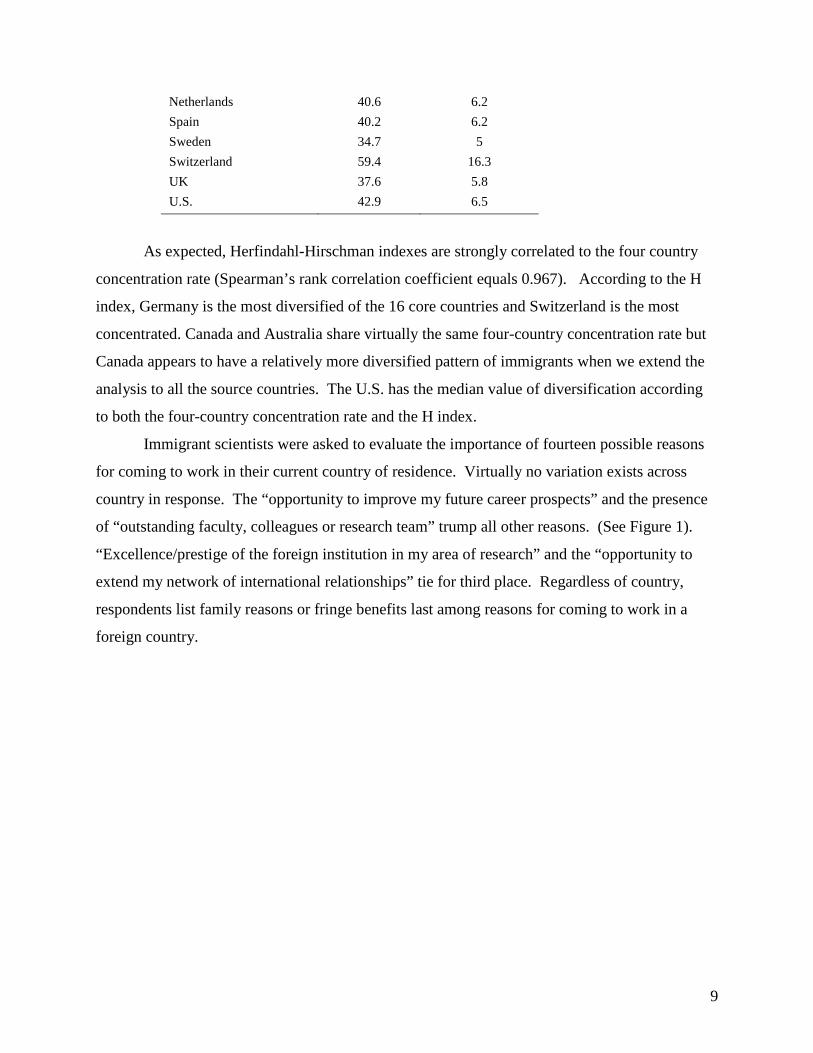
9
Netherlands 40.6 6.2 Spain 40.2 6.2 Sweden 34.7 5 Switzerland 59.4 16.3 UK 37.6 5.8 U.S. 42.9 6.5
As expected, Herfindahl-Hirschman indexes are strongly correlated to the four country
concentration rate (Spearman’s rank correlation coefficient equals 0.967). According to the H
index, Germany is the most diversified of the 16 core countries and Switzerland is the most
concentrated. Canada and Australia share virtually the same four-country concentration rate but
Canada appears to have a relatively more diversified pattern of immigrants when we extend the
analysis to all the source countries. The U.S. has the median value of diversification according
to both the four-country concentration rate and the H index.
Immigrant scientists were asked to evaluate the importance of fourteen possible reasons
for coming to work in their current country of residence. Virtually no variation exists across
country in response. The “opportunity to improve my future career prospects” and the presence
of “outstanding faculty, colleagues or research team” trump all other reasons. (See Figure 1).
“Excellence/prestige of the foreign institution in my area of research” and the “opportunity to
extend my network of international relationships” tie for third place. Regardless of country,
respondents list family reasons or fringe benefits last among reasons for coming to work in a
foreign country.

10
Figure 1 - Answers to question “How important was each of the following factors behind your choice to take a postdoc, employment or academic job in a country different than the one where you resided at age 18?” ranked by order of importance.
4. Emigration
A strength of the GlobSci survey is that it not only provides information on immigrants
working or studying in one of the 16 core countries but it also provides information on the
percent of scientists living in a core country at age 18 who were working or studying in 2011 in a
core country, be it the same or different. This information is summarized in the right hand panel
(columns 4-8) of Table 2 for the 15,115 respondents who lived in a core country at age 18 and
provided full and consistent information on international experience(s). Probability weights
were used to compute the reported rates given that response rates varied by country.9
Once again we find considerable variation in the percent studying or working abroad.
Not surprisingly, India heads the list with 39.8 percent of the scientists who lived there at age 18
working or studying in a different core country in 2011. But the country that has the second
highest rate among the 16 is Switzerland, with approximately one third of its residents studying
or working abroad in 2011. The Netherlands and the UK are next, with approximately one in
9 The weights used are the inverse of the response rate of the country where the observation was collected and thus weight observations by the probability of inclusion in the sampling design. The logic is that response rates arguably depend more on factors existing in the country of residence at the time the survey was fielded rather than on nationality. Thus Italians living in Germany will have more similar response rates to French living in Germany than to Italians living in Italy. Examples of such country factors are settings on anti-spam filters, versions and settings of browsers, periods of the year when researchers are particularly busy, such as national holidays, vacations, exam periods, term breaks, etc.

11
four of their residents studying or working outside of country. The country with the lowest
percent of emigrants is Japan (3.1 percent) but the United States is close to last at 5.0 percent,
followed by Brazil and Spain.
There is considerably less variation in the country of destination (column 6). Indeed, the
top destination country for emigrants from 13 of 15 countries is the United States; for the
remaining two the United States is the second most likely destination country. The most likely
destination country for individuals living in the United States at age 18 is Canada.
Migrants from Sweden and Canada are the most likely to report that they will return
home at some time in the future, with more than one in three answering affirmatively (Figure 2)
that they will, while less than one in five of the migrant scientists from the UK, Italy, Denmark
and Belgium state that they plan to return at some time in the future. Indians working outside the
country are less likely than the average emigrant to report that they plan to return. Close to one
out of two emigrant scientists from the Netherlands and Japan see their return as conditional on
job opportunities. Four out of ten scientists from five other countries (Italy, Spain, France,
Germany and Switzerland) indicate that their return is conditional on job opportunities. Job
prospects figure less importantly in the possible return for emigrants from other countries, with
those from Sweden, Brazil and India placing the least emphasis on job prospects.

12
Figure 2 - Answers to the question: “Is it possible that you return in the future?” by country of residency at age 18 in descending order of percent answering “yes”.
Information regarding the international experience of individuals living in one of the core
countries at age 18 is provided in column 7 of Table 2. Particularly notable is the fact that half
or more of the residents in 13 of the 16 countries have international experience. The rate is
highest for Switzerland, followed closely by India where approximately three out of four natives
have international experience. The country whose scientists have by far the lowest propensity
for international experience is the United States. Table 2 also provides information on the
percent with international experience who had returned to their country of origin by the time the
survey was administered (column 8). Considerable variation exists, ranging from a high of 92
percent for emigrants from Japan to a low of 47 percent for India.
All respondents who indicated that they had studied or worked in a country different form
their country of origin were asked whether or not they had subsequently returned. Those who
had returned, were asked to rate the importance of the reasons behind their decision to return.
The rating scale ranged from 1 to 5 with incremental steps of .1, where 1 was “totally

13
unimportant” and 5 was “extremely important.” Average scores assigned by returnees to each of
the motivations by country of origin (and return) are reported in Table 4.
Table 4 - How important was each of the following reasons behind your decision to return to the country where you lived when you were 18. Average score.
Country of origin at 18
exce
llenc
e/ p
rest
ige
of th
e in
stitu
tion
in m
y ar
ea o
f re
sear
ch
outs
tand
ing
facu
lty, c
olle
ague
s or
rese
arch
team
bette
r res
earc
h in
fras
truct
ures
an
d fa
cilit
ies
grea
ter a
vaila
bilit
y of
rese
arch
fu
nds
bette
r wag
e / m
onet
ary
com
pens
atio
n
bette
r frin
ge b
enef
its (p
aren
tal
leav
es, p
ensi
on, i
nsur
ance
, ..)
bette
r wor
king
con
ditio
ns
(vac
atio
ns, h
ours
of w
ork,
..)
oppo
rtuni
ty to
wor
k w
ith a
sp
ecifi
c gr
oup
of sc
hola
rs o
r co
lleag
ues
bette
r job
opp
ortu
nity
or c
aree
r pr
ospe
cts
bette
r qua
lity
of li
fe
pers
onal
or f
amily
reas
ons
visa
or i
mm
igra
tion
reas
ons
Australia 3.1 3.1 2.8 2.6 2.9 2.7 2.8 2.9 3.2 4.1 4.3 1.9 Belgium 2.8 2.9 2.6 2.5 2.4 2.9 2.8 3.3 3.4 3.5 4.4 1.8 Brazil 3.1 3.0 2.4 2.6 2.7 2.6 2.6 2.9 3.3 3.3 4.1 1.9 Canada 3.3 3.3 2.9 2.9 2.8 3.2 2.9 2.9 3.4 3.9 4.1 1.6 Denmark 2.8 3.1 2.7 2.7 2.8 3.1 3.1 2.8 3.1 3.5 4.5 1.3 France 3.4 3.4 2.8 2.4 2.2 3.6 3.3 3.4 3.4 3.8 4.2 1.5 Germany 3.4 3.5 3.2 3.3 2.8 3.1 2.7 3.2 3.6 3.3 4.0 1.6 India 4.0 3.5 3.3 3.3 2.8 3.0 3.1 3.1 3.4 3.3 4.1 2.1 Italy 2.6 2.6 1.9 1.8 1.8 2.2 2.2 2.7 2.6 3.2 4.3 1.4 Japan 3.2 3.2 3.3 3.1 3.0 2.8 2.7 3.2 3.6 3.2 3.7 2.0 Netherlands 2.9 3.1 2.8 2.6 2.6 2.6 2.6 2.9 3.3 3.1 4.1 1.6 Spain 2.8 3.0 2.3 2.3 2.3 2.6 2.6 3.0 3.4 3.7 4.5 1.4 Sweden 2.8 2.8 2.7 2.9 2.4 3.5 3.2 2.7 3.0 3.7 4.5 1.5 Switzerland 3.6 3.6 3.7 3.7 3.6 3.1 2.8 3.3 3.6 3.8 4.3 1.5 UK 3.6 3.5 2.9 2.9 2.4 2.5 2.6 3.2 3.4 2.9 3.9 1.8 U.S. 3.6 3.6 3.5 3.4 3.1 2.7 2.4 3.1 3.8 2.9 3.9 1.8 AVERAGE 3.3 3.3 2.9 2.8 2.6 2.9 2.7 3.1 3.4 3.4 4.1 1.7
Table 5 reports the percent that rated as “important” or “very important” the same
motivations. Regardless of country, the most likely reason scientists give for returning to their
country of origin is for “personal or family reasons” and “personal and family reasons” are most
likely to be scored “important” or “very important.”

14
Table 5 - How important was each of the following reasons behind your decision to return to the country where you lived when you were 18. Percent indicating “important” or “extremely important”.
Country of origin at 18
exce
llenc
e/ p
rest
ige
of th
e in
stitu
tion
in m
y ar
ea o
f re
sear
ch
outs
tand
ing
facu
lty, c
olle
ague
s or
rese
arch
team
bette
r res
earc
h in
fras
truct
ures
an
d fa
cilit
ies
grea
ter a
vaila
bilit
y of
rese
arch
fu
nds
bette
r wag
e / m
onet
ary
com
pens
atio
n
bette
r frin
ge b
enef
its (p
aren
tal
leav
es, p
ensi
on, i
nsur
ance
, ..)
bette
r wor
king
con
ditio
ns
(vac
atio
ns, h
ours
of w
ork,
..)
oppo
rtuni
ty to
wor
k w
ith a
sp
ecifi
c gr
oup
of sc
hola
rs o
r co
lleag
ues
bette
r job
opp
ortu
nity
or c
aree
r pr
ospe
cts
bette
r qua
lity
of li
fe
pers
onal
or f
amily
reas
ons
visa
or i
mm
igra
tion
reas
ons
Australia 33.6 27.9 15.6 11.6 23.3 26.0 22.4 27.0 35.7 68.4 83.3 6.4 Belgium 20.4 20.4 12.6 9.6 7.3 29.0 17.9 41.6 47.5 45.0 86.0 7.3 Brazil 40.9 34.9 13.6 22.4 22.6 22.2 19.1 29.1 42.8 46.0 75.4 12.0 Canada 43.0 40.6 21.5 23.4 22.6 40.2 28.0 25.7 44.3 66.5 73.4 5.5 Denmark 22.7 35.0 22.2 22.7 19.5 39.3 43.3 20.1 38.9 44.9 91.5 3.5 France 41.6 41.0 17.2 8.4 8.0 53.6 38.1 45.1 44.9 60.8 80.4 5.0 Germany 48.1 49.8 36.1 39.8 19.3 34.0 19.1 36.3 49.6 38.2 72.2 7.6 India 67.2 49.9 35.6 39.5 19.6 24.8 27.8 32.0 39.1 34.9 70.8 14.3 Italy 20.7 22.0 5.2 5.5 4.8 11.4 8.5 27.0 23.8 37.6 82.2 1.9 Japan 34.9 31.6 38.8 27.8 24.8 16.7 14.7 35.1 52.1 32.5 59.2 9.7 Netherlands 22.7 28.3 19.0 15.6 17.8 17.7 16.6 27.2 45.7 37.4 75.1 7.2 Spain 22.5 31.0 7.2 7.5 8.5 16.8 14.9 31.3 45.2 57.8 87.9 2.9 Sweden 23.8 21.8 22.8 23.1 6.4 48.1 32.4 22.7 26.3 52.4 87.5 1.3 Switzerland 55.6 52.3 56.6 56.8 50.4 35.7 18.8 42.2 48.7 60.7 82.7 3.2 UK 49.7 43.8 19.8 18.8 8.5 11.5 14.8 36.2 43.0 19.6 65.8 11.2 U.S. 56.6 53.9 50.4 44.9 36.1 20.6 13.3 34.2 62.6 24.3 66.2 10.7 AVERAGE 40.5 38.9 25.9 23.9 18.1 26.8 20.4 33.9 45.3 43.5 74.5 7.5
5. Discussion/Conclusion
The GlobSci survey is the first comprehensive study of mobility patterns of scientists
actively engaged in research in a large number of countries. The survey finds a high rate of
foreign-raised talent studying and working in a number of countries. To put it bluntly, the
United States is not that atypical when it comes to a strong reliance on foreign talent. But there
are a number of countries—including India, Italy, Japan, Brazil and Spain—where foreign
scientists and engineers are extremely rare. The survey also finds considerable variation in
emigration patterns across countries. Swiss and Indian scientists are the most mobile; those from

15
the United States the least mobile. The survey also documents that, for virtually all the core
countries studied, the United States is the dominant destination country.
Policy levers appear to be extremely important in attracting scientists to work or study
abroad. Regardless of country, opportunities to improve one’s future or the availability of
outstanding faculty, colleagues or research teams prove the most important reasons for
immigration. But policy levers appear to have played little role in pulling returning emigrants
back to their home country. For these returnees, and regardless of country, “personal or family
reasons” are the most important factor influencing the decision to return. It does not follow,
however, that countries have no ability to influence the return decisions of emigrants living
abroad. As noted above, emigrant scientists from a handful of countries report that whether or
not they return in the future will depend in part on job market conditions.
GlobSci is not without limitations. First, it is restricted to researchers who have
published in one of 16 countries. Second it is limited to four fields of science. Third, due to
problems encountered in administering the survey, China was excluded from the core countries
studied. Fourth, GlobSci provides but a snapshot of scientists active in 2009, thereby limiting
the ability to compare cohorts of scientists overtime. Despite these limitations, GlobSci
represents the largest international survey of scientists working in these four fields at this time.

16
APPENDIX
A1. Sampling procedure
We surveyed active researchers in the four scientific disciplines of biology, chemistry,
earth and environmental sciences, and materials science during the period February-June 2011.
In constructing the sample, we selected all journals classified by ISI as belonging to one
of the four disciplinary fields and sorted them by Impact Factor for all subfields of the four
disciplines. Impact Factor was taken from the latest available release of the Journal Citation
Report of Thomson-Web of Science®. We then randomly picked a selection of four journals in
each quartile of the Impact Factor distribution in each subfield of each of the four disciplines. In
the aggregate, this selection corresponds to approximately 30% of all journals published in the
four fields.
We downloaded full references of all scientific articles published in the selected journals
in 2009 and retrieved the email address of the corresponding author. In case of multiple
corresponding authors, we picked the first name on the list. In the case of corresponding authors
appearing repeatedly in the list, we randomly selected one record.
We coded the records by country, based on the domain name of the email address (e.g.
“.au” for Australia; “.be” for Belgium, etc.). We identified U.S. authors by those having “.edu”
in the address, thereby restricting the U.S. sample to academic researchers. Surveyed countries
are: Australia, Belgium, Brazil, Canada, Denmark, France, Germany, India, Italy, Japan,
Netherlands, Spain, Sweden, Switzerland, United Kingdom, United States. China was initially
included in the survey. However, a low response rate of less than 5 percent for a test sample of
Chinese addresses suggested that respondents were either not receiving the invitation or had
problems responding to the invitation. We thus decided not to survey researchers based in
China.

17
Table A- 1 - Sixteen country panels by scientific discipline
Core country Biology Chemistry Earth Materials Science
Total
Australia 470 386 490 225 1571 Belgium 253 214 131 108 706 Brazil 626 473 161 277 1,537 Canada 825 685 621 324 2,455 Denmark 189 170 99 55 513 France 1,026 1,380 671 762 3,839 Germany 1,303 1,533 763 781 4,380 India 282 587 160 351 1,380 Italy 771 1,097 514 397 2,779 Japan 1,485 1,996 562 1,207 5,250 Netherlands 382 275 223 156 1,036 Spain 620 939 369 375 2,303 Sweden 326 251 181 124 882 Switzerland 285 265 256 113 919 UK 1,312 1,051 748 584 3,695 U.S. 5,135 4,247 2,667 2,010 14,059 Total 15,290 15,549 8,616 7,849 47,304
The procedure produced a sample of unique article-corresponding author addresses of
47,304 scientists in 16 countries. The country panel sizes are highly variable. The smallest panel
is Belgium (706) and the largest is the U.S. (14,059), reflecting differentials in country
contributions to scientific publications. Table A- 1 provides summary statistics on the panel of
invited respondents by country and scientific discipline.
We track two characteristics of the articles from which the email of the corresponding
author was extracted: number of coauthors of the article and total citations received by the article
as of February 2010 (Table A- 2). The latter are retrieved from the Thomson-Web of Science®
database. Variability across countries reflects field differences as well as variation in the quality
of research being performed within country. The Swiss sample is associated with articles having
the highest number of citations; the Brazilian sample is associated with articles having the lowest
number.

18
Table A- 2 - Characteristics of the panels: total cites and number of co-authors
Core country Total Cites* Number of coauthors
Australia 0.95 4.61 Belgium 0.97 5.85 Brazil 0.39 5.27 Canada 0.85 4.33 Denmark 1.08 4.83 France 0.91 5.54 Germany 1.17 5.10 India 0.46 3.68 Italy 0.67 5.74 Japan 0.77 5.26 Netherlands 1.11 5.27 Spain 0.74 4.98 Sweden 1.01 4.88 Switzerland 1.55 5.14 UK 1.23 4.95 U.S. 1.31 4.64
*Cumulated as of February 2010.
A2. Survey administration and questionnaire
The main language of the survey is English. However, the questionnaire and the
invitation emails were available in six other languages: French, German, Italian, Japanese,
Portuguese and Spanish. The online questionnaire was developed through the platform
Qualtrics® that supports multiple languages. The survey administrator chose a primary language
to use in emails and set the list of languages available for a specific country survey. The platform
then automatically deploys the language in which the recipient has set her browser, and lets the
respondent switch from one language to another at any point while filling-in the questionnaire.
Table A- 3 reports the languages used to administer the survey by country. Each panel
member was emailed at most three times during February-June 2011 and asked to complete the
web-based questionnaire. The platform recorded partial answers, allowing respondents to follow-
up in additional rounds. The U.S. sample was divided into three blocks, due to the size of the
sample. The questionnaire is available at
http://www.dig.polimi.it/uploads/media/GlobSci_survey.pdf.

19
Table A- 3 - Primary and secondary languages in which the survey was administered
Core country
Primary languages Secondary languages
Australia English - Belgium English - Brazil Brazilian Portuguese English Canada English, French - Denmark English - France French English Germany German English India English - Italy Italian English Japan Japanese English Netherlands English - Spain Spanish English Sweden English - Switzerland English French, German, Italian UK English - U.S. English -
A3. Response rates
Table 1 in the text reports the number of answers received by country. Answers are
further divided into complete answers and partial answers. The latter are answers from
respondents who began the survey, but dropped-out before reaching the last question. The total
dropout rate is 5 percent. The response rate is 40.6 percent if both complete and partial answers
are counted; 35.6 percent if only complete answers are counted. As noted in the text, reported
response rates do not take into account undelivered invitations due to such things as incorrect
email address, retirement or death and consequently underestimate the response rate.
Response rates by scientific field are reported in Table A- 4. Participation was highest for
scientists in earth and environmental sciences and lowest for scientists in biology.
Table A- 4 - Response rates by scientific field
Scientific field Panels Total Answers
Of which complete
Of which dropouts
Total Response
Rate
%
Complete Response
Rate
% Biology 15,290 5,810 5,097 713 38.0 33.3 Chemistry 15,549 6,324 5,524 800 40.7 35.5 Earth & Environment 8,616 3,956 3,532 424 45.9 41.0 Materials Science 7,849 3,093 2,674 419 39.4 34.1 Total 47,304 19,183 16,827 2,356 40.6 35.6

20
A4. Non-response bias
We assess non-response bias along three dimensions. First, we compare early and late
respondents; second, we compare respondents against non-respondents and third, we compare
full-respondents against those who dropped-out. In all instances the comparison is done for two
known characteristics for the entire panel and sample: total citations received by the underlying
article and number of coauthors. Total citations arguably are positively correlated with the
eminence of the scientist and could potentially reflect differentials in the propensity to answer
related to how busy the respondent is. The number of co-authors is positively correlated with the
amount of time it took to answer the questionnaire given that number of coauthors was a basis
for a branching question in the survey. Therefore, the number of coauthors is potentially
associated with dropping out of the survey. Tests for equality of means are performed for each
pair of country samples.
Mean differences by country for early and late respondents are reported in Table A- 5.
Early-respondents are those who completed the survey during the first and second round and
late-respondents are those who completed the survey during third round. Regardless of country
or measure, there is no significant difference at the 5 percent confidence level.
Comparison statistics for non-respondents vs. respondents are reported in Table A- 6.
Authors of more highly-cited papers living in France, Italy, Spain and the U.S. are less likely to
respond than those with lower-cited papers. Authors of papers with more co-authors living in
Brazil, Germany, Italy and the U.S are also less likely to have answered.

21
Table A- 5 - Two-groups comparisons. T-Tests. Hypothesized difference (early respondents – late respondents)=0
Core country
Total Cites
mean diff. (st. err.)
Number of authors
mean diff. (st. err.)
Australia 0.174 -0.393 (0.200) (0.287)
Belgium -0.084 0.575 (0.329) (0.450)
Brazil 0.148 0.144 (0.083) (0.227)
Canada -0.208 -0.372 (0.132) (0.219)
Denmark 0.192 -0.367 (0.481) (0.519)
France 0.047 -0.167 (0.133) (0.216)
Germany -0.140 -0.042 (0.221) (0.238)
India -0.093 0.119 (0.117) (0.217)
Italy -0.049 -0.334 (0.117) (0.230)
Japan 0.151 -0.060 (0.157) (0.241)
Netherlands 0.045 0.250 (0.254) (0.364)
Spain -0.099 -0.040 (0.138) (0.203)
Sweden -0.123 -0.531 (0.317) (0.448)
Switzerland -0.297 -0.357 (0.438) (0.438)
UK 0.165 0.173 (0.182) (0.235)
U.S. 0.199 0.074 (0.106) (0.102)
*p<0.05

22
Table A- 6 Two-groups comparisons. T-Tests. Hypothesized difference (non-respondent – respondent)=0
Core country Total Cites
mean diff. (st. err.)
Number of authors
mean diff. (st. err.)
Australia -0.039 0.035 (0.098) (0.142) Belgium -0.268 -0.274 (0.162) (0.222) Brazil 0.088 0.397 (0.046) (0.125)* Canada 0.009 0.160 (0.063) (0.105) Denmark -0.002 -0.114 (0.224) (0.242) France 0.122 0.029 (0.058)* (0.094) Germany 0.158 0.205 (0.092) (0.099)* India 0.029 0.008 (0.052) (0.096) Italy 0.181 0.288 (0.061)* (0.120)* Japan 0.089 0.112 (0.052) (0.080) Netherlands 0.069 0.031 (0.124) (0.178) Spain 0.161 0.051 (0.064)* (0.095) Sweden -0.040 0.089 (0.133) (0.188) Switzerland 0.212 0.206 (0.200) (0.200) UK 0.143 0.123 (0.083) (0.108) U.S. 0.354 0.146 (0.052)* (0.049)*
*p<0.05
Results of test comparisons for full-respondents against partial respondents (dropouts) are
reported in Table A- 7. Results indicate that more cited authors from Belgium were more likely
to dropout. The opposite is true for more cited authors from India, who were more likely than
less-cited authors to take the survey in full. Dutch authors with more coauthors are also more
likely to have completed the survey in full.

23
Table A- 7 - Two-groups comparisons. T-Tests. Hypothesized difference (complete – dropout)=0
Core country Total Cites
mean diff. (st.err.)
Number of authors
mean diff. (st.err.)
Australia -0.162 -0.637 (0.224) (0.371)
Belgium -0.962 -0.120 (0.405)* (0.463)
Brazil -0.065 -0.298 (0.104) (0.299)
Canada 0.168 -0.257 (0.150) (0.242)
Denmark 0.029 -0.293 (0.670) (0.650)
France 0.192 0.278 (0.122) (0.197)
Germany -0.096 -0.387 (0.207) (0.236)
India 0.196 0.064 (0.084)* (0.175)
Italy -0.069 -0.417 (0.105) (0.239)
Japan 0.176 0.079 (0.144) (0.214)
Netherlands 0.565 0.872 (0.290) (0.438)*
Spain 0.111 -0.068 (0.117) (0.192)
Sweden 0.401 -0.161 (0.300) (0.387)
Switzerland -0.832 -0.479 (0.517) (0.455)
UK 0.015 -0.063 (0.175) (0.282)
U.S. -0.130 0.105 (0.101) (0.118)
* p<0.05

24
REFERENCES
Auriol, Laudeline (2010) “Careers of Doctorate holders: employment and mobility patterns” OECD
STI Working paper 2010/4
_______ (2007) “Labour market characteristics and international mobility of doctorate holders:
results for seven countries” OECD STI Working papers 2007/2.
Empirica GmbH (2005) “Post-Docs in the Life Science” Paper prepared for the NetReAct project.
Dowloadable at: www.netreact-eu.org/documents/NetreactDeliverable1.3.pdf
Haeussler, Carolin (2011). “Information Sharing in Academe and Industry: A Comparative
Study,” Research Policy. 40:105-122. (2011).
Hirschman, Albert O. (1964). “The Paternity of an Index.” The American Economic Review
54(5):761, (1964).
Hunter, Rosalind S., Andrew J. Oswald and Bruce Charlton. 2009. “The Elite Brain Drain.”
Economic Journal 119:231-251.
Levin, Sharon and Paula Stephan. (1999). “Are the Foreign Born a Source of Strength for U.S.
Science?” Science 285:1213-14.
MORE (2011) “Mobility and career paths Of Researchers in Europe” Project funded by the
European Commission (DG Research) and carried out by a consortium of international
organisations led by IDEA Consult. http://www.researchersmobility.eu
National Science Board. (2012), Science and Engineering Indicators: 2012. Arlington, VA:
National Science Foundation.
Sauermann, Henry, and Mike Roach (2011a). “Not all scientists pay to be scientists:
Heterogeneous preferences for publishing in industrial research,” Georgia Institute of
Technology, working paper (2010).
_______(2011b). “Static and Dynamic Drivers of Web Survey Response Rates: An
Experimental Study. Georgia Institute of Technology, working paper.

25
SCImago Journal and Country Rank database. Retrieved April 28, 2010, from
http://www.scimagojr.com/
Stephan, Paula (2012). How Economics Shapes Science, Cambridge, MA: Harvard University
Press.
Walsh, John, Wes Cohen, and Charlene Cho. (2007). “Where Excludability Matters: Material
versus Intellectual Property in Academic Biomedical Research.” Research Policy
36:1184-203.