Foreign Aid and Corruption - Georgetown University
71
Foreign Aid and Corruption Jihyuk John Lim 4/25/13 IPEC-401 Professor Anders Olofsgard Abstract: Foreign aid and corruption have received a lot of scholarly attention in the recent decades, but there have only been a few papers empirically examining the causal relationship between the two. This paper uses a unique, large-scale panel dataset and an instrumental variable methodology to show that total foreign aid has a positive impact on the recipient country’s level of corruption, while the effects of the different subcategories of assistance are mixed. Additional specifications of the model also lead to varied results. Thesis Submitted in Partial Fulfillment of the Requirements for the Award of Honors in International Political Economy, Edmund A. Walsh School of Foreign Service, Georgetown University, Spring 2013.
Transcript of Foreign Aid and Corruption - Georgetown University

Foreign Aid and Corruption
Jihyuk John Lim
4/25/13
IPEC-401
Professor Anders Olofsgard
Abstract: Foreign aid and corruption have received a lot of scholarly attention in the recent
decades, but there have only been a few papers empirically examining the causal relationship
between the two. This paper uses a unique, large-scale panel dataset and an instrumental
variable methodology to show that total foreign aid has a positive impact on the recipient
country’s level of corruption, while the effects of the different subcategories of assistance are
mixed. Additional specifications of the model also lead to varied results.
Thesis Submitted in Partial Fulfillment of the Requirements for the Award of Honors in
International Political Economy, Edmund A. Walsh School of Foreign Service, Georgetown
University, Spring 2013.

2
Table of Contents
I. Introduction ····················································································································3
II. Literature Review···········································································································4
A. Corruption ················································································································5
B. Foreign Aid ··············································································································7
C. Foreign Aid and Corruption ·····················································································8
III. The Econometric Model ······························································································11
IV. Description of the Data ································································································17
V. Main Results ················································································································21
A. OLS Regression Results ························································································21
B. 2SLS Regressions Results······················································································24
VI. Sensitivity Analysis ·····································································································31
A. Regional Dummies·································································································31
B. Education Variables ·······························································································34
C. Democracy Variables ·····························································································36
D. Monterrey Consensus·····························································································38
E. Paris Declaration ····································································································39
F. Fixed Effects ··········································································································40
G. Previous Corruption ·······························································································41
VII. Conclusion ···················································································································42
VIII. Appendices ···················································································································44
IX. Bibliography ················································································································69

3
I. Introduction
In 2003, according to the World Bank, Sudan received over 620 million dollars in official
assistance from the international community. While the amount it received in 2003 was large,
other countries and multilateral institutions even more generous towards Khartoum in subsequent
years. In 2004, Sudan saw a 60% increase in the aid that it received from foreign sources
compared to the previous year, for a total of close to 994 million dollars. The assistance
provided by the international community nearly doubled the following year to over 1.8 billion
dollars in 2005. By 2010, Sudan’s annual intake from official bilateral and multilateral sources
amounted to larger than 2 billion dollars a year, an increase of 234.5% compared to what it
received in 2003.1
During these years, Sudan remained one of the most corrupt countries in the world. In
2003, Sudan received a score of 2.3 out of 10 on the Corruption Perceptions Index compiled by
Transparency International. Its score tied Khartoum with such bastions of clean government as
Bolivia, Honduras, Macedonia, Serbia & Montenegro, Ukraine, and Zimbabwe, which all ranked
106th
out of 133 countries in the index that year. While Sudan’s level of corruption was far from
desirable, it managed to slip further down during the ensuing years that saw increased funding
from the outside world. By 2010, Sudan had fallen to 1.6 out of 10 on the Corruption
Perceptions Index, tying it with Turkmenistan and Uzbekistan for the 172nd
place out of 178
countries. Only Iraq, Afghanistan, Myanmar, and Somalia, all countries with a long-running
reputation for corruption, fared worse on the index that year.2
Sudan’s dismal experience with foreign aid and corruption is only one case out of a much
larger group of countries that have received assistance from abroad, but it appears to confirm a
1 World Bank, “Net Official Development Assistance and Official Aid Receive (Current US$),” World Development
Indicators. 2 Transparency International, Corruption Perceptions Index.

4
popular perception, and perhaps even an intuition, that the corruption and foreign aid are
connected and that the latter leads to more of the former. It is this suspicion that has led to my
research. A vast majority of countries receives foreign aid from bilateral and multilateral
sources, often for decades, and every government struggles with at least some level of
corruption. The causal relationship between official assistance from abroad and corruption, if
one were to exist, would seem to pose an important challenge for international development.
Through this paper, I attempt to test out that perception, that foreign aid breeds corruption, using
a cross-section of countries over a sixteen-year period.
The rest of the paper is as follows. Section II discusses the previous literature on
corruption and foreign aid in order to highlight how my work builds upon and contributes to the
vast amount of research that has already been conducted in these areas. Section III presents the
model utilized to test out the data on the question of what impact official assistance from abroad
has on the level of corruption of the recipient country. Section IV describes the data, including
their sources, and what the variables are. Section V examines the results of the main model.
Section VI is devoted to the sensitivity analysis of the model. Section VII concludes the paper.
II. Literature Review
Corruption and foreign aid have each received increasing attention from policymakers
and academics over the last couple of decades. As a result, academic research on these topics
has proliferated greatly during this time. Interestingly, most of what has been written about
corruption and foreign aid has treated them as separate issues, often tying them not with each
other, but with other related topics, such as economic growth.

5
A. Corruption
The literature on corruption can be divided broadly into two categories: works examining
the causes of corruption—whether economic, political, or cultural—and studies looking at the
effects of corruption. Papers studying the causes of corruption include “The Quality of
Government” (1999) by Rafael La Porta,3 Florencio Lopez-de-Silanes, Andrei Shleifer, and
Robert Vishny, “The Causes of Corruption: A Cross-National Study” (2000) by Daniel
Treisman,4 “Sources of Corruption: A Cross-Country Study” (2002) by Gabriella Montinola and
Robert Jackman,5
and “Causes of Corruption: A Survey of Cross-Country Analyses and
Extended Results” (2007) by Lorenzo Pellegrini and Reyer Gerlagh.6 “Corruption in Empirical
Research—A Review”7
(1999) by Johann Graf Lambsdorff provides an overview of the
literature up to that point in time on corruption, showing the increasing academic interest on this
subject and the differing results of the research. While the results of these studies vary, and
every author greater emphasis on some factors over others, they all stress that there are several
distinct causes for why some countries have higher levels of corruption, while others have lower
levels. The results of the last two decades of research in this area has suggested that these causes
include historical and cultural factors, such as religion, ethno-linguistic heterogeneity, colonial
past, and origins of countries’ legal systems, political conditions like the level of democracy and
government structure, and economic issues, such as the levels of economic development and
economic competition.
3 Rafael La Porta, Florencio Lopez-de-Silanes, Andrei Shleifer, and Robert Vishny, “The Quality of Government,”
Journal of Law, Economics, and Organization 15.1 (1999). 4 Daniel Treisman, “The Causes of Corruption: A Cross-National Study,” Journal of Public Economics 76.3 (2000).
5 Gabriella Montinola and Robert Jackman, “Sources of Corruption: A Cross-Country Study,” British Journal of
Political Science 32.1 (2002). 6 Lorenzo Pellegrini and Reyer Gerlagh, “Causes of Corruption: A Survey of Cross Country Analyses and Extended
Results,” Economics of Governance 9 (2008). 7 Johann Graf Lambsdorff, “Corruption in Empirical Research—A Review,” World Bank (1999).

6
Works looking at the effects of corruption, often on economic growth, are similarly
extensive. Susan Rose-Ackerman has published a number of books and papers on this subject,
such as Corruption: A Study in Political Economy (1978) and Corruption and Government:
Causes, Consequences, and Reform (1999).8 She argues that corruption in general has far-
reaching negative impacts on both the political and economic spheres of a country. Meanwhile,
Samuel Huntington, in Political Order in Changing Societies (1968), states that the impact of
corruption may not always be negative, and that in fact, it can at times be construed as positive.9
Andrew Wedeman advances this argument in a more nuanced way in “Looters, Rent-Scrapers,
and Dividend-Collectors: Corruption and Growth in Zaire, South Korea, and the Philippines”
(1997), suggesting that the positive or negative impact of corruption lies with the type of
corruption, as he classifies into three categories.10
Empirical studies include “Institutions and
Economic Performance: Cross-Country Tests Using Alternative Institutional Measures” (1995)
by Stephen Knack and Philip Keefer, which argues that strong property rights are critical for
investment and economic growth,11
and “Corruption and Growth” (1995) by Paolo Mauro, which
suggests that corruption lowers economic growth by decreasing investment.12
“Corruption,
Growth, and Public Finances” (2000) by Vito Tanzi and Hamid Davoodi points to the negative
impacts of corruption on enterprises, allocation of talent, investment, public finances, and
therefore economic growth,13
while “Corruption, Growth, and Ethnic Fractionalization” (2012)
by Roy Cerqueti, Raffaella Coppier, and Gustavo Piga makes the argument that ethnic
8 Susan Rose-Ackerman, Corruption: A Study in Political Economy, New York: Academic Press, 1978. Susan Rose-
Ackerman, Corruption and Government: Causes: Consequences, and Reform, Cambridge: Cambridge University Press, 1999. 9 Samuel Huntington, Political Order in Changing Societies, New Haven: Yale University Press, 2006.
10Andrew Wedeman, “Looters, Rent-Scrapers, and Dividend-Collectors: Corruption and Growth in Zaire, South
Korea, and the Philippines,” The Journal of Developing Areas 31.4 (1997). 11
Stephen Knack and Philip Keefer, “Institutions and Economic Performance: Cross-Country Tests Using Alternative Institutional Measures,” Economics & Politics 7.3 (1995). 12
Paolo Mauro, “Corruption and Growth,” The Quarterly Journal of Economics 110.3 (1995). 13
Vito Tanzi and Hamid Davoodi, “Corruption, Growth, and Public Finances,” IMF Working Paper (2000).

7
fractionalization affects corruption, which in turn impacts economic growth, all in a non-linear
fashion.14
As such, it appears that while it is recognized that corruption has the potential to have
negative effects, the academic community does not have a definitive consensus on whether the
influence is always negative.
B. Foreign Aid
Studies examining the effects of foreign aid, mostly on economic growth, are likewise
quite numerous, with varied results. Dissent on Development (1972) and other works by Peter
Thomas Bauer,15
as well as Dambisa Moyo’s Dead Aid: Why Aid is Not Working and How There
is a Better Way for Africa (2009) and William Easterly’s The White Man’s Burden: Why the
West’s Efforts to Aid the Rest Have Done So Much Ill and So Little Good (2006), have all argued
that foreign aid has not been an effective tool in promoting economic growth,16
while Jeffrey
Sachs’ The End of Poverty: Economic Possibilities for Our Time (2005) takes a more optimistic
view of the impact that development assistance can have on economic growth.17
Alberto Alesina
and David Dollar’s “Who Gives Foreign Aid to Whom and Why?” (2000) suggests that foreign
aid is not always disbursed based on economic need of the recipient alone, but also on political
and strategic calculations of the donor.18
Jakob Svensson’s “Aid, Growth, and Democracy”
(2003) argues that foreign aid can have a positive effect on economic growth, but that it is
conditional on the country’s level of democracy and good governance.19
“Aid, Policies, and
14
Roy Cerqueti, Raffaella Coppier, and Gustavo Piga, “Corruption, Growth, and Ethnic Fractionalization,” Journal of Economics 106.2 (2012). 15
Peter Thomas Bauer, Dissent on Development, Cambridge: Harvard University Press, 1972. 16
Dambisa Moyo, Dead Aid: Why Aid is Not Working and How There is a Better Way for Africa, New York: Farrar, Strauss and Giroux, 2009. William Easterly, The White Man’s Burden: Why the West’s Efforts to Aid the Rest Have Done So Much Ill and So Much Good, New York: Penguin, 2006. 17
Jeffrey Sachs, The End of Poverty: Economic Possibilities for Our Time, New York: Penguin, 2005. 18
Alberto Alesina and David Dollar, “Who Gives Aid to Whom and Why?” Journal of Economic Growth 5.1 (2000). 19
Jakob Svensson, “Aid, Growth, and Democracy,” Economics & Politics 11.3 (1999).

8
Growth” (2000) by Craig Burnside and David Dollar states that the positive impact of aid on
growth is subject to the recipient country’s economic policies, but also that the quality of the
recipient country’s policies appears to be a small factor in the donor’s decision to disburse aid.20
“Aid and Growth: What Does the Cross-Country Evidence Really Show?” (2008) by Raghuram
Rajan and Arvind Subramanian makes the argument that foreign aid is not very effective for
economic growth, even after controlling for policy or geographical factors or types of aid.21
Therefore, it seems that much like the research on corruption, the studies on the impact of
foreign aid have not yet conclusively determined whether foreign aid has positive or negative
effects on economic growth and under what conditions those influences differ.
C. Foreign Aid and Corruption
Compared to the large volume of studies done on foreign aid and corruption separately,
there has not been a lot of work done tying the two together and looking at the relationship
between them. World Development Report, which discusses economic development issues and
often talks about foreign aid, placed emphasis on the importance of building strong institutions
for good governance in the report from 1996 and subsequent years, thereby linking the two
subjects.22
Bauer’s works in the preceding decades, discussed above, likewise made a
connection between development assistance and corruption, arguing that foreign aid fosters more
corruption. Corruption would then lead to stunted economic growth.23
More systematic and empirical studies have been conducted in recent years to test out
intuitions about the relationship between development assistance and corruption. The bulk of the
20
Craig Burnside and David Dollar, “Aid, Policies, and Growth,” American Economic Review 90.4 (2000). 21
Raghuram Rajan and Arvind Subramanian, “Aid and Growth: What Does the Cross-Country Evidence Really Show?” The Review of Economics and Statistics 90.4 (2008). 22
World Bank, World Development Report 1996. For example, World Bank, World Development Report 1997. 23
Bauer, Dissent on Development.

9
empirical evidence suggests that foreign aid likely leads to greater corruption. However, only a
few studies have been conducted, and the results have not been entirely conclusive.
Stephen Knack’s “Aid Dependence and the Quality of Governance: Cross-Country
Empirical Tests” (2001) looks at potential negative impacts of foreign aid on various aspects of
institution-building and good governance, including corruption. Knack uses panel data from
1982 to 1995, and his main dependent variable of interest is the change in indicators of
governance, as measured by the International Country Risk Guide (ICRG). His measure for aid
uses an instrumental variable built from infant mortality in 1980, initial GDP per capita, a
dummy for membership in the Franc Zone, and a dummy for Central America. His results
suggest that foreign aid worsens measures of governance, including corruption, in recipient
countries.24
“Foreign Aid and Rent Seeking” (2000) by Jakob Svensson examines the relationship
between those two by building a model based on game theory to look at the struggle for
additional resources. Svensson builds panel data of 66 countries from 1980 to 1994, divided into
three times periods, using ICRG data for corruption and an instrumental variable for aid. He
constructs his instrument for aid from the log of the recipient country’s population, the log of the
recipient country’s GDP, and a measure of income from trade. He argues that in some cases,
greater government revenue—such as through foreign aid—leads to worse provision of public
goods. If the aid is tied to improved economic policies, the result could be reversed. In addition,
official assistance is likely to result in higher corruption in countries with social groups
24
Stephen Knack, “Aid Dependence and the Quality of Governance: Cross-Country Empirical Tests,” Southern Economic Journal 68.2 (2001).

10
competing for resources. Furthermore, donors’ decision to disburse aid to a particular country
does not depend on the level of corruption in the target country.25
Alberto Alesina and Beatrice Weder’s “Do Corrupt Governments Receive Less Foreign
Aid?” (2002) seeks to answer three separate questions related to corruption and foreign aid based
on panel data from 1975 to 1995. For corruption, they use seven different indices, rather than
relying on one set of measures, such as the ICRG index used in previous studies. Their results
suggest that corrupt governments do not receive less aid than others, and that different donors
consider the recipient country’s level of corruption in varying degrees as they decide whether to
provide assistance. With regards to what impact aid has on corruption, Alesina and Weder, who
attempt to account for the lagging effects of change in foreign aid, show that an increase in
foreign aid leads to greater corruption.26
“The Effect of Foreign Aid on Corruption: A Quantile Regression Approach” (2012) by
Keisuke Okada and Sovannroeun Samreth categorizes aid recipient countries by their levels of
corruption. They test out the effects of foreign aid on the various groups of countries, with the
data coming from 120 countries over the period of 1995 to 2009. Their results note that foreign
aid actually lowers corruption, with the effects appearing more strongly in less corrupt countries.
When the total foreign aid is divided into aid from multilateral sources, France, Japan, the United
Kingdom, and the United States, multilateral aid and bilateral assistance from Japan are shown to
significantly reduce corruption, while aid from the other three donors does not have such an
impact. Based on the results, the authors suggest that the decisions by France, the United States,
25
Jakob Svensson, “Foreign Aid and Rent-Seeking,” Journal of International Economics 51 (2000). 26
Alberto Alesina and Beatrice Weder, “Do Corrupt Governments Receive Less Foreign Aid?” The American Economic Review 92.4 (2002).

11
and the United Kingdom to provide assistance are likely motivated by strategic and historical
factors, more than the quality of institutions in the target countries.27
III. The Econometric Model
The model that I utilize to test the impact of foreign aid on corruption differs from the
ones used in previous studies. As can be expected, the dependent variable of the model is the
level of corruption in a country for a given year (corruption), as listed in Transparency
International’s Corruption Perceptions Index. What is notable about this is that the previous
works on this subject by Alesina and Weder and by Knack looked at percentage changes in
corruption. This was done in order to make the research more manageable. As Knack notes in
his paper, “A convenient implication of using the change in the ICRG index from 1982 to 1995
as the dependent variable is that factors such as these that are invariant over very long periods of
time are unlikely to matter much (original italics included).”28
However, utilizing changes as the
dependent variable presents challenges of its own, as changes can be misleading. An
improvement in corruption from 5 to 6 and from 50 to 60 all show the same percentage increase,
but in reality, the differences in corruption experienced by those two countries are vast. To focus
on the seriousness of corruption in a country, and the influence of foreign aid on that, it is better
to use the level of—rather than change in—corruption as the dependent variable in the model.
The main independent variables of interest are total foreign aid (totforaid) and its various
components. As discussed in the previous literature, it is possible for assistance from the outside
to have both a positive and a negative effect on corruption. Aid may be directed towards
strengthening institutions, which, if successful, would lead to better governance. Even if the aid
27
Keisuke Okada and Sovannroeun Samreth, “The Effect of Foreign Aid on Corruption: A Quantile Regression Approach,” Economic Letters 115.2 (2012). 28
Knack 2001.

12
revenues are spent on consumption, they can help governments seeking to reform their countries
survive by giving them fiscal breathing room to pursue necessary policies that the population
opposes. On the other hand, even money spent on building up institutions and improving
policies can be, and often have been, failures, and by giving governments an alternative source of
income to taxation, foreign aid allows states to be unaccountable to their citizens, but rather to be
beholden to donors’ interests. In addition, as Knack remarks, “Foreign aid represents a potential
source of rents,” which could lead to greater corruption.29
The aid revenue would be used for
patronage purposes, and as Svensson argues, if the competition among interest groups is sever
enough, government expenditure for productive purposes can decline.30
While the theory
presents a mixed view, the empirical studies have suggested that it is more likely for assistance
from abroad to worsen corruption, and I, following those footsteps, hypothesize that total foreign
aid leads to increased corruption.
Assistance from abroad is disaggregated into aid from the Development Assistance
Committee (DAC) of the Organisation for Economic Co-operation and Development (OECD)
(oecdoda), from the United States (usoda), and from multilateral sources (iooda). Military
assistance from the United States (usmilaid) is also an independent variable of interest. Different
countries disburse aid with varying weights on strategic reasons and the needs of the recipient in
their decision-making, and certain countries and international organizations, such as the United
States, place greater policy and governance-related conditions on the aid given than other states.
Even for assistance provided by the United States, it is likely that economic needs of the
recipient play a far smaller role in how much military aid is given, compared to the calculations
for development assistance. As such, my hypothesis is that while all four types of foreign aid
29
Ibid. 30
Svensson 2000.

13
leads to greater corruption, the ones from the DAC, the United States, and multilateral sources
would have a less negative impact than total foreign aid has. In addition, I hypothesize that
military aid from the United States leads to more severe corruption than total foreign aid does.
However, using the actual numbers for foreign aid as the values for the independent
variable presents a serious endogeneity issue. It is unclear whether the causal arrow runs from
aid to corruption or corruption to aid. Much the way that it is likely that increased assistance
leads to greater corruption, it is just as possible for a larger amount of aid to be disbursed in
response to rising corruption, especially if the assistance is targeted at improving the recipient
country’s governance. Alesina and Weder try to address this problem by lagging the change in
foreign aid, while Knack and Svensson build their own instruments to take the place of the actual
foreign aid data. Using an instrumental variable is probably more effective than simply lagging
the data for resolving the endogeneity issue, especially since corruption is persistent over time
and resistant to quick changes. Therefore, I construct an instrumental variable for aid.
Because of the endogeneity issue surrounding foreign aid, the history of the academic
literature on the subject is also a long-running saga of attempts to find a suitable instrument—
one that would be highly correlated with the original independent variable without being highly
correlated with the dependent variable. New papers written on the subject of foreign aid,
especially as it relates to economic growth, boast of the strength of their instruments, but it is
often not clear why the authors choose the instruments they do, or why those instruments should
work well. Rajan and Subramanian (2008) and Frot and Perrotta (2010) discuss in depth the
shortcomings of previous attempts at constructing a valid instrument for foreign aid.31
Rajan and
Subramanian attempt to get around this problem by focusing on the historical aspect of a donor-
31
Rajan and Subramanian 2008. Emmanuel Frot and Maria Perrotta, “Aid Effectiveness: New Instrument, New Results?” SITE Working Paper Series 11 (2010).

14
recipient relationship as the basis for the instrument. Their rationale is supported by the
literature, which suggests that historical and strategic reasons play a critical role in a donor
country’s decision to provide assistance to a specific state.32
The independent variables that
Rajan and Subramanian use in the first stage of the two-stage regression are shared language, the
current and past colonial relationships, the size of the donor relative to that of the recipient, and
the influence of a particular donor relative to the influence exercised by other donor countries on
the recipient.33
Frot and Perotta argue that Rajan and Subramanian’s instrument fails to address all of the
issues. They point to the likelihood of an endogenous relationship between growth and historical
factors, which should be avoided in the context of Rajan and Subramanian’s study. Frot and
Perrotta present a new strategy for building an instrumental variable that can solve this issue and
be used in a dynamic model. Their instrument is the predicted quantity of aid that a country
would receive on the basis of the donor-recipient relationship and the resulting share of the
donor’s total aid budget that is expected to be allocated to a particular recipient country. This
instrument is dependent on when the donor began providing aid, when the recipient in question
began receiving assistance from the donor, and how many countries receive aid from the donor
during the given year. As Frot and Perrotta explain in their paper, the predicted aid quantity is
highly correlated with the actual level of assistance received by a country, is not subject to
endogeneity issues plaguing the original independent variable or other previous attempts at
instrumentation, and only affects growth through one channel—the actual influx of aid.34
Although my research deals with the impact on corruption, not growth, it is not hard to see that
predicted aid quantity most likely impacts corruption through no other means besides the actual
32
Alesina and Dollar 2000. 33
Rajan and Subramanian 2008. 34
Frot and Perrotta 2010.

15
flow of assistance. As such, I build an instrument for various specifications of foreign aid—
totforaidinstr, usodainstr, oecdaidinstr, and usmilaidinstr—following the methodology described
by Frot and Perrotta, and my model is therefore a two-stage least squares (2SLS) regression,
rather than an ordinary least squares (OLS) regression.
In order to calculate the instrument to be used in the second stage of the 2SLS model, the
following equation must be estimated:
σ, the normalized aid share, is the difference between the share of the donor’s total aid budget
allotted to the recipient and the inverse of the total number of countries that received assistance
from the donor at least once before the given year t. The variable κ refers to the ordinal number
year in the donor’s history of providing assistance at which point the recipient began getting aid
from the donor. τ signifies the difference between the year in question t and the year in which
the donor-recipient relationship was established. The OLS fitted values of the above equation
are used to find ̂ . This value is then multiplied by the donor country’s total aid budget for
the given year to find the predicted aid quantity. As shown in Appendix V, the correlation
between predicted aid quantities and the original data for the independent variables is statistically
significant, which empirically shows that they serve as good instruments for various
classifications of foreign aid used in this research.
The control variables used in my main model are GDP per capita (gdppercapita),
inflation (inflation), expenditure by the central government (govexp), the percentage of GDP that
is made up by natural resource rents (natresgdp), the existence of sovereign wealth fund
(sovwealthfund), ethno-linguistic fractionalization (elfrac), whether the recipient country’s legal
system originates from Great Britain (britleg), natural disasters (natdisasters), the gross primary

16
school enrollment ratio (primeduc), the gross secondary school enrollment ratio (educ), and the
recipient country’s level of democracy (dem). GDP per capita is included as a control, as
previous literature has suggested that wealth tends to be negatively correlated with corruption.35
Inflation is used as a proxy for the recipient country’s macroeconomic policy distortions, which
would increase corruption as they become more severe, much the way that black market
premium would. Following Svensson’s argument, central government outlay is utilized as a
control variable since an increase in the government’s expenditure likely would intensify
individuals’ and interest groups’ rent-seeking behavior to influence how the money is spent.36
As articulated by Sachs and Warner, natural resource rents, defined in this case as the sum of
rents from oil, natural gas, coal, mineral, and forest, likely negatively affect the level of
corruption in a country.37
Sovereign wealth fund, like natural resource rents and foreign aid, is
another source of revenue for the government that does not depend on taxation, with similar
implications for corruption. However, it may also be the case that having a professionally
managed sovereign wealth fund, free from political tampering, leads to a more transparent
accounting of the country’s revenues, preventing natural resource rents from becoming a source
of corruption. As discussed in Section II, the previous literature has pointed to long-run
historical factors as influencing a country’s level of corruption, so ethno-linguistic
fractionalization and British legal origins, which were identified in past studies as such causes,38
are included to control for the fact that corruption tends to be persistent and not easily subject to
short-term changes in one variable. Natural disasters are included in the model since a country
suffering a catastrophe is more likely to see a large increase in the inflow of aid. Democracy and
35
Mauro 1995. Tanzi and Davoodi 2000. 36
Svensson 2000. 37
Jeffrey Sachs and Andrew Warner, “The Big Push, Natural Resource Booms and Growth,” Journal of Development Economics 59.1 (1999). 38
For example, Treisman 2000 and Okada and Samreth 2012.
17
different levels of education are used as control variables in the model, as there is evidence from
previous literature suggesting that higher levels of democracy and education may lead to lower
levels of corruption over time.39
The second stage of the 2SLS, which serves as the main model of this paper, is as
follows:
The variable totforaidinstr is substituted with oecdaidinstr, usodainstr, ioodainstr, and
usmilaidinstr when testing the effects of the various subcategories of foreign aid. All of the
regressions are done with robust standard errors to adjust for any potential heteroskedasticity
issues. Later on, when I conduct sensitivity analysis, I modify the right-hand side of the
equation, such as by adding more control variables.
IV. Description of the Data
My dataset spans 144 countries, located in all six inhabited continents, over a sixteen-
year period, from 1995 to 2010. Since the study focuses on the impact that receiving foreign aid
has on that state’s corruption, the countries in the dataset were selected on the basis of whether
they experienced an inflow of official assistance at any point during the sixteen-year time period.
As a result, the countries, for the most part, are ones generally considered either developing or
middle-income. Some foreign aid-receiving countries, such as East Timor, Kosovo, or
39
See Ivar Kolstad and Arne Wiig, “Does Democracy Reduce Corruption?” CMI Working Paper (2011), Michael Rock, “Corruption and Democracy,” DESA Working Paper (2007), and Shrabani Saha and Neil Campbell, “Studies of the Effect of Democracy on Corruption” (2007) for a review of the literature on the relationship between democracy and corruption. See H.Y. Cheung and A.W.H. Chan, “Corruption across Countries: Impacts from Education and Cultural Dimensions,” Social Science Journal 45:2 (2008) and Douglas Beets, “Understanding the Demand-Side Issues of International Corruption,” Journal of Business Ethics 57(2005) for the impact of education on corruption.
18
Montenegro, are not included in the dataset, as they existed as separate states for only a part of
the time period considered, while several others were excluded for lack of data. Hong Kong,
which has never been an independent country, was included in the dataset, as there was sufficient
data to include it as a separate observation. Overall, the fact that 144 countries are in this study
makes it a larger dataset than those utilized in the four previous papers on this subject.
The dependent variable of the model is corruption, as reported in the Corruption
Perceptions Index, which has been published every year by Transparency International since
1995. It is a compilation of several different indices of how corrupt a country is seen to be, as
measured by various private and public sector organizations, and a country must have a rating
from at least three different data sources in order to be placed onto the Corruption Perceptions
Index. The scores run from 0 to 10, although I multiply all of the scores by 10 so that they range
from 0 to 100. The Corruption Perceptions Index has grown in scope and sophistication since its
initial publication in 1995, which ranked 41 countries on the basis of seven surveys. The 2010
version of the Corruption Perceptions Index, which is the most recent one used for this study,
included 178 countries and territories and was built from thirteen different sources of data. The
Corruption Perceptions Index does not measure the actual occurrence of corruption in a country,
which is a much more difficult—and perhaps impossible—task, but it rather rates corruption in
the public sector of a country as perceived by business people and country experts on a scale
from 0 to 10. Despite this drawback, the Index is generally considered to be one of the most
reliable and useful means to compare levels of corruption between countries.
The main independent variables of interest are total foreign aid and its components, the
data for most of which comes from the World Bank. Totforaid figures come from World Bank’s
World Development Indicators (WDI). Aid consists of grants and loans with a grant component

19
of at least 25% that are disbursed for the economic development and welfare of the recipient
countries and territories. The data for assistance from the DAC (oecdoda), which is a group of
25 main bilateral donor countries that meet regularly to discuss effective aid strategies, and for
usoda also come from the WDI. Iooda is an agglomeration of loans and credits from the World
Bank, regional development banks, and other multilateral and intergovernmental sources, and net
official flows from various United Nations agencies. The United Nations agencies, the funding
from which is included in the figure for multilateral aid, are the International Fund for
Agricultural Development (IAFD), the Joint United Nations Programme on HIV/AIDS
(UNAIDS), the United Nations Development Programme (UNDP), the United Nations
Population Fund (UNFPA), the United Nations Refugee Agency (UNHCR), the United Nations
Children’s Fund (UNICEF), the United Nations Regular Programme of Technical Assistance
(UNTA), and the World Food Programme (WFP). All of the foreign aid figures are in current
dollars, and in some cases, the numbers are negative to reflect a country having to pay back more
of its outstanding loans than it receives as assistance that year.
Another independent variable of interest in this study is usmilaid. Although the United
States is not the only country in the world that provides such assistance, it is the only one that is
even remotely transparent about how much it spends to help another country militarily.
Therefore, the results of the regression using this figure will give some, but not a full, idea of the
impact that military assistance has on corruption. The United States government classifies all of
the assistance that it provides as either economic or military aid. The data, which shows the
figures in current dollars, comes from the United States Agency for International Development
(USAID) website.

20
With regards to the control variables, the data for gdppercapita, inflation, govexp,
natresgdp, primeduc, and educ are taken from the World Bank’s WDI. Whether a country has a
sovereign wealth fund follows the listing provided by the Sovereign Wealth Fund Institute, while
the ethno-linguistic fractionalization data is taken from Romain Wacziarg, Klaus Desmet, and
Ignacio Ortuño-Ortin (2009).40
The data on the origins of legal systems comes from the work
done by Rafael La Porta (1999, 2003, and 2008), who classifies them into those of British,
French, Socialist, and Scandinavian origins.41
For democracy, I utilize the data, with scores
running from 0 to 6, given by the Polity IV project. The data for natdisasters comes from the
International Disaster Database (EM-DAT), which is compiled by the Belgium-based Center for
Research on the Epidemiology of Disasters. Natural disasters include a wide range of events,
including droughts, earthquakes, extreme temperatures, wildfires, floods, and epidemics.
As discussed in the previous section, simply using the given data for foreign aid will
likely have endogeneity issues, so instruments are constructed to take the place of official
bilateral and multilateral assistance figures. The data used to run the first stage of the two-stage
regression come from WDI. The instruments are calculated according to the specifications
provided by Frot and Perrotta (2010).
Appendix I lists all of the variables, their descriptions, and their sources. Overall, the
data is taken from highly reliable sources, and therefore do not present a challenge to the
legitimacy of the results. Appendix II displays the summary statistics of the dependent,
independent, and control variables. There are no real surprises here. The range for total foreign
40
Romain Wacziarg, Klaus Desmet, and Ignacio Ortuño-Ortin, “The Political Economy of Linguistic Cleavages,” Journal of Development Economics 97.2 (2012). 41
La Porta, Lopez-de-Silanes, Shleifer, and Vishny 1999. Simeon Djankov, Rafael La Porta, Florencio Lopez-de-Silanes, and Andrei Shleifer, “Courts: The Lex Mundi Project,” Quarterly Journal of Economics 118.2 (2003). Rafael La Porta, Florencio Lopez-de-Silanes, and Andrei Shleifer, “The Economic Consequences of Legal Origins,” Journal of Economic Literature 46.2 (2008).

21
aid is very big, which shows that the data includes countries that receive a lot of assistance from
abroad and those that receive little. As discussed above, some of the numbers are negative, since
a country may have had to make a larger payment for a loan in a given year than the aid that it
obtains that year. In addition, the numbers for the foreign aid instrument include negative
figures since the predicted aid quantity is based on normalized aid shares. The maximum values
for educ and primeduc are greater than 100, since gross enrollment figures, which are used as
measures of the recipient country’s levels of education, include the total number of those in
school regardless of age, expressed as a percentage of those belonging to the appropriate official
school age group. Another notable factor is that although the figures for foreign aid exist for all
2,304 observations, such is not the case for most other variables. The Corruption Perceptions
Index does not have a score for every country in this study for every year, limiting the total
number of observations for that variable to 1,484. However, this is still a large number of
observations, which should allow for strong results. Appendix III shows the correlation matrix
between the variables discussed in this section. It appears that there is no serious
multicollinearity issue among the independent variables in my data, with the highest level of
correlation being -0.6225 between secondary education and the Africa dummy variable.
V. Main Results
A. OLS Regression Results
The results of the OLS regressions, with robust standard errors, using the original aid data
as the independent variables, are shown in Appendix IV. According to these, there is a serious
negative correlation between total foreign aid and corruption. The impact of each dollar in
foreign assistance at first glance seems to have only a small effect on corruption; after all, the

22
coefficient is -2.41E-9. However, in terms that are more realistic in the world of foreign aid, this
translates to a decrease in the Corruption Perceptions Index score by nearly 2.41 for every billion
dollars in assistance. This suggests that, in fact, foreign aid does have a tremendous negative
impact on the recipient country’s level of public sector corruption. All of the control variables in
this specification are statistically significant. Following the predictions of the literature, greater
wealth in the recipient country’s economy leads to lower levels of corruption, as does having
strong legal institutions based on English common law. Natural resource rents, macroeconomic
policy distortions, ethno-linguistic fractionalization, and an increase in government expenditure
lead to worse levels of corruption, as is expected. The negative relationship between natural
disasters and corruption seems to suggest that as more aid money flows in in the aftermath of
large-scale catastrophes, the struggle for control of the additional resources and how they are
spent fosters more corruption. As discussed in Section III, having a sovereign wealth fund can
cut both ways in terms of corruption, and these results suggest that the positive effect of
sovereign wealth funds on corruption outweighs the negative impact. A calculation of the
economic significance of each of the independent variables, done by multiplying the coefficient
and the standard deviation together, shows that foreign aid is not the strongest influence on
corruption. GDP per capita has the greatest impact on corruption, followed by natural resource
rents and common law-based legal systems. However, foreign aid nevertheless has stronger
effect on corruption than sovereign wealth fund, inflation, ethno-linguistic fractionalization,
central government expenditure, and natural disasters.
The OLS regressions for the four subcategories of aid present interesting results. The
specifications using assistance from multilateral sources and from the DAC countries yield
outcomes with strong statistical significance, and the signs point in the predicted directions.

23
Similarly, all of the control variables are statistically significant and have the same signs as they
did in the specification using total foreign aid. The coefficient for multilateral aid, -1.54E-9, is
less negative than the coefficient for bilateral assistance from the DAC countries, which is -
2.27E-9. This could be a consequence of how stringent anti-corruption conditions attached to the
aid are. It may be the case that multilateral sources, which are designed to disburse funding on
the basis of the recipient’s needs and merits, evaluate the target country through a more
technocratic lens. It is likely that they place a greater emphasis on corruption reduction efforts as
part of broader economic development, without regards to political, strategic, or other
calculations.42
Donor countries, on the other hand, are bound to care more about bilateral
relations, even if their primary objective is the effective and sustainable growth of the recipient
country. It is more likely for political and strategic concerns to enter their thinking than that of
multilateral institutions, and given those constraints, donor countries may be less willing to
demand anti-corruption efforts if they believe that such pressure could harm bilateral relations.43
Comparing the economic significance of the variables, foreign aid is the fifth strongest influence
out of nine variables on the recipient country’s corruption in the OECD aid specification, but it
has the second smallest impact on corruption in the multilateral assistance regression, ahead of
central government expenditure.
Assistance from the United States, both economic and military, is not shown to have
statistically significant effects on the recipient country’s corruption. In fact, in the specification
using foreign aid from the United States, usoda is the only independent variable that is not
statistically significant. The coefficients of all of the variables in that regression show the same
signs as in the previously mentioned regressions. While not statistically significant, usoda has a
42
Okada and Samreth 2012. 43
Alesina and Dollar 2000. Alesina and Weder 2002. Okada and Samreth 2012.

24
smaller coefficient than oecdoda or iooda, suggesting that the United States takes corruption
seriously as an important component of economic development efforts. This distaste for and
struggle against corruption makes sense on one hand. On the other hand, it is somewhat
surprising since the long laundry list of strategic priorities and foreign policy concerns that the
United States has, which may conflict with the desire to fight corruption, likely influences its aid
policies and decisions. Foreign aid, in comparison with the economic significance of the control
variables, appears to have the weakest influence on corruption. Military aid from the United
States has a statistically insignificant impact on corruption, but what is quite surprising is that the
sign is positive, meaning that an additional billion dollars of military assistance leads to an
increase in the Corruption Perceptions Index score by nearly 0.7. Without statistical
significance, there is not much confidence in what effect military aid actually has on corruption,
and it is quite unexpected that military aid, which is provided primarily for strategic reasons,
would have a less negative influence on corruption than economic assistance, which is driven by
considerations for growth and development. One possible explanation is that the United States,
which sees itself as the model of civil-military relations, is wary of the aid that it gives being
gobbled up by unaccountable, politically minded military leadership in other countries, and
places stringent conditions on its assistance packages. However, this is difficult to state with any
amount of certainty simply based on these results. The economic significance of military aid is
also weak, ranking it at the bottom of the nine independent variables used in this specification.
B. 2SLS Regression Results
However, as discussed in Section II, using OLS presents an endogeneity issue. This
prevents the results from being able to be interpreted with regards to the direction of the causal

25
arrow. In order to be able to state with certainty that foreign aid has an impact on corruption,
regressions have to be run using instrumental variables to take the place of the independent
variables. As such, the main model of my paper utilizes a two-stage least squares regressions
(2SLS) method. The results of the second stages of 2SLS regressions with robust standard
errors, using totforaidinstr, usodainstr, oecdaidinstr, and usmilaidinstr as the main independent
variables of interest, are reported in Appendix VI.
In the first specification of this model, total foreign aid is shown to have a statistically
significant effect on corruption. The coefficient is positive, which is surprising given that three
of the four previous empirical studies on this subject showed a negative influence of foreign
assistance on corruption. Although the two models are different, the results of my regression and
that done by Okada and Samreth agree, in that foreign aid improves the corruption in the
recipient country.44
My results indicate that an increase in foreign aid by 100 million dollars
leads to a rise in the Corruption Perceptions Index score of close to 2.40. The sign in this
regression is the opposite of what was obtained in the OLS, and this difference is strange but
explainable. The OLS regression indicates a correlation between foreign aid and corruption, but
the 2SLS regression determines causality running from foreign assistance to corruption.
Correlation can be affected by the donor’s decision-making process on to which country aid will
be disbursed, among other factors. If we consider, based on previous works, that the decision to
award aid is determined not only by the recipient’s needs, but also by the donor’s strategic and
political calculations,45
perhaps the level of corruption is a secondary consideration and a corrupt
regime can receive a lot of aid. This would explain why the correlation is negative. The 2SLS
regression shows, however, that the aid, once received, improves public sector corruption in the
44
Okada and Samreth 2012. 45
Alesina and Dollar 2000. Alesina and Weder 2002. Okada and Samreth 2012.

26
recipient country. Given the pessimistic predictions of the literature, the best explanation for this
may be that the aid is conditioned on an improvement in the corruption situation or is provided
specifically for anti-corruption programs. Although case studies have shown these efforts to not
have had the desired effects,46
it appears that on the whole, attempts to combat corruption with
the help of the international community are working. In addition, the results make sense given
that the time period for which the data has been gathered starts in 1995, right around the time
when policymakers and academics began paying close attention to corruption and the link
between good governance and successful economic growth. As such, it is likely that much of the
foreign assistance rendered has been conditioned on an improvement in corruption.
Similar to the OLS regressions, most of the control variables are statistically significant
and point in the expected directions. This suggests that for most of the control variables, the
explanations that I gave for the OLS results still hold true. Interestingly, inflation, which serves
as a proxy for macroeconomic policy distortions, is shown to have a positive sign. Nevertheless,
it is statistically insignificant, so it likely does not play a major role in explaining the variances in
corruption across the sample of countries in the dataset. Compared to most of the control
variables, total foreign aid appears to have a small impact on corruption. The economic
significance numbers show that total foreign aid has a greater effect on corruption than only
inflation among the nine total independent variables in the regression. GDP per capita, natural
resource rents, and British legal origins continue to have particularly strong effects on
corruption, with greater national wealth and having a legal system based on common law
decreasing corruption, while greater natural resource rents makes it worse.
The results of the regression using oecdaidinstr show that foreign aid given by the 25
countries in the DAC leads to an improvement in the recipient country’s corruption. According
46
See Knack 2001 for a discussion.

27
to the regression table, an increase in assistance by 100 million dollars leads to an ascent in the
Corruption Perceptions Index score by approximately 3.37. This is a significant progress in
fighting corruption, and the effects are greater than when we consider the influx of foreign aid
from all sources. The results are somewhat unexpected, since Okada and Samreth found that
foreign aid, when disaggregated according to donors, all of whom are members of the DAC, has
a statistically insignificant, albeit positive, effect on corruption.47
In any case, the same
explanations that I gave above for the positive coefficient of total foreign aid still holds true. If
anything, the fact that the coefficient for this independent variable is greater than the one for total
foreign aid shows that the DAC countries either give more to anti-corruption programs or tie
recipients into more stringent corruption-related conditions as part of the aid package. As is the
case with total foreign aid, the only statistically insignificant independent variable is inflation,
although in this regression, the sign points in the expected, negative direction. An analysis of the
economic significance of the variables shows that much like total foreign aid, aid from the DAC
countries has a weak effect on corruption compared to other factors. Only inflation has a smaller
impact on corruption than assistance. The three strongest factors influencing corruption continue
to be GDP per capita, natural resource rents, and British legal origins.
The effect of multilateral aid on corruption in the 2SLS regression is quite unexpected.
Ioodainstr is shown to have a statistically significant impact on recipient countries’ corruption.
The control variables also all have a statistically significant influence on corruption, with the
exception of central government outlay, and all of them, again except for government spending,
point in the predicted direction. Compared to other variables in the specification, multilateral aid
has a small impact on corruption, as its economic significance is smaller than that of any other
independent variable besides government expenditure. However, when seen in absolute terms,
47
Okada and Samreth 2012.
28
the coefficient of the multilateral aid variable indicates that every 100 million dollar increase in
multilateral aid leads to a decrease in the Corruption Perceptions Index score by 0.535. While
previous literature has discussed the propensity of aid in general to lead to corruption,48
there is
no reason to suspect that assistance from international financial institutions and United Nations
agencies should have a more negative effect on corruption, especially when total foreign aid is
demonstrated to have a positive influence.49
If anything, for the reasons cited in the previous
discussion on my OLS regressions and according to Okada and Samreth’s research, multilateral
aid should have a more positive effect on corruption than total aid has.
One possible explanation for this baffling result is that what has become worse with
increased aid is not corruption, but the perception of corruption. As mentioned previously, the
Corruption Perception Index is not an objective measure of corruption, such as how much money
is spent on bribery or how often such interactions take place, but is rather an indicator of how
bad the public sector corruption that country is perceived to be by outsiders. If international
financial institutions and United Nations agencies send out more advisers and technocrats to the
recipient country along with more assistance money, it is possible that they see more corruption
and therefore their perception of the country’s corruption worsens. This may happen even if the
actual level of corruption in the recipient country is either the same or in fact better than before
receiving the money. However, considering that the DAC countries likely also monitor their
overseas assistance programs, it is not clear that the above explanation is necessarily correct.
Given this puzzling result, further research to uncover the causes of this will be necessary in the
future.
48
Knack 2001. Svensson 2000. Alesina and Weder 2002. 49
Okada and Samreth 2012.

29
Another specification of the regression demonstrates that foreign aid from the United
States has a positive, albeit statistically insignificant, effect on corruption. The lack of statistical
significance combined with positive coefficient is consistent with the results reported by Okada
and Samreth in their 2012 study.50
As was discussed previously with regards to the OLS
regression results, it is not surprising that the United States, a major donor, takes anti-corruption
efforts seriously in its aid policy, which explains why the coefficient is positive. However, the
other aspect of the United States’ decision-making process—a calculation of strategic and
political interests—may also be present, as the coefficient of usodainstr is smaller than those of
totforaidinstr and oecdaidinstr. In fact, an increase in aid by 100 million dollars leads to a rise in
the Corruption Perceptions Index score by only 0.76, in comparison with 2.40 and 3.37,
respectively. This may indicate that concerns other than the recipient’s needs have a greater
impact on the United States’ decision to award aid to a particular country than on the decision
made by other DAC countries, as stricter anti-corruption conditions would likely lead to more
decreased levels of corruption. In this specification of the model, every control variable is
statistically significant, and its sign points in the predicted direction. With regards to economic
significance, foreign aid from the United States has the weakest impact on corruption among all
nine independent variables, with GDP per capita and natural resource rents having the strongest
influences.
The final subcategory of aid to be tested with the main model is the impact of American
military aid on corruption. Unlike those for the OLS regression, which were surprising, the
results here are expected. The sign is negative, and consequently, the effect on corruption is
more negative than the influence of total foreign aid, American economic assistance, or aid
disbursed by the DAC countries. When comparing the coefficients, military assistance from the
50
Ibid.

30
United States has a more positive impact on corruption than aid from multilateral sources, but as
discussed above, the results for that regression are perplexing. In this regression, the results
show that a 1 billion dollar increase in U.S. military aid makes the recipient country’s score on
the Corruption Perceptions Index worse by 0.515. Since military aid is given primarily for
strategic reasons, rather than a concern for the target country’s economic well-being or
institutional development, it is no surprise that it could lead to greater corruption. However, it is
difficult to say with any real certainty what effect military assistance has, as the results are far
from being statistically significant. All of the control variables, on the other hand, are
statistically significant, and they point in the hypothesized direction. In addition to being
statistically insignificant, American military aid also has a relatively weak influence on the
recipient country’s public sector corruption. Its value for economic significance is the lowest
among all nine right-hand side variables, with GDP per capita and natural resource rents again
having the greatest impact on corruption.
Overall, the 2SLS regressions, the results of which indicate that total foreign aid has a
positive impact on corruption while various components of it have mixed influences, explain the
effect of foreign aid on corruption well. They establish a causal linkage from assistance to
corruption that the OLS regressions, presented earlier in this section, cannot. In addition, the
regressions, utilizing eight control variables to account for the economic characteristics of the
recipient and other determinants of corruption, allow the model to present more convincing
results. While the R-squared number is not particularly important in 2SLS regressions, the
regression output nonetheless reports that the models for American military aid, American
economic assistance, and aid from multilateral sources capture between 58% and 60% of the
variances in the data. The R-squared figures for the total foreign aid and the DAC assistance

31
specifications are not given. It is clear that the 2SLS model utilized for this study holds strong
explanatory powers, although some of the results are unexpected.
VI. Sensitivity Analysis
With the primary results in hand, as reported in Section V, I run a number of regressions
for sensitivity analysis, tweaking the setup of the model with various changes to the right-hand
side to see how robust the results are. The results are discussed below and reported in Appendix
VII.
A. Regional Dummies
I first add regional dummies to the right-hand side. Given that corruption is persistent
and values are difficult to change in the short-term simply by adjusting policies, it is entirely
possible that I am not accounting for important historical and cultural factors not captured by
britleg and elfrac. In order to account for possible omitted variable bias, I insert regional dummy
variables in all specifications of the second stage of the 2SLS regressions. The dummies are
labeled americas, asiapac, africa, and eeuropecasia to signify the recipient country’s location in
the Americas, the Asia-Pacific, Sub-Saharan Africa, and Eastern Europe and Central Asia. Only
the countries from the Middle East and North Africa are not labeled with a dummy variable. I
use the same labels and classify the countries the same way as Transparency International did for
the Corruption Perceptions Index.
I start by adding the dummy variable for Africa, which accounts for 47 of the 144
countries in the sample, to the specification. The signs of all the other independent variables
point in the same direction as before, and all independent variable except for inflation are

32
statistically significant. Africa is positive, indicating that the specific conditions of the countries
in the continent should lead to an improvement in the corruption situation. However, it is
statistically insignificant, which makes it difficult to say that this is indeed the case.
When I add americas to the specification of the model that includes africa, both are
positive and tantalizingly close to statistical significance. All other independent variables, with
the exception of inflation, remain statistically significant, showing that the two regional dummies
take away from the explanatory power of the other independent variables. However, as a
calculation of the respective economic significances shows, total foreign aid has a smaller impact
on corruption than the two regional dummies. This indicates that historical and cultural factors
associated with those regions of the world go a longer way in explaining the improvement in
corruption among the countries in the sample than short-term changes in foreign aid.
When asiapac is added to the previously discussed specification, africa and asiapac are
statistically significant and negative, while americas is statistically insignificant and positive.
The other independent variables do not show much change from before. It is unclear why the
signs flip for africa, but it appears in this specification that being located in Africa or the Asia-
Pacific region is associated with factors conducive to greater corruption. Total foreign aid is still
shown to have a positive and statistically significant impact on corruption, but its economic
significance, or its relative impact on dependent variable, is weaker than those of africa and
asiapac.
I next put all four regional dummies—africa, asiapac, americas, and eeuropecasia—into
the model. Although the signs of the nine original independent variables point in the same
direction as in previous specifications, the confidence in their explanatory power suffers. In
addition to inflation, elfrac and totforaidinstr are no longer statistically significant. As such,

33
although the foreign aid variable is positive, it is difficult to say with certainty that a larger
amount of it leads to a less corrupt public sector in the recipient countries. On the other hand, all
four regional dummies are statistically significant and negative. As discussed in previous
paragraphs, this result captures the long-running factors not fully encapsulated in my original
model that continue to exert strong influence on the level of corruption in a country. Given
corruption’s persistence, it is no surprise that regional characteristics pose a greater impact on the
dependent variable than foreign aid does.
Using all four regional dummies with subcomponents of foreign aid to replace total
foreign aid leads to mostly similar, but some different, results. In every case, all of the non-
regional control variables point in the expected directions, although ethno-linguistic
fractionalization loses statistical significance in the American economic aid and American
military assistance regressions. Government expenditure and inflation are not statistically
significant in the regression using bilateral aid from the DAC countries, while inflation is
statistically insignificant in the specification that uses multilateral assistance. Multilateral aid
continues to present negative and statistically significant influence on corruption, while
assistance from the DAC countries maintains positive, albeit statistically insignificant, impact on
corruption. Much like before, American military aid has a negative but statistically insignificant
effect on the recipient country’s level of corruption.
What is particularly interesting is the result of the usodainstr regression. Usodainstr is
shown to be statistically significant and negative, which it was not earlier. It appears that when
regional characteristics are taken into account, American economic assistance breeds greater
corruption, with an increase of 100 million dollars leading to a fall in the Corruption Perceptions
Index score by approximately 2.21. Although it is entirely possible for the coefficient to have a

34
negative sign, as mentioned in previous sections, it is unclear why the sign flips. It is also not
certain why economic assistance—which considers the recipient’s development needs, including
corruption problems—demonstrates a more convincing negative impact on the level of
corruption than military aid—which is given for strategic reasons—does. Despite these
questions, what makes this result compelling is that this specification captures a fuller picture of
the determinants of corruption.
B. Education Variables
For the next step in my sensitivity analysis, I add variables for education into the main
model. As discussed in Section III, higher levels of education should generate lower levels of
corruption over time. When I add primary education to the model, it is not shown to be
statistically significant in any of the five original specifications, although it is positive. This
suggests that more people receiving primary education may result in lower corruption over time,
although it is difficult to state with great confidence. In addition, the addition of primary
education leads to foreign aid variables becoming statistically insignificant in every case except
for bilateral aid from the DAC countries. The signs of the aid variables point in the expected
directions as before, so even when the country’s level of primary education is taken into account,
the positive or negative effect of foreign aid on corruption appears to be largely consistent with
previous results. In these specifications, most of the other control variables maintain their
statistical significance.
The inclusion of secondary education into the main model as a control variable also leads
to interesting results. Secondary education is statistically significant in specifications using
American economic aid, assistance from multilateral sources, and military aid from the United

35
States. In addition, the sign for this variable is positive in every case except for the regression
using total foreign aid. The results suggest that secondary education most likely has a strong and
positive influence on the level of corruption, and the effect of secondary education is far more
pronounced that that of primary education. Considering that students learn to think more
critically and come into contact with more complex subjects during their secondary school years,
it is entirely plausible that higher enrollment in secondary education would have such an effect
on combatting corruption. While the signs point in the same directions as previously, the foreign
aid variables lose statistical significance in all five regressions. It seems that when secondary
education is taken into account, the increase in foreign aid has a much less noticeable influence
on the recipient’s level of corruption.
Especially since foreign aid was shown in my original results to have positive results in
many of the five specifications, it is worth exploring whether education is a channel through
which assistance from abroad accomplishes this. After all, having a better educated population is
often seen as a means to achieving long-term economic development, and as a result, foreign aid
programs often target education. In order to test out this hypothesis, I create interaction terms in
the model by multiplying the secondary education variables with the foreign aid variables and
add them to the main model. In the cases of total foreign aid, American economic assistance,
and bilateral aid from the DAC countries, the positive role of foreign assistance is shown to be
conditional on secondary education. The statistically significant and positive results in these
regressions suggest that a major way by which foreign aid improves corruption is by raising the
level of secondary education in the recipient country. This confirms the findings of previous
studies in the literature, which argues that better educated countries have lower levels of

36
corruption.51
While it is not surprising that the interaction term is statistically insignificant in the
American military aid regression, it is odd that that is also the case with multilateral funding, as
various United Nations agencies and international financial institutions provide a lot of resources
for recipient countries to improve education as part of their broader economic development
goals, of which lower levels of corruption is often a part.
C. Democracy Variables
While the model so far has accounted for various economic, historical, and social
conditions influencing corruption, it has not included political variables that may also affect the
level of public sector corruption. As such, I add Polity IV’s measure for a country’s level of
democracy. As mentioned in Section III, previous studies have suggested, albeit not yet
definitively, that more democratic a country, lower its level of corruption will be.52
In all five
specifications of the main model, democracy is statistically significant and positive, confirming
the results of the existing literature. The foreign aid variables maintain the same signs, and
whether they are statistically significant stays the same, although assistance from the United
States rises substantially in statistical significance. In most cases, the control variables keep the
same signs as before and their statistical significance. What is notable is that not only is
democracy statistically significant, but it is also economically significant in some cases. In the
regressions with total foreign aid and with bilateral aid from the DAC countries, it is shown to
have the second biggest impact on corruption out of the ten independent variables used.
As is the case with education, one possible route by which foreign aid influences
corruption is by affecting the target country’s level of democracy. This is not only the case with
51
Cheung and Chan 2008. Beets 2005. 52
Kolstad and Wiig 2011. Rock 2007. Saha and Campbell 2007.

37
the United States, which funds pro-democracy programs through channels like the United States
Agency for International Development (USAID) and the National Endowment for Democracy
(NED), but also with many of the countries that are members of the DAC. On the other hand,
some of the other bilateral donor countries and multilateral sources of funding tend to hold a
more agnostic view on political systems, and democracy therefore would not be a strong means
by which foreign aid would have a positive impact on corruption.
I test out this hypothesis by building interaction terms using the democracy scores and the
instrumental variables for foreign aid. The interaction term turns out to be statistically
insignificant in three of the five regressions. In addition, the regression using American military
aid yields statistically significant, but negative, results for the interaction term. Although these
results are not necessarily unexpected, the surprising finding comes from the specification that
uses economic aid from the United States. It turns out that the interaction between assistance
and democracy leads to a negative influence on corruption in this case as well. Although the
finding for military aid could perhaps be predicted, given the importance of strategic
considerations for the funding, the result for economic aid is a bit startling considering that the
United States considers pro-democracy programs to be an important aspect of its overseas aid
policy. There are several possible explanations for this result. It may be the case that, the United
States’ support for greater democracy abroad is breeding the creation of more interest groups that
fight harder for extra aid revenue, leading to corruption. It is also possible that contrary to its
public statements and popular perception, the United States primarily distributes foreign aid for
reasons other than promoting democracy and for programs besides those that foster greater levels
of participatory politics. If this is true, the aid money may be going to non-democratic regimes
with or without development needs, or towards a project that raises economic growth while
38
negatively affecting the recipient’s level of democracy. This ties in with previous discussion on
the role that strategic and political calculations may play in the United States’ decision-making
process to disburse aid. In addition, as is always possible, the results could be driven by outliers.
It is difficult to say with certainty which of these potential explanations best describes what is
happening in this regression.
D. Monterrey Consensus
In 2002, the United Nations Conference on Financing for Development met in
Monterrey, Mexico. The resulting Monterrey Consensus, agreed to by numerous governments,
international institutions, and other stakeholders in development, outlined goals for effective
development aid and policies. One of the points in the Monterrey Consensus was the importance
of fighting corruption.53
The next series of sensitivity analyses that I undertake is to see if
foreign aid has been more effective in combatting corruption since that time. I compare the
results of regressions using data from 2002 and before with those using data from 2003 and after
in four—total foreign aid, American economic assistance, bilateral aid from the DAC countries,
and funding from multilateral sources—of the five main model specifications. The regressions
for 2002 and before show the foreign aid variables to be statistically insignificant. In fact, most
of the control variables are also not significant in all models, except for the specification that
uses multilateral aid. The lack of convincing results for these specifications may be driven by
the scarcity of corruption scores from that part of the sample, as the Corruption Perceptions
Index covered fewer countries at that time. The foreign aid variables in the 2003 and after
regressions are also statistically insignificant. Although they are not statistically significant, if
we compare the coefficients of the foreign assistance variables, total foreign aid goes from -
53
“Monterrey Consensus of the International Conference on Financing for Development,” United Nations (2002).

39
5.48E-8 to 7.16E-9, American assistance from 9.90E-8 to -5.17E-9, funding from the DAC
countries from -5.88E-8 to 1.11E-8, and multilateral aid from 7.78E-9 to -2.74E-9. The
conflicting changes in the coefficient suggest that that the reforms agreed to at Monterrey have
not necessarily resulted in more effective anti-corruption efforts.
E. Paris Declaration
Another such milestone in the drive for better development aid policy was the 2005 Paris
High Level Forum on Aid Effectiveness, convened by the OECD, and the resulting Paris
Declaration. Built around the five pillars of ownership, alignment, harmonization, results, and
mutual accountability, the Paris Declaration set out to present a roadmap towards a more
successful use of aid for development purposes. Fighting corruption was one of the goals
outlined by the document.54
In order to find out whether the Paris Declaration has had the
desired effects with regards to corruption, I do the same thing that I did for the Monterrey
Consensus—divide the data into 2005 and before and 2006 and after—before running the main
model regressions on them. As is the case with Monterrey Consensus, the four foreign aid
variables are not statistically significant in any regression, making it difficult to state with
certainty whether the Paris Declaration has actually resulted in more effective disbursement of
aid for anti-corruption purposes. If we consider just the coefficients, without regard to statistical
significance, total aid’s coefficient changes from 9.05E-8 to 1.31E-9, while that for American aid
goes from 4.56E-8 to -2.41E-8. Aid from the DAC countries experiences a change in its
coefficient from 1.14E-7 to 2.21E-9, and assistance from multilateral sources shows an increase
in its coefficient from -3.30E-9 to -2.01E-9. Much like the Monterrey Consensus, the results are
54
“The Paris Declaration on Aid Effectiveness and the Accra Agenda for Action,” Organisation for Economic Co-operation and Development (2005, 2008).

40
inconclusive, but it appears that it is not the Paris Declaration that necessarily triggered the
positive effect of foreign aid on corruption seen in the findings of the main model.
F. Fixed Effects
Earlier, I ran regressions with regional dummy variables to account for characteristics
influencing corruption that may not be adequately captured by the model. Given the importance
of historical and cultural issues in the persistence of corruption, perhaps a better way to deal with
these and isolate country-specific factors is by running fixed effects regressions. I run fixed
effects regressions for all five specifications of the main model. In all five regressions, ethno-
linguistic fractionalization and the dummy for British legal origins are omitted due to
collinearity. The foreign aid variables are statistically significant in the cases of total assistance
and bilateral funding from the DAC countries. In both cases, the coefficients are positive,
showing that when individual country characteristics are taken into account, assistance leads to
less corruption. A calculation of economic significance shows that foreign aid is not a
particularly strong influence on corruption when considered in comparison to other independent
variables in the regressions. In addition, despite Svensson’s predictions,55
central government
expenditure is shown to have positive and statistically significant effects on corruption in both
specifications. The coefficient for multilateral aid is also positive, but statistically insignificant,
and the foreign aid variables for American economic assistance and American military aid are
both negative and statistically insignificant. Although the coefficients do not point in the same
directions as the original results, the lack of statistical significance seems to suggest in any case
that foreign aid from those sources do not have great effects on corruption in the recipient
countries.
55
Svensson 2000.

41
G. Previous Corruption
The final group of sensitivity analyses that I conduct deals with the persistence of
corruption. Throughout the paper, I have mentioned that corruption is a long-term phenomenon
that does not change easily over the short run. In order to account for this, I included ethno-
linguistic fractionalization and British legal origins, both identified as potentially important
determinants of corruption in the previous literature,56
as control variables. However, a more
direct way to handle the obstinacy of corruption may be to include the previous year’s corruption
level as a control variable on the right-hand side of the equation, instead of elfrac and britleg. In
all five regressions, the foreign aid variables lose statistical significance, and all of their
coefficients have negative signs, except for assistance from multilateral sources. The only two
control variables from the original model that maintain statistical significance in all five results
are GDP per capita and natural resource rents. As can be expected, the previous year’s level of
corruption is extremely correlated with the present year’s level. In fact, the confidence in the
correlation is so high that the t-score in any regression never falls below 57.09. It seems that the
previous year’s level of corruption is such a strong determinant of the current year’s level that it
takes away the significance of most of the other variables. The dominant role played by the
prevcorr variable is also indicated by the sharp rise in the R-squared values of the regressions.
In all five specifications, the inclusion of the previous year’s corruption helps to explain between
95% and 96% of the variation in the data. The results of these regressions confirm the notion
that corruption, as a long-term problem, does not improve very much in the short run. Perhaps
one hopeful indicator is that the coefficients for prevcorr are positive in all five cases, which
seems to suggest that corruption may improve over time on its own.
56
For example, Treisman 2000 and Okada and Samreth 2012.

42
VII. Conclusion
This study sought to establish a causal relationship between different types of foreign aid
and corruption. Despite the plethora of research on foreign assistance and corruption as separate
topics, there have been very few empirical papers examining the relationship between the two. I
hypothesized mainly a negative effect of foreign aid on corruption on the basis that most of the
limited research on this subject has either theorized or shown such consequences. My study,
utilizing the largest and most up-to-date set of data compiled and an instrumental variable
approach, suggests otherwise. The 2SLS regressions, using predicted aid quantities as
instruments for foreign aid variables, indicate that total foreign assistance fosters improved
corruption, while the effects of the different subcategories of aid are mixed. Additional
specifications of the model are shown in Section VI to lead to varied results.
This paper leaves plenty of room for future research. Some of the results are quite
puzzling, especially the statistically significant and negative finding for the role that multilateral
aid plays on the level of the recipient’s corruption. Some of the other findings do not square
perfectly with the predictions of the previous literature. More than one possible explanation is
given for some of the results, and further research is necessary to sort out what is right and what
is wrong. My work simply scratches the surface of this subject that has received relatively little
scholarly attention, and more research is needed to better understand the relationship between
foreign aid and corruption.
The results lead to important policy suggestions. One such implication is that while
countries should strive to develop their economies as part of fighting corruption, reliance on
natural resource rents as the primary development strategy is likely to be counterproductive in

43
that regard. As has already been widely researched, greater wealth is associated with lower
levels of corruption, while natural resource rents is tied to worse levels of corruption. The strong
impact shown by those two variables in many specifications of my model confirms the
predictions of the literature and the actual experiences of many countries. As such, countries
seeking to generate strong economic growth and combat corruption should look to more
productive means of generating wealth, rather than depending on natural resource rents.
However, the most important implication arising from this paper is that properly targeted,
foreign aid can be a useful tool for combatting corruption. As discussed throughout the paper, it
is likely, based on the literature, that monetary assistance, on its own, does not result in
decreased corruption. It is probable that the results observed in this study are consequences of
either funding directed at anti-corruption programs or aid being conditioned on the recipient
country cleaning up its public sector. Considering that my data is from 1995 to 2010, a period
when good governance became an important aspect of development thinking and policy, my
results appear to confirm this emphasis on fighting corruption. While foreign aid can be
successfully utilized to battle corruption, it is important that donors actually carry out their
commitments to focus on reducing corruption rather than simply issuing documents like the
Monterrey Consensus or the Paris Declaration. As my results from Section VI show, one way
that aid can effectively work on fighting corruption is by investing in secondary education. Even
though corruption remains a stubborn problem that cannot be erased overnight by changes in
policies and additional funding, the results of my regressions give evidence to the argument, and
also hope for the future, that a reduction in corruption can be achieved with the help of the
international community.
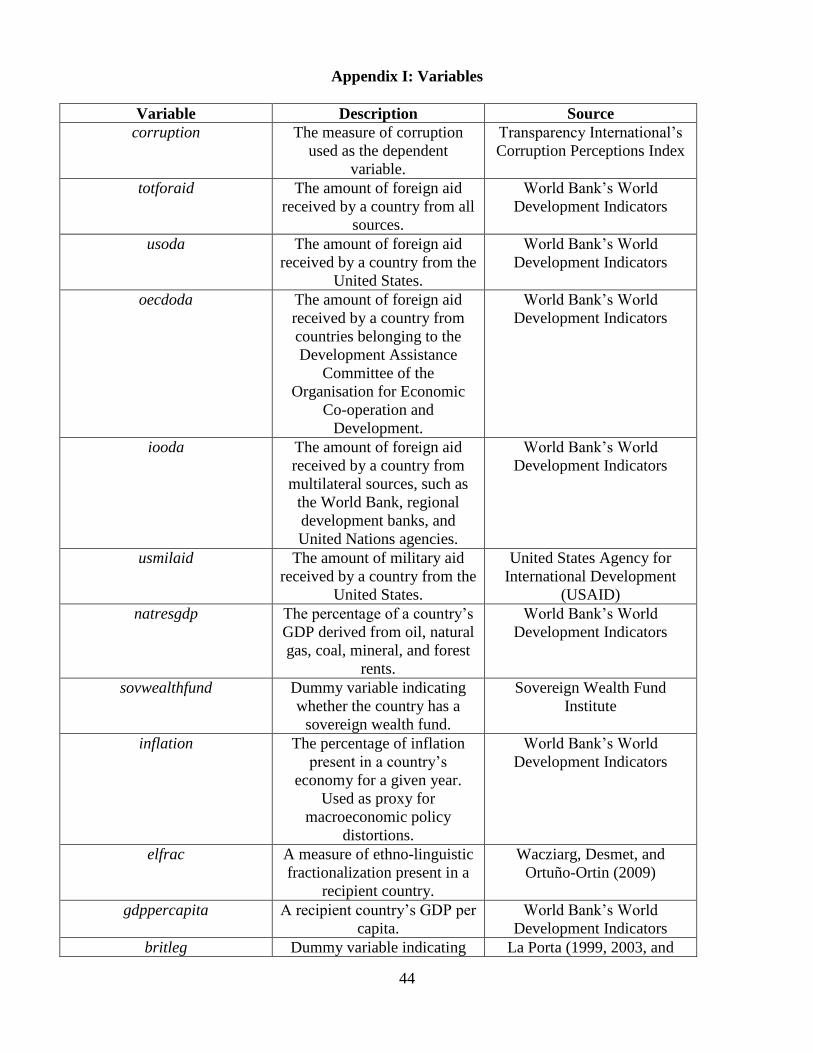
44
Appendix I: Variables
Variable Description Source
corruption The measure of corruption
used as the dependent
variable.
Transparency International’s
Corruption Perceptions Index
totforaid The amount of foreign aid
received by a country from all
sources.
World Bank’s World
Development Indicators
usoda The amount of foreign aid
received by a country from the
United States.
World Bank’s World
Development Indicators
oecdoda The amount of foreign aid
received by a country from
countries belonging to the
Development Assistance
Committee of the
Organisation for Economic
Co-operation and
Development.
World Bank’s World
Development Indicators
iooda The amount of foreign aid
received by a country from
multilateral sources, such as
the World Bank, regional
development banks, and
United Nations agencies.
World Bank’s World
Development Indicators
usmilaid The amount of military aid
received by a country from the
United States.
United States Agency for
International Development
(USAID)
natresgdp The percentage of a country’s
GDP derived from oil, natural
gas, coal, mineral, and forest
rents.
World Bank’s World
Development Indicators
sovwealthfund Dummy variable indicating
whether the country has a
sovereign wealth fund.
Sovereign Wealth Fund
Institute
inflation The percentage of inflation
present in a country’s
economy for a given year.
Used as proxy for
macroeconomic policy
distortions.
World Bank’s World
Development Indicators
elfrac A measure of ethno-linguistic
fractionalization present in a
recipient country.
Wacziarg, Desmet, and
Ortuño-Ortin (2009)
gdppercapita A recipient country’s GDP per
capita.
World Bank’s World
Development Indicators
britleg Dummy variable indicating La Porta (1999, 2003, and

45
that the country’s legal system
originates from British
common law.
2008)
govexp Spending by the recipient
country’s central government.
World Bank’s World
Development Indicators
natdisasters The occurrence of natural
disasters in the recipient
country.
International Disaster
Database (EM-DAT)
primeduc The gross primary school
enrollment rate in the recipient
country.
World Bank’s World
Development Indicators
educ The gross secondary school
enrollment rate in the recipient
country.
World Bank’s World
Development Indicators
dem The level of democracy in the
recipient country.
Polity IV
prevcorr The level of corruption in the
year before the present year.
Transparency International’s
Corruption Perceptions Index
americas Dummy variable for the
recipient country’s location in
the Americas.
Transparency International’s
Corruption Perceptions Index
asiapac Dummy variable for the
recipient country’s location in
the Asia-Pacific.
Transparency International’s
Corruption Perceptions Index
africa Dummy variable for the
recipient country’s location in
Sub-Saharan Africa.
Transparency International’s
Corruption Perceptions Index
eeuropecasia Dummy variable for the
recipient country’s location in
Eastern Europe and Central
Asia.
Transparency International’s
Corruption Perceptions Index
totforaidinstr The instrument constructed
according to Frot and Perrotta
(2010) to replace totforaid.
Author’s own calculations
usodainstr The instrument constructed
according to Frot and Perrotta
(2010) to replace usoda.
Author’s own calculations
oecdaidinstr The instrument constructed
according to Frot and Perrotta
(2010) to replace oecdoda.
Author’s own calculations
ioodainstr The instrument constructed
according to Frot and Perrotta
(2010) to replace iooda.
Author’s own calculations
usmilaidinstr The instrument constructed
according to Frot and Perrotta
(2010) to replace usmilaid.
Author’s own calculations
eductotforaidinstr Variable created to measure
interaction effects of educ and
Author’s own calculations

46
totforaidinstr.
educusaidinstr Variable created to measure
interaction effects of educ and
usodainstr.
Author’s own calculations
educoecdaidinstr Variable created to measure
interaction effects of educ and
oecdaidinstr.
Author’s own calculations
educioaidinstr Variable created to measure
interaction effects of educ and
ioodainstr.
Author’s own calculations
educusmilaidinstr Variable created to measure
interaction effects of educ and
usmilaidinstr.
Author’s own calculations
demtotforaidinstr Variable created to measure
interaction effects of dem and
totforaidinstr.
Author’s own calculations
demusaidinstr Variable created to measure
interaction effects of educ and
usodainstr.
Author’s own calculations
demoecdaidinstr Variable created to measure
interaction effects of educ and
oecdaidinstr.
Author’s own calculations
demioaidinstr Variable created to measure
interaction effects of educ and
ioodainstr.
Author’s own calculations
demusmilaidinstr Variable created to measure
interaction effects of educ and
usmilaidinstr.
Author’s own calculations

47
Appendix II: Summary Statistics
Variable Observations Mean Std. Dev. Min Max
corruption 1484 34.89488 15.42453 4 94
totforaid 2304 4.28E+8 8.50E+8 -9.43E+8 2.21E+10
usoda 2304 7.31E+7 3.35E+8 -1.58E+8 1.12E+10
oecdoda 2304 3.30E+8 7.67E+8 -9.55E+8 2.20E+10
usmilaid 2304 5.55E+7 3.84E+8 0 6.80E+9
iooda 2304 1.58E+8 4.13E+8 0 6.46E+9
totforaidinstr 2304 -6.34E+7 6.38E+7 -2.97E+8 -5618485
usodainstr 2304 -2.14E+7 2.31E+7 -1.25E+8 1.08E+7
oecdaidinstr 2304 -6.19E+7 4.34E+7 -2.14E+8 -1.98E+7
usmilaidinstr 2304 1.04E+7 4.01E+7 -1.17E+8 1.36E+8
ioodainstr 2304 1.30E+8 1.32E+8 -1.99E+7 4.90E+8
natresgdp 2244 11.43853 19.54502 0 214.4921
sovwealthfund 2304 .124566 .3302978 0 1
inflation 2065 17.35251 119.5773 -16.11732 4145.107
elfrac 2288 .4857399 .3056033 .0002 .9903
gdppercapita 2304 6777.213 9208.605 119.2633 72727.68
britleg 2304 .2847222 .45138 0 1
govexp 2129 1.18E+10 4.19E+10 1.63E+7 7.88E+11
educ 1604 66.03768 28.70882 5.15948 122.9262
primeduc 1852 99.87475 18.91698 19.31771 161.9051
dem 2176 4.324449 3.764257 0 10
natdisasters 2304 .7630208 .4781865 0 11
americas 2304 .7630208 .4781865 0 1
asiapac 2304 .1944444 .3958583 0 1
africa 2304 .1388889 .3459056 0 1
eeuropecasia 2304 .1319444 .3385038 01 1
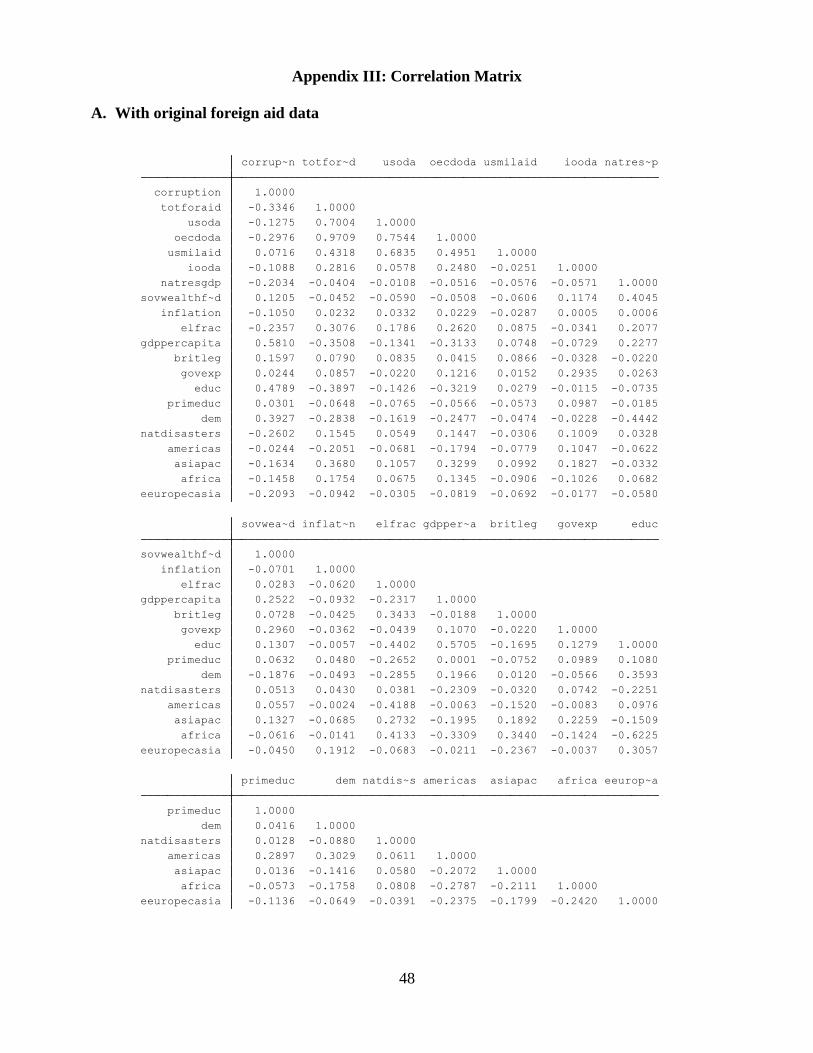
48
Appendix III: Correlation Matrix
A. With original foreign aid data
eeuropecasia -0.1136 -0.0649 -0.0391 -0.2375 -0.1799 -0.2420 1.0000
africa -0.0573 -0.1758 0.0808 -0.2787 -0.2111 1.0000
asiapac 0.0136 -0.1416 0.0580 -0.2072 1.0000
americas 0.2897 0.3029 0.0611 1.0000
natdisasters 0.0128 -0.0880 1.0000
dem 0.0416 1.0000
primeduc 1.0000
primeduc dem natdis~s americas asiapac africa eeurop~a
eeuropecasia -0.0450 0.1912 -0.0683 -0.0211 -0.2367 -0.0037 0.3057
africa -0.0616 -0.0141 0.4133 -0.3309 0.3440 -0.1424 -0.6225
asiapac 0.1327 -0.0685 0.2732 -0.1995 0.1892 0.2259 -0.1509
americas 0.0557 -0.0024 -0.4188 -0.0063 -0.1520 -0.0083 0.0976
natdisasters 0.0513 0.0430 0.0381 -0.2309 -0.0320 0.0742 -0.2251
dem -0.1876 -0.0493 -0.2855 0.1966 0.0120 -0.0566 0.3593
primeduc 0.0632 0.0480 -0.2652 0.0001 -0.0752 0.0989 0.1080
educ 0.1307 -0.0057 -0.4402 0.5705 -0.1695 0.1279 1.0000
govexp 0.2960 -0.0362 -0.0439 0.1070 -0.0220 1.0000
britleg 0.0728 -0.0425 0.3433 -0.0188 1.0000
gdppercapita 0.2522 -0.0932 -0.2317 1.0000
elfrac 0.0283 -0.0620 1.0000
inflation -0.0701 1.0000
sovwealthf~d 1.0000
sovwea~d inflat~n elfrac gdpper~a britleg govexp educ
eeuropecasia -0.2093 -0.0942 -0.0305 -0.0819 -0.0692 -0.0177 -0.0580
africa -0.1458 0.1754 0.0675 0.1345 -0.0906 -0.1026 0.0682
asiapac -0.1634 0.3680 0.1057 0.3299 0.0992 0.1827 -0.0332
americas -0.0244 -0.2051 -0.0681 -0.1794 -0.0779 0.1047 -0.0622
natdisasters -0.2602 0.1545 0.0549 0.1447 -0.0306 0.1009 0.0328
dem 0.3927 -0.2838 -0.1619 -0.2477 -0.0474 -0.0228 -0.4442
primeduc 0.0301 -0.0648 -0.0765 -0.0566 -0.0573 0.0987 -0.0185
educ 0.4789 -0.3897 -0.1426 -0.3219 0.0279 -0.0115 -0.0735
govexp 0.0244 0.0857 -0.0220 0.1216 0.0152 0.2935 0.0263
britleg 0.1597 0.0790 0.0835 0.0415 0.0866 -0.0328 -0.0220
gdppercapita 0.5810 -0.3508 -0.1341 -0.3133 0.0748 -0.0729 0.2277
elfrac -0.2357 0.3076 0.1786 0.2620 0.0875 -0.0341 0.2077
inflation -0.1050 0.0232 0.0332 0.0229 -0.0287 0.0005 0.0006
sovwealthf~d 0.1205 -0.0452 -0.0590 -0.0508 -0.0606 0.1174 0.4045
natresgdp -0.2034 -0.0404 -0.0108 -0.0516 -0.0576 -0.0571 1.0000
iooda -0.1088 0.2816 0.0578 0.2480 -0.0251 1.0000
usmilaid 0.0716 0.4318 0.6835 0.4951 1.0000
oecdoda -0.2976 0.9709 0.7544 1.0000
usoda -0.1275 0.7004 1.0000
totforaid -0.3346 1.0000
corruption 1.0000
corrup~n totfor~d usoda oecdoda usmilaid iooda natres~p

49
B. With instruments
eeuropecasia -0.1136 -0.0649 -0.0391 -0.2375 -0.1799 -0.2420 1.0000
africa -0.0573 -0.1758 0.0808 -0.2787 -0.2111 1.0000
asiapac 0.0136 -0.1416 0.0580 -0.2072 1.0000
americas 0.2897 0.3029 0.0611 1.0000
natdisasters 0.0128 -0.0880 1.0000
dem 0.0416 1.0000
primeduc 1.0000
primeduc dem natdis~s americas asiapac africa eeurop~a
eeuropecasia -0.0450 0.1912 -0.0683 -0.0211 -0.2367 -0.0037 0.3057
africa -0.0616 -0.0141 0.4133 -0.3309 0.3440 -0.1424 -0.6225
asiapac 0.1327 -0.0685 0.2732 -0.1995 0.1892 0.2259 -0.1509
americas 0.0557 -0.0024 -0.4188 -0.0063 -0.1520 -0.0083 0.0976
natdisasters 0.0513 0.0430 0.0381 -0.2309 -0.0320 0.0742 -0.2251
dem -0.1876 -0.0493 -0.2855 0.1966 0.0120 -0.0566 0.3593
primeduc 0.0632 0.0480 -0.2652 0.0001 -0.0752 0.0989 0.1080
educ 0.1307 -0.0057 -0.4402 0.5705 -0.1695 0.1279 1.0000
govexp 0.2960 -0.0362 -0.0439 0.1070 -0.0220 1.0000
britleg 0.0728 -0.0425 0.3433 -0.0188 1.0000
gdppercapita 0.2522 -0.0932 -0.2317 1.0000
elfrac 0.0283 -0.0620 1.0000
inflation -0.0701 1.0000
sovwealthf~d 1.0000
sovwea~d inflat~n elfrac gdpper~a britleg govexp educ
eeuropecasia -0.2093 -0.5555 -0.5117 -0.5399 -0.3195 -0.2345 -0.0580
africa -0.1458 0.2153 0.2133 0.1951 -0.0510 0.1503 0.0682
asiapac -0.1634 0.1755 0.1316 0.1766 0.1989 0.0753 -0.0332
americas -0.0244 0.3205 0.3683 0.3171 0.3967 0.1374 -0.0622
natdisasters -0.2602 0.1054 0.1813 0.1002 0.1680 0.1004 0.0328
dem 0.3927 -0.1454 -0.0801 -0.1249 0.0069 -0.1065 -0.4442
primeduc 0.0301 0.1276 0.1361 0.1264 0.0792 0.1429 -0.0185
educ 0.4789 -0.4615 -0.4514 -0.4395 -0.2066 -0.1848 -0.0735
govexp 0.0244 -0.1119 -0.1349 -0.1062 -0.0776 0.0296 0.0263
britleg 0.1597 0.2345 0.1976 0.2311 -0.0159 0.0923 -0.0220
gdppercapita 0.5810 -0.2874 -0.4009 -0.3042 -0.2713 -0.0281 0.2277
elfrac -0.2357 0.1507 0.0675 0.1417 0.0032 -0.0035 0.2077
inflation -0.1050 0.0286 0.0005 0.0396 -0.0015 -0.0648 0.0006
sovwealthf~d 0.1205 0.0672 -0.0049 0.0588 -0.0088 0.0849 0.4045
natresgdp -0.2034 0.1049 0.0073 0.0723 -0.0145 0.0638 1.0000
ioodainstr -0.0730 0.1176 0.4366 0.0868 0.3696 1.0000
usmilaidin~r -0.1916 0.5102 0.7451 0.4895 1.0000
oecdaidinstr -0.0788 0.9943 0.7689 1.0000
usodainstr -0.1950 0.7810 1.0000
totforaidi~r -0.0873 1.0000
corruption 1.0000
corrup~n totfor~r usodai~r oecdai~r usmila~r ioodai~r natres~p

50
Appendix IV: OLS Regressions
(1) (2) (3) (4) (5)
VARIABLES corruption corruption corruption corruption corruption
totforaid -2.41E-9***
(3.45E-10)
gdppercapita 0.0009*** 0.0010*** 0.0009*** 0.0010*** 0.0010***
(0.0001) (0.0001) (0.0001) (0.0001) (0.0001)
natresgdp -0.3434*** -0.3370*** -0.3413*** -0.3411*** -0.3359***
(0.0204) (0.0207) (0.0206) (0.0209) (0.0208)
sovwealthfund 5.7322*** 5.8362*** 5.7063*** 5.9889*** 5.9764***
(0.8915) (0.9209) (0.9041) (0.9154) (0.9301)
inflation -0.0132*** -0.0120** -0.0126** -0.0123** -0.0118**
(0.0051) (0.0049) (0.0050) (0.0050) (0.0049)
elfrac -2.0490** -3.3857*** -2.4975** -3.5472*** -3.5749***
(1.0012) (1.0059) (1.0055) (1.0112) (1.0132)
britleg 5.3570*** 5.3432*** 5.2500*** 5.3176*** 5.3304***
(0.6427) (0.6565) (0.6501) (0.6520) (0.6566)
govexp -1.07E-11*** -1.52E-11*** -1.11E-11*** -9.54E-12** -1.55E-11***
(4.06E-12) (4.23E-12) (4.16E-12) (4.29E-12) (4.28E-12)
natdisasters -2.7908** -3.0269** -2.8773** -2.9569** -3.0490**
(1.2029) (1.2745) (1.2232) (1.2492) (1.2752)
usoda -9.67E-10
(1.69E-9)
oecdoda -2.27E-9***
(4.66E-10)
iooda -1.54E-9***
(4.49E-10)
usmilaid 6.99E-10
(9.24E-10)
Observations 1,286 1,286 1,286 1,286 1,286
R-squared 0.6087 0.5993 0.6043 0.6018 0.5996
* Significant at 10 percent; ** Significant at 5 percent; *** Significant at 1 percent. Robust standard errors in parentheses.
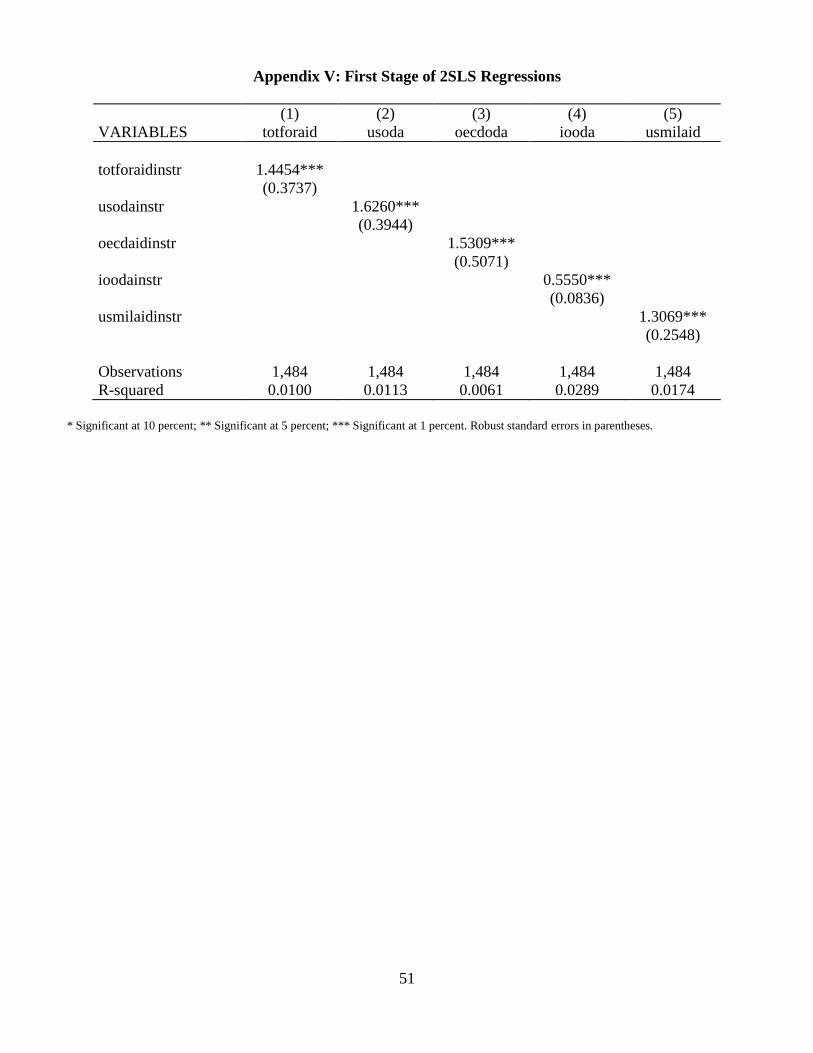
51
Appendix V: First Stage of 2SLS Regressions
(1) (2) (3) (4) (5)
VARIABLES totforaid usoda oecdoda iooda usmilaid
totforaidinstr 1.4454***
(0.3737)
usodainstr 1.6260***
(0.3944)
oecdaidinstr 1.5309***
(0.5071)
ioodainstr 0.5550***
(0.0836)
usmilaidinstr 1.3069***
(0.2548)
Observations 1,484 1,484 1,484 1,484 1,484
R-squared 0.0100 0.0113 0.0061 0.0289 0.0174
* Significant at 10 percent; ** Significant at 5 percent; *** Significant at 1 percent. Robust standard errors in parentheses.

52
Appendix VI: Second Stage of 2SLS Regressions
(1) (2) (3) (4) (5)
VARIABLES corruption corruption corruption corruption corruption
totforaid 2.40E-8**
(1.03E-8)
gdppercapita 0.0014*** 0.0010*** 0.0014*** 0.0009*** 0.0010***
(0.0002) (0.0001) (0.0002) (0.0001) (0.0001)
natresgdp -0.2719*** -0.3362*** -0.2711*** -0.3514*** -0.3377***
(0.0477) (0.0216) (0.0485) (0.0220) (0.0211)
sovwealthfund 7.4014*** 6.2621*** 8.5317*** 6.2472*** 5.8165***
(2.0947) (1.1882) (2.1576) (0.9433) (1.1135)
inflation 0.0008 -0.0115** -0.0019 -0.0134** -0.0120**
(0.0088) (0.0052) (0.0083) (0.0053) (0.0050)
elfrac -17.7189*** -4.1964*** -18.0452*** -3.7196*** -3.4054***
(5.9815) (1.6188) (5.7867) (1.0081) (1.2598)
britleg 5.1585*** 5.3054*** 6.6605*** 5.2648*** 5.3452***
(1.3685) (0.6818) (1.3635) (0.6515) (0.6623)
govexp -6.06E-11*** -1.58E-11*** -7.80E-11*** 4.65E-12 -1.51E-11***
(2.29E-11) (4.43E-12) (2.81E-11) (1.10E-11) (4.48E-12)
natdisasters -5.5947** -3.1997** -5.5598** -2.7358** -3.0445**
(2.6051) (1.4027) (2.6639) (1.1701) (1.2854)
usoda 7.59E-9
(1.33E-8)
oecdoda 3.37E-8**
(1.35E-8)
iooda -5.35E-9**
(2.63E-9)
usmilaid -5.15E-10
(4.30E-9)
Observations 1,286 1,286 1,286 1,286 1,286
R-squared 0.5834 0.5854 0.5982
* Significant at 10 percent; ** Significant at 5 percent; *** Significant at 1 percent. Robust standard errors in parentheses. All foreign aid
variables are replaced by their instruments.

53
Appendix VII: Sensitivity Analyses
A. With Regional Dummies
(1) (2) (3) (4)
VARIABLES corruption corruption corruption corruption
totforaid 2.25E-8** 1.40E-8*** 3.46E-8*** 6.16E-9
(9.66E-9) (4.43E-9) (1.22E-8) (1.01E-8)
gdppercapita 0.0014*** 0.0013*** 0.0015*** 0.0010***
(0.0002) (0.0001) (0.0003) (0.0002)
natresgdp -0.2829*** -0.3055*** -0.2972*** -0.3485***
(0.0442) (0.0308) (0.0510) (0.0283)
sovwealthfund 7.5320*** 6.8228*** 11.0165*** 8.4008***
(2.0097) (1.5016) (2.9587) (1.6698)
inflation -0.0017 -0.0051 0.0017 -0.0064
(0.0083) (0.0061) (0.0103) (0.0064)
elfrac -17.9174*** -11.2540*** -14.9055*** -5.3944
(5.8470) (2.4812) (4.5463) (3.3151)
britleg 4.7975*** 4.7876*** 9.0314*** 6.0772***
(1.3663) (1.0489) (2.2596) (1.0975)
govexp -5.62E-11*** -4.00E-11*** -6.19E-11*** -2.12E-11
(2.12E-11) (1.18E-11) (2.34E-11) (1.57E-11)
natdisasters -5.4638** -4.6395** -6.5553** -3.8479**
(2.4610) (1.9248) (3.1075) (1.9062)
africa 2.3177 2.1880* -5.2128** -5.3461***
(1.4908) (1.1203) (2.5990) (1.2398)
americas 2.3452* 2.6601 -4.4701**
(1.2153) (1.8518) (1.8987)
asiapac -19.4327*** -9.7090**
(7.1789) (4.4579)
eeuropecasia -8.9058***
(1.4061)
Observations 1,286 1,286 1,286 1,286
R-squared 0.1688 0.5314
* Significant at 10 percent; ** Significant at 5 percent; *** Significant at 1 percent. Robust standard errors in parentheses. All foreign aid
variables are replaced by their instruments.

54
(1) (2) (3) (4)
VARIABLES corruption corruption corruption corruption
usoda 6.04E-9 1.02E-8 1.67E-8 -2.21E-8**
(1.28E-8) (1.19E-8) (1.15E-8) (1.10E-8)
gdppercapita 0.0010*** 0.0010*** 0.0010*** 0.0008***
(0.0001) (0.0001) (0.0001) (0.0001)
natresgdp -0.3400*** -0.3397*** -0.3450*** -0.3589***
(0.0213) (0.0219) (0.0232) (0.0215)
sovwealthfund 6.3053*** 6.5611*** 7.2811*** 6.6007***
(1.1872) (1.1773) (1.1776) (1.0964)
inflation -0.0125** -0.0126** -0.0129** -0.0096**
(0.0053) (0.0054) (0.0058) (0.0043)
elfrac -4.6312*** -5.4890*** -5.3496*** -0.9833
(1.7499) (1.6233) (1.6539) (1.4977)
britleg 5.1143*** 5.1198*** 5.6730*** 5.7772***
(0.7084) (0.7243) (0.8253) (0.8605)
govexp -1.49E-11*** -1.52E-11*** -1.36E-11*** -1.11E-11***
(0.0000) (4.34E-12) (4.81E-12) (4.25E-12)
natdisasters -3.1840** -3.2457** -3.3249** -2.7633**
(1.3585) (1.3537) (1.3961) (1.1910)
africa 1.2326 1.2537 0.2855 -5.7262***
(0.7828) (0.7973) (0.9593) (1.1216)
americas -0.6781 -1.1533 -5.8681***
(0.7226) (0.7781) (0.9156)
asiapac -2.4550** -7.4586***
(1.1194) (1.3048)
eeuropecasia -9.8048***
(0.8645)
Observations 1,286 1,286 1,286 1,286
R-squared 0.5896 0.5736 0.5355 0.5432
* Significant at 10 percent; ** Significant at 5 percent; *** Significant at 1 percent. Robust standard errors in parentheses. All foreign aid
variables are replaced by their instruments.

55
(1) (2) (3) (4)
VARIABLES corruption corruption corruption corruption
oecdoda 3.23E-8** 2.13E-8*** 4.27E-8*** 1.21E-8
(1.29E-8) (6.19E-9) (1.47E-8) (1.21E-8)
gdppercapita 0.0014*** 0.0013*** 0.0014*** 0.0010***
(0.0002) (0.0001) (0.0002) (0.0002)
natresgdp -0.2813*** -0.3025*** -0.2997*** -0.3435***
(0.0452) (0.0323) (0.0489) (0.0290)
sovwealthfund 8.6616*** 7.6116*** 11.7266*** 9.0225***
(2.1076) (1.5515) (2.8832) (1.8498)
inflation -0.0042 -0.0062 -0.0035 -0.0065
(0.0081) (0.0063) (0.0094) (0.0057)
elfrac -18.5993*** -12.0960*** -14.5347*** -6.4958**
(5.7959) (2.5882) (4.3388) (3.1636)
britleg 6.2055*** 5.6903*** 10.2224*** 6.7658***
(1.3018) (1.0148) (2.5142) (1.4306)
govexp -7.36E-11*** -5.29E-11*** -7.88E-11*** -3.12E-11
(2.65E-11) (1.46E-11) (2.69E-11) (1.99E-11)
natdisasters -5.4845** -4.7437** -6.1002** -4.0841**
(2.5390) (2.0321) (2.9664) (1.9314)
africa 2.4842 2.3662** -3.8731* -5.2574***
(1.5560) (1.1852) (2.2294) (1.0871)
americas 2.5091** 2.2718 -3.9493**
(1.2236) (1.6769) (1.7902)
asiapac -16.1593*** -10.3289***
(6.1895) (3.5631)
eeuropecasia -8.4263***
(1.4672)
Observations 1,286 1,286 1,286 1,286
R-squared 0.0508 0.4406
* Significant at 10 percent; ** Significant at 5 percent; *** Significant at 1 percent. Robust standard errors in parentheses. All foreign aid
variables are replaced by their instruments.

56
(1) (2) (3) (4)
VARIABLES corruption corruption corruption corruption
iooda -5.51E-9** -5.40E-9** -4.63E-9* -7.45E-9**
(2.64E-9) (2.53E-9) (2.64E-9) (2.94E-9)
gdppercapita 0.0009*** 0.0009*** 0.0009*** 0.0008***
(0.0001) (0.0001) (0.0001) (0.0001)
natresgdp -0.3528*** -0.3524*** -0.3547*** -0.3728***
(0.0214) (0.0214) (0.0216) (0.0219)
sovwealthfund 6.2899*** 6.2958*** 6.5513*** 7.8508***
(0.9384) (0.9369) (0.9308) (0.9764)
inflation -0.0137** -0.0137** -0.0141** -0.0096**
(0.0053) (0.0053) (0.0055) (0.0042)
elfrac -3.8803*** -4.0162*** -3.4608*** -3.1978***
(1.0836) (1.1288) (1.1175) (1.0851)
britleg 5.2104*** 5.2239*** 5.6963*** 5.1635***
(0.6681) (0.6677) (0.7123) (0.7117)
govexp 5.48E-12 5.02E-12 3.67E-12 1.38E-11
(1.03E-11) (1.06E-11) (1.05E-11) (1.15E-11)
natdisasters -2.7304** -2.7292** -2.7293** -2.8428**
(1.1611) (1.1587) (1.1683) (1.1694)
africa 0.3250 0.3069 -0.4976 -5.0942***
(0.7422) (0.7410) (0.8321) (0.9088)
americas -0.2239 -0.7188 -4.4656***
(0.7675) (0.8404) (0.9457)
asiapac -1.8845* -5.7727***
(1.0411) (1.1407)
eeuropecasia -9.6863***
(0.8016)
Observations 1,286 1,286 1,286 1,286
R-squared 0.5840 0.5851 0.5925 0.5993
* Significant at 10 percent; ** Significant at 5 percent; *** Significant at 1 percent. Robust standard errors in parentheses. All foreign aid
variables are replaced by their instruments.
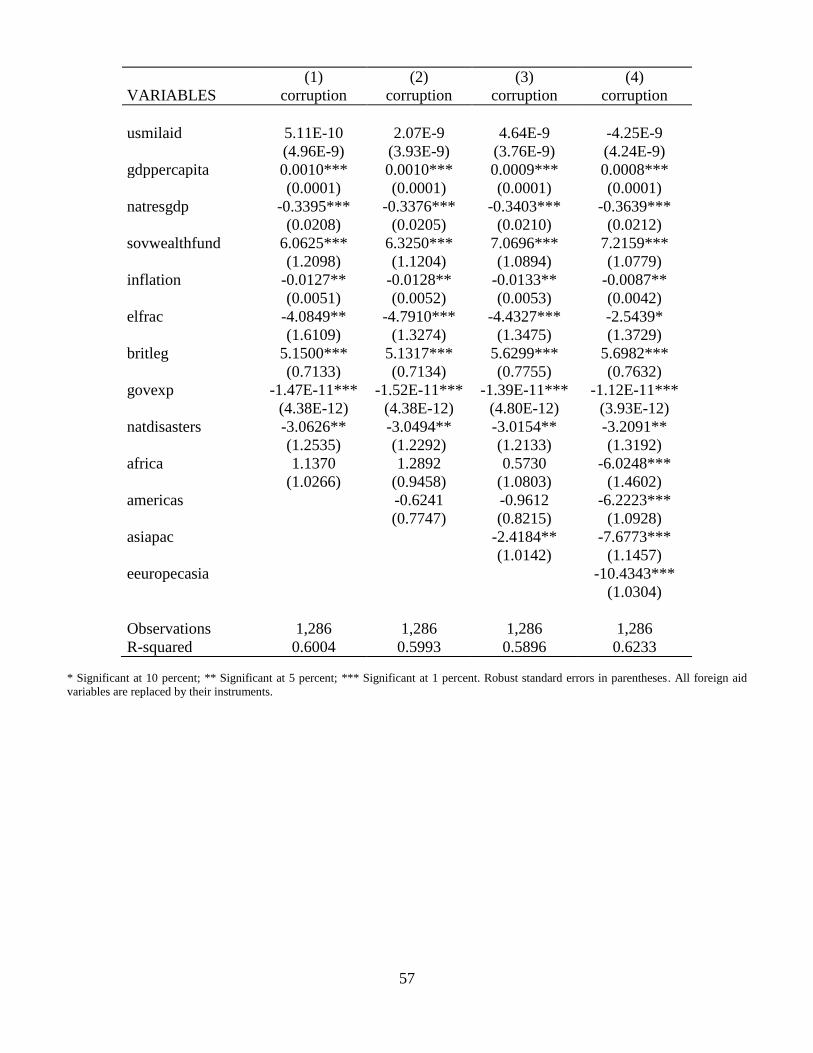
57
(1) (2) (3) (4)
VARIABLES corruption corruption corruption corruption
usmilaid 5.11E-10 2.07E-9 4.64E-9 -4.25E-9
(4.96E-9) (3.93E-9) (3.76E-9) (4.24E-9)
gdppercapita 0.0010*** 0.0010*** 0.0009*** 0.0008***
(0.0001) (0.0001) (0.0001) (0.0001)
natresgdp -0.3395*** -0.3376*** -0.3403*** -0.3639***
(0.0208) (0.0205) (0.0210) (0.0212)
sovwealthfund 6.0625*** 6.3250*** 7.0696*** 7.2159***
(1.2098) (1.1204) (1.0894) (1.0779)
inflation -0.0127** -0.0128** -0.0133** -0.0087**
(0.0051) (0.0052) (0.0053) (0.0042)
elfrac -4.0849** -4.7910*** -4.4327*** -2.5439*
(1.6109) (1.3274) (1.3475) (1.3729)
britleg 5.1500*** 5.1317*** 5.6299*** 5.6982***
(0.7133) (0.7134) (0.7755) (0.7632)
govexp -1.47E-11*** -1.52E-11*** -1.39E-11*** -1.12E-11***
(4.38E-12) (4.38E-12) (4.80E-12) (3.93E-12)
natdisasters -3.0626** -3.0494** -3.0154** -3.2091**
(1.2535) (1.2292) (1.2133) (1.3192)
africa 1.1370 1.2892 0.5730 -6.0248***
(1.0266) (0.9458) (1.0803) (1.4602)
americas -0.6241 -0.9612 -6.2223***
(0.7747) (0.8215) (1.0928)
asiapac -2.4184** -7.6773***
(1.0142) (1.1457)
eeuropecasia -10.4343***
(1.0304)
Observations 1,286 1,286 1,286 1,286
R-squared 0.6004 0.5993 0.5896 0.6233
* Significant at 10 percent; ** Significant at 5 percent; *** Significant at 1 percent. Robust standard errors in parentheses. All foreign aid
variables are replaced by their instruments.

58
B. With Education Variables
(1) (2) (3) (4) (5)
VARIABLES corruption corruption corruption corruption corruption
totforaid 1.33E-8*
(7.17E-9)
gdppercapita 0.0012*** 0.0009*** 0.0012*** 0.0009*** 0.0009***
(0.0002) (0.0001) (0.0002) (0.0001) (0.0001)
natresgdp -0.2868*** -0.3185*** -0.2891*** -0.3323*** -0.3267***
(0.0365) (0.0209) (0.0367) (0.0230) (0.0224)
sovwealthfund 4.1924*** 3.6682*** 5.0181*** 4.3976*** 3.3952***
(1.6022) (1.0340) (1.6568) (0.9840) (1.0316)
inflation -0.0555 -0.0420* -0.0559 -0.0446* -0.0460*
(0.0411) (0.0237) (0.0442) (0.0230) (0.0244)
elfrac -14.1666*** -5.5581*** -14.3518*** -5.9408*** -5.3101***
(4.4576) (1.6401) (4.1102) (1.1285) (1.3812)
britleg 6.4387*** 6.4678*** 7.1543*** 6.2815*** 6.5343***
(1.0140) (0.7204) (1.0542) (0.7000) (0.7240)
govexp -3.53E-11** -1.24E-11** -4.63E-11** -4.41E-13 -1.12E-11**
(1.56E-11) (4.81E-12) (1.90E-11) (9.05E-12) (4.65E-12)
natdisasters -3.8304** -2.4007** -3.9185* -2.2032** -2.4608**
(1.9144) (1.1661) (2.0051) (1.0530) (1.1774)
primeduc 0.0041 0.0166 0.0035 0.0270 0.0149
(0.0270) (0.0161) (0.0289) (0.0181) (0.0166)
usoda -3.95E-9
(1.16E-8)
oecdoda 1.96E-8**
(9.34E-9)
iooda -4.45E-9
(2.82E-9)
usmilaid -4.01E-9
(3.80E-9)
Observations 1,107 1,107 1,107 1,107 1,107
R-squared 0.0416 0.5528 0.5502 0.5286
* Significant at 10 percent; ** Significant at 5 percent; *** Significant at 1 percent. Robust standard errors in parentheses. All foreign aid
variables are replaced by their instruments.

59
(1) (2) (3) (4) (5)
VARIABLES corruption corruption corruption corruption corruption
totforaid -2.33E-7
(4.10E-7)
gdppercapita -0.0025 0.0009*** 0.0030 0.0009*** 0.0009***
(0.0060) (0.0001) (0.0028) (0.0001) (0.0001)
natresgdp -1.2973 -0.3197*** 0.2981 -0.3270*** -0.3280***
(1.7414) (0.0318) (0.8411) (0.0270) (0.0268)
sovwealthfund 1.9968 5.2526*** 12.0669 4.6060*** 4.2830***
(19.2929) (1.2379) (14.2510) (1.0060) (1.1043)
inflation -0.0130 -0.0156 -0.0224 -0.0102 -0.0106
(0.2216) (0.0250) (0.1730) (0.0183) (0.0186)
elfrac 94.4971 -5.1057** -65.1626 -2.6534** -2.2341
(172.8300) (1.9811) (79.7666) (1.1680) (1.5878)
britleg 4.0950 5.9970*** 15.4625 6.1964*** 6.2670***
(12.4532) (0.9448) (13.8807) (0.7794) (0.8081)
govexp 4.82E-10 -1.77E-11*** -4.08E-10 -1.33E-11 -1.64E-11***
(8.86E-10) (5.63E-12) (5.08E-10) (9.11E-12) (5.21E-12)
natdisasters 12.6981 -2.5883* -12.4353 -2.2093* -2.2574*
(27.0497) (1.4810) (15.9565) (1.2615) (1.3086)
educ -1.3876 0.0795*** 0.7825 0.0743*** 0.0756***
(2.5303) (0.0185) (0.9476) (0.0158) (0.0160)
usoda 2.15E-8
(1.33E-8)
oecdoda 1.95E-7
(2.50E-7)
iooda -1.09E-9
(2.31E-9)
usmilaid -1.61E-9
(3.75E-9)
Observations 993 993 993 993 993
R-squared 0.3935 0.5551 0.5472
* Significant at 10 percent; ** Significant at 5 percent; *** Significant at 1 percent. Robust standard errors in parentheses. All foreign aid
variables are replaced by their instruments.

60
(1) (2) (3) (4) (5)
VARIABLES corruption corruption corruption corruption corruption
totforaid -9.92E-9***
(2.93E-9)
gdppercapita 0.0008*** 0.0009*** 0.0008*** 0.0013 0.0014***
(0.0001) (0.0001) (0.0001) (0.0010) (0.0005)
natresgdp -0.3773*** -0.3315*** -0.3678*** -0.1811 -0.4895***
(0.0258) (0.0276) (0.0275) (0.3365) (0.1325)
sovwealthfund 3.5604*** 2.7925** 3.1514*** 0.4362 -2.8912
(1.0463) (1.1413) (1.0162) (9.4753) (7.3921)
inflation -0.0116 -0.0012 -0.0120 -0.0333 -0.0088
(0.0150) (0.0172) (0.0162) (0.0644) (0.0365)
elfrac 2.5114 2.1533 1.7959 -4.6833 12.0233
(1.6504) (1.8560) (1.8030) (6.2150) (12.5782)
britleg 5.3364*** 5.7670*** 4.8748*** 9.0578 7.7057**
(0.8678) (1.0092) (0.8680) (6.4486) (3.4426)
govexp 7.01E-12 -1.32E-11** 6.87E-12 -1.60E-10 3.53E-12
(8.08E-12) (5.88E-12) (1.01E-11) (3.48E-10) (2.22E-11)
natdisasters -1.6298 -1.9968 -1.7103 -4.6120 -2.8474
(1.0380) (1.2432) (1.0755) (6.5221) (2.5200)
educ 0.0584** 0.1002*** 0.0955*** 0.1131 0.0958*
(0.0246) (0.0208) (0.0225) (0.0956) (0.0577)
eductotforaidinstr 2.77E-10***
(5.16E-11)
usoda -3.06E-8***
(1.02E-8)
educusaidinstr 7.04E-10***
(2.02E-10)
oecdoda -1.05E-8**
(4.37E-9)
educoecdaidinstr 4.70E-10***
(7.78E-11)
iooda 4.58E-8
(1.09E-7)
educioaidinstr -0.0000
(0.0000)
usmilaid -5.26E-8
(4.82E-8)
educusmilaidinstr 0.0000
(0.0000)
Observations 993 993 993 993 993
R-squared 0.4567 0.3359 0.4918
* Significant at 10 percent; ** Significant at 5 percent; *** Significant at 1 percent. Robust standard errors in parentheses. All foreign aid
variables are replaced by their instruments.

61
C. With Democracy Variables
(1) (2) (3) (4) (5)
VARIABLES corruption corruption corruption corruption corruption
totforaid 5.15E-8**
(2.53E-8)
gdppercapita 0.0019*** 0.0010*** 0.0017*** 0.0009*** 0.0009***
(0.0005) (0.0001) (0.0004) (0.0001) (0.0001)
natresgdp -0.0126 -0.2889*** -0.0638 -0.3194*** -0.3068***
(0.1641) (0.0264) (0.1328) (0.0235) (0.0232)
sovwealthfund 13.1300*** 8.4295*** 14.0904*** 7.3244*** 6.7566***
(4.4791) (1.4252) (4.2056) (0.9626) (1.1880)
inflation 0.0336 -0.0044 0.0216 -0.0086** -0.0071*
(0.0246) (0.0046) (0.0180) (0.0041) (0.0040)
elfrac -25.6902** -2.3335 -22.5845** -1.0111 -0.5297
(12.1082) (1.4567) (9.8265) (0.9554) (1.0753)
britleg 2.4862 3.7523*** 5.5488** 3.9656*** 4.0291***
(2.7811) (0.7482) (2.2800) (0.5989) (0.6223)
govexp -1.11E-10** -1.58E-11*** -1.27E-10** 6.98E-12 -1.38E-11***
(5.36E-11) (5.15E-12) (5.53E-11) (1.05E-11) (4.66E-12)
natdisasters -8.4853* -3.4270** -7.5578* -2.6322** -2.9513**
(4.8794) (1.5922) (4.3020) (1.2059) (1.3323)
dem 2.2946** 0.5933*** 1.9076** 0.4393*** 0.4291***
(0.9828) (0.1331) (0.7528) (0.0871) (0.0991)
usoda 2.34E-8
(1.44E-8)
oecdoda 6.10E-8**
(2.73E-8)
iooda -5.72E-9**
(2.50E-9)
usmilaid -1.34E-9
(4.09E-9)
Observations 1,253 1,253 1,253 1,253 1,253
R-squared 0.4630 0.5740 0.5903
* Significant at 10 percent; ** Significant at 5 percent; *** Significant at 1 percent. Robust standard errors in parentheses. All foreign aid
variables are replaced by their instruments.

62
(1) (2) (3) (4) (5)
VARIABLES corruption corruption corruption corruption corruption
totforaid 5.23E-8***
(1.64E-8)
gdppercapita 0.0019*** 0.0010*** 0.0017*** 0.0005 0.0008***
(0.0003) (0.0001) (0.0003) (0.0010) (0.0001)
natresgdp -0.0079 -0.2656*** -0.0480 -0.4990 -0.2688***
(0.1144) (0.0342) (0.1097) (0.4794) (0.0250)
sovwealthfund 13.2417*** 10.8934*** 14.6157*** 9.5391 10.0217***
(4.4792) (1.9967) (4.1763) (6.8189) (1.9803)
inflation 0.0342* -0.0012 0.0235 -0.0213 -0.0034
(0.0182) (0.0059) (0.0154) (0.0354) (0.0039)
elfrac -26.0888*** -4.7019** -24.0174*** -3.8996 -2.1595*
(8.8202) (1.8809) (8.0180) (8.2275) (1.1450)
britleg 2.4729 3.8709*** 5.6956** 1.4077 3.4939***
(2.7174) (1.1392) (2.4926) (6.9302) (0.8809)
govexp -1.12E-10*** -1.77E-11*** -1.34E-10*** 2.26E-10 -1.81E-11***
(4.26E-11) (6.51E-12) (4.57E-11) (5.91E-10) (6.33E-12)
natdisasters -8.5719** -3.9474** -7.8530* 0.1828 -2.6864**
(4.2253) (1.8174) (4.0519) (7.8209) (1.1722)
dem 2.3198*** 0.6746*** 1.9777*** -0.6875 0.6673***
(0.6453) (0.1561) (0.5887) (2.9379) (0.1141)
demtotforaidinstr -4.77E-11
(1.24E-9)
usoda 5.51E-8**
(2.28E-8)
demusaidinstr -5.38E-9**
(2.32E-9)
oecdoda 6.49E-9***
(1.96E-8)
demoecdaidinstr -3.22E-10
(1.97E-9)
iooda -6.62E-8
(1.63E-7)
demioaidinstr 8.54E-9
(2.27E-8)
usmilaid 1.58E-8*
(9.45E-9)
demusmilaidinstr -4.54E-9***
(1.75E-9)
Observations 1,253 1,253 1,253 1,253 1,253
R-squared 0.3862
* Significant at 10 percent; ** Significant at 5 percent; *** Significant at 1 percent. Robust standard errors in parentheses. All foreign aid
variables are replaced by their instruments.

63
D. Monterrey Consensus
1. 2002 and Before
(1) (2) (3) (4)
VARIABLES corruption corruption corruption corruption
totforaid -5.48E-8
(6.95E-8)
gdppercapita 0.0008 0.0005 0.0015*** 0.0019***
(0.0012) (0.0015) (0.0004) (0.0001)
natresgdp 0.0873 -1.2920 0.0765 -0.4678***
(0.7284) (1.0971) (0.6817) (0.0539)
sovwealthfund -12.7195 30.5466 -11.3549 9.4812***
(29.4107) (26.6141) (26.5820) (1.6759)
inflation -0.1182 0.0867 -0.0924 0.0289*
(0.1837) (0.0961) (0.1442) (0.0164)
elfrac 27.5625 -8.1678 23.5771 0.0729
(35.8391) (9.1496) (30.4609) (1.8646)
britleg 7.8852 -0.3219 2.7748 3.6690***
(6.2965) (5.3331) (3.0377) (1.3820)
govexp 3.71E-10 -9.22E-11 2.94E-10 -9.89E-11
(5.09E-10) (8.55E-11) (3.97E-10) (6.83E-11)
natdisasters 0.4318 -7.8053 0.3510 -5.5230***
(7.5516) (5.8551) (7.1903) (1.4753)
usoda 9.90E-8
(1.25E-7)
oecdoda -5.88E-8
(7.19E-8)
iooda 7.78E-9
(6.55E-9)
Observations 376 376 376 376
R-squared 0.6444
* Significant at 10 percent; ** Significant at 5 percent; *** Significant at 1 percent. Robust standard errors in parentheses. All foreign aid
variables are replaced by their instruments.
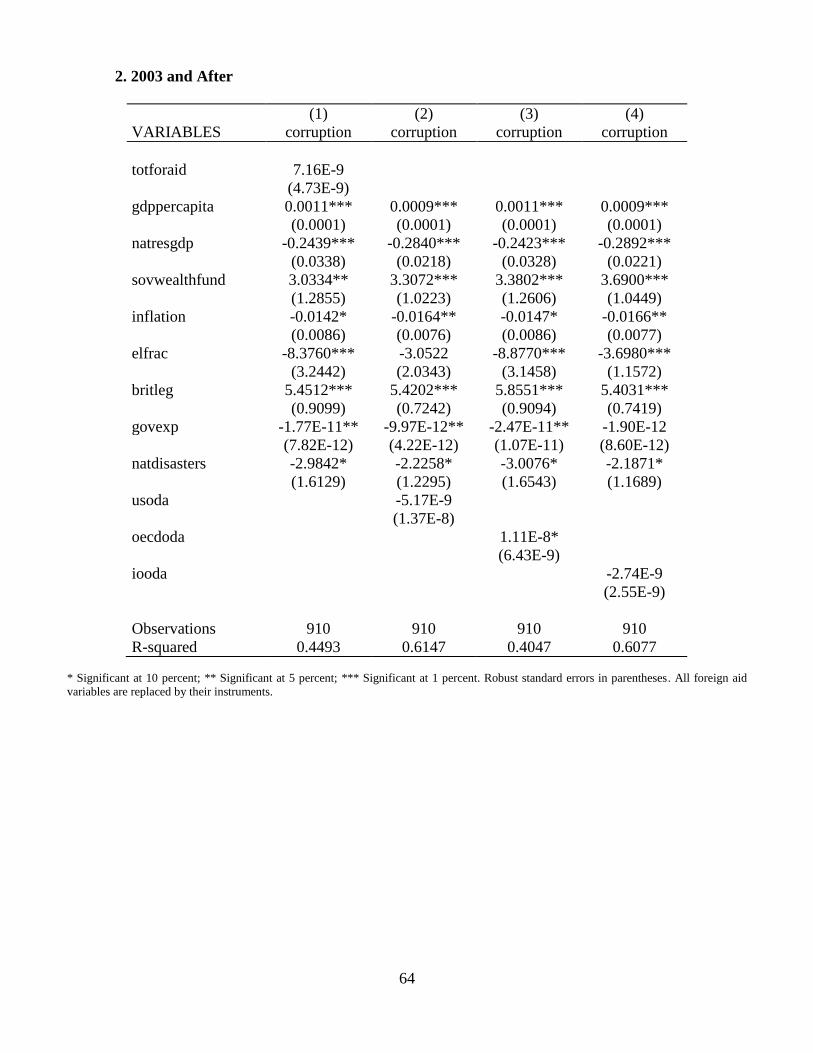
64
2. 2003 and After
(1) (2) (3) (4)
VARIABLES corruption corruption corruption corruption
totforaid 7.16E-9
(4.73E-9)
gdppercapita 0.0011*** 0.0009*** 0.0011*** 0.0009***
(0.0001) (0.0001) (0.0001) (0.0001)
natresgdp -0.2439*** -0.2840*** -0.2423*** -0.2892***
(0.0338) (0.0218) (0.0328) (0.0221)
sovwealthfund 3.0334** 3.3072*** 3.3802*** 3.6900***
(1.2855) (1.0223) (1.2606) (1.0449)
inflation -0.0142* -0.0164** -0.0147* -0.0166**
(0.0086) (0.0076) (0.0086) (0.0077)
elfrac -8.3760*** -3.0522 -8.8770*** -3.6980***
(3.2442) (2.0343) (3.1458) (1.1572)
britleg 5.4512*** 5.4202*** 5.8551*** 5.4031***
(0.9099) (0.7242) (0.9094) (0.7419)
govexp -1.77E-11** -9.97E-12** -2.47E-11** -1.90E-12
(7.82E-12) (4.22E-12) (1.07E-11) (8.60E-12)
natdisasters -2.9842* -2.2258* -3.0076* -2.1871*
(1.6129) (1.2295) (1.6543) (1.1689)
usoda -5.17E-9
(1.37E-8)
oecdoda 1.11E-8*
(6.43E-9)
iooda -2.74E-9
(2.55E-9)
Observations 910 910 910 910
R-squared 0.4493 0.6147 0.4047 0.6077
* Significant at 10 percent; ** Significant at 5 percent; *** Significant at 1 percent. Robust standard errors in parentheses. All foreign aid
variables are replaced by their instruments.

65
E. Paris Declaration
1. 2005 and Before
(1) (2) (3) (4)
VARIABLES corruption corruption corruption corruption
totforaid 8.61E-8
(9.24E-8)
gdppercapita 0.0028 0.0011*** 0.0028 0.0013***
(0.0018) (0.0001) (0.0019) (0.0002)
natresgdp -0.4379*** -0.4694*** -0.4157** -0.3652***
(0.1459) (0.1074) (0.1787) (0.0343)
sovwealthfund 32.2777 19.8707*** 37.0684 9.7985***
(25.0631) (5.2032) (35.3830) (1.4320)
inflation 0.1112 0.0095 0.1056 0.0003
(0.1268) (0.0212) (0.1426) (0.0101)
elfrac -42.5817 -7.9408** -50.5237 -1.3054
(43.3004) (3.3602) (60.3990) (1.6220)
britleg 1.8441 2.6597 10.5988 4.1164***
(5.4034) (2.2554) (8.9421) (1.0040)
govexp -4.83E-10 -6.23E-11** -6.16E-10 -7.02E-11**
(4.98E-10) (3.03E-11) (7.48E-10) (3.35E-11)
natdisasters -14.4558 -6.7061** -17.2185 -4.1600***
(12.1216) (3.3471) (17.9205) (1.0935)
usoda 1.20E-7**
(5.73E-8)
oecdoda 1.36E-7
(1.71E-7)
iooda 8.49E-9
(5.30E-9)
Observations 691 691 691 691
R-squared 0.5584
* Significant at 10 percent; ** Significant at 5 percent; *** Significant at 1 percent. Robust standard errors in parentheses. All foreign aid
variables are replaced by their instruments.

66
2. 2006 and After
(1) (2) (3) (4)
VARIABLES corruption corruption corruption corruption
totforaid 1.31E-9
(3.72E-9)
gdppercapita 0.0009*** 0.0008*** 0.0009*** 0.0009***
(0.0001) (0.0001) (0.0001) (0.0001)
natresgdp -0.2814*** -0.3254*** -0.2803*** -0.3026***
(0.0390) (0.0316) (0.0367) (0.0306)
sovwealthfund 1.6301 2.0004* 1.7032 2.3092*
(1.3923) (1.1460) (1.2699) (1.3072)
inflation -0.0122** -0.0128*** -0.0123** -0.0126**
(0.0060) (0.0040) (0.0061) (0.0054)
elfrac -5.5471* -0.7481 -5.7597* -4.5338***
(3.2672) (2.9641) (3.1348) (1.4364)
britleg 5.8472*** 5.8075*** 5.8980*** 5.7675***
(0.9654) (0.9894) (0.9526) (0.9415)
govexp -8.18E-12 -9.26E-12** -9.55E-12 -1.55E-12
(0.0000) (4.53E-12) (7.12E-12) (1.05E-11)
natdisasters -2.4456 -1.9635 -2.4577 -2.2583
(1.6832) (1.3805) (1.6903) (1.5025)
usoda -2.41E-8
(1.69E-8)
oecdoda 2.21E-9
(4.99E-9)
iooda -2.01E-9
(3.13E-9)
Observations 595 595 595 595
R-squared 0.6052 0.5455 0.6001 0.6206
* Significant at 10 percent; ** Significant at 5 percent; *** Significant at 1 percent. Robust standard errors in parentheses. All foreign aid
variables are replaced by their instruments.

67
F. Fixed Effects
(1) (2) (3) (4) (5)
VARIABLES corruption corruption corruption corruption corruption
totforaid 1.11E-8***
(2.87E-9)
gdppercapita 0.0002*** 0.0000 0.0003*** 0.0001** 0.0001**
(0.0001) (0.0001) (0.0001) (0.0001) (0.0001)
natresgdp -0.1551*** -0.0562 -0.1676*** -0.0879*** -0.0913***
(0.0430) (0.0451) (0.0476) (0.0317) (0.0320)
sovwealthfund -0.0190 1.3516 1.6572 1.0049 1.2082
(1.2600) (1.1448) (1.2964) (0.9536) (0.9573)
inflation -0.0084* -0.0079* -0.0082 -0.0078** -0.0084**
(0.0051) (0.0048) (0.0054) (0.0039) (0.0040)
govexp 2.81E-11*** 2.36E-12 1.87E-11** 4.87E-12 5.89E-12
(8.18E-12) (5.96E-12) (7.29E-12) (4.63E-12) (4.61E-12)
natdisasters -0.1709 -0.3416 -0.1030 -0.3661 -0.4810
(0.3877) (0.3601) (0.4141) (0.2952) (0.3293)
usoda -1.98E-8
(1.23E-8)
oecdoda 1.48E-8***
(4.48E-9)
iooda 1.28E-9
(1.13E-9)
usmilaid -7.06E-9
(8.15E-9)
Observations 1,286 1,286 1,286 1,286 1,286
Number of
countryvar
133 133 133 133 133
* Significant at 10 percent; ** Significant at 5 percent; *** Significant at 1 percent. All foreign aid variables are replaced by their
instruments.
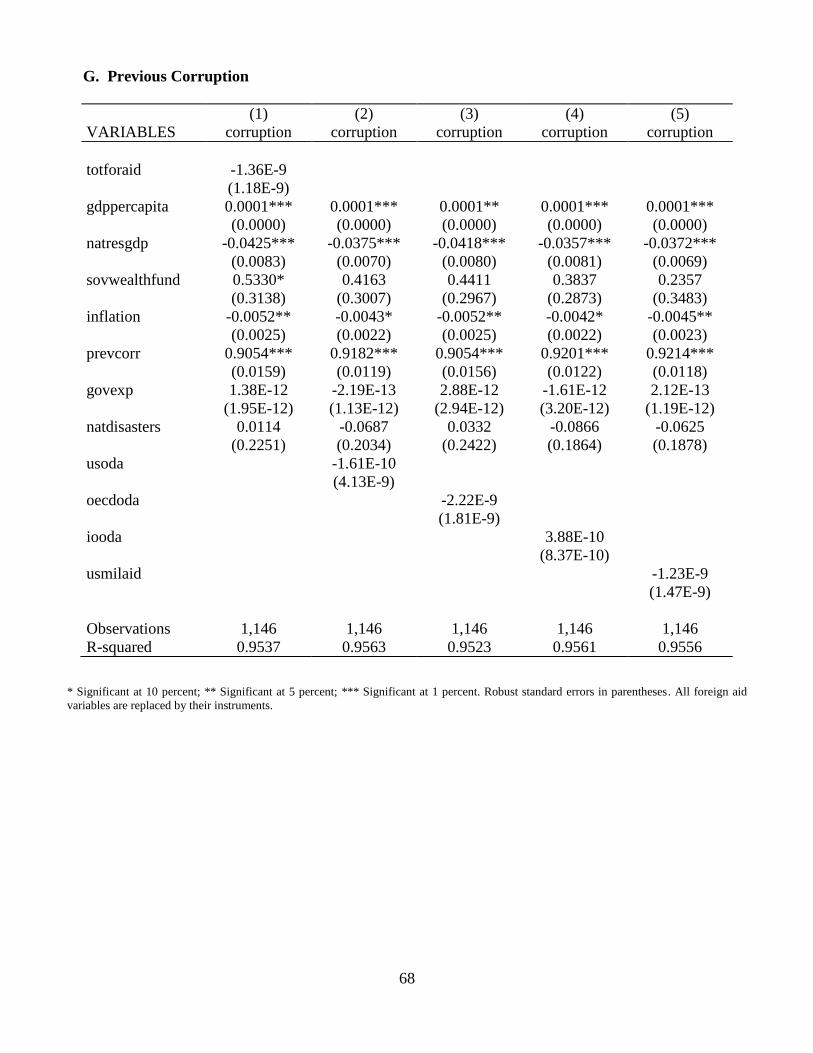
68
G. Previous Corruption
(1) (2) (3) (4) (5)
VARIABLES corruption corruption corruption corruption corruption
totforaid -1.36E-9
(1.18E-9)
gdppercapita 0.0001*** 0.0001*** 0.0001** 0.0001*** 0.0001***
(0.0000) (0.0000) (0.0000) (0.0000) (0.0000)
natresgdp -0.0425*** -0.0375*** -0.0418*** -0.0357*** -0.0372***
(0.0083) (0.0070) (0.0080) (0.0081) (0.0069)
sovwealthfund 0.5330* 0.4163 0.4411 0.3837 0.2357
(0.3138) (0.3007) (0.2967) (0.2873) (0.3483)
inflation -0.0052** -0.0043* -0.0052** -0.0042* -0.0045**
(0.0025) (0.0022) (0.0025) (0.0022) (0.0023)
prevcorr 0.9054*** 0.9182*** 0.9054*** 0.9201*** 0.9214***
(0.0159) (0.0119) (0.0156) (0.0122) (0.0118)
govexp 1.38E-12 -2.19E-13 2.88E-12 -1.61E-12 2.12E-13
(1.95E-12) (1.13E-12) (2.94E-12) (3.20E-12) (1.19E-12)
natdisasters 0.0114 -0.0687 0.0332 -0.0866 -0.0625
(0.2251) (0.2034) (0.2422) (0.1864) (0.1878)
usoda -1.61E-10
(4.13E-9)
oecdoda -2.22E-9
(1.81E-9)
iooda 3.88E-10
(8.37E-10)
usmilaid -1.23E-9
(1.47E-9)
Observations 1,146 1,146 1,146 1,146 1,146
R-squared 0.9537 0.9563 0.9523 0.9561 0.9556
* Significant at 10 percent; ** Significant at 5 percent; *** Significant at 1 percent. Robust standard errors in parentheses. All foreign aid
variables are replaced by their instruments.

69
Bibliography
Alesina, Alberto and Dollar, David. “Who Gives Aid to Whom and Why?” Journal of Economic Growth
5.1 (2000).
Alesina, Alberto and Weder, Beatrice. “Do Corrupt Governments Receive Less Foreign Aid?” The
American Economic Review 92.4 (2002).
Bauer, Peter Thomas. Dissent on Development. Cambridge: Harvard University Press, 1972.
Beets, Douglas. “Understanding the Demand-Side Issues of International Corruption.” Journal of
Business Ethics 57(2005).
Burnside, Craig and Dollar, David. “Aid, Policies, and Growth.” American Economic Review 90.4 (2000).
Cerqueti, Roy, Coppier, Raffaella, and Piga, Gustavo. “Corruption, Growth, and Ethnic
Fractionalization.” Journal of Economics 106.2 (2012).
Cheung, H.Y. and Chan, A.W.H. “Corruption across Countries: Impacts from Education and Cultural
Dimensions.” Social Science Journal 45:2 (2008).
Djankov, Simeon, La Porta, Rafael, Lopez-de-Silanes, Florencio, and Shleifer, Andrei. “Courts: The Lex
Mundi Project.” Quarterly Journal of Economics 118.2 (2003).
Easterly, William. The White Man’s Burden: Why the West’s Efforts to Aid the Rest Have Done So Much
Ill and So Much Good. New York: Penguin, 2006.
Frot, Emmanuel and Perrotta, Maria. “Aid Effectiveness: New Instrument, New Results?” SITE Working
Paper Series 11 (2010).
Huntington, Samuel. Political Order in Changing Societies. New Haven: Yale University Press, 2006.
Knack, Stephen. “Aid Dependence and the Quality of Governance: Cross-Country Empirical Tests.”
Southern Economic Journal 68.2 (2001).
Knack, Stephen and Keefer, Philip. “Institutions and Economic Performance: Cross-Country Tests Using
Alternative Institutional Measures.” Economics & Politics 7.3 (1995).
Kolstad, Ivar and Wiig, Arne. “Does Democracy Reduce Corruption?” CMI Working Paper (2011).
Lambsdorff, Johann Graf. “Corruption in Empirical Research—A Review.” World Bank (1999).
La Porta, Rafael, Lopez-de-Silanes, Florencio, and Shleifer, Andrei. “The Economic Consequences of
Legal Origins.” Journal of Economic Literature 46.2 (2008).
La Porta, Rafael, Lopez-de-Silanes, Florencio, Shleifer, Andrei, and Vishny, Robert. “The Quality of
Government.” Journal of Law, Economics, and Organization 15.1 (1999).

70
Mauro, Paolo. “Corruption and Growth.” The Quarterly Journal of Economics 110.3 (1995).
“Monterrey Consensus of the International Conference on Financing for Development.” United Nations
(2002).
Montinola, Gabriella and Jackman, Robert. “Sources of Corruption: A Cross-Country Study.” British
Journal of Political Science 32.1 (2002).
Moyo, Dambisa. Dead Aid: Why Aid is Not Working and How There is a Better Way for Africa. New
York: Farrar, Strauss and Giroux, 2009.
Okada, Keisuke and Samreth, Sovannroeun. “The Effect of Foreign Aid on Corruption: A Quantile
Regression Approach.” Economic Letters 115.2 (2012).
Pellegrini, Lorenzo and Gerlagh, Reyer. “Causes of Corruption: A Survey of Cross Country Analyses and
Extended Results.” Economics of Governance 9 (2008).
Rajan, Raghuram and Subramanian, Arvind. “Aid and Growth: What Does the Cross-Country Evidence
Really Show?” The Review of Economics and Statistics 90.4 (2008).
Rock, Michael. “Corruption and Democracy,” DESA Working Paper (2007).
Rose-Ackerman, Susan. Corruption: A Study in Political Economy. New York: Academic Press, 1978.
Rose-Ackerman, Susan. Corruption and Government: Causes: Consequences, and Reform. Cambridge:
Cambridge University Press, 1999.
Sachs, Jeffrey. The End of Poverty: Economic Possibilities for Our Time. New York: Penguin, 2005.
Sachs, Jeffrey and Warner, Andrew. “The Big Push, Natural Resource Booms and Growth.” Journal of
Development Economics 59.1 (1999).
Saha, Shrabani and Campbell, Neil. “Studies of the Effect of Democracy on Corruption” (2007).
Svensson, Jakob. “Aid, Growth, and Democracy.” Economics & Politics 11.3 (1999).
Svensson, Jakob. “Foreign Aid and Rent-Seeking.” Journal of International Economics 51 (2000).
Tanzi, Vito and Davoodi, Hamid. “Corruption, Growth, and Public Finances.” IMF Working Paper
(2000).
“The Paris Declaration on Aid Effectiveness and the Accra Agenda for Action.” Organisation for
Economic Co-operation and Development (2005, 2008).
Treisman, Daniel. “The Causes of Corruption: A Cross-National Study.” Journal of Public Economics
76.3 (2000).
Transparency International. Corruption Perceptions Index.

71
Wacziarg, Romain, Desmet, Klaus, and Ortuño-Ortin, Ignacio. “The Political Economy of Linguistic
Cleavages.” Journal of Development Economics 97.2 (2012).
Wedeman, Andrew. “Looters, Rent-Scrapers, and Dividend-Collectors: Corruption and Growth in Zaire,
South Korea, and the Philippines.” The Journal of Developing Areas 31.4 (1997).
World Bank. World Development Indicators.
World Bank, World Development Report 1996.
World Bank, World Development Report 1997.