Foreign Affairs and Trade Portfoliodfat.gov.au/about-us/corporate/portfolio-budget.... Use of...
187
Portfolio Budget Statements 2016-17 Budget Related Paper No. 1.9 Foreign Affairs and Trade Portfolio Budget Initiatives and Explanations of Appropriations Specified by Outcomes and Programs by Entity
Transcript of Foreign Affairs and Trade Portfoliodfat.gov.au/about-us/corporate/portfolio-budget.... Use of...
Portfolio Budget Statements 2016-17 Budget Related Paper No. 1.9
Foreign Affairs and Trade Portfolio
Budget Initiatives and Explanations of Appropriations Specified by Outcomes
and Programs by Entity

ii
© Commonwealth of Australia 2016
ISBN 978-1-74322-318-5
This publication is available for your use under a Creative Commons BY Attribution
3.0 Australia licence, with the exception of the Commonwealth Coat of Arms, the
Department of Foreign Affairs and Trade logo, photographs, images, signatures and
where otherwise stated. The full licence terms are available from http://creativecommons.org/licenses/by/3.0/au/legalcode.
Use of Foreign Affairs and Trade portfolio material under a Creative Commons BY
Attribution 3.0 Australia licence requires you to attribute the work (but not in any way
that suggests that the Foreign Affairs and Trade portfolio endorses you or your use of
the work).
Foreign Affairs and Trade portfolio material used 'as supplied'
Provided you have not modified or transformed Foreign Affairs and Trade portfolio
material in any way including, for example, by changing the Foreign Affairs and Trade
portfolio text; calculating percentage changes; graphing or charting data; or deriving
new statistics from published Foreign Affairs and Trade portfolio statistics – then the
Foreign Affairs and Trade portfolio prefers the following attribution:
Source: The Australian Government Foreign Affairs and Trade portfolio
Derivative material
If you have modified or transformed Foreign Affairs and Trade portfolio material, or
derived new material from those of the Foreign Affairs and Trade portfolio in any way,
then the Foreign Affairs and Trade portfolio prefers the following attribution:
Based on The Australian Government Foreign Affairs and Trade portfolio data
Use of the Coat of Arms
The terms under which the Coat of Arms can be used are set out on the It’s an Honour
website (see www.itsanhonour.gov.au)
Other uses
Enquiries regarding this licence and any other use of this document are welcome at:
Mr Paul Wood, Chief Financial Officer, Department of Foreign Affairs and Trade.

iii
MINISTER FOR FOREIGN AFFAIRS
MINISTER FOR TRADE AND INVESTMENT PARLIAMENT HOUSE
CANBERRA 2600
President of the Senate
Australian Senate
Parliament House
CANBERRA ACT 2600
Speaker
House of Representatives
Parliament House
CANBERRA ACT 2600
Dear Mr President
Dear Mr Speaker
We hereby submit Portfolio Budget Statements in support of the 2016-17 Budget for
the Foreign Affairs and Trade portfolio.
These statements have been developed, and are submitted to the Parliament, as a
statement on the outcomes for the portfolio.
We present these statements to provide accountability to the Parliament and, through
it, the public.
Yours sincerely
The Hon Julie Bishop MP The Hon Steven Ciobo MP
Minister for Foreign Affairs Minister for Trade and Investment

iv
Abbreviations and conventions
The following notation may be used:
NEC/nec not elsewhere classified
- nil
.. not zero, but rounded to zero
na not applicable (unless otherwise specified)
nfp not for publication
$m $ million
$b $ billion
Figures in tables and in the text may be rounded. Figures in text are generally rounded
to one decimal place, whereas figures in tables are generally rounded to the nearest
thousand. Discrepancies in tables between totals and sums of components are due to
rounding.
Enquiries
Should you have any enquiries regarding this publication please contact
Mr Paul Wood, Chief Financial Officer in the Department of Foreign Affairs and Trade
on (02) 6261 1240.
Links to Portfolio Budget Statements (including Portfolio Additional Estimates
Statements and Portfolio Supplementary Additional Estimates Statements) can be
located on the Australian Government Budget website at: www.budget.gov.au.

v
USER GUIDE TO THE
PORTFOLIO BUDGET STATEMENTS

vi
USER GUIDE
The purpose of the 2016-17 Portfolio Budget Statements (PB Statements) is to inform
Senators and Members of Parliament of the proposed allocation of resources to
government outcomes by entities within the portfolio. Entities receive resources from
the annual appropriations acts, special appropriations (including standing
appropriations and special accounts), and revenue from other sources.
A key role of the PB Statements is to facilitate the understanding of proposed annual
appropriations in Appropriation Bills (No. 1 and No. 2) 2016-17 (or Appropriation
(Parliamentary Departments) Bill (No. 1) 2016-17 for the parliamentary departments).
In this sense the PB Statements are Budget related papers and are declared by the
Appropriation Acts to be ‘relevant documents’ to the interpretation of the Acts
according to section 15AB of the Acts Interpretation Act 1901.
The PB Statements provide information, explanation and justification to enable
Parliament to understand the purpose of each outcome proposed in the Bills.
As required under section 12 of the Charter of Budget Honesty Act 1998, only entities
within the general government sector are included as part of the Commonwealth
general government sector fiscal estimates and produce PB Statements where they
receive funding (either directly or via portfolio departments) through the annual
appropriation acts.

vii
CONTENTS
Portfolio overview ......................................................................................................... 1
Foreign Affairs and Trade portfolio overview .................................................................. 3
Entity resources and planned performance ............................................................... 7
Department of Foreign Affairs and Trade (DFAT) ........................................................... 9
Australian Trade and Investment Commission (Austrade) ........................................... 69
Australian Centre for International Agricultural Research (ACIAR) ............................ 109
Australian Secret Intelligence Service (ASIS) ............................................................. 135
Tourism Australia ........................................................................................................ 149
Portfolio glossary ...................................................................................................... 175


1
PORTFOLIO OVERVIEW


3
FOREIGN AFFAIRS AND TRADE PORTFOLIO OVERVIEW
Ministers and portfolio responsibilities
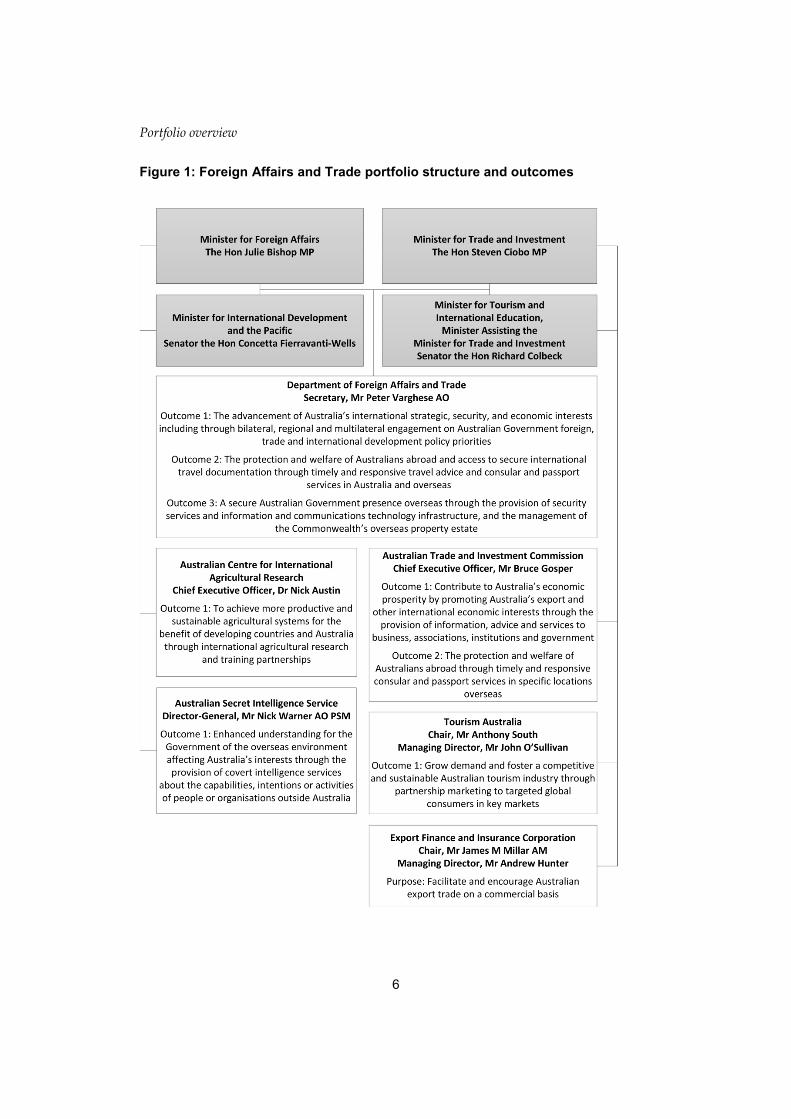
The four portfolio ministers are the Minister for Foreign Affairs, the
Hon Julie Bishop MP, the Minister for Trade and Investment, the
Hon Steven Ciobo MP, the Minister for International Development and the Pacific,
Senator the Hon Concetta Fierravanti-Wells, and the Minister for Tourism and
International Education and the Minister Assisting the Minister for Trade and
Investment, Senator the Hon Richard Colbeck.
The portfolio consists of the Department of Foreign Affairs and Trade (DFAT), the
Australian Trade and Investment Commission (Austrade), the Australian Secret
Intelligence Service (ASIS), the Australian Centre for International Agricultural
Research (ACIAR), Tourism Australia and the Export Finance and Insurance
Corporation (Efic).
DFAT works to make Australia stronger, safer and more prosperous by promoting and
protecting our interests internationally and contributing to global stability and
economic growth, particularly in the Indo-Pacific region. In partnership with
government and non-government organisations, business and community groups in
Australia and overseas, the department leads the Government’s efforts to shape the
regional and international environment, progress Australia’s international security
priorities and strengthen global cooperation in ways that advance Australia’s interests.
The department works to maintain and open up new access to markets and generate
conditions for increased trade and investment to strengthen Australia’s economy and
create new higher paying jobs. It helps lift economic growth and reduce poverty in the
Indo-Pacific region and beyond. The department projects a positive image of Australia
as a preferred destination for business, investment, tourism and study and provides
high-quality passport and consular advice to Australian citizens. The department leads
the Government’s response to international crises, including humanitarian disasters.
The Government’s economic diplomacy agenda – led by DFAT with support from
Austrade, Tourism Australia, Efic and ACIAR – is driving innovation, and boosting
access to global markets and investment in Australia. DFAT will support the ongoing
implementation of recent free trade agreements with China, Japan and the
Republic of Korea as well as other existing agreements, and also support the entry into
force of the Trans-Pacific Partnership Agreement. The department will continue
negotiating other priority bilateral and regional trade agreements, and renew efforts to
progress plurilateral and multilateral trade negotiations.

Portfolio overview
4
DFAT will deliver an innovative aid program, centred on the Indo-Pacific region,
which contributes to sustainable economic growth, poverty reduction and regional
stability. The Australian aid program will maintain a strong commitment to
development in the Pacific and focus on building economic partnerships in Asia.
DFAT will strengthen the aid program’s engagement with the private sector and
embed gender equality and the empowerment of women and girls across 80 per cent
of its mainstream aid investments. DFAT’s innovationXchange will continue to build
on and facilitate innovation in the aid program, experiment with new ways of solving
intractable problems and forge new collaborations with the private sector and
entrepreneurs in this work.
By supporting Australian undergraduates to study and undertake internships in the
region, the New Colombo Plan will continue to increase knowledge of the Indo-Pacific
in Australia and strengthen people-to-people links. In 2016-17, the opportunities for
young Australian students offered under the program will continue to grow.
With more Australians travelling overseas than ever before, DFAT will continue to
provide high quality consular services, responsive travel advice and a secure and
efficient passport service. In 2016-17, the department will build on its first Consular
Strategy to develop a second three-year Strategy covering 2017-19. This will refine
consular policy and practices to respond to increasing demands while maintaining
Australia’s consular service at the forefront of world’s best practice. Austrade will also
deliver consular and passport services in specific locations overseas.
The effectiveness and security of Australia’s network of overseas diplomatic missions
will remain a high priority. The department will continue to maintain and protect
Australia’s secure government communications system. DFAT will provide high-
quality protocol services to diplomatic and consular missions and international
organisations accredited to Australia.
Austrade will contribute to Australia’s economic prosperity by promoting Australia’s
international trade, investment and education interests, and providing advice to
Government on tourism policy. Austrade has a particular focus on growth and
emerging markets, including those in Asia that offer commercial potential and provide
opportunities aligned with Australia’s comparative advantage. Within these markets,
there is a clear role for Austrade as a Government agency to support Australian
businesses and education institutions. Austrade, with DFAT, will also continue to
promote the opportunities created by free trade agreements.
Austrade will partner with state and territory governments and other Commonwealth
Government agencies to attract productive foreign direct investment in priority sectors
from established and other emerging markets. Austrade will also promote Australia as
a preferred education destination and provider of education services, and continue to
Portfolio overview
5
administer several grant programs. Austrade will continue implementing the
Government’s tourism policy, Tourism 2020, working on tourism policy, projects,
programs and research to strengthen Australia's tourism industry, and grow
Australia's tourism market share.
Tourism Australia will continue to promote Australia as a compelling tourism
destination for international leisure and business events visitors. Tourism Australia
will focus its marketing on consumers in key international markets, working in
partnership with state and territory tourism organisations, industry and commercial
partners to increase the economic benefits of tourism to Australia by building demand
and increasing visitation and visitor spending.
DFAT will work closely with Austrade, Tourism Australia and other Commonwealth
Government agencies to advance Australia’s Tourism 2020 domestic reform priorities.
The department will continue to strengthen bilateral tourism relationships with major
source countries and participate in key multilateral tourism forums.
Through ASIS, the portfolio will continue to enhance government understanding of
the overseas environment affecting Australia’s vital interests and take appropriate
action, consistent with applicable legislation, to protect identified interests.
ACIAR’s work underpins Australia’s national interest by contributing to economic
growth and poverty reduction in the Indo-Pacific region. ACIAR will continue to
improve the productivity, sustainability and profitability of agricultural systems,
through international agricultural research and training partnerships. ACIAR’s
research partnerships will enhance and promote agricultural competitiveness and
sustainability, increased market access, and value-chain efficiencies and effectiveness.
Farm-level productivity and the competitiveness of both traditional and emerging
value chains to achieve access on domestic and international markets will continue to
be a primary focus. Projects will tackle gender inequality in their design, delivery and
impact. ACIAR will maintain its core mandate of producing excellent research, and
will work through others to achieve up-scaling and broader development outcomes.
ACIAR will also continue to administer and manage Australia’s investment in
multilateral innovation through the CGIAR (formerly ‘the Consultative Group on
International Agricultural Research’).
Efic helps Australian companies exporting and investing overseas to gain access to
finance and insurance services. Efic provides financial facilities for exporters, including
loans, guarantees, bonds and political risk insurance, with a focus on small and
medium enterprises and those seeking to do business in emerging markets. Efic will
continue to work closely with DFAT and Austrade in the delivery of these services. It
will also manage the National Interest Account on behalf of the Commonwealth.
For information on resourcing across the portfolio, please refer to Part 1: Agency
Financial Resourcing in Budget Paper No. 4: Agency Resourcing.
Portfolio overview
6
Figure 1: Foreign Affairs and Trade portfolio structure and outcomes

7
ENTITY RESOURCES AND PLANNED PERFORMANCE
Department of Foreign Affairs and Trade (DFAT) ...................................................... 9
Australian Trade and Investment Commission (Austrade) .................................... 69
Australian Centre for International Agricultural Research (ACIAR) .................... 109
Australian Secret Intelligence Service (ASIS) ........................................................ 135
Tourism Australia ...................................................................................................... 149


9
Department of Foreign Affairs and Trade (DFAT)
Entity resources and planned performance


11
DEPARTMENT OF FOREIGN AFFAIRS AND TRADE
Section 1: Entity overview and resources ................................................................ 13
1.1 Strategic direction statement .......................................................................... 13
1.2 Entity resource statement ............................................................................... 20
1.3 Budget measures ............................................................................................ 22
Section 2: Outcomes and planned performance ..................................................... 25
2.1 Budgeted expenses and performance for Outcome 1 .................................... 26
2.2 Budgeted expenses and performance for Outcome 2 .................................... 41
2.3 Budgeted expenses and performance for Outcome 3 .................................... 47
Section 3: Budgeted financial statements ................................................................ 52
3.1 Budgeted financial statements........................................................................ 52
3.2.1 Budgeted financial statements tables ............................................................. 55


DFAT Budget Statements
13
DEPARTMENT OF FOREIGN AFFAIRS AND TRADE
(DFAT)
Section 1: Entity overview and resources
1.1 STRATEGIC DIRECTION STATEMENT
The Department of Foreign Affairs and Trade (DFAT) supports Ministers in the
delivery of Australia’s foreign, trade and investment, development and international
security policy priorities. In 2016-17, the department will continue to make Australia
stronger, safer and more prosperous by promoting and protecting our interests
internationally and contributing to global stability and economic growth, particularly
in the Indo-Pacific region.
Australia has global interests, with a strong focus on the Indo-Pacific region. In
2016-17, the department will continue to advance Australia’s interests in a more
complex global and regional environment. The department will help Government
shape the international environment through development of strong bilateral
relationships; coalition-building with other nations with common interests; and an
activist approach to using regional and global institutions and forums to create rules
and norms that promote stability, peace and prosperity. DFAT recognises that gender
equality and women’s empowerment are important to Australia’s national interest and
are a priority across all of our work.
DFAT will continue to provide timely, high-quality advice to Ministers on
international developments and appropriate policy responses. The department will use
Australia’s overseas missions to build strong networks and for high-quality
information-gathering, analysis and advocacy in support of government policies.
DFAT will maximise opportunities to advocate Australian interests through support
for ministerial visits to key partners and international forums.
Strengthening Australia’s key regional partnerships will remain a priority for the
department. The engagement of the United States (US) in the Indo-Pacific provides
major security and economic benefits to the region, and to Australia. Through
Australia’s alliance with the US, and extensive economic ties, the department will
work to support the US contribution to regional and global security and prosperity.
The department will work to strengthen Australia’s partnerships with Japan, China
and the Republic of Korea, building on shared strategic perspectives and
implementing the new free trade agreements. The department will deepen Australia’s
engagement with Indonesia, including on regional security, trade and investment and
development challenges. The department will continue to enhance Australia’s strategic
and economic relationship with India, including by working to conclude the bilateral

DFAT Budget Statements
14
Comprehensive Economic Cooperation Agreement (CECA). The department will take
our bilateral relationship with Singapore to a new level through implementation of the
Comprehensive Strategic Partnership.
It is in Australia’s interest to have secure, stable and prosperous neighbours. The
department will drive Australia’s comprehensive engagement with Papua New
Guinea (PNG) to strengthen our bilateral strategic, economic and business partnership.
The Pacific Leadership and Governance Precinct initiative to strengthen PNG public
sector leadership will remain a priority. Australia will promote continued peace and
development in Bougainville, PNG.
Australia will continue to strengthen bilateral relations with Fiji and other Pacific
Island countries. As the drawdown of the Regional Assistance Mission to Solomon
Islands (RAMSI) continues to mid-2017, the department will work to enhance
Australia’s engagement with the Solomon Islands. Further deepening of Australia’s
close relationship with New Zealand and our cooperation in the Pacific, including with
the Pacific Islands Forum, will remain a priority.
Australia will continue to strengthen partnerships with the nations of Southeast Asia
and regionally through the Association of Southeast Asian Nations (ASEAN). The
department will drive forward the ASEAN-Australia strategic partnership and
support the Prime Minister in the first biennial summit under this partnership in 2016.
The department will leverage new economic partnerships in the region through the aid
program, including with Indonesia, the Philippines and Vietnam.
DFAT will continue efforts to strengthen the East Asia Summit (EAS), build support
for increased regional cooperation on maritime issues and work with ASEAN and its
free trade agreement partners (Australia, China, India, Japan, the Republic of Korea
and New Zealand) to progress the Regional Comprehensive Economic Partnership
(RCEP) negotiations. The department will work closely with Peru, the 2016 Asia-
Pacific Economic Cooperation (APEC) host, and Vietnam, the 2017 host, to support
APEC in promoting economic growth and prosperity in the region. The department
will also lead the Government’s efforts to support PNG’s hosting of APEC in 2018.
The New Colombo Plan is deepening Australia’s relationships in the Indo-Pacific by
offering undergraduate students opportunities for scholarships and grants for study
and internships/mentorships in the region. Operating in 38 locations, approximately
5,000 grants will be offered in 2017 as the program expands to enable more students to
live, study and work in the Indo-Pacific region.
The Government will continue to invest in the Australia Awards to support our
partner countries to progress their development goals. Leaders of tomorrow will have
the opportunity to study at Australia’s world class institutions where we hope to build
trust and mutual understanding so together we can contribute to development and
prosperity in our region.
DFAT Budget Statements
15
Through the measure International Engagement to Prevent and Disrupt Maritime People
Smuggling - continuation, the department will continue to support whole-of-
government efforts to prevent people-smuggling, and engage with key countries on
related returns and resettlement initiatives in support of Operation Sovereign Borders.
The department will also support, through the Bali Process, regional cooperation to
address irregular migration challenges, and increased prevention and law enforcement
activities to combat human trafficking.
The department will continue to support cooperation in the Indian Ocean region
through the Indian Ocean Rim Association (IORA). As part of the MIKTA grouping
(Mexico, Indonesia, Republic of Korea, Turkey and Australia), Australia will seek to
foster constructive solutions to emerging global challenges and enhance bilateral and
plurilateral ties.
The department will work to strengthen Australia’s political and economic relations
with Europe, including by sustaining momentum in Australia-UK Ministerial
(AUKMIN) meetings and the strategic partnerships with France and Germany. The
department will further enhance relations with the European Union (EU), including
working toward a free trade agreement and signing of the Framework Agreement. The
department will facilitate continued cooperation with Ukraine, including on the
international investigations on the downing of Malaysia Airlines flight MH17. The
department will engage with Russia on matters of national interest to Australia, while
implementing continued sanctions.
The department will also continue to advance Australia’s growing economic, strategic
and security interests in South Asia, the Americas, the Middle East and Africa,
including by identifying further opportunities for trade and investment.
DFAT will continue to work with Middle East nations and other partners in the
international coalition to combat terrorist groups, including Daesh and Al-Qaeda. The
department will maintain Australia’s diplomatic presence in Baghdad to pursue
bilateral engagement with Iraq and support Australian personnel deployed to train
and advise the Iraqi Security Forces as well as Australian forces taking part in air
strikes against Daesh. The department will also support Australian Government efforts
to stop Australians joining terrorist networks and travelling overseas to become
foreign fighters.
The department will support Australia’s continued engagement with Afghanistan,
including as part of the NATO-led ‘Resolute Support’ mission, and work to influence
developments in ways that promote stability and protect Australia's interests.
As a trading economy, Australia’s economic success is closely tied to the openness of
international markets. DFAT, working with Austrade, will focus on expanding access
to international markets for Australian exporters and lowering the cost of doing
business in Australia. DFAT will encourage two-way flows of investment that are in

DFAT Budget Statements
16
the national interest and ensure trade and investment reform supports the
Government’s broader domestic economic policy agenda to drive growth and create
new higher paying jobs.
DFAT is leading the Government’s economic diplomacy agenda which is driven by the
core objectives of trade, growth, investment and business. It applies across the
department’s work drawing together foreign, trade, investment, tourism and
development policies and leveraging our international networks and diplomatic assets.
The Beyond the Border initiative will support economic diplomacy by utilising
Australia’s international assets to tackle barriers to trade and investment in our major
trading partners.
The department will support the entry into force of the Trans-Pacific Partnership and
the ongoing implementation of recent FTAs with China, Japan and the
Republic of Korea. Through the measure Free Trade Agreement Portal – enhancements,
DFAT will expand the coverage of the Government’s online FTA portal to assist small
and medium enterprises understand and take advantage of the FTAs through a range
of programs and initiatives, including Austrade’s Export Market Development Grants
scheme. The department will continue to leverage the benefits of existing FTAs with
countries in Southeast Asia, New Zealand, the US and Chile, while taking advantage
of built-in agendas to review and update those agreements where appropriate.
The department will work towards conclusion of RCEP, which will build on
Australia’s existing FTA with ASEAN and New Zealand and complement the Trans-
Pacific Partnership and Australia’s bilateral FTAs in the region. Australia will also
continue to progress negotiations with India, Indonesia, the Pacific Island countries
and New Zealand through the Pacific Agreement on Closer Economic Relations –
PACER Plus, and the Gulf Cooperation Council. The department will also explore
opportunities for new FTAs, including in the Indo-Pacific region.
Australia is committed to the pursuit of global trade reform. The department will work
to find ways to progress negotiations in the World Trade Organization (WTO),
including on remaining issues from the Doha Round. Following the WTO agreement
to eliminate over $15 billion worth of agricultural export subsidy entitlements, DFAT
will continue to support a stronger, more competitive Australian agriculture and
agribusiness sector. The department will push for further agricultural trade reform in
the WTO, including through the Cairns Group, and seek to unlock new opportunities
for exports of manufactures, services, and mineral and energy products.
Australia will also provide leadership in major plurilateral negotiations, including the
Trade in Services Agreement that Australia co-chairs, which will further liberalise
global services trade and the Environmental Goods Agreement, which Australia also
chairs. Australia is negotiating accession to the plurilateral Agreement on Government
Procurement. DFAT will ensure trading partners’ compliance with WTO and FTA
obligations through consultation and dispute mechanisms, where appropriate.

DFAT Budget Statements
17
Australia will work within the Group of Twenty (G20) to lift global growth and job
opportunities and make the global economy more resilient.
The department, together with Austrade and Efic, will continue to work closely with
Treasury to ensure Australia’s foreign investment regime supports much needed
inward investment and meets the national interest. This will help build Australia’s
productive capacity, unlock our national economic potential, particularly in Northern
Australia, and support the transition to a diversified prosperous economy.
DFAT will continue to implement the Government’s development policy Australian
aid: promoting prosperity, reducing poverty, enhancing stability. The aid program’s purpose
is to promote Australia’s national interests by contributing to sustainable economic
growth and poverty reduction. The program is focused on supporting private sector
development and strengthening human development. The department will support
the delivery of the 2030 Agenda for Sustainable Development and is working to
further embed the Agenda into the Australian aid program.
DFAT’s innovationXchange will be working to multiply the impact of Australian aid
by fostering new partnerships which will bring new finance and fresh creative
solutions to development challenges. It will seek to link collaborators and investors
prepared to test new ways of tackling problems, and use these lessons to inform the
future direction of work. The innovationXchange will support broader efforts to
encourage innovation across the department and coordinate the department’s support
for the National Innovation and Science Agenda, working closely with the Department
of Industry, Innovation and Science and Austrade.
Australia will continue to support its developing country partners through an
approach that acknowledges the different development trajectories of the Pacific and
growing Asia. Australia will maintain a leadership role through our aid program to
the Pacific and respond to the needs identified in each country. In parts of Asia, where
economic growth and poverty reduction have continued apace, Australian aid will be
targeted primarily toward leveraging domestic capacity and resources.
Gender equality and women and girls' empowerment will be promoted across the aid
program. Australia will also promote development that empowers people with
disabilities. Expenditure on aid for trade will be increased to 20 per cent of official
development assistance (ODA) by 2020 to support trade and sustainable economic
growth in developing countries. Aid for trade investments include economic
infrastructure, agriculture, fisheries and other productive capacity, and trade
facilitation and regulation.
The department will apply the Government’s performance framework for the aid
program, Making Performance Count, to ensure a strong link between funding and
performance, a focus on results and value for money. DFAT’s Office of Development

DFAT Budget Statements
18
Effectiveness will quality assure and verify performance reporting and evaluate aid
effectiveness, under the oversight of the Independent Evaluation Committee.
The department will work with our partners to build resilience by reducing risks from,
preparing for, and responding to disasters, particularly within the Indo-Pacific region.
We will also support countries recovering from disasters, including Fiji in the wake of
tropical Cyclone Winston. Beyond our region, we will continue to provide life-saving
assistance to people affected by ongoing humanitarian crises including in Syria, Iraq
and the Horn of Africa.
The need for strong international cooperation through the United Nations (UN) is
critical to tackle human rights and global security challenges. The department will
pursue Australia’s interests in the UN system, including election to the Human Rights
Council for the 2018-20 term and a United Nations Security Council term in 2029-30.
DFAT will also seek to progress the interests of the world’s indigenous peoples
through the Indigenous Peoples Strategy and strengthen its advocacy in support of
global abolition of the death penalty.
The department will advance Australia’s environment and climate change interests
through a range of forums and seek to capitalise on momentum generated by the 2015
Paris Agreement on Climate Change.
The department will continue to counter the proliferation of nuclear weapons,
constrain the illicit arms trade and counter terrorism. The department will expand our
network of bilateral cyber policy dialogues to include Indonesia as well as China,
India, Japan and Republic of Korea, implement the Government’s cyber security
strategy, and support work to elaborate how international law applies to state
behaviour in cyberspace. Through the measure Cyber Security – implementation of
Australia’s Cyber Security Strategy, the department will work to support the
Government’s efforts to bolster international cyber cooperation and address cyber
challenges through capacity building focused on the Indo-Pacific region and the
establishment of Australia’s first Cyber Ambassador.
Through public diplomacy the department will advance initiatives that promote
Australia’s economic, artistic and cultural, sporting, science and education assets and
underline Australia’s credentials as a destination for business, investment, tourism and
study, and emphasise Australia’s engagement with the Indo-Pacific region. The
department will prioritise promoting Australia’s creative economy and National
Innovation and Science Agenda abroad.
The delivery of high quality consular services is one of the department’s foreign policy
priorities. The department will develop a second three-year Consular Strategy to
strengthen the delivery of consular services and enhance public messaging. The
department will also promote safe travel messages through accurate and timely travel
advice, including through the Smartraveller campaign. The department will sustain its

DFAT Budget Statements
19
investment in the development and testing of strong contingency plans across its
network of overseas posts and lead whole-of-government responses to crises overseas.
The department will continue to deliver an efficient passport service for Australian
citizens. A new and more technologically advanced passport is currently under
development. The Passport Redevelopment Program will continue to ensure the
integrity, security and quality of Australian passports and deliver increased processing
capability, improved client services and enhanced fraud and investigation controls.
Through the measure Expanding Australia’s Diplomatic Representation, the Government
will increase the nation’s diplomatic footprint by opening two additional offices, one in
China (with the location to be announced after further consultations with China) and
one in Papua New Guinea (Lae) following consultation with the host government. In
addition to providing consular services, these offices will support Australia’s trade and
investment in China and PNG.
The security and safety of Australian Government personnel and their dependants
overseas, together with the security of its missions, remains a high priority for the
department in an unpredictable and fluid international security environment. This will
require the implementation and maintenance of comprehensive and effective strategic
risk mitigation strategies and operational and personal security measures.
The department will continue its efforts to build a more resilient, flexible and cohesive
organisation that can better deliver the Government’s agenda. The department is
implementing its Women in Leadership strategy to support women’s career
advancement and build a more inclusive workplace culture in DFAT which maximises
performance and capability. The department is implementing its first workforce plan
as a tool to improve its capabilities to meet Australia’s foreign, trade and economic,
international security, development and consular challenges.
The department will continue to implement changes required by the Public
Governance, Performance and Accountability (PGPA) Act, including the enhanced
Commonwealth performance framework. The department is implementing a new
approach to risk management which will encourage staff to engage with risk in a
positive way to improve policy development and service delivery. The department
will also continue to support the Government’s regulatory reform agenda by removing
unnecessary regulation and only imposing new regulation where it is absolutely
necessary.
DFAT Budget Statements
20
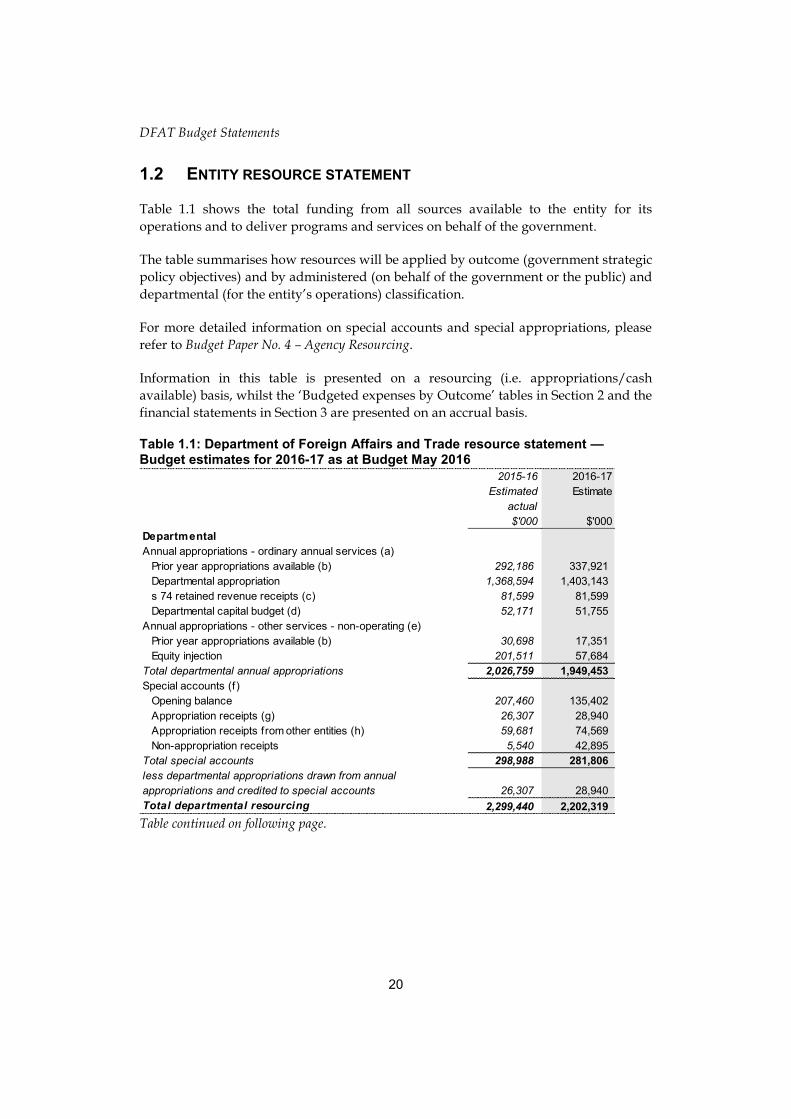
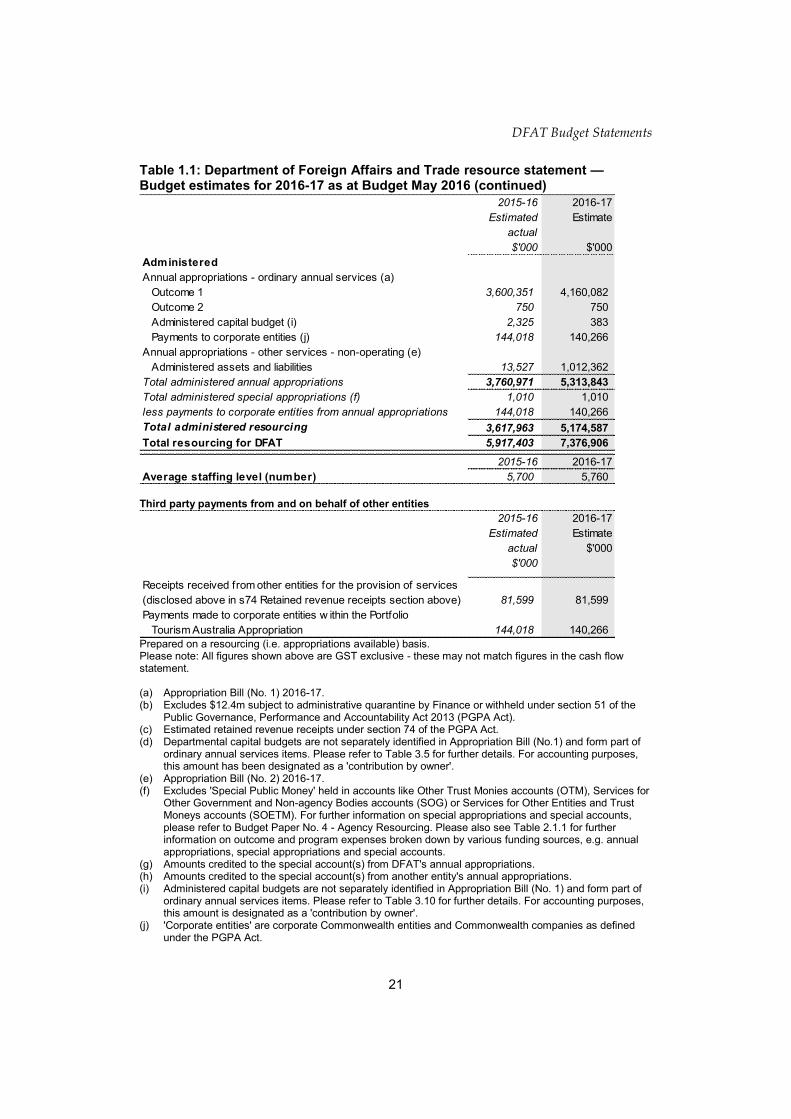
1.2 ENTITY RESOURCE STATEMENT
Table 1.1 shows the total funding from all sources available to the entity for its
operations and to deliver programs and services on behalf of the government.
The table summarises how resources will be applied by outcome (government strategic
policy objectives) and by administered (on behalf of the government or the public) and
departmental (for the entity’s operations) classification.
For more detailed information on special accounts and special appropriations, please
refer to Budget Paper No. 4 – Agency Resourcing.
Information in this table is presented on a resourcing (i.e. appropriations/cash
available) basis, whilst the ‘Budgeted expenses by Outcome’ tables in Section 2 and the
financial statements in Section 3 are presented on an accrual basis.
Table 1.1: Department of Foreign Affairs and Trade resource statement — Budget estimates for 2016-17 as at Budget May 2016
Table continued on following page.
2015-16
Estimated
actual
$'000
2016-17
Estimate
$'000
Departmental
Annual appropriations - ordinary annual services (a)
Prior year appropriations available (b) 292,186 337,921
Departmental appropriation 1,368,594 1,403,143
s 74 retained revenue receipts (c) 81,599 81,599
Departmental capital budget (d) 52,171 51,755
Annual appropriations - other services - non-operating (e)
Prior year appropriations available (b) 30,698 17,351
Equity injection 201,511 57,684
Total departmental annual appropriations 2,026,759 1,949,453
Special accounts (f)
Opening balance 207,460 135,402
Appropriation receipts (g) 26,307 28,940
Appropriation receipts from other entities (h) 59,681 74,569
Non-appropriation receipts 5,540 42,895
Total special accounts 298,988 281,806
less departmental appropriations drawn from annual
appropriations and credited to special accounts 26,307 28,940
Total departmental resourcing 2,299,440 2,202,319
DFAT Budget Statements
21
Table 1.1: Department of Foreign Affairs and Trade resource statement — Budget estimates for 2016-17 as at Budget May 2016 (continued)
Third party payments from and on behalf of other entities
Prepared on a resourcing (i.e. appropriations available) basis. Please note: All figures shown above are GST exclusive - these may not match figures in the cash flow statement. (a) Appropriation Bill (No. 1) 2016-17. (b) Excludes $12.4m subject to administrative quarantine by Finance or withheld under section 51 of the
Public Governance, Performance and Accountability Act 2013 (PGPA Act). (c) Estimated retained revenue receipts under section 74 of the PGPA Act. (d) Departmental capital budgets are not separately identified in Appropriation Bill (No.1) and form part of
ordinary annual services items. Please refer to Table 3.5 for further details. For accounting purposes, this amount has been designated as a 'contribution by owner'.
(e) Appropriation Bill (No. 2) 2016-17. (f) Excludes 'Special Public Money' held in accounts like Other Trust Monies accounts (OTM), Services for
Other Government and Non-agency Bodies accounts (SOG) or Services for Other Entities and Trust Moneys accounts (SOETM). For further information on special appropriations and special accounts, please refer to Budget Paper No. 4 - Agency Resourcing. Please also see Table 2.1.1 for further information on outcome and program expenses broken down by various funding sources, e.g. annual appropriations, special appropriations and special accounts.
(g) Amounts credited to the special account(s) from DFAT's annual appropriations. (h) Amounts credited to the special account(s) from another entity's annual appropriations. (i) Administered capital budgets are not separately identified in Appropriation Bill (No. 1) and form part of
ordinary annual services items. Please refer to Table 3.10 for further details. For accounting purposes, this amount is designated as a 'contribution by owner'.
(j) 'Corporate entities' are corporate Commonwealth entities and Commonwealth companies as defined under the PGPA Act.
2015-16
Estimated
actual
$'000
2016-17
Estimate
$'000
Administered
Annual appropriations - ordinary annual services (a)
Outcome 1 3,600,351 4,160,082
Outcome 2 750 750
Administered capital budget (i) 2,325 383
Payments to corporate entities (j) 144,018 140,266
Annual appropriations - other services - non-operating (e)
Administered assets and liabilities 13,527 1,012,362
Total administered annual appropriations 3,760,971 5,313,843
Total administered special appropriations (f) 1,010 1,010
less payments to corporate entities from annual appropriations 144,018 140,266
Total administered resourcing 3,617,963 5,174,587
Total resourcing for DFAT 5,917,403 7,376,906
2015-16 2016-17
Average staffing level (number) 5,700 5,760
2015-16
Estimated
actual
$'000
2016-17
Estimate
$'000
Receipts received from other entities for the provision of services
(disclosed above in s74 Retained revenue receipts section above) 81,599 81,599
Payments made to corporate entities w ithin the Portfolio
Tourism Australia Appropriation 144,018 140,266

DFAT Budget Statements
22
1.3 BUDGET MEASURES
Budget measures in Part 1 relating to the Department of Foreign Affairs and Trade are
detailed in Budget Paper No. 2 and are summarised below.
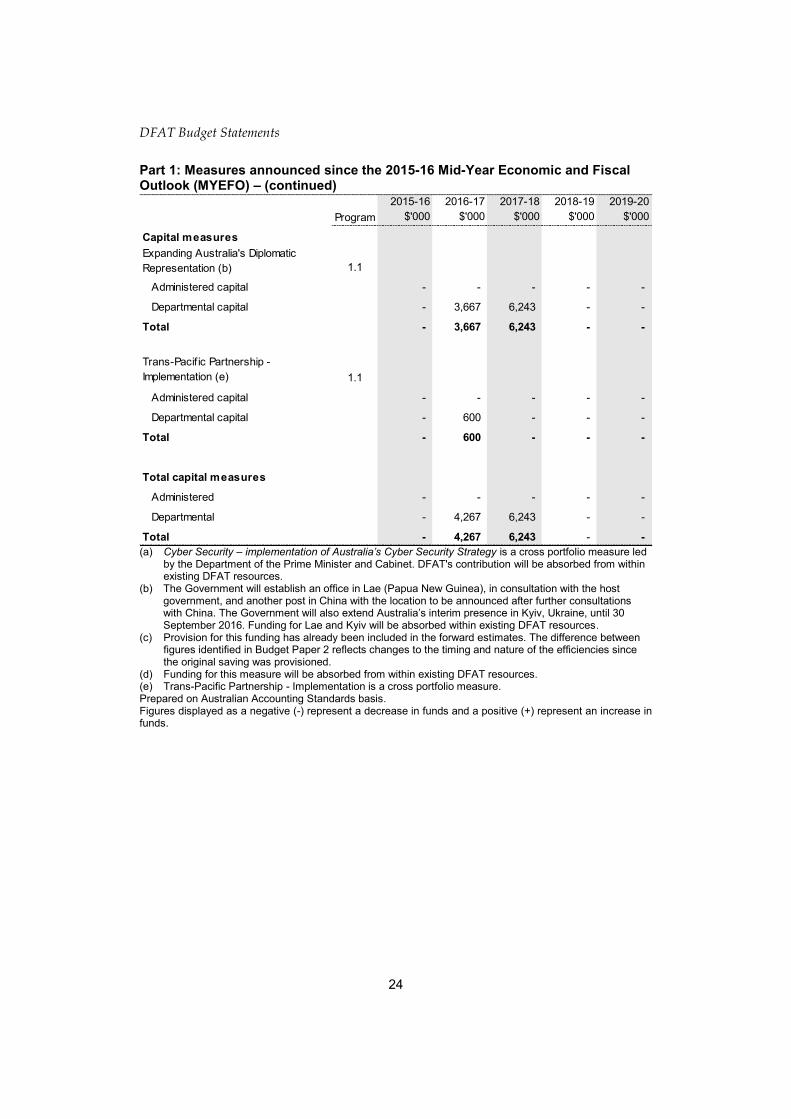
Table 1.2: Entity 2016-17 Budget measures
Part 1: Measures announced since the 2015-16 Mid-Year Economic and Fiscal Outlook (MYEFO)
Table continued on following page.
Program
2015-16
$'000
2016-17
$'000
2017-18
$'000
2018-19
$'000
2019-20
$'000
Revenue measures
Notarial Fees - increase 2.1
Administered revenues - 5,905 12,948 14,152 15,517
Departmental revenues - - - - -
Total - 5,905 12,948 14,152 15,517
Passport Fees - supporting consular
services 2.2
Administered revenues - 24,196 47,513 48,651 52,543
Departmental revenues - - - - -
Total - 24,196 47,513 48,651 52,543
Total revenue measures
Administered - 30,101 60,461 62,803 68,060
Departmental - - - - -
Total - 30,101 60,461 62,803 68,060
Expense measures
Cyber Security - implementation of
Australia's Cyber Security Strategy (a) 1.1
Administered expenses - - - - -
Departmental expenses - - - - -
Total - - - - -
Expanding Australia's Diplomatic
Representation (b) 1.1
Administered expenses - - - - -
Departmental expenses - 1,088 3,945 5,492 5,745
Total - 1,088 3,945 5,492 5,745

DFAT Budget Statements
23
Part 1: Measures announced since the 2015-16 Mid-Year Economic and Fiscal Outlook (MYEFO) – (continued)
Table continued on following page.
Program
2015-16
$'000
2016-17
$'000
2017-18
$'000
2018-19
$'000
2019-20
$'000
Foreign Affairs and Trade Portfolio -
eff iciencies (c)
1.1, 2.1,
2.2, 3.1
Administered expenses - - - - -
Departmental expenses (321) (10,714) (12,900) (13,143) (13,395)
Total (321) (10,714) (12,900) (13,143) (13,395)
Free Trade Agreement Portal -
enhancements (d) 1.1
Administered expenses - - - - -
Departmental expenses - - - - -
Total - - - - -
International Engagement to Prevent
and Disrupt Maritime People Smuggling -
continuation 1.1
Administered expenses - - - - -
Departmental expenses - 2,304 2,336 2,270 2,290
Total - 2,304 2,336 2,270 2,290
Passport Funding Arrangements -
additional funding 2.2
Administered expenses - - - - -
Departmental expenses - 13,959 8,777 10,471 13,467
Total - 13,959 8,777 10,471 13,467
Total expense measures
Administered - - - - -
Departmental (321) 6,637 2,158 5,090 8,107
Total (321) 6,637 2,158 5,090 8,107
DFAT Budget Statements
24
Part 1: Measures announced since the 2015-16 Mid-Year Economic and Fiscal Outlook (MYEFO) – (continued)
(a) Cyber Security – implementation of Australia’s Cyber Security Strategy is a cross portfolio measure led
by the Department of the Prime Minister and Cabinet. DFAT's contribution will be absorbed from within existing DFAT resources.
(b) The Government will establish an office in Lae (Papua New Guinea), in consultation with the host government, and another post in China with the location to be announced after further consultations with China. The Government will also extend Australia’s interim presence in Kyiv, Ukraine, until 30 September 2016. Funding for Lae and Kyiv will be absorbed within existing DFAT resources.
(c) Provision for this funding has already been included in the forward estimates. The difference between figures identified in Budget Paper 2 reflects changes to the timing and nature of the efficiencies since the original saving was provisioned.
(d) Funding for this measure will be absorbed from within existing DFAT resources. (e) Trans-Pacific Partnership - Implementation is a cross portfolio measure. Prepared on Australian Accounting Standards basis. Figures displayed as a negative (-) represent a decrease in funds and a positive (+) represent an increase in funds.
Program
2015-16
$'000
2016-17
$'000
2017-18
$'000
2018-19
$'000
2019-20
$'000
Capital measures
Expanding Australia's Diplomatic
Representation (b) 1.1
Administered capital - - - - -
Departmental capital - 3,667 6,243 - -
Total - 3,667 6,243 - -
Trans-Pacif ic Partnership -
Implementation (e) 1.1
Administered capital - - - - -
Departmental capital - 600 - - -
Total - 600 - - -
Total capital measures
Administered - - - - -
Departmental - 4,267 6,243 - -
Total - 4,267 6,243 - -

DFAT Budget Statements
25
Section 2: Outcomes and planned performance
Government outcomes are the intended results, impacts or consequences of actions by
the Government on the Australian community. Commonwealth programs are the
primary vehicle by which government entities achieve the intended results of their
outcome statements. Entities are required to identify the programs which contribute to
government outcomes over the Budget and forward years.
Each outcome is described below together with its related programs. The following
provides detailed information on expenses for each outcome and program, further
broken down by funding source.
Note:
From 1 July 2015, performance reporting requirements in the Portfolio Budget
Statements sit alongside those required under the enhanced Commonwealth
performance framework. It is anticipated that the performance criteria described in
Portfolio Budget Statements will be read with broader information provided in an
entity’s corporate plans and annual performance statements – included in Annual
Reports from October 2016 – to provide an entity’s complete performance story.

DFAT Budget Statements
26
2.1 BUDGETED EXPENSES AND PERFORMANCE FOR OUTCOME 1
Outcome 1: The advancement of Australia’s international strategic, security and economic interests including through bilateral, regional and multilateral engagement on Australian Government foreign, trade and international development priorities
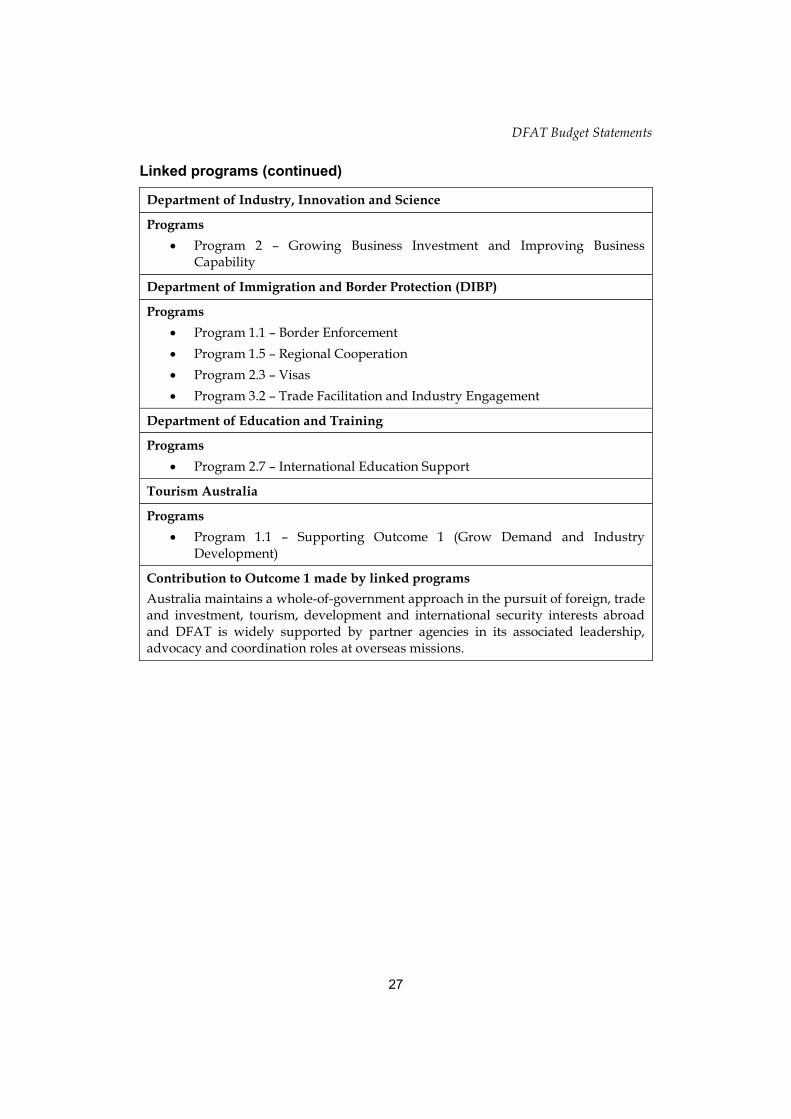
Linked programs
Attorney-General’s Department
Programs
Program 1.1 – Attorney-General’s Department Operating Expenses—Civil Justice and Legal Services
Program 1.2 – Attorney-General’s Department Operating Expenses—National Security and Criminal Justice
Program 1.7 – National Security and Criminal Justice
Australian Centre for International Agricultural Research (ACIAR)
Programs
Program 1.1 – International Agricultural Research For Development For More Productive and Sustainable Agriculture
Australian Federal Police (AFP)
Programs
Program 1.2 – International Police Assistance
Austrade
Programs
Program 1.1 – Promotion of Australia’s Export and Other International Economic Interests
Program 1.2 – Programs to Promote Australia’s Export and Other International Economic Interests
Department of Defence
Programs
Program 1.5 – Joint Operations Command
Table continued on following page.
DFAT Budget Statements
27
Linked programs (continued)
Department of Industry, Innovation and Science
Programs
Program 2 – Growing Business Investment and Improving Business Capability
Department of Immigration and Border Protection (DIBP)
Programs
Program 1.1 – Border Enforcement
Program 1.5 – Regional Cooperation
Program 2.3 – Visas
Program 3.2 – Trade Facilitation and Industry Engagement
Department of Education and Training
Programs
Program 2.7 – International Education Support
Tourism Australia
Programs
Program 1.1 – Supporting Outcome 1 (Grow Demand and Industry Development)
Contribution to Outcome 1 made by linked programs
Australia maintains a whole-of-government approach in the pursuit of foreign, trade and investment, tourism, development and international security interests abroad and DFAT is widely supported by partner agencies in its associated leadership, advocacy and coordination roles at overseas missions.
DFAT Budget Statements
28
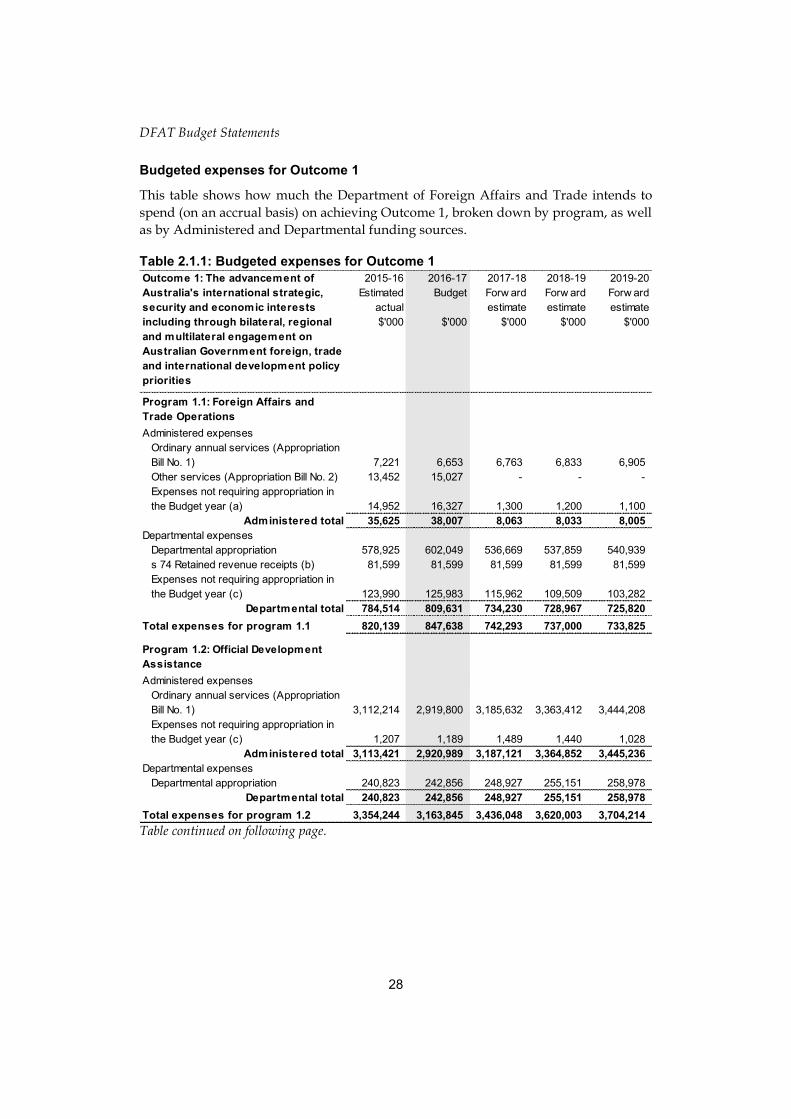
Budgeted expenses for Outcome 1
This table shows how much the Department of Foreign Affairs and Trade intends to
spend (on an accrual basis) on achieving Outcome 1, broken down by program, as well
as by Administered and Departmental funding sources.
Table 2.1.1: Budgeted expenses for Outcome 1
Table continued on following page.
Outcome 1: The advancement of
Australia's international strategic,
security and economic interests
including through bilateral, regional
and multilateral engagement on
Australian Government foreign, trade
and international development policy
priorities
2015-16
Estimated
actual
$'000
2016-17
Budget
$'000
2017-18
Forw ard
estimate
$'000
2018-19
Forw ard
estimate
$'000
2019-20
Forw ard
estimate
$'000
Program 1.1: Foreign Affairs and
Trade Operations
Administered expenses
Ordinary annual services (Appropriation
Bill No. 1) 7,221 6,653 6,763 6,833 6,905
Other services (Appropriation Bill No. 2) 13,452 15,027 - - -
Expenses not requiring appropriation in
the Budget year (a) 14,952 16,327 1,300 1,200 1,100
Administered total 35,625 38,007 8,063 8,033 8,005
Departmental expenses
Departmental appropriation 578,925 602,049 536,669 537,859 540,939
s 74 Retained revenue receipts (b) 81,599 81,599 81,599 81,599 81,599
Expenses not requiring appropriation in
the Budget year (c) 123,990 125,983 115,962 109,509 103,282
Departmental total 784,514 809,631 734,230 728,967 725,820
Total expenses for program 1.1 820,139 847,638 742,293 737,000 733,825
Program 1.2: Official Development
Assistance
Administered expenses
Ordinary annual services (Appropriation
Bill No. 1) 3,112,214 2,919,800 3,185,632 3,363,412 3,444,208
Expenses not requiring appropriation in
the Budget year (c) 1,207 1,189 1,489 1,440 1,028
Administered total 3,113,421 2,920,989 3,187,121 3,364,852 3,445,236
Departmental expenses
Departmental appropriation 240,823 242,856 248,927 255,151 258,978
Departmental total 240,823 242,856 248,927 255,151 258,978
Total expenses for program 1.2 3,354,244 3,163,845 3,436,048 3,620,003 3,704,214
DFAT Budget Statements
29
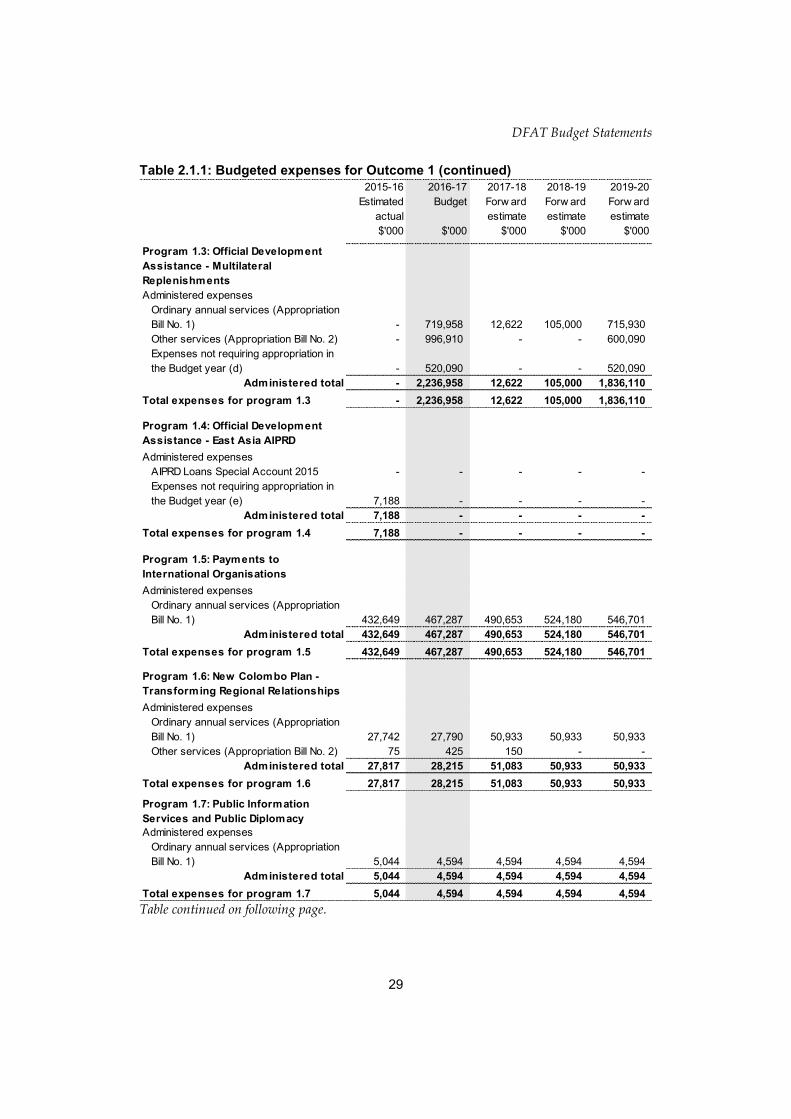
Table 2.1.1: Budgeted expenses for Outcome 1 (continued)
Table continued on following page.
2015-16
Estimated
actual
$'000
2016-17
Budget
$'000
2017-18
Forw ard
estimate
$'000
2018-19
Forw ard
estimate
$'000
2019-20
Forw ard
estimate
$'000
Program 1.3: Official Development
Assistance - Multilateral
Replenishments
Administered expenses
Ordinary annual services (Appropriation
Bill No. 1) - 719,958 12,622 105,000 715,930
Other services (Appropriation Bill No. 2) - 996,910 - - 600,090
Expenses not requiring appropriation in
the Budget year (d) - 520,090 - - 520,090
Administered total - 2,236,958 12,622 105,000 1,836,110
Total expenses for program 1.3 - 2,236,958 12,622 105,000 1,836,110
Program 1.4: Official Development
Assistance - East Asia AIPRD
Administered expenses
AIPRD Loans Special Account 2015 - - - - -
Expenses not requiring appropriation in
the Budget year (e) 7,188 - - - -
Administered total 7,188 - - - -
Total expenses for program 1.4 7,188 - - - -
Program 1.5: Payments to
International Organisations
Administered expenses
Ordinary annual services (Appropriation
Bill No. 1) 432,649 467,287 490,653 524,180 546,701
Administered total 432,649 467,287 490,653 524,180 546,701
Total expenses for program 1.5 432,649 467,287 490,653 524,180 546,701
Program 1.6: New Colombo Plan -
Transforming Regional Relationships
Administered expenses
Ordinary annual services (Appropriation
Bill No. 1) 27,742 27,790 50,933 50,933 50,933
Other services (Appropriation Bill No. 2) 75 425 150 - -
Administered total 27,817 28,215 51,083 50,933 50,933
Total expenses for program 1.6 27,817 28,215 51,083 50,933 50,933
Program 1.7: Public Information
Services and Public Diplomacy
Administered expenses
Ordinary annual services (Appropriation
Bill No. 1) 5,044 4,594 4,594 4,594 4,594
Administered total 5,044 4,594 4,594 4,594 4,594
Total expenses for program 1.7 5,044 4,594 4,594 4,594 4,594

DFAT Budget Statements
30
Table 2.1.1: Budgeted expenses for Outcome 1 (continued)
(a) Includes expenses for the Debt-to-Health Swap with the Government of Indonesia $13.4 million in
2015-16 and $15.0 million in 2016-17 that are funded through Appropriation Bill 2. (b) Estimated expenses incurred in relation to receipts retained under section 74 of the PGPA Act 2013. (c) Expenses not requiring appropriation in the Budget year are made up of depreciation expenses,
amortisation expenses, make good expenses, audit fees. (d) Expenses not requiring appropriation in the Budget year relates to the concessional investment
discount for the discounting of the investment component for the International Development Association and Asian Development Fund.
(e) Expenses not requiring appropriation in the Budget year relates to the concessional loan discount for the AIPRD loans.
Note: Departmental appropriation splits and totals are indicative estimates and may change in the course of the budget year as government priorities change.
2015-16
Estimated
actual
$'000
2016-17
Budget
$'000
2017-18
Forw ard
estimate
$'000
2018-19
Forw ard
estimate
$'000
2019-20
Forw ard
estimate
$'000
Program 1.8: Programs to Promote
Australia's International Tourism
Interests
Administered expenses
Tourism Australia - Corporate
Commonw ealth Entity 144,018 140,266 141,291 144,417 147,462
Ordinary annual services (Appropriation
Bill No. 1) 14,000 14,000 14,000 14,000 14,000
Administered total 158,018 154,266 155,291 158,417 161,462
Total expenses for program 1.8 158,018 154,266 155,291 158,417 161,462
Outcome 1 Totals by appropriation type
Administered Expenses
Ordinary annual services (Appropriation
Bill No. 1) 3,598,870 4,160,082 3,765,197 4,068,952 4,783,271
Corporate Commonw ealth Entity 144,018 140,266 141,291 144,417 147,462
Other services (Appropriation Bill No. 2) 13,527 1,012,362 150 - 600,090
Expenses not requiring appropriation in
the Budget year 23,347 537,606 2,789 2,640 522,218
Administered total 3,779,762 5,850,316 3,909,427 4,216,009 6,053,041
Departmental expenses
Departmental appropriation 819,748 844,905 785,596 793,010 799,917
s 74 Retained revenue receipts (b) 81,599 81,599 81,599 81,599 81,599
Expenses not requiring appropriation in
the Budget year (a, c, d and e) 123,990 125,983 115,962 109,509 103,282
Departmental total 1,025,337 1,052,487 983,157 984,118 984,798
Total expenses for Outcome 1 4,805,099 6,902,803 4,892,584 5,200,127 7,037,839
2015-16 2016-17
Average staffing level (number) 3,749 3,789

DFAT Budget Statements
31
Table 2.1.2: Program components of Outcome 1
2015-16
Estimated
actual
$'000
2016-17
Budget
$'000
2017-18
Forw ard
estimate
$'000
2018-19
Forw ard
estimate
$'000
2019-20
Forw ard
estimate
$'000
Annual administered expenses:
International Climate Change
Engagement 3,000 3,000 3,000 3,000 3,000
Personal Benefits - Locally Engaged
Staff pension schemes 2,980 2,974 3,069 3,123 3,178
Other Administered Items 1,819 679 694 710 727
Other services (Appropriation Bill No. 2)
Debt-to-Health Sw ap w ith
Government of Indonesia 13,452 15,027 - - -
Expenses not requiring appropriation in
the Budget year
Export Finance and Insurance
Corporation (EFIC) - National Interest
Account Expenses 1,500 1,300 1,300 1,200 1,100
Other Administered Items 13,452 15,027 - - -
Departmental expenses
Departmental appropriation 578,925 602,049 536,669 537,859 540,939
s 74 Retained revenue receipts 81,599 81,599 81,599 81,599 81,599
Expenses not requiring appropriation in
the Budget year 123,990 125,983 115,962 109,509 103,282
Total Component 1.1.1 expenses 820,717 847,638 742,293 737,000 733,825
2015-16
Estimated
actual
$'000
2016-17
Budget
$'000
2017-18
Forw ard
estimate
$'000
2018-19
Forw ard
estimate
$'000
2019-20
Forw ard
estimate
$'000
Annual administered expenses:
Country programs 1,682,783 1,603,879 1,643,976 1,685,075 1,727,202
Regional programs 641,695 621,706 667,395 670,395 702,015
Global programs 549,615 355,276 505,322 599,003 599,003
Humanitarian and emergency
response programs 238,121 338,939 368,939 408,939 415,988
Expenses not requiring appropriation in
the Budget year 1,207 1,189 1,489 1,440 1,028
Departmental expenses
Departmental appropriation 240,823 242,856 248,927 255,151 258,978
Total Component 1.2.1 expenses 3,354,244 3,163,845 3,436,048 3,620,003 3,704,214
Program 1.1: Foreign Affairs and Trade Operations
1.1.1 - Component 1: Foreign Affairs and Trade Operations
1.2.1 - Component 2: Official Development Assistance
Program 1.2: Official Development Assistance

DFAT Budget Statements
32
Table 2.1.3: Performance criteria for Outcome 1
Table 2.1.3 below details the performance criteria for each program associated with
Outcome 1. It also summarises how each program is delivered and where 2016-17
Budget measures have created new programs or materially changed existing
programs.
Outcome 1 – The advancement of Australia’s international strategic, security and economic interests including through bilateral, regional and multilateral engagement on Australian Government foreign, trade and international development priorities
Program 1.1 – Foreign Affairs and Trade Operations. The department will assist the Government to meet its foreign, trade and investment, development and international security policy priorities over 2016-17 and forward years. This includes actively shaping the international environment through development of strong bilateral relationships, coalition building with other nations with common interests, and an activist approach to using regional and global institutions and forums to create rules and norms that promote stability, peace and prosperity.
Delivery The department is advancing Australia’s interests through:
Protecting and advancing the national interest through engaging in effective advocacy in Australia and overseas that promotes Australia’s foreign, trade and investment, tourism, development and international security interests.
Delivering accurate and timely policy advice to Ministers and other key clients that addresses the challenges of an evolving international environment.
Promoting a whole-of-government approach in pursuit of Australia’s interests abroad, including through leadership at overseas missions and coordination of the overseas diplomatic network and through liaison with domestic Australian Government agencies and state and territory governments.
Ensuring the security and protecting the dignity of the diplomatic and consular corps serving in Australia by delivering a quality service and upholding Australia’s obligation under the Vienna Conventions.
Performance information
Year Performance criteria Targets
2015-16 • High level of satisfaction of Ministers and high-level clients with the quality and timeliness of advice, briefing and support in relation to Australia’s foreign, trade and economic, development and international security interests.
• The department’s advocacy, negotiation and liaison on Australia’s foreign, trade and economic, development and international security interests contributes positively to bilateral, regional and multilateral outcomes that help ensure the security and prosperity of Australia and Australians.
• Government agencies at overseas missions are satisfied with service provided in accordance with the Prime Minister’s Directive on the Guidelines for the Management of the Australian Government Presence Overseas and service level agreements in place.
• The diplomatic and consular corps accredited to Australia are satisfied with the level of service provided, including in terms of responsiveness and timeliness in meeting Australia’s obligations under the Vienna Conventions.
Targets are:
Met
Partially met
Not met
DFAT expects that these performance criteria will be met during the course of 2015-16.
Table continued on following page.
DFAT Budget Statements
33
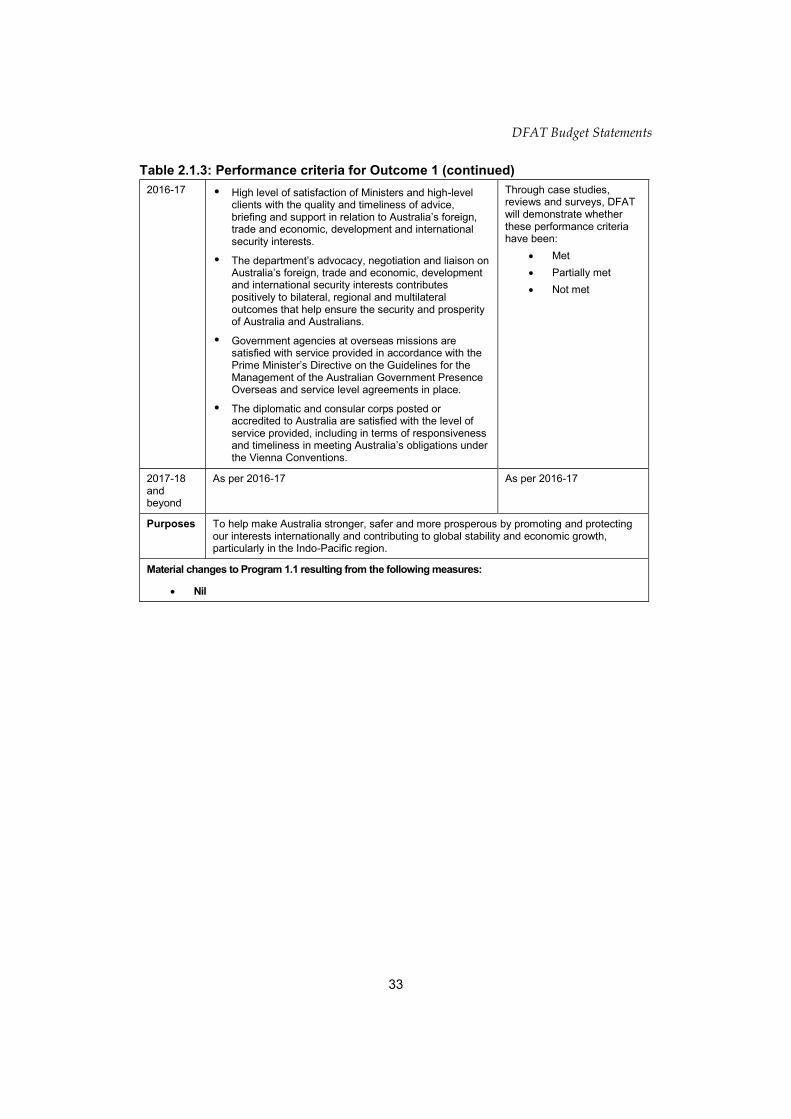
Table 2.1.3: Performance criteria for Outcome 1 (continued)
2016-17 • High level of satisfaction of Ministers and high-level clients with the quality and timeliness of advice, briefing and support in relation to Australia’s foreign, trade and economic, development and international security interests.
• The department’s advocacy, negotiation and liaison on Australia’s foreign, trade and economic, development and international security interests contributes positively to bilateral, regional and multilateral outcomes that help ensure the security and prosperity of Australia and Australians.
• Government agencies at overseas missions are satisfied with service provided in accordance with the Prime Minister’s Directive on the Guidelines for the Management of the Australian Government Presence Overseas and service level agreements in place.
• The diplomatic and consular corps posted or accredited to Australia are satisfied with the level of service provided, including in terms of responsiveness and timeliness in meeting Australia’s obligations under the Vienna Conventions.
Through case studies, reviews and surveys, DFAT will demonstrate whether these performance criteria have been:
Met
Partially met
Not met
2017-18 and beyond
As per 2016-17 As per 2016-17
Purposes To help make Australia stronger, safer and more prosperous by promoting and protecting our interests internationally and contributing to global stability and economic growth, particularly in the Indo-Pacific region.
Material changes to Program 1.1 resulting from the following measures:
Nil

DFAT Budget Statements
34
Program 1.2 – Official Development Assistance promotes Australia’s national interests by contributing to
sustainable economic growth and poverty reduction.
Delivery The Australian Government’s aid policy, Australian aid: promoting prosperity, reducing poverty, enhancing stability shapes the way Australia delivers its official development assistance (ODA). It focuses on two development outcomes: supporting private sector development and strengthening human development.
Australia’s ODA investments focus on six priority areas:
• infrastructure, trade facilitation and international competitiveness;
• agriculture, fisheries and water;
• effective governance through policies, institutions and functioning economies;
• education and health;
• building resilience through humanitarian assistance, disaster risk reduction and social protection; and
• gender equality and empowering women and girls.
Performance information
Year Performance criteria Targets
2015-16 • Achievement of significant development results and demonstrated organisational effectiveness, including progress towards the strategic targets contained in the Australian aid program’s performance framework, Making Performance Count.
• Detailed reporting against the performance framework, including individual program and investment performance, will be published annually in the Performance of Australian Aid report.
Targets are:
Met
Partially met
Not met
DFAT expects that these performance criteria will be met during the course of 2015-16.
2016-17 • Achievement of significant development results and demonstrated organisational effectiveness, including progress towards the strategic targets contained in the Australian aid program’s performance framework, Making Performance Count.
• Detailed reporting against the performance framework, including individual program and investment performance, will be published annually in the Performance of Australian Aid report.
Through case studies and reviews, DFAT will demonstrate whether these performance criteria have been:
Met
Partially met
Not met
2017-18 and beyond
As per 2016-17 As per 2016-17
Purposes To help make Australia stronger, safer and more prosperous by promoting and protecting our interests internationally and contributing to global stability and economic growth, particularly in the Indo-Pacific region.
Material changes to Program 1.2 resulting from the following measures:
Nil

DFAT Budget Statements
35
Program 1.3 – Official Development Assistance – Multilateral Replenishments assists developing countries by contributing to sustainable economic growth and poverty reduction through contributions to multilateral organisations.
Delivery Australia’s official development assistance is advanced through our work with multilateral organisations. Their reach, leverage, specialisation and other strengths play a critical role in helping Australia to meet its international development objectives.
Performance information
Year Performance criteria Targets
2015-16 • Australia assesses the performance of its multilateral partners to inform our engagement with them and to ensure value for money from our multilateral funding.
• Australia is strengthening its approach to the assessment of performance of multilateral organisations in line with the aid performance framework, Making Performance Count.
• Strengthened systems for assessing the performance of multilateral aid delivery partners.
Targets are:
Met
Partially met
Not met
DFAT expects that these performance criteria will be met during the course of 2015-16.
2016-17 • Achievement of significant development results and demonstrated organisational effectiveness, including progress towards the strategic targets contained in the Australian aid program’s performance framework, Making Performance Count.
• Detailed reporting against the performance framework, including for multilateral replenishments, will be published annually in the Performance of Australian Aid report.
Through case studies and reviews, DFAT will demonstrate whether these performance criteria have been:
Met
Partially met
Not met
2017-18 and beyond
As per 2016-17 As per 2016-17
Purposes To help make Australia stronger, safer and more prosperous by promoting and protecting our interests internationally and contributing to global stability and economic growth, particularly in the Indo-Pacific region.
Material changes to Program 1.3 resulting from the following measures:
Nil

DFAT Budget Statements
36
Program 1.4 – Official Development Assistance – East Asia: Australia-Indonesia Partnership for Reconstruction and Development (AIPRD) assists Indonesia in reconstruction and development in the aftermath of the 2004 Indian Ocean Tsunami.
Delivery The Australia-Indonesia Partnership for Reconstruction and Development (AIPRD) between Australia and Indonesia consisted of $500 million in grant funding and $500 million in highly concessional loans.
The final disbursement of the AIPRD program was made in 2014-15 and as a result the program is now complete. The Department of Foreign Affairs and Trade no longer provides performance information for this program.

DFAT Budget Statements
37
Program 1.5 – Payment to International Organisations advances Australia’s foreign, trade and investment, development and international security interests through participation in international organisations.
Delivery Australia’s participation in international organisations is delivered through:
• Australian membership of international organisations and international treaty secretariats through payments of assessed and voluntary contributions.
• Effective participation in the United Nations and its Specialised Agencies, the World Trade Organization and other multilateral forums in support of Australia’s foreign, trade and economic, development and international security interests.
• Contributions to UN and other international organisations to assist developing countries reduce poverty and lift living standards through sustainable economic growth.
Performance information
Year Performance criteria Targets
2015-16 • Payments to international organisations are timely and within budget.
• The department’s contributions influence multilateral outcomes which enhance Australia’s security and prosperity, maximise the impact of Australia’s aid program and represent value for money.
Targets are:
Met
Partially met
Not met
DFAT expects that these performance criteria will be met during the course of 2015-16.
2016-17 • The department’s contributions shape multilateral outcomes in accordance with Australia’s interests.
• High-quality leadership of government strategies on multilateral issues.
Through case studies and reviews, DFAT will demonstrate whether these performance criteria have been:
Met
Partially met
Not met
2017-18 and beyond
As per 2016-17 As per 2016-17
Purposes To help make Australia stronger, safer and more prosperous by promoting and protecting our interests internationally and contributing to global stability and economic growth, particularly in the Indo-Pacific region.
Material changes to Program 1.5 resulting from the following measures:
Nil

DFAT Budget Statements
38
Program 1.6 – New Colombo Plan – Transforming Regional Relationships advances Australia’s interests and bilateral relationships through enduring people-to-people, institutional and business links with the Indo-Pacific region.
Delivery The New Colombo Plan (NCP) will be delivered in 38 Indo-Pacific locations, fostering closer people-to-people and institutional links and contributing to an overall increase in the number of Australian undergraduate students undertaking study and internships in the region.
Performance information
Year Performance criteria Targets
2015-16 • More Australian undergraduates supported to study and intern in the Indo-Pacific region.
• NCP participants build relationships in the region and promote the value of the NCP experience.
• Universities, the private sector and partner governments support the implementation of the NCP.
• Alumni are engaged through networks that foster professional development and ongoing connections with the region.
Targets are:
Met
Partially met
Not met
DFAT expects that these performance criteria will be met during the course of 2015-16.
2016-17 • More Australian undergraduates supported to study and intern in the Indo-Pacific region.
• NCP participants build relationships in the region and promote the value of the NCP experience.
• Universities, the private sector and partner governments support the implementation of the NCP.
• Alumni are engaged through networks that foster professional development and ongoing connections with the region.
Through case studies and reviews, DFAT will demonstrate whether these performance criteria have been:
Met
Partially met
Not met
2017-18 and beyond
As per 2016-17 As per 2016-17
Purposes To help make Australia stronger, safer and more prosperous by promoting and protecting our interests internationally and contributing to global stability and economic growth, particularly in the Indo-Pacific region.
Material changes to Program 1.6 resulting from the following measures:
Nil

DFAT Budget Statements
39
Program 1.7– Public Information Services and Public Diplomacy projects a positive and contemporary image of Australia and promotes a clear understanding of Government policies and objectives and engagement with the Indo-Pacific region through the department’s public diplomacy, cultural and media activities.
Delivery The department’s public diplomacy, cultural and media activities are:
• Promoting people-to-people links and a contemporary and positive image of Australia as a creative and innovative nation and as a destination for business, investment, tourism and study and support the Government’s international policy goals.
• Advancing Australia’s national interests through new approaches which engage audiences on contemporary Australia and facilitate networks, collaboration and connections between people and institutions to build understanding, trust and influence.
Performance information
Year Performance criteria Targets
2015-16 • An understanding of contemporary Australia and the government’s foreign, trade, investment and development credentials, and strengthened people-to-people and institutional links and trade, economic and cultural ties.
Targets are:
Met
Partially met
Not met
DFAT expects that this performance criterion will be met during the course of 2015-16.
2016-17 • Public diplomacy initiatives build links overseas to further Australia’s interests and increase Australia’s influence.
• Inform and influence media reporting on Australia.
• Timely and high-quality management of domestic and international media enquiries, including measurement of the quantity and quality of departmental responses to media enquiries.
• High-quality stakeholder engagement including through departmental and embassy websites and social media platforms.
Through case studies and reviews, DFAT will demonstrate whether these performance criteria have been:
Met
Partially met
Not met
2017-18 and beyond
As per 2016-17 As per 2016-17
Purposes To help make Australia stronger, safer and more prosperous by promoting and protecting our interests internationally and contributing to global stability and economic growth, particularly in the Indo-Pacific region.
Material changes to Program 1.7 resulting from the following measures:
Nil

DFAT Budget Statements
40
Program 1.8 – Programs to Promote Australia’s International Tourism Interests
Delivery The delivery of this program is the responsibility of Austrade and Tourism Australia.
Performance information
Year Performance criteria Targets
2015-16 Refer to Austrade’s Outcomes and planned performance section for 2015-16 objectives, deliverables and performance criteria.
Refer to Tourism Australia’s Outcomes and planned performance section for 2015-16 objectives, deliverables and performance criteria.
2016-17 Refer to Austrade’s Outcomes and planned performance section for 2016-17 for objectives, deliverables, performance criteria and targets.
Refer to the Tourism Australia’s Outcomes and planned performance section for 2016-17 for objectives, deliverables, performance criteria and targets.
2017-18 and beyond
See 2016-17 above.
Purposes To help make Australia stronger, safer and more prosperous by promoting and protecting our interests internationally and contributing to global stability and economic growth, particularly in the Indo-Pacific region. Also refer to Austrade’s and Tourism Australia’s corporate plans for information on the contribution of this program to these organisation’s purposes.
Material changes to Program 1.8 resulting from the following measures:
Nil

DFAT Budget Statements
41
2.2 BUDGETED EXPENSES AND PERFORMANCE FOR OUTCOME 2
Outcome 2: The protection and welfare of Australians abroad and access to secure international travel documentation through timely and responsive travel advice and consular and passport services in Australia and overseas
Linked programs
Austrade
Programs
Program 2.1 – Consular and Passport Services
Department of Human Services
Programs
Program 1.1 – Services to the Community-Social Security and Welfare
Contribution to Outcome 2 made by linked programs
DFAT is supported by the Department of Human Services and Austrade in the delivery of high-quality consular services, including the provision of Australian passport information services and the repatriation of vulnerable Australians.
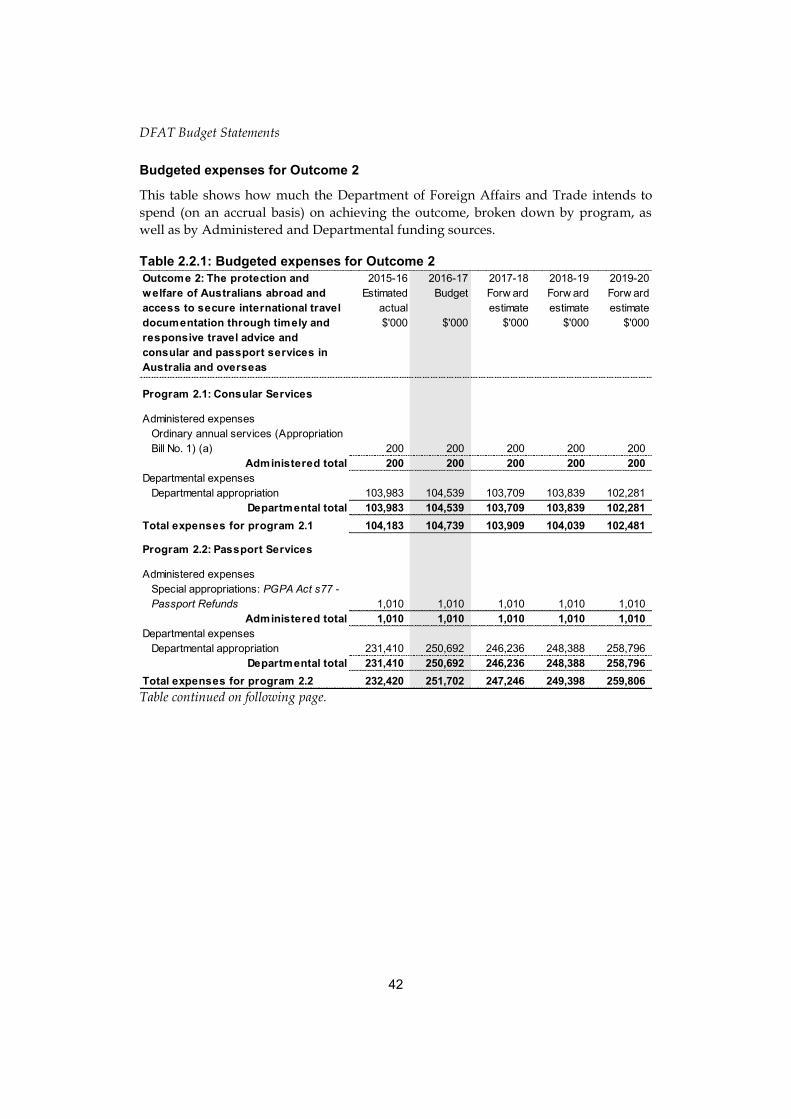
DFAT Budget Statements
42
Budgeted expenses for Outcome 2
This table shows how much the Department of Foreign Affairs and Trade intends to
spend (on an accrual basis) on achieving the outcome, broken down by program, as
well as by Administered and Departmental funding sources.
Table 2.2.1: Budgeted expenses for Outcome 2
Table continued on following page.
Outcome 2: The protection and
welfare of Australians abroad and
access to secure international travel
documentation through timely and
responsive travel advice and
consular and passport services in
Australia and overseas
2015-16
Estimated
actual
$'000
2016-17
Budget
$'000
2017-18
Forw ard
estimate
$'000
2018-19
Forw ard
estimate
$'000
2019-20
Forw ard
estimate
$'000
Program 2.1: Consular Services
Administered expenses
Ordinary annual services (Appropriation
Bill No. 1) (a) 200 200 200 200 200
Administered total 200 200 200 200 200
Departmental expenses
Departmental appropriation 103,983 104,539 103,709 103,839 102,281
Departmental total 103,983 104,539 103,709 103,839 102,281
Total expenses for program 2.1 104,183 104,739 103,909 104,039 102,481
Program 2.2: Passport Services
Administered expenses
Special appropriations: PGPA Act s77 -
Passport Refunds 1,010 1,010 1,010 1,010 1,010
Administered total 1,010 1,010 1,010 1,010 1,010
Departmental expenses
Departmental appropriation 231,410 250,692 246,236 248,388 258,796
Departmental total 231,410 250,692 246,236 248,388 258,796
Total expenses for program 2.2 232,420 251,702 247,246 249,398 259,806

DFAT Budget Statements
43
Table 2.2.1: Budgeted expenses for Outcome 2 (continued)
(a) This expense does not include $0.55m for Traveller's Emergency Loans as these are treated as
receivables and form part of the receivables balance in Table 3.8.
Note: Departmental appropriation splits and totals are indicative estimates and may change in the course of the budget year as government priorities change.
2015-16
Estimated
actual
$'000
2016-17
Budget
$'000
2017-18
Forw ard
estimate
$'000
2018-19
Forw ard
estimate
$'000
2019-20
Forw ard
estimate
$'000
Outcome 2 Totals by appropriation type
Administered expenses
Ordinary annual services (Appropriation
Bill No. 1) (a) 200 200 200 200 200
Special appropriations 1,010 1,010 1,010 1,010 1,010
Administered total 1,210 1,210 1,210 1,210 1,210
Departmental expenses
Departmental appropriation 335,393 355,231 349,945 352,227 361,077
Departmental total 335,393 355,231 349,945 352,227 361,077
Total expenses for Outcome 2 336,603 356,441 351,155 353,437 362,287
2015-16 2016-17
Average staffing level (number) 1,082 1,093
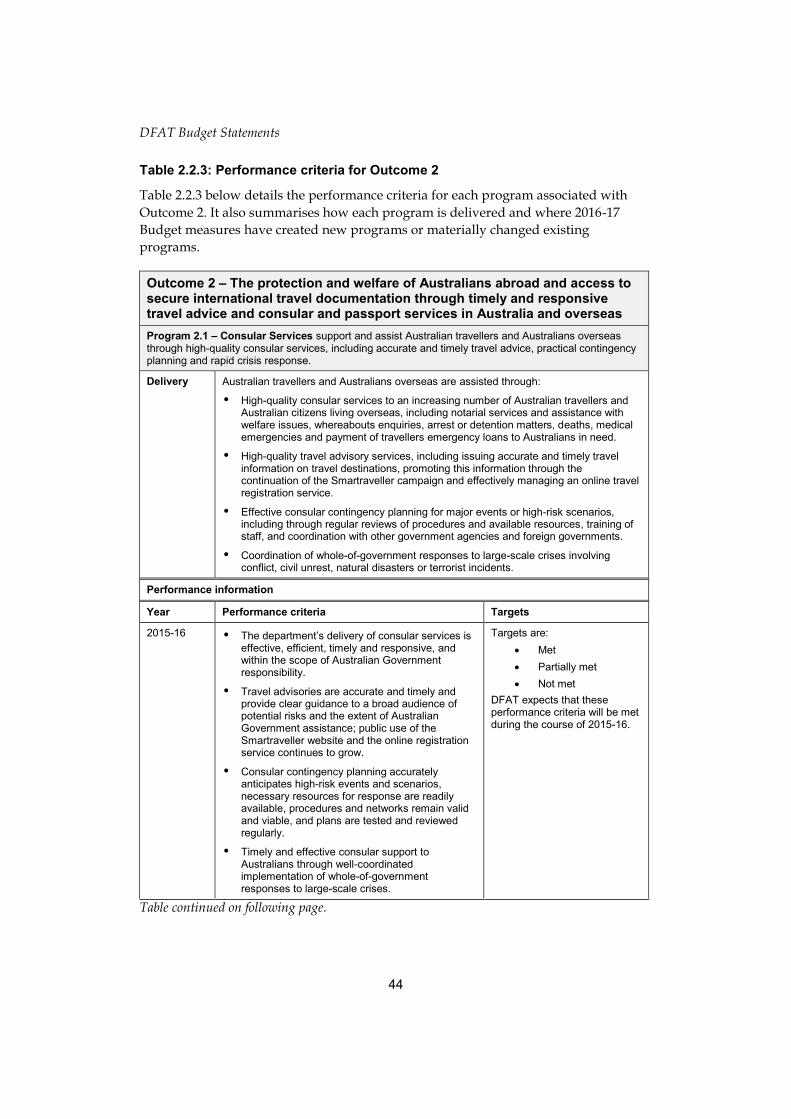
DFAT Budget Statements
44
Table 2.2.3: Performance criteria for Outcome 2
Table 2.2.3 below details the performance criteria for each program associated with
Outcome 2. It also summarises how each program is delivered and where 2016-17
Budget measures have created new programs or materially changed existing
programs.
Outcome 2 – The protection and welfare of Australians abroad and access to secure international travel documentation through timely and responsive travel advice and consular and passport services in Australia and overseas
Program 2.1 – Consular Services support and assist Australian travellers and Australians overseas through high-quality consular services, including accurate and timely travel advice, practical contingency planning and rapid crisis response.
Delivery Australian travellers and Australians overseas are assisted through:
• High-quality consular services to an increasing number of Australian travellers and Australian citizens living overseas, including notarial services and assistance with welfare issues, whereabouts enquiries, arrest or detention matters, deaths, medical emergencies and payment of travellers emergency loans to Australians in need.
• High-quality travel advisory services, including issuing accurate and timely travel information on travel destinations, promoting this information through the continuation of the Smartraveller campaign and effectively managing an online travel registration service.
• Effective consular contingency planning for major events or high-risk scenarios, including through regular reviews of procedures and available resources, training of staff, and coordination with other government agencies and foreign governments.
• Coordination of whole-of-government responses to large-scale crises involving conflict, civil unrest, natural disasters or terrorist incidents.
Performance information
Year Performance criteria Targets
2015-16 • The department’s delivery of consular services is effective, efficient, timely and responsive, and within the scope of Australian Government responsibility.
• Travel advisories are accurate and timely and provide clear guidance to a broad audience of potential risks and the extent of Australian Government assistance; public use of the Smartraveller website and the online registration service continues to grow.
• Consular contingency planning accurately anticipates high-risk events and scenarios, necessary resources for response are readily available, procedures and networks remain valid and viable, and plans are tested and reviewed regularly.
• Timely and effective consular support to Australians through well-coordinated implementation of whole-of-government responses to large-scale crises.
Targets are:
Met
Partially met
Not met
DFAT expects that these performance criteria will be met during the course of 2015-16.
Table continued on following page.

DFAT Budget Statements
45
Table 2.2.3: Performance criteria for Outcome 2 (continued)
2016-17 • Timely and effective delivery of consular services to Australians overseas, including during crises.
• Timely, effective and well-coordinated implementation of whole-of-government responses to large-scale crises overseas.
• Timely and accurate information provided to the public, including on responding to incidents and updates to travel advice.
Through case studies and reviews, DFAT will demonstrate whether these performance criteria have been:
Met
Partially met
Not met
2017-18 and beyond
As per 2016-17 As per 2016-17
Purposes To help make Australia stronger, safer and more prosperous by promoting and protecting our interests internationally and contributing to global stability and economic growth, particularly in the Indo-Pacific region.
Material changes to Program 2.1 resulting from the following measures:
Nil
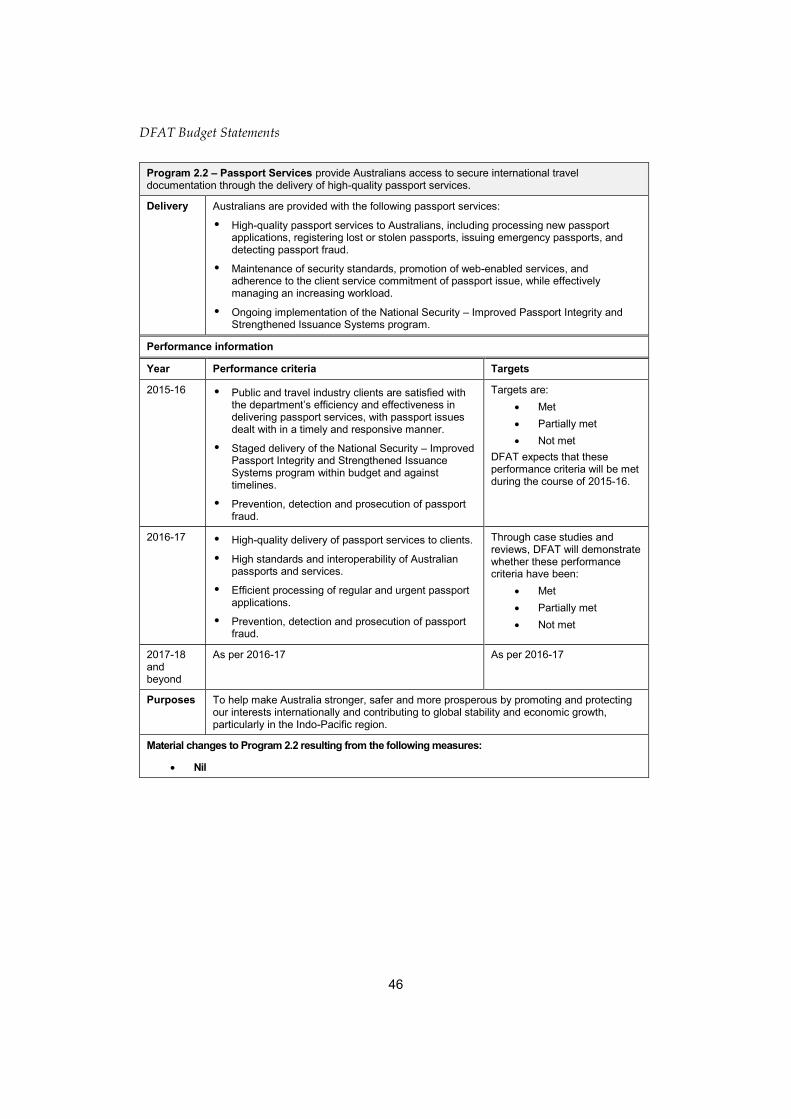
DFAT Budget Statements
46
Program 2.2 – Passport Services provide Australians access to secure international travel documentation through the delivery of high-quality passport services.
Delivery Australians are provided with the following passport services:
• High-quality passport services to Australians, including processing new passport applications, registering lost or stolen passports, issuing emergency passports, and detecting passport fraud.
• Maintenance of security standards, promotion of web-enabled services, and adherence to the client service commitment of passport issue, while effectively managing an increasing workload.
• Ongoing implementation of the National Security – Improved Passport Integrity and Strengthened Issuance Systems program.
Performance information
Year Performance criteria Targets
2015-16 • Public and travel industry clients are satisfied with the department’s efficiency and effectiveness in delivering passport services, with passport issues dealt with in a timely and responsive manner.
• Staged delivery of the National Security – Improved Passport Integrity and Strengthened Issuance Systems program within budget and against timelines.
• Prevention, detection and prosecution of passport fraud.
Targets are:
Met
Partially met
Not met
DFAT expects that these performance criteria will be met during the course of 2015-16.
2016-17 • High-quality delivery of passport services to clients.
• High standards and interoperability of Australian passports and services.
• Efficient processing of regular and urgent passport applications.
• Prevention, detection and prosecution of passport fraud.
Through case studies and reviews, DFAT will demonstrate whether these performance criteria have been:
Met
Partially met
Not met
2017-18 and beyond
As per 2016-17 As per 2016-17
Purposes To help make Australia stronger, safer and more prosperous by promoting and protecting our interests internationally and contributing to global stability and economic growth, particularly in the Indo-Pacific region.
Material changes to Program 2.2 resulting from the following measures:
Nil

DFAT Budget Statements
47
2.3 BUDGETED EXPENSES AND PERFORMANCE FOR OUTCOME 3
Outcome 3: A secure Australian Government presence overseas through the provision of security services and information and communications technology infrastructure, and the management of the Commonwealth’s overseas property estate
Budgeted expenses for Outcome 3
This table shows how much the entity intends to spend (on an accrual basis) on
achieving the outcome, broken down by program, as well as by Administered and
Departmental funding sources.
Table 2.3.1: Budgeted expenses for Outcome 3
Table continued on following page.
Outcome 3: A secure Australian
Government presence overseas
through the provision of security
services and information and
communication technology
infrastructure, and the
management of the
Commonwealth's overseas
property estate
2015-16
Estimated
actual
$'000
2016-17
Budget
$'000
2017-18
Forw ard
estimate
$'000
2018-19
Forw ard
estimate
$'000
2019-20
Forw ard
estimate
$'000
Program 3.1: Foreign Affairs and
Trade Security and IT
Departmental expenses
Departmental appropriation 194,815 203,007 151,822 152,005 150,991
Departmental total 194,815 203,007 151,822 152,005 150,991
Total expenses for program 3.1 194,815 203,007 151,822 152,005 150,991
Program 3.2: Overseas Property
Special Accounts: Overseas
Property Special Account - DFAT -
s20 FMA Act Det 2002/01 (a) 163,586 160,879 133,715 165,185 172,389
Expenses not requiring appropriation
in the Budget year (b) 19,295 15,432 22,414 25,476 28,298
Departmental total 182,881 176,311 156,129 190,661 200,687
Total expenses for program 3.2 182,881 176,311 156,129 190,661 200,687
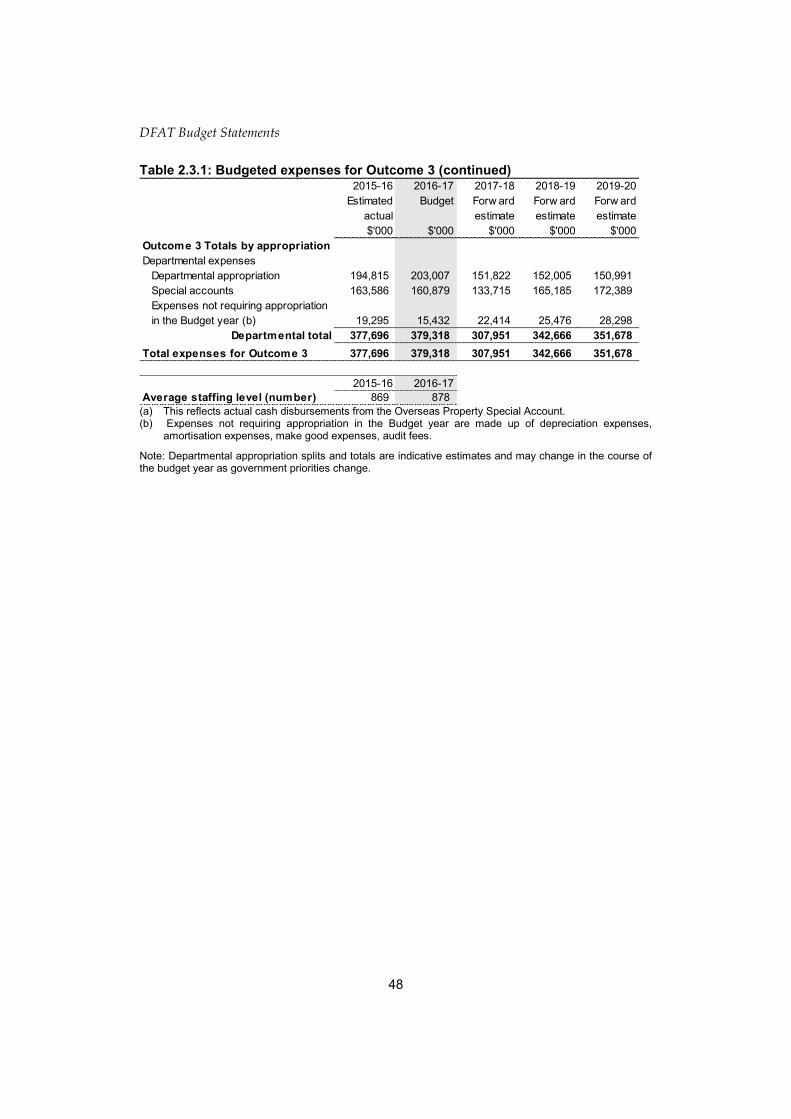
DFAT Budget Statements
48
Table 2.3.1: Budgeted expenses for Outcome 3 (continued)
(a) This reflects actual cash disbursements from the Overseas Property Special Account. (b) Expenses not requiring appropriation in the Budget year are made up of depreciation expenses,
amortisation expenses, make good expenses, audit fees.
Note: Departmental appropriation splits and totals are indicative estimates and may change in the course of the budget year as government priorities change.
2015-16
Estimated
actual
$'000
2016-17
Budget
$'000
2017-18
Forw ard
estimate
$'000
2018-19
Forw ard
estimate
$'000
2019-20
Forw ard
estimate
$'000
Outcome 3 Totals by appropriation
Departmental expenses
Departmental appropriation 194,815 203,007 151,822 152,005 150,991
Special accounts 163,586 160,879 133,715 165,185 172,389
Expenses not requiring appropriation
in the Budget year (b) 19,295 15,432 22,414 25,476 28,298
Departmental total 377,696 379,318 307,951 342,666 351,678
Total expenses for Outcome 3 377,696 379,318 307,951 342,666 351,678
2015-16 2016-17
Average staffing level (number) 869 878

DFAT Budget Statements
49
Table 2.3.3: Performance criteria for Outcome 3
Table 2.3.3 below details the performance criteria for each program associated with
Outcome 3. It also summarises how each program is delivered and where 2016-17
Budget measures have created new programs or materially changed existing
programs.
Outcome 3 – A secure Australian Government presence overseas through the provision of security services and information and communications technology infrastructure, and the management of the Commonwealth’s overseas property estate
Program 3.1 – Foreign Affairs and Trade Security and IT works to ensure:
• A secure Australian Government presence overseas for personnel, assets and information by sustaining and improving physical and operational security.
• Strengthened information and communications technology (ICT) capability at Australia’s missions overseas and DFAT offices in Australia.
Delivery The department is delivering security services and information and communications technology (ICT) through:
• Strengthened physical and operational security mitigation measures commensurate with the evolving international security environment.
• Protection of official information through effective management of ICT systems, security vetting processes, and security training to ensure high standards of security awareness and vigilance.
• Continued progress in moving the department’s ICT systems infrastructure to a common platform that can be more efficiently integrated and supported, and implementation of key elements of the Government’s ICT Reform Program and ICT elements of the Government’s national security policy and objectives.
• High-quality overseas ICT services to other government agencies.
• Ongoing implementation of the International Communications Network – upgrade program.
Performance information
Year Performance criteria Targets
2015-16 • Effective threat analysis, risk assessments and mitigation strategies appropriate to increased security risks, including timely and effective responses to security incidents.
• Reduced security risks to official information, through a strengthened security culture, evidenced by fewer security breaches.
• Client satisfaction with the accessibility, reliability and effectiveness of the secure cable network (Official Diplomatic Information Network) and the global secure telecommunications infrastructure.
• Staged delivery of the International Communications Network – upgrade program within budget and against timelines.
Targets are:
Met
Partially met
Not met
DFAT expects that these performance criteria will be met during the course of 2015-16.
Table continued on following page.

DFAT Budget Statements
50
Table 2.3.3: Performance criteria for Outcome 3 (continued)
2016-17 • A strong security culture.
• High-quality advice, effective mitigation strategies and timely responses to international security incidents based on considered threat and risk assessments.
• An accessible and reliable secure cable network.
Through case studies and reviews, DFAT will demonstrate whether these performance criteria have been:
Met
Partially met
Not met
2017-18 and beyond
As per 2016-17 As per 2016-17
Purposes To help make Australia stronger, safer and more prosperous by promoting and protecting our interests internationally and contributing to global stability and economic growth, particularly in the Indo-Pacific region.
Material changes to Program 3.1 resulting from the following measures:
Nil

DFAT Budget Statements
51
Program 3.2 – Overseas Property is ensuring a secure Australian government presence overseas through the effective management of the Commonwealth’s overseas property estate and of the contracts for the leased estate.
Delivery The department is a secure Australian Government presence overseas through:
• Efficient and effective management and delivery of a substantial construction and refurbishment program in the overseas property estate.
• Efficient and effective management of the overseas property estate to meet the Government’s requirements and maintain conditions and service capabilities.
• Effective management of outsourced property contract arrangements.
Performance information
Year Performance criteria Targets
2015-16 • Completion of construction and refurbishment projects within an agreed timeframe and budget.
• Effective and accountable management of the property services contract and construction project contracts.
• Achieve a portfolio condition and utility rating of good or better.
• The majority of tenants rate the performance of the service provider and the Overseas Property Office as good or better.
• Asset management plans are in place for all owned properties in the estate.
• Achieve a management expense ratio appropriate to the unique nature of the Commonwealth’s overseas owned estate.
Targets are:
Met
Partially met
Not met
DFAT expects that these performance criteria will be met during the course of 2015-16.
2016-17 • The construction and refurbishment of departmental overseas property completed within agreed timeframes and budgets.
• Asset management plans are in place for all owned properties in the estate.
• The majority of tenants rate the performance of the service provider and the Overseas Property Office as good or better.
Through case studies and reviews, DFAT will demonstrate whether these performance criteria have been:
Met
Partially met
Not met
2017-18 and beyond
As per 2016-17 As per 2016-17
Purposes To help make Australia stronger, safer and more prosperous by promoting and protecting our interests internationally and contributing to global stability and economic growth, particularly in the Indo-Pacific region.
Material changes to Program 3.2 resulting from the following measures:
Nil

DFAT Budget Statements
52
Section 3: Budgeted financial statements
Section 3 presents budgeted financial statements which provide a comprehensive
snapshot of entity finances for the 2016-17 budget year, including the impact of budget
measures and resourcing on financial statements.
3.1 BUDGETED FINANCIAL STATEMENTS
3.1.1 Differences between entity resourcing and financial statements
In accordance with the Government Finance Statistics provided by the Australian
Bureau of Statistics, the budgeted financial statements do not recognise concessionality
and the associated discounting of concessional loans. Australian Accounting
Standards require concessional loans to reflect a market related rate of interest and be
discounted over the loan maturity period. DFAT’s financial statements will be
prepared in accordance with Australian Accounting Standards. DFAT has two
programs that are affected by this treatment:
Asian Development Fund replenishments – investment component; and
International Development Association replenishments – investment
component.
The investment component does not impact on the fiscal or underlying cash balances,
as the provision of a loan only affects the composition of the Australian Government
investment in financial assets.
3.1.2 Explanatory notes and analysis of budgeted financial statements
The total budgeted appropriation in 2016-17 is $1,403.1 million, which represents an
increase of $53.2 million in appropriations from 2015-16 as shown in Table 3.1. The
increase is primarily attributable to:
• funding for new measures;
• parameter adjustments for overseas and domestic inflation; and
• foreign exchange movements.
This is partially offset by:
efficiencies agreed in the 2016-17 Budget.
The Income Statement shows a budgeted deficit in 2016-17 of $91.8 million, due to the
removal of appropriation funding for depreciation and amortisation under the Net
Cash funding arrangements. Adjusting for the changed funding arrangements, the
DFAT Budget Statements
53
operating result attributable to the department is a surplus of $67.5 million in 2016-17,
all of which relates to the Overseas Property Special Account (OPSA).
Budgeted Departmental Balance Sheet
The department will receive an equity injection of $57.7 million in 2016-17 for the
purchase or construction of new assets. The department will also receive $51.8 million
through its Departmental Capital Budget to fund the replacement of existing assets.
For 2016-17, the department’s non-financial asset position is budgeted to be $3,634.9
million at year-end. The major asset component is $3,070.3 million for Land and
Buildings.
Schedule of Budgeted Income and Expenses Administered on behalf of the Government
In 2016-17 the department will receive administered appropriation of $4,161.8 million
(excluding capital funding) for programs administered on behalf of the Government.
The increase in appropriations of $559.7 million from 2015-16 is due to new
multilateral replenishments being negotiated for the Asian Development Fund (ADF)
and the International Development Association (IDA).
Administered expenses for ‘International Development Assistance’ are budgeted at
$2,919.8 million, a decrease of $192.4 million from the 2015-16 estimated actual which
reflects the reduction in expenditure on the Australian Aid Program.
Administered expenses for ‘IDA/ADF Multilateral Replenishment Grants’ and ‘Other
Multilateral Replenishment Grants’ are budgeted at $720.0 million, an increase of
$720.0 million from the 2015–16 estimated actual due to new multilateral
replenishments being negotiated for the ADF and the IDA.
Expenses under ‘Concessional loan discount’ relate to the discounting of the Australia
Indonesia Partnerships for Reconstruction and Development (AIPRD) loans.
Expenses under ‘Concessional investment discount’ relate to the discounting of the
investment components of the replenishments for the IDA and ADF.
Schedule of Budgeted Assets and Liabilities Administered on behalf of the Government
Administered assets and liabilities administered on behalf of the Government are
budgeted at $5,333.6 million and $2,835.2 million respectively for the year ending
30 June 2016.
Administered assets are expected to increase in 2016-17 by $1,037.1 million. This is
due to new multilateral replenishments being negotiated for the ADF and the IDA in
2016-17.

DFAT Budget Statements
54
Administered liabilities are expected to increase in 2016-17 by $932.7 million. This is
due to new liabilities for the multilateral replenishments being negotiated for the ADF
and the IDA in 2016-17.
Schedule of Budgeted Administered Cash Flows
Administered cash receipts is primarily comprised of receipts from passport and
consular services and is budgeted at $571.4 million, an increase of $51.8 million.
Administered cash used in 2016-17 is estimated to decrease by $101.6 million
compared to 2015-16. This is due primarily to the reduction in expenditure on the
Australian Aid Program.
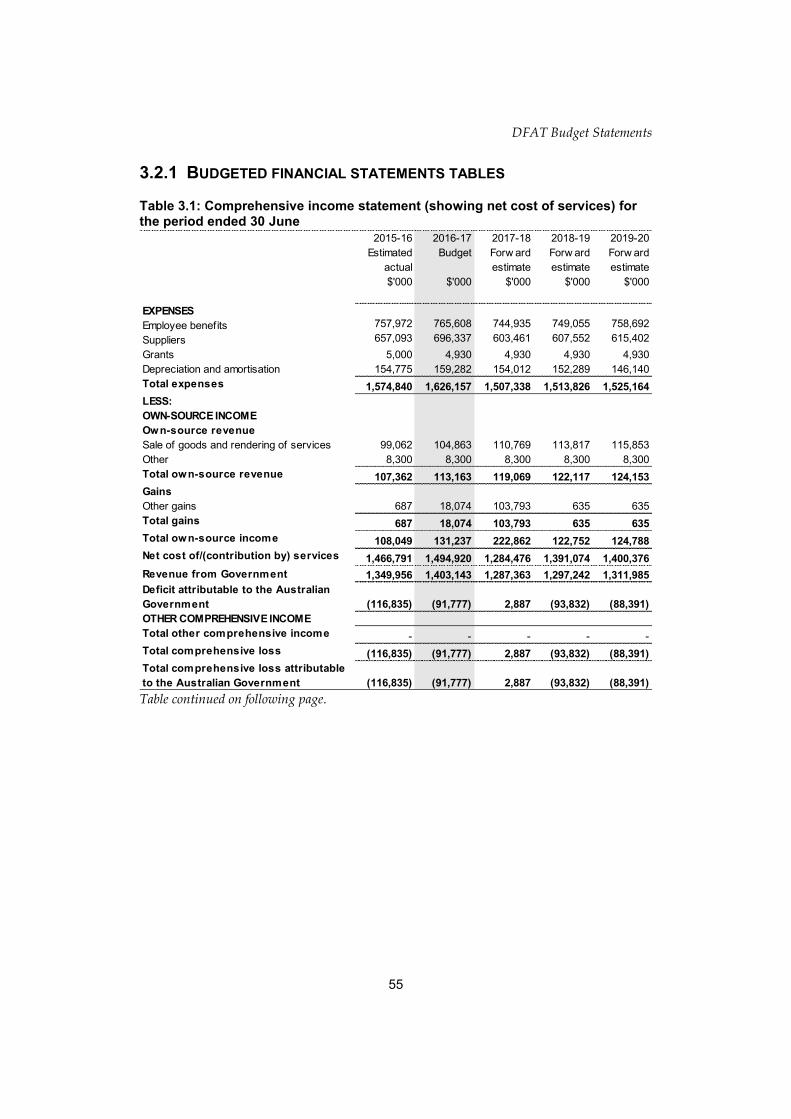
DFAT Budget Statements
55
3.2.1 BUDGETED FINANCIAL STATEMENTS TABLES
Table 3.1: Comprehensive income statement (showing net cost of services) for the period ended 30 June
Table continued on following page.
2015-16
Estimated
actual
$'000
2016-17
Budget
$'000
2017-18
Forw ard
estimate
$'000
2018-19
Forw ard
estimate
$'000
2019-20
Forw ard
estimate
$'000
EXPENSES
Employee benefits 757,972 765,608 744,935 749,055 758,692
Suppliers 657,093 696,337 603,461 607,552 615,402
Grants 5,000 4,930 4,930 4,930 4,930
Depreciation and amortisation 154,775 159,282 154,012 152,289 146,140
Total expenses 1,574,840 1,626,157 1,507,338 1,513,826 1,525,164
LESS:
OWN-SOURCE INCOME
Own-source revenue
Sale of goods and rendering of services 99,062 104,863 110,769 113,817 115,853
Other 8,300 8,300 8,300 8,300 8,300
Total own-source revenue 107,362 113,163 119,069 122,117 124,153
Gains
Other gains 687 18,074 103,793 635 635
Total gains 687 18,074 103,793 635 635
Total own-source income 108,049 131,237 222,862 122,752 124,788
Net cost of/(contribution by) services 1,466,791 1,494,920 1,284,476 1,391,074 1,400,376
Revenue from Government 1,349,956 1,403,143 1,287,363 1,297,242 1,311,985
Deficit attributable to the Australian
Government (116,835) (91,777) 2,887 (93,832) (88,391)
OTHER COMPREHENSIVE INCOME
Total other comprehensive income - - - - -
Total comprehensive loss (116,835) (91,777) 2,887 (93,832) (88,391)
Total comprehensive loss attributable
to the Australian Government (116,835) (91,777) 2,887 (93,832) (88,391)
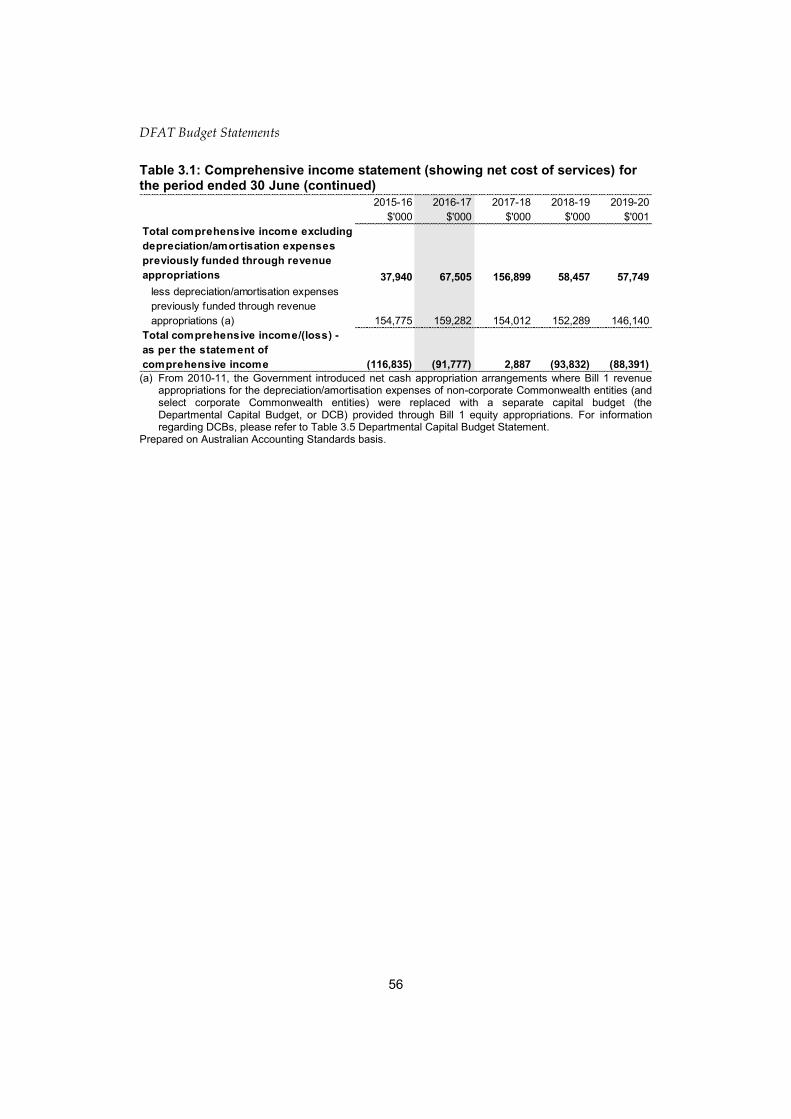
DFAT Budget Statements
56
Table 3.1: Comprehensive income statement (showing net cost of services) for the period ended 30 June (continued)
(a) From 2010-11, the Government introduced net cash appropriation arrangements where Bill 1 revenue
appropriations for the depreciation/amortisation expenses of non-corporate Commonwealth entities (and select corporate Commonwealth entities) were replaced with a separate capital budget (the Departmental Capital Budget, or DCB) provided through Bill 1 equity appropriations. For information regarding DCBs, please refer to Table 3.5 Departmental Capital Budget Statement.
Prepared on Australian Accounting Standards basis.
2015-16
$'000
2016-17
$'000
2017-18
$'000
2018-19
$'000
2019-20
$'001
Total comprehensive income excluding
depreciation/amortisation expenses
previously funded through revenue
appropriations 37,940 67,505 156,899 58,457 57,749
less depreciation/amortisation expenses
previously funded through revenue
appropriations (a) 154,775 159,282 154,012 152,289 146,140
Total comprehensive income/(loss) -
as per the statement of
comprehensive income (116,835) (91,777) 2,887 (93,832) (88,391)

DFAT Budget Statements
57
Table 3.2: Budgeted departmental balance sheet (as at 30 June)
* ‘Equity’ is the residual interest in assets after deduction of liabilities. Prepared on Australian Accounting Standards basis.
2015-16
Estimated
actual
$'000
2016-17
Budget
$'000
2017-18
Forw ard
estimate
$'000
2018-19
Forw ard
estimate
$'000
2019-20
Forw ard
estimate
$'000
ASSETS
Financial assets
Cash and cash equivalents 84,720 84,720 84,720 84,720 84,720
Trade and other receivables 622,423 589,651 714,929 692,450 606,498
Total financial assets 707,143 674,371 799,649 777,170 691,218
Non-financial assets
Land and buildings 2,996,120 3,070,305 3,079,564 3,099,226 3,190,538
Property, plant and equipment 276,206 285,094 280,475 267,845 258,912
Intangibles 93,114 86,090 78,563 73,592 70,849
Inventories 39,641 39,641 39,641 39,641 39,641
Other non-financial assets 86,062 86,923 87,792 88,670 89,557
Assets held for sale 89,403 66,842 - - -
Total non-financial assets 3,580,546 3,634,895 3,566,035 3,568,974 3,649,497
Total assets 4,287,689 4,309,266 4,365,684 4,346,144 4,340,715
LIABILITIES
Payables
Suppliers 122,687 123,914 82,226 83,048 83,879
Other payables 62,895 63,324 63,755 64,189 64,508
Total payables 185,582 187,238 145,981 147,237 148,387
Provisions
Employee provisions 214,607 216,753 218,920 221,110 223,321
Other provisions 22,534 22,647 22,760 22,874 22,988
Total provisions 237,141 239,400 241,680 243,984 246,309
Total liabilities 422,723 426,638 387,661 391,221 394,696
Net assets 3,864,966 3,882,628 3,978,023 3,954,923 3,946,019
EQUITY*
Parent entity interest
Contributed equity 2,407,063 2,516,502 2,609,010 2,686,942 2,766,429
Reserves 1,241,493 1,241,493 1,241,493 1,241,493 1,241,493
Retained surplus 216,410 124,633 127,520 26,488 -61,903
Total parent entity interest 3,864,966 3,882,628 3,978,023 3,954,923 3,946,019
Total Equity 3,864,966 3,882,628 3,978,023 3,954,923 3,946,019

DFAT Budget Statements
58
Table 3.3: Departmental statement of changes in equity — summary of movement (Budget year 2016-17)
Prepared on Australian Accounting Standards basis.
Retained
earnings
$'000
Asset
revaluation
reserve
$'000
Contributed
equity/ capital
$'000
Total equity
$'000
Opening balance as at 1 July 2016
Balance carried forw ard from previous
period 216,410 1,241,493 2,407,063 3,864,966
Adjusted opening balance 216,410 1,241,493 2,407,063 3,864,966
Comprehensive income
Other comprehensive income - - - -
Surplus/(deficit) for the period (91,777) - - (91,777)
Total comprehensive loss (91,777) - - (91,777)
of w hich:
Attributable to the Australian
Government (91,777) - - (91,777)
Transactions with owners
Distributions to owners
Returns of capital:
Cash transfer to the OPA - - - -
Contributions by owners
Equity Injection - Appropriation - - 57,684 57,684
Departmental Capital Budget (DCB) - - 51,755 51,755
Sub-total transactions with owners - - 109,439 109,439
Estimated closing balance as at 30
June 2017 124,633 1,241,493 2,516,502 3,882,628
Closing balance attributable to the
Australian Government 124,633 1,241,493 2,516,502 3,882,628

DFAT Budget Statements
59
Table 3.4: Budgeted departmental statement of cash flows (for the period ended 30 June)
Prepared on Australian Accounting Standards basis.
2015-16
Estimated
actual
$'000
2016-17
Budget
$'000
2017-18
Forw ard
estimate
$'000
2018-19
Forw ard
estimate
$'000
2019-20
Forw ard
estimate
$'000
OPERATING ACTIVITIES
Cash received
Appropriations 1,349,956 1,403,143 1,287,363 1,297,242 1,311,985
Sale of goods and rendering of
services 107,362 113,163 119,069 122,117 124,153
Other 136,526 104,496 71,545 69,540 134,192
Total cash received 1,593,844 1,620,802 1,477,977 1,488,899 1,570,330
Cash used
Employees 755,847 763,462 742,768 746,865 756,481
Suppliers 657,093 695,110 603,461 607,552 615,402
Other 44,378 98,854 234,241 57,742 64,255
Total cash used 1,457,318 1,557,426 1,580,470 1,412,159 1,436,138
Net cash from/(used by) operating
activities 136,526 63,376 (102,493) 76,740 134,192
INVESTING ACTIVITIES
Cash received
Proceeds from sales of property, plant
and equipment - 41,120 174,038 - -
Total cash received - 41,120 174,038 - -
Cash used
Purchase of property, plant, equipment
and intangibles 420,906 231,286 165,135 147,472 213,679
Total cash used 420,906 231,286 165,135 147,472 213,679
Net cash from/(used by) investing
activities (420,906) (190,166) 8,903 (147,472) (213,679)
FINANCING ACTIVITIES
Cash received
Contributed equity 284,380 126,790 93,590 77,932 79,487
Total cash received 284,380 126,790 93,590 77,932 79,487
Cash used
Returns of equity - - - 7,200 -
Total cash used - - - 7,200 -
Net cash used by financing activities 284,380 126,790 93,590 70,732 79,487
Net increase in cash held - - - - -
Cash and cash equivalents at the
beginning of the reporting period 84,720 84,720 84,720 84,720 84,720
Cash and cash equivalents at the
end of the reporting period 84,720 84,720 84,720 84,720 84,720

DFAT Budget Statements
60
Table 3.5: Departmental capital budget statement (for the period ended 30 June)
(a) Includes both current Bill 2 and prior Act 2/4/6 appropriations and special capital appropriations. (b) Does not include annual finance lease costs. Includes purchases from current and previous years’
Departmental capital budgets (DCBs). (c) Includes the following sources of funding:
- Bill 1 and current Bill 3 and prior year Act 1/3/5 appropriations (excluding amounts from the DCB) - internally developed assets; - s 74 Retained revenue receipts; and - proceeds from the sale of assets.
Prepared on Australian Accounting Standards basis.
2015-16
Estimated
actual
$'000
2016-17
Budget
$'000
2017-18
Forw ard
estimate
$'000
2018-19
Forw ard
estimate
$'000
2019-20
Forw ard
estimate
$'000
NEW CAPITAL APPROPRIATIONS
Capital budget - Bill 1 (DCB) 52,171 51,755 47,449 72,126 78,644
Equity injections - Bill 2 201,511 57,684 45,059 5,806 843
Total new capital appropriations 253,682 109,439 92,508 77,932 79,487
Provided for:
Purchase of non-financial assets 253,682 109,439 92,508 77,932 79,487
Total Items 253,682 109,439 92,508 77,932 79,487
PURCHASE OF NON-FINANCIAL
ASSETS
Funded by capital appropriations (a) 232,209 75,035 46,141 5,806 843
Funded by capital appropriation -
DCB (b) 52,171 51,755 47,449 72,126 78,644
Funded internally from departmental
resources (c) 136,526 104,496 71,545 69,540 134,192
TOTAL 420,906 231,286 165,135 147,472 213,679
RECONCILIATION OF CASH USED TO
ACQUIRE ASSETS TO ASSET
MOVEMENT TABLE
Total purchases 420,906 231,286 165,135 147,472 213,679
Total cash used to acquire assets 420,906 231,286 165,135 147,472 213,679

DFAT Budget Statements
61
Table 3.6: Statement of asset movements (Budget year 2016-17)
(a) 'Appropriation equity' refers to equity injections appropriations provided through Appropriation Bill (No. 2)
2016-17, including CDABs. (b) ‘Appropriation ordinary annual services' refers to funding provided through Appropriation Bill (No.1)
2016-17 for depreciation/amortisation expenses, DCBs or other operational expenses. Prepared on Australian Accounting Standards basis.
Land
$'000
Buildings
$'000
Other
property,
plant and
equipment
$'000
Computer
softw are
and
intangibles
$'000
L&B, IP&E
held for
sale
$'000
Total
$'000
As at 1 July 2016
Gross book value 1,493,020 1,740,080 408,586 188,194 89,403 3,919,283
Accumulated
depreciation/amortisation and
impairment - (236,980) (132,380) (95,080) - (464,440)
Opening net book balance 1,493,020 1,503,100 276,206 93,114 89,403 3,454,843
Capital asset additions
Estimated expenditure on
new or replacement assets
By purchase - appropriation
equity (a) - 14,150 59,649 1,236 - 75,035
By purchase - appropriation
ordinary annual services (b) 29,500 119,190 - 7,561 - 156,251
Total additions 29,500 133,340 59,649 8,797 - 231,286
Other movements
Depreciation/amortisation - (92,700) (50,761) (15,821) - (159,282)
Other - - - (22,561) (22,561)
Total other movements - (92,700) (50,761) (15,821) (22,561) (181,843)
As at 30 June 2017
Gross book value 1,522,520 1,877,465 468,235 196,991 - 4,132,053
Accumulated
depreciation/amortisation and
impairment - (329,680) (183,141) (110,901) - (623,722)
Closing net book balance 1,522,520 1,547,785 285,094 86,090 66,842 3,508,331

DFAT Budget Statements
62
Table 3.7: Schedule of budgeted income and expenses administered on behalf of Government (for the period ended 30 June)
(a) International Development Association (IDA) and Asian Development Fund (ADF). Prepared on Australian Accounting Standards basis.
2015-16
Estimated
actual
$'000
2016-17
Budget
$'000
2017-18
Forw ard
estimate
$'000
2018-19
Forw ard
estimate
$'000
2019-20
Forw ard
estimate
$'000
EXPENSES
Employee benefits 2,980 2,974 3,069 3,123 3,178
Suppliers 1,673 1,689 1,704 1,720 1,737
International Development Assistance 3,112,214 2,919,800 3,185,632 3,363,412 3,444,208
IDA/ADF Multilateral Replenishment grants (a) - 591,448 - - 592,910
Other Multilateral Replenishment grants - 128,510 12,622 105,000 123,020
Concessional loan discount 7,188 - - - -
Concessional investment discount - 520,090 - - 520,090
Grants and contributions 482,635 516,871 563,380 596,907 619,428
Depreciation and amortisation 1,207 1,189 1,489 1,440 1,028
Other expenses 15,530 16,327 1,300 1,200 1,100
Payments to Corporate entities 144,018 140,266 141,291 144,417 147,462
Total expenses administered on behalf of
Government 3,767,445 4,839,164 3,910,487 4,217,219 5,454,161
LESS:
OWN-SOURCE INCOME
Non-taxation revenue
Sale of goods and rendering of services 449,898 505,098 545,713 559,163 603,572
Interest 1,105 96 96 96 96
Dividends 13,654 6,900 9,300 10,200 11,200
Other revenue 158 158 158 159 159
Returns of prior year administered expenses 54,814 59,145 59,066 88,222 91,494
Total non-taxation revenue 519,629 571,397 614,333 657,840 706,521
Total own-sourced income administered
on behalf of Government 519,629 571,397 614,333 657,840 706,521
Net cost of services (3,247,816) (4,267,767) (3,296,154) (3,559,379) (4,747,640)
Total comprehensive loss (3,247,816) (4,267,767) (3,296,154) (3,559,379) (4,747,640)

DFAT Budget Statements
63
Table 3.8: Schedule of budgeted assets and liabilities administered on behalf of Government (as at 30 June)
(a) International Development Association (IDA) and Asian Development Fund (ADF).
Prepared on Australian Accounting Standards basis.
2015-16
Estimated
actual
$'000
2016-17
Budget
$'000
2017-18
Forw ard
estimate
$'000
2018-19
Forw ard
estimate
$'000
2019-20
Forw ard
estimate
$'000
ASSETS
Financial assets
Cash and cash equivalents 1,832 1,832 1,832 1,832 1,832
Loans and receivables 133,112 133,662 134,212 134,762 135,312
Investments (IDA/ADF)(a) 1,936,071 2,016,071 2,016,071 2,016,071 2,096,071
Investment accounted for using the
equity method 456,302 456,302 456,302 456,302 456,302
Appropriation receivable - other 1,761,645 2,719,006 2,373,378 2,190,554 3,160,852
Total financial assets 4,288,962 5,326,873 4,981,795 4,799,521 5,850,369
Non-financial assets
Leasehold improvements 1,482 973 907 902 902
Infrastructure, plant and equipment 1,533 1,436 956 525 525
Intangibles 4,368 4,168 3,668 3,168 2,668
Other non-financial assets 151 151 151 151 151
Total non-financial assets 7,534 6,728 5,682 4,746 4,246
Total assets administered on behalf
of Government 4,296,496 5,333,601 4,987,477 4,804,267 5,854,615
LIABILITIES
Payables
IDA/ADF grant component (a) 301,104 810,486 717,762 613,238 1,092,160
IDA/ADF concessional component (a) 1,028,954 1,353,432 1,116,369 924,619 1,351,544
Aid program payable 461,051 557,583 541,588 655,033 719,484
Other payables 30,663 32,934 32,938 32,943 32,943
Total payables 1,821,772 2,754,435 2,408,657 2,225,833 3,196,131
Provisions
Employee provisions 80,749 80,749 80,749 80,749 80,749
Total provisions 80,749 80,749 80,749 80,749 80,749
Total liabilities administered on
behalf of Government 1,902,521 2,835,184 2,489,406 2,306,582 3,276,880
Net assets 2,393,975 2,498,417 2,498,071 2,497,685 2,577,735
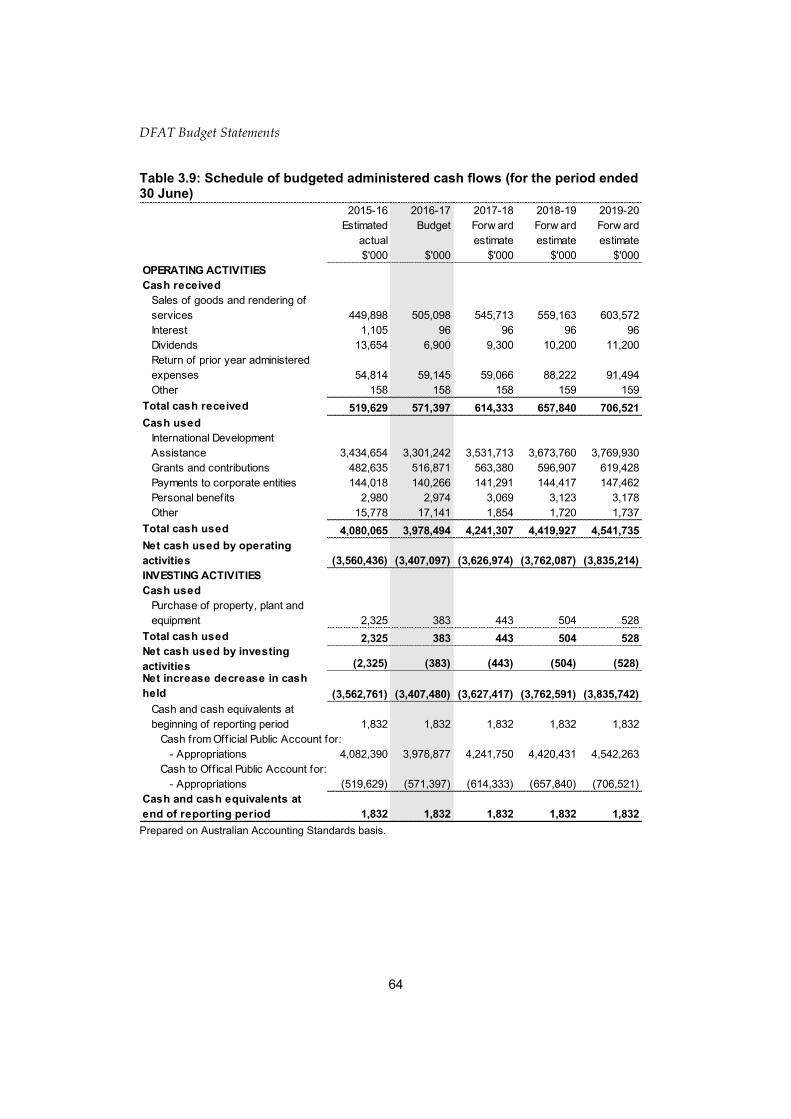
DFAT Budget Statements
64
Table 3.9: Schedule of budgeted administered cash flows (for the period ended 30 June)
Prepared on Australian Accounting Standards basis.
2015-16
Estimated
actual
$'000
2016-17
Budget
$'000
2017-18
Forw ard
estimate
$'000
2018-19
Forw ard
estimate
$'000
2019-20
Forw ard
estimate
$'000
OPERATING ACTIVITIES
Cash received
Sales of goods and rendering of
services 449,898 505,098 545,713 559,163 603,572
Interest 1,105 96 96 96 96
Dividends 13,654 6,900 9,300 10,200 11,200
Return of prior year administered
expenses 54,814 59,145 59,066 88,222 91,494
Other 158 158 158 159 159
Total cash received 519,629 571,397 614,333 657,840 706,521
Cash used
International Development
Assistance 3,434,654 3,301,242 3,531,713 3,673,760 3,769,930
Grants and contributions 482,635 516,871 563,380 596,907 619,428
Payments to corporate entities 144,018 140,266 141,291 144,417 147,462
Personal benefits 2,980 2,974 3,069 3,123 3,178
Other 15,778 17,141 1,854 1,720 1,737
Total cash used 4,080,065 3,978,494 4,241,307 4,419,927 4,541,735
Net cash used by operating
activities (3,560,436) (3,407,097) (3,626,974) (3,762,087) (3,835,214)
INVESTING ACTIVITIES
Cash used
Purchase of property, plant and
equipment 2,325 383 443 504 528
Total cash used 2,325 383 443 504 528
Net cash used by investing
activities (2,325) (383) (443) (504) (528)
Net increase decrease in cash
held (3,562,761) (3,407,480) (3,627,417) (3,762,591) (3,835,742)
Cash and cash equivalents at
beginning of reporting period 1,832 1,832 1,832 1,832 1,832
Cash from Official Public Account for:
- Appropriations 4,082,390 3,978,877 4,241,750 4,420,431 4,542,263
Cash to Offical Public Account for:
- Appropriations (519,629) (571,397) (614,333) (657,840) (706,521)
Cash and cash equivalents at
end of reporting period 1,832 1,832 1,832 1,832 1,832

DFAT Budget Statements
65
Table 3.10: Administered capital budget statement (for the period ended 30 June)
(a) Includes purchases from current and previous years' administered capital budgets (ACBs). Prepared on Australian Accounting Standards basis.
2015-16
Estimated
actual
$'000
2016-17
Budget
$'000
2017-18
Forw ard
estimate
$'000
2018-19
Forw ard
estimate
$'000
2019-20
Forw ard
estimate
$'000
NEW CAPITAL APPROPRIATIONS
Capital budget - Bill 1 (ACB) 2,325 383 443 504 528
Administered Assets and Liabilities
- Bill 2 13,527 1,012,362 150 - 600,090
Total new capital appropriations 15,852 1,012,745 593 504 600,618
Provided for:
Purchase of non-financial assets 2,325 383 443 504 528
Other Items 13,527 1,012,362 150 - 600,090
Total items 15,852 1,012,745 593 504 600,618
PURCHASE OF NON-FINANCIAL
ASSETS
Funded by capital appropriation - ACB (a) 2,325 383 443 504 528
TOTAL 2,325 383 443 504 528
RECONCILIATION OF CASH USED TO
ACQUIRE ASSETS TO ASSET
MOVEMENT TABLE
Total accrual purchases 2,325 383 443 504 528
Total cash used to acquire assets 2,325 383 443 504 528
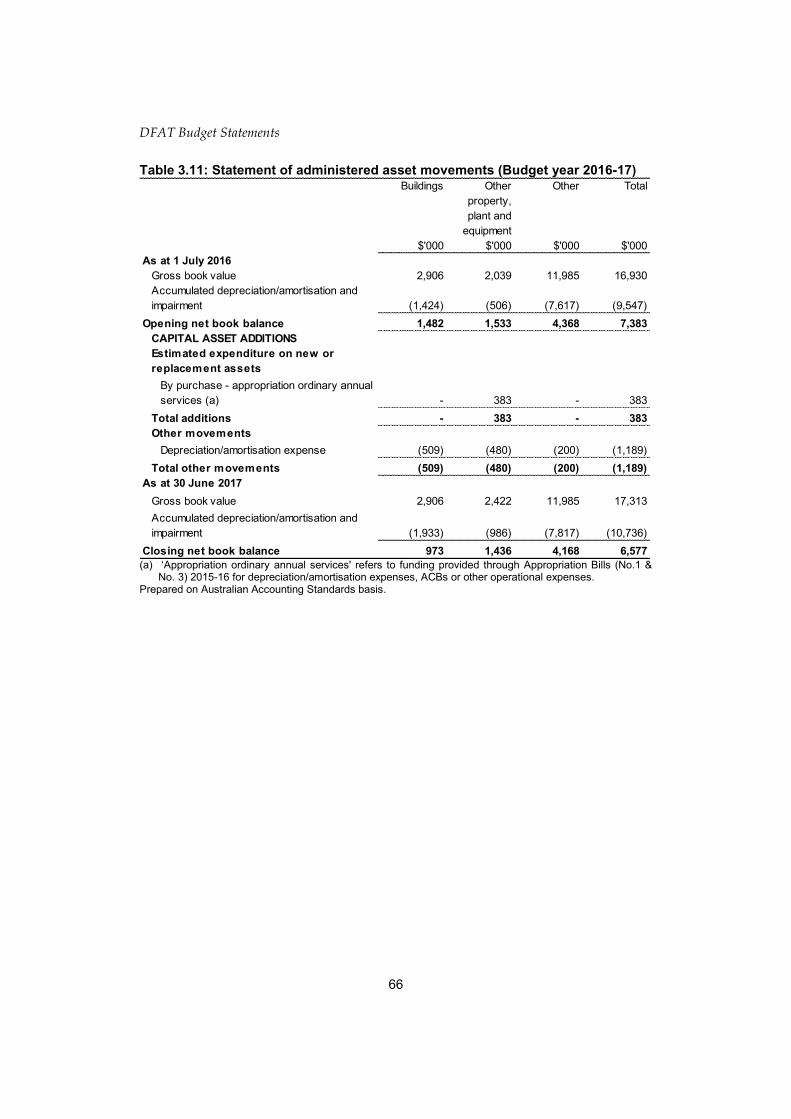
DFAT Budget Statements
66
Au
strade B
ud
get S
tatemen
ts
Table 3.11: Statement of administered asset movements (Budget year 2016-17)
(a) ‘Appropriation ordinary annual services' refers to funding provided through Appropriation Bills (No.1 &
No. 3) 2015-16 for depreciation/amortisation expenses, ACBs or other operational expenses. Prepared on Australian Accounting Standards basis.
Buildings
$'000
Other
property,
plant and
equipment
$'000
Other
$'000
Total
$'000
As at 1 July 2016
Gross book value 2,906 2,039 11,985 16,930
Accumulated depreciation/amortisation and
impairment (1,424) (506) (7,617) (9,547)
Opening net book balance 1,482 1,533 4,368 7,383
CAPITAL ASSET ADDITIONS
Estimated expenditure on new or
replacement assets
By purchase - appropriation ordinary annual
services (a) - 383 - 383
Total additions - 383 - 383
Other movements
Depreciation/amortisation expense (509) (480) (200) (1,189)
Total other movements (509) (480) (200) (1,189)
As at 30 June 2017
Gross book value 2,906 2,422 11,985 17,313
Accumulated depreciation/amortisation and
impairment (1,933) (986) (7,817) (10,736)
Closing net book balance 973 1,436 4,168 6,577

Au
strade B
ud
get S
tatemen
ts


69
Australian Trade and Investment Commission
(Austrade)
Entity resources and planned performance

71
AUSTRALIAN TRADE AND INVESTMENT COMMISSION
(AUSTRADE)
Section 1: Entity overview and resources ................................................................ 73
1.1 Strategic direction statement .......................................................................... 73
1.2 Entity resource statement ............................................................................... 76
1.3 Budget measures ............................................................................................ 77
Section 2: Outcomes and planned performance ..................................................... 78
2.1 Budgeted expenses and performance for Outcome 1 .................................... 79
2.2 Budgeted expenses and performance for Outcome 2 .................................... 91
Section 3: Budgeted financial statements ................................................................ 95
3.1 Budgeted financial statements........................................................................ 95
3.2.1 Budgeted financial statements tables ............................................................. 98


Austrade Budget Statements
73
AUSTRALIAN TRADE AND INVESTMENT COMMISSION
(AUSTRADE)
Section 1: Entity overview and resources
1.1 STRATEGIC DIRECTION STATEMENT
The Australian Trade and Investment Commission (Austrade) is the Australian
Government’s international trade, investment and education promotion agency.
Austrade also has responsibility for policies and programs to strengthen Australia’s
tourism sector.
Austrade’s outcomes are:
Contribute to Australia’s economic prosperity by promoting Australia’s export
and other international economic interests through the provision of information,
advice and services to business, associations, institutions and governments; and
The protection and welfare of Australians abroad through timely and responsive
consular and passport services in specific locations overseas.
Austrade’s goals, and how it intends to achieve them, are set out on its website and in
its Corporate Plan.
Austrade’s trade, investment, education and tourism activities play a central role in
helping to secure Australia’s future prosperity by promoting opportunities for
Australian businesses and institutions overseas, including those which will flow from
the completion of recent significant trade agreements.
Drawing on its commercial knowledge, its international network, and its relationships
and connections (with international customers, investors and decision makers),
Austrade will continue to identify valuable international business opportunities for
Australian businesses and institutions, and provide them with practical advice and
services. Austrade’s unique perspective, gained from its international market presence
and its firm-level interactions, will continue to inform businesses and institutions as
well as inform policy advice to Government, including supporting the Government’s
vision for developing Northern Australia.
Austrade will continue to take the lead role in coordinating international business
missions led by ministers and the Prime Minister, including Australia Week events in
China and ASEAN countries.
Austrade Budget Statements
74
Austrade will, through its trade promotion and investment attraction activities,
continue to contribute to the Government’s economic diplomacy agenda. This work
will be closely coordinated with, and complementary to, other agencies in the Foreign
Affairs and Trade portfolio. Austrade will continue to provide small and medium
enterprises with useful and practical information on how to take up the opportunities
that FTAs provide.
Austrade’s overseas network comprises 79 overseas offices in 47 different markets, and
is weighted towards growth and emerging markets that have high commercial
potential, and where Austrade’s assistance can have the most impact. Austrade’s trade
promotion work will continue to focus on markets where it is more difficult for
companies acting alone to access commercial opportunities, where there are language,
business and cultural barriers, where regulatory frameworks and business processes
are less open or transparent and where the ‘badge of government’ helps to secure
commercial outcomes. In established markets, such as North America and Europe,
Austrade will continue to use partners, referrals and online services to support
Australian businesses’ trade development activities. Austrade will continue to focus on
those sectors with high growth potential and where Australia has a comparative
advantage.
As part of its Global Innovation Strategy, the Government provided Austrade with
$11.2 million over four years to establish five landing pads in global innovation hot
spots, including Tel Aviv, San Francisco, Shanghai, Berlin and one other location, with
the objective of supporting Australians start-ups to build networks and tackle new
markets. In this, Austrade will liaise closely with DFAT and the Department of
Industry, Innovation and Science. In 2016-17 Austrade will also open an office in
Tehran to help Australian businesses access commercial opportunities in Iran
following Australia’s decision to lift most sanctions.
Austrade will support the Government’s high profile investment agenda with the
resources of its international network and its offshore and onshore investment
specialists. While Austrade’s investment promotion and attraction activities will
continue to be concentrated in North America, Western Europe and Japan, as those
markets represent Australia’s largest sources of foreign investment, Austrade will also
pursue foreign investors in other regions, including China, India, Singapore and the
Republic of Korea.
Austrade’s activities in key student-source markets will continue to contribute to the
growth in demand for Australian education services. Its activities will help to position
Australia as a provider of high quality education services, and contribute to the
development of a sustainable international education sector. From 2016-17, Austrade,
along with the education sector, will implement Australian International Education 2025,
a long-term plan for the development of international markets. This plan supports the
vision of the Government’s National Strategy for International Education, which
recognises Australian international education as a core element of Australia’s
economic prosperity, social advancement and international standing.

Austrade Budget Statements
75
Austrade’s Tourism Division will continue to have responsibility for policies to
improve the competitiveness of Australia’s tourism industry, and will continue to
implement the national long-term tourism strategy, Tourism 2020, to strengthen
Australia’s tourism industry and help grow Australia’s tourism market share.
Austrade will also continue to administer various tourism programs to support the
Australian tourism sector.
Austrade will continue to administer the Export Market Development Grants (EMDG)
scheme, which helps small and medium-sized Australian businesses meet the
challenges associated with undertaking promotion in export markets. From 1 July 2016
the EMDG scheme will benefit from ongoing legislative status, with no termination
date specified in its legislation.
Austrade also continues to deliver timely consular and passport services to Australians
in 16 overseas locations, extending Australia’s Consular network.
Within Australia, Austrade operates in 10 locations. Its reach is extended through its
TradeStart network in 27 locations across regional and metropolitan Australia,
managed in partnership with state, territory and local governments and industry
bodies.
Austrade will also contribute to Foreign Affairs and Trade portfolio efficiencies, while
maintaining the level of service it provides to its clients and other stakeholders.
Austrade will continue to partner with private sector organisations and state and
territory governments to run the Australian Export Awards that promote and
recognise successful Australian export businesses.
On 1 May 2016, the ‘Australian Trade Commission’ became the ‘Australian Trade and Investment Commission’, reflecting the organisation’s expanded mandate to attract international investment to Australia, in addition to its existing functions. However, the corporate identity, Austrade, will remain.

Austrade Budget Statements
76
1.2 ENTITY RESOURCE STATEMENT
Table 1.1 shows the total funding from all sources available to the entity for its
operations and to deliver programs and services on behalf of the government.
The table summarises how resources will be applied by outcome (government strategic
policy objectives) and by administered (on behalf of the government or the public) and
departmental (for the entity’s operations) classification.
For more detailed information on special accounts and special appropriations, please
refer to Budget Paper No. 4 – Agency Resourcing.
Information in this table is presented on a resourcing (i.e. appropriations/cash
available) basis, whilst the ‘Budgeted expenses by Outcome’ tables in Section 2 and the
financial statements in Section 3 are presented on an accrual basis.
Table 1.1: Austrade resource statement — Budget estimates for 2016-17 as at Budget May 2016
Prepared on a resourcing (i.e. appropriations available) basis. Please note: All figures shown above are GST exclusive – these may not match figures in the cash flow statement. (a) Appropriation Bill (No.1) 2016-17. (b) Estimated retained revenue receipts under section 74 of the PGPA Act. (c) Departmental capital budgets are not separately identified in Appropriation Bill (No.1) and form part of
ordinary annual services items. Please refer to Table 3.5 for further details. For accounting purposes, this amount has been designated as a 'contribution by owner’.
(d) Appropriation Bill (No.2) 2016-17.
2015-16
Estimated
actual
$'000
2016-17
Estimate
$'000
Departmental
Annual appropriations - ordinary annual services (a)
Prior year appropriations available 48,629 45,143
Departmental appropriation 215,861 197,340
s 74 retained revenue receipts (b) 25,100 25,100
Departmental capital budget (c) 14,160 14,526
Annual appropriations - other services - non-operating (d)
Prior year appropriations available (a) - 2,486
Equity injection 2,718 1,595
Total departmental annual appropriations 306,468 286,190
Total departmental resourcing 306,468 286,190
Administered
Annual appropriations - ordinary annual services (a)
Outcome 1 140,897 140,714
Total administered annual appropriations 140,897 140,714
Total administered resourcing 140,897 140,714
Total resourcing for Austrade 447,365 426,904
2015-16 2016-17
Average staffing level (number) 1,024 1,020

Austrade Budget Statements
77
1.3 BUDGET MEASURES
Budget measures in Part 1 relating to Austrade are detailed in Budget Paper No. 2 and
are summarised below.
Table 1.2: Entity 2016-17 Budget measures
Part 1: Measures announced since the 2015-16 Mid-Year Economic and Fiscal Outlook (MYEFO)
Prepared on a Government Finance Statistics (fiscal) basis. Figures displayed as a negative (-) represent a decrease in funds and a positive (+) represent an increase in funds. (a) Net figures are presented for this measure. The total estimated cost of Re-opening Australia's Australian
Trade and Investment Commission Office in Tehran, Iran is $5.3 million, which is offset by savings to be achieved from improved efficiencies in overseas operations.
Program
2015-16
$'000
2016-17
$'000
2017-18
$'000
2018-19
$'000
2019-20
$'000
Expense measures
Foreign Affairs and Trade Portfolio -
eff iciencies 1.1
Departmental expenses (1,500) (6,795) (5,090) (5,309) (5,340)
Total (1,500) (6,795) (5,090) (5,309) (5,340)
Landing Pads in Innovation Hot Spots 1.1
Departmental expenses - 1,180 1,186 - -
Total - 1,180 1,186 - -
Re-opening Australia's Australian
Trade and Investment Commission
Office in Tehran, Iran 1.1
Departmental expenses (a) - (189) (37) (37) (38)
Total - (189) (37) (37) (38)
Total expense measures
Departmental (1,500) (5,804) (3,941) (5,346) (5,378)
Total (1,500) (5,804) (3,941) (5,346) (5,378)
Capital measures
Trans-Pacif ic Partnership -
Implementation 1.1
Departmental capital - 300 - - -
Total - 300 - - -
Re-opening Australia's Australian
Trade and Investment Commission
Office in Tehran, Iran 1.1
Departmental capital - 225 - - -
Total - 225 - - -
Total capital measures
Departmental - 525 - - -
Total - 525 - - -

Austrade Budget Statements
78
Section 2: Outcomes and planned performance
Government outcomes are the intended results, impacts or consequences of actions by
the Government on the Australian community. Commonwealth programs are the
primary vehicle by which government entities achieve the intended results of their
outcome statements. Entities are required to identify the programs which contribute to
government outcomes over the Budget and forward years.
Each outcome is described below together with its related programs. The following
provides detailed information on expenses for each outcome and program, further
broken down by funding source.
Note:
From 1 July 2015, performance reporting requirements in the Portfolio Budget
Statements sit alongside those required under the enhanced Commonwealth
performance framework. It is anticipated that the performance criteria described in
Portfolio Budget Statements will be read with broader information provided in an
entity’s corporate plans and annual performance statements – included in Annual
Reports from October 2016 – to provide an entity’s complete performance story.

Austrade Budget Statements
79
2.1 BUDGETED EXPENSES AND PERFORMANCE FOR OUTCOME 1
Outcome 1 – Contribute to Australia’s economic prosperity by promoting Australia’s export and other international economic interests through the provision of information, advice and services to business, associations, institutions and government
Linked programs
Department of Foreign Affairs and Trade
Programs
Program 1.1 – Foreign Affairs and Trade Operations
Program 1.7 – Public Information Services and Public Diplomacy
Program 1.8 – Programs to Promote Australia’s International Tourism Interests
Contribution to Outcome 1 made by linked programs
DFAT and Austrade work closely across a number of areas. This cooperation results in stronger economic ties, and includes the maximisation of trade and investment opportunities for Australia through the promotion of Free Trade Agreements. It also contributes to the projection of a positive image of Australia as a destination for business, investment, tourism and study.
Tourism Australia
Programs
Program 1 - Grow demand and foster a competitive and sustainable Australian tourism industry through partnership marketing to targeted global consumers
Contribution to Outcome 1 made by linked programs
Austrade provides research and policy support to Tourism Australia’s activities of promoting the export of Australian tourism services. These exports contribute to Australia’s prosperity.
Department of Industry, Innovation and Science (DIIS)
Programs
Program 3 – Program Support
Contribution to Outcome 1 made by linked programs
DIIS provides administrative support in relation to the grants for the Australian Tropical Medicine Commercialisation scheme.
Table continued on the following page.

Austrade Budget Statements
80
Linked programs (continued)
Department of Immigration and Border Protection (DIBP)
Programs
Program 3.2 – Trade Facilitation and Industry Engagement
Contribution to Outcome 1 made by linked programs
Austrade co-operates with DIBP by providing advice on visa policy where this affects trade, tourism, international education and investment. Austrade is also the sole nominating entity for the Premium Investment Visa program and is a nominating entity for the Significant Investor Visa program, which are managed by DIBP.
Department of Education and Training (DET)
Programs
Program 3.7 – International Education Support
Contribution to Outcome 1 made by linked programs
DET development of the National Strategy for International Education to strengthen the fundamentals of the international education sector complements Austrade’s work in developing Australian International Education 2025, a long-term market development roadmap that seeks to enable the sector to realise its full potential. Austrade and DET will continue to work closely to ensure implementation activity is aligned and complementary.

Austrade Budget Statements
81
Budgeted expenses for Outcome 1
This table shows how much Austrade intends to spend (on an accrual basis) on
achieving the outcome, broken down by program, as well as by Administered and
Departmental funding sources.
Table 2.1.1: Budgeted expenses for Outcome 1
Table continued on the following page.
2015-16
Estimated
actual
$'000
2016-17
Budget
$'000
2017-18
Forw ard
estimate
$'000
2018-19
Forw ard
estimate
$'000
2019-20
Forw ard
estimate
$'000
Departmental expenses
Departmental appropriation (a) 203,069 187,626 189,492 190,801 189,440
s 74 Retained revenue receipts (a) 21,596 21,596 21,596 21,596 21,596
Special accounts
Services for Other Entities and
Trust Moneys Special Account1,018 10 - - -
Expenses not requiring
appropriation in the Budget
year (b)
19,000 19,000 19,000 19,000 19,460
Departmental total 244,683 228,232 230,088 231,397 230,496
Total expenses for
program 1.1244,683 228,232 230,088 231,397 230,496
Program 1.1: Promotion of Australia's export and other international economic
interests

Austrade Budget Statements
82
Table 2.1.1: Budgeted expenses for Outcome 1 (continued)
(a) Estimated expenses incurred in relation to receipts retained under section 74 of the PGPA Act. (b) Expenses not requiring appropriation in the Budget year are made up of depreciation expenses,
amortisation expenses, make good expenses and audit fees. Note: Departmental appropriation splits and totals are indicative estimates and may change in the course of the budget year as government priorities change.
2015- 16
Estimated
actual
$'000
2016- 17
Budget
$'000
2017- 18
Forward
estimate
$'000
2018- 19
Forward
estimate
$'000
2019- 20
Forward
estimate
$'000
Administered expenses
Ordinary annual services
(Appropriation Bill No. 1)140,897 140,714 140,158 139,946 137,900
Administered total 140,897 140,714 140,158 139,946 137,900
Total expenses for
program 1.2140,897 140,714 140,158 139,946 137,900
Administered expenses
Special accounts
Administered Payments and
Receipts for Other Entities
Special Account
9,200 9,200 9,200 9,200 9,200
Administered total 9,200 9,200 9,200 9,200 9,200
Total expenses for
Other Administered9,200 9,200 9,200 9,200 9,200
Administered expenses
Ordinary annual services
(Appropriation Bill No. 1)140,897 140,714 140,158 139,946 137,900
Special accounts 9,200 9,200 9,200 9,200 9,200
Administered total 150,097 149,914 149,358 149,146 147,100
Departmental expenses
Departmental appropriation 203,069 187,626 189,492 190,801 189,440
s 74 Retained revenue receipts (a) 21,596 21,596 21,596 21,596 21,596
Special accounts 1,018 10 - - -
Expenses not requiring
appropriation in the Budget year 19,000 19,000 19,000 19,000 19,460
Departmental total 244,683 228,232 230,088 231,397 230,496
Total expenses for Outcome 1 394,780 378,146 379,446 380,543 377,596
2015-16 2016-17
Average staffing level (number) 985 981
Program 1.2: Programmes to promote Australia's exports and other international
economic interests
Outcome 1 Totals by appropriation type
Other Administered

Austrade Budget Statements
83
Table 2.1.2: Program components of Outcome 1
2015-16
Estimated
actual
$'000
2016-17
Budget
$'000
2017-18
Forw ard
estimate
$'000
2018-19
Forw ard
estimate
$'000
2019-20
Forw ard
estimate
$'000
Annual administered expenses:
Ordinary annual services
(Appropriation Bill No. 1) 137,900 137,900 137,900 137,900 137,900
Total component 1 expenses 137,900 137,900 137,900 137,900 137,900
Annual administered expenses:
Ordinary annual services 600 200 - - -
Total component 2 expenses 600 200 - - -
Annual administered expenses:
Ordinary annual services 1,372 773 - - -
Total component 3 expenses 1,372 773 - - -
Annual administered expenses:
Ordinary annual services 1,025 1,841 2,258 2,046 -
Total component 4 expenses 1,025 1,841 2,258 2,046 -
Total program expenses 140,897 140,714 140,158 139,946 137,900
1.2.1 - Export Market Development Grants scheme
1.2.2 - Asian Business Engagement plan
1.2.3 - Free Trade Agreement Promotion
Program 1.2: Programmes to promote Australia's exports and other international
economic interests
1.2.4 - Developing Northern Australia - positioning the north as a leader in tropical health

Austrade Budget Statements
84
Table 2.1.3: Performance criteria for Outcome 1
Table 2.1.3 below details the performance criteria for each program associated with
Outcome 1. It also summarises how each program is delivered and where 2016-17
Budget measures have created new programs or materially changed existing
programs.
Outcome 1 – Contribute to Australia’s economic prosperity by promoting Australia’s export and other international economic interests through the provision of information, advice and services to business, associations, institutions and government
Program 1.1 – Promotion of Australia’s export and other international economic interests
Delivery Austrade achieves this by generating market information and insight, promoting Australian capabilities, developing policy, making connections through an extensive global network of contacts, leveraging the badge of government offshore and providing quality advice and services. Specifically, it
Helps Australian companies to grow their businesses in international markets, and promotes the Australian education and training sector in international markets
Provides coordinated government assistance to promote, attract and facilitate productive foreign direct investment into Australia
Provides advice to the Australian Government on its trade, tourism, international education and training and investment policy agendas
Develops policy, manages programs and provides research to strengthen Australia’s tourism industry and to grow Australia’s market share
Performance information
Year Performance criteria (a) Targets
2015-16 Satisfaction
High level of satisfaction for Ministers, Australian business community, institutions and key partners with Austrade’s services.
Forecast: Austrade expects this level of satisfaction to be at least 70%, as measured in an end-of-year survey.
Develop international markets, and promote international education
Proportion of Australian businesses which have engaged with Austrade, and say Austrade made a positive contribution to their international business activities.
Forecast: Austrade expects this proportion to be at least 70%, as measured in a survey.
Proportion of Australian businesses which have engaged with Austrade, and say they have achieved some form of commercial outcome as a result of working with Austrade.
Forecast: Austrade expects this proportion to be at least 70%, as measured in a survey.
Table continued on following page.

Austrade Budget Statements
85
Table 2.1.3: Performance criteria for Outcome 1 (continued)
2015-16 Win productive foreign direct investment
Number of investment outcomes facilitated
Forecast: Austrade expects to facilitate at least 50 investment outcomes during 2015-16.
Amount of capital expenditure associated with foreign direct investment outcomes facilitated
Forecast: Austrade expects to facilitate investment outcomes that amount to at least $2 billion during 2015-16.
Number of new jobs created / retained (ongoing full time equivalents) as a direct result of investment outcomes facilitated
Forecast: Austrade expects to facilitate investment outcomes during 2015-16 that generate or retain at least 500 FTE jobs.
Anticipated annual exports from investment outcomes facilitated
Forecast: Austrade expects to facilitate investment outcomes during 2015-16 that generate at least $15 million in annual exports.
Number of information, project and visitation requests, and stakeholder introductions generated from potential investors
Forecast: Austrade expects to handle at least 150 information, project and visitation requests and stakeholder introductions from potential investors during 2015-16.
Strengthen Australia’s tourism industry
Priorities and outputs outlined in the Tourism 2015-2020 Implementation Plan progressed in accordance with agreed timeframes
Forecast: Progress will meet agreed timeframes for 2015-16.
Proportion of tourism operators which use Austrade’s tourism research and information and say it helped support their marketing and business decisions
Forecast: Austrade expects at least 80% of respondents to report that it helped support their marketing and business decisions in 2015-16, as measured in a survey.
Table continued on following page.

Austrade Budget Statements
86
Table 2.1.3: Performance criteria for Outcome 1 (continued)
2015-16 Whole-of-government
Effective contribution to whole-of-government policy development using Austrade’s commercial perspectives on export, investment, international education and tourism
Forecast: Austrade will have provided an effective contribution to whole-of-government policy development.
2016-17 Satisfaction
High level of satisfaction for Ministers, Australian business community, institutions and key partners with Austrade’s services.
Forecast: Austrade expects this level of satisfaction to be at least 70%, as measured in a survey.
Develop international markets, and promote international education
Proportion of Australian businesses which have engaged with Austrade, and say Austrade made a positive contribution to their international business activities.
Forecast: Austrade expects this proportion to be at least 70%, as measured in a survey.
Proportion of Australian education institutions which have engaged with Austrade, and say Austrade made a positive contribution to their international business activities.
Forecast: Austrade expects this proportion to be at least 70%, as measured in a survey.
Proportion of Australian education institutions which have engaged with Austrade, and say they have achieved some form of commercial outcome as a result of working with Austrade.
Forecast: Austrade expects this proportion to be at least 70%, as measured in a survey.
Win productive foreign direct investment
Number of investment outcomes facilitated.
Forecast: Austrade expects to facilitate at least 50 investment outcomes during 2016-17.
Amount of investment value (a) associated with foreign direct investment outcomes facilitated
Forecast: Austrade expects to facilitate investment outcomes that amount to at least $2 billion during 2016-17.
Number of new jobs created / retained (ongoing full time equivalents) as a direct result of investment outcomes facilitated
Forecast: Austrade expects to facilitate investment outcomes during 2016-17 that generate or retain at least 500 FTE jobs.
Table continued on following page.

Austrade Budget Statements
87
Table 2.1.3: Performance criteria for Outcome 1 (continued)
2016-17 Number of information, project and visitation request, and stakeholder introductions generated from potential investors
Forecast: Austrade expects to handle at least 150 information, project and visitation requests and stakeholder introductions from potential investors during 2016-17.
Strengthen Australia’s tourism industry
Priorities and outputs outlined in the Tourism 2015-2020 Implementation Plan progressed in accordance with agreed timeframes
Forecast: Progress will meet agreed timeframes for 2016-17.
Proportion of tourism operators which use Austrade’s tourism research and information and say it helped support their marketing and business decisions
Forecast: Austrade expects at least 80% of respondents to report that it helped support their marketing and business decisions in 2016-17, as measured in a survey.
Whole-of-government
Effective contribution to whole-of-government policy development using Austrade’s commercial perspectives on export, investment, international education and tourism
2017-18 and beyond
Generally, as per 2016-17. Generally, as per 2016-17.
Purposes The Australian Trade and Investment Commission (Austrade) contributes to Australia’s economic prosperity by helping Australian businesses, education institutions, tourism operators, governments and citizens as they:
Develop international markets and promote international education
Win productive foreign direct investment
Strengthen Australia’s tourism industry
(a) For 2016/17 the term ‘capital expenditure’ has been changed to ‘investment value’ to more accurately reflect financial measurement of the investment, which may go beyond capital expenditure.

Austrade Budget Statements
88
Program 1.2 – Programs to promote Australia’s export and other international economic interests
Delivery Austrade will administer programs that support Australian businesses’ engagement in international business, provide an incentive for small-to-medium businesses to enter into export markets and grow to become sustainable exporters, or that strengthen and stimulate growth in the tourism industry. It will help Australian companies to grow their business in international markets, including through the administration of the Export Market Development Grants scheme, and promotion of opportunities arising from Australia’s Free Trade Agreements.
Performance information
Year Performance criteria (a) Targets
2015-16 Export Market Development Grants (EMDG) scheme
Proportion of EMDG scheme recipients reporting that the receipt of a grant supported their business to become a more sustainable exporter.
Forecast: Austrade expects at least 90% of EMDG recipients to report that receiving a grant in 2015-16 supported their business to become a more sustainable exporter, as measured by a survey.
Proportion of EMDG scheme recipients reporting that the receipt of a grant enabled them to grow their international revenue.
Forecast: Austrade expects at least 75% of EMDG recipients to report that receiving a grant in 2015-16 enabled them to grow their international revenue, as measured by a survey.
Free Trade Agreement (FTA) Promotion
Proportion of seminar and roadshow attendees reporting an increased awareness of FTAs
Forecast: Austrade expects at least 90% of seminar and roadshow attendees to report increased awareness of FTAs in 2015-16, as measured by feedback forms.
Proportion of seminar and roadshow attendees reporting an increased understanding of how to use and benefit from FTAs
Forecast: Austrade expects at least 85% of seminar and roadshow attendees to report increased awareness of FTAs in 2015-16, as measured by feedback forms.
Tasmanian Regional Tourism Package (TRTP)
TRTP funding distributed to projects identified by the Tasmanian Government in the National Partnership Agreement, consistent with agreed principles
Forecast: Austrade expects that 16 projects will receive TRTP funding in 2015-16.
Tourism Demand Driver Infrastructure (TDDI) Program
Budgeted TDDI funding distributed to state and territory governments
Forecast: Austrade expects at least $9 million of TDDI funding will be distributed to state and territory governments in 2015-16.
TDDI funding distributed to projects identified by state and territory governments in National Partnership Agreements, consistent with funding principles agreed by tourism ministers
Forecast: Austrade expects that funding will be distributed to all states and territories in 2015-16 in line with projects identified in National Partnership Agreements.
Table continued on following page.
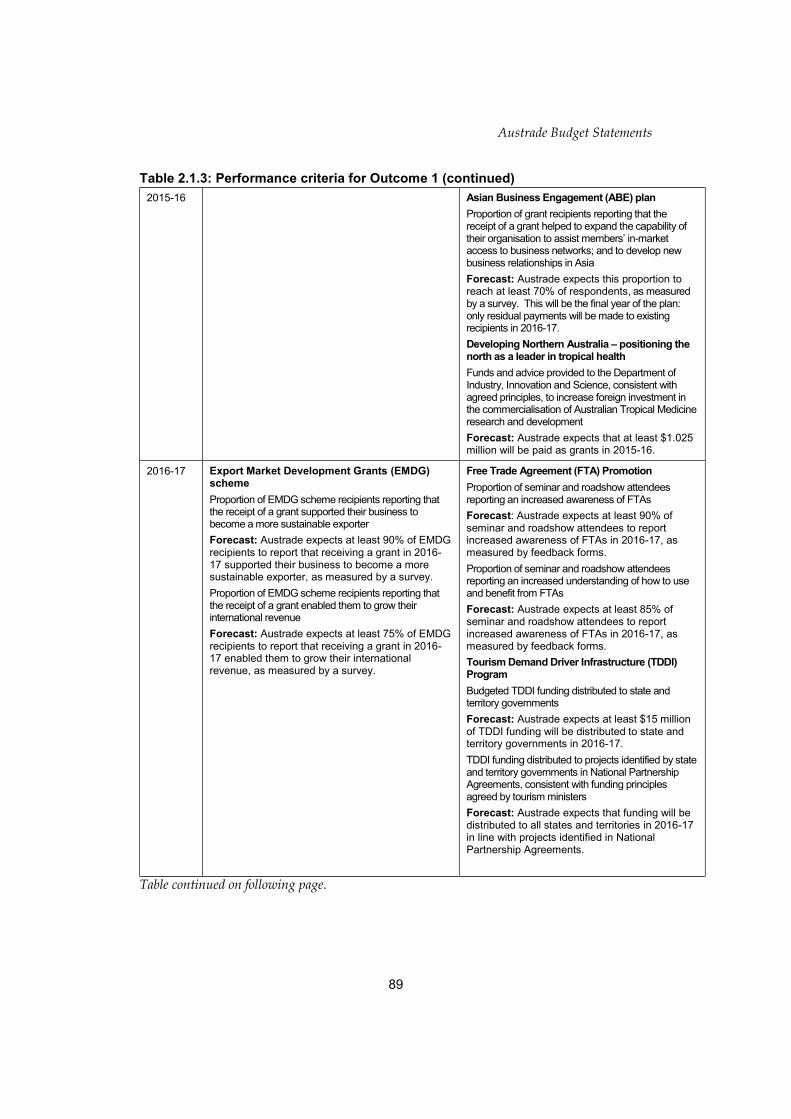
Austrade Budget Statements
89
Table 2.1.3: Performance criteria for Outcome 1 (continued)
2015-16 Asian Business Engagement (ABE) plan
Proportion of grant recipients reporting that the receipt of a grant helped to expand the capability of their organisation to assist members’ in-market access to business networks; and to develop new business relationships in Asia
Forecast: Austrade expects this proportion to reach at least 70% of respondents, as measured by a survey. This will be the final year of the plan: only residual payments will be made to existing recipients in 2016-17.
Developing Northern Australia – positioning the north as a leader in tropical health
Funds and advice provided to the Department of Industry, Innovation and Science, consistent with agreed principles, to increase foreign investment in the commercialisation of Australian Tropical Medicine research and development
Forecast: Austrade expects that at least $1.025 million will be paid as grants in 2015-16.
2016-17 Export Market Development Grants (EMDG) scheme
Proportion of EMDG scheme recipients reporting that the receipt of a grant supported their business to become a more sustainable exporter
Forecast: Austrade expects at least 90% of EMDG recipients to report that receiving a grant in 2016-17 supported their business to become a more sustainable exporter, as measured by a survey.
Proportion of EMDG scheme recipients reporting that the receipt of a grant enabled them to grow their international revenue
Forecast: Austrade expects at least 75% of EMDG recipients to report that receiving a grant in 2016-17 enabled them to grow their international revenue, as measured by a survey.
Free Trade Agreement (FTA) Promotion
Proportion of seminar and roadshow attendees reporting an increased awareness of FTAs
Forecast: Austrade expects at least 90% of seminar and roadshow attendees to report increased awareness of FTAs in 2016-17, as measured by feedback forms.
Proportion of seminar and roadshow attendees reporting an increased understanding of how to use and benefit from FTAs
Forecast: Austrade expects at least 85% of seminar and roadshow attendees to report increased awareness of FTAs in 2016-17, as measured by feedback forms.
Tourism Demand Driver Infrastructure (TDDI) Program
Budgeted TDDI funding distributed to state and territory governments
Forecast: Austrade expects at least $15 million of TDDI funding will be distributed to state and territory governments in 2016-17.
TDDI funding distributed to projects identified by state and territory governments in National Partnership Agreements, consistent with funding principles agreed by tourism ministers
Forecast: Austrade expects that funding will be distributed to all states and territories in 2016-17 in line with projects identified in National Partnership Agreements.
Table continued on following page.

Austrade Budget Statements
90
Table 2.1.3: Performance criteria for Outcome 1 (continued)
Developing Northern Australia – positioning the north as a leader in tropical health
Funds and advice provided to the Department of Industry, Innovation and Science, consistent with agreed principles, to increase foreign investment in the commercialisation of Australian Tropical Medicine research and development.
Forecast: Austrade expects that at least $1.8 million will be paid as grants in 2016-17.
National Innovation and Science Agenda – Global Innovation Strategy
Establishment of landing pads in global innovation hot spots
Forecast: Austrade expects to establish five landing pads in global innovation hot spots by end 2016-17.
2017-18 and beyond
As per 2016-17. As per 2016-17.
Purposes Austrade contributes to Australia’s economic prosperity by helping Australian businesses, education institutions, tourism operators, governments and citizens as they:
develop international markets and promote international education
win productive foreign direct investment
strengthen Australia’s tourism industry
Material changes to Program 1.2 resulting from the following measures:
Measure title – National Innovation and Science Agenda - Global Innovation Strategy
(a) New or modified performance criteria that reflect new or materially changed programs are shown in italics.

Austrade Budget Statements
91
2.2 BUDGETED EXPENSES AND PERFORMANCE FOR OUTCOME 2
Outcome 2: The protection and welfare of Australians abroad through timely and responsive consular and passport services in specific locations overseas
Linked programs
Department of Foreign Affairs and Trade
Programs
Program 2.1 – Consular Services
Program 2.2 – Passport Services
Program 3.1 – Foreign Affairs and Trade Security and IT
Program 3.2 – Overseas Property
Contribution to Outcome 2 made by linked programs
Where Austrade has overseas locations that complement those of DFAT, Austrade provides consular and passport services to Australians in those locations. DFAT ensures a secure Austrade presence overseas for personnel, assets and information.

Austrade Budget Statements
92
Budgeted expenses for Outcome 2
This table shows how much Austrade intends to spend (on an accrual basis) on
achieving the outcome, broken down by program, as well as by Administered and
Departmental funding sources.
Table 2.2.1: Budgeted expenses for Outcome 2
(a) Estimated expenses incurred in relation to receipts retained under section 74 of the PGPA Act. Note: Departmental appropriation splits and totals are indicative estimates and may change in the course of the budget year as government priorities change.
Table 2.2.2: Program components of Outcome 2
Program 2.1 has only one component as described in Table 2.2.1.
2015-16
Estimated
actual
$'000
2016-17
Budget
$'000
2017-18
Forw ard
estimate
$'000
2018-19
Forw ard
estimate
$'000
2019-20
Forw ard
estimate
$'000
Departmental expenses
Departmental appropriation (a) 9,497 9,714 9,676 9,740 9,796
s 74 Retained revenue receipts (a) 3,504 3,504 3,504 3,504 3,504
Departmental total 13,001 13,218 13,180 13,244 13,300
Total expenses for
program 2.113,001 13,218 13,180 13,244 13,300
Departmental expenses
Departmental appropriation 9,497 9,714 9,676 9,740 9,796
s 74 Retained revenue receipts (a) 3,504 3,504 3,504 3,504 3,504
Departmental total 13,001 13,218 13,180 13,244 13,300
Total expenses for Outcome 2 13,001 13,218 13,180 13,244 13,300
2015-16 2016-17
Average staffing level (number) 39 39
Outcome 2: The protection and welfare of Australians abroad through timely and
responsive consular and passport services in specific locations overseas
Program 2.1: Consular and passport services
Outcome 2 Totals by appropriation type

Austrade Budget Statements
93
Table 2.2.3: Performance criteria for Outcome 2
Table 2.2.3 below details the performance criteria for each program associated with
Outcome 2. It also summarises how each program is delivered and where 2016-17
Budget measures have created new programs or materially changed existing
programs.
Outcome 2 – The protection and welfare of Australians abroad through timely and responsive consular and passport services in specific locations overseas
Program 2.1 – Consular and Passport Services
Delivery In overseas locations where Austrade has designated consular management responsibilities, Austrade will continue to place a high priority on helping Australians through the delivery of effective consular services, efficient passport services and practical contingency planning, in accordance with DFAT’s Consular Services and Passports Client Services charters
Performance information
Year Performance criteria Targets
2015-16 Normal passport applications are scanned within 24 hours – three percent tolerance
Forecast: Austrade expects at least 98% of normal passport applications to be scanned within 24 hours in 2015-16.
Routine passports are issued in a timely and responsive manner
Forecast: Austrade expects at least 97% of routine passports to be issued in a timely and responsive manner in 2015-16.
Urgent passport issues are dealt with in a timely responsive manner. Where a priority processing fee is paid, the passport is to be provided within two working days.
Forecast: Austrade expects 97% of urgent passports to be issued within two working days in 2015-16. Note that from 1 January 2016, priority processing fees and service are no longer available in Austrade’s overseas posts.
Notarial services are to be delivered within three working days of the lodgement of documents from a client
Forecast: Austrade expects 97% of the notarial services it provides in 2015-16 to be delivered at the time of appointment, once the correct documentation has been lodged.
2016-17 Normal passport applications are scanned within 24 hours
Forecast: Austrade expects at least 98% of normal passport applications to be scanned within 24 hours in 2016-17.
Routine passports are issued in a timely and responsive manner
Forecast: Austrade expects at least 97% of routine passports to be issued in a timely and responsive manner in 2016-17.
Urgent passport issues are dealt with in a timely responsive manner.
Forecast: Austrade expects 97% of urgent passports to be issued as quickly as reasonably possible in 2016-17.
Table continued on following page.

Austrade Budget Statements
94
Table 2.2.3: Performance criteria for Outcome 2 (continued)
Notarial services are to be delivered when the correct documents are lodged by a client
Forecast: Austrade expects 97% of the notarial services it provides in 2016-17 to be delivered at the time of appointment, once the correct documentation has been lodged.
2017-18 and beyond
As per 2016-17 As per 2016-17
Purposes Austrade contributes to Australia’s economic prosperity by helping Australian businesses and citizens as they seek consular and passport services.

Austrade Budget Statements
95
Section 3: Budgeted financial statements
Section 3 presents budgeted financial statements which provide a comprehensive
snapshot of entity finances for the 2016-17 budget year, including the impact of budget
measures and resourcing on financial statements.
3.1 BUDGETED FINANCIAL STATEMENTS
3.1.1 Differences between entity resourcing and financial statements
There are no differences between the resource information presented in the budget
Papers and in Austrade’s Portfolio Budget Statements.
3.1.2 Explanatory notes and analysis of budgeted financial statements
An analysis of Austrade’s budgeted financial statements, as reflected in the
departmental financial statements and administered schedules, is provided below.
Departmental financial statements
The Departmental financial statements represent the assets, liabilities, revenues and
expenses which are controlled by Austrade. Departmental expenses include employee
and supplier expenses and other administrative costs which are incurred by Austrade
in undertaking its operations.
Budgeted departmental comprehensive income statement
This statement provides estimated actual financial results for 2015-16 and the
estimated revenue and expenses for 2016-17 and forward years.
Total income in 2016-17 is estimated to be $222.5 million, which represents a decrease
of $15.4 million in appropriations from the 2015-16 estimated actual shown at Table
3.2.1. The decrease is primarily a result of:
Foreign Affairs and Trade Portfolio efficiencies – a decrease of $5.3 million;
movement of funds for the Free Trade Agreement from 2016-17 to 2015-16 – a
decrease of $6.0 million;
terminating program – Australia Week in China – a decrease of $1.8 million; and
continuation of an additional one-off 2.5 per cent Efficiency Dividend announced
in December 2011 – a decrease of $2.2 million;
Partially offset by:

Austrade Budget Statements
96
landing pads in innovation hot spots – a net increase of $1.2 million; and
foreign exchange and parameter adjustments – a net increase of $2.3 million.
Austrade is receiving funding of $16.1 million to fund the Departmental Capital
Budget which is treated as an equity injection.
Total estimated expenses for 2016-17 have decreased by $16.2 million to reflect the
reduction in income.
Budgeted departmental balance sheet
This statement discloses the estimated end of year financial position for Austrade.
Austrade’s budgeted net asset position at the end of 2016-17 of $62.3 million represents
an increase of $0.6 million from the 2015-16 estimated actual in table 3.2 due to the
variation between capital program funding ($16.1 million), estimated asset revaluation
surplus ($3.5 million) and estimated depreciation expense ($19.0 million).
Departmental statement of changes in equity — summary of movement
This statement shows changes in equity resulting from the net impact of movements in
accumulated results, assets revaluation and other reserves, and contributed equity.
Total equity at the end of 2016-17 is estimated to be $62.3 million, an increase of $0.6
million due to the variation between capital program funding ($16.1 million),
estimated asset revaluation surplus ($3.5 million) and estimated depreciation expense
($19.0 million).
Budgeted departmental statement of cash flows
This statement shows the extent and nature of cash flows as a result of Austrade’s
operating, investing and financing activities. Austrade’s cash balance at the end of
2016-17 is estimated to be $5.5 million.
Departmental capital budget statement
This statement shows all planned departmental capital expenditure on non-financial
assets, whether funded through capital appropriations, additional equity, borrowings,
or funds from internal sources.
Departmental statement of asset movements
This statement shows budgeted acquisitions and disposals of non-financial assets
during the budget year.
Schedule of administered activity
Details of transactions administered by Austrade on behalf of the Government are
shown in the following schedules to the financial statements.

Austrade Budget Statements
97
Schedule of budgeted income and expenses administered on behalf of Government
This schedule discloses revenue and expenses administered on behalf of the
Government.
Administered expenses of $140.7 million for 2016-17 relate to the EMDG Scheme
($137.9 million), Free Trade Agreement Promotion ($0.8 million), Developing Northern
Australia - positioning the north as a leader in tropical health ($1.9 million) and ACBE
Plan ($0.2 million). The EMDG Scheme is comprised of $131.0 million in grant
expenditure and $6.9 million in expenditure for the costs of administration on behalf of
the Government. Free Trade Agreement Promotion, Developing Northern Australia -
positioning the north as a leader in tropical health and ACBE Plan are wholly
comprised of grant expenditure.
Schedule of budgeted assets and liabilities administered on behalf of Government
This schedule identifies the assets and liabilities administered on behalf of the
Government.
Total administered assets and liabilities for 2016-17 are estimated at $0.0 million and
$8.8 million respectively.
Schedule of budgeted administered cash flows
This schedule shows cash flows administered on behalf of the Government. All cash received is expected to be expended on the relevant programs.

Austrade Budget Statements
98
3.2.1 BUDGETED FINANCIAL STATEMENTS TABLES
Table 3.1: Comprehensive income statement (showing net cost of services) for the period ended 30 June
Table continued on the following page.
2015-16
Estimated
actual
$'000
2016-17
Budget
$'000
2017-18
Forw ard
estimate
$'000
2018-19
Forw ard
estimate
$'000
2019-20
Forw ard
estimate
$'000
EXPENSES
Employee benefits 133,502 136,849 138,853 138,877 137,670
Suppliers 105,182 85,601 85,415 86,764 86,666
Depreciation and amortisation 19,000 19,000 19,000 19,000 19,460
Total expenses 257,684 241,450 243,268 244,641 243,796
LESS:
OWN-SOURCE INCOME
Own-source revenue
Sale of goods and rendering of services 22,868 22,010 22,000 22,000 22,000
Rental income 100 100 100 100 100
Other 3,000 3,000 3,000 3,000 3,000
Total own-source revenue 25,968 25,110 25,100 25,100 25,100
Total own-source income 25,968 25,110 25,100 25,100 25,100
Net (cost of)/contribution by
services
(231,716) (216,340) (218,168) (219,541) (218,696)
Revenue from Government 212,716 197,340 199,168 200,541 199,236
Surplus/(deficit) attributable to the
Australian Government
(19,000) (19,000) (19,000) (19,000) (19,460)
OTHER COMPREHENSIVE INCOME
Changes in asset revaluation surplus 900 3,500 3,500
Total other comprehensive income 900 3,500 3,500 - -
Total comprehensive income/(loss) (18,100) (15,500) (15,500) (19,000) (19,460)
Total comprehensive income/(loss)
attributable to the Australian
Government
(18,100) (15,500) (15,500) (19,000) (19,460)

Austrade Budget Statements
99
Table 3.1: Comprehensive income statement (showing net cost of services) for the period ended 30 June
(a) From 2010-11, the Government introduced net cash appropriation arrangements where Bill 1 revenue
appropriations for the depreciation/amortisation expenses of non-corporate Commonwealth entities (and select corporate Commonwealth entities) were replaced with a separate capital budget (the Departmental Capital Budget, or DCB) provided through Bill 1 equity appropriations. For information regarding DCBs, please refer to Table 3.5 Departmental Capital Budget Statement.
Prepared on Australian Accounting Standards basis.
2015-16
$'000
2016-17
$'000
2017-18
$'000
2018-19
$'000
2019-20
$'000
Total comprehensive income/(loss)
excluding depreciation/amortisation
expenses previously funded
through revenue appropriations.
900 3,500 3,500 - -
less depreciation/amortisation
expenses previously funded through
revenue appropriations (a) 19,000 19,000 19,000 19,000 19,460
Total comprehensive income/(loss)
- as per the statement of
comprehensive income
(18,100) (15,500) (15,500) (19,000) (19,460)
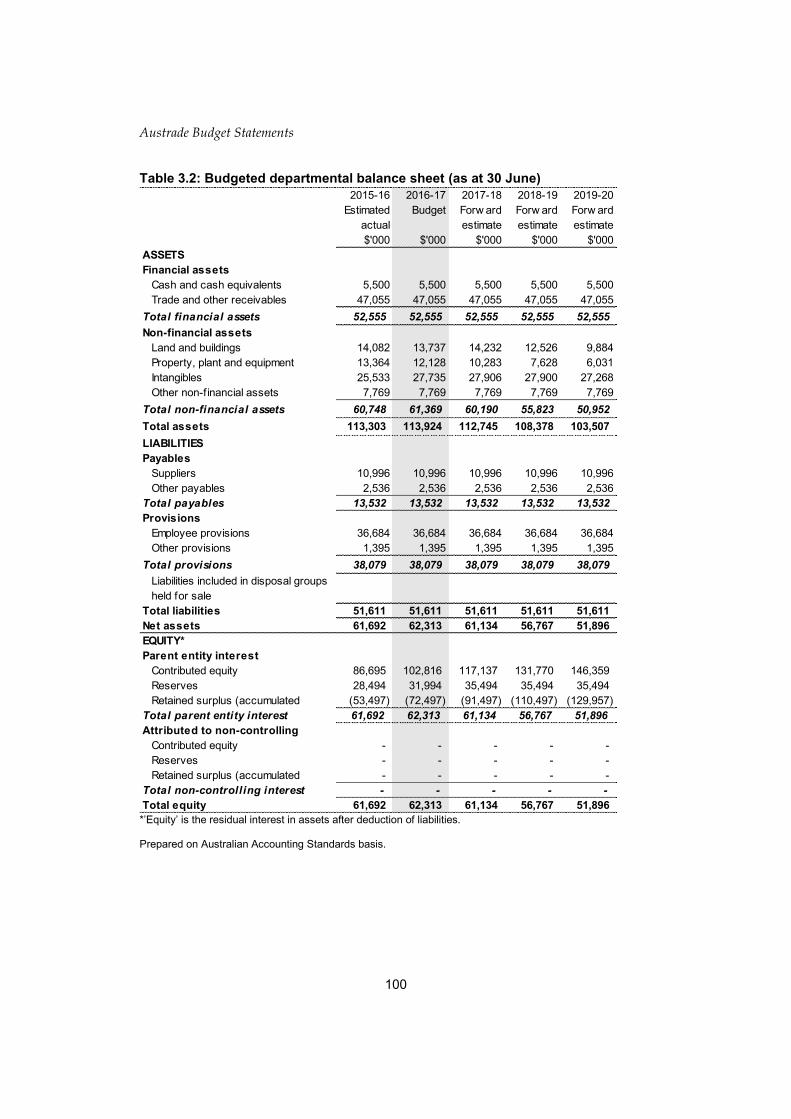
Austrade Budget Statements
100
Table 3.2: Budgeted departmental balance sheet (as at 30 June)
*’Equity’ is the residual interest in assets after deduction of liabilities. Prepared on Australian Accounting Standards basis.
2015-16
Estimated
actual
$'000
2016-17
Budget
$'000
2017-18
Forw ard
estimate
$'000
2018-19
Forw ard
estimate
$'000
2019-20
Forw ard
estimate
$'000
ASSETS
Financial assets
Cash and cash equivalents 5,500 5,500 5,500 5,500 5,500
Trade and other receivables 47,055 47,055 47,055 47,055 47,055
Total financial assets 52,555 52,555 52,555 52,555 52,555
Non-financial assets
Land and buildings 14,082 13,737 14,232 12,526 9,884
Property, plant and equipment 13,364 12,128 10,283 7,628 6,031
Intangibles 25,533 27,735 27,906 27,900 27,268
Other non-financial assets 7,769 7,769 7,769 7,769 7,769
Total non-financial assets 60,748 61,369 60,190 55,823 50,952
Total assets 113,303 113,924 112,745 108,378 103,507
LIABILITIES
Payables
Suppliers 10,996 10,996 10,996 10,996 10,996
Other payables 2,536 2,536 2,536 2,536 2,536
Total payables 13,532 13,532 13,532 13,532 13,532
Provisions
Employee provisions 36,684 36,684 36,684 36,684 36,684
Other provisions 1,395 1,395 1,395 1,395 1,395
Total provisions 38,079 38,079 38,079 38,079 38,079
Liabilities included in disposal groups
held for sale
Total liabilities 51,611 51,611 51,611 51,611 51,611
Net assets 61,692 62,313 61,134 56,767 51,896
EQUITY*
Parent entity interest
Contributed equity 86,695 102,816 117,137 131,770 146,359
Reserves 28,494 31,994 35,494 35,494 35,494
Retained surplus (accumulated (53,497) (72,497) (91,497) (110,497) (129,957)
Total parent entity interest 61,692 62,313 61,134 56,767 51,896
Attributed to non-controlling
Contributed equity - - - - -
Reserves - - - - -
Retained surplus (accumulated - - - - -
Total non-controlling interest - - - - -
Total equity 61,692 62,313 61,134 56,767 51,896

Austrade Budget Statements
101
Table 3.3: Departmental statement of changes in equity — summary of movement (Budget year 2016-17)
Prepared on Australian Accounting Standards basis.
Retained
earnings
$'000
Asset
revaluation
reserve
$'000
Other
reserves
$'000
Contributed
equity/
capital
$'000
Total
equity
$'000
Opening balance as at 1 July 2016
Balance carried forw ard from previous
period(53,497) 28,494 - 86,695 61,692
Adjusted opening balance (53,497) 28,494 - 86,695 61,692
Comprehensive income
Other comprehensive income - 3,500 - - 3,500
Surplus/(deficit) for the period (19,000) - - - (19,000)
Total comprehensive income (19,000) 3,500 - - (15,500)
of w hich:
Attributable to the Australian
Government(72,497) 31,994 - 86,695 46,192
Attributable to non-controlling interest - - - - -
Transactions with owners
Contributions by owners
Equity injection - Appropriation 1,595 1,595
Departmental capital budget (DCB) 14,526 14,526
Sub-total transactions with owners - - - 16,121 16,121
Transfers betw een equity
Transfers betw een equity components -
Estimated closing balance as at 30
June 2017(72,497) 31,994 - 102,816 62,313
Less: non-controlling interests* -
Closing balance attributable to the
Australian Government(72,497) 31,994 - 102,816 62,313
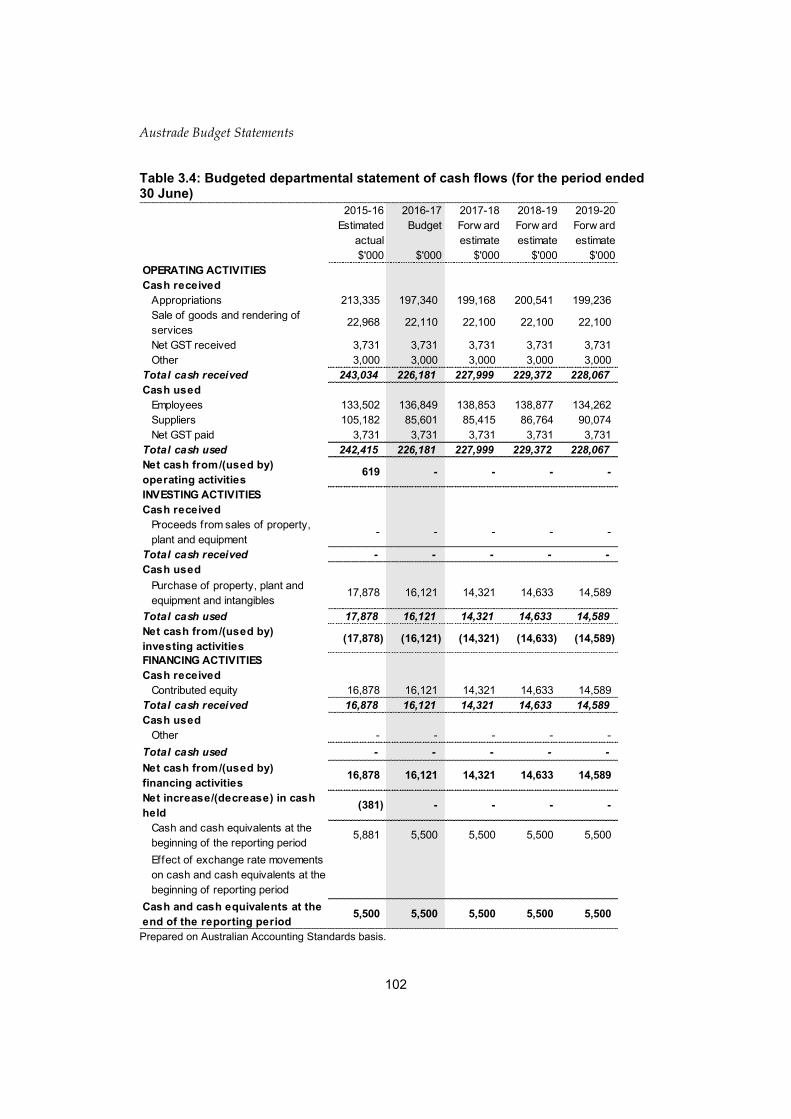
Austrade Budget Statements
102
Table 3.4: Budgeted departmental statement of cash flows (for the period ended 30 June)
Prepared on Australian Accounting Standards basis.
2015-16
Estimated
actual
$'000
2016-17
Budget
$'000
2017-18
Forw ard
estimate
$'000
2018-19
Forw ard
estimate
$'000
2019-20
Forw ard
estimate
$'000
OPERATING ACTIVITIES
Cash received
Appropriations 213,335 197,340 199,168 200,541 199,236
Sale of goods and rendering of
services22,968 22,110 22,100 22,100 22,100
Net GST received 3,731 3,731 3,731 3,731 3,731
Other 3,000 3,000 3,000 3,000 3,000
Total cash received 243,034 226,181 227,999 229,372 228,067
Cash used
Employees 133,502 136,849 138,853 138,877 134,262
Suppliers 105,182 85,601 85,415 86,764 90,074
Net GST paid 3,731 3,731 3,731 3,731 3,731
Total cash used 242,415 226,181 227,999 229,372 228,067
Net cash from/(used by)
operating activities619 - - - -
INVESTING ACTIVITIES
Cash received
Proceeds from sales of property,
plant and equipment- - - - -
Total cash received - - - - -
Cash used
Purchase of property, plant and
equipment and intangibles17,878 16,121 14,321 14,633 14,589
Total cash used 17,878 16,121 14,321 14,633 14,589
Net cash from/(used by)
investing activities(17,878) (16,121) (14,321) (14,633) (14,589)
FINANCING ACTIVITIES
Cash received
Contributed equity 16,878 16,121 14,321 14,633 14,589
Total cash received 16,878 16,121 14,321 14,633 14,589
Cash used
Other - - - - -
Total cash used - - - - -
Net cash from/(used by)
financing activities16,878 16,121 14,321 14,633 14,589
Net increase/(decrease) in cash
held(381) - - - -
Cash and cash equivalents at the
beginning of the reporting period5,881 5,500 5,500 5,500 5,500
Effect of exchange rate movements
on cash and cash equivalents at the
beginning of reporting period
Cash and cash equivalents at the
end of the reporting period5,500 5,500 5,500 5,500 5,500

Austrade Budget Statements
103
Table 3.5: Departmental capital budget statement (for the period ended 30 June)
(a) Includes both current Bill 2 and prior Act 2/4/6 appropriations and special capital appropriations. (b) Does not include annual finance lease costs. Includes purchases from current and previous years’
Departmental capital budgets (DCBs). Prepared on Australian Accounting Standards basis.
2015-16
Estimated
actual
$'000
2016-17
Budget
$'000
2017-18
Forw ard
estimate
$'000
2018-19
Forw ard
estimate
$'000
2019-20
Forw ard
estimate
$'000
NEW CAPITAL APPROPRIATIONS
Capital budget - Bill 1 (DCB) 14,160 14,526 14,321 14,443 14,589
Equity injections - Bill 2 2,718 1,595 190
Total new capital appropriations 16,878 16,121 14,321 14,633 14,589
Provided for:
Purchase of non-financial assets 16,878 16,121 14,321 14,633 14,589
Total items 16,878 16,121 14,321 14,633 14,589
PURCHASE OF NON-FINANCIAL ASSETS
Funded by capital appropriations (a) 2,718 1,595 - 190 -
Funded by capital appropriation - DCB (b) 15,160 14,526 14,321 14,443 14,589
TOTAL 17,878 16,121 14,321 14,633 14,589
RECONCILIATION OF CASH USED TO
ACQUIRE ASSETS TO ASSET
MOVEMENT TABLE
Total purchases 17,878 16,121 14,321 14,633 14,589
Total cash used to acquire assets 17,878 16,121 14,321 14,633 14,589
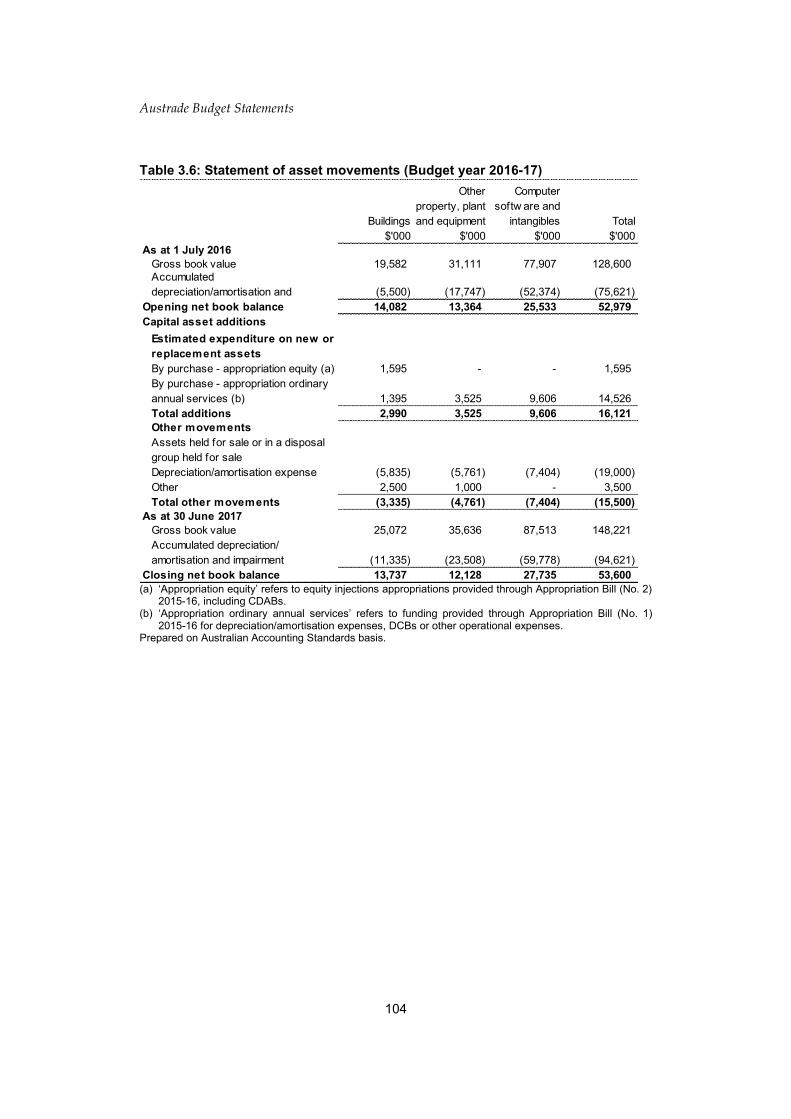
Austrade Budget Statements
104
Table 3.6: Statement of asset movements (Budget year 2016-17)
(a) ‘Appropriation equity’ refers to equity injections appropriations provided through Appropriation Bill (No. 2)
2015-16, including CDABs. (b) ‘Appropriation ordinary annual services’ refers to funding provided through Appropriation Bill (No. 1)
2015-16 for depreciation/amortisation expenses, DCBs or other operational expenses. Prepared on Australian Accounting Standards basis.
Buildings
$'000
Other
property, plant
and equipment
$'000
Computer
softw are and
intangibles
$'000
Total
$'000
As at 1 July 2016
Gross book value 19,582 31,111 77,907 128,600
Accumulated
depreciation/amortisation and (5,500) (17,747) (52,374) (75,621)
Opening net book balance 14,082 13,364 25,533 52,979
Capital asset additions
Estimated expenditure on new or
replacement assets
By purchase - appropriation equity (a) 1,595 - - 1,595
By purchase - appropriation ordinary
annual services (b) 1,395 3,525 9,606 14,526
Total additions 2,990 3,525 9,606 16,121
Other movements
Assets held for sale or in a disposal
group held for sale
Depreciation/amortisation expense (5,835) (5,761) (7,404) (19,000)
Other 2,500 1,000 - 3,500
Total other movements (3,335) (4,761) (7,404) (15,500)
As at 30 June 2017
Gross book value 25,072 35,636 87,513 148,221
Accumulated depreciation/
amortisation and impairment (11,335) (23,508) (59,778) (94,621)
Closing net book balance 13,737 12,128 27,735 53,600

Austrade Budget Statements
105
Au
strade B
ud
get S
tatemen
ts
Table 3.7: Schedule of budgeted income and expenses administered on behalf of Government (for the period ended 30 June)
Prepared on Australian Accounting Standards basis.
2015-16
Estimated
actual
$'000
2016-17
Budget
$'000
2017-18
Forw ard
estimate
$'000
2018-19
Forw ard
estimate
$'000
2019-20
Forw ard
estimate
$'000
EXPENSES
Employee benefits 5,000 5,000 5,000 5,000 5,000
Suppliers 1,895 1,895 1,895 1,895 1,895
Grants 134,002 133,819 133,263 133,051 131,005
Depreciation and amortisation
Total expenses administered on
behalf of Government140,897 140,714 140,158 139,946 137,900
LESS:
OWN-SOURCE INCOME
Total own-sourced income
administered on behalf of
Government
- - - - -
Net cost of/(contribution by) services 140,897 140,714 140,158 139,946 137,900
Surplus/(deficit) before income tax 140,897 140,714 140,158 139,946 137,900
Income tax expense - - - - -
Surplus/(deficit) after income tax 140,897 140,714 140,158 139,946 137,900
OTHER COMPREHENSIVE INCOME
Items not subject of subsequent
Changes in asset revaluation surplus - - - - -
Total other comprehensive income - - - - -
Total comprehensive income/(loss) 140,897 140,714 140,158 139,946 137,900

Austrade Budget Statements
106
Table 3.8: Schedule of budgeted assets and liabilities administered on behalf of Government (as at 30 June)
Prepared on Australian Accounting Standards basis.
2015-16
Estimated
actual
$'000
2016-17
Budget
$'000
2017-18
Forw ard
estimate
$'000
2018-19
Forw ard
estimate
$'000
2019-20
Forw ard
estimate
$'000
ASSETS
Financial assets
Cash and cash equivalents - - - - -
Trade and other receivables 41 41 41 41 41
Total financial assets 41 41 41 41 41
Non-financial assets
Total non-financial assets - - - - -
Assets held for sale - - - - -
Total assets administered on
behalf of Government41 41 41 41 41
LIABILITIES
Payables
Suppliers 30 30 30 30 30
Grants 635 635 635 635 635
Other payables 22 22 22 22 22
Total payables 687 687 687 687 687
Provisions
Employee provisions 2,035 2,035 2,035 2,035 2,035
Other provisions 6,066 6,066 6,066 6,066 6,066
Total provisions 8,101 8,101 8,101 8,101 8,101
Liabilities included in disposal
groups held for sale
Total liabilities administered on
behalf of Government8,788 8,788 8,788 8,788 8,788
Net assets/(liabilities) (8,747) (8,747) (8,747) (8,747) (8,747)

Austrade Budget Statements
107
Table 3.9: Schedule of budgeted administered cash flows (for the period ended 30 June)
2015-16
Estimated
actual
$'000
2016-17
Budget
$'000
2017-18
Forw ard
estimate
$'000
2018-19
Forw ard
estimate
$'000
2019-20
Forw ard
estimate
$'000
OPERATING ACTIVITIES
Cash received
Net GST received 195 195 195 195 195
Other
Total cash received 195 195 195 195 195
Cash used
Grant 134,002 133,819 133,263 133,051 131,005
Suppliers 1,895 1,895 1,895 1,895 1,895
Net GST paid 195 195 195 195 195
Employees 5,000 5,000 5,000 5,000 5,000
Total cash used 141,092 140,909 140,353 140,141 138,095
Net cash from/(used by) operating
activities(140,897) (140,714) (140,158) (139,946) (137,900)
Net increase/(decrease) in cash
held(140,897) (140,714) (140,158) (139,946) (137,900)
Cash and cash equivalents at
beginning of reporting period- - - - -
Cash from Official Public Account for:
- Appropriations 140,897 140,714 140,158 139,946 137,900
Total cash from Official Public
Account140,897 140,714 140,158 139,946 137,900
Cash and cash equivalents at end
of reporting period- - - - -


109
Au
strade B
ud
get S
tatemen
ts Australian Centre for International Agricultural
Research (ACIAR)
Entity resources and planned performance


111
AUSTRALIAN CENTRE FOR INTERNATIONAL
AGRICULTURAL RESEARCH (ACIAR)
Section 1: Entity overview and resources .............................................................. 112
1.1 Strategic direction statement ........................................................................ 112
1.2 Entity resource statement ............................................................................. 114
Section 2: Outcomes and planned performance ................................................... 116
2.1 Budgeted expenses and performance for Outcome 1 .................................. 117
Section 3: Budgeted financial statements .............................................................. 121
3.1 Budgeted financial statements...................................................................... 121
3.2.1 Budgeted financial statements tables ........................................................... 123

ACIAR Budget Statements
112
AUSTRALIAN CENTRE FOR INTERNATIONAL
AGRICULTURAL RESEARCH (ACIAR)
Section 1: Entity overview and resources
1.1 STRATEGIC DIRECTION STATEMENT
ACIAR works in Australia’s national interest by contributing to economic growth and
poverty reduction in the Indo-Pacific region. ACIAR will continue to improve the
productivity, sustainability and profitability of agricultural systems, through
international agricultural research and training partnerships and the empowerment of
women and girls.
While ACIAR will concentrate its efforts in developing Asia Pacific countries in 2016-
17, ACIAR will also engage in high-payoff partnerships in other regions in support of
Australia’s foreign policy objectives. ACIAR will work through bilateral (at least 70 per
cent) and multilateral (up to 30 per cent) modalities. In line with the refocusing of the
Australian aid program, ACIAR has increased funding to East Asia and the Pacific
region, particularly Papua New Guinea (PNG).
ACIAR will directly contribute to the Government’s aid policy by working to enhance
and promote agricultural competitiveness and sustainability, increase market access,
and improve value-chain efficiencies and effectiveness. Farm-level productivity and
the competitiveness of both traditional and emerging value chains to achieve access on
domestic and international markets will continue to be a primary focus of the Centre’s
activities.
ACIAR’s strategic approach will be to respond to major challenges in our region and
where Australia has comparative advantage. A number of countries in the Indo–Pacific
region remain characterised by persistent and widespread poverty, high dependence
on agriculture, high population growth, limited economic growth, an increasing
disparity in incomes between the rich and poor, and in many cases political instability.
It is these countries that will continue to be important partners for ACIAR.
ACIAR will capitalise on its strong people-to-people connections to build innovative
responses to agricultural challenges. ACIAR’s research and training partnerships will
also deliver benefits to Australian farmers, institutions and the private sector in areas
such as biosecurity, technology, research capabilities and trade, as well as improve
smallholder farmer productivity and livelihoods in the countries in which the Centre
works.
ACIAR will continue to manage research partnerships in four areas of endeavour:
crops; livestock and fisheries; natural resources and forestry; socioeconomics and
policy. There will be a multidisciplinary approach between these research clusters.

ACIAR Budget Statements
113
Cross-cutting issues such as communications and the empowerment of women and
girls will be incorporated into the design, delivery and assessment of impacts of the
Centre’s activities.
At a global level, ACIAR will engage closely with a range of international multilateral
institutions and associations, including CGIAR, the Asia Pacific Association of
Agricultural Research Institutions (APAARI), ASEAN, CABI (an intergovernmental,
not-for-profit organisation), the UN Food and Agricultural Organization (FAO), the
Pacific Community (PC) and The World Vegetable Center (AVRDC) to extend our
effectiveness and to reduce some of the challenges our environment presents.
ACIAR will generate outputs across four areas: new technologies; new knowledge;
greater capacity; and better decision-making.
ACIAR will continue to fund work that helps generate new scientific knowledge
aimed at the development of resilient and robust agricultural systems. We will deepen
our existing partnerships and explore new and more diverse partnerships, with greater
emphasis on the private sector and non-government organisations, and new,
innovative partnerships with emerging economies, in order that knowledge generated
by our partnership is applied effectively.
ACIAR will work to improve linkages of high-value agriculture to markets by
implementing research and development solutions, and developing new partnerships,
particularly with private industry. ACIAR complements emergency relief work by
supporting collaborative research and development, and will address the longer-term
consequences of post-disaster changes in the farming systems in Vanuatu, Nepal,
Indonesia and Fiji.
ACIAR will build greater capacity in partner countries to undertake and use research.
Building institutional and individual capacity will significantly enhance the
sustainability of our research outcomes and reduce skills gaps. ACIAR will support the
development of skills and knowledge by formal postgraduate, research management
and leadership development and ‘on-the-job’ training, and thereby build enduring
people-to-people links between Australia, our regional neighbours and the broader
international community.
ACIAR will continue to develop the evidence base for good policy formulation and
will actively work to make existing information available.

ACIAR Budget Statements
114
1.2 ENTITY RESOURCE STATEMENT
Table 1.1 shows the total funding from all sources available to the entity for its
operations and to deliver programs and services on behalf of the Government.
The table summarises how resources will be applied by outcome (Government
strategic policy objectives) and by administered (on behalf of the Government or the
public) and departmental (for the entity’s operations) classification.
For more detailed information on special accounts and special appropriations, please
refer to Budget Paper No. 4 – Agency Resourcing.
Information in this table is presented on a resourcing (i.e. appropriations/cash
available) basis, whilst the ‘Budgeted expenses for Outcome 1 table in Section 2 and
the financial statements in Section 3 are presented on an accrual basis.

ACIAR Budget Statements
115
Table 1.1: ACIAR resource statement — Budget estimates for 2016-17 as at Budget May 2016
Prepared on a resourcing (i.e. appropriations available) basis. Please note: All figures shown above are GST exclusive – these may not match figures in the cash flow statement. (a) Appropriation Bill (No.1) 2016-17. (b) Estimated retained revenue receipts under section 74 of the PGPA Act. (c) Departmental capital budgets are not separately identified in Appropriation Bill (No.1) and form part of
ordinary annual services items. Please refer to Table 3.5 for further details. For accounting purposes, this amount has been designated as a 'contribution by owner’.
(d) Appropriation Bill (No.2) 2016-17. (e) Excludes 'Special Public Money' held in accounts like Other Trust Monies accounts (OTM), Services for
Other Government and Non-agency Bodies accounts (SOG) or Services for Other Entities and Trust Moneys accounts (SOETM)). For further information on special appropriations and special accounts, please refer to Budget Paper No. 4 - Agency Resourcing. Please also see Table 2.1 for further information on outcome and program expenses broken down by various funding sources, e.g. annual appropriations, special appropriations and special accounts.
2015-16
Estimated
actual
$'000
2016-17
Estimate
$'000
Departmental
Annual appropriations - ordinary annual services (a)
Prior year appropriations available 3,622 3,645
Departmental appropriation 9,654 9,494
s 74 retained revenue receipts (b) 2,631 1,627
Departmental capital budget (c) 248 247
Annual appropriations - other services - non-operating (d)
Equity injection 161 -
Total departmental annual appropriations 16,316 15,013
Total departmental resourcing 16,316 15,013
Administered
Annual appropriations - ordinary annual services (a)
Prior year appropriations available 2,187 2,982
Outcome 1 81,629 93,993
Total administered annual appropriations 83,816 96,975
Special accounts (e)
Opening balance 27,851 19,877
Non-appropriation receipts 13,505 15,539
Total special account receipts 41,356 35,416
Total administered resourcing 125,172 132,391
Total resourcing for ACIAR 141,488 147,404
2015-16 2016-17
Average staffing level (number) 74 74

ACIAR Budget Statements
116
Section 2: Outcomes and planned performance
Government outcomes are the intended results, impacts or consequences of actions by
the Government on the Australian community. Commonwealth programs are the
primary vehicle by which Government entities achieve the intended results of their
outcome statements. Entities are required to identify the programs which contribute to
Government outcomes over the Budget and forward years.
Each outcome is described below together with its related programs. The following
provides detailed information on expenses for each outcome and program, further
broken down by funding source.
Note:
From 1 July 2015, performance reporting requirements in the Portfolio Budget
Statements sit alongside those required under the enhanced commonwealth
performance framework. It is anticipated that the performance criteria described in
Portfolio Budget Statements will be read with broader information provided in an
entity’s corporate plans and annual performance statements – included in Annual
Reports from October 2016 – to provide an entity’s complete performance story.
ACIAR Budget Statements
117
Au
strade B
ud
get S
tatemen
ts
2.1 BUDGETED EXPENSES AND PERFORMANCE FOR OUTCOME 1
Outcome 1: To achieve more productive and sustainable agricultural systems for the benefit of developing countries and Australia through international agricultural research and training partnerships.

ACIAR Budget Statements
118
Budgeted expenses for Outcome 1
This table shows how much the entity intends to spend (on an accrual basis) on
achieving the outcome, broken down by program, as well as by Administered and
Departmental funding sources.
Table 2.1: Budgeted expenses for Outcome 1
(a) Estimated expenses incurred in relation to receipts retained under section 74 of the PGPA Act. (b) Expenses not requiring appropriation in the Budget year are made up of depreciation expenses,
amortisation expenses, make good expenses and audit fees. Note: Departmental appropriation splits and totals are indicative estimates and may change in the course of the budget year as Government priorities change.
2015-16
Estimated
actual
$'000
2016-17
Budget
$'000
2017-18
Forw ard
estimate
$'000
2018-19
Forw ard
estimate
$'000
2019-20
Forw ard
estimate
$'000
Administered expenses
Ordinary annual services
(Appropriation Bill No. 1) 81,629 93,993 95,780 97,503 99,356
Special accounts 21,480 24,010 18,365 16,837 18,410
Administered total 103,109 118,003 114,145 114,340 117,766
Departmental expenses
Departmental appropriation 9,654 9,494 9,551 9,603 9,682
s 74 Retained revenue receipts (a) 1,787 1,627 1,787 1,962 2,126
Expenses not requiring
appropriation in the Budget year (b) 336 491 494 497 493
Departmental total 11,777 11,612 11,832 12,062 12,301
Total expenses for
program 1 114,886 129,615 125,977 126,402 130,067
2015-16
Estimated
actual
$'000
2016-17
Budget
$'000
2017-18
Forw ard
estimate
$'000
2018-19
Forw ard
estimate
$'000
2019-20
Forw ard
estimate
$'000
Administered expenses
Ordinary annual services
(Appropriation Bill No. 1) 81,629 93,993 95,780 97,503 99,356
s74 Retained revenue receipts (a)
Special accounts 21,480 24,010 18,365 16,837 18,410
Administered total 103,109 118,003 114,145 114,340 117,766
Departmental expenses
Departmental appropriation 9,654 9,494 9,551 9,603 9,682
s 74 Retained revenue receipts (a) 1,787 1,627 1,787 1,962 2,126
Expenses not requiring
appropriation in the Budget year (b) 336 491 494 497 493
Departmental total 11,777 11,612 11,832 12,062 12,301
Total expenses for Outcome 1 114,886 129,615 125,977 126,402 130,067
2015-16 2016-17
Average staffing level (number) 74 74
Program 1: International Agricultural Research and Development
Outcome 1 Totals by appropriation type

ACIAR Budget Statements
119
Table 2.2: Performance criteria for Outcome 1
Table 2.2 below details the performance criteria for the single program associated with
Outcome 1. It also summarises how the program is delivered and where 2016-17
Budget measures have created new programs or materially changed existing
programs.
Outcome 1 – To achieve more productive and sustainable agricultural systems for the benefit of developing countries and Australia through international agricultural research and training partnerships.
Program 1 – International agricultural research for development for more productive and sustainable agriculture.
Delivery ACIAR’s delivery mechanism is as both a valued funder and knowledgeable research broker operating through establishing active working partnerships, supporting the empowerment of women and girls, and providing timely and consistent funding and strong technical backing. ACIAR will build on its current close working relations with regional and country agricultural research organisations and forums to support the development of national agricultural systems.
Performance information
Year Performance criteria Targets
2015-16 Productivity and profitability of agricultural systems
- Increased incomes and employment
- Innovative and diversified enterprise options
- Enhanced small-holder access to markets and value chains
- Improved nutritional quality and diversity of diets
- Increased productivity in agricultural systems
- Increased quality of agricultural products
Sustainability
- Improved natural resource management
- Greater resilience and diversity of production systems
- Increased ability to adapt to and mitigate climate change
- Strengthened plant and animal biosecurity
Table continued on the following page.

ACIAR Budget Statements
120
Table 2.2: Performance criteria for Outcome 1 (continued)
Capability
- Increased research capacity amongst partner countries at the individual and institutional level
- Improved evidence and capacity to support policy development
- Improved social inclusion and greater empowerment of women and girls
- Enhanced linkages between research partners
Institutional efficiency and effectiveness
- Effective strategic planning - Improved business practices - Effective stakeholder engagement
and communications - Improved knowledge management
2016-17 As per 2015-16 As per 2015-16
2017-18 and beyond
As per 2016-17 As per 2016-17
Purpose ACIAR’s purpose is to achieve more productive and sustainable agricultural systems for the benefit of developing countries and Australia through supporting international agricultural research and training partnerships.

ACIAR Budget Statements
121
Section 3: Budgeted financial statements
Section 3 presents budgeted financial statements which provide a comprehensive
snapshot of entity finances for the 2016-17 budget year, including the impact of budget
measures and resourcing on financial statements.
3.1 BUDGETED FINANCIAL STATEMENTS
3.1.1 Explanatory notes and analysis of budgeted financial statements
Departmental financial statements and schedule of administered activity
Under the Australian Government’s budgeting framework, and consistent with
Australian Accounting Standards, transactions that agencies control (departmental
transactions) are budgeted for, and reported on, separately to transactions which
agencies do not have control over (administered transactions). This ensures that
agencies are only held fully accountable for the transactions over which they have
control.
• Departmental items are those assets, liabilities, revenues and expenses in relation to
an agency or authority that are controlled by the agency. Departmental expenses
include employee and supplier expenses and other administrative costs, which are
incurred by the agency in providing its goods and services.
• Administered items are revenues, expenses, assets and liabilities that are managed
by an agency or authority on behalf of the Government according to set
Government directions. Administered expenses include subsidies, grants and
personal benefit payments and administered revenues include taxes, fees, fines and
excises.
Appropriations in the budgeting framework
Under the Australian Government’s budgeting framework, separate annual
appropriations are provided for:
• Departmental appropriations: representing the Government’s funding for agency
programs;
• Departmental capital budget appropriations: representing the Government’s
funding through additional equity for the replacement of existing agency assets as
they reach the end of their useful life;
• Departmental capital appropriations: for new investments by the Government
through additional equity; and

ACIAR Budget Statements
122
• Administered expense appropriations: for the estimated administered expenses
relating to specific programs.
Asset valuation
In accordance with current Australian accounting standards the Agency’s assets are
carried at fair value.

ACIAR Budget Statements
123
3.2.1 BUDGETED FINANCIAL STATEMENTS TABLES
Table 3.1: Comprehensive income statement (showing net cost of services) for the period ended 30 June
Table continued on the following page.
2015-16
Estimated
actual
$'000
2016-17
Budget
$'000
2017-18
Forw ard
estimate
$'000
2018-19
Forw ard
estimate
$'000
2019-20
Forw ard
estimate
$'000
EXPENSES
Employee benefits 7,682 7,843 8,000 8,160 8,323
Suppliers 3,790 3,309 3,369 3,437 3,517
Depreciation and amortisation 305 460 463 465 461
Total expenses 11,777 11,612 11,832 12,062 12,301
LESS:
OWN-SOURCE INCOME
Own-source revenue
Sale of goods and rendering of services 2,631 1,627 1,787 1,962 2,126
Total own-source revenue 2,631 1,627 1,787 1,962 2,126
Gains
Other 31 31 31 32 32
Total gains 31 31 31 32 32
Total own-source income 2,662 1,658 1,818 1,994 2,158
Net (cost of)/contribution by
services (9,115) (9,954) (10,014) (10,068) (10,143)
Revenue from Government 9,654 9,494 9,551 9,603 9,682
Surplus/(deficit) attributable to the
Australian Government539 (460) (463) (465) (461)
Total comprehensive income/(loss)
attributable to the Australian
Government 539 (460) (463) (465) (461)
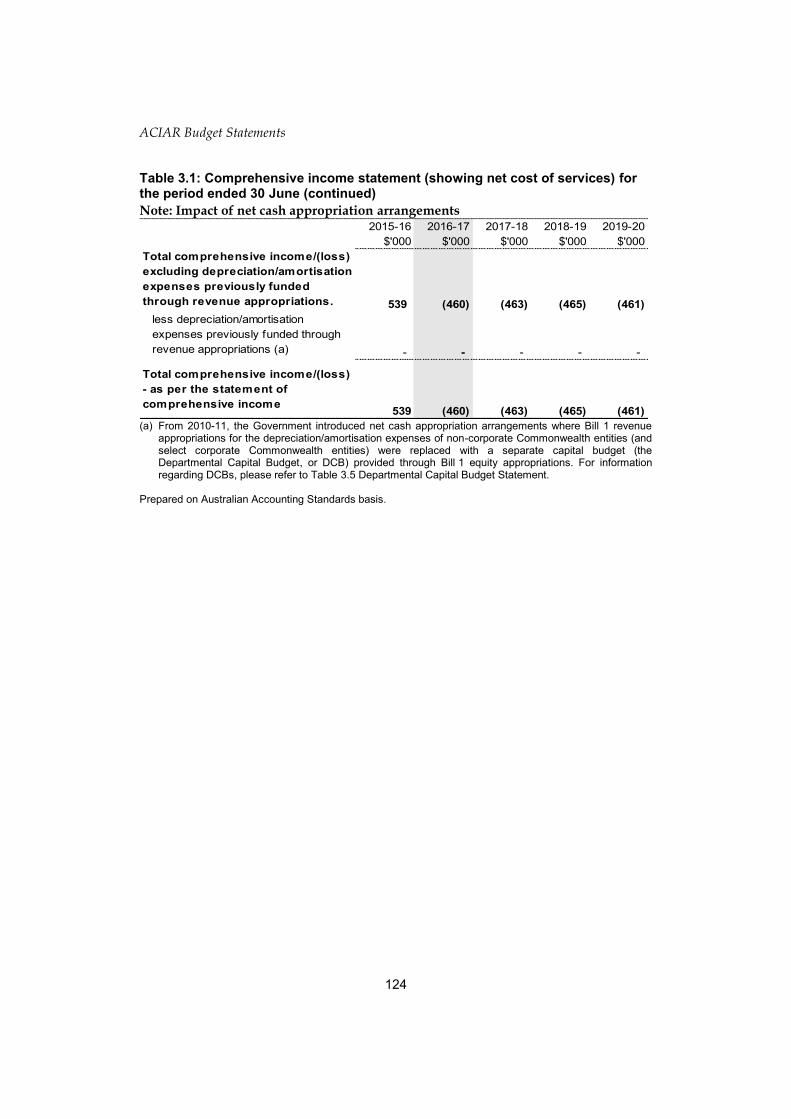
ACIAR Budget Statements
124
Table 3.1: Comprehensive income statement (showing net cost of services) for the period ended 30 June (continued)
Note: Impact of net cash appropriation arrangements
(a) From 2010-11, the Government introduced net cash appropriation arrangements where Bill 1 revenue
appropriations for the depreciation/amortisation expenses of non-corporate Commonwealth entities (and select corporate Commonwealth entities) were replaced with a separate capital budget (the Departmental Capital Budget, or DCB) provided through Bill 1 equity appropriations. For information regarding DCBs, please refer to Table 3.5 Departmental Capital Budget Statement.
Prepared on Australian Accounting Standards basis.
2015-16
$'000
2016-17
$'000
2017-18
$'000
2018-19
$'000
2019-20
$'000
Total comprehensive income/(loss)
excluding depreciation/amortisation
expenses previously funded
through revenue appropriations. 539 (460) (463) (465) (461)
less depreciation/amortisation
expenses previously funded through
revenue appropriations (a) - - - - -
Total comprehensive income/(loss)
- as per the statement of
comprehensive income539 (460) (463) (465) (461)

ACIAR Budget Statements
125
Table 3.2: Budgeted departmental balance sheet (as at 30 June)
*’Equity’ is the residual interest in assets after deduction of liabilities. Prepared on Australian Accounting Standards basis.
2015-16
Estimated
actual
$'000
2016-17
Budget
$'000
2017-18
Forw ard
estimate
$'000
2018-19
Forw ard
estimate
$'000
2019-20
Forw ard
estimate
$'000
ASSETS
Financial assets
Cash and cash equivalents 84 84 84 84 84
Trade and other receivables 3,701 3,722 3,755 3,798 3,832
Total financial assets 3,785 3,806 3,839 3,882 3,916
Non-financial assets
Land and buildings 1,295 1,161 1,079 1,056 977
Property, plant and equipment 174 245 269 236 265
Intangibles 818 668 513 356 198
Other non-financial assets 96 96 96 96 96
Total non-financial assets 2,383 2,170 1,957 1,744 1,536
Total assets 6,168 5,976 5,796 5,626 5,452
LIABILITIES
Payables
Suppliers 374 374 384 394 400
Other payables 413 373 333 293 253
Total payables 787 747 717 687 653
Provisions
Employee provisions 2,357 2,418 2,481 2,554 2,622
Total provisions 2,357 2,418 2,481 2,554 2,622
Total liabilities 3,144 3,165 3,198 3,241 3,275
Net assets 3,024 2,811 2,598 2,385 2,177
EQUITY*
Parent entity interest
Contributed equity 1,986 2,233 2,483 2,735 2,988
Reserves 112 112 112 112 112
Retained surplus (accumulated deficit) 926 466 3 (462) (923)
Total parent entity interest 3,024 2,811 2,598 2,385 2,177
Total equity 3,024 2,811 2,598 2,385 2,177

ACIAR Budget Statements
126
Table 3.3: Departmental statement of changes in equity — summary of movement (Budget year 2016-17)
Prepared on Australian Accounting Standards basis.
Retained
earnings
$'000
Asset
revaluation
reserve
$'000
Contributed
equity/
capital
$'000
Total
equity
$'000
Opening balance as at 1 July 2016
Balance carried forw ard from previous
period 926 112 1,986 3,024
Adjusted opening balance 926 112 1,986 3,024
Comprehensive income
Surplus/(deficit) for the period (460) - - (460)
Total comprehensive income (460) - - (460)
of w hich:
Attributable to the Australian
Government (460) - - (460)
Departmental capital budget (DCB) - - 247 247
Sub-total transactions with owners (460) - 247 (213)
Closing balance attributable to the
Australian Government 466 112 2,233 2,811

ACIAR Budget Statements
127
Table 3.4: Budgeted departmental statement of cash flows (for the period ended 30 June)
Prepared on Australian Accounting Standards basis.
2015-16
Estimated
actual
$'000
2016-17
Budget
$'000
2017-18
Forw ard
estimate
$'000
2018-19
Forw ard
estimate
$'000
2019-20
Forw ard
estimate
$'000
OPERATING ACTIVITIES
Cash received
Appropriations 9,631 9,473 9,518 9,560 9,648
Sale of goods and rendering of
services 2,631 1,627 1,787 1,961 2,126
Net GST received 230 230 230 230 230
Total cash received 12,492 11,330 11,535 11,751 12,004
Cash used
Employees 7,629 7,782 7,937 8,086 8,255
Suppliers 4,020 3,548 3,598 3,665 3,749
Total cash used 11,649 11,330 11,535 11,751 12,004
Net cash from/(used by)
operating activities 843 - - - -
INVESTING ACTIVITIES
Cash used
Purchase of property, plant and
equipment and intangibles 1,252 247 250 252 253
Total cash used 1,252 247 250 252 253
Net cash from/(used by)
investing activities (1,252) (247) (250) (252) (253)
FINANCING ACTIVITIES
Cash received
Contributed equity 409 247 250 252 253
Total cash received 409 247 250 252 253
Net cash from/(used by)
financing activities 409 247 250 252 253
Net increase/(decrease) in cash
held - - - - -
Cash and cash equivalents at the
beginning of the reporting period 84 84 84 84 84
Cash and cash equivalents at the
end of the reporting period 84 84 84 84 84

ACIAR Budget Statements
128
Table 3.5: Departmental capital budget statement (for the period ended 30 June)
(a) Includes both current Bill 2 and prior Act 2/4/6 appropriations and special capital appropriations. (b) Does not include annual finance lease costs. Includes purchases from current and previous years’
Departmental capital budgets (DCBs). (c) s 74 Retained revenue receipts. Prepared on Australian Accounting Standards basis.
2015-16
Estimated
actual
$'000
2016-17
Budget
$'000
2017-18
Forw ard
estimate
$'000
2018-19
Forw ard
estimate
$'000
2019-20
Forw ard
estimate
$'000
NEW CAPITAL APPROPRIATIONS
Capital budget - Bill 1 (DCB) 248 247 250 252 253
Equity injections - Bill 2 161 - - - -
Total new capital appropriations 409 247 250 252 253
Provided for:
Purchase of non-financial assets 409 247 250 252 253
Total items 409 247 250 252 253
PURCHASE OF NON-FINANCIAL ASSETS
Funded by capital appropriations (a) 161 - - - -
Funded by capital appropriation - DCB (b) 248 247 250 252 253
Funded internally from departmental
resources (c) 843 - - - -
TOTAL 1,252 247 250 252 253
RECONCILIATION OF CASH USED TO
ACQUIRE ASSETS TO ASSET
MOVEMENT TABLE
Total purchases 1,252 247 250 252 253
Total cash used to acquire assets 1,252 247 250 252 253

ACIAR Budget Statements
129
Table 3.6: Statement of asset movements (Budget year 2016-17)
(a) ‘Appropriation ordinary annual services’ refers to funding provided through Appropriation Bill (No. 1)
2015-16 for depreciation/amortisation expenses, DCBs or other operational expenses. Prepared on Australian Accounting Standards basis.
Buildings
$'000
Other property,
plant and
equipment
$'000
Computer
software and
intangibles
$'000
Total
$'000
As a t 1 July 2 0 16
Gross book value 1,421 439 1,482 3,342
Accumulated depreciation/
amortisation and impairment (126) (265) (664) (1,055)
Ope ning ne t book ba la nc e 1,295 174 818 2,287
Ca pita l a sse t a dditions
Estima te d e xpe nditure on ne w
or re pla c e me nt a sse ts
By purchase - appropriation ordinary
annual services (a) - 197 50 247
Tota l a dditions - 197 50 247
Othe r move me nts
Depreciation/amortisation expense (134) (126) (200) (460)
Tota l othe r move me nts (134) (126) (200) (460)
As a t 3 0 June 2 0 17
Gross book value 1,421 636 1,532 3,589
Accumulated depreciation/
amortisation and impairment (260) (391) (864) (1,515)
Closing ne t book ba la nc e 1,161 245 668 2,074

ACIAR Budget Statements
130
Table 3.7: Schedule of budgeted income and expenses administered on behalf of Government (for the period ended 30 June)
Prepared on Australian Accounting Standards basis.
2015-16
Estimated
actual
$'000
2016-17
Budget
$'000
2017-18
Forw ard
estimate
$'000
2018-19
Forw ard
estimate
$'000
2019-20
Forw ard
estimate
$'000
EXPENSES
Employee benefits 221 299 305 311 317
Suppliers 102,888 117,704 113,840 114,029 117,449
Total expenses administered on
behalf of Government 103,109 118,003 114,145 114,340 117,766
LESS:
OWN-SOURCE INCOME
Own-source revenue
Non-taxation revenue
Sale of goods and rendering of
services 13,505 15,539 16,277 17,051 17,485
Total non-taxation revenue 13,505 15,539 16,277 17,051 17,485
Total own-source revenue
administered on behalf of
Government 13,505 15,539 16,277 17,051 17,485
Total own-sourced income
administered on behalf of
Government 13,505 15,539 16,277 17,051 17,485
Net cost of/(contribution by) services 89,604 102,464 97,868 97,289 100,281
Total comprehensive income/(loss) 89,604 102,464 97,868 97,289 100,281

ACIAR Budget Statements
131
Table 3.8: Schedule of budgeted assets and liabilities administered on behalf of Government (as at 30 June)
Prepared on Australian Accounting Standards basis.
2015-16
Estimated
actual
$'000
2016-17
Budget
$'000
2017-18
Forw ard
estimate
$'000
2018-19
Forw ard
estimate
$'000
2019-20
Forw ard
estimate
$'000
ASSETS
Financial assets
Cash and cash equivalents 19,877 11,406 9,318 9,532 8,607
Taxation receivables 699 699 699 699 699
Total financial assets 20,576 12,105 10,017 10,231 9,306
Total assets administered on
behalf of Government 20,576 12,105 10,017 10,231 9,306
LIABILITIES
Payables
Suppliers 2,950 2,960 3,000 3,100 3,200
Other payables 638 638 638 638 638
Total payables 3,588 3,598 3,638 3,738 3,838
Provisions
Employee provisions 32 32 32 32 32
Total provisions 32 32 32 32 32
Total liabilities administered on
behalf of Government 3,620 3,630 3,670 3,770 3,870
Net assets/(liabilities) 16,956 8,475 6,347 6,461 5,436

ACIAR Budget Statements
132
Table 3.9: Schedule of budgeted administered cash flows (for the period ended 30 June)
Prepared on Australian Accounting Standards basis.
2015-16
Estimated
actual
$'000
2016-17
Budget
$'000
2017-18
Forw ard
estimate
$'000
2018-19
Forw ard
estimate
$'000
2019-20
Forw ard
estimate
$'000
OPERATING ACTIVITIES
Cash received
Net GST received 5,000 5,000 5,000 5,000 5,000
Other 13,505 15,539 16,277 17,051 17,485
Total cash received 18,505 20,539 21,277 22,051 22,485
Cash used
Suppliers 102,894 117,694 113,800 113,929 117,349
Employees 221 299 305 311 317
Total cash used 103,115 117,993 114,105 114,240 117,666
Net cash from/(used by) operating
activities (84,610) (97,454) (92,828) (92,189) (95,181)
Net increase/(decrease) in cash
held (84,610) (97,454) (92,828) (92,189) (95,181)
Cash and cash equivalents at
beginning of reporting period 27,852 19,877 11,406 9,318 9,532
Cash from Official Public Account for:
- Appropriations 81,635 93,983 95,740 97,403 99,256
Total cash from Official Public
Account 81,635 93,983 95,740 97,403 99,256
Cash to Official Public Account for:
- Appropriations (5,000) (5,000) (5,000) (5,000) (5,000)
Total cash to Official Public Account (5,000) (5,000) (5,000) (5,000) (5,000)
Cash and cash equivalents at end
of reporting period 19,877 11,406 9,318 9,532 8,607

133
Au
strade B
ud
get S
tatemen
ts


135
Au
strade B
ud
get S
tatemen
ts
Australian Secret Intelligence Service (ASIS)
Entity resources and planned performance


137
Au
strade B
ud
get S
tatemen
ts
AUSTRALIAN SECRET INTELLIGENCE SERVICE (ASIS)
Section 1: Entity overview and resources .............................................................. 138
1.1 Strategic direction statement ........................................................................ 138
1.2 Entity resource statement ............................................................................. 139
Section 2: Outcomes and planned performance ................................................... 140
2.1 Budgeted expenses and performance for Outcome 1 .................................. 141
Section 3: Budgeted financial statements .............................................................. 143
3.2.1 Budgeted financial statements tables ........................................................... 144

ASIS Budget Statements
138
Au
strade B
ud
get S
tatemen
ts
AUSTRALIAN SECRET INTELLIGENCE SERVICE (ASIS)
Section 1: Entity overview and resources
1.1 STRATEGIC DIRECTION STATEMENT
In 2016-17 the Australian Secret Intelligence Service (ASIS) will continue to enhance
Government understanding of the overseas environment affecting Australia’s vital
interests. ASIS will take appropriate action, consistent with applicable legislation, to
protect and promote Australia’s vital interests through the provision of unique foreign
intelligence services as directed by the Government.
The primary functions of ASIS are:
(a) to obtain, in accordance with the Government’s requirements, intelligence about
the capabilities, intentions or activities of people or organisations outside
Australia;
(b) to communicate, in accordance with the Government’s requirements, such
intelligence;
(c) to provide assistance to the Defence Force in support of military operations and
to co-operate with the Defence Force on intelligence matters;
(d) to conduct counter-intelligence activities;
(e) to liaise with intelligence or security services, or other authorities, of other
countries;
(f) to co-operate with and assist ASD, AGO, ASIO and other Commonwealth and
State authorities in the performance of their functions; and
(g) to undertake such other activities as the responsible Minister directs relating to
the capabilities, intentions or activities of people or organisations outside
Australia.
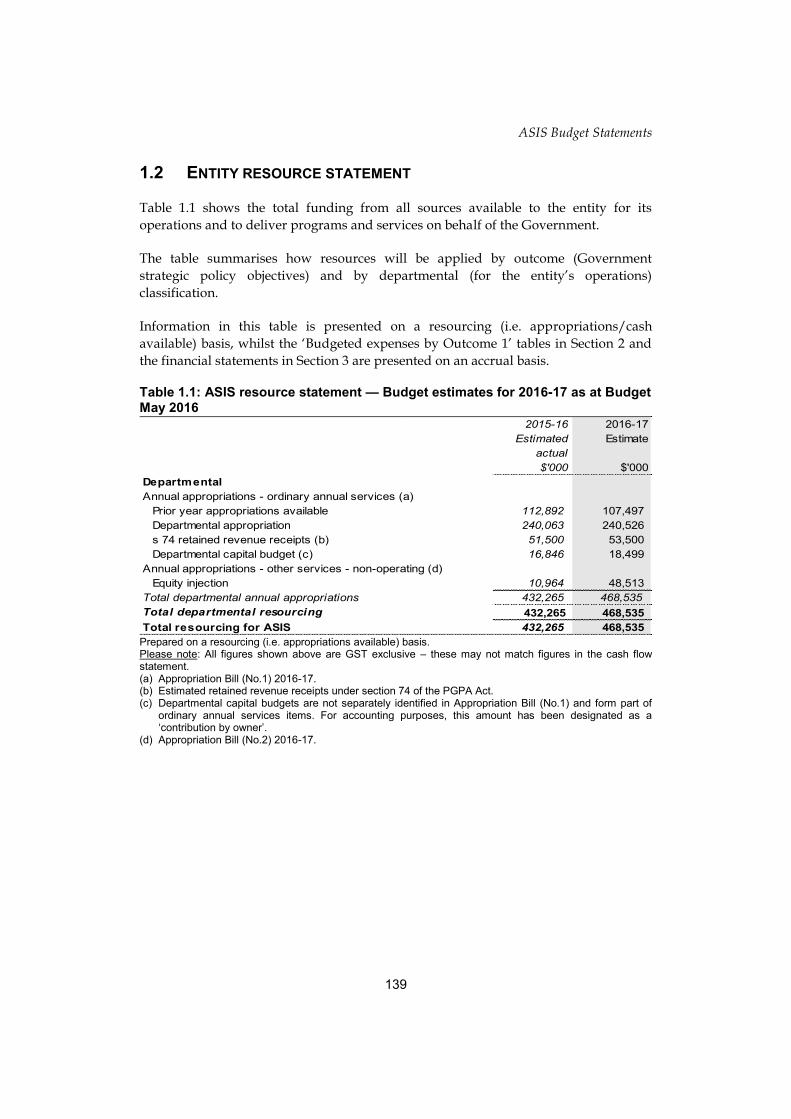
ASIS Budget Statements
139
1.2 ENTITY RESOURCE STATEMENT
Table 1.1 shows the total funding from all sources available to the entity for its
operations and to deliver programs and services on behalf of the Government.
The table summarises how resources will be applied by outcome (Government
strategic policy objectives) and by departmental (for the entity’s operations)
classification.
Information in this table is presented on a resourcing (i.e. appropriations/cash
available) basis, whilst the ‘Budgeted expenses by Outcome 1’ tables in Section 2 and
the financial statements in Section 3 are presented on an accrual basis.
Table 1.1: ASIS resource statement — Budget estimates for 2016-17 as at Budget May 2016
Prepared on a resourcing (i.e. appropriations available) basis. Please note: All figures shown above are GST exclusive – these may not match figures in the cash flow statement. (a) Appropriation Bill (No.1) 2016-17. (b) Estimated retained revenue receipts under section 74 of the PGPA Act. (c) Departmental capital budgets are not separately identified in Appropriation Bill (No.1) and form part of
ordinary annual services items. For accounting purposes, this amount has been designated as a ‘contribution by owner’.
(d) Appropriation Bill (No.2) 2016-17.
2015-16
Estimated
actual
$'000
2016-17
Estimate
$'000
Departmental
Annual appropriations - ordinary annual services (a)
Prior year appropriations available 112,892 107,497
Departmental appropriation 240,063 240,526
s 74 retained revenue receipts (b) 51,500 53,500
Departmental capital budget (c) 16,846 18,499
Annual appropriations - other services - non-operating (d)
Equity injection 10,964 48,513
Total departmental annual appropriations 432,265 468,535
Total departmental resourcing 432,265 468,535
Total resourcing for ASIS 432,265 468,535

ASIS Budget Statements
140
SECTION 2: OUTCOMES AND PLANNED PERFORMANCE
Government outcomes are the intended results, impacts or consequences of actions by
the Government on the Australian community. Commonwealth programs are the
primary vehicle by which Government entities achieve the intended results of their
outcome statements. Entities are required to identify the programs which contribute to
Government outcomes over the Budget and forward years.
Each outcome is described below together with its related programs. The following
provides detailed information on expenses for each outcome and program, further
broken down by funding source.

ASIS Budget Statements
141
2.1 BUDGETED EXPENSES AND PERFORMANCE FOR OUTCOME 1
Outcome 1: Enhanced understanding for the Government of the overseas environment affecting Australia’s interests through the provision of covert intelligence services about the capabilities, intentions or activities of people or organisations outside Australia.
Budgeted expenses for Outcome 1
This table shows how much ASIS intends to spend (on an accrual basis) on achieving
the outcome, broken down by program, as well as by Departmental funding sources.
Table 2.1.1: Budgeted expenses for Outcome 1
Table continued on following page.
2015-16
Estimated
actual
$'000
2016-17
Budget
$'000
2017-18
Forw ard
estimate
$'000
2018-19
Forw ard
estimate
$'000
2019-20
Forw ard
estimate
$'000
Departmental expenses
Departmental appropriation 180,047 180,395 186,764 191,074 193,179
s 74 Retained revenue receipts (a) 38,625 40,125 40,875 41,625 42,375
Expenses not requiring appropriation
in the Budget year (b)15,472 17,945 26,161 30,259 31,622
Departmental total 234,144 238,465 253,800 262,958 267,176
Total expenses for
program 1.1234,144 238,465 253,800 262,958 267,176
Outcome 1: Enhanced understanding for the Government of the overseas environment
affecting Australia’s interests through the provision of covert intelligence services about
the capabilities, intentions or activities of people or organisations outside Australia.
Program 1.1: Secret Intelligence

ASIS Budget Statements
142
Table 2.1.1: Budgeted expenses for Outcome 1 (continued)
(a) Estimated expenses incurred in relation to receipts retained under section 74 of the PGPA Act. (b) Expenses not requiring appropriation in the Budget year are made up of depreciation expenses. Note: Departmental appropriation splits and totals are indicative estimates and may change in the course of the budget year as Government priorities change.
2015-16
Estimated
actual
$'000
2016-17
Budget
$'000
2017-18
Forw ard
estimate
$'000
2018-19
Forw ard
estimate
$'000
2019-20
Forw ard
estimate
$'000
Departmental expenses
Departmental appropriation 60,016 60,131 62,255 63,692 64,393
s 74 Retained revenue receipts (a) 12,875 13,375 13,625 13,875 14,125
Expenses not requiring appropriation
in the Budget year (b)5,157 5,982 8,720 10,086 10,541
Departmental total 78,048 79,488 84,600 87,653 89,059
Total expenses for
program 1.278,048 79,488 84,600 87,653 89,059
Departmental expenses
Departmental appropriation 240,063 240,526 249,019 254,766 257,572
s 74 Retained revenue receipts (a) 51,500 53,500 54,500 55,500 56,500
Expenses not requiring appropriation
in the Budget year (b)20,629 23,927 34,881 40,345 42,163
Departmental total 312,192 317,953 338,400 350,611 356,235
Total expenses for Outcome 1 312,192 317,953 338,400 350,611 356,235
Program 1.2: Other Services
Outcome 1 Totals by appropriation type

ASIS Budget Statements
143
Section 3: Budgeted financial statements
Section 3 presents budgeted financial statements which provide a comprehensive
snapshot of ASIS’ finances for the 2016-17 budget year, including the impact of budget
measures and resourcing on financial statements.
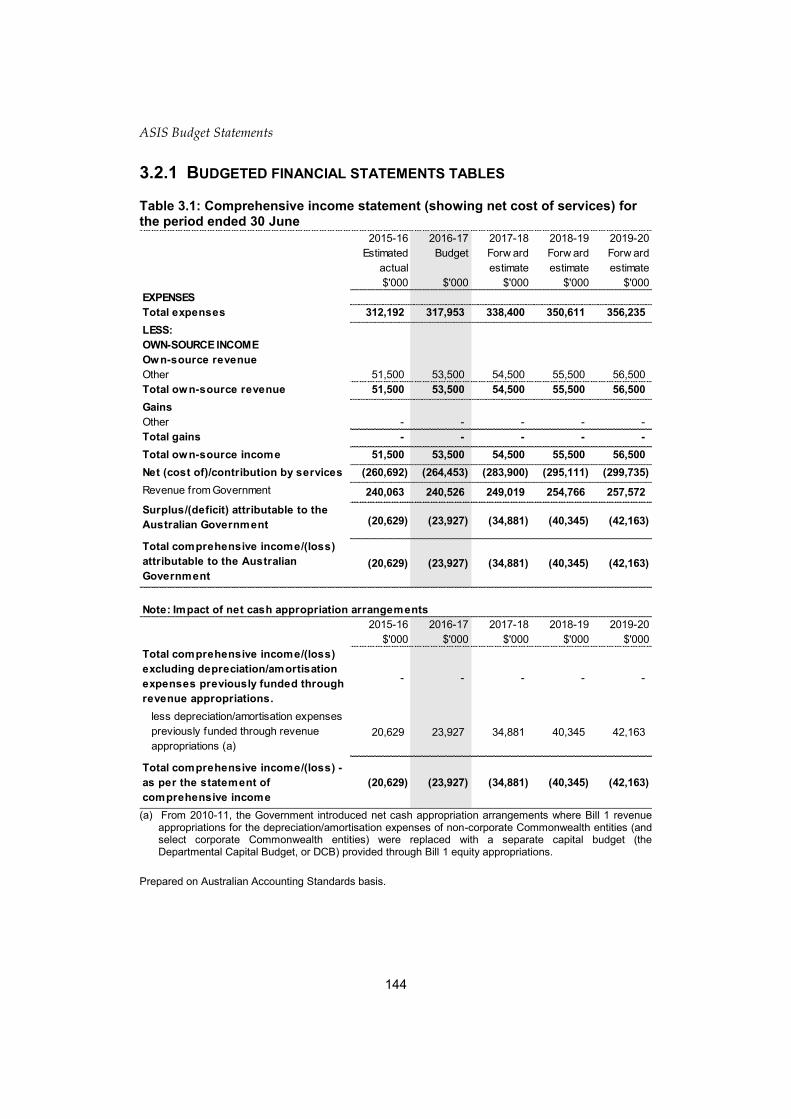
ASIS Budget Statements
144
3.2.1 BUDGETED FINANCIAL STATEMENTS TABLES
Table 3.1: Comprehensive income statement (showing net cost of services) for the period ended 30 June
(a) From 2010-11, the Government introduced net cash appropriation arrangements where Bill 1 revenue
appropriations for the depreciation/amortisation expenses of non-corporate Commonwealth entities (and select corporate Commonwealth entities) were replaced with a separate capital budget (the Departmental Capital Budget, or DCB) provided through Bill 1 equity appropriations.
Prepared on Australian Accounting Standards basis.
2015-16
Estimated
actual
$'000
2016-17
Budget
$'000
2017-18
Forw ard
estimate
$'000
2018-19
Forw ard
estimate
$'000
2019-20
Forw ard
estimate
$'000
EXPENSES
Total expenses 312,192 317,953 338,400 350,611 356,235
LESS:
OWN-SOURCE INCOME
Own-source revenue
Other 51,500 53,500 54,500 55,500 56,500
Total own-source revenue 51,500 53,500 54,500 55,500 56,500
Gains
Other - - - - -
Total gains - - - - -
Total own-source income 51,500 53,500 54,500 55,500 56,500
Net (cost of)/contribution by services (260,692) (264,453) (283,900) (295,111) (299,735)
Revenue from Government 240,063 240,526 249,019 254,766 257,572
Surplus/(deficit) attributable to the
Australian Government (20,629) (23,927) (34,881) (40,345) (42,163)
Total comprehensive income/(loss)
attributable to the Australian
Government
(20,629) (23,927) (34,881) (40,345) (42,163)
Note: Impact of net cash appropriation arrangements
2015-16
$'000
2016-17
$'000
2017-18
$'000
2018-19
$'000
2019-20
$'000
Total comprehensive income/(loss)
excluding depreciation/amortisation
expenses previously funded through
revenue appropriations.
- - - - -
less depreciation/amortisation expenses
previously funded through revenue
appropriations (a)
20,629 23,927 34,881 40,345 42,163
Total comprehensive income/(loss) -
as per the statement of
comprehensive income
(20,629) (23,927) (34,881) (40,345) (42,163)
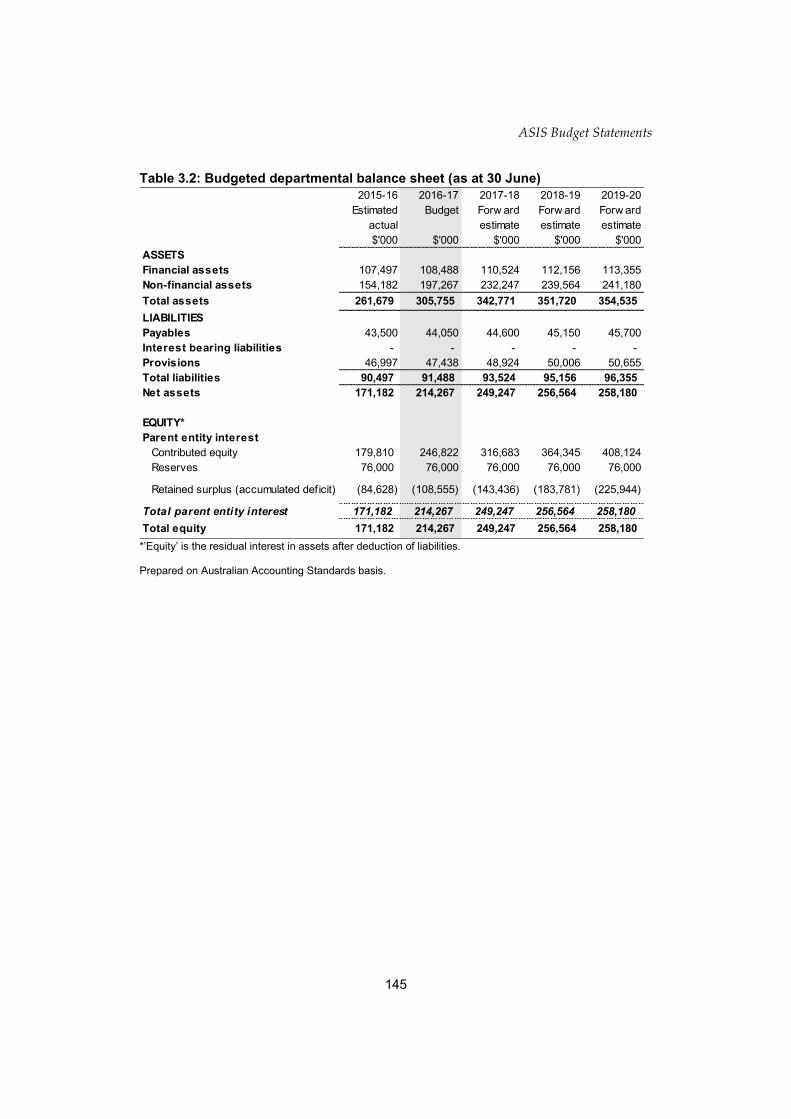
ASIS Budget Statements
145
Table 3.2: Budgeted departmental balance sheet (as at 30 June)
*’Equity’ is the residual interest in assets after deduction of liabilities. Prepared on Australian Accounting Standards basis.
2015-16
Estimated
actual
$'000
2016-17
Budget
$'000
2017-18
Forw ard
estimate
$'000
2018-19
Forw ard
estimate
$'000
2019-20
Forw ard
estimate
$'000
ASSETS
Financial assets 107,497 108,488 110,524 112,156 113,355
Non-financial assets 154,182 197,267 232,247 239,564 241,180
Total assets 261,679 305,755 342,771 351,720 354,535
LIABILITIES
Payables 43,500 44,050 44,600 45,150 45,700
Interest bearing liabilities - - - - -
Provisions 46,997 47,438 48,924 50,006 50,655
Total liabilities 90,497 91,488 93,524 95,156 96,355
Net assets 171,182 214,267 249,247 256,564 258,180
EQUITY*
Parent entity interest
Contributed equity 179,810 246,822 316,683 364,345 408,124
Reserves 76,000 76,000 76,000 76,000 76,000
Retained surplus (accumulated deficit) (84,628) (108,555) (143,436) (183,781) (225,944)
Total parent entity interest 171,182 214,267 249,247 256,564 258,180
Total equity 171,182 214,267 249,247 256,564 258,180
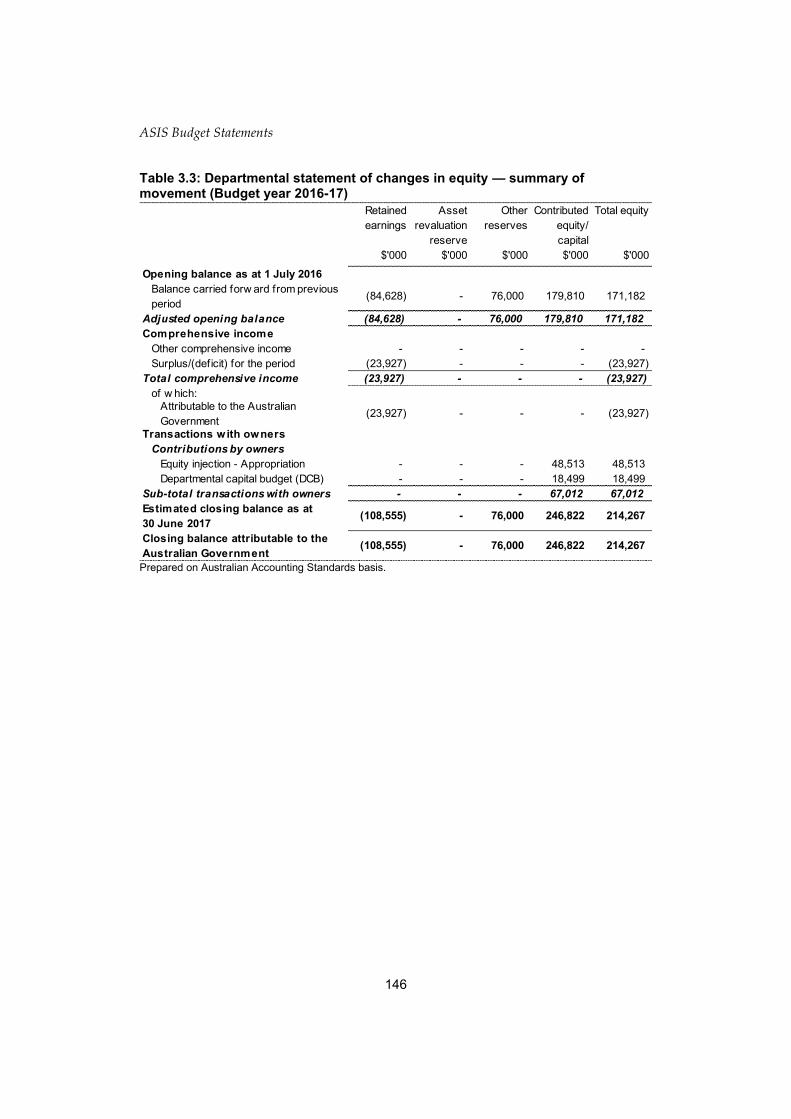
ASIS Budget Statements
146
Table 3.3: Departmental statement of changes in equity — summary of movement (Budget year 2016-17)
Prepared on Australian Accounting Standards basis.
Retained
earnings
$'000
Asset
revaluation
reserve
$'000
Other
reserves
$'000
Contributed
equity/
capital
$'000
Total equity
$'000
Opening balance as at 1 July 2016
Balance carried forw ard from previous
period(84,628) - 76,000 179,810 171,182
Adjusted opening balance (84,628) - 76,000 179,810 171,182
Comprehensive income
Other comprehensive income - - - - -
Surplus/(deficit) for the period (23,927) - - - (23,927)
Total comprehensive income (23,927) - - - (23,927)
of w hich:
Attributable to the Australian
Government(23,927) - - - (23,927)
Transactions with owners
Contributions by owners
Equity injection - Appropriation - - - 48,513 48,513
Departmental capital budget (DCB) - - - 18,499 18,499
Sub-total transactions with owners - - - 67,012 67,012
Estimated closing balance as at
30 June 2017(108,555) - 76,000 246,822 214,267
Closing balance attributable to the
Australian Government(108,555) - 76,000 246,822 214,267

ASIS Budget Statements
147
Table 3.4: Budgeted departmental statement of cash flows (for the period ended 30 June)
Prepared on Australian Accounting Standards basis.
2015-16
Estimated
actual
$'000
2016-17
Budget
$'000
2017-18
Forw ard
estimate
$'000
2018-19
Forw ard
estimate
$'000
2019-20
Forw ard
estimate
$'000
OPERATING ACTIVITIES
Cash received
Appropriations 245,566 239,535 246,982 253,134 256,374
Other 51,500 53,500 54,500 55,500 56,500
Total cash received 297,066 293,035 301,482 308,634 312,874
Cash used
Other 297,066 293,035 301,482 308,634 312,874
Total cash used 297,066 293,035 301,482 308,634 312,874
Net cash from/(used by) operating
activities- - - - -
INVESTING ACTIVITIES
Cash received
Other - - - - -
Total cash received - - - - -
Cash used
Other 27,810 67,012 69,861 47,661 43,779
Total cash used 27,810 67,012 69,861 47,661 43,779
Net cash from/(used by) investing
activities(27,810) (67,012) (69,861) (47,661) (43,779)
FINANCING ACTIVITIES
Cash received
Other 27,810 67,012 69,861 47,661 43,779
Total cash received 27,810 67,012 69,861 47,661 43,779
Cash used
Other - - - - -
Total cash used - - - - -
Net cash from/(used by) financing
activities27,810 67,012 69,861 47,661 43,779
Net increase/(decrease) in cash
held- - - - -
Cash and cash equivalents at the
beginning of the reporting period25,000 25,000 25,000 25,000 25,000
Cash and cash equivalents at the
end of the reporting period25,000 25,000 25,000 25,000 25,000


149
Au
strade B
ud
get S
tatemen
ts
Tourism Australia
Entity resources and planned performance


151
Au
strade B
ud
get S
tatemen
ts
TOURISM AUSTRALIA
Section 1: Entity overview and resources .............................................................. 153
1.1 Strategic direction statement ........................................................................ 153
1.2 Entity resource statement ............................................................................. 155
Section 2: Outcomes and planned performance ................................................... 158
2.1 Budgeted expenses and performance for Outcome 1 .................................. 159
Section 3: Budgeted financial statements .............................................................. 166
3.1 Budgeted financial statements...................................................................... 166
3.2.1 Budgeted financial statements tables ........................................................... 167


Tourism Australia Budget Statements
153
TOURISM AUSTRALIA
Section 1: Entity overview and resources
1.1 STRATEGIC DIRECTION STATEMENT
Purpose and outcome
Tourism Australia is Australia’s national tourism marketing organisation that promotes Australia internationally as a compelling tourism destination for leisure and business events. The outcome of our activities is to grow demand and foster a competitive and sustainable Australian tourism industry through partnership marketing activities that target global consumers in key markets.
Industry outlook
Shifts impacting Australian tourism have been explored and addressed in the development of Tourism Australia’s strategies.
SHIFTS IMPACTING AUSTRALIAN TOURISM
GLOBAL
ECONOMY
Increasing competitiveness of global tourism as countries identify
tourism as a source of economic growth
Increasing middle class in Asia, and compressed maturation cycle
in new Asian markets
MEDIA
LANDSCAPE
Globalisation of media agencies as agency networks consolidate
Increasing use of performance advertising to target consumers
Increasingly costly mass media markets, challenging ability to cut
through
CONSUMER
BEHAVIOUR
Increasing use of mobile technology
Democratisation of insider information – increased access to
unfiltered consumer messaging
Rising demand for experiential travel with increasing demand for
personalisation
TRAVEL
INDUSTRY
COMPOSITION
Rise of the sharing economy
Rise of online travel agencies
Changing configuration of global airlines – continued low cost carrier
expansion
Tourism 2020
Tourism 2020 is a whole-of-government and industry long-term strategy to build the resilience and competitiveness of Australia’s tourism industry and grow its economic contribution to Australia’s economy. It focuses on improving the industry’s global performance and competitiveness by pursuing the strongest opportunities for growth and addressing supply-side factors.

Tourism Australia Budget Statements
154
Tourism Australia works with industry and all levels of the Government across Australia to maximise the economic contribution of Australian tourism. The industry has set a goal to increase overnight tourism expenditure from $70 billion in 2009 to more than $115 billion in 2020.
Strategies
Customer strategy: Two target customers will continue to be at the heart of Tourism Australia’s marketing – the leisure traveller and the business events traveller. Our leisure target customers are predisposed to travel to Australia for a holiday and are likely to spend more, do more and disperse more widely beyond capital city gateways. Tourism Australia’s business events target customers in two sectors – association congresses and incentive events.
Market portfolio framework: Tourism Australia invests the majority of its effort and resources in a portfolio of priority markets which reflects growth potential, market maturity and Australia’s competitive position. Markets fall into one of four categories with activity aimed at maximising the opportunity in each market.
MARKET PORTFOLIO FRAMEWORK
CATEGORIES Build access and distribution
Full build Partnership-led conversion
Maintain access and distribution
STRATEGIC
OBJECTIVE
Focus on establishing access and distribution in early stage of activity
Continued focus on distribution supported by broad marketing, including with partners
Capitalise on established distribution, through integrated partnership marketing
Ongoing distribution and partnership focus in mature markets
COUNTRIES Indonesia China USA India
Hong Kong Singapore Malaysia UK Japan South Korea
Germany France Italy
Marketing strategy: This will be delivered through integrated global campaigns under the campaign umbrella There’s nothing like Australia. Messaging will focus on the most important reasons for travel, including world class beauty and natural environments, food and wine and aquatic and coastal experiences. Competitive positioning will be strengthened by a range of support activities that promote Indigenous tourism, youth and premium tourism experiences. Marketing campaigns will be delivered through social media, content, our websites (Australia.com and Australia.cn), targeted global media buying and personalisation, taking advantage of changing consumer travel buying behaviours.

Tourism Australia Budget Statements
155
Business Events strategy: Through its specialist unit, Business Events Australia (BEA), Tourism Australia delivers partnership marketing and trade programs that target key decision-makers in the international incentives and associations sectors. BEA works in partnership with the Australian business events industry to drive awareness, intention and conversion of business via specific initiatives for each sector.
Distribution development strategy: Our distribution efforts drive increased conversion from intention to visitation, ensuring the target customer has the right information and can easily access and book quality Australian tourism products. This will be achieved by increasing the presence of Australian tourism experiences in the programs of international distributors, educating frontline sellers on how to best sell Australian tourism experiences and connecting buyers of Australian tourism product with sellers through trade events both in Australia and overseas.
Partnership strategy: Tourism Australia actively collaborates with industry and government partners. It secures commercial partnerships to extend its ability to target customers and facilitates their ability to buy Australian tourism product. Tourism Australia partners with state and territory tourism organisations (STOs) across a number of ‘one voice’ initiatives including global marketing campaigns, through the Aussie Specialist Program, supporting international media hosting and broadcast opportunities, trade events both in Australia and offshore and through a recently developed collaboration on consumer research.
Enabling Strategy: Tourism Australia’s activity is underpinned by a committed workforce and high performing culture, government collaboration, industry engagement and effective systems and processes that support delivery of robust corporate governance.
1.2 ENTITY RESOURCE STATEMENT
Table 1.1 shows the total funding from all sources available to the entity for its
operations and to deliver programs and services on behalf of the Government.
The table summarises how resources will be applied by outcome (Government
strategic policy objectives) and by administered (on behalf of the Government or the
public) and departmental (for the entity’s operations) classification.
For more detailed information on special accounts and special appropriations, please
refer to Budget Paper No. 4 – Agency Resourcing.
Information in this table is presented on a resourcing (i.e. appropriations/cash
available) basis, whilst the ‘Budgeted expenses by Outcome 1’ tables in Section 2 and
the financial statements in Section 3 are presented on an accrual basis.

Tourism Australia Budget Statements
156
Table 1.1: Tourism Australia resource statement — Budget estimates for 2016-17 as at Budget May 2016
Prepared on a resourcing (i.e. appropriations available) basis.
Please note: All figures shown above are GST exclusive - these may not match figures in the cash flow statement.
(a) Appropriation Bill (No. 1) 2016-17
(b) Asia Marketing Fund
2015-16
estimated
actual
$'000
2016-17
estimate
$'000
Opening balance/cash reserves at 1 July - -
Funds from Government
Annual appropriations - ordinary annual services (a)
Outcome 1 - Grow demand and foster a competitive and
sustainable Australian tourism industry through partnership
marketing to targeted global consumers in key markets. 144,018 140,266
Total annual appropriations 144,018 140,266
Amounts received from related entities
Amounts from portfolio department (b) 14,000 14,000
Total amounts received from related entities 14,000 14,000
Total funds from Government 158,018 154,266
Funds from industry sources
Other 16,574 20,974
Total funds from industry sources 16,574 20,974
Funds from other sources
Interest 1,100 1,100
Total funds from other sources 1,100 1,100
Total net resourcing for Tourism Australia 175,692 176,340
2015-16 2016-17
Average staffing level (number) 207 207

Tourism Australia Budget Statements
157
1.3 Budget measures
There are no budget measures in Part 1 relating to Tourism Australia.

Tourism Australia Budget Statements
158
Section 2: Outcomes and planned performance
Government outcomes are the intended results, impacts or consequences of actions by
the Government on the Australian community. Commonwealth programs are the
primary vehicle by which Government entities achieve the intended results of their
outcome statements. Entities are required to identify the programs which contribute to
Government outcomes over the Budget and forward years.
Each outcome is described below together with its related programs. The following
provides detailed information on expenses for each outcome and program, further
broken down by funding source.
Note:
From 1 July 2015, performance reporting requirements in the Portfolio Budget
Statements sit alongside those required under the enhanced commonwealth
performance framework. It is anticipated that the performance criteria described in
Portfolio Budget Statements will be read with broader information provided in an
entity’s corporate plans and annual performance statements – included in Annual
Reports from October 2016 – to provide an entity’s complete performance story.

Tourism Australia Budget Statements
159
2.1 BUDGETED EXPENSES AND PERFORMANCE FOR OUTCOME 1
Outcome 1:
Grow demand and foster a competitive and sustainable Australian tourism industry through partnership marketing to targeted global consumers in key markets
Linked programs
Department of Foreign Affairs and Trade (DFAT)
Programs
Program 1.8 – Programs to promote Australia’s International Tourism Interests
Contribution to Tourism Australia’s Outcome 1 made by linked programs
This program provides funding to Tourism Australia to deliver Outcome 1.
Austrade
Programs
Program 1.2 – Programs to promote Australia’s export and other international economic interests
Contribution to Tourism Australia’s Outcome 1 made by linked programs
Austrade provides research and policy support to Tourism Australia’s activities of promoting the export of Australian tourism services. These exports contribute to Australia’s prosperity.
Department of Immigration and Border Protection (DIBP)
Programs
Program 3.2 – Trade Facilitation and Industry Engagement
Contribution to Tourism Australia’s Outcome 1 made by linked programs
Tourism Australia works with the DIBP by providing advice on visa and traveller facilitation policy relevant to the Australian tourism industry.
Table continued on following page.

Tourism Australia Budget Statements
160
Linked programs (continued)
Department of Infrastructure and Regional Development
Programs
Program 2.4 – Air Transport
An efficient, sustainable, competitive, safe and secure air transport system contributes to increasing international visitor arrivals and expenditure, and growing demand for Australia as a destination for tourism and business events.
Programs
Program 3.1 – Regional development
Contribution to Tourism Australia’s Outcome 1 made by linked programs
Tourism Australia works in partnership with State and Territory Governments, industry and commercial partners to build demand and increase visitor arrivals and spend in Australia and encouraging international visitor to disperse beyond our gateway cities into regional areas.

Tourism Australia Budget Statements
161
Budgeted expenses for Outcome 1
This table shows how much the entity intends to spend (on an accrual basis) on
achieving the outcome, broken down by program, as well as by Administered and
Departmental funding sources.
Tourism Australia has one program and one outcome with Departmental funding
sources only.
Table 2.1.1: Budgeted expenses for Outcome 1
Note: Departmental appropriation splits and totals are indicative estimates and may change in the course of the budget year as Government priorities change.
2015-16
Estimated
actual
$'000
2016-17
Budget
$'000
2017-18
Forw ard
estimate
$'000
2018-19
Forw ard
estimate
$'000
2019-20
Forw ard
estimate
$'000
Revenue from Government
Ordinary annual services (Appropriation
Bill No. 1)144,018 140,266 141,291 144,417 147,462
Payment from related entities 14,000 14,000 14,000 14,000 14,000
Revenues from industry sources 16,574 20,974 20,974 20,974 20,974
Revenues from other independent sources 1,100 1,100 1,100 1,100 1,100
Total expenses for Outcome 1 and
Program 1.1175,692 176,340 177,365 180,491 183,536
Average staffing level (number) 2015-16 2016-17
207 207
Outcome 1 totals by resource type
Program 1.1: Supporting Outcome 1
Outcome 1 and Program 1.1 totals by resource type

Tourism Australia Budget Statements
162
Table 2.1.2: Program components of Outcome 1
Program component 1.1.1: Grow demand
Program component 1.1.2: Industry development
2015-16
Estimated
actual
$'000
2016-17
Budget
$'000
2017-18
Forward
estimate
$'000
2018-19
Forward
estimate
$'000
2019-20
Forward
estimate
$'000
Annual departmental expenses:
Program Support 153,724 154,291 155,188 157,923 160,587
Total component 1 expenses 153,724 154,291 155,188 157,923 160,587
Annual departmental expenses:
Program Support 21,968 22,049 22,177 22,568 22,949
Total component 2 expenses 21,968 22,049 22,177 22,568 22,949
Total program expenses 175,692 176,340 177,365 180,491 183,536
1.1.1 - Component 1 (Grow demand)
1.1.2 - Component 2: (Industry development)
Program 1.1: Supporting Outcome 1

Tourism Australia Budget Statements
163
Table 2.1.3: Performance criteria for Outcome 1
Table 2.1.3 below details the performance criteria for each program associated with
Outcome 1. It also summarises how each program is delivered and where 2016-17
Budget measures have created new programs or materially changed existing
programs.
Outcome 1 – Grow demand and foster a competitive and sustainable Australian tourism industry through partnership marketing to targeted global consumers in key markets
Program component 1.1.1 – Grow demand
Objective: Identify and target best prospect consumers, inspire them to travel to Australia. To focus activities
and resources, utilise a dedicated market categorisation approach.
Delivery Target groups
The leisure traveller in key international markets: • Consumer research to build knowledge about what motivates the target customer when
choosing a travel destination • Campaigns in partnership with commercial partners, state and territory tourism
organisations and convention and visitor bureaux • Marketing activities to stimulate target customers, including brand advertising and
promotions, broadcasts, public relations, international media hosting program, content development and social media
• Work in partnership with Government and industry to align efforts and activities increasing Australia’s collective share of voice in global marketplace to achieve efficiency and effectiveness
Business events travellers in key international markets: • Consumer research to build knowledge of the needs of corporate and association
decision makers when choosing a destination for meetings, associations and incentives, and to understand the needs and decision patterns of individual delegates.
• Deliver program of activities to promote Australia as a business events destination, including trade events, buyer and agent familiarisation visits, direct marketing and public relations.
Performance information
Year Performance criteria Targets
2015-16 Tourism 2020 Goal: Overnight Tourism Expenditure (international and domestic overnight total trip spend) Source: IVS & NVS Total International Expenditure Source: IVS Total International Expenditure from TA markets Source: IVS Total International Expenditure from leisure visitors from TA markets Source: IVS Total International Expenditure from business event visitors from select TA markets Source: IVS
$94.5bn (12mths to Dec15) Up 10.5% $36.6bn (12mths to Dec15) Up 17.7% $29.5bn (12mths to Dec15) Up 20.7% $14.9bn (12mths to Dec15) Up 20.0% $2.0bn (12mths to Dec15) Up 1.1%
Table continued on following page.

Tourism Australia Budget Statements
164
Table 2.1.3: Performance criteria for Outcome 1 (continued)
2015-16 Earned Advertising Value (EAV) (AU$ value of TA PR activities in selected international markets) Source: PR coverage reporting Total Unique Visitors (UVs) to TA websites Source: Adobe Return on marketing investment (AU$ visitor spend returned from $1 of marketing investment) Source: External agency research
$226mil (12mths to Jun15) 28.4mil (12mths to Mar16) Down 6.3% $16:1(FY1415 Campaigns)
2016-17 Tourism 2020: Overnight Tourism Expenditure Total International Expenditure Total International Expenditure from TA markets Total International Expenditure from leisure visitors from TA markets Total International Expenditure from business event visitors from select TA markets Earned Advertising Value (EAV) Total Unique Visitors (UVs) to TA websites Return on marketing investment
$100.7bn (12mths to Dec16) $40.7bn (12mths to Dec16) $33.5bn (12mths to Dec16) $17.0bn (12mths to Dec16) $2.2bn (12mths to Dec16) $265mil (12mths to Jun17) 31.3mil (12mths to Mar17) $16:1 (FY1617 Campaigns)
2017-18 and beyond
Tourism 2020: Overnight Tourism Expenditure Total International Expenditure Total International Expenditure from TA markets Total International Expenditure from leisure visitors from TA markets Total International Expenditure from business event visitors from select TA markets Earned Advertising Value (EAV) Total Unique Visitors (UVs) to TA websites Return on marketing investment
$115bn (12mths to Dec20) $57.0bn (12mths to Dec20) $49.4bn (12mths to Dec20) $25.5bn (12mths to Dec20) $3.2bn (12mths to Dec20) TBA 45.7mil (12mths to Mar21) $16:1 (FY2021 Campaigns)

Tourism Australia Budget Statements
165
Program component 1.1.2 – Industry development
Objective: An Australian tourism industry that is competitive and sustainable and delivers on the needs of the target customer.
Delivery Target group:
The Australian tourism industry and trade and distribution partners in key markets
overseas
Key activities:
• Development of the distribution system
• Provision of platforms to do business
• Support of supply-side industry goals
• Dissemination of tourism insights and engagement of industry stakeholders
Performance information
Year Performance criteria Targets
2015-16 Stakeholder indicate that TA add value to their business (% of stakeholders indicating TA activities provide excellent, very good or good value to their business) Source: stakeholder surveys
91% (Average of FY1516 results)
2016-17 Stakeholder indicate that TA add value to their business >90% (FY1617)
2017-18 and beyond
Stakeholder indicate that TA add value to their business >90% (FY1617)

Tourism Australia Budget Statements
166
Section 3: Budgeted financial statements
Section 3 presents budgeted financial statements which provide a comprehensive
snapshot of entity finances for the 2016-17 budget year, including the impact of budget
measures and resourcing on financial statements.
3.1 BUDGETED FINANCIAL STATEMENTS
3.1.1 Differences between entity resourcing and financial statements
Tourism Australia has no significant differences between the resource information
presented in the Budget Papers and in the Portfolio Budget Statements as a result of
differences between whole-of-government level reporting (under Australian
Accounting Standard 1049) and entity level financial reporting.
3.1.2 Explanatory notes and analysis of budgeted financial statements
The departmental financial statements represent the assets, liabilities, revenues and
expenses which are controlled by Tourism Australia. Departmental expenses include
employee and supplier expenses and other administrative costs which are incurred by
Tourism Australia in undertaking its operations.
Budgeted departmental comprehensive Income statement
Total operating revenue for 2016-17 is estimated at $176.3 million and is made up of
Government appropriations of $140.3 million, Asia Marketing Fund from Government
of $14 million and revenue from other sources of $22 million. The revenue from
industry sources has increased by $4.4 million from the 2015-16 estimated actual of
$16.6 million.
The change includes:
Appropriation for 2016-17 reflects normal level of funding for Tourism
Australia adjusted for the efficiency dividend.
Impact of wage cost index applied to appropriations.
Corresponding total expenses are also estimated to be $176.3 million, an increase of
$0.6 million from the 2015-16 estimated actual of $175.7 million due to the funding of
foreign exchange impacts for 2015-16.
Budgeted departmental balance sheet
Tourism Australia is budgeting a net asset position of $19.5 million in 2016-17. Net
assets are projected to remain the same beyond 2016-17.

Tourism Australia Budget Statements
167
3.2.1 BUDGETED FINANCIAL STATEMENTS TABLES
Table 3.1: Comprehensive income statement (showing net cost of services) for the period ended 30 June
Prepared on Australian Accounting Standards basis.
2015-16
Estimated
actual
$'000
2016-17
Budget
$'000
2017-18
Forward
estimate
$'000
2018-19
Forward
estimate
$'000
2019-20
Forward
estimate
$'000
EXPENSES
Employee benefits 30,473 31,150 31,649 31,649 31,648
Suppliers 136,486 136,457 136,983 140,109 143,155
Grants - - - - -
Depreciation and amortisation 4,500 4,500 4,500 4,500 4,500
Finance costs 33 33 33 33 33
Write-down and impairment of assets - - - - -
Losses from asset sales - - - - -
Other expenses 4,200 4,200 4,200 4,200 4,200
Total expenses 175,692 176,340 177,365 180,491 183,536
LESS:
OWN-SOURCE INCOME
Own-source revenue
Interest 1,100 1,100 1,100 1,100 1,100
Other 16,574 20,974 20,974 20,974 20,974
Total own-source revenue 17,674 22,074 22,074 22,074 22,074
Gains
Sale of assets - - - - -
Other - - - - -
Total gains - - - - -
Total own-source income 17,674 22,074 22,074 22,074 22,074
Net (cost of)/contribution by services(158,018) (154,266) (155,291) (158,417) (161,462)
Revenue from Government 158,018 154,266 155,291 158,417 161,462
Surplus/(deficit) attributable to the
Australian Government - - - - -
OTHER COMPREHENSIVE INCOME
Changes in asset revaluation surplus
Total other comprehensive income - - - - -
Total comprehensive income/(loss) - - - - -
Total comprehensive income/(loss)
attributable to the Australian
Government - - - - -

Tourism Australia Budget Statements
168
Table 3.2: Budgeted departmental balance sheet (as at 30 June)
2015-16
Estimated
actual
$'000
2016-17
Budget
$'000
2017-18
Forward
estimate
$'000
2018-19
Forward
estimate
$'000
2019-20
Forward
estimate
$'000
ASSETS
Financial assets
Cash and cash equivalents 13,929 13,896 13,896 13,896 13,896
Trade and other receivables 5,954 5,954 5,954 5,954 5,954
Total financial assets 19,883 19,850 19,850 19,850 19,850
Non-financial assets
Land and buildings 3,675 3,675 3,675 3,675 3,675
Property, plant and equipment 740 740 740 740 740
Intangibles 8,476 8,476 8,476 8,476 8,476
Other non-financial assets 4,794 4,794 4,794 4,794 4,794
Total non-financial assets 17,685 17,685 17,685 17,685 17,685
Assets held for sale
Total assets 37,568 37,535 37,535 37,535 37,535
LIABILITIES
Payables
Suppliers 6,544 6,511 6,511 6,511 6,511
Other payables 5,481 5,481 5,481 5,481 5,481
Total payables 12,025 11,992 11,992 11,992 11,992
Provisions
Employee provisions 5,275 5,275 5,275 5,275 5,275
Other provisions 766 766 766 766 766
Total provisions 6,041 6,041 6,041 6,041 6,041
Total liabilities 18,066 18,033 18,033 18,033 18,033
Net assets 19,502 19,502 19,502 19,502 19,502

Tourism Australia Budget Statements
169
Table 3.2: Budgeted departmental balance sheet (as at 30 June) (continued)
*Equity is the residual interest in assets after the deduction of liabilities.
Prepared on Australian Accounting Standards basis.
2015-16
Estimated
actual
$'000
2016-17
Budget
$'000
2017-18
Forward
estimate
$'000
2018-19
Forward
estimate
$'000
2019-20
Forward
estimate
$'000
EQUITY*
Parent entity interest
Contributed equity 1,543 1,543 1,543 1,543 1,543
Reserves 1,990 1,990 1,990 1,990 1,990
Retained surplus (accumulated deficit) 15,969 15,969 15,969 15,969 15,969
Total parent entity interest 19,502 19,502 19,502 19,502 19,502
Total equity 19,502 19,502 19,502 19,502 19,502
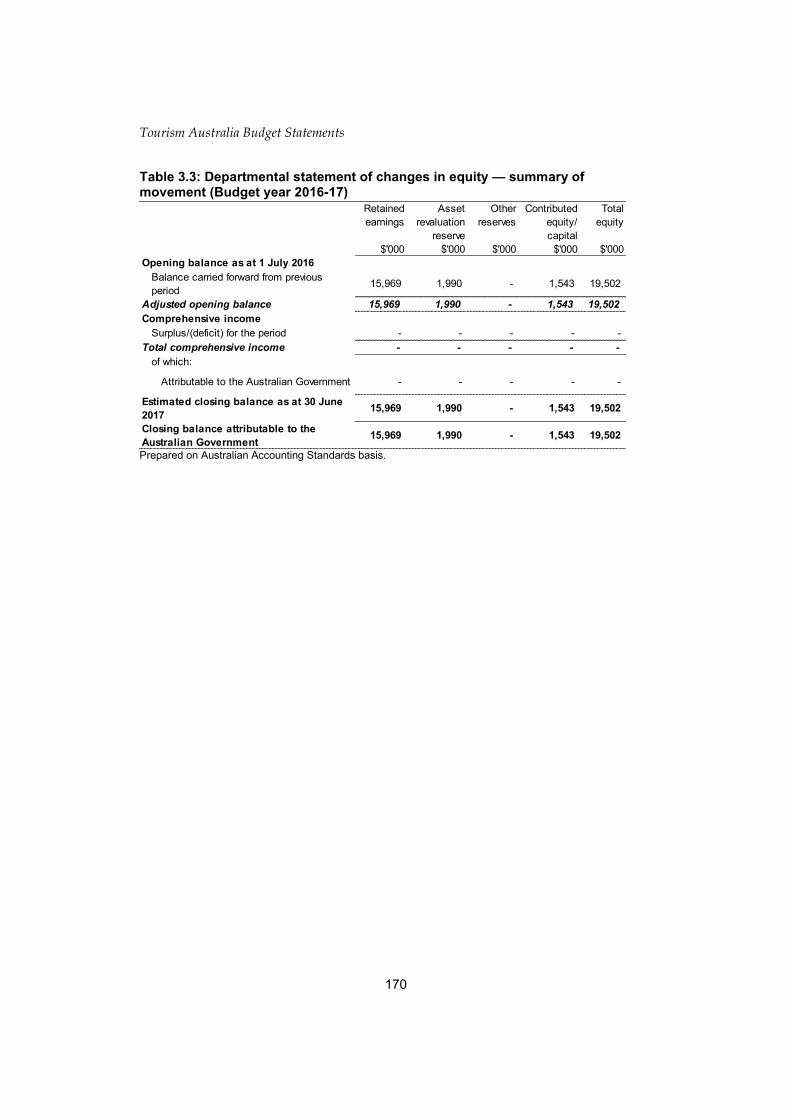
Tourism Australia Budget Statements
170
Table 3.3: Departmental statement of changes in equity — summary of movement (Budget year 2016-17)
Prepared on Australian Accounting Standards basis.
Retained
earnings
$'000
Asset
revaluation
reserve
$'000
Other
reserves
$'000
Contributed
equity/
capital
$'000
Total
equity
$'000
Opening balance as at 1 July 2016
Balance carried forward from previous
period15,969 1,990 - 1,543 19,502
Adjusted opening balance 15,969 1,990 - 1,543 19,502
Comprehensive income
Surplus/(deficit) for the period - - - - -
Total comprehensive income - - - - -
of which:
Attributable to the Australian Government - - - - -
Estimated closing balance as at 30 June
201715,969 1,990 - 1,543 19,502
Closing balance attributable to the
Australian Government15,969 1,990 - 1,543 19,502

Tourism Australia Budget Statements
171
Table 3.4: Budgeted departmental statement of cash flows (for the period ended 30 June)
2015-16
Estimated
actual
$'000
2016-17
Budget
$'000
2017-18
Forward
estimate
$'000
2018-19
Forward
estimate
$'000
2019-20
Forward
estimate
$'000
OPERATING ACTIVITIES
Cash received
Appropriations 144,018 140,266 141,291 144,798 147,462
Receipts from Government 14,000 14,000 14,000 14,000 14,000
Sale of goods and rendering of services
Interest 1,100 1,100 1,100 1,100 1,100
Dividends
Net GST received
Other 17,767 20,974 20,974 20,974 20,974
Total cash received 176,885 176,340 177,365 180,872 183,536
Cash used
Employees 30,473 31,150 31,649 31,649 31,648
Suppliers 137,679 136,490 137,016 140,523 143,188
Other 4,233 4,233 4,200 4,200 4,200
Total cash used 172,385 171,873 172,865 176,372 179,036
Net cash from/(used by) operating
activities4,500 4,467 4,500 4,500 4,500
INVESTING ACTIVITIES
Cash used
Purchase of property, plant and
equipment and intangibles4,500 4,500 4,500 4,500 4,500
Total cash used 4,500 4,500 4,500 4,500 4,500
Net cash from/(used by) investing
activities(4,500) (4,500) (4,500) (4,500) (4,500)

Tourism Australia Budget Statements
172
Table 3.4: Budgeted Departmental Statement of Cash Flows (for the period ended 30 June) (continued)
Prepared on Australian Accounting Standards basis.
2015-16
Estimated
actual
$'000
2016-17
Budget
$'000
2017-18
Forward
estimate
$'000
2018-19
Forward
estimate
$'000
2019-20
Forward
estimate
$'000
FINANCING ACTIVITIES
Cash received
Contributed equity - - - - -
Other - - - - -
Total cash received - - - - -
Cash used
Other - - - - -
Total cash used - - - - -
Net cash from/(used by) financing
activities- - - - -
Net increase/(decrease) in cash held - (33) - - -
Cash and cash equivalents at the
beginning of the reporting period13,929 13,929 13,896 13,896 13,896
Effect of exchange rate movements on
cash and cash equivalents at the
beginning of reporting period
Cash and cash equivalents at the
end of the reporting period13,929 13,896 13,896 13,896 13,896

Tourism Australia Budget Statements
173
Table 3.5: Departmental capital budget statement (for the period ended 30 June)
(a) Includes the following sources of funding: - current Bill 1; - internally developed assets; - proceeds from the sale of assets.
Prepared on Australian Accounting Standards basis.
2015-16
Estimated
actual
$'000
2016-17
Budget
$'000
2017-18
Forward
estimate
$'000
2018-19
Forward
estimate
$'000
2019-20
Forward
estimate
$'000PURCHASE OF NON-FINANCIAL
ASSETS
Funded internally from departmental
resources (a) 4,500 4,500 4,500 4,500 4,500
TOTAL 4,500 4,500 4,500 4,500 4,500
RECONCILIATION OF CASH USED TO
ACQUIRE ASSETS TO ASSET
MOVEMENT TABLE
Total purchases 4,500 4,500 4,500 4,500 4,500
Total cash used to acquire assets 4,500 4,500 4,500 4,500 4,500

Tourism Australia Budget Statements
174
Table 3.6: Statement of asset movements (Budget year 2016-17)
Prepared on Australian Accounting Standards basis.
Buildings
$'000
Other property,
plant and
equipment
$'000
Computer
software and
intangibles
$'000
Total
$'000
As at 1 July 2016
Gross book value 8,737 4,898 45,337 58,972
Accumulated depreciation/amortisation
and impairment (5,062) (4,158) (36,861) (46,081)
Opening net book balance 3,675 740 8,476 12,891
Capital asset additionsEstimated expenditure on new or
replacement assets
By purchase - other 500 100 3,900 4,500
Total additions 500 100 3,900 4,500
Other movements
Depreciation/amortisation expense (500) (100) (3,900) (4,500)
Total other movements (500) (100) (3,900) (4,500)
As at 30 June 2017
Gross book value 9,237 4,998 49,237 63,472
Accumulated depreciation/ amortisation
and impairment (5,562) (4,258) (40,761) (50,581)
Closing net book balance 3,675 740 8,476 12,891

Glossary
175
PORTFOLIO GLOSSARY
Term Meaning
Accrual accounting System of accounting where items are brought to account and
included in the financial statements as they are earned or
incurred, rather than as they are received or paid.
Accumulated
depreciation
The aggregate depreciation recorded for a particular
depreciating asset.
Additional
Estimates
Where amounts appropriated at Budget time are insufficient,
Parliament may appropriate more funds to portfolios through
the Additional Estimates Acts.
Administered Revenues, expenses, assets or liabilities managed by agencies
on behalf of the Commonwealth. Agencies do not control
administered items. Administered expenses include grants,
subsidies and benefits. In many cases, administered expenses
fund the delivery of third party outputs.
Annual
appropriation
Two appropriation Bills are introduced into Parliament in
May and comprise the Budget for the financial year beginning
1 July. Further Bills are introduced later in the financial year
as part of the additional estimates. Parliamentary
departments have their own appropriations.
Appropriation An authorisation by Parliament to spend monies from the
Consolidated Revenue Fund for a particular purpose.
Capital
expenditure
Expenditure by an agency on capital projects, for example
purchasing a building.
Consolidated
Revenue Fund
Section 81 of the Constitution stipulates that all revenue raised
or money received by the Commonwealth forms the one
consolidated revenue fund (CRF).
Departmental Revenue, expenses, assets and liabilities that are controlled by
the agency in providing its outputs. Departmental items
would generally include computers, plant and equipment
assets used by agencies in providing goods and services and
most employee expenses, supplier costs and other
administrative expenses incurred.

Glossary
176
Depreciation Apportionment of an asset’s capital value as an expense over
its estimated useful life to take account of normal usage,
obsolescence, or the passage of time.
Effectiveness
indicators
Measure the joint or independent contribution of programmes
to the achievement of their specified outcome.
Efficiency
indicators
Measure the adequacy of an agency’s management of its
programmes. Includes price, quality and quantity indicators.
The interrelationship between the three efficiency indicators of
any one programme should be considered when judging
efficiency.
Equity or net assets Residual interest in the assets of an entity after deduction of
its liabilities.
Expense Total value of all of the resources consumed in producing
goods and services or the loss of future economic benefits in
the form of reductions in assets or increases in liabilities of an
entity.
Fair value Valuation methodology: the amount for which an asset could
be exchanged, or a liability settled, between knowledgeable
and willing parties in an arm’s length transaction. The fair
value can be affected by the conditions of the sale, market
conditions and the intentions of the asset holder.
Operating result Equals revenue less expense.
Outcomes The Government’s objectives in each portfolio area. Outcomes
are desired results, impacts or consequences for the Australian
community as influenced by the actions of the Australian
Government. Actual outcomes are assessments of the end
results or impacts actually achieved.
Price One of the three key efficiency indicators. The amount the
Government or the community pays for the delivery of
programmes.
Programme Activity that delivers benefits, services or transfer payments to
individuals, industry and/or the community as a whole, with
the aim of achieving the intended result specified in an
outcome statement.

Glossary
177
Quality One of the three key efficiency indicators. Relates to the
characteristics by which customers or stakeholders judge an
organisation, product or service. Assessment of quality
involves use of information gathered from interested parties
to identify differences between the user’s expectations and
experiences.
Quantity One of the three key efficiency indicators. Examples include:
the size of a programme; count or volume measures; how
many or how much.
Revenue Total value of resources earned or received to cover the
production of goods and services.
Special Account Special Accounts allow money in the Consolidated Revenue
Fund to be acknowledged as set-aside (hypothecated) for a
particular purpose. Amounts credited to a Special Account
may only be spent for the purposes of the Special Account.
Special Accounts can only be established by a written
determination of the Finance Minister (section 78 of the Public
Governance, Performance and Accountability (PGPA) Act 2013) or
through an Act of Parliament (section 80 of the PGPA Act
2013).
Special
Appropriations
(including Standing
Appropriations)
An amount of money appropriated by a particular Act of
Parliament for a specific purpose and number of years. For
Special Appropriations the authority to withdraw funds from
the Consolidated Revenue Fund does not generally cease at
the end of the financial year. Standing Appropriations are a
sub-category consisting of ongoing Special Appropriations -
the amount appropriated will depend on circumstances
specified in the legislation.


![[DEFENSE & FOREIGN AFFAIRS HANDBOOK 1967/77]...Title [DEFENSE & FOREIGN AFFAIRS HANDBOOK 1967/77] Subject [DEFENSE & FOREIGN AFFAIRS HANDBOOK 1967/77] Keywords](https://static.fdocuments.us/doc/165x107/5f2c74a40fc5d9696c286bc2/defense-foreign-affairs-handbook-196777-title-defense-foreign.jpg)