Forecasting Travel Time Index using a Travel Demand Model to Measure Plan Performance Thomas...
23
Forecasting Travel Time Index using a Travel Demand Model to Measure Plan Performance Thomas Williams, AICP Texas A&M Transportation Institute 2015 TRB Transportation Planning Applications Atlantic City, NJ
-
Upload
paul-bruce -
Category
Documents
-
view
217 -
download
0
Transcript of Forecasting Travel Time Index using a Travel Demand Model to Measure Plan Performance Thomas...
Forecasting Travel Time Index using a Travel Demand Model to Measure Plan
PerformanceThomas Williams, AICPTexas A&M Transportation Institute2015 TRB Transportation Planning ApplicationsAtlantic City, NJ
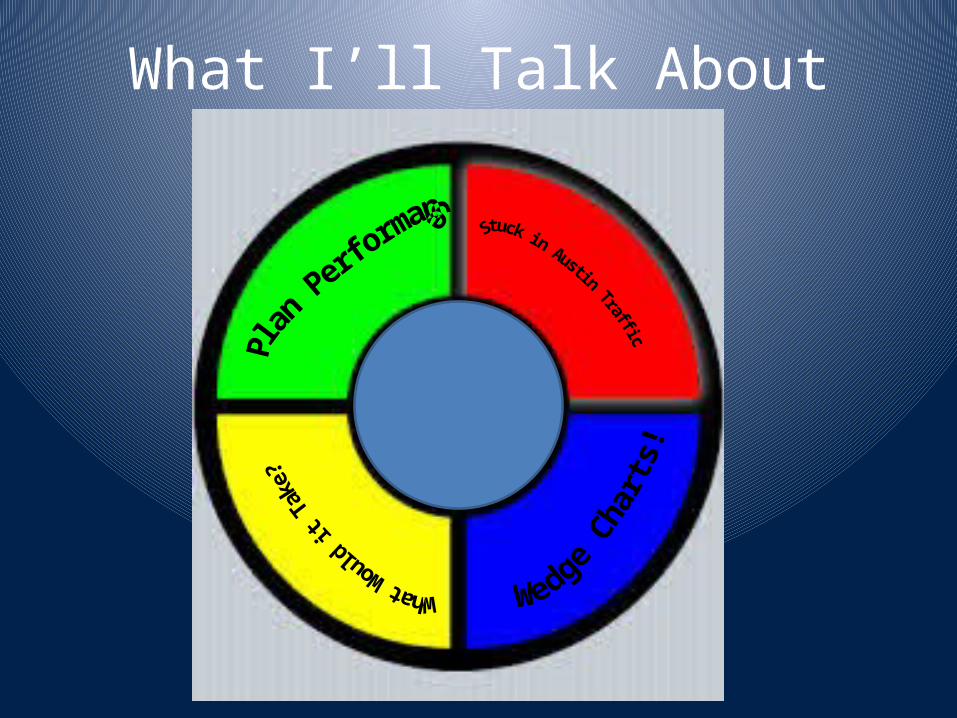
What I’ll Talk About
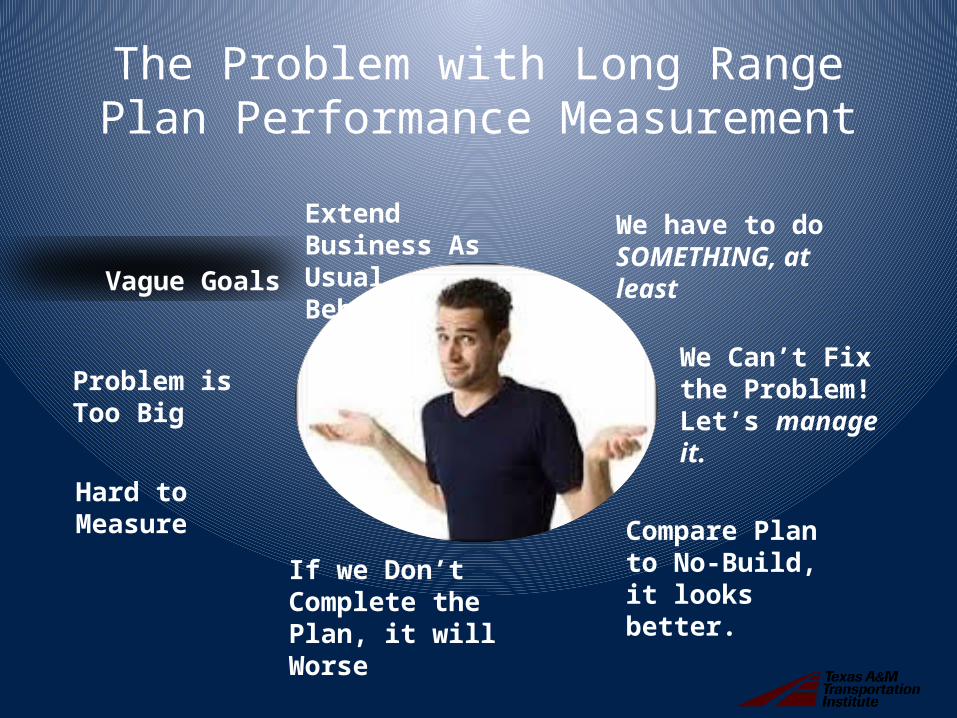
The Problem with Long Range Plan Performance Measurement
Vague Goals
Problem is Too Big
Hard to Measure
Extend Business As Usual Behavior
If we Don’t Complete the Plan, it will Worse
Compare Plan to No-Build, it looks better.
We Can’t Fix the Problem! Let’s manage it.
We have to do SOMETHING, at least
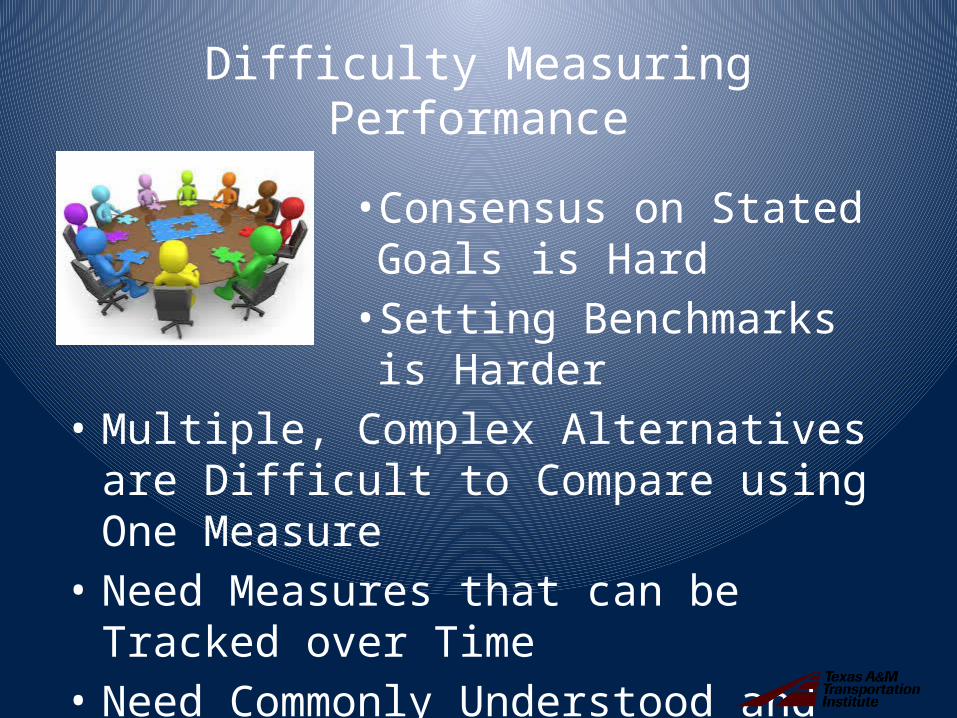
Difficulty Measuring Performance
• Consensus on Stated Goals is Hard• Setting Benchmarks is Harder
• Multiple, Complex Alternatives are Difficult to Compare using One Measure
• Need Measures that can be Tracked over Time• Need Commonly Understood and Easily
Communicated Measures

Austin’s Congestion
Travel Time IndexRanked 4th in Large City Category since 2008
This Happens 8 to 10 Hours
per Day!

I-35 Investment Priorities Project
• Studied 7 Alternatives - Included Managed Lanes, Toll Tolling, Major Re-construction
• Dynamic Traffic Modeling
No AlternativeSignificantly
ReducedCongestion

But Compared to No Build, things
Look Better…
A Little…
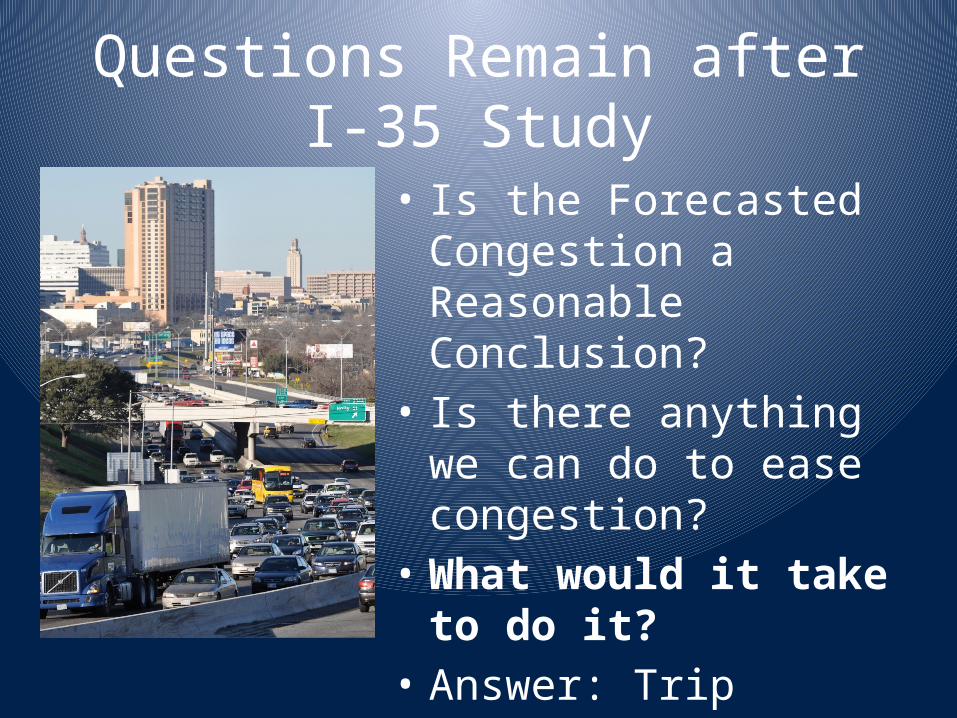
Questions Remain after I-35 Study
• Is the Forecasted Congestion a Reasonable Conclusion?
• Is there anything we can do to ease congestion?
• What would it take to do it?
• Answer: Trip Reduction!
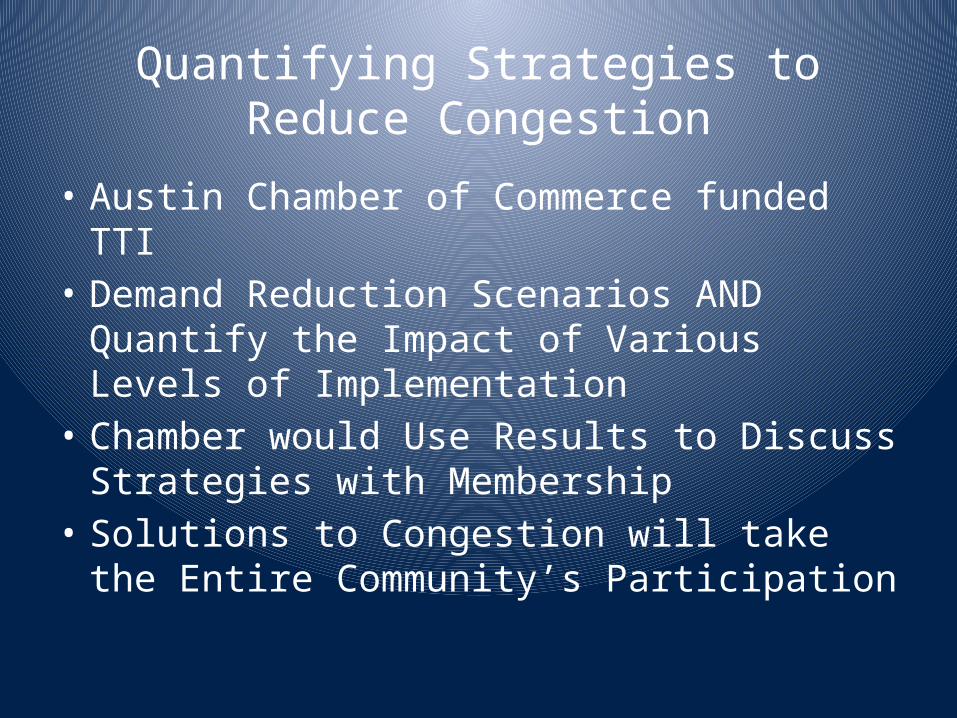
Quantifying Strategies to Reduce Congestion
• Austin Chamber of Commerce funded TTI• Demand Reduction Scenarios AND Quantify
the Impact of Various Levels of Implementation
• Chamber would Use Results to Discuss Strategies with Membership
• Solutions to Congestion will take the Entire Community’s Participation

Travel Time Index
• Commonly Understood, widely Publicized
• Annual “Urban Mobility Report”
• Ratio of Congested Travel Time to Free Flow Travel Time
• “1.31” - trip will take 31% longer during Congested Periods
• Applied to any Geographic area or Segment

Wedge Charts in Climate Science
• “Stabilization Wedges: Solving the Climate Problem for the Next 50 years with Current Technology” – S. Pacala & R. Socolow
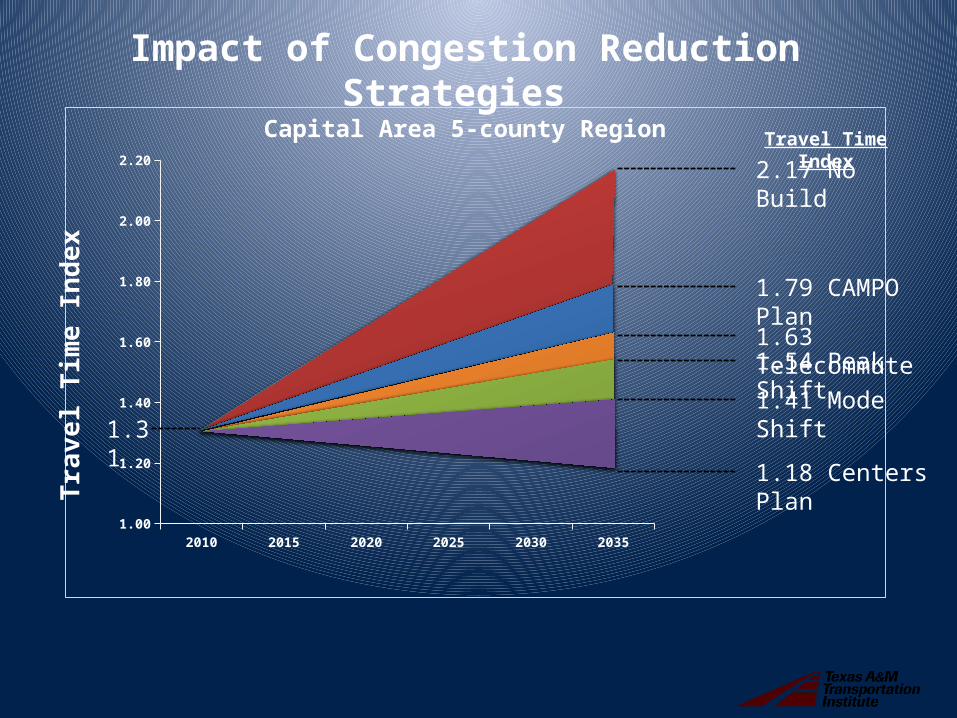
2010 2015 2020 2025 2030 20351.00
1.20
1.40
1.60
1.80
2.00
2.202.17 No BuildTravel Time Index
Trav
el T
ime
Inde
x
1.31
1.79 CAMPO Plan
1.63 Telecommute1.54 Peak Shift
1.41 Mode Shift
1.18 Centers Plan
Impact of Congestion Reduction Strategies Capital Area 5-county Region

Why the Wedges?
Longer we Wait, the Worse it Gets
Shows Relative/Cumulative
Impacts Visually
Numerous, Interchangeable
Scenarios
Picked up by Media,
Referenced Many Times
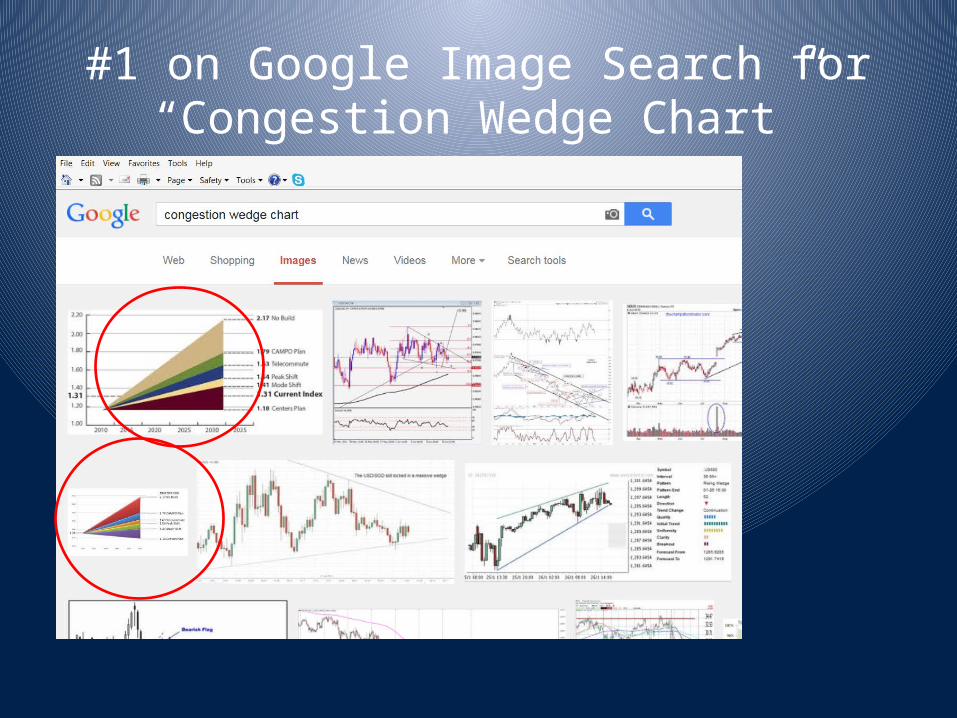
#1 on Google Image Search for “Congestion Wedge Chart”
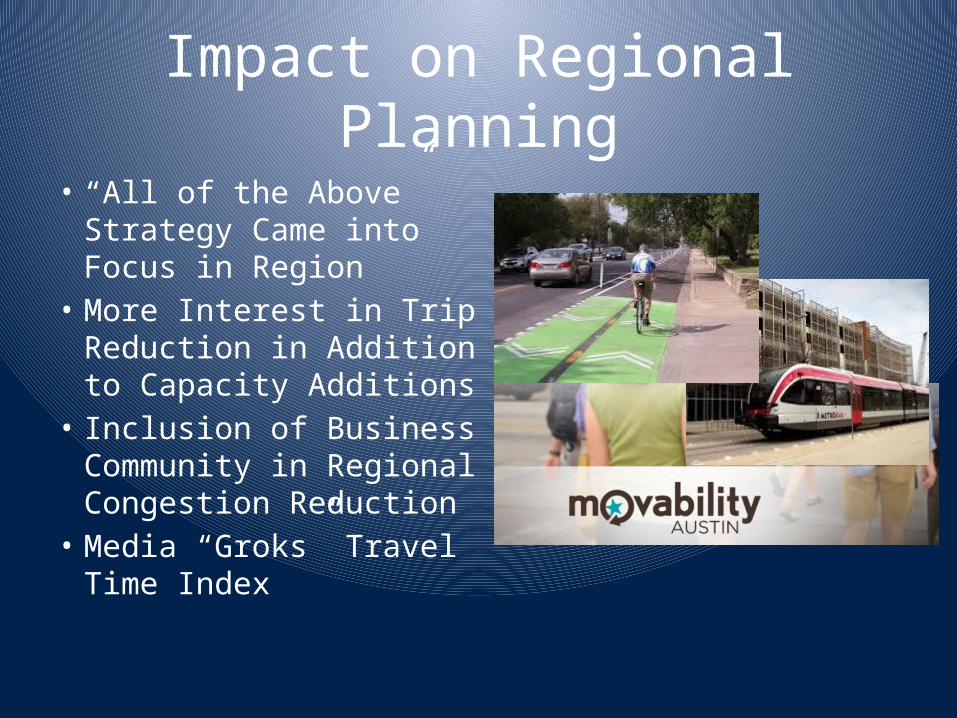
Impact on Regional Planning
• “All of the Above” Strategy Came into Focus in Region
• More Interest in Trip Reduction in Addition to Capacity Additions
• Inclusion of Business Community in Regional Congestion Reduction
• Media “Groks” Travel Time Index

Modeling the Index
Travel Time Index = Congested Time/Free Flow Time
Urban Mobility Report uses INRIX speed dataINRIX is Past Data – So, How to Forecast?
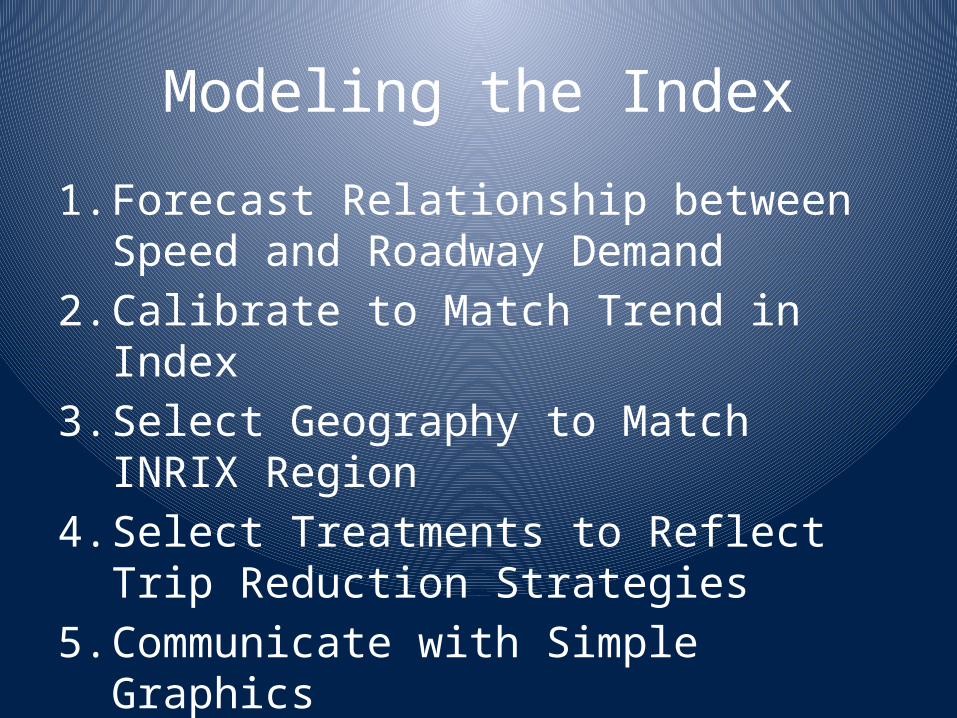
Modeling the Index
1. Forecast Relationship between Speed and Roadway Demand
2. Calibrate to Match Trend in Index3. Select Geography to Match INRIX Region4. Select Treatments to Reflect Trip Reduction
Strategies5. Communicate with Simple Graphics
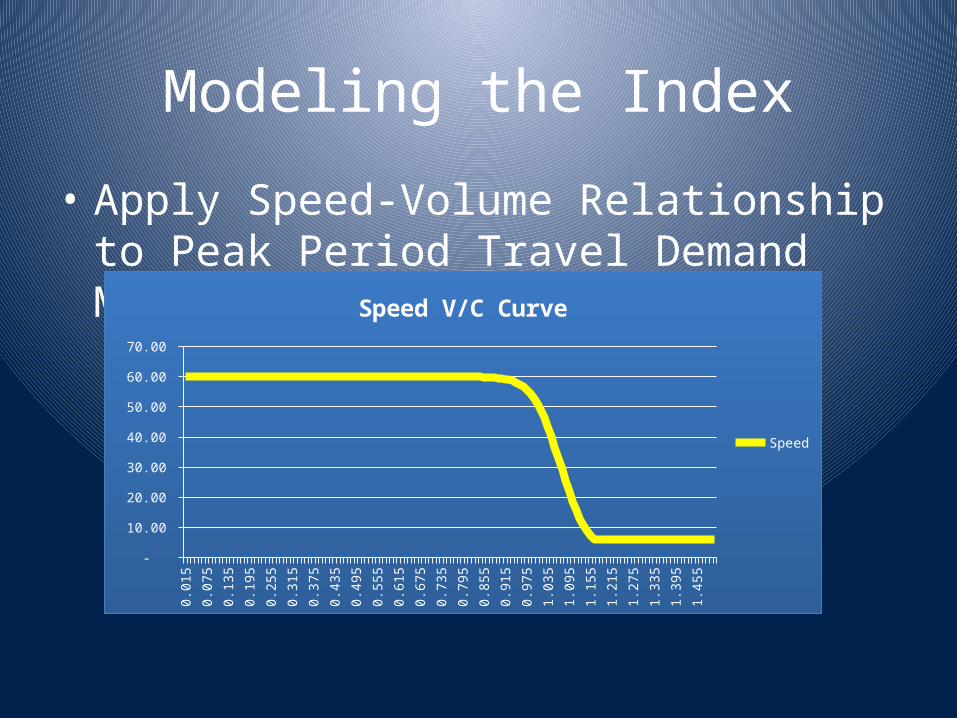
Modeling the Index
• Apply Speed-Volume Relationship to Peak Period Travel Demand Models
0.01
50.
055
0.09
50.
135
0.17
50.
215
0.25
50.
295
0.33
50.
375
0.41
50.
455
0.49
50.
535
0.57
50.
615
0.65
50.
695
0.73
50.
775
0.81
50.
855
0.89
50.
935
0.97
51.
015
1.05
51.
095
1.13
51.
175
1.21
51.
255
1.29
51.
335
1.37
51.
415
1.45
51.
495
-
10.00
20.00
30.00
40.00
50.00
60.00
70.00
Speed V/C Curve
Speed
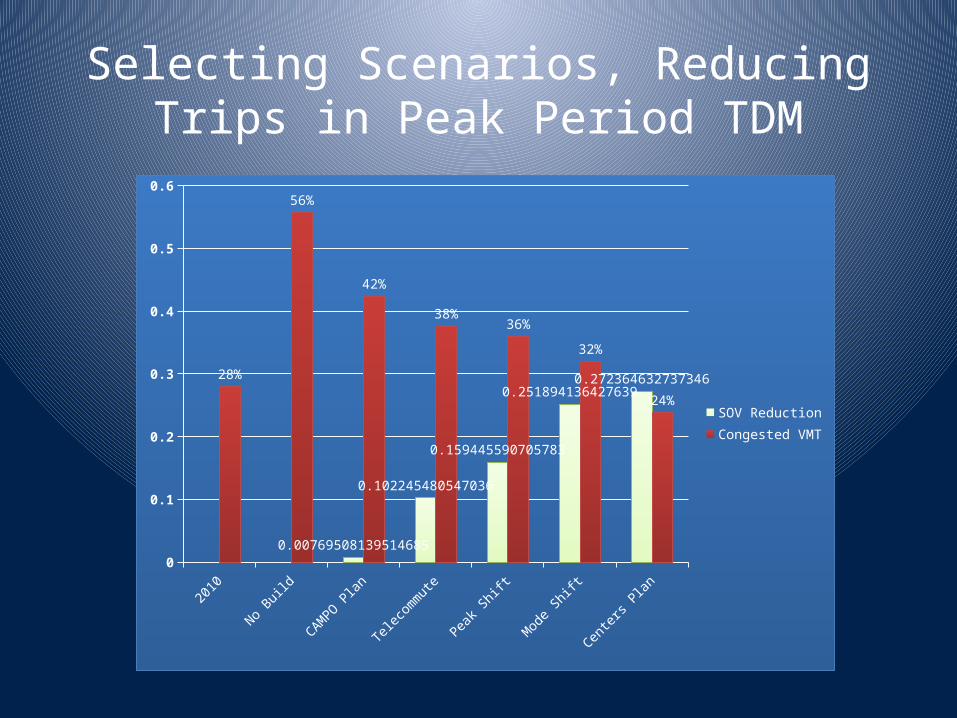
Selecting Scenarios, Reducing Trips in Peak Period TDM
2010 No Build CAMPO Plan Telecommute Peak Shift Mode Shift Centers Plan0
0.1
0.2
0.3
0.4
0.5
0.6
28%
56%
42%
38%36%
32%
24%
0.00769508139514685
0.102245480547036
0.159445590705783
0.2518941364276390.272364632737346
SOV ReductionCongested VMT

Limitations to Method
• Not Predictive – Scenarios are Assumed• Only measures Roadways, not Multimodal• Doesn’t account for other Criteria besides
Congestion and Delay• Average may not Reflect Specific Corridors or
parts of Region

Benefits of Wedges and Process
• Well-known Travel Time Index as Measure of Performance
• Can be used with Multiple Combinations of Treatments
• Combines Capacity-Additions with TDM Treatments
• Uses Demand Model• Compares Plan Performance to
Existing Conditions, not No Build

What We Need
• Models that Can Forecast – Demand Response to Severe Congestion– Technology Impacts
• Adjustment to Long Range Planning to Explicitly Include TDM– And Measure It
• Cost Comparison Studies of TDM/TSM Impacts