FORECASTING STUDENT ACADEMIC … · Artificial Neural Networks, Decision tree learning, ... number...
7
International Research Journal of Engineering and Technology (IRJET) e-ISSN: 2395 -0056 Volume: 03 Issue: 12 | Dec -2016 www.irjet.net p-ISSN: 2395-0072 © 2016, IRJET | Impact Factor value: 4.45 | ISO 9001:2008 Certified Journal | Page 955 FORECASTING STUDENT ACADEMIC PERFORMANCE BY DECISION TREE LEARNING USING ARTIFICIAL NEURAL NETWORKS R.Ruhin kouser 1 , J.Daphney Joann 2 , K.Suganya 3 Assistant Professor, Department of Computer Science Engineering, Kingston Engineering College,Vellore ABSTRACT: Along with the spreading of online training, the significance of dynamic support of alternates required in internet learning forms has developed. The utilization of counterfeit consciousness in training permits educators to dissect information separated from college servers, recognize examples of alternate conduct and create mediations for battling alternates. This review utilized alternate information put away as a part of a Open source server and anticipated alternate accomplishment in course, in light of four learning exercises - correspondence by means of messages, cooperative substance creation with wiki, content association measured by documents saw and self- assessment through online tests. Next, a model in light of the Neural System and decision tree was prepared to anticipate alternate execution on a mixed adapting course environment. The model anticipated the execution of alternates with right arrangement rate of 98.5% KEYWORDS Artificial Neural Networks, Decision tree learning, Student Achievement, Open source Data 1. INTRODUCTION Nowadays, the application of artificial intelligence in education has grown considerably worldwide, exploiting the fact that student related information have become available through the daily use of Learning Management Systems (LMSs). By examining logs and reports from such systems, instructors can evaluate the online activity of their students and see how many times they access the course, what the number of pages or modules accessed is and which assignments they completed. Online participation in chats and forums, and rates of students’ progress can also be monitored and provide actionable insights to improve teaching. In order to improve the functionality provided by those unstructured,low-level information collected in server logs, researchers utilize many data mining methods to analyze raw data and extract high level information about students' behavior and learning strategies [1], [2], [3]. Analytics and data mining methodologies allow teachers to search through large datasets to discover patterns that reflect the students' behavior and learning [4]. An important research topic in Educational Data Mining is the modeling of student’s online activity in order to predict future academic performance [5]. Although students' performance holds an important role in the learning process, it itself is a complex phenomenon affected by many factors like the teaching environment and personal study habits. Different studies have used different indicators/variables to build models capable to predict academic performance. Research indicates that some variables are more efficient predictors than others, in terms of student success in LMS supported courses [1], [2]. One of the factors that influence the student's engagement is classroom environment. Research findings indicate that, teaching practices that encourage active learning strategies, collaborative group work and feedback, especially in blended learning environments, have increased potential to engage students in meaningful interactions with course materials, peers and instructors. In this study, four predictors/variables, drawn from the daily students' activity in a Moodle based blended learning course, were used as inputs in order to build an Artificial Neural Network (ANN) model capable to predict student success in terms of course grade. An ANN is a three-layer network, that uses a supervised learning algorithm to classify input data (e.g., number of messages, number of wiki postings, number of files viewed and number of quiz efforts) into specific output categories (e.g., failure or success). The proportion of students that the PNN made a correct diagnosis of success or failure was 98.5%. 2. RELATED WORK Neural networks have been used by analysts to predict student learning outcomes. Lykourentzou et al. [6] used grades from a multiple-choice test as inputs to neural networks that predict students' final achievement. The results showed that neural network method was more accurate and efficient, compared to linear regression, in classifying students into two groups based on their learning outcom. In order to predict academic performance of business school graduates, Paliwal & Kumar [7] used data from a business school and compared neural networks and standard statistical techniques for prediction and classification problems. The findings demonstrated the superiority of ANN over the other algorithms and revealed that undergraduate academic results and test score were the most important variables in
Transcript of FORECASTING STUDENT ACADEMIC … · Artificial Neural Networks, Decision tree learning, ... number...

International Research Journal of Engineering and Technology (IRJET) e-ISSN: 2395 -0056
Volume: 03 Issue: 12 | Dec -2016 www.irjet.net p-ISSN: 2395-0072
© 2016, IRJET | Impact Factor value: 4.45 | ISO 9001:2008 Certified Journal | Page 955
FORECASTING STUDENT ACADEMIC PERFORMANCE BY DECISION TREE
LEARNING USING ARTIFICIAL NEURAL NETWORKS
R.Ruhin kouser1, J.Daphney Joann2, K.Suganya3
Assistant Professor, Department of Computer Science Engineering, Kingston Engineering College,Vellore
ABSTRACT: Along with the spreading of online training, the significance of dynamic support of alternates required in internet learning forms has developed. The utilization of counterfeit consciousness in training permits educators to dissect information separated from college servers, recognize examples of alternate conduct and create mediations for battling alternates. This review utilized alternate information put away as a part of a Open source server and anticipated alternate accomplishment in course, in light of four learning exercises - correspondence by means of messages, cooperative substance creation with wiki, content association measured by documents saw and self-assessment through online tests. Next, a model in light of the Neural System and decision tree was prepared to anticipate alternate execution on a mixed adapting course environment. The model anticipated the execution of alternates with right arrangement rate of 98.5%
KEYWORDS Artificial Neural Networks, Decision tree learning, Student Achievement, Open source Data 1. INTRODUCTION
Nowadays, the application of artificial intelligence in education has grown considerably worldwide, exploiting the fact that student related information have become available through the daily use of Learning Management Systems (LMSs). By examining logs and reports from such systems, instructors can evaluate the online activity of their students and see how many times they access the course, what the number of pages or modules accessed is and which assignments they completed. Online participation in chats and forums, and rates of students’ progress can also be monitored and provide actionable insights to improve teaching. In order to improve the functionality provided by those unstructured,low-level information collected in server logs, researchers utilize many data mining methods to analyze raw data and extract high level information about students' behavior and learning strategies [1], [2], [3]. Analytics and data mining methodologies allow teachers to search through large datasets to discover patterns that reflect the students' behavior and learning [4]. An
important research topic in Educational Data Mining is the modeling of student’s online activity in order to predict future academic performance [5]. Although students' performance holds an important role in the learning process, it itself is a complex phenomenon affected by many factors like the teaching environment and personal study habits. Different studies have used different indicators/variables to build models capable to predict academic performance. Research indicates that some variables are more efficient predictors than others, in terms of student success in LMS supported courses [1], [2]. One of the factors that influence the student's engagement is classroom environment. Research findings indicate that, teaching practices that encourage active learning strategies, collaborative group work and feedback, especially in blended learning environments, have increased potential to engage students in meaningful interactions with course materials, peers and instructors. In this study, four predictors/variables, drawn from the daily students' activity in a Moodle based blended learning course, were used as inputs in order to build an Artificial Neural Network (ANN) model capable to predict student success in terms of course grade. An ANN is a three-layer network, that uses a supervised learning algorithm to classify input data (e.g., number of messages, number of wiki postings, number of files viewed and number of quiz efforts) into specific output categories (e.g., failure or success). The proportion of students that the PNN made a correct diagnosis of success or failure was 98.5%.
2. RELATED WORK Neural networks have been used by analysts to
predict student learning outcomes. Lykourentzou et al. [6] used grades from a multiple-choice test as inputs to neural networks that predict students' final achievement. The results showed that neural network method was more accurate and efficient, compared to linear regression, in classifying students into two groups based on their learning outcom. In order to predict academic performance of business school graduates, Paliwal & Kumar [7] used data from a business school and compared neural networks and standard statistical techniques for prediction and classification problems. The findings demonstrated the superiority of ANN over the other algorithms and revealed that undergraduate academic results and test score were the most important variables in

International Research Journal of Engineering and Technology (IRJET) e-ISSN: 2395 -0056
Volume: 03 Issue: 12 | Dec -2016 www.irjet.net p-ISSN: 2395-0072
© 2016, IRJET | Impact Factor value: 4.45 | ISO 9001:2008 Certified Journal | Page 956
measuring the academic performance. Jayne, Lanitis & Christodoulou [8] predicted the grades of different courses, based on the grade pupils received either on mathematics or Physics course. Three neural network-based methods were investigated: multilayer perceptron, radial basis functions and mixture density networks. According to the results, multilayer perceptron and radial basis functions outperform mixture density networks. Kanakana and Olanrewaju [9] used the average point scores of grade 12 students as inputs to a multilayer perception neural network and predicted first year college student achievement with high accuracy. In a literature review on data mining techniques used for predicting student performance, Shahiri, Husain & Rashid [10] found that cumulative grade point average (CGPA) is the most influence attribute because it determines future educational and career mobility. According to their findings, neural network has the highest prediction accuracy by (98%) followed by decision tree by (91%). Support vector machine and k-nearest neighbor had the same accuracy (83%), while naive Bayes gave lower prediction accuracy (76%). 3. ARTIFICIAL NEURAL NETWORKS
Artificial Neural Networks are computing algorithms that can solve complex problems imitating animal brain processes in a simplified manner [11]. Perceptron-type neural networks consist of artificial neurons or nodes, which are information processing units arranged in layers and interconnected by synaptic weights (connections). Neurons can filter and transmit information in a supervised fashion in order to built a predictive model that classifies data stored in memory.
The typical ANN model is a three-layered network of interconnected nodes: the input layer, the hidden layer, and the output layer. The nodes between input and output layers can form one or more hidden layers. Every neuron in one layer has a link to every other neuron in the next layer, but neurons belonging to the same layer have no connections between them (Figure 1). The input layer receives information from the outside world, the hidden layer perform the information processing and the output layer produces the class label or predicts continuous values. The values from the input layer entering a hidden node are multiplied by weights, a set of predetermined numbers, and the products are then added to produce a single number. This number is passed as an argument to a nonlinear mathematical function, the activation function, which returns a number between 0 and 1.
Figure 1. Neural network architecture. Figure 2. Neural network active node.
In Fig.2, the net sum of the weighted inputs entering a node j and the output activation function that converts a neuron's weighted input to its output activation (the most commonly used is the The neuron, and therefore the ANN, has two modes of operation, the training mode and the using mode. During the training phase, a data set with actual inputs and outputs will be used as examples to teach the system how to predict outputs. This supervised learning begins with random weights and, by using gradient descent search algorithms like Back propagation, adjusts the weights to be applied to the task at hand. The difference between target output values and obtained values is used in the error function to drive learning [12]. The error function depends on the weights, which need to be modified in order to minimize the error. For a given training set {{x1,t1 },{x2 ,t2 },….,{xk ,tk }} consisting of k ordered pairs of n inputs and m dimensional vectors(n-inputs, m-outputs),

International Research Journal of Engineering and Technology (IRJET) e-ISSN: 2395 -0056
Volume: 03 Issue: 12 | Dec -2016 www.irjet.net p-ISSN: 2395-0072
© 2016, IRJET | Impact Factor value: 4.45 | ISO 9001:2008 Certified Journal | Page 957
which are called the input and output patterns, the error for the output of each neuron can be defined by the equation: E j = 12 (O j − t j )2 , while the error function of the
k
network that must be minimized is given by: E j =12 ∑(O j
− t j )2 , where O j is the output Oj produced when the
input pattern x j from the training set enters the network,
and t j is the target value [13]. During the training mode,
each weight is changed adding to its previous value the
quantity
The higher the learning rate, the faster the convergent will be, but the searching path may trapped around the optimal solution and convergence become impossible. Once a set of good weights have been found, the neural network model can take another dataset with unknown output values and predict automatic the corresponding outputs. Decision tree learning is the construction of a decision tree from class-labeled training tuples. A decision tree is a flow-chart-like structure, where each internal (non-leaf) node denotes a test on an attribute, each branch represents the outcome of a test, and each leaf (or terminal) node holds a class label. The topmost node in a tree is the root node the expected information gain is the change in information entropy from a prior state to a state that takes some information as given: IG(T,a) = H(T) - H(T|a)
4. METHODOLOGY 4.1. Data
The data collected was for a course (Data Structures) which is a 2nd year course for Anna university in computer science. The course was chosen because of the familiarity of the researchers with the course and the grades considered were the semester results for the course for three previous years. A questionnaire was also distributed to students to collect data about the other factors considered in the prediction such as the students‟ financial strength and motivation to study. The data collected from the result sheet was entered into SPSS Version 20 for analysis. Table 1. Factors of the Prediction
Factor Description Attributes SPSS
value Scor
e Student‟s grade >40 and <40 0 – 100 Statu
s Student‟s status Pass, Fail 1,2
Gend
er Students gender Male, female 1,2 Finance
Financial strength Low, Medium, High 1,2,3
Motivatio
n Attitude to
learning Low, Moderate,
High 1,2,3
The factors that are considered in predicting the performance of students in this study are;
[1] Scores: this is the total scores obtained by the
students in the previous session of the course under consideration. The scores‟ attributes are within the range of >40 and <40. The scores are however entered into SPSS as obtained from the results sheets (i.e. 0 – 100). For the purpose of this study,the classification was reduced from the six class classification of scores i.e. A, B, C, D, E, F to a two-class classification of Pass and Fail in order to reduce the margin of error for the research as it regards to the prediction
[2] Status: Status refers to the remark obtained for the scores of the students, i.e. „Pass‟ or „fail‟. In which case a score less than 40 is entered as fail while a score greater or equal to 40 is entered as pass. The status is coded as 1 or 2; where 1 stands for pass and 2 stands for fail.
Gender: Gender is used to classify the students as
either male or female. This factor is quite important because it helps to know the effect of gender of the students on predicting. This is in agreement with [13] who established that gender plays a great role in the performance of female .
Students in a large public Turkish University. Though
gender and age are predictors in the academic performance of students, gender is a better predictor [14].
Finance: this refers to the financial status of students while in school, this factor is important because it affects the stability of the students as it relates to their comfort during the academic session. Finance is an avenue trough which the students are able to settle their bill. Students without adequate financial strength are affected adversely [15]. The attributes of the factor include, High, Medium mad Low are they are coded in SPSS as 1, 2 and 3. Where 1 is for high, 2 is medium and 3 is Low.
International Research Journal of Engineering and Technology (IRJET) e-ISSN: 2395 -0056
Volume: 03 Issue: 12 | Dec -2016 www.irjet.net p-ISSN: 2395-0072
© 2016, IRJET | Impact Factor value: 4.45 | ISO 9001:2008 Certified Journal | Page 958
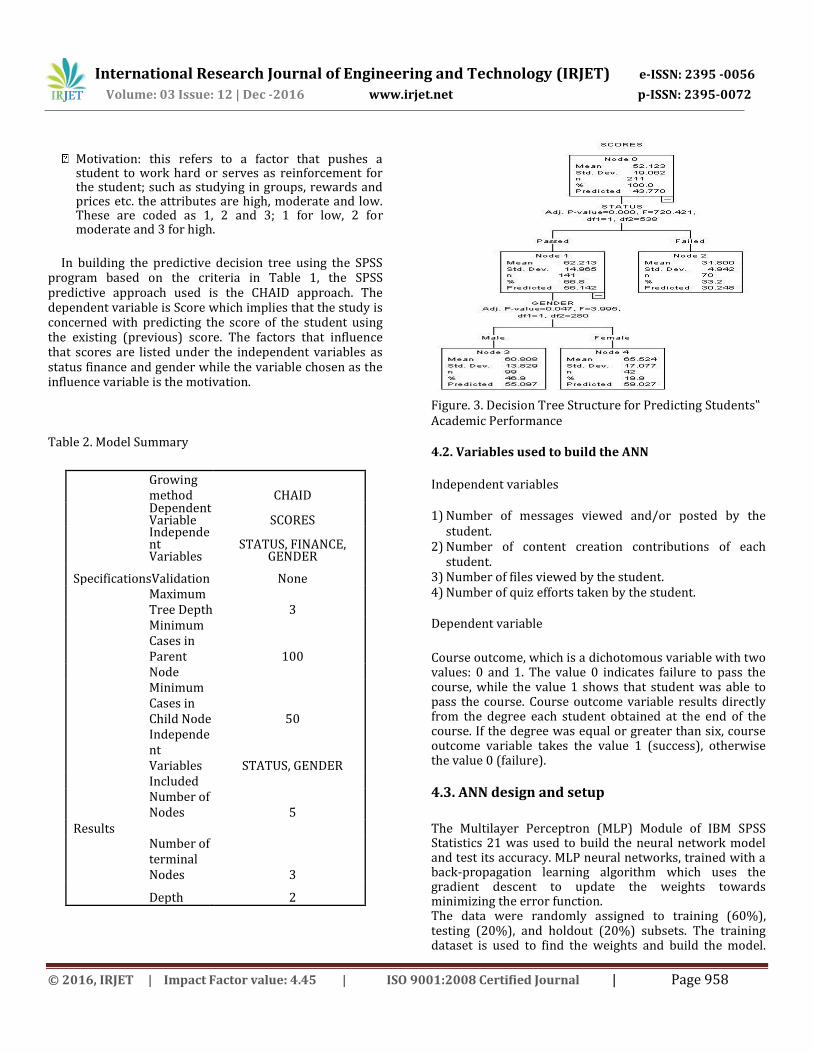
Motivation: this refers to a factor that pushes a
student to work hard or serves as reinforcement for the student; such as studying in groups, rewards and prices etc. the attributes are high, moderate and low. These are coded as 1, 2 and 3; 1 for low, 2 for moderate and 3 for high.
In building the predictive decision tree using the SPSS
program based on the criteria in Table 1, the SPSS predictive approach used is the CHAID approach. The dependent variable is Score which implies that the study is concerned with predicting the score of the student using the existing (previous) score. The factors that influence that scores are listed under the independent variables as status finance and gender while the variable chosen as the influence variable is the motivation. Table 2. Model Summary
Growing method CHAID Dependent Variable SCORES Independent Variables
STATUS, FINANCE, GENDER
SpecificationsValidation None Maximum Tree Depth 3 Minimum Cases in Parent 100 Node Minimum Cases in Child Node 50 Independent Variables STATUS, GENDER Included Number of Nodes 5
Results Number of terminal Nodes 3
Depth 2
Figure. 3. Decision Tree Structure for Predicting Students‟ Academic Performance 4.2. Variables used to build the ANN Independent variables 1) Number of messages viewed and/or posted by the
student. 2) Number of content creation contributions of each
student. 3) Number of files viewed by the student. 4) Number of quiz efforts taken by the student. Dependent variable
Course outcome, which is a dichotomous variable with two values: 0 and 1. The value 0 indicates failure to pass the course, while the value 1 shows that student was able to pass the course. Course outcome variable results directly from the degree each student obtained at the end of the course. If the degree was equal or greater than six, course outcome variable takes the value 1 (success), otherwise the value 0 (failure). 4.3. ANN design and setup
The Multilayer Perceptron (MLP) Module of IBM SPSS Statistics 21 was used to build the neural network model and test its accuracy. MLP neural networks, trained with a back-propagation learning algorithm which uses the gradient descent to update the weights towards minimizing the error function. The data were randomly assigned to training (60%), testing (20%), and holdout (20%) subsets. The training dataset is used to find the weights and build the model.

International Research Journal of Engineering and Technology (IRJET) e-ISSN: 2395 -0056
Volume: 03 Issue: 12 | Dec -2016 www.irjet.net p-ISSN: 2395-0072
© 2016, IRJET | Impact Factor value: 4.45 | ISO 9001:2008 Certified Journal | Page 959
The testing data is used to find errors and prevent overtraining during the training mode. The holdout data is used to validate the model [15]. Before training, all covariates were normalized using the formula (x−min)/(max−min), which returns values between 0 and 1, and data only from the training set. The basic MLP configurations are summarized below:
MLP Success (MLEVEL=N) WITH Messages Ccc Quiz_Efforts Files_Viewed /RESCALE COVARIATE=NORMALIZED /PARTITION TRAINING=6 TESTING=2 HOLDOUT=2 /ARCHITECTURE AUTOMATIC=NO HIDDENLAYERS=1 (NUMUNITS=AUTO) HIDDEN FUNCTION=TANH OUTPUTFUNCTION=SOFTMAX /CRITERIA TRAINING=BATCH OPTIMIZATION= SCALED CONJUGATE LAMBDAINITIAL=0.0000005 SIGMAINITIAL=0.00005 INTERVALCENTER=0 INTERVALOFFSET=0.5 MEMSIZE=1000 /PRINT CPS NETWORKINFO SUMMARY CLASSIFICATION SOLUTION IMPORTANCE /PLOT NETWORK ROC GAIN LIFT PREDIC TED/OUTFILE MODEL='C:\Users\Nikzach\Hubic\Artificial Prediction - Nikos\6-8-2016\Synaptic_Weights.Xml' /STOPPINGRULES ERRORS TEPS= 10 (DATA=AUTO) TRAININGTIMER= ON (MAXTIME=15) MAXEPOCHS =AUTO ERRORCHANGE=1.0E-4 ERRORRATIO= 0.0010/MISSING USERMISSING= EXCLUDE . The number of output neurons. The softmax function takes real numbers as arguments and maps them into real values between 0 and 1 that have sum equal to 1. Since the sum of the output activations is 1, the softmax layer can be thought of as a probability distribution and the O j value can be interpreted as the network's estimated probability (or pseudo-probability) of the classification of input x. 5. RESULTS OF decision tree
Fig 1 shows the decision tree for the prediction of the students‟ performance in the study. The first test was based on the status of the students which was determined based on the number of passed and failed students. The result shows that 66.8% passed and 33.2% failed and based on the principle of decision trees it shows that the percentage of those who passed is higher and therefore the new consideration is the passed node (that is why the next decision tree node is under the passed node). The next factor for consideration is the gender (Male, Female) and based on the principle of decision tree structure the gender division shows that 55.10% of the male students are predicted to pass while 59.03% of the female is predicted in the predictive analysis. Therefore this shows that the study is showing that more female students are predicted to do better in the course than the male students.
Table 3. Gain Summary for Nodes
Node N Percent Mean
4 42 19.9% 65.52
3 99 46.9% 60.81
2 70 33.2% 31.80
Growing Method: CHAID, Dependent Variable: SCORES Table 3 shows the summary of the gain for the nodes in
the predictive decision tree structures. It shows that node tree has a higher gain than the other nodes at 46.9% which is an indication of the level of influence of the third note factor on the predictive analysis of the students‟ performance. The network diagram that SPSS used to predict course outcome (success=0, success=1) from 4 online student activities, is shown in Figure 3. The diagram shows the 4 input nodes, the 3 hidden nodes and the two output nodes representing failure and success categories.
Figure 4. network Diagram Figure 4 shows box plots of predicted pseudo-probabilities. For the dependent variable course outcome, the chart displays box plots that classify the predicted pseudo-probabilities based on the whole dataset [15]. For each box plot, the values above 0.5 show correct predictions. Figure 5. Predicted-by-observed chart

International Research Journal of Engineering and Technology (IRJET) e-ISSN: 2395 -0056
Volume: 03 Issue: 12 | Dec -2016 www.irjet.net p-ISSN: 2395-0072
© 2016, IRJET | Impact Factor value: 4.45 | ISO 9001:2008 Certified Journal | Page 960
The first, from the left, bloxplot shows the predicted probability of the observed failed students to be in the failure category. The second boxplot shows, the probability for a student to be classified in failure category although he really was in success category. The third boxplot shows, for outcomes that have observed category success, the predicted probability of category failure. The right boxplot shows, the probability a student who really succeeded to be classified in the success category.
The ROC curve is a diagram of sensitivity versus specificity that shows the classification performance for all possible cutoffs. Figure 5 gives the sensitivity and specificity (= 1 − false positive rate) chart, based on the combined training and testing samples. The 45-degree line from the upper right corner of the chart to the lower left represents the scenario of randomly guessing the class. The more the curve moves away the 45-degree baseline, the more accurate is the classification. Figure 6. ROC curve
. Figure 6 gives the area under the ROC curve. The area value shows that, if a student from the success category and a student from the failure category are randomly selected, there is 0.989 probability that the model-predicted pseudo-probability for the first student of being in the success category, is higher than the model-predicted pseudo-probability for the second student of being in the success category. Figure 7. Area under the curve. Figure 7 gives the impact of each independent variable in the ANN model in terms of relative and normalized importance. Chart in Figure 9 also depicts the importance
of the variables, i.e how sensitive is the model is the change of each input variable.
Figure 8. Independent variable importance.
From the chart is apparent that variables related to student's engagement with peers and instructor (messages) and collaborative creation of new content (ccc), have the greatest effect on how the network classifies students, in terms of course outcomes. Supporting self directed learning by means such as online quizzes (quiz efforts) is also a major determinant of model predictive power, by far more important than the engagement with the online course modules, as expressed by files viewed.
6. CONCLUSION
The aim of this research was to determine the effectiveness of artificial neural networks in predicting student achievement, based on data collected from students' online activities in Web-based blended learning courses. The literature review indicated that neural networks outperform all other classifiers, regarding prediction accuracy. A neural network was trained by decision tree learning, to predict students ability to successfully pass the course. The classification accuracy rate was very high, with 98.5% accuracy in classifying the students into the predicted success and failure categories. The results also showed that the most powerful predictors of course outcome were the numbers of messages posted by the students and the contributions they made in team content creation projects. Although future work will need to validate these findings in larger and more diverse samples, there is strong evidence that the proposed model

International Research Journal of Engineering and Technology (IRJET) e-ISSN: 2395 -0056
Volume: 03 Issue: 12 | Dec -2016 www.irjet.net p-ISSN: 2395-0072
© 2016, IRJET | Impact Factor value: 4.45 | ISO 9001:2008 Certified Journal | Page 961
can be used effectively to predict student course achievement and help instructor to design timely interventions that increase the possibility of success. REFERENCES
[3] Macfadyen, L. P., & Dawson, S. (2010). Mining LMS
data to develop an “early warning system” for educators: A proof of concept. Computers & Education, 54(2), 588–599.
[4] Zacharis, N. Z. (2015). A multivariate approach to predicting student outcomes in web-enabled blended learning courses. Internet and Higher Education, 27, 44–53.
[5] Strang, D. K. (2016). Can online student performance be forecasted by learning analytics? International Journal of Technology Enhanced Learning, 8(1), 26-47.
[6] Sabourin, J., Rowe, J., Mott, B., Lester, J. (2011). When Off-Task in On-Task: The Affective Role of Off-Task Behavior in Narrative-Centered Learning Environments. Proceedings of the 15th International Conference on Artificial Intelligence in Education, 534-536.
[7] Baker, R.S.J.d., Yacef, K. (2009). The State of Educational Data Mining in 2009: A Review and Future Visions. Journal of Educational Data Mining, 1(1), 3-17.
[8] Lykourentzou, I., Giannoukos, I., Mpardis, G., Nikolopoulos, V. and Loumos, V. (2009), Early and dynamic student achievement prediction in e-learning courses using neural networks. J. Am. Soc. Inf. Sci., 60: 372–380. doi: 10.1002/asi.20970
[9] Paliwal, M., & Kumar, U. A. (2009). A study of academic performance of business school graduates using neural network and statistical techniques. Expert Systems with Applications, 36(4), 7865–7872.
[10] Jayne C, Lanitis A, Christodoulou C (2011). Neural network methods for one-to-many multi-valued mapping problems. Neural Comput Appl 20(6):775–785
[11] Kanakana, G.M., Olanrewaju, A.O. (2011). Predicting student performance in engineering education using an artificial neural network at Tshwane university of technology. Proceedings of the International Conference on Industrial Engineering, Systems Engineering and Engineering Management for Sustainable Global Development, Stellenbosch, South Africa, pp. 1–7.
[12] Shahiri, A.M., Husain, W., Rashid, A.N. (2015). A review on predicting student's performance using data mining techniques. Procedia Computer Science, 72, 414-422.
[13] McClelland, J.L., Rumelhart, D.E., and Hinton, G.E. (1986). The appeal of parallel distributed processing,
in Parallel Distributed Processing: Explorations in the Microstructure of Cognition - Foundations, Vol.1, MIT Press, Cambridge, pp.3-44.
[14] Leverington, D. (2009). A Basic Introduction to Feedforward Backpropagation Neural Networks. http://www.webpages.ttu.edu/dleverin/neural_network/neural_networks.html
[15] Rojas Raúl (1996). Neural Networks: A Systematic Introduction, Springer-Verlag, Berlin, New-York.
[16] Marwala, T. (2010). Finite Element Model Updating Using Computational Intelligence Techniques: Applications to Structural Dynamics, Springer Publishing Company, Inc .
[17] IBM (2016). Knowledge Center. http://goo.gl/SuuMHu
[16] Møller, M.F., 1993. A scaled conjugate gradient algorithm for fast supervised learning.
BIOGRAPHIES
R.Ruhin Kouser is working as an
Asst. Professor in the Department of
CSE in Kingston Engineering College,
Vellore-TamilNadu.
J. Daphney Joann is working as an Asst. Professor in the Department of CSE in Kingston Engineering College, Vellore-TamilNadu. She is currently pursuing her PHD in Anna University.Her research interests are in the areas of Web Technology,
Wireless Networks &Network Security. She is the life member of ISTE, New Delhi, India and member in IAENG
K.Suganya is working as an Asst. Professor in the Department of CSE in Kingston Engineering College, Vellore-TamilNadu