
Forecasting Part II
10
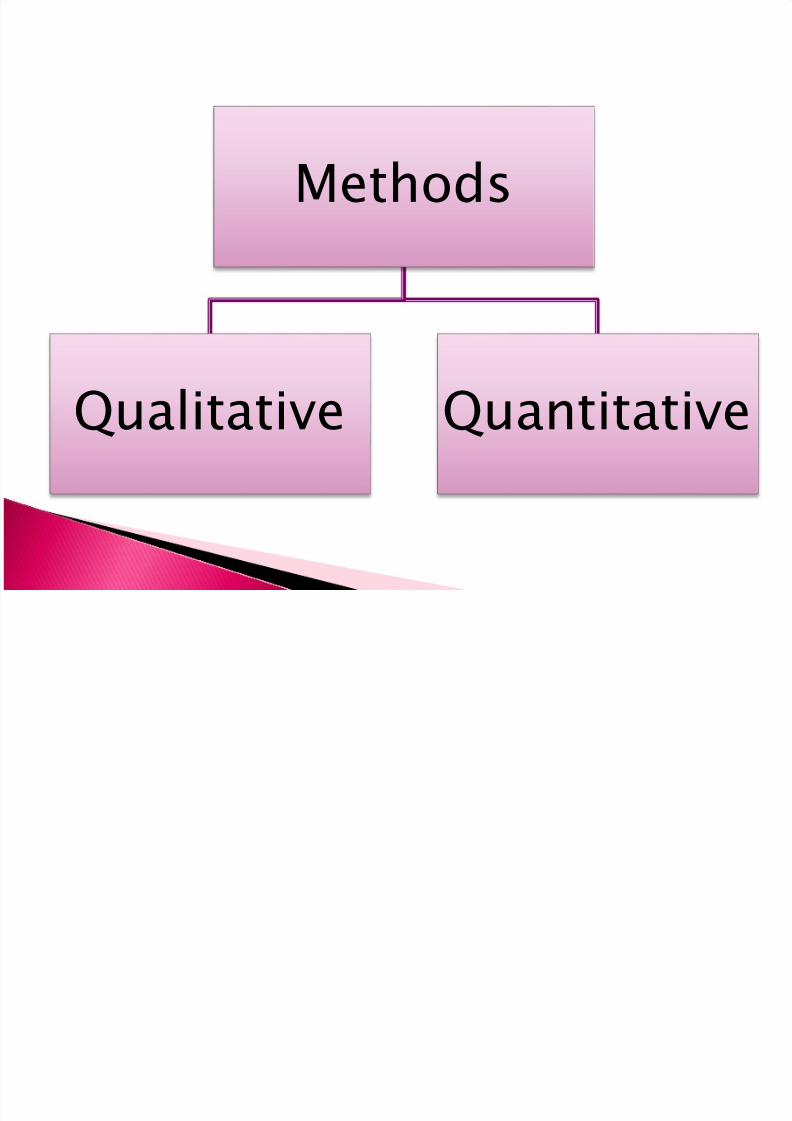
Methods Qualitative Quantitative
Transcript of Forecasting Part II
8/3/2019 Forecasting Part II
http://slidepdf.com/reader/full/forecasting-part-ii 1/10
Methods
Qualitative Quantitative

8/3/2019 Forecasting Part II
http://slidepdf.com/reader/full/forecasting-part-ii 2/10
Genius forecasting
This method is based on a combination of intuition, insight,
and luck. Psychics and crystal ball readers are the most extreme case of
genius forecasting.
Their forecasts are based exclusively on intuition
The weakness in genius forecasting is that its impossible to
recognize a good forecast until the forecast has come to pass.

8/3/2019 Forecasting Part II
http://slidepdf.com/reader/full/forecasting-part-ii 3/10
Trend extrapolation These methods examine trends and cycles in historical data, and
then use mathematical techniques to extrapolate to the future. The assumption of all these techniques is that the forces
responsible for creating the past, will continue to operate in thefuture.
This is often a valid assumption when forecasting short termhorizons, but it falls short when creating medium and long termforecasts
The stability of the environment is the key factor in determiningwhether trend extrapolation is an appropriate forecasting model
The concept of "developmental inertia" embodies the idea thatsome items are more easily changed than others
Clothing styles is an example of an area that contains littleinertia. It is difficult to produce reliable mathematical forecasts
for clothing

8/3/2019 Forecasting Part II
http://slidepdf.com/reader/full/forecasting-part-ii 4/10
Consensus methods Forecasting complex systems often involves seeking expert
opinions from more than one person.Each is an expert in his own discipline, and it is through the
synthesis of these opinions that a final forecast is obtained.
One method of arriving at a consensus forecast would be toput all the experts in a room and let them "argue it out".
This method falls short because the situation is often
controlled by those individuals that have the best group
interaction and persuasion skills.

8/3/2019 Forecasting Part II
http://slidepdf.com/reader/full/forecasting-part-ii 5/10
Cross-impact matrix method Relationships often exist between events and developments that are not
revealed by univariate forecasting techniques The cross-impact matrix method recognizes that the occurrence of an
event can, in turn, effect the likelihoods of other events
Probabilities are assigned to reflect the likelihood of an event in the
presence and absence of other events The resultant inter-correlational structure can be used to examine the
relationships of the components to each other, and within the overall
system.
The advantage of this technique is that it forces forecasters and policy- makers to look at the relationships between system components, rather
than viewing any variable as working independently of the others.

8/3/2019 Forecasting Part II
http://slidepdf.com/reader/full/forecasting-part-ii 6/10
Delphi Technique The Delphi Technique was originally conceived as a
way to obtain the opinion of experts withoutnecessarily bringing them together face to face.
The Delphi begins with the initial development of aquestionnaire focusing on the identified problem.
An appropriate respondent group is selected, then thequestionnaire is mailed to them.
Each participant answers the questionnaireindependently and returns it.
The initiators of the questionnaire summarizeresponses, then develop a feedback summary and asecond questionnaire for the same respondent group.
After reviewing the feedback summary, respondentsindependently rate priority ideas included in thesecond questionnaire, then mail back the responses.
The process is repeated until investigators feelpositions are firm and agreement on a topic is reached.
A final summary report is issued to the respondentgroup. the Delphi can be modified in many ways.

8/3/2019 Forecasting Part II
http://slidepdf.com/reader/full/forecasting-part-ii 7/10
Some companies use as a forecast sourcesalespeople who have continual contacts with customers.
They believe that the salespeople who are
closest to the ultimate customers may have significant insights regarding thestate of the future market.
Forecasts based on sales force may be
used to modify other quantitative and/or qualitative forecasts that have been generated internally in the company.

8/3/2019 Forecasting Part II
http://slidepdf.com/reader/full/forecasting-part-ii 8/10
Advantages
It is simple to use and understand.
It uses the specialized knowledge of those closest to
the action. It can place responsibility for attaining the forecast
in the hands of those who most affect the actual
results.
The information can be broken down easily by
territory, product, customer, or salesperson.

8/3/2019 Forecasting Part II
http://slidepdf.com/reader/full/forecasting-part-ii 9/10
The disadvantages include: salespeople’s being overly optimistic or pessimisticregarding their predictions and inaccuracies due to broader economic events that are largely beyond their control.

8/3/2019 Forecasting Part II
http://slidepdf.com/reader/full/forecasting-part-ii 10/10
Consumer Surveys Some companies conduct their own
market surveys regarding specificconsumer purchases.
Surveys may consist of telephone
contacts, personal interviews, orquestionnaires as a means of obtainingdata.
Extensive statistical analysis usually is
applied to survey results in order to testhypotheses regarding consumer behavior.