Risk & Uncertainity Khan and its comparison between its competitors
Upload
mko091946sedCategory
view
19download
2
Air Transport Market Forecastingin Dynamic Market Environment
Air Transport Market Forecastingin Dynamic Market Environmentwith Uncertain Data
C O N F I D E N T I A L | www.mkm.de
in Dynamic Market Environmentwith Uncertain Data
System Approach (x-via, SONAR) ® MKmetric 1992
Dr. Benedikt MandelKarlsruhe, 28.02.2011
with Uncertain Data
System Approach (x-via, SONAR) ® MKmetric 1992 Dr. Benedikt MandelCracow, 10-11.03.2011

Agenda
�MKmetric
�Methodology
�Application x-via web
�Applikation SONAR
11st Polish Regional Airport Association Conference, Cracow 10-11.03.2011
�Examples from former MKmetric studies
�Results of network simulations for Airport Poznań (POZ)

MKmetricCompany profile
� MKmetric was founded 1993 as spin-off of the Karlsruhe Institute of Technology based on the idea to apply science. The organisation is an independent institute.
� Special fields of business:- air transport analysis and forecasting,- simulation of strategic, tactical and political decisions in air transport,- transport systems consulting,- provision of software systems for transport forecasting and strategic analysis,- provision of online solutions and tools for tactical air transport system analysis,- development of web applications.
� Experience: 20 years research, 17 years transport consulting.
21st Polish Regional Airport Association Conference, Cracow 10-11.03.2011
� Experience: 20 years research, 17 years transport consulting.
� Special fields of scientific interest are the development and application of: - level & discrete choice algorithms, - OR routines for process optimisation, - programs to encounter system interdependencies.
� Major qualification: - data and data gap handling,- multimodal demand & supply modelling, - analysis & simulation as well as - the development & test of policy instruments and forecasts,- design, programming and establishment of related software and - assignment of tailor made hardware components.

MKmetricProject References / Clients
� Know how in EC Framework Program work (DG TREN):STEMM, BRIDGES, ASSEMBLING, Spotlights, TEN PAN, Forecast 2020, APRON, STAC, ETIS-Base, -Agent, -Link, ETISplus, Worldnet - global air cargo, Toolqit, Interconnect;i.g. responsible for data/network/models/analysis/forecast/scenarios, pax (all modes), air cargo
� Know how in Interreg Program work (DG Regio): SEABIRD (Baltic Sea), SEAPLANE (North Sea), EUROPLANE (CEE) - air transport market potential and route potential forecast and EC policy issues.
� Air transport market potential and route potential analyses and forecasts for several airports (hubs, intl. network, regional), airlines (network, regional, charter, LCC) in 20 European countries (since 1993)
� Numerous projects for railway operators (high speed, airport connectivity, line service, track),
31st Polish Regional Airport Association Conference, Cracow 10-11.03.2011
� Numerous projects for railway operators (high speed, airport connectivity, line service, track), consultancies (assistance, data) and universities (research, data) as well as Ministries of Transport(national, federal) and regional authorities
� Active as: Project-Coordinator, WP-leader, Task-leader and Trustee.
� Air transport projects in Poland:
- Airport Poznań > Route potential forecast ex-post (2005), update with scenarios (2007/2008)- Airport Łódź > Route potential forecast ex-post (2008)- LOT Polish Airlines > Route potential forecast ex-post for Warsaw
Task 1 (2007-2008) forecast split for PLL LOT and CENTRALWINGS
- Ministry of Infrastructure > Analyses of the Polish air transport system with scenarios (2009/2010)Forecast all airports 2015, 2025, 2035 with simulation of 18 scenarios
For further details please visit our web site: www.mkm.de

Agenda
�MKmetric
�Method
�Application x-via web
�Application SONAR
41st Polish Regional Airport Association Conference, Cracow 10-11.03.2011
�Examples from former MKmetric studies
�Results of network simulations for Airport Poznań (POZ)

MethodThe situation of the travellers and their behaviour are the main issue.
Car, train or plane?STR, FRA or MUC?Departure, when?By Metro to Airport
or ...?
Trip yes or no?Where to?
Which modality?What carrier?
When?
51st Polish Regional Airport Association Conference, Cracow 10-11.03.2011
Transparency taken from the presentation: „Data for network planing in air transport“;IVT-Seminar; Dr. Karl Echtermeyer; DLH AGJune 2000; ETH Zürich
decision

MethodData background - IATA Strategy Symposium 2010
61st Polish Regional Airport Association Conference, Cracow 10-11.03.2011
!�

MethodPoor data supply background - SITA Trends Survey 2010 (Airline IT)
� Today 40,8 % of tickets are direct sales from the airline to the traveller. Thereof- 25,8% by internet- 10,7% by call centre- 4,3% by interlining
� In 2013 the following targets are envisaged:- 55,1% direct sales whereby - 33,9% are by internet but - call centre and interlining remains stable
� Increasing activities by airlines using ‘Smartphones’ features in 2013 for- ticket sales - 70% of all airlines / 85% of the big airlines (today)- flight status information - 86%
All activities
listed will
reduce
within
2 years
further the
sample size,
71st Polish Regional Airport Association Conference, Cracow 10-11.03.2011
- flight status information - 86%- mobile online check-in - 80% (today 28%)- mobile electronic boarding pass - 76%- travel offers - 68%
� Increasing self service up to 2013- agent check-in reducing from today 50,7% to 28,9%- kiosk check-in remains stable at 20%- kiosk ticket sales - 80%- more kiosks - 47%
� Introduction of booking portals by airlines up to 2013- for travel agencies - 84% (today 41%)- for business clients - 82% (today 44%) - social networking functions - 55% (today 21%)
sample size,
coverage
and quality
of the
database
used by
classical
forecast
models!

Classic air transport forecast
Trend
MethodData background
Air transport market informationMarketing Information Data Tapes / Billing and Settlement Process
100%
50%
Ticket / Coupon data
Why?- direct sales, e.g. internet
- cost reduction- consolidators- GDS (Global Distribution System*)
81st Polish Regional Airport Association Conference, Cracow 10-11.03.2011
Ticket/Coupon,Booking data
Up to 1995 Today
50%
Up to 1995 Today
Booking data
Size, type and structureof the market are well known.
Fragmented market, new products, type, structure, faster shock waves, global drivers, new sales structure, limited rights using airline ticket sales data.
* Global Distribution System, z.B. AMADEUS, GALILEO, SABRE, TRAVELPORT

MethodMarket dynamics and Data supply
� The market situation changed
- differentiation inside the airline world (network, charter, LCC, all business)
- consolidation by mergers and acquisitions (Lufthansa, BA & Iberia, AF & KLM, etc.)
- development of global airline alliances (North & South America, Gulf, Asia, Russia?)
- growing influence of Gulf Arab Airlines (huge aircraft orders)
- new aircraft types (A380, B787, A350, A320 neo, B797?, CS-Series …)
- new products on board (new classes, changes in fare structure, tariff decomposition)
- new markets (short trips, migrations, multiple leisure trips, VF&R trips)
� Stable markets are going unstable
- change of schedule faster (try & error)
- growing power of economic drivers (GDP, kerosene, bank crises)
91st Polish Regional Airport Association Conference, Cracow 10-11.03.2011
- growing power of economic drivers (GDP, kerosene, bank crises)
- global disease effects (SARS, bird flue)
- environmental catastrophes (volcano, hurricanes, earth quakes, flooding)
- regulations (taxes, emission trading, environmental fees)
� New links to the customer
- changing distribution channels (direct sales, GDS, non- GDS, Google -ITA)
- new customer behaviour (social media – Facebook, Twitter, YouTube)
� Changing competition
- between airlines, alliances on flight segments and routes, between airports (hub, spoke)
- with other modes (HSR, car, bus)
Trend based forecasts neither reflect the changes nor cope with the data leakage.

MethodData background for all MKmetric systems (VIA, SONAR, x-via web)
Consumer elasticity e.g.- airport surveys across Europe, - DE - KONTIV survey, mobility survey,- DK - national mobility survey,- CH - national travel survey,- EU - Dateline mobility survey, ...
Volume observations e.g.
- detailed Eurostat, national statistics(on flight, on stage)
- airport, airline publications, IATA samples,- associations of airports and airlines,- link counting for road- transport figures for rail, ...
101st Polish Regional Airport Association Conference, Cracow 10-11.03.2011
Mode networks e.g.
- air schedules (OAG, Cedion, ...),- information from the air transport industry,- surface networks (road, bus),- railway, ferry schedules ,- MKm extensions, ...
Regional attractors e.g.
- socio-economy (UN, IWF, OECD, EZB, ...),- satellite data (Corine aggregates), - tourist information- land use data, - meteorological data, ...

MethodThe point of view turns from the airport to the region as starting point of the trip decision. Therefore the traditional static view becomes a consumer oriented dynamic one.
Conventional / Traditional Modelling (Airport-Airport with fixed Isochrones)
111st Polish Regional Airport Association Conference, Cracow 10-11.03.2011
Enriched point of view (System approach: Region-Region via multiple Routes)

Air transport model
Method – MKmetric system approachMKmetric explains transport in a consistent way. No transport activity appears or vanishes unexplained.
Transport is embedded in its determinants
121st Polish Regional Airport Association Conference, Cracow 10-11.03.2011
Model layers
Determinants
Scenarios

• MultimodalityFor a trip from Poznan to Brussels use- the plane- the train- the private car or a coach
• IntermodalityFor a trip from Poznan to Brussels by air starting from an airport in Berlin - and use the train to Berlin Zoo (+ Bus)
Forms of modality*
Multi-modality
Multi-modality
Method – MKmetric system approachWhich modality? - Which mode? - Which route?
Types of modality
131st Polish Regional Airport Association Conference, Cracow 10-11.03.2011
- and use the train to Berlin Zoo (+ Bus)- the private car to Berlin-Tegel
• IntramodalityFor a trip from Poznan to Brussels usethe plane either on the route - POZ - FRA - BRU or- POZ - WAW - BRU or- WAW - BRU or- THF - BRU or ...
MKmetric
Inter-modality
Inter-modality
Intra-modality
Intra-modality

Method – MKmetric system approach APC Bielefeld - Hong Kong (business)
141st Polish Regional Airport Association Conference, Cracow 10-11.03.2011
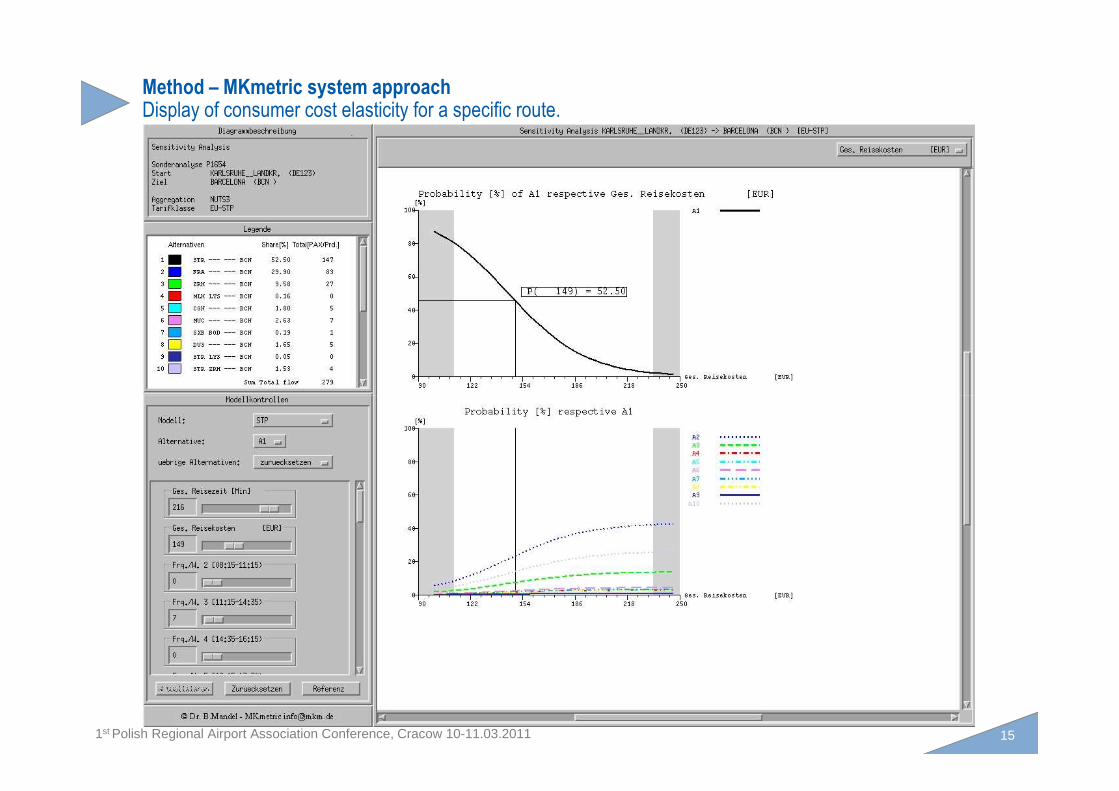
Method – MKmetric system approach Display of consumer cost elasticity for a specific route.
151st Polish Regional Airport Association Conference, Cracow 10-11.03.2011
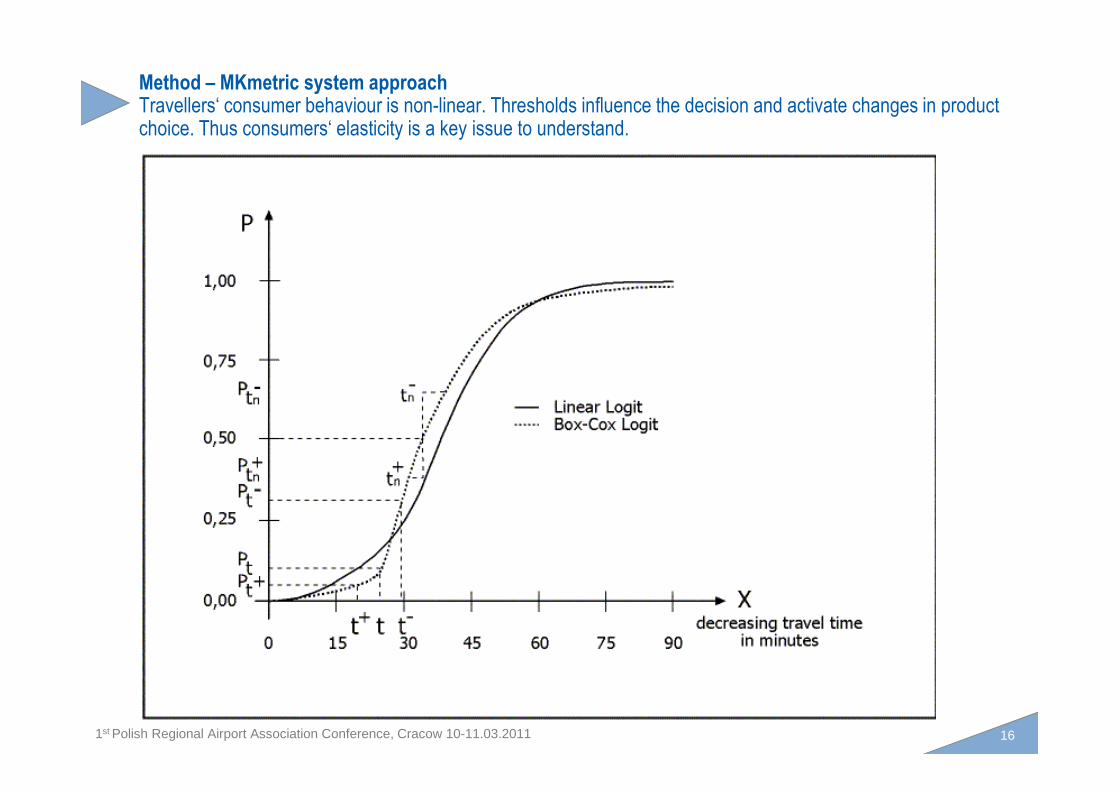
Method – MKmetric system approach Travellers‘ consumer behaviour is non-linear. Thresholds influence the decision and activate changes in product choice. Thus consumers‘ elasticity is a key issue to understand.
161st Polish Regional Airport Association Conference, Cracow 10-11.03.2011

Method – MKmetric system approach Travellers‘ consumer behaviour is non-linear. Thresholds influence the decision and activate changes in product choice. Thus consumers‘ elasticity is a key issue to understand.
i, j∈Cn
Logit
−
=)ln(
)1(: )(
x
xx k
k λλλ
0
0
=≠
k
k
λλ
∑=
j jnUinU
nP(i)
171st Polish Regional Airport Association Conference, Cracow 10-11.03.2011
Cross elasticity
Point elasticityCeteris paribus variation of the demand for alternative i by a 1% change of the characteristic value of alternative i.
Ceteris paribus variation of the demand for alternative j by a 1% change of the characteristic value of alternative i.
nP(i)kinx
kinxnP(i)
)kinx,n(P(i)∂∂=η
nP(i)
kjnx
kjnxnP(i)
)kjnx,n(P(i)∂∂=η

Method – MKmetric system approach - ExcursusThe price elasticity diversified by markets in the year 1991.
20%
40%
40%
60%
80%
60%
80%
100%
Change o
f pass
enger
dem
and
Hamburg 1991 Hamburg 1991Hamburg 1991
Vacation VacationVacation
Europe IntercontinentalDomestic
Travel market (Hamburg base year 1991) – research results from 1992/93
World-wide first scientific explanation for LCC- success
181st Polish Regional Airport Association Conference, Cracow 10-11.03.2011
-80%
-60%
-40%
-20%
0%
-100 -50 0 50 100 150 200
-80%
-60%
-40%
-20%
0%
20%
-100 -50 0 50 100 150 200
-80%
-60%
-40%
-20%
0%
20%
40%
-100 -50 0 50 100 150 200
Price variation per passenger in DM
Change o
f pass
enger
dem
and
Private
Business
Private
Business
Private
Business
Price

Generation/distribution
Modal split total sum of utilities over all modes
Method – MKmetric system approach Linking the model steps by a quasi-direct format (QDF) in the forecasting system
Each change in one layer of the econometric model will be re-calculated and considered in the next layer.
191st Polish Regional Airport Association Conference, Cracow 10-11.03.2011
Airport choice
Access/egress choicetotal sum of utilities over all modes
total sum of utilities over all alternatives
Slot choicetotal sum of utilities over all alternatives
Logical sequence but computed in reverse order
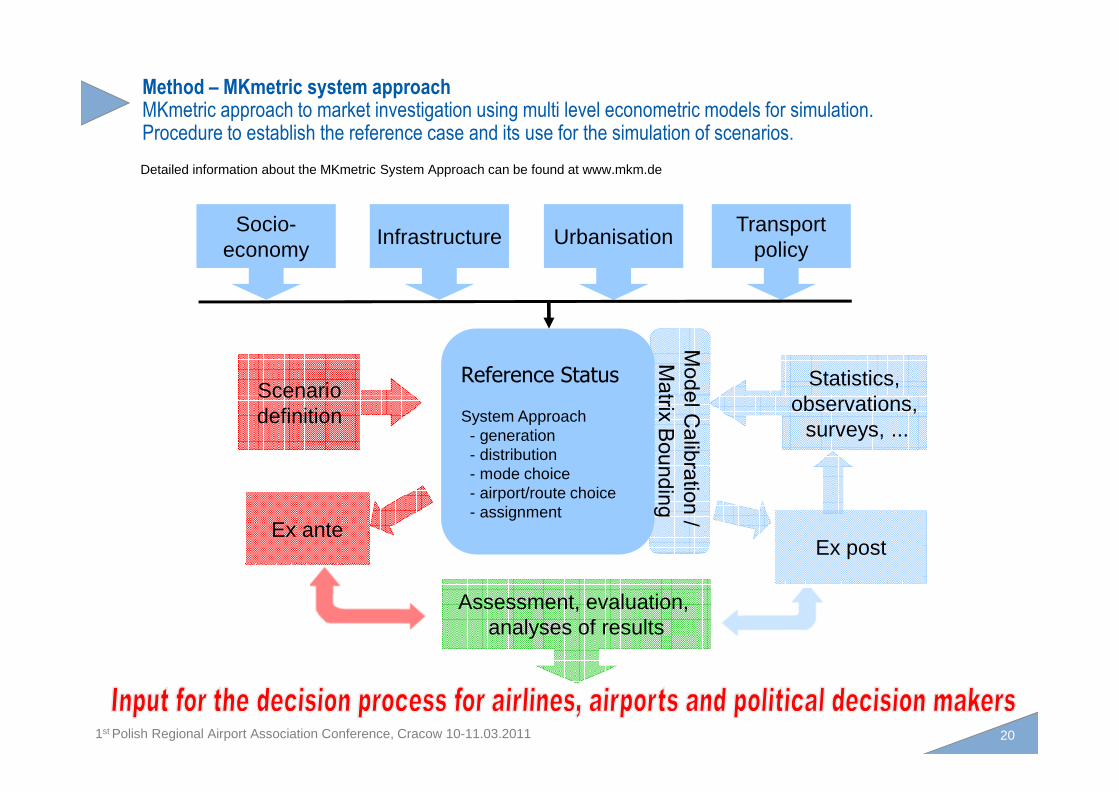
Method – MKmetric system approach MKmetric approach to market investigation using multi level econometric models for simulation.Procedure to establish the reference case and its use for the simulation of scenarios.
Detailed information about the MKmetric System Approach can be found at www.mkm.de
Socio-economy
Infrastructure Urbanisation
Reference Status Statistics,observations,
Transportpolicy
Scenario
201st Polish Regional Airport Association Conference, Cracow 10-11.03.2011
System Approach- generation- distribution- mode choice- airport/route choice- assignment
observations,surveys, ...
Assessment, evaluation, analyses of results
Ex postEx ante
Scenariodefinition

Method – MKmetric system approach Iterative calibration process.
Distribution
Generation
Modal split
Matrix evaluation
Mode choice assessment
Base statistic evaluation
Matrix Bounding
Model / Input adjustment
211st Polish Regional Airport Association Conference, Cracow 10-11.03.2011
Route choice
Assignment Link load assessment
Airport / Route choice Assessment
Statistic evaluation
The calibration is an iterative process where data from various sources and model results are assessed to detect irregularities, inconsistencies and errors. The arrows symbolise the principle process flow but due to the complexity the recursive parts and their nesting can not be displayed.

Generation of traffic:
�Socio-economic framework data (e.g. population, structure, GDP)
�Political decisions (e.g. taxes, security, noise charges)
Distribution of traffic :
�Regional attractivities (e.g. type of region, temperature, sea, mountains)
�Political decisions (e.g. traffic rights, subsidies)
Mode choice:
�Network / Service characteristics (e.g. time, cost, frequency, transfer, operation days)
Method – MKmetric system approach Principle scenario types at the different model stages.
221st Polish Regional Airport Association Conference, Cracow 10-11.03.2011
�Network / Service characteristics (e.g. time, cost, frequency, transfer, operation days)
� Political decisions (e.g. „PSO“, infrastructure investments)
Airport / Route choice:
�Service-Structure (e.g. new route / closure, „MCT“, airline base, transfer node)
� Infrastructure (e.g. access / egress by surface modes, inter-modal routes)
Assignment:
� Infrastructure networks (e.g. new airports, new HSR services) and/or changes of network attributes (e.g. capacity, speed, charges, tolls, fees)
Please note that the examples may as well be applicable in other model stages.

Method – MKmetric system approach Excursus: Complexity and coverage.
Regions:
�Europe on NUTS 3 level
�World (aggregates of administrative units)
Relations:
�Region to Region demand matrix
�About 1900 x 1900 relationships
Airports:
�Europe – all scheduled services (e.g. delivered by OAG, HAFAS, web sites, own research)
�World - representative airports with scheduled services for all world regions
231st Polish Regional Airport Association Conference, Cracow 10-11.03.2011
�World - representative airports with scheduled services for all world regions
Surface modes (Feeders / Competitors):
�Road - network ca. 2,8 Mio. links, up to county road level
�Rail – whole network with real Europe-wide schedule data
Alternatives:
� Intercontinental destinations represented by 16 alternatives per relation
�European destinations represented by 10 alternatives per relation
�National destinations represented by 7 alternatives per relation
Trip purposes:
�business
�non-business (private u. vacation trips)

Agenda
�MKmetric
�Method
�MKmetric applications SONAR, x-via web
�Application x-via web
241st Polish Regional Airport Association Conference, Cracow 10-11.03.2011
�Application SONAR
�Examples from former MKmetric studies
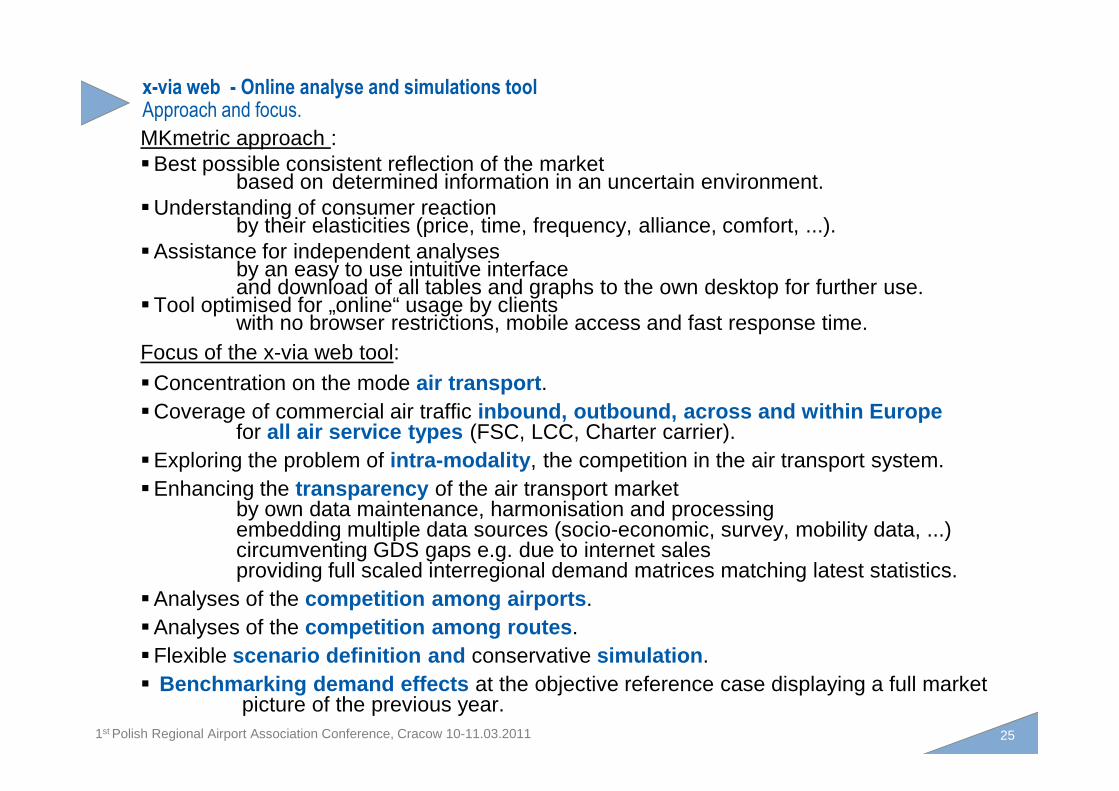
x-via web - Online analyse and simulations tool Approach and focus.
MKmetric approach :�Best possible consistent reflection of the market
based on determined information in an uncertain environment.�Understanding of consumer reaction
by their elasticities (price, time, frequency, alliance, comfort, ...).�Assistance for independent analyses
by an easy to use intuitive interfaceand download of all tables and graphs to the own desktop for further use.
�Tool optimised for „online“ usage by clients with no browser restrictions, mobile access and fast response time.
Focus of the x-via web tool: �Concentration on the mode air transport.
251st Polish Regional Airport Association Conference, Cracow 10-11.03.2011
�Coverage of commercial air traffic inbound, outbound, across and within Europe for all air service types (FSC, LCC, Charter carrier).
�Exploring the problem of intra-modality, the competition in the air transport system.�Enhancing the transparency of the air transport market
by own data maintenance, harmonisation and processing embedding multiple data sources (socio-economic, survey, mobility data, ...)circumventing GDS gaps e.g. due to internet salesproviding full scaled interregional demand matrices matching latest statistics.
�Analyses of the competition among airports.�Analyses of the competition among routes.�Flexible scenario definition and conservative simulation.� Benchmarking demand effects at the objective reference case displaying a full market
picture of the previous year.
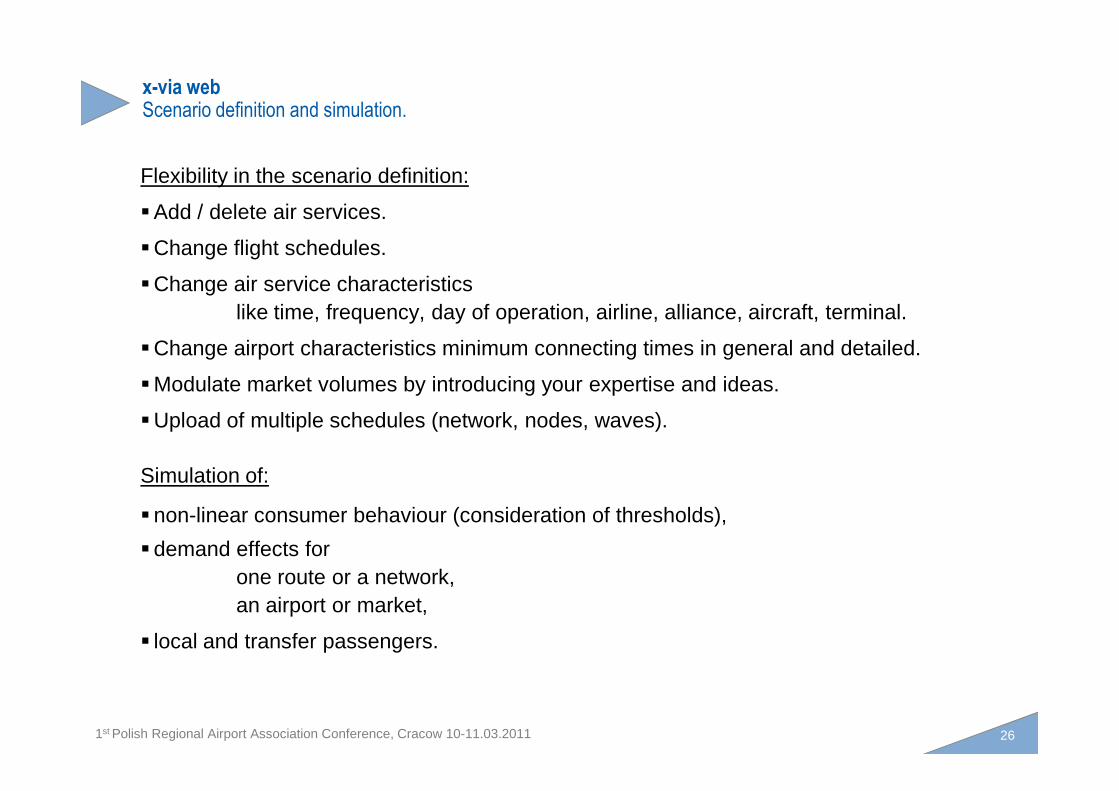
x-via webScenario definition and simulation.
Flexibility in the scenario definition:
�Add / delete air services.
�Change flight schedules.
�Change air service characteristics like time, frequency, day of operation, airline, alliance, aircraft, terminal.
�Change airport characteristics minimum connecting times in general and detailed.
�Modulate market volumes by introducing your expertise and ideas.
261st Polish Regional Airport Association Conference, Cracow 10-11.03.2011
�Modulate market volumes by introducing your expertise and ideas.
�Upload of multiple schedules (network, nodes, waves).
Simulation of:
�non-linear consumer behaviour (consideration of thresholds),
�demand effects for one route or a network,an airport or market,
� local and transfer passengers.

x-via webThe tool allows analyses out of three different point of view; the airport, the region and the route (airline).
Region:
�Airport / Route choice of the traveller by route and trip purpose.
�Diffusion diagram of competing airports.
�Accessibility of regions.
Airport:
�Catchment of the airport or a route for OD and transfer travellers.
�Proportional distribution of the demand in space.
�Airlines and air services at an airport.
271st Polish Regional Airport Association Conference, Cracow 10-11.03.2011
�Airlines and air services at an airport.
Route:
�Demand by routes at an airport (Spider).
�Feeder-Information of a flight segment (Sheaf).
�Top transfer destinations.
Data coverage:�Analyses available for all European airports with commercial traffic and regions.

x-via webRequirements of the tool usage.
Technical standard: - Internet access,- Browser - Firefox >=1.5 or Internet Explorer 6+- or Opera mobile with UMTS.
Cooperation between client and customer to benefit the further tool development: - analyses types, simulation types,- tool-handling, format,- content of working processes and / or standard reports, „story“,
281st Polish Regional Airport Association Conference, Cracow 10-11.03.2011
- content of working processes and / or standard reports, „story“,- statistics, airport surveys,- response about errors and difficulties.
Availability:- 365 days 24 hours, except maintenance time and “Force majeure”,- assistance during the general working hours, exclusive vacation time.

Agenda
�MKmetric
�Method
�Application x-via web
�Application SONAR
291st Polish Regional Airport Association Conference, Cracow 10-11.03.2011
�Examples from former MKmetric studies
�Results of network simulations for Airport Poznań (POZ)
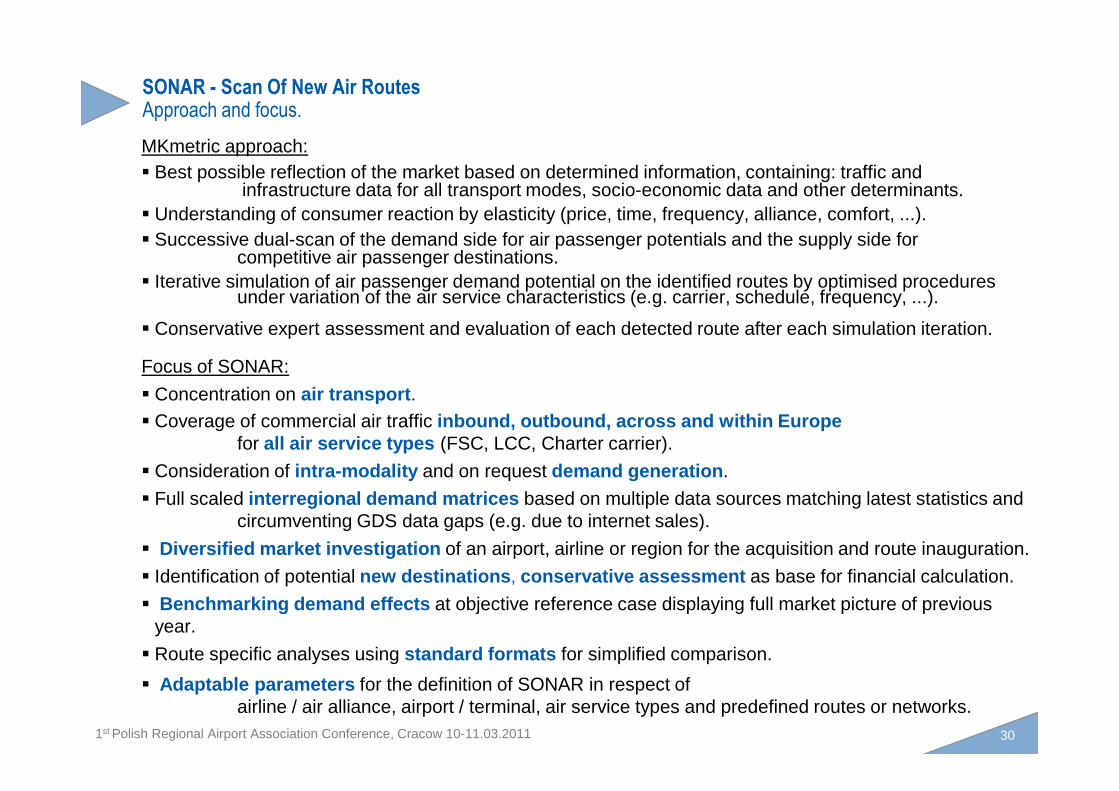
SONAR - Scan Of New Air RoutesApproach and focus.
MKmetric approach:� Best possible reflection of the market based on determined information, containing: traffic and
infrastructure data for all transport modes, socio-economic data and other determinants.� Understanding of consumer reaction by elasticity (price, time, frequency, alliance, comfort, ...).� Successive dual-scan of the demand side for air passenger potentials and the supply side for
competitive air passenger destinations.� Iterative simulation of air passenger demand potential on the identified routes by optimised procedures
under variation of the air service characteristics (e.g. carrier, schedule, frequency, ...).
� Conservative expert assessment and evaluation of each detected route after each simulation iteration.
Focus of SONAR:
� Concentration on air transport.
301st Polish Regional Airport Association Conference, Cracow 10-11.03.2011
� Concentration on air transport.� Coverage of commercial air traffic inbound, outbound, across and within Europe
for all air service types (FSC, LCC, Charter carrier).
� Consideration of intra-modality and on request demand generation.
� Full scaled interregional demand matrices based on multiple data sources matching latest statistics and circumventing GDS data gaps (e.g. due to internet sales).
� Diversified market investigation of an airport, airline or region for the acquisition and route inauguration.
� Identification of potential new destinations, conservative assessment as base for financial calculation.
� Benchmarking demand effects at objective reference case displaying full market picture of previous year.
� Route specific analyses using standard formats for simplified comparison.
� Adaptable parameters for the definition of SONAR in respect of airline / air alliance, airport / terminal, air service types and predefined routes or networks.
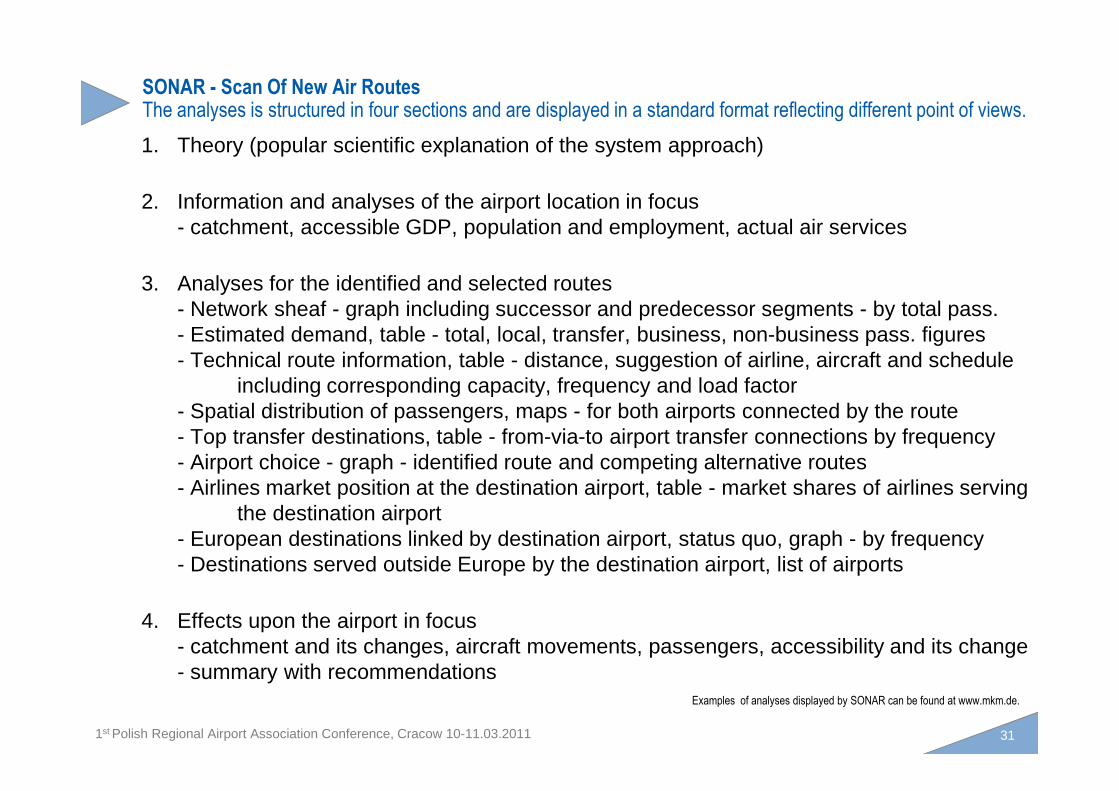
SONAR - Scan Of New Air Routes The analyses is structured in four sections and are displayed in a standard format reflecting different point of views.
1. Theory (popular scientific explanation of the system approach)
2. Information and analyses of the airport location in focus- catchment, accessible GDP, population and employment, actual air services
3. Analyses for the identified and selected routes- Network sheaf - graph including successor and predecessor segments - by total pass.- Estimated demand, table - total, local, transfer, business, non-business pass. figures- Technical route information, table - distance, suggestion of airline, aircraft and schedule
including corresponding capacity, frequency and load factor
311st Polish Regional Airport Association Conference, Cracow 10-11.03.2011
including corresponding capacity, frequency and load factor- Spatial distribution of passengers, maps - for both airports connected by the route - Top transfer destinations, table - from-via-to airport transfer connections by frequency- Airport choice - graph - identified route and competing alternative routes- Airlines market position at the destination airport, table - market shares of airlines serving
the destination airport- European destinations linked by destination airport, status quo, graph - by frequency- Destinations served outside Europe by the destination airport, list of airports
4. Effects upon the airport in focus- catchment and its changes, aircraft movements, passengers, accessibility and its change- summary with recommendations
Examples of analyses displayed by SONAR can be found at www.mkm.de.
�MKmetric
�Method
�Application x-via web
�Application SONAR
321st Polish Regional Airport Association Conference, Cracow 10-11.03.2011
�Examples from former MKmetric studies
�Results of network simulations for Airport Poznań (POZ)

Examples - MKmetric long term forecastSelected long term forecasts for small, medium and large airports (1993, 1995 and 2003 for the period up to 2010).
331st Polish Regional Airport Association Conference, Cracow 10-11.03.2011
Berlin Brandenburg International Airport,planned new airport, forecasted in 1993.
Hamburg Airport forecasted in 1995.
Frankfurt Airport forecasted in 2003.

Results network simulations for Airport Poznań (POZ)Example: Results of first route potential analysis for POZ (INTERREG project EUROPLANE 2004-2006)
341st Polish Regional Airport Association Conference, Cracow 10-11.03.2011
New route POZ-DUB
MKmetric forecast for 2006: = 61.208 pax
Airport statistics POZ-DUB (04 - 12.2006): = 55.853 pax (Aer Lingus 2x7, Ryanair 3x7)
Route POZ- DUB: Forecast from 2005 = Reality 2006!

Results network simulations for Airport Poznań (POZ)Example: Historic reference from MKmetric forecast for POZ (2006) – airport statistics
351st Polish Regional Airport Association Conference, Cracow 10-11.03.2011
1) Forecast for Barcelona BCN – scheduled Centralwings. Operation: “Barcelona” Girona - scheduled Centralwings.
2) Forecast for Paris CDG – scheduled Air France or LOT with code share Air France. Operation: “Paris” Beauvais - scheduled Centralwings.
3) Forecast for Rome FCO – scheduled AlItalia or Air One or LOT with code share Air One. Operation: Rome CIA - scheduled Centralwings.
R) Remark:
The charter destinations Antalya, Heraklion and Tenerife (Pax 49.453) in operation show in total the charter potential indicated by the MKm forecast of 51.163 pax for all charter destinations (see next slide with orig. forecast). If vacationists can just select 3 out of 7 destinations the demand concentrates to a certain extent on the services available.

Results network simulations for Airport Poznań (POZ)Example: Historic reference from MKmetric forecast for POZ (2006) – simulation results
361st Polish Regional Airport Association Conference, Cracow 10-11.03.2011

Examples - MKmetric route forecastSelected route forecasts for small, medium and large airports.
Final decision is with the airline.
371st Polish Regional Airport Association Conference, Cracow 10-11.03.2011
Late but finally achieved.

Examples - MKmetric route forecastSelected route forecasts for small, medium and large airports.
Suggested
by MKm in RouteForecast
Pax [p.a.]
Airline
suggested
Actually
inaugurated in
Pax 2009
[p.a.]
Airline
flying Remarks
2004 HAJ-RJK 10.000 Charter 2005 21.000 Tuifly
2004 OST-LPA 14.000 Charter 2007 16.000 Jetairfly
2004 OST-PMI 11.000 Charter 2007 16.000 Jetairfly
2004 SVG-TRD 69.000 Braathens 2005 65.000 SAS Partly stopover flights
2006 BRE-AGP 50.000 Air Berlin 2006 56.000 Ryanair
2006 BRE-ALC 42.000 Air Berlin 2007 33.000 Ryanair
2006 POZ-DUB 61.000 Ryanair 2007 56.000 Ryanair
2006 POZ-TFS 5.000 Charter 2007 5.000 Charter Stopped 2009, alternative e.g. HRG, ATY
381st Polish Regional Airport Association Conference, Cracow 10-11.03.2011
2007 GOA-MAD 47.000 Iberia 2008 39.000 Iberia Larger A/C and lower frequency as suggested
2007 MUC-BIO 100.000 Lufthansa 2008 140.000 Lufthansa Parallel service to OVD assumed (78000 forecast)
2007 MUC-SIN 103.000 Lufthansa 2008 114.000 Lufthansa
2007 MUC-TLL 48.000 Lufthansa 2008 57.000 Estonian
2007 POZ-EDI 61.000 Ryanair 2008 44.000 Ryanair Lower frequency, other competing UK routes
Suggested
by Mkm in RouteForecast
Pax [p.a.]
Airline
suggested
Actually
inaugurated
Pax 2009
[p.a.]
Airline
flying Remarks
2004 HAJ-CIA Air Berlin 2011 n.a. Germanwings will offer 976 seats on 4/7 frequency to FCO
2004 VXO-AGP 9.000 Charter 2011 n.a. Ryanair will offer 756 seats on 2/7 frequency to ALC
2006 BRE-OPO 32.000 dba 2011 n.a. Ryanair will offer 756 seats on 2/7 frequency
2007 MUC-TRD 39.000 Lufthansa 2011 n.a. Lufthansa will offer 432 seats on weekends
Late but finally achieved.

�MKmetric
�Method
�Application x-via web
�Application SONAR
391st Polish Regional Airport Association Conference, Cracow 10-11.03.2011
�Examples from former MKmetric studies
�Results of network simulations for Airport Poznań (POZ)

Results network simulations for Airport Poznań (POZ)Example: Scenario v.12 – New LO flights to AMS, BRU, CDG; BZG –WAW, shuttle BZG-POZ
401st Polish Regional Airport Association Conference, Cracow 10-11.03.2011

Results network simulations for Airport Poznań (POZ)Example: Scenario – Timetable for new LO flights (2xEMB175), BZG to WAW (LO), shuttle BZG-POZ
411st Polish Regional Airport Association Conference, Cracow 10-11.03.2011

Results network simulations for Airport Poznań (POZ)Example: Winners and losers, demand effects across the air services at POZ
421st Polish Regional Airport Association Conference, Cracow 10-11.03.2011

Results network simulations for Airport Poznań (POZ)Example: New destination AMS, O&D and transfer passengers
431st Polish Regional Airport Association Conference, Cracow 10-11.03.2011

Results network simulations for Airport Poznań (POZ)Example: New destination ZRH, O&D and transfer passengers
441st Polish Regional Airport Association Conference, Cracow 10-11.03.2011
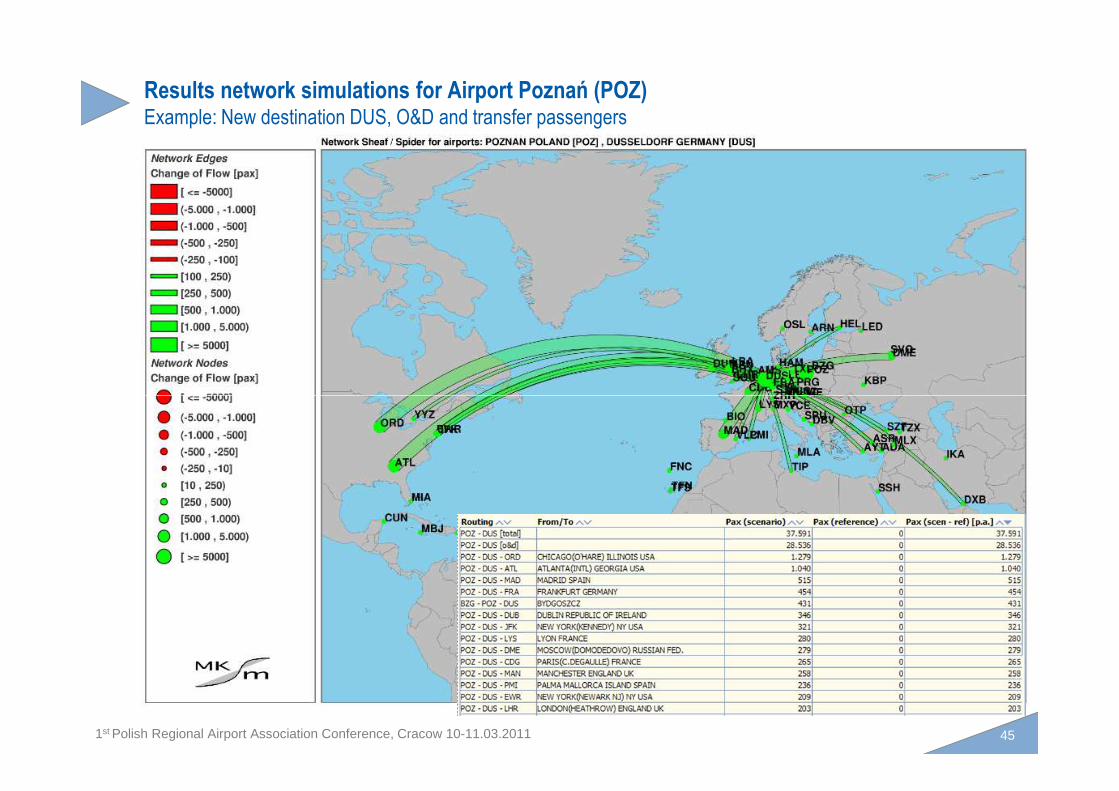
Results network simulations for Airport Poznań (POZ)Example: New destination DUS, O&D and transfer passengers
451st Polish Regional Airport Association Conference, Cracow 10-11.03.2011

Results network simulations for Airport Poznań (POZ)Example: Influence of new scenario for POZ on traffic in WAW
461st Polish Regional Airport Association Conference, Cracow 10-11.03.2011

Results network simulations for Airport Poznań (POZ)Example: Demand effects across the air services at WAW due to the POZ scenario
471st Polish Regional Airport Association Conference, Cracow 10-11.03.2011

Results network simulations for Airport Poznań (POZ)Example: Influence of new scenario for POZ on traffic in FRA
481st Polish Regional Airport Association Conference, Cracow 10-11.03.2011
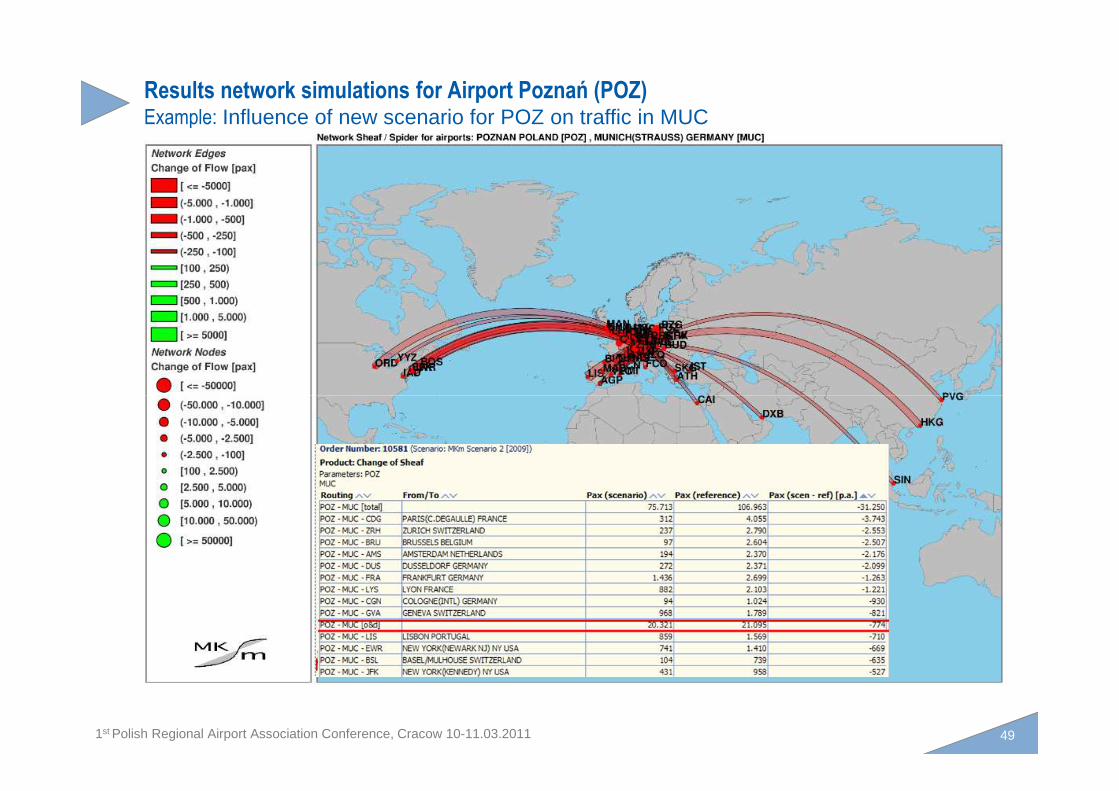
Results network simulations for Airport Poznań (POZ)Example: Influence of new scenario for POZ on traffic in MUC
491st Polish Regional Airport Association Conference, Cracow 10-11.03.2011

Results network simulations for Airport Poznań (POZ)Example:
501st Polish Regional Airport Association Conference, Cracow 10-11.03.2011

Results network simulations for Airport Poznań (POZ)Example:
511st Polish Regional Airport Association Conference, Cracow 10-11.03.2011

MKmetric Gesellschaft für Systemplanung mbH
www.mkm.de
521st Polish Regional Airport Association Conference, Cracow 10-11.03.2011
www.mkm.de