Forecasting employment based on business tendency survey ... fileForecasting employment based on...
15
Forecasting employment based on business tendency survey responses March 2017 19 T o forecast short-term variations in market-sector employment, economic analysts use both macroeconomic models and calibrations based on business tendency survey data. Using macroeconomic models for forecasting requires a scenario of activity in the market sectors and assumptions on the trend in apparent labour productivity, possibly adjusted for the effects of employment policies. However, these assumptions may be found to be inadequate in the event of a downturn. Calibrations assume a stable statistical relationship between measured employment and the responses of business leaders interviewed for the business tendency surveys. In the very short term, the results they give are often more accurate than the macroeconomic equations. Variations in employment can be forecast both at the level of all market-sector employment and for each of the four main sectors comprising it: industry, construction, temporary employment and the rest of the market tertiary sector. Aggregating results from the sectoral calibrations gives an “indirect” forecast of employment which is comparable in terms of accuracy to direct estimates of employment as a whole. Sectoral models also give a better understanding of the overall change in employment as a result of specific trends in each sector. Employment can follow very different trajectories from one sector to another and, depending on the quarter, this can make a small or large contribution to overall change. Of all the sectors, temporary employment stands out because although it represents only 4% of market employment, on its own it accounts for almost 40% of quarterly fluctuations. Calibrations also serve to gradually incorporate different types of information as they become available, first from the business tendency surveys, then from the first quantitative indicators, especially for temporary employment. As this information continues to be introduced, the accuracy of the forecasts is gradually improved. A new indicator, the “employment climate”, synthesises information on the change in workforce from the monthly business tendency surveys. It provides a satisfactory description of the short-term outlook for payroll employment. Compared to the business climate in France, it shows the less irregular profile of the short-term employment situation and the fact that employment reacts with a time lag to fluctuations in activity. In fact, the differences between business climate and employment climate provide a coherent picture of the apparent labour productivity cycle. For direct employment forecasts in the calibration models, this “employment climate” provides significant additional information. Vincent Dortet-Bernadet Morgane Glotain Département de la conjoncture
Transcript of Forecasting employment based on business tendency survey ... fileForecasting employment based on...

Forecasting employment basedon business tendency survey responses
March 2017 19
To forecast short-term variations in market-sector employment, economicanalysts use both macroeconomic models and calibrations based on business
tendency survey data.
Using macroeconomic models for forecasting requires a scenario of activity in themarket sectors and assumptions on the trend in apparent labour productivity,possibly adjusted for the effects of employment policies. However, theseassumptions may be found to be inadequate in the event of a downturn.
Calibrations assume a stable statistical relationship between measuredemployment and the responses of business leaders interviewed for the businesstendency surveys. In the very short term, the results they give are often moreaccurate than the macroeconomic equations. Variations in employment can beforecast both at the level of all market-sector employment and for each of the fourmain sectors comprising it: industry, construction, temporary employment and therest of the market tertiary sector. Aggregating results from the sectoral calibrationsgives an “indirect” forecast of employment which is comparable in terms ofaccuracy to direct estimates of employment as a whole.
Sectoral models also give a better understanding of the overall change inemployment as a result of specific trends in each sector. Employment can followvery different trajectories from one sector to another and, depending on thequarter, this can make a small or large contribution to overall change. Of all thesectors, temporary employment stands out because although it represents only 4%of market employment, on its own it accounts for almost 40% of quarterlyfluctuations. Calibrations also serve to gradually incorporate different types ofinformation as they become available, first from the business tendency surveys,then from the first quantitative indicators, especially for temporary employment. Asthis information continues to be introduced, the accuracy of the forecasts isgradually improved.
A new indicator, the “employment climate”, synthesises information on the changein workforce from the monthly business tendency surveys. It provides a satisfactorydescription of the short-term outlook for payroll employment. Compared to thebusiness climate in France, it shows the less irregular profile of the short-termemployment situation and the fact that employment reacts with a time lag tofluctuations in activity. In fact, the differences between business climate andemployment climate provide a coherent picture of the apparent labour productivitycycle. For direct employment forecasts in the calibration models, this “employmentclimate” provides significant additional information.
Vincent Dortet-BernadetMorgane Glotain
Département de laconjoncture

Forecasting employment basedon business tendency survey responses
About 45 days after the end of each quarter, INSEE publishes an early estimate (or“flash estimate”) of payroll employment in the non-farm market sectors (Box 1). Asecond estimate is published later, about 70 days after the end of the quarter.
Before these estimates become available, INSEE produces an employmentforecast for the current quarter with projections for the next one or two quarters foreach issue of Conjoncture in France (Table 1). Two complementary tools are usedto produce the employment forecast: first, macroeconomic equations whichmainly relate employment to activity, and second, calibrations using enterprises’responses in the business tendency surveys or early quantitative indicators.
Macroeconomic equations and calibrations,two complementary tools for the forecaster
Macroeconomic equationsrequire an activity scenario
and assumptions abouttrend variations in productivity
Short-term changes in payroll employment in the market sectors can be forecastusing macroeconomic equations which model the link between the number ofpeople employed and its main determinants: mainly activity in the branchesconcerned, but also the cost of labour or its duration (Argouarc’h et al., 2010;Passeron and Perez-Duarte, 2003). These models are estimated by assuming thatapparent labour productivity increases at a regular pace in the long term. Theeffects of policies to enhance job growth, such as the tax credit for encouragingcompetitiveness and jobs or the emergency plan for employment, are usuallyestimated independently then incorporated on a discretionary basis into themodels.1 These macroeconomic models have proved their effectiveness overseveral quarters and for this reason they are used in the preparation of eachConjoncture in France. However, they remain dependent on the overallmacroeconomic diagnosis, especially the scenario for market-sector activity.They also depend on changes in the trend in apparent labour productivity orchanges in behaviour by employers who may be slow or fast to adjust theirworkforce according to activity. This was notably the case during the 2008-2009crisis, a period when results from macroeconomic models were less successful.
20 Conjoncture in France
Indicator Source Release time comparedto the end of quarter Q
Business tendency surveys - month 1 of quarter Q INSEE –70 days
60 days before the end of quarter Q: beginning of the forecast exercise Conjoncture in France from INSEE
Business tendency surveys - month 2 of quarter Q INSEE –40 days
Estimation of temporary employment - month 1 of quarter Q DARES –20 days
20 days before the end of quarter Q: end of the forecast exercise Conjoncture in France from INSEE
Business tendency surveys - month 3 of quarter Q INSEE –10 days
Payroll employment except temporary employment - end of themonth - month 1 of quarter Q*
ACOSS –5 days
Estimation of temporary employment - month 2 of quarter Q DARES +10 days
Payroll employment except temporary employment - end of themonth - month 2 of quarter Q*
ACOSS +25 days
Estimation of temporary employment - month 3 of quarter Q DARES +40 days
“Flash” estimation of payroll employment - quarter Q INSEE +45 days
Estimation of payroll employment - quarter Q INSEE +70 days
Table 1 - Publication calendar for employment information in quarter Q
*in view of the introduction of the Nominative Social Declaration (DSN) and its gradual application since March 2015, the monthlyseries of workforce numbers produced by ACOSS have temporarily not been published at a monthly rate since mid-2016.Source: INSEE
1. See “What effects should we expect from the Tax Credit for EncouragingCompetitiveness and Jobs (CICE) in 2014?”, Conjoncture in France, December 2013,p. 71-73 and “In 2015, the CICE employment tax credit is set to ramp up and theResponsibility and Solidarity Pact (PRS) is to be introduced”, Conjoncture in France,December 2014, p. 73-74.

Calibrations translate businessleaders’ opinions collected
from the business tendencysurveys into quantitative
forecasts
To estimate changes in employment over the very short term — the current quarterand the following quarter — calibrations using balances of opinion from thebusiness tendency surveys often give more accurate results than macroeconomicequations. These calibrations assume a constant statistical relationship betweenmeasured employment and balance of opinion from business leaders, especiallyregarding past and expected changes in their own workforce. On the other hand,they do not presuppose an economic relationship between employment andactivity and do not require a growth scenario or an assumption regardingproductivity.
March 2017 21
Forecasting employment basedon business tendency survey responses
Box 1 – Employment forecasting based largely on that of payroll employmentin non-farm market sectors
The results in this report concern only payroll employment in the non-farm market sectors, for which the first estimate is published 45 daysafter the end of the quarter (mainly based on the ACEMO (Labour Activity and Employment Conditions) surveys conducted by DARES(Research Studies and Statistics Department)); this estimate is then revised regularly, especially 70 days after the end of the quarter (basedon comprehensive declarations by enterprises to URSSAF). Payroll employment in the non-farm market sector represents a little undertwo-thirds of total employment, and is made up mainly of market tertiary employment (73%). While temporary employment in this sectorrepresents a small proportion of employment (4% of the total), its contribution to fluctuations in employment is considerably greater thanits weight would suggest (Graph and Table).
Employment in industry (19% of the total) has declined almost continuously since the first oil shock; in particular, it fell sharply at the time ofthe 2008-2009 crisis. In construction, employment, like activity, follows an economic cycle that is quite distinct from that of the othersectors; in particular, it made the largest negative contribution in 2015 despite representing only 8% of the total.
In Conjoncture in France, forecasting methods differ according to sector of activity or form of employment. These distinctions are duemainly to the availability of sources. For payroll employment in the non-farm market sector, as quarterly data are available it is possible todevelop different specific tools (macro- or meso-economic equations, calibrations based on business tendency survey responses,calibrations based on quantitative indicators, etc.) for preparing forecasts. For assisted contracts in the public sector (CUI-CAE (singleintegration contract in the non-market sector), future contracts, etc.) sub-annual data are also available, and in this case, forecasts arebased on input assumptions and parameters related to contract duration.
For other jobs (public sector tenured personnel, self-employed, agricultural employees, etc.), information is provided only at an annualrate. Forecasts are mainly deduced from trends observed in previous years. �
Four sectors making very different contributions to change in non-farm market sector (NFMS) payroll employment
Source: INSEE
Share of employment(in 2016)
Average contributions tovariations in employment
over the period 2007-2016
Industry 19% 12%
Construction 8% 8%
Tertiary sector except temporary employment 69% 41%
Temporary employment 4% 39%
Temporary employment, a small but highly volatile share in non-farm market payroll employmentContributions to quarterly fluctuations by the different employment components
Scope: payroll employment of non-farm market sectorsSource : Insee

To forecast employmentin the very short term,
a “direct” forecast is comparedwith aggregated sectoral
calibrations
Short-term change in payroll employment in the non-farm market sector frombusiness tendency surveys is forecast either by calibrating the entire scope(“direct” approach), or by aggregating employment forecasts for the sectorscomprising it (“disaggregated” or “indirect” approach): industry, constructionand the market tertiary sector, taking care to differentiate temporary employmentwithin this last sector. Sectoral forecasts are prepared based on calibrations whichuse different balances of opinion, mainly those on employment in thecorresponding sectors (Appendix 1).
When using the “indirect” method it is possible to refine analysis of the short-termoutlook in employment by pinpointing those sectors that have made the largestcontributions. While they all undergo a common change, the different sectors arealso subject to their own short-term economic uncertainties. All in all, they maymake very different contributions to overall change from one quarter to another(Box 1). By comparing the direct and indirect methods it is also possible to test theconsistency of overall forecasts.
Incorporating quantitative information on temporaryemployment improves the calibrations
The employment forecast published by INSEE in Conjoncture in France is theresult of an iterative process which takes place between seventy and twenty daysbefore the end of the current quarter. As new employment information becomesavailable, it is included in the calibrations to improve the forecast.
Up to 40 days before the end of the quarter, the payroll employment forecast isbased solely on the business tendency surveys. This forecast is considerablyimproved when the results from the business tendency surveys from the secondmonth of the quarter (“at month 2”) are included. At the end of the process,temporary employment for the first month of the quarter is published by DARES(Research Studies and Statistics Department) and by taking this into account theaccuracy of the forecast is further improved (Appendix 1 and Table 2).
The quality of the payrollemployment forecast depends
on that of temporaryemployment
At the start of the exercise, the payroll employment forecast suffers from a lack ofinformation on temporary employment, which by nature is difficult to predict as itis subject to wide quarterly variations. It is in fact the temporary employmentestimate that contributes most to average forecasting error at the beginning of theperiod (Graph 1). While temporary employment represents a little less than 4% ofmarket employment in level, because of its strong volatility since 2007 it hascontributed about 40% of total fluctuations (Box 1).
22 Conjoncture in France
Forecasting employment basedon business tendency survey responses
Estimate date
Conjoncture in FranceQ–1
Business tendencysurvey - month 1
Business tendencysurvey - month 2
Conjoncture in France(temporary employmentindicator from DARES -
month 1)
(date expressed in a number of dayscompared to the end of the quarter) 100 days before 70 days before 40 days before 20 days before
Industry 0.16 0.15 0.14 0.14
Construction 0.31 0.23 0.23 0.23
Tertiary sector excepttemporary employment
0.22 0.15 0.15 0.15
Temporary employment 4.62 3.61 3.02 2.14
NFMS Employment (indirect estimate) 0.24 0.19 0.18 0.14
NFMS Employment (direct estimate) 0.24 0.19 0.16 0.15
Table 2 - Mean forecast error for payroll employment change in the non-farm market sectorin quarter Q, according to the estimate date
in %
Note: forecast errors are calculated for the period 2007-2016.How to read the table: for a Conjoncture in France issue published at the end of quarter Q–1, change in employment in industry in quarter Q isforecast using a root mean (square) error of 0.16%.
Sources: DARES (temporary employment numbers - end of the month), INSEE

The contribution of temporary employment to the overall forecast error decreaseswith the availability of the business tendency surveys: in two months, i.e. betweenthe beginning of the quarter and the end of the second month, the contribution bythis sector decreases by more than 9 points (Graph 1). Incorporating the firstestimate of temporary employment for the first month of the quarter at the end ofthe period reduces this contribution still further, by 17 points. For the othersectors, taking the business tendency surveys into account over the quarterincreases the accuracy of the estimates a little more moderately; they thereforecontribute relatively more to the forecast errors, especially market tertiaryemployment excluding temporary employment, given its weight.
Forecasting can benefit fromthe publication of monthly
quantitative indicators
For temporary employment, introducing monthly quantitative information clearlyimproves the accuracy of the overall employment forecast.Another monthly quantitative indicator illustrates this contribution: the estimate ofpayroll employment at the end of the month produced by ACOSS, taking as itsscope competitive enterprises with at least 10 employees. When this indicator istaken into account between the end of the forecasting period for Conjoncture inFrance (T–20 days) and the first employment estimate (T+45), the forecast forquarterly change in non-farm market sector employment, excluding temporaryemployment, is improved (Box 2).
The forecasts used in eachConjoncture in France takeinto account both direct and
indirect approaches
At the end of the forecasting exercise for Conjoncture in France, the indirectapproach provides an employment forecast of predominantly better quality.However, the direct approach is more parsimonious: a single calibration isneeded with one or two variables taken from the business tendency surveys. Inaddition, this approach does not always give less satisfactory results: since 2007and with the models used here, at the time of publication of the Conjoncture inFrance, more than 4 times out of 10 the direct approach provides forecasts for thecurrent quarter that are of better quality than the indirect approach. In practice,the forecasts presented in Conjoncture in France are based on the resultsobtained from different tools, macroeconomic equations and calibrations basedon the surveys; for the surveys, the direct and indirect approaches are arbitrated.
March 2017 23
Forecasting employment basedon business tendency survey responses
1 - Contributions by the different sectors to the forecast error for employment in the current quarteras the indicators become available
Note: the mean quadratic contributions are calculated for the period 2007-2016.How to read the graph: at the time that Conjoncture in France is being finalised, when the monthly indicator for temporary employment is known,forecast errors in temporary employment account for about 30% of the forecast error for quarterly change as a whole.
Sources: DARES (temporary employment numbers - end of the month), INSEE (business tendency survey and employment numbers), INSEE calculations

24 Conjoncture in France
Forecasting employment basedon business tendency survey responses
Box 2 - After publication of Conjoncture in France but before the “flash” estimates foremployment, the ACOSS monthly indicator improves forecasting accuracy
Another producer of statistics, the Central Agency of Social Security Associations (ACOSS), publishes a payroll employment estimate atthe end of every month, based on a set of data of similar scope to the non-farm market branches, that of the private sector excepttemporary employment, limited to enterprises with 10 or more employees. Until mid-2016, this indicator was published about 55 daysbefore the end of the month under consideration (i.e. 5 days before the end of the quarter for the first month, 25 days after the end of thequarter for the second month). In neither case are these indicators available for the forecasting period of Conjoncture in France (20 daysbefore the end of a quarter) but they are available between this publication and the flash estimate for employment published 45 days afterthe end of the quarter.
Incorporating the ACOSS monthly indicator1 improves forecasting by 30%
To appreciate the contribution made by the ACOSS monthly indicator to forecasting payroll employment excluding temporary work,models that incorporate this indicator are compared with a reference model that uses the indicator for the business climate in France.However, since the ACOSS indicator is only available from 2006, there is not sufficient time depth to compare the quality of the modelsoutside the sample. For the period 2006-2015, the inclusion of the ACOSS monthly indicator until the second month of the quarterimproved forecasting by 30% between the end of the forecasting period and 25 days after the end of the quarter under consideration.
Forecast of non-farm market employment excluding temporary employment in the first month of quarter “t+1”
Reference model
emploi SMNAHI emploi SMNAHIt t_ . _ .( . )
–( .
= × +0 89 00159 9
13 3
4)
_ _× DcIimat France m t
(in brackets the Student’s t-test statistics)Period of estimation: 2006Q2-2016Q4
R2 adjusted in the model: 0.69
where:- emploi_SMNAHIt is the growth rate of non-farm market sector payroll employment excluding temporary employment in quarter t,standard deviation 0.24% from 2006;- climat_France_m4t is the business climate in France for the first month of quarter t+1;- D is the difference operator.
The root mean square error (RMSE) for this model for the period 2006Q2-2016Q4 is 0.13%.
Model with ACOSS indicator
emploi SMNAHI a s mens SMt_ – . . cos _ _(– . ) ( . )
= + ×124 0 486 7 5 1
NAHI m cIimat France mt t_ . _ _( . )
2 0012 46 5
+ ×
(in brackets the Student’s t-test statistics)Period of estimation: 2006Q2-2016Q4
R2 adjusted in the model: 0.85
where:- acoss_mens_m2t is the ACOSS monthly indicator in the second month of quarter t.
The root mean square error (RMSE) for this model for the period 2006Q2-2016Q4 is 0.09%, i.e. a 30% gain compared with thereference model.
There is also a clear improvement in accuracy when considering only industrial employment.
Forecast of payroll employment in industry
Reference model
emploi industrie emploi indt_ – . . _(– . ) ( . )
= + ×005 0 591 5 6 7
ustrie solde emploi passé industriet –( . ). _ _ _ _14 8
0013+ × m t4
(in brackets the Student’s t-test statistics)Period of estimation: 2006Q2-2016Q4
R2 adjusted in the model: 0.82
where:- emploi_industriet is the growth rate of payroll employment in industry in quarter t, standard deviation 0.31% from 2006;- solde_emploi_passé_industrie_m4t is the balance of opinion on recent change in employment in industry in the first month of quartert+1.
The root mean square error (RMSE) for this model for the period 2006Q2-2016Q4 is 0.13%.
1. Since August 2016, the ACOSS monthly indicator is no longer published every month. Estimates have been disrupted by the introduction of a newmethod for collecting social declarations by employers, the Nominative Social Declaration (DSN). The indicators are currently only published every threemonths, about two months after the end of the given quarter. They are therefore temporarily no longer usable for forecasting before the quarterlypublication.

Forecasting employment basedon business tendency survey responses
March 2017 25
Model with ACOSS indicator
emploi industrie emploi indt_ – . . _(– . ) ( . )
= + ×004 0 441 2 3 4
ustrie a s mens ind mt t–( . )
( . )
. cos _ _ _
.
14 6
4 1
0 53 2
0016
+ ×
+ × Dsolde emploi passé industrie trimt_ _ _ _ + 1
(in brackets the Student’s t-test statistics)Period of estimation: 2006Q2-2016Q4
R2 adjusted in the model: 0.89
where:- emploi_industriet is the growth rate of payroll employment in industry in quarter t;- acoss_mens_ind_m2t is the ACOSS monthly indicator for industry in the second month of quarter t;- solde_emploi_passé_industrie_trimt+1 is the quarterly balance of opinion on recent change in employment in industry published in thefirst month of quarter t+1.
The root mean square error (RMSE) for this model for the period 2006Q2-2015Q3 is 0.10%, i.e. a 23% gain compared with thereference model.
The monthly quantitative indicator of the stock of employment established by ACOSS is not the only available indicator. First, ACOSS alsopublishes monthly data on hirings which can improve employment calibrations for certain sectors. Second, since the end of 2015 thehuman resources management consultancy ADP has introduced a monthly employment indicator based on a sample of its clientcompanies.
Every month, ADP publishes its monthly employment report about 20 days after the end of the month under consideration, which istherefore a very early indicator. However, this indicator seems fairly difficult to use. Firstly, because of its limited time depth: it is availableonly from the beginning of 2012, which limits the possibility of developing an econometric model. The second reason is the poorcorrelation between this indicator and the INSEE indicator based on company declarations to URSSAF (covering the non-farm marketsector except temporary employment; Graph): the correlation of the quarterly variations in these indicators with the area that is closest inscope (market sector except temporary employment) is 14%, well below the correlation between INSEE’s quarterly variations and those ofthe ACOSS monthly indicator (67%). Lastly, the dynamism of this ADP indicator for 2014 and 2015 is difficult to relate to concomitantinformation on activity or unemployment. �
*NFMS: non-farm market sectorNote: the ADP and ACOSS monthly indicators are shown as quarterly figures.
Sources: ACOSS, ADP and INSEE

Employment reacts with a time lag to fluctuations in activity
Employment and activity haveshort-term cycles which are
linked but out of phase,as reflected in the business
tendency surveys
All the business tendency surveys include questions on employment, usually oneon past change in employee numbers and another on expected change.2
Irrespective of the sector, the balances of opinion of business leaders concerningemployment describe a very specific short-term economic cycle, with a similarprofile to that of the balances of opinion for activity, though lagging slightlybehind. In the manufacturing industry, balances of opinion on employment3
recovered more slowly than those on production in the wake of the 2008-2009economic and financial crisis (Graph 2). In addition, balances of opinion onemployment are considerably less volatile: they vary much less than those onproduction, which are subject to severe jolts. At the beginning of 2016, when thebalances of opinion on production showed contrasting changes (strongimprovement in expected production but sharp fall in past production), thebalances for employment once again showed the upward trend started at thebeginning of 2015. These features of the balances of opinion clearly reflect thoseof the quantitative variables, especially the way that employment lags behind,reacting more slowly to fluctuations in activity for each sector, except temporaryemployment.
“France” business climate,an aggregate indicator of
overall activity which is usefulfor forecasting employment
directly
Of all the “direct” calibration models for payroll employment in the non-farmmarket sector, those using the estimated business climate for all market sectors ofthe French economy (“France“ business climate) often give the most accurateforecasts (see also Special analysis, “How to forecast employment figures byreading the newspaper”, p. 35). This may seem paradoxical, in that this climate issupposed to reflect change in economic activity overall rather than change inemployment. In fact it summarises information from 26 balances of opinion from5 sector surveys: industry, services, building industry, retail and wholesale trade
Forecasting employment basedon business tendency survey responses
26 Conjoncture in France
2 - Balances of opinion on employment have a similar profile to those for activitybut they lag behind and are less uneven
Source: INSEE, monthly business tendency survey in industry
2. In all the surveys, questions take the form, “How has your total workforce changed in thelast three months?” and “What is the expected change in total workforce in your enterprisein the next three months?” However, from one survey to another there are always a fewdifferences over the definition of workforce. The term total workforce is used for theindustry survey, with no further clarification given; however, employees and self-employedworkers are required for the building sector survey figures, workforce includes temporaryworkers for retail trade and services surveys, and lastly both temporary work andemployment excluding temporary work are specified in the civil engineering survey.
3. Balances of opinion on employment in industry are now available on a monthly basis.The available timescale is now sufficient to carry out seasonal adjustments and as a resultthese new series can be used rather than quarterly employment balances of opinion.

(Bardaji et al., 2008). Most of the balances used for this indicator reflect thegeneral opinion of business leaders on change in activity (production, turnover,general outlook, etc.), and only two of the ten existing balances of opinion onemployment were selected: expected changes in employment in retail trade andpast changes in employment in the building industry.
“Employment climate”, a new composite indicatorconstructed only from balances of opinion on employment
To track the specific short-term cycle of employment, factor analysis can be usedto construct an indicator that summarises information contained in the balancesof opinion on past and expected changes in employment in the different marketsectors. The method selected here is similar to that used to calculate the businessclimate indicators (Appendix 2).
The “employment climate” isa good reflection
of the short-term outlookfor payroll employment
The resulting composite indicator –called the “employment climate”– verysatisfactorily tracks the short-term phases of non-farm market sector payrollemployment (Graph 3). The correlation between the employment climatecalculated in the second month of a quarter and the quarterly growth in workforcenumbers is high (75%), and comparable with that obtained with the businessclimate in France. Over the recent period the employment climate is a goodreflection of the upward trend in employment that started at the beginning of2015, and is even more accurate than the business climate.
The difference betweenthe business climate and
the employment climatereflects the productivity cycle
Concerning the non-farm market sector, the employment climate providesinformation that complements the business climate indicator. Since mid-2015, ithas been positioned well above the business climate, and this differenceillustrates the short-term slowdown in apparent labour productivity, in other wordsgreater employment intensity of growth, mainly attributable to recent schemes toreduce labour costs. An indicator calculated as the difference between thebusiness climate in France and the employment climate presents the cycle ofapparent labour productivity in France (Graph 4) in a coherent way, so that it canbe used to better anticipate changes.
Forecasting employment basedon business tendency survey responses
March 2017 27
3 - Comparison of variations in employment, “employment climate” and the business climate in France
Source: INSEE, business tendency surveys and employment numbers

The employment climatecomplements the business
climate in France to forecastchange in payroll employment
To control for the properties of this new indicator, the predictive capacities of threepayroll employment models were tested for the period 1991-2016 (Box 3): areference model involving only the business climate; a model involving only theemployment climate, and finally a model involving these two indicatorssimultaneously. The second model appeared slightly less efficient in forecastingthan the reference model, which confirmed that the business climate containsinformation in advance of the employment model. In the third model, the twoindicators are clearly differentiated and the model reproduces data better when itis estimated for the entire period of study (larger adjusted R²). This shows that theemployment climate provides additional information to the business climate toforecast change in payroll employment. On the other hand, forecasting errorsare not significantly reduced when a real-time simulation is carried out(“real-time” RMSFE not significantly different).
INSEE will publish this new indicator every month from April 2017, as acomplement to the indicators on business climate and the economic turnaroundin France. �
Forecasting employment basedon business tendency survey responses
28 Conjoncture in France
4 - Differences between the business climate in France and the employment climateclosely follow change in per capita productivity
Source: INSEE, business surveys, quarterly accounts
Bibliography
Argouac’h J., Debauche E., Leblanc P. and Ourliac B. (2010), “Comment expliquer les évolutions de l’emploidepuis le début de la crise ?”, Conjoncture in France, December, p. 19-43.
Bardaji J., Minodier C., Clavel L. and Tallet F. (2008), “Two new indicators to help analyse the economic outlookin France”, Conjoncture in France, December, p. 21-41.
Passeron V. and Perez-Duarte S. (2003) , “Will the recovery be jobless?”, Conjoncture in France, December,p. 11-28. �

March 2017 29
Forecasting employment basedon business tendency survey responses
Box 3 – The employment climate in the forecasting modelsand testing its forecasting properties
In order to directly forecast change in non-farm market employment in the short term, the reference model that can be applied in thesecond month of the quarter is a calibration involving the indicator for the business climate in France.
Reference model
emploi SMNA emploi SMNAt t_ – . . _(– . ) ( . )
–= + ×0 89 0302 3 3 1
13 7
2
2 3
036
0009
+ ×
+ ×
. _
. _( . )
–
( . )
emploi SMNA
cIimat Fra
t
nce m cIimat France m cIimat Frant t_ . ( _ _ – _( . )
2 0057 25 0
+ × ce m
DcIimat France m
t
t
_ )
. _ _( . )
1
0013 12 4
+ ×
(in brackets the Student’s t-test statistics)Period of estimation: 1991Q1-2014Q4
R2 adjusted in the model: 0.78
where:- emploi_SMNAt is growth in non-farm market payroll employment in quarter t , where the standard deviation is 0.33% since 2007;- climat_France_m1t is the business climate in France in the first month of quarter t;- climat_France_m2t is the business climate in France in the second month of quarter t;- D is the difference operator.
The root mean square forecast error for this model (“real time” RMSFE) for the period 2007Q1-2016Q4 is 0.15%.
Model with employment climate only
emploi SMNA emploi SMNAt t_ . _ .( . )
–( . )
= × + ×024 0322 3
13 3
emploi SMNA emploi SMNAt t_ . _ .–( . )
–( .
22 8
36
028 0047+ × +8
2)
_ _× DcIimat emploi m t
(in brackets the Student’s t-test statistics)Period of estimation: 1991Q1-2014Q4
R2 adjusted in the model: 0.77
The standard deviation error for this model (“real time” RMSFE) for the period 2007Q1-2016Q4 is 0.19%.
Model with employment climate and business climate in France
emploi SMNA emploi SMNAt t_ – . . _(– . ) ( . )
–= + ×0 91 0262 4 2 8
14 3
2
2 4
038
0009
+ ×
+ ×
. _
. _( . )
–
( . )
emploi SMNA
cIimat Fra
t
nce m cIimat France m cIimat Frant t_ . ( _ _ – _( . )
2 0061 25 2
+ × ce m
DcIimat emploi m
t
t
_ )
. _ _( . )
1
0019 23 0
+ ×
(in brackets the Student’s t-test statistics)Period of estimation: 1991Q1-2014Q4
R2 adjusted in the model: 0.80
The standard deviation error for this model (“real time” RMSFE) for the period 2007Q1-2016Q4 is 0.16%. �

Forecasting employment basedon business tendency survey responses
30 Conjoncture in France
Appendix 1 – Calibrations from business tendency surveys to forecast short-term change innon-farm market sector payroll employment
Forecasting change over the short term in payroll employment from the business tendency surveys can be done either by calibrating thescope of the entire non-farm market sector (in what is called a “direct approach”), or by aggregating forecasts from the industry,construction, tertiary except temporary employment and temporary employment sectors (“disaggregated” or “indirect” approach).
Calibration of non-farm market payroll employment (direct approach)
The different tests carried out with the many balances of opinion in the surveys conclude that in general, in a forecasting exercise inConjoncture in France (in the second month of a given quarter “t”), the best direct forecast of change in non-farm market employment isobtained from a calibration that uses the business climate indicator for the French economy.
(1)
emploi SMNA emploi SMNAt t_ – . . _(– . ) ( . )
–= + × +0 88 0262 3 2 7
1 0 42
00094 4
2
2 4
. _
. _ _( . )
–
( . )
×
+ ×
emploi SMNA
cIimat France
t
m DcIimat France m
cIim
t t2 0013 1
00662 3
5 6
+ ×
+ ×
. _ _
. (( . )
( . )at France m cIimat France mt t_ _ – _ _ )2 1
(in brackets the Student’s t-test statistics)Period of estimation: 1995Q1-2016Q4
R2 adjusted in the model: 0.79
where:- emploi_SMNAt is the growth rate of non-farm market payroll employment in quarter t, where the standard deviation is 0.33% from 2007;- climat_France_m1t and climat_France_m2t are the values for the France business climate in the first two months of quarter t;- Dclimat_France_m1t is the variation in the France business climate in the first month of quarter t.
The root mean square forecast error for this model (“real time” RMSFE1) for the period 2007Q1-2016Q4 is 0.16%.
Calibration of non-farm market payroll employment (indirect approach)
The calibration models by sector, on the other hand, show balances of opinion from business leaders in the sector under consideration ontheir own workforce, supplemented by other variables.
Manufacturing industry
(2)Ind Ind solt t= + × + ×– . . .
(– . ) ( . )–
( . )002 067 0006
0 7 9 21
3 3de commandes Ind m
Dsolde effectif p
t_ _ _
. _ _( . )
2
00143 1
+ × révu Ind trimt_ _
Period of estimation: 1995Q1-2016Q4R2 adjusted in the model: 0.80
where:- Indt is the growth rate of payroll employment in industry in quarter t, where the standard deviation is 0.33% from 2007;- Dsolde_effectif_prévu_Ind_trimt is the variation in the balance of opinion on expected change in employment, calculated from thequarterly survey;- solde_commandes_Ind_m2t is the balance of opinion on the level of order books in the second month of quarter t.
Construction
(3)BTP BTP soldt t= + × + ×036 028 0009
6 1 2 91
4 5. . .( . ) ( . )
–( . )
e commandes Bat m
Dsolde effectif pr
t_ _ _
. _ _( . )
2
00163 1
+ × évu Bat m solde activité prévue TPt t_ _ . _ _ _( . )
2 00115 1
+ ×
Period of estimation: 1995Q1-2016Q4R2 adjusted in the model: 0.88
where:- BTPt is the growth rate of payroll employment in construction in quarter t, where the standard deviation is 0.55% from 2007;- Dsolde_effectif_prévu_Bat_m2t is the variation in the balance of opinion on expected change in employment in the second month ofquarter t;- solde_commandes_Bat_m2t is the balance of opinion on the level of order books in the second month of quarter t;- solde_activité_prévue_TPt is the balance of opinion on expected change in activity in civil engineering in quarter t.
The root mean square forecast error for this model (“real time” RMSFE) for the period 2007Q1-2016Q3 is 0.23%.
1. To find the best model, we try to position ourselves in the same conditions in which the economic analyst would find himself at each date t to construct thecalibration. The idea is to recalculate the model coefficients at each date t, by including at each stage the latest available information observed and thenmeasuring the forecast error obtained with this information. The simulation is nevertheless carried out using historical series of payroll employment andsurvey balances as published today and not that of the variations measured for the first publication: strictly speaking, this is therefore “pseudo real time”.

Forecasting employment basedon business tendency survey responses
March 2017 31
Tertiary employment except temporary employment
(4)
TerMHI TerMHIt t= + × +– . . .(– . ) ( . )
–( .
0 55 034 00182 0 3 6
14 2
4 0
2
0015)
( . )
_ _
. _
×
+ ×
DcIimat Service m
solde effectif
t
_ _ _ . _ _
.( . )
(
passé ComD m cIimat ComG mt t2 0008 1
0782 6
+ ×
+4 3
1998 2. )
× ind Q
Period of estimation: 1995Q1-2016Q4R2 adjusted in the model: 0.79
where:- TerMHIt is the growth rate of payroll employment in the tertiary sector excluding temporary employment in quarter t, where the standarddeviation is 0.23% from 2007;- solde_effectif_passé_ComD_m2t is the balance of opinion on past change in employment in retail trade in the second month of quarter t;- Dclimat_Service_m2t is the variation in business climate in services in the second month of quarter t;- climat_ComG_m1t is the business climate in wholesale trade, in the first month of quarter t;- Ind1998Q2 is a dummy for Q2 1998.
The root mean square forecast error for this model (“real time” RMSFE) for the period 2007Q1-2016Q3 is 0.15%.
Temporary employment
For this sector, it is possible first to take into account only the survey variables (calibration (5)); when carrying out a forecasting exercise forConjoncture in France, we can then use the temporary employment estimate from month 1 of quarter t published by DARES (calibration(6)).
(5)Inter DcIimat France mt t= + × +024 0 47 2 0
0 5 3 4. . _ _ .
( . ) ( . )28
0062 1
1 4
( . )
( . )
_ _ _ _
.
×
+
Dsolde effectif prévu Ind trimt
_ _ _ _× solde activité prévue Ind m t2
Period of estimation: 1995Q1-2016Q4R2 adjusted in the model: 0.47
(6)Inter DcIimat industrie mt t= × +031 2 011
5 2 3 2. _ _ .
( . ) ( . )×
+ ×
Dsolde effectif prévu tp trim
Dsolde
t_ _ _ _
. _( . )
00817
effectif prévu bat m indicateur Intérit_ _ _ . _( . )
1 109 3
+ × m Dares mt_ _ 1
Period of estimation: 2002Q2-2016Q4R2 adjusted in the model: 0.79
where:- Intert is the growth rate of temporary employment in quarter t, where the standard deviation is 4.89% from 2007;- Dsolde_effectif_prévu_tp_trimt is the variation in balance of opinion on expected change in employment in the civil engineering sector inquarter t;- Dsolde_effectif_prévu_bat_m1t is the variation in balance of opinion on expected change in employment in the building industry sector inthe first month of quarter t;- indicateur_Intérim_Dares_m1t is the monthly change in the DARES indicator in the first month of quarter t;- Dclimat_France_m2t is the variation in the France business climate in the second month of quarter t;- Dclimat_industrie_m2t is the variation in business climate in industry in the second month of quarter t.
The root mean square error for model 5 (“real time” RMSFE) for the period 2007Q1-2016Q4 is 3.02% whereas for model 6 it is 2.14%.
Result of the aggregation
Aggregating these sector forecasts gives a forecast of change in employment in the scope of the non-farm market sector which iscomparable in terms of accuracy to the direct method. At the end of the forecasting exercise for Conjoncture in France, it is possible to usethe first monthly estimate for temporary employment to forecast both temporary employment and non-farm market employment across thewhole quarter: for the period 2007Q1-2016Q4, the indirect method is better in 53% of cases, however, according to a Diebold andMariano test, this difference is not statistically significant. �

Forecasting employment basedon business tendency survey responses
32 Conjoncture in France
Appendix 2 - Construction of a composite employment indicatorfrom business tendency surveys
In most business tendency surveys, balances of opinion are available on past or expected employment.
A composite indicator of employment can be constructed from a static factor analysis of these balances of opinion. Using this method, thebehaviour of several variables can be summarised in a single unobserved variable, which represents the common trend in the balancesconsidered.
Static factor analysis assumes that at each date t, the balance of opinion (Sit) is represented as the sum of a term proportional to thecommon factor (Ft) and a component specific to each balance (uit):
S F uit i t it= +λ
The common factor is therefore written as a linear combination of balances of opinion:
F St i it= ∑ω
The termsωi are the coefficients associated with the balances of opinion and these terms, called loadings, track the correlation between agiven balance and the common factor.
Choice of balances and estimation period
The main difficulty in preparing this composite indicator lies in the different periodicities of the balances of opinion to be combined and thedates when they are available. In addition to the fact that some surveys are not monthly (surveys on wholesale, small constructioncompanies and civil engineering), the balances of opinion on employment in the other surveys have also changed their periodicity overtime. For example, balances on employment in the services survey have been monthly only since June 2000, the date when the surveybecame monthly (Table 1).
Only the monthly balances are selected
To calculate a common monthly employment factor, it seemed preferable to select only monthly balances. Taking quarterly balances intoaccount would mean extending them in the months for which they are not available in order to have monthly series, thus increasing theprobability of having to revise the indicator once the quarterly balance is known. In addition, the sectors concerned (civil engineering,wholesale trade) account for only 7% of employment in the non-farm market sector.
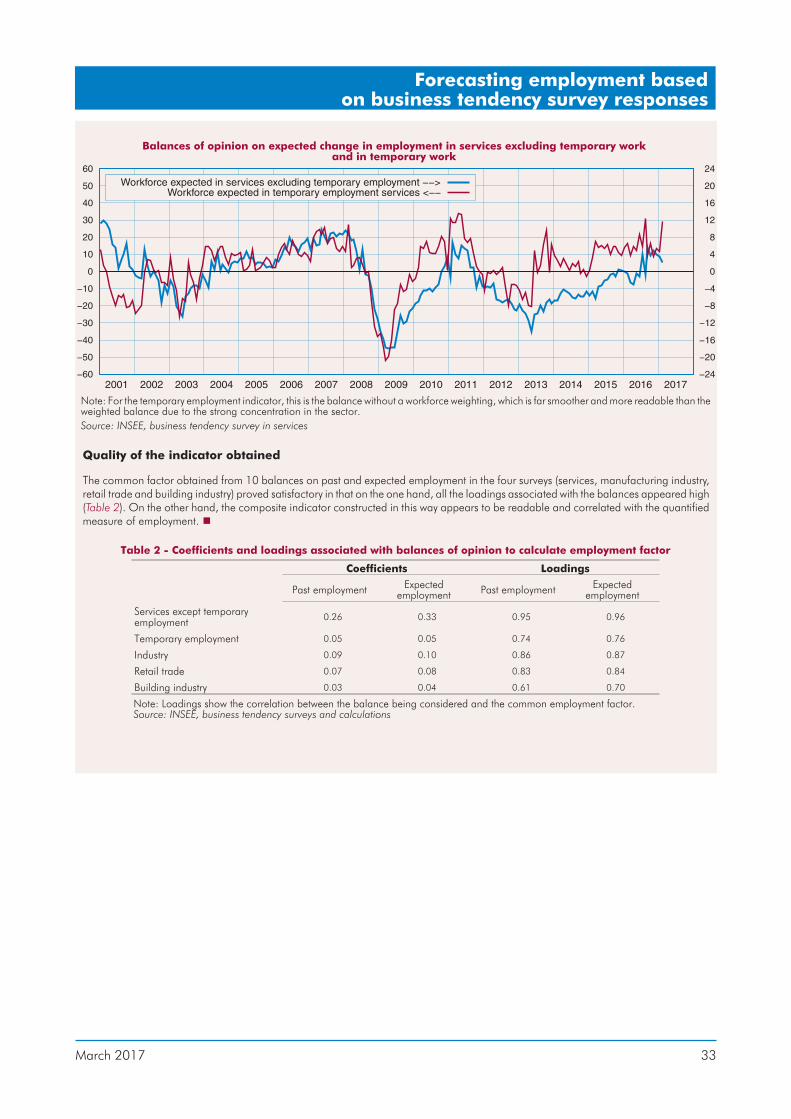
In services, temporary employment activity can be distinguished
Temporary employment activities are part of the scope of the services survey. However, the temporary employment sector has its ownspecific economic outlook compared with the other sectors (Box 1), due to the nature of this type of work, which in particular adjusts morequickly to fluctuations in activity (Argouarc’h et al., 2010). The services survey reflects this situation well (Graph): the balance on expectedemployment increased much earlier for temporary employment than for services excluding temporary employment after the 2008-2009crisis. For this reason, balances used to calculate the common factor for employment are not calculated for services as a whole. Instead weuse balances for “services excluding temporary employment” on the one hand, and those for temporary employment on the other.
The composite indicator is estimated for the period 2003-2016 then backcast from 1991
As the balances of opinion on employment in the services, industry, retail trade and building industry business tendency surveys have allbeen monthly since 2003, the parameters of the composite indicator are estimated for the period 2003-2016. Once the parameters arecalculated, they are applied to the balances of opinion from 1991 to 2003, after linear interpolation of the series that were quarterlybefore 2003. Lastly, the composite indicator is standardised across the entire period, which starts in 1991, so that it has a mean of 100and standard deviation of 10 (same convention as for the business climates).
SurveyBalance of opinion “past employment” Balance of opinion “expected employment”
1st disponible point Frequency 1st disponible point Frequency
Services January 1988Monthly since June 2000;
quarterly beforeJanuary 1988
Monthly since June 2000;quarterly before
Industry April 1976Monthly since January 2003;
quarterly beforeApril 1976
Monthly since January 2003;quarterly before
Retail trade January 1991Monthly since March 2000;
bimonthly beforeJanaury 1991
Monthly since March 2000;bimonthly before
Wholesale trade July 1979 Bimonthly July 1979 Bimonthly
Building industry April 1975Monthly since September 1993;
quarterly beforeJanuary 1975
Monthly since September 1993;quarterly before
Small construction companies January 1991 Quarterly October 1990 Quarterly
Civil engineering January 1974 Quarterly
Table 1 - Balances of opinion on employment available in business tendency surveys
Source: INSEE
Forecasting employment basedon business tendency survey responses
March 2017 33
Quality of the indicator obtained
The common factor obtained from 10 balances on past and expected employment in the four surveys (services, manufacturing industry,retail trade and building industry) proved satisfactory in that on the one hand, all the loadings associated with the balances appeared high(Table 2). On the other hand, the composite indicator constructed in this way appears to be readable and correlated with the quantifiedmeasure of employment. �
Balances of opinion on expected change in employment in services excluding temporary workand in temporary work
Note: For the temporary employment indicator, this is the balance without a workforce weighting, which is far smoother and more readable than theweighted balance due to the strong concentration in the sector.
Source: INSEE, business tendency survey in services
Coefficients Loadings
Past employment Expectedemployment Past employment Expected
employment
Services except temporaryemployment
0.26 0.33 0.95 0.96
Temporary employment 0.05 0.05 0.74 0.76
Industry 0.09 0.10 0.86 0.87
Retail trade 0.07 0.08 0.83 0.84
Building industry 0.03 0.04 0.61 0.70
Table 2 - Coefficients and loadings associated with balances of opinion to calculate employment factor
Note: Loadings show the correlation between the balance being considered and the common employment factor.Source: INSEE, business tendency surveys and calculations