Forecast of Generation, Revenue and Costs for CS Energy ...
32
Forecast of Generation, Revenue and Costs for CS Energy and Stanwell 2020-21 to 2024-25
Transcript of Forecast of Generation, Revenue and Costs for CS Energy ...

Forecast of Generation, Revenue and Costs for
CS Energy and Stanwell2020-21 to 2024-25
TABLE OF CONTENTSExecutive Summary 2
CS Energy and Stanwell Assets 4
Impact of Callide C Explosion 4
Implications for Stanwell 5
Implications for CS Energy 5
A decade in the Queensland Market 6
Generation 7
2020-21 7
Forecast to 2025 8
Price 9
2020-21 9
Forecast to 2025 10
Revenue 11
Wholesale Energy 11
Hedging 12
Retail 13
Coal (Stanwell) 14
Other Revenue Streams 15
Costs 15
Electricity and energy services expenses 15
Power Station Investment 15
Access fees and charges 16
Fuel 17
Deprecation 17
Other costs 17
Factors not included in forecast 18
Price Sensitivity Analysis 18
Appendix 20
Factors not included in forecast 28
Sensitivity Analysis 30

2GOC PROFIT FORECAST 2021
Executive SummaryThe Queensland Government could have to prop up its coal fired government owned corporations (GOCs), CS Energy and Stanwell, by 2024-25 as more renewable energy continues to drive down wholesale and forward contract prices.
We have analysed CS Energy and Stanwell’s public reporting as well as market data to forecast their revenue streams including wholesale energy, retail, hedging through forward contracts and coal sales to create our own profit forecast out to 2024-25 (Figure 1). In 2020-21, forward contracts signed several years ago before prices began to fall will likely ensure CS Energy and Stanwell remain profitable. These forward contracts work both ways – up until the incident at Callide C4 on 25 May, these contracts would have topped up CS Energy and Stanwell’s lower wholesale revenue. If average prices continue to rise in June, CS Energy and Stanwell may receive lower than the average wholesale price through their contracts.
From 2021-22, we forecast that CS Energy will be unprofitable. This does not include any write downs, or impairments, of assets, or rebuilding Callide C4. The Queensland Government would have to prop up CS Energy by $430m over 4 years.
Stanwell has a bigger generation portfolio than CS Energy, a stronger history in the retail business and revenue from coal export from its mines. We forecast it will still be marginally profitable in 2024-25. However, by 2024-25, its profits could be less than CS Energy’s losses and the government’s coal fired GOCs would be losing money. After 2023-24, the GOCs will not make an operating profit again.
The Queensland Government and the GOCs know that the electricity system is changing. In 2019-20, CS and Stanwell recorded a loss, because they wrote down the value of their coal assets by nearly $1bn. But the 2020-21 Queensland budget1 forecasts over $2bn profits out to 2023-24.
We believe that the 2020-21 budget overestimates profits in 2020-21, even though it was released halfway through the year in November 2020. It continues to make optimistic assumptions through 2021-22 and 2022-23 although it does forecast a decline in profits. In 2023-24, profits are forecast to rise. The primary reason cited is higher wholesale prices following closure of Liddell. Both the NSW and Federal Government have made recent policy and funding announcements to ensure prices do not spike after coal closure. The NSW Government Roadmap will underwrite 12 GW of renewable energy and 2 GW of storage while the Federal Government is stuck on funding 600 MW of gas, but the result for CS and Stanwell is similarly bleak.
The Queensland Government will release their updated profit forecasts to 2024-25 in the budget on 15 June 2021. We call on them to acknowledge the looming profitability crisis and set out a clear plan to stop propping up uneconomic dirty coal plant and move to a renewable future.
1 https://budget.qld.gov.au/files/BP2_8_Public_Non-financial_Corporations_Sector.pdf
GOC PROFIT FORECAST 2021
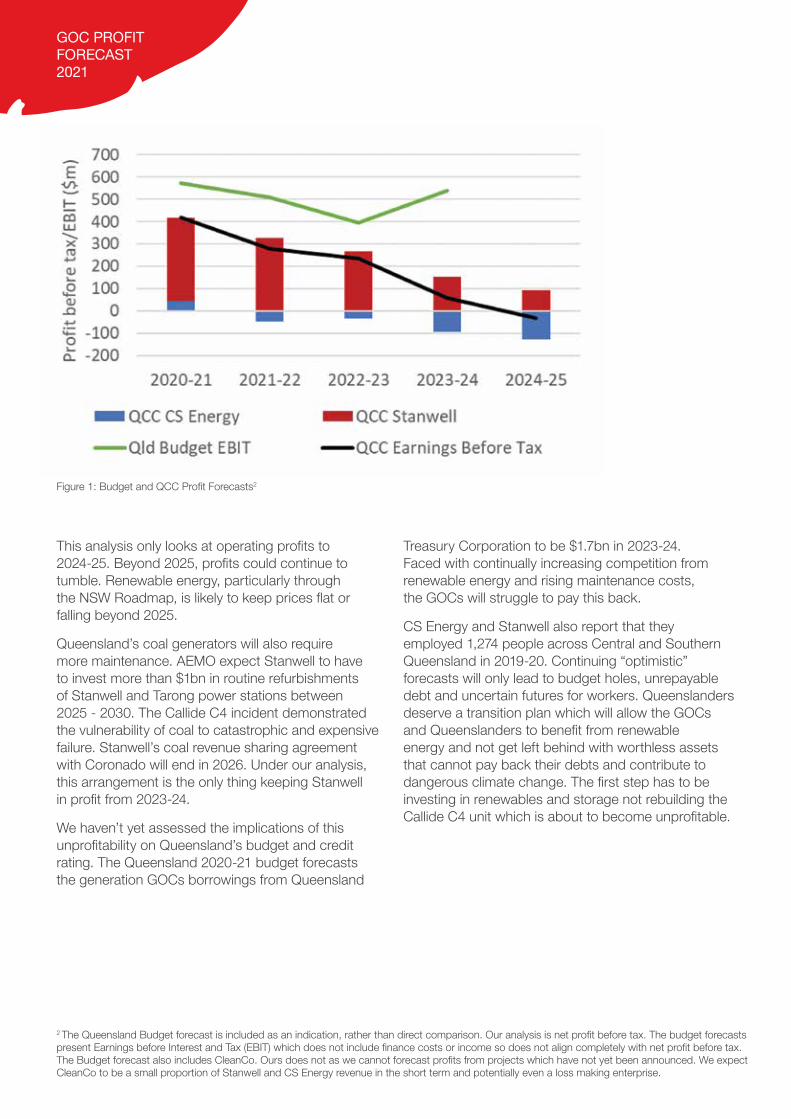
This analysis only looks at operating profits to 2024-25. Beyond 2025, profits could continue to tumble. Renewable energy, particularly through the NSW Roadmap, is likely to keep prices flat or falling beyond 2025.
Queensland’s coal generators will also require more maintenance. AEMO expect Stanwell to have to invest more than $1bn in routine refurbishments of Stanwell and Tarong power stations between 2025 - 2030. The Callide C4 incident demonstrated the vulnerability of coal to catastrophic and expensive failure. Stanwell’s coal revenue sharing agreement with Coronado will end in 2026. Under our analysis, this arrangement is the only thing keeping Stanwell in profit from 2023-24.
We haven’t yet assessed the implications of this unprofitability on Queensland’s budget and credit rating. The Queensland 2020-21 budget forecasts the generation GOCs borrowings from Queensland
Treasury Corporation to be $1.7bn in 2023-24. Faced with continually increasing competition from renewable energy and rising maintenance costs, the GOCs will struggle to pay this back.
CS Energy and Stanwell also report that they employed 1,274 people across Central and Southern Queensland in 2019-20. Continuing “optimistic” forecasts will only lead to budget holes, unrepayable debt and uncertain futures for workers. Queenslanders deserve a transition plan which will allow the GOCs and Queenslanders to benefit from renewable energy and not get left behind with worthless assets that cannot pay back their debts and contribute to dangerous climate change. The first step has to be investing in renewables and storage not rebuilding the Callide C4 unit which is about to become unprofitable.
Figure 1: Budget and QCC Profit Forecasts2
2 The Queensland Budget forecast is included as an indication, rather than direct comparison. Our analysis is net profit before tax. The budget forecasts present Earnings before Interest and Tax (EBIT) which does not include finance costs or income so does not align completely with net profit before tax. The Budget forecast also includes CleanCo. Ours does not as we cannot forecast profits from projects which have not yet been announced. We expect CleanCo to be a small proportion of Stanwell and CS Energy revenue in the short term and potentially even a loss making enterprise.

4GOC PROFIT FORECAST 2021
3 https://www.csenergy.com.au/what-we-do/power-generation 4 https://www.stanwell.com/energy-assets/our-power-stations/ Note this does not include the Mackay Gas Turbine or Mica Creek Power Station at Mt Isa which were both decommissioned during 2020-21 and may have a small impact on generation and finances in 2020-215 http://www.nemweb.com.au/REPORTS/CURRENT/MTPASA_DUIDAvailability/
CS Energy and Stanwell AssetsCS Energy operates over 1.5 GW of coal generation at the following stations3:
» 1 x 750 MW unit at Kogan Creek north west of Dalby
» 2 x 350 MW units (700 MW) at Callide B
» Half of 2 x 420 MW units at Callide C (840 MW), the other half is owned by Intergen, although CS Energy operate and maintain all of Callide C, both near Biloela
CS Energy also have an offtake agreement with NRG, to trade generation from Gladstone power station in excess of the requirements of Boyne Island smelter. No generation from Gladstone is included in CS Energy’s annual reporting or this analysis.
Stanwell operates 3.3 GW of coal generation at the following stations4:
» 1 x 443 MW unit at Tarong North
» 4 x 350 MW units (1,400 MW) at Tarong, both south of Kingaroy
» 4 x 365 MW units (1,460 MW) at Stanwell, west of Rockhampton
Impact of Callide C ExplosionOn 25 May, a fire and explosion at Callide C4 triggered the loss of over 3 GW of generation at surrounding coal power stations and solar farms and a major power outage in Queensland. This sent Queensland prices to the Market Price Cap (MPC) of $15,000/MWh for 1.5 hours that evening. Prices have remained consistently high since 25 May. This report includes price analysis up to and including 4 June. Continued high prices are likely to lead to higher average 2020-21 prices by the end of June. In the two weeks leading up to 25 May, Queensland’s daily average price was $60/MWh. From 26 May to 4 June, the average daily price was around $250/MWh.
Callide’s sudden outage from the market came on top of four units already being out for maintenance. Since 25 May, there has been eight Queensland coal units offline, totalling 3.4 GW of capacity. Evening peak has had to be met with more gas and higher priced imports from NSW. As well as all four Callide units, Kogan Creek and one unit each at Tarong, Millmerran and Stanwell are offline for maintenance or seasonal operational reasons. Except for Stanwell 2 and Callide C4, AEMO have been informed that all these units will return to service by the end of June5.
Average wholesale prices in 2020-21 increased by $10/MWh from 24 May to 4 June. Figure 2 shows Stanwell have captured these higher prices as they were able to restore Stanwell to service for evening peak on 25 May and have kept receiving high evening prices since the incident. CS Energy has seen an increase of less than $1/MWh since the incident.

GOC PROFIT FORECAST 2021
Figure 2: Impact of Callide C explosion on Price.
Implications for StanwellStanwell’s wholesale price received has risen since the Callide incident. As discussed further in this report, Stanwell were likely already locked into forward contracts with set strike prices. We estimate that Stanwell is likely to receive around $54/MWh for 2020-21, based on contracts signed up to three years ago. This means that they would effectively compensate a retailer or other party when price is higher than $54/MWh, even through price spikes, and be compensated in turn when prices are lower. The Callide C4 incident means that Stanwell might now transfer some revenue back to retailers/loads rather than receiving extra revenue through these contracts.
Stanwell increased output at Stanwell and Tarong by an average of 2.6 GWh/day after the incident, potentially increasing their revenue. Not only have spot prices been high but base load contracts for the remainder of Q2 2021 (to end June) jumped $30/MWh the day after the Callide incident. We will be watching Stanwell’s profit statements carefully to see if they are indeed profiting off CS Energy’s lack of generation, at the expense of the Queensland consumer.
The futures for Q3 2021 (July - September) jumped around $10/MWh immediately following the incident but have since lost most of this increase. It is too soon to tell if the Callide incident and risk of further similar incidents will lead to a long term sustained increase in futures prices.
Implications for CS EnergyCS Energy have had all their units offline or on partial outage since 25 May. This could mean that they have not been able fulfil their forward contracts. We understand that they have business continuity insurance for these situations and therefore assume their eventual revenue will be at the contract prices calculated before the Callide incident.
CS Energy’s bigger concerns going into 2021-22 will be the cost of repairing Callide C4. We believe CS Energy would already be struggling to make a profit while investing the planned $108m into their power stations in 2021-22. Cost estimates for repairing Callide C4 have ranged from $40m to repair a turbine to $200m. These repair costs are not included in this analysis as they are still too uncertain.
6GOC PROFIT FORECAST 2021
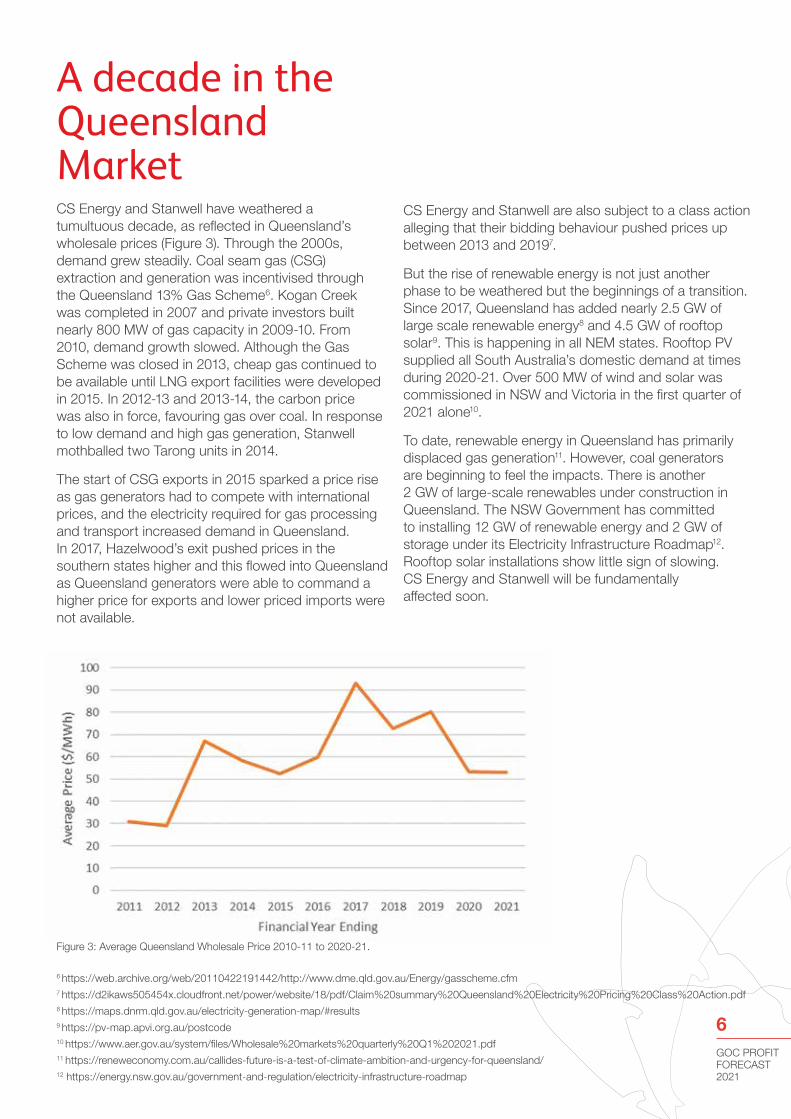
A decade in the Queensland MarketCS Energy and Stanwell have weathered a tumultuous decade, as reflected in Queensland’s wholesale prices (Figure 3). Through the 2000s, demand grew steadily. Coal seam gas (CSG) extraction and generation was incentivised through the Queensland 13% Gas Scheme6. Kogan Creek was completed in 2007 and private investors built nearly 800 MW of gas capacity in 2009-10. From 2010, demand growth slowed. Although the Gas Scheme was closed in 2013, cheap gas continued to be available until LNG export facilities were developed in 2015. In 2012-13 and 2013-14, the carbon price was also in force, favouring gas over coal. In response to low demand and high gas generation, Stanwell mothballed two Tarong units in 2014.
The start of CSG exports in 2015 sparked a price rise as gas generators had to compete with international prices, and the electricity required for gas processing and transport increased demand in Queensland. In 2017, Hazelwood’s exit pushed prices in the southern states higher and this flowed into Queensland as Queensland generators were able to command a higher price for exports and lower priced imports were not available.
CS Energy and Stanwell are also subject to a class action alleging that their bidding behaviour pushed prices up between 2013 and 20197.
But the rise of renewable energy is not just another phase to be weathered but the beginnings of a transition. Since 2017, Queensland has added nearly 2.5 GW of large scale renewable energy8 and 4.5 GW of rooftop solar9. This is happening in all NEM states. Rooftop PV supplied all South Australia’s domestic demand at times during 2020-21. Over 500 MW of wind and solar was commissioned in NSW and Victoria in the first quarter of 2021 alone10.
To date, renewable energy in Queensland has primarily displaced gas generation11. However, coal generators are beginning to feel the impacts. There is another 2 GW of large-scale renewables under construction in Queensland. The NSW Government has committed to installing 12 GW of renewable energy and 2 GW of storage under its Electricity Infrastructure Roadmap12. Rooftop solar installations show little sign of slowing. CS Energy and Stanwell will be fundamentally affected soon.
Figure 3: Average Queensland Wholesale Price 2010-11 to 2020-21.
6 https://web.archive.org/web/20110422191442/http://www.dme.qld.gov.au/Energy/gasscheme.cfm7 https://d2ikaws505454x.cloudfront.net/power/website/18/pdf/Claim%20summary%20Queensland%20Electricity%20Pricing%20Class%20Action.pdf8 https://maps.dnrm.qld.gov.au/electricity-generation-map/#results9 https://pv-map.apvi.org.au/postcode10 https://www.aer.gov.au/system/files/Wholesale%20markets%20quarterly%20Q1%202021.pdf11 https://reneweconomy.com.au/callides-future-is-a-test-of-climate-ambition-and-urgency-for-queensland/12 https://energy.nsw.gov.au/government-and-regulation/electricity-infrastructure-roadmap

GOC PROFIT FORECAST 2021
Generation2020-21As the influx of renewable energy has primarily displaced gas generation, Queensland coal generation in 2020-21 is likely to still be higher than a decade ago in 2011-12. There has been a downward trend in coal generation in Queensland; from a peak of 53 GWh in 2017-18 to 46 GWh in 2020-21. This will be the lowest since 2014-15, when two units of Tarong were mothballed. The fire at Callide C4 and subsequent outage of all Callide units likely reduced overall coal generation in Queensland by around 0.6 GWh in 2020-21.
There is annual variation in individual stations’ output due to planned maintenance and forced outages, but some operational changes are beginning to be seen. Gladstone has reduced output significantly and started operating units more flexibly, that is, online less often. A similar unit decommitment strategy has been seen at Callide B1 and Stanwell 2, with both units offline for more than half the year in 2020-21 as shown in Figure 4. Historically, maintenance has taken units at these stations offline for up to 20% of the time. The sheer amount of time that Callide B1 and Stanwell 2 have been offline indicates that this is an economic decision to turn off a unit and reduce running costs where possible.
Figure 4: Availability of Units at Callide and Stanwell.
Reduced demand due to rooftop solar, combined with cheap energy from large scale renewables is pushing prices so low in the middle of the day that all Queensland coal units dipped their generation during the middle of the day in April 2021.
Figure 5 shows the average generation across the day of Tarong unit 2 in 2016 and 2021. The unit
is operating with much higher rates of change in generation (ramping) than it did five years ago. It is not operating down to its minimum level but the consistent ramping pattern throughout the day shows the impact of renewables especially solar.

8GOC PROFIT FORECAST 2021
Figure 5: Time of Day Operation of Tarong Unit 2 April 2016 vs 2021.
Forecast to 2025The impact of rooftop solar and large-scale renewables on Queensland’s coal generators will only continue to grow. IEEFA and Green Energy Markets forecast coal generation in the NEM in 2025 in their February 2021 report, Fast Erosion of Coal Plant Profits in the National Electricity Market13. This combined forecasts of small14 and large-scale renewables to build a picture of the renewable generation fleet in 2025. Note that this did not include the commitments of NSW Government’s Electricity Infrastructure Roadmap15 to significantly increase large scale renewable energy in NSW.
IEEFA and Green Energy Markets then created time of day forecasts of renewable generation. Rooftop solar reduces operational demand and large-scale renewables were bid into the NEM at close to $0/MWh. Coal generators were assumed to respond in a rational economic manner, so that output was reduced at the most expensive Short Run Marginal Cost (SRMC) plant first. When that plant reached minimum load, the next most expensive plant was
assumed to ramp down. This simplifies complex constraints and bidding behaviour of coal plant but still provides a valuable insight into how much cheaper electricity will be available in the NEM by 2025. This report forecasts that Stanwell’s generation will be reduced by 30% and CS Energy’s by 20% by 2025. CS Energy is forecast to be less affected as Kogan Creek is the second cheapest coal plant in the NEM and therefore, second last to be ramped down.
We assume a steady decline to meet IEEFA’s 2025 estimate as shown in Figure 5. This assumes that CS Energy can compensate for the lack of Callide C4 in 2021-22. This is technically possible as the 2021-22 forecast generation has Kogan Creek running at 75% capacity factor, Callide B at 55% and Callide C at 70%. However, the complexities of Callide C’s joint ownership with Intergen and the higher cost at Callide B may mean that CS Energy operates their fleet differently without Callide C4.
13 https://ieefa.org/wp-content/uploads/2021/02/Coal-Plant-Profitability-Is-Eroding_February-2021.pdf 14 http://www.cleanenergyregulator.gov.au/DocumentAssets/Documents/Small-scale%20solar%20PV% 20modelling%20report%20by%20GEM%20-%20September%202020.pdf15 https://energy.nsw.gov.au/government-and-regulation/electricity-infrastructure-roadmap

GOC PROFIT FORECAST 2021
Figure 6: Forecast Generation CS and Stanwell.
Figure 7: Average time of day price in Queensland.
PriceFigure 3 mapped the significant changes in Queensland’s wholesale electricity prices over the previous decade, and particularly the sharp drop from a 2018-19 to 2019-20.
2020-212020-21 was on track to continue the downward trend in wholesale prices until the Callide incident. As shown in Figure 2, Queensland’s average wholesale price for 2020-21 jumped by $10/MWh from 25 May to 4 June, from $43/MWh to $53/MWh. Figure 7 shows that the increase has been due to higher prices at peak times. The dotted blue line shows average 2020-21 prices to end of April, and the solid blue line to the end of May.
Figure 7 also shows that in 2020-21, average prices during the day and overnight have continued to fall from 2019-20. Daytime prices are now, on average, lower than overnight due to the high prevalence of negative daytime prices. In 2020-21 to the end of May, prices have been below zero for 700 half hour trading intervals. That is over two weeks of cumulative time, around 5% of total trading intervals. It is becoming routine. There have been negatively priced trading intervals on around 40% of days in 2020-21 to the end of May. This is a drastic increase from 2018-19, when there were fewer than 20 trading intervals with negative prices. Overnight prices have also dropped significantly. This is partly due to increase wind capacity in southern states and potentially changes in operation of coal units.

10GOC PROFIT FORECAST 2021
Figure 8: Annual Forward Base Load Contracts.
Forecast to 2025As a result of low prices particularly during the day, Queensland forward contracts out to 2025 have also fallen in price. Figure 8 shows the traded price for base financial year contracts from 2015 to 31 May 2021. Contracts from 2020-21 to 2024-25 have converged just above $40/MWh for nearly a year. This has increased since the Callide incident to the high $40s/MWh particularly for 2021-22, but it is too soon to tell if this reactive nervousness will last and create a meaningful price change.
IEEFA and Green Energy Markets forecast that average prices in the NEM in 2025 would be around $34/MWh if the existing relationship between demand for fossil
16 https://ieefa.org/wp-content/uploads/2021/02/Coal-Plant-Profitability-Is-Eroding_February-2021.pdf 17 https://energy.nsw.gov.au/sites/default/files/2020-12/NSW%20Electricity%20Infrastructure%20Road map%20-%20Detailed%20Report.pdf
fuel power and price stays the same16. Modelling for the NSW Electricity Infrastructure Roadmap by Aurora Energy Research17 forecast that implementing the roadmap would keep wholesale prices at an average of $43/MWh in Queensland throughout the 2020s.
We will use the average forward contract price from 1 April 2020 for 2021-22 to 2024-25 as an estimate of wholesale prices. The average price in 2021-22 to 4 June was $53/MWh. This includes the price uptick since the Callide C4 incident and results in a range of wholesale prices from $53/MWh in 2021-22 to $40/MWh in 2024-25 (Figure 9).

GOC PROFIT FORECAST 2021
Figure 9: Forecast Queensland Wholesale Price.
Figure 10: Forecast Wholesale Revenue
RevenueAccording to their annual reports, CS Energy and Stanwell’s main sources of revenue are:
» Wholesale energy sales
» Hedging through forward contracts
» Retail revenue
» Coal sharing revenue (Stanwell)
Wholesale EnergyBoth CS Energy and Stanwell’s wholesale energy revenue fell dramatically in 2019-20 as prices dropped. As outlined in the above sections on Price and Generation, we expect CS and Stanwell’s generation to fall, while prices stabilise around $40/MWh. The resulting wholesale revenue forecast will decline to 2024-25 (Figure 10). Here, Stanwell’s wholesale revenue in 2020-21 is higher than CS Energy, due to the increase in wholesale prices after the Callide C4 incident. After 2021-22, Stanwell’s revenue is forecast to decrease faster than CS’ because of its higher cost generation reducing ahead of Kogan Creek.

12GOC PROFIT FORECAST 2021
Figure 11: Average wholesale price, price received and estimate through hedging strategy.
HedgingCS and Stanwell both operate complex and confidential hedging through forward contracts. These will contain a mix of standard contracts as traded on the Australian Stock Exchange (ASX) as well as some over the counter contracts, where they trade directly with usually large industrial loads outside the ASX on bespoke terms. In Figure 11, we have loosely replicated CS Energy and Stanwell’s price received for the past three years using the following assumptions:
Under this method, we would expect CS Energy and Stanwell to receive around $54/MWh after hedging in 2020-21. Before the Callide C4 incident, this would likely have been around $10/MWh above the average wholesale price. It is now less than $2/MWh above wholesale prices, and is actually $1.25/MWh less than Stanwell has received on the wholesale market to end May 2021. Stanwell have received a higher price than average by reducing generation at times of low prices (middle of the day) and ramping up for evening peak. CS Energy have received only $45/MWh as none of their plant has been available since the 25 May. Through their insurance, we assume they can still receive $54/MWh, or a $9/MWh benefit from their forward contracts.
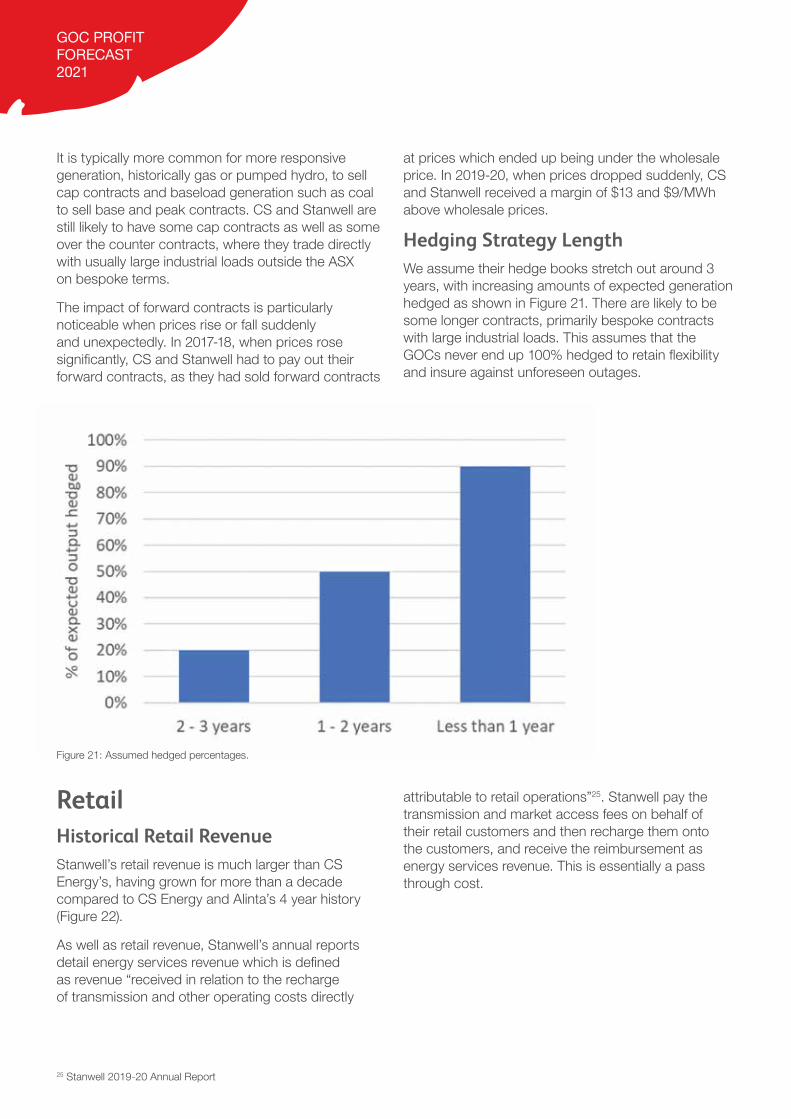
» Hedge books run for three years, with increasing amounts of generation hedged each year, up to 90%.
» Quarterly base contracts can represent higher prices for peak and cap contracts by assuming CS Energy and Stanwell achieve the highest possible base contract quarterly price in a year.
We cannot replicate differences in hedging strategies between CS Energy and Stanwell. In 2019-20, CS Energy received a higher price than Stanwell and the opposite was true in 2017-18. We have to assume they have consistent hedging strategies going forward.
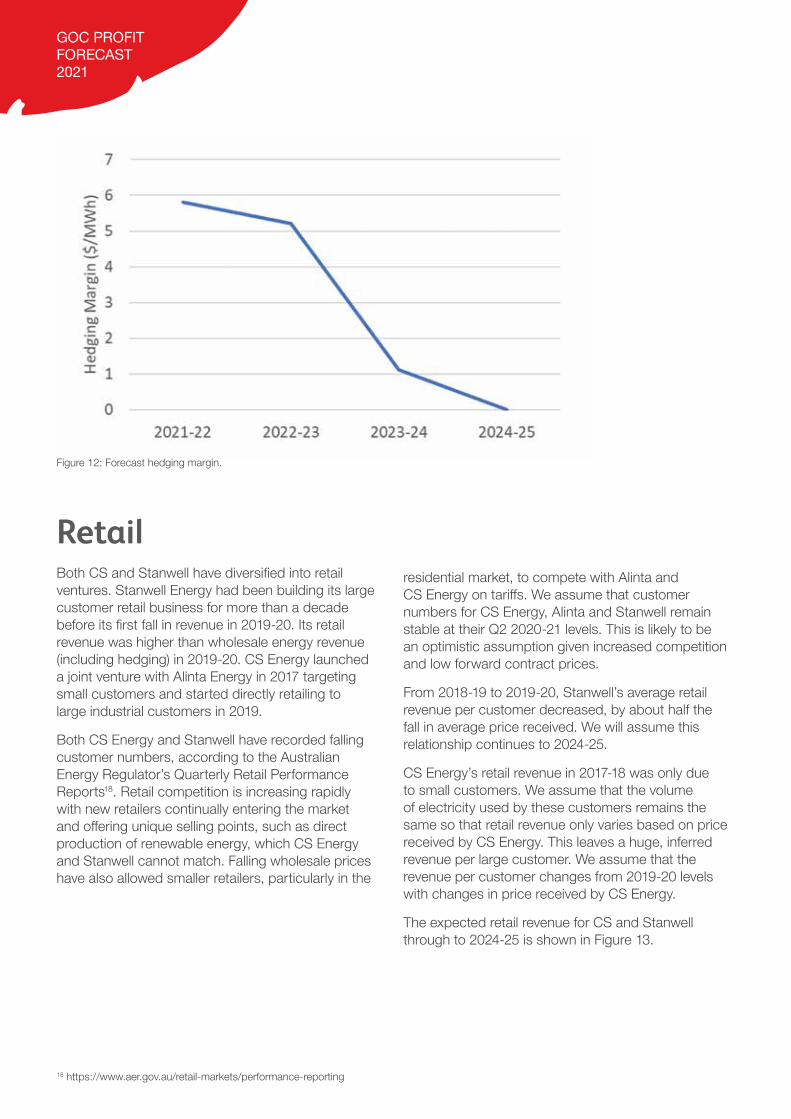
We expect CS Energy and Stanwell to be able to receive higher than wholesale prices through their hedging in 2021-22 and 2022-23, as they would have sold contracts before prices crashed in late 2019/early 2020. However, as wholesale price projections and forward contracts converge around $40/MWh we do not expect CS Energy and Stanwell to continue to receive significant margins through their hedging (Figure 12).
GOC PROFIT FORECAST 2021
Figure 12: Forecast hedging margin.
RetailBoth CS and Stanwell have diversified into retail ventures. Stanwell Energy had been building its large customer retail business for more than a decade before its first fall in revenue in 2019-20. Its retail revenue was higher than wholesale energy revenue (including hedging) in 2019-20. CS Energy launched a joint venture with Alinta Energy in 2017 targeting small customers and started directly retailing to large industrial customers in 2019.
Both CS Energy and Stanwell have recorded falling customer numbers, according to the Australian Energy Regulator’s Quarterly Retail Performance Reports18. Retail competition is increasing rapidly with new retailers continually entering the market and offering unique selling points, such as direct production of renewable energy, which CS Energy and Stanwell cannot match. Falling wholesale prices have also allowed smaller retailers, particularly in the
residential market, to compete with Alinta and CS Energy on tariffs. We assume that customer numbers for CS Energy, Alinta and Stanwell remain stable at their Q2 2020-21 levels. This is likely to be an optimistic assumption given increased competition and low forward contract prices.
From 2018-19 to 2019-20, Stanwell’s average retail revenue per customer decreased, by about half the fall in average price received. We will assume this relationship continues to 2024-25.
CS Energy’s retail revenue in 2017-18 was only due to small customers. We assume that the volume of electricity used by these customers remains the same so that retail revenue only varies based on price received by CS Energy. This leaves a huge, inferred revenue per large customer. We assume that the revenue per customer changes from 2019-20 levels with changes in price received by CS Energy.
The expected retail revenue for CS and Stanwell through to 2024-25 is shown in Figure 13.
18 https://www.aer.gov.au/retail-markets/performance-reporting
14GOC PROFIT FORECAST 2021
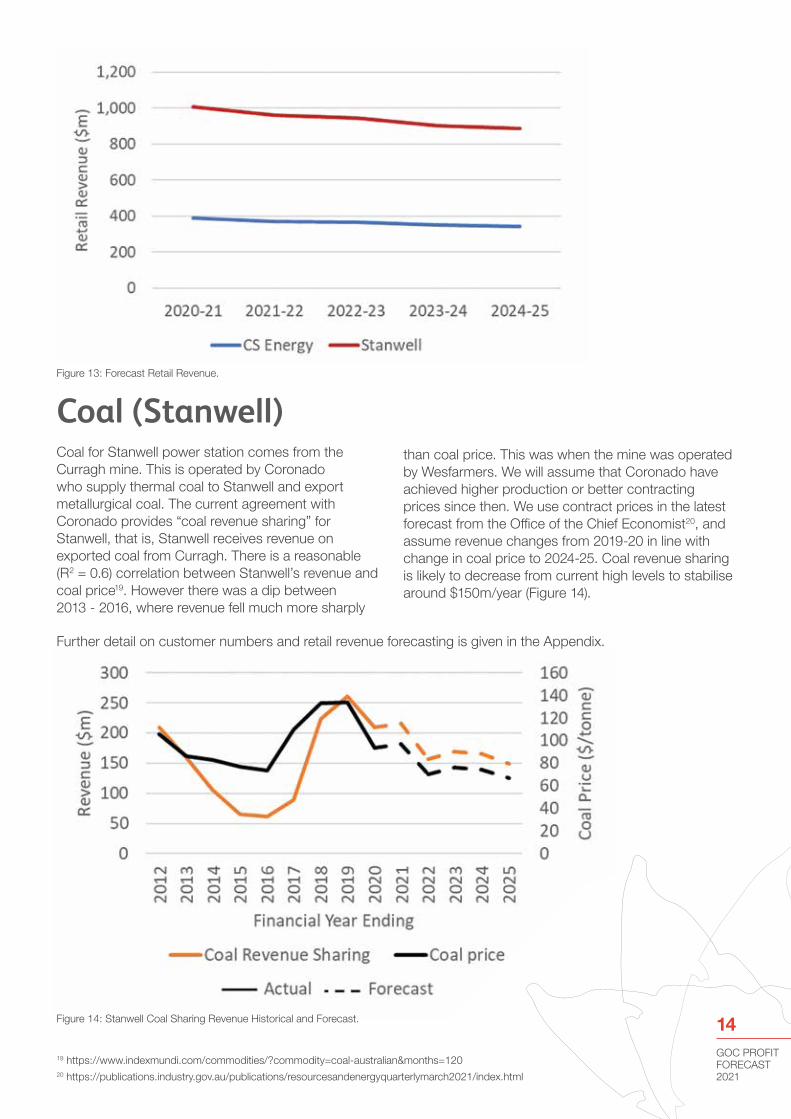
Figure 13: Forecast Retail Revenue.
Coal (Stanwell)Coal for Stanwell power station comes from the Curragh mine. This is operated by Coronado who supply thermal coal to Stanwell and export metallurgical coal. The current agreement with Coronado provides “coal revenue sharing” for Stanwell, that is, Stanwell receives revenue on exported coal from Curragh. There is a reasonable (R2 = 0.6) correlation between Stanwell’s revenue and coal price19. However there was a dip between 2013 - 2016, where revenue fell much more sharply
than coal price. This was when the mine was operated by Wesfarmers. We will assume that Coronado have achieved higher production or better contracting prices since then. We use contract prices in the latest forecast from the Office of the Chief Economist20, and assume revenue changes from 2019-20 in line with change in coal price to 2024-25. Coal revenue sharing is likely to decrease from current high levels to stabilise around $150m/year (Figure 14).
Figure 14: Stanwell Coal Sharing Revenue Historical and Forecast.
19 https://www.indexmundi.com/commodities/?commodity=coal-australian&months=12020 https://publications.industry.gov.au/publications/resourcesandenergyquarterlymarch2021/index.html
Further detail on customer numbers and retail revenue forecasting is given in the Appendix.
GOC PROFIT FORECAST 2021
In 2018-19, Stanwell negotiated a new, long term coal supply agreement with Coronado from 2027 – 2038. This agreement does not include the coal revenue sharing agreement, so this revenue stream will not exist for Stanwell beyond 202621.
Other Revenue StreamsThe following revenue streams are assumed to stay at their past four year average out to 2024-25:
» Coal on-sale (Stanwell), domestic sale of coal from Curragh mine
» O&M Services (CS Energy), related to CS Energy’s operation of jointly owned Callide C
» Environmental Certificates (Stanwell)
» Other revenue and income
» Finance income
CostsCS Energy and Stanwell’s annual reports have been examined to understand their cost centres. The major cost categories which are likely to change to 2024-25 are:
» Electricity and energy service expenses
» Fuel Costs
» Depreciation and amortisation
Electricity and energy services expensesThe biggest expense line item for CS and Stanwell is electricity and energy services expenses. This includes capital investment in power stations as well as ancillary services, market fees and environmental levies for both the wholesale generation business and the retail business.
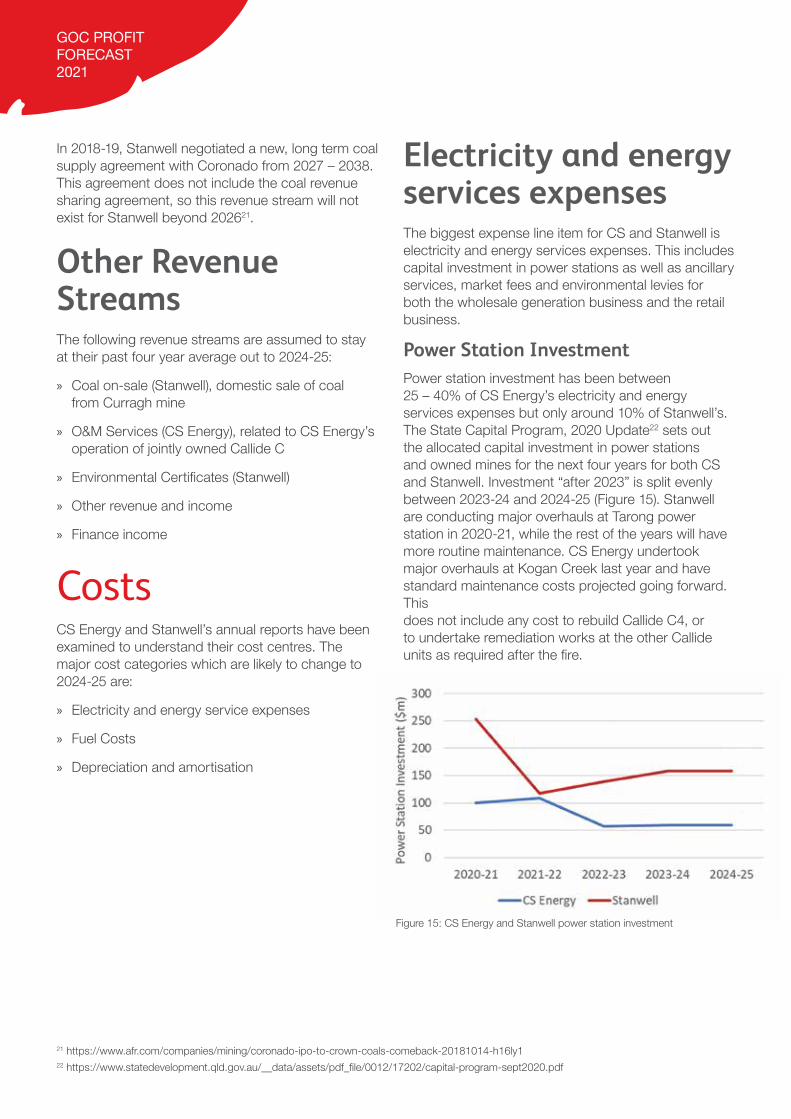
Power Station InvestmentPower station investment has been between 25 – 40% of CS Energy’s electricity and energy services expenses but only around 10% of Stanwell’s. The State Capital Program, 2020 Update22 sets out the allocated capital investment in power stations and owned mines for the next four years for both CS and Stanwell. Investment “after 2023” is split evenly between 2023-24 and 2024-25 (Figure 15). Stanwell are conducting major overhauls at Tarong power station in 2020-21, while the rest of the years will have more routine maintenance. CS Energy undertook major overhauls at Kogan Creek last year and have standard maintenance costs projected going forward. This does not include any cost to rebuild Callide C4, or to undertake remediation works at the other Callide units as required after the fire.
21 https://www.afr.com/companies/mining/coronado-ipo-to-crown-coals-comeback-20181014-h16ly122 https://www.statedevelopment.qld.gov.au/__data/assets/pdf_file/0012/17202/capital-program-sept2020.pdf
Figure 15: CS Energy and Stanwell power station investment
16GOC PROFIT FORECAST 2021
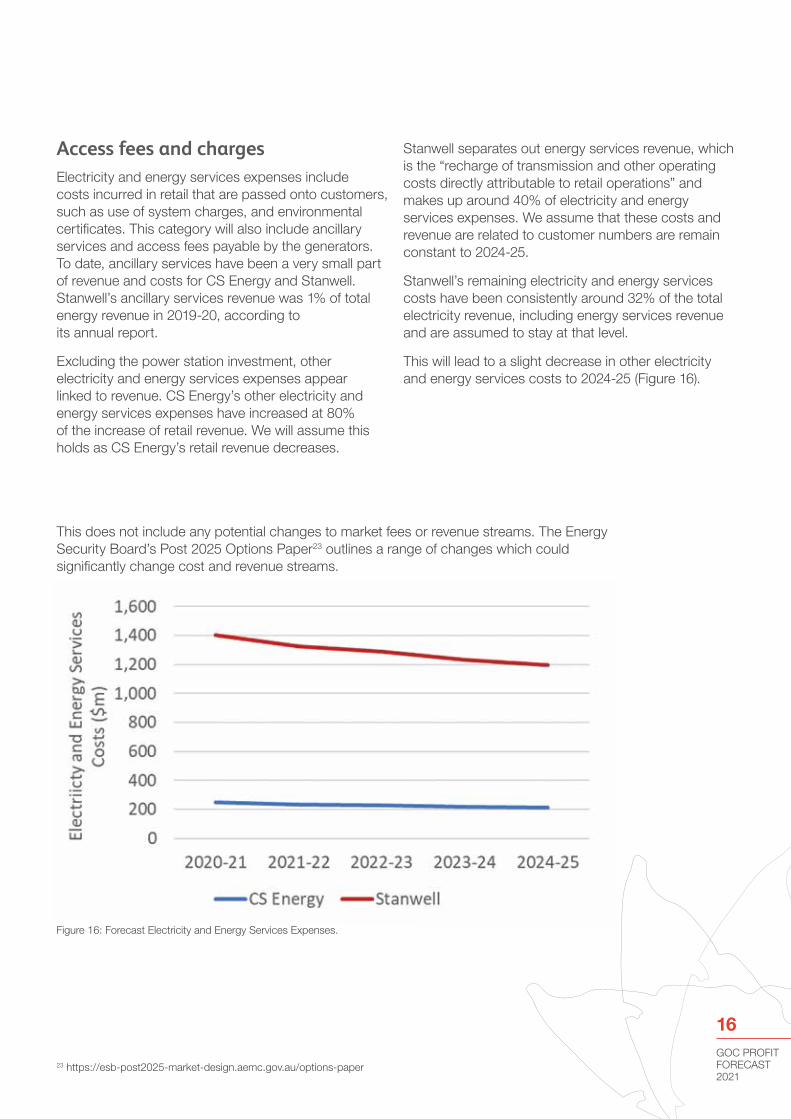
Figure 16: Forecast Electricity and Energy Services Expenses.
Access fees and chargesElectricity and energy services expenses include costs incurred in retail that are passed onto customers, such as use of system charges, and environmental certificates. This category will also include ancillary services and access fees payable by the generators. To date, ancillary services have been a very small part of revenue and costs for CS Energy and Stanwell. Stanwell’s ancillary services revenue was 1% of total energy revenue in 2019-20, according to its annual report.
Excluding the power station investment, other electricity and energy services expenses appear linked to revenue. CS Energy’s other electricity and energy services expenses have increased at 80% of the increase of retail revenue. We will assume this holds as CS Energy’s retail revenue decreases.
This does not include any potential changes to market fees or revenue streams. The Energy Security Board’s Post 2025 Options Paper23 outlines a range of changes which could significantly change cost and revenue streams.
Stanwell separates out energy services revenue, which is the “recharge of transmission and other operating costs directly attributable to retail operations” and makes up around 40% of electricity and energy services expenses. We assume that these costs and revenue are related to customer numbers are remain constant to 2024-25.
Stanwell’s remaining electricity and energy services costs have been consistently around 32% of the total electricity revenue, including energy services revenue and are assumed to stay at that level.
This will lead to a slight decrease in other electricity and energy services costs to 2024-25 (Figure 16).
23 https://esb-post2025-market-design.aemc.gov.au/options-paper

GOC PROFIT FORECAST 2021
FuelFuel costs will decrease with forecast decreasing generation (Figure 17). We have forecast fuel cost by reducing 2019-20 costs by the same proportion as generation, e.g. a 5% decrease in generation will lead to a 5% decrease in fuel costs. This assumes that coal prices will stay constant at the plant to 2024-25 which
DeprecationIn 2019-20, CS Energy and Stanwell both recorded significant write downs, or impairments, of their assets. This reduces the asset value and therefore reduces depreciation and amortisation costs. CS Energy report that power stations account for 80% of total depreciation. These power stations were written down by 25% in 2019-20, so we assume that 2019-20 depreciation costs are reduced by 20% going forward. This does not account for further investment in capital at power stations, or further write downs.
Stanwell reports that the impairment in 2019-20 covered all the associated equipment as well as generation plant. Stanwell’s total assets were impaired by nearly 30%, so we assume that depreciation costs going forward are 30% lower and remain constant.
is in line with AEMO forecasts24 for CS Energy and slightly optimistic for Stanwell.
AEMO reported fuel costs and heat rates are not used to calculate fuel costs from the bottom up as this overestimates Stanwell’s reported fuel costs by around 20%.
Other costsThe following costs are assumed to stay at the last four years average. Four years has been chosen as the annual reports have had the same format and categories for four years.
» Employee benefit expenses
» Raw materials
» Other
» Services and consultants
» Finance
» Operating and capacity payments (CS Energy)
24 https://aemo.com.au/en/energy-systems/major-publications/integrated-system-plan-isp/2022-integrated-system-plan-isp/current-inputs- assumptions-and-scenarios
Figure 17: Forecast Fuel Costs.

18GOC PROFIT FORECAST 2021
Factors not included in forecastDue to a lack of publicly available data we have not included the following factors in our forecast:
» CS Energy Onerous Contract with Gladstone power station
» Further write downs or impairments
» Non hedge accounted change in fair value of forward contracts already signed
Further information on these factors is included in the Appendix.
If CS and Stanwell could maintain around $55/MWh, the GOCs overall would maintain profitability (Figure 19). Note that CS would only just be breaking even, with Stanwell propping up the profits. This matches more closely with Government budget forecasts for the next two years and provides an indication of the price forecasts used in the Budget modelling.
Price Sensitivity AnalysisThe wholesale price and hedging margin CS and Stanwell achieve are the biggest drivers of profits and the hardest to predict. We have assessed the impact of three different price scenarios. The total price received, a combination of wholesale price and hedging margin, is shown in Figure 18.
Under our steady price forecast, declining generation due to increasing competition from renewables will still lead to a decline in profits to 2025. Prices around 10% lower will see GOCs start to lose money from 2022-23, and will halve the cumulative profits before tax over the five years from around $1bn to $500m.
Figure 18: Price Scenarios.

GOC PROFIT FORECAST 2021
Further analysis of the impact of generation and coal export prices is included in the Appendix.
Figure 19: Profits under different price scenarios.
20GOC PROFIT FORECAST 2021
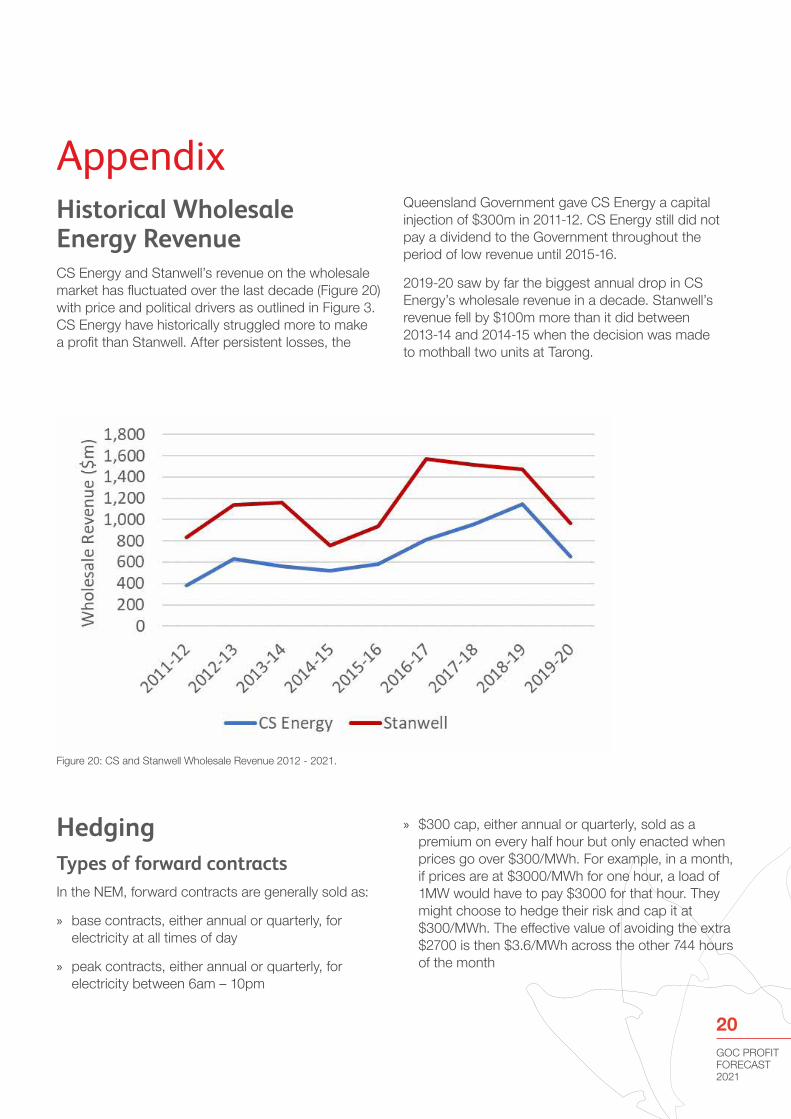
AppendixHistorical Wholesale Energy Revenue CS Energy and Stanwell’s revenue on the wholesale market has fluctuated over the last decade (Figure 20) with price and political drivers as outlined in Figure 3. CS Energy have historically struggled more to make a profit than Stanwell. After persistent losses, the
HedgingTypes of forward contractsIn the NEM, forward contracts are generally sold as:
» base contracts, either annual or quarterly, for electricity at all times of day
» peak contracts, either annual or quarterly, for electricity between 6am – 10pm
Queensland Government gave CS Energy a capital injection of $300m in 2011-12. CS Energy still did not pay a dividend to the Government throughout the period of low revenue until 2015-16.
2019-20 saw by far the biggest annual drop in CS Energy’s wholesale revenue in a decade. Stanwell’s revenue fell by $100m more than it did between 2013-14 and 2014-15 when the decision was made to mothball two units at Tarong.
» $300 cap, either annual or quarterly, sold as a premium on every half hour but only enacted when prices go over $300/MWh. For example, in a month, if prices are at $3000/MWh for one hour, a load of 1MW would have to pay $3000 for that hour. They might choose to hedge their risk and cap it at $300/MWh. The effective value of avoiding the extra $2700 is then $3.6/MWh across the other 744 hours of the month
Figure 20: CS and Stanwell Wholesale Revenue 2012 - 2021.
GOC PROFIT FORECAST 2021
It is typically more common for more responsive generation, historically gas or pumped hydro, to sell cap contracts and baseload generation such as coal to sell base and peak contracts. CS and Stanwell are still likely to have some cap contracts as well as some over the counter contracts, where they trade directly with usually large industrial loads outside the ASX on bespoke terms.
The impact of forward contracts is particularly noticeable when prices rise or fall suddenly and unexpectedly. In 2017-18, when prices rose significantly, CS and Stanwell had to pay out their forward contracts, as they had sold forward contracts
RetailHistorical Retail RevenueStanwell’s retail revenue is much larger than CS Energy’s, having grown for more than a decade compared to CS Energy and Alinta’s 4 year history (Figure 22).
As well as retail revenue, Stanwell’s annual reports detail energy services revenue which is defined as revenue “received in relation to the recharge of transmission and other operating costs directly
at prices which ended up being under the wholesale price. In 2019-20, when prices dropped suddenly, CS and Stanwell received a margin of $13 and $9/MWh above wholesale prices.
Hedging Strategy LengthWe assume their hedge books stretch out around 3 years, with increasing amounts of expected generation hedged as shown in Figure 21. There are likely to be some longer contracts, primarily bespoke contracts with large industrial loads. This assumes that the GOCs never end up 100% hedged to retain flexibility and insure against unforeseen outages.
attributable to retail operations”25. Stanwell pay the transmission and market access fees on behalf of their retail customers and then recharge them onto the customers, and receive the reimbursement as energy services revenue. This is essentially a pass through cost.
Figure 21: Assumed hedged percentages.
25 Stanwell 2019-20 Annual Report

22GOC PROFIT FORECAST 2021
Customer NumbersAccording to AER data27, Stanwell’s customer base peaked at just over 1,800 large industrial companies in 2018-19 before dropping in 2019-20. This does not include Victoria, as it is not covered by the same rules and regulations as the rest of the states. In 2020-21 so far, it has fallen by 20 customers to 1,653. The sudden rise and fall in Figure 23 is likely to be due to a group procurement frame coming to and then leaving Stanwell. This means that Stanwell could attract further customers through a framework.
However, an increasing number of customers, even large industrial ones, are demanding renewable energy28 which Stanwell cannot directly provide and competition is increasing, with another 5 retailers entering the large customer space in the last year. We assume that Stanwell will retain its customer numbers as at Q2 2020-21. We believe that this is an optimistic assumption given the increasing competition and demand for renewable energy.
Figure 22: Retail Revenue 2011-12 to 2019-2026
26 Note that Stanwell have only report retail revenue as distinct from wholesale energy revenue since 2016-17. Before then, retail revenue is estimated based on energy services revenue. 27 https://www.aer.gov.au/retail-markets/performance-reporting28 https://reenergise.org/
Figure 23: Stanwell Customer Numbers.

GOC PROFIT FORECAST 2021
The Alinta branded venture with CS Energy rapidly attracted small business and residential customers since launching in 2017 (Figure 24) as the partnership with CS Energy allowed Alinta to offer cheaper rates. However small customer numbers stagnated in 2019-20 and have fallen in 2020-21 to date. Competition in small business and residential retail is growing even faster than the industrial space. Retailers are entering which can offer unique selling points, from community ownership to pass through of wholesale prices. Many of these have been able to take advantage of lower wholesale prices to compete with Alinta on retail tariffs. These retail offerings and competition are likely to continue to grow and keep eroding customers from Alinta and CS Energy’s joint venture.
CS Energy also started retailing directly to large customers in 2019-20. Although there are very few large customers, they have a massive impact on revenue. CS Energy’s retail revenue grew from 2018-19 to 2019-20, because growth in large customers offset a stagnation of growth in small customers and a reduction in average price received. We assume that CS customer numbers remain constant. While they may recruit more large customers, they are likely to continue losing small customers, and in both markets will face increased competition as discussed above for Stanwell.
Figure 24: CS Energy Customer Numbers.
24GOC PROFIT FORECAST 2021
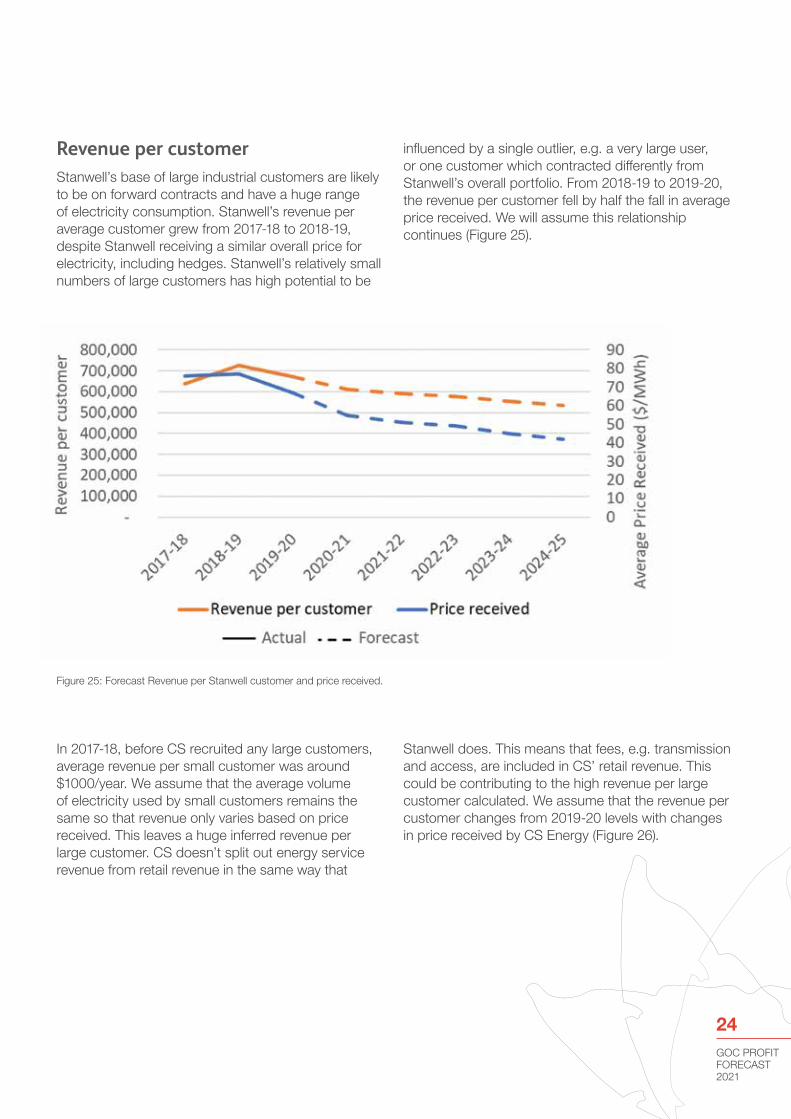
Revenue per customerStanwell’s base of large industrial customers are likely to be on forward contracts and have a huge range of electricity consumption. Stanwell’s revenue per average customer grew from 2017-18 to 2018-19, despite Stanwell receiving a similar overall price for electricity, including hedges. Stanwell’s relatively small numbers of large customers has high potential to be
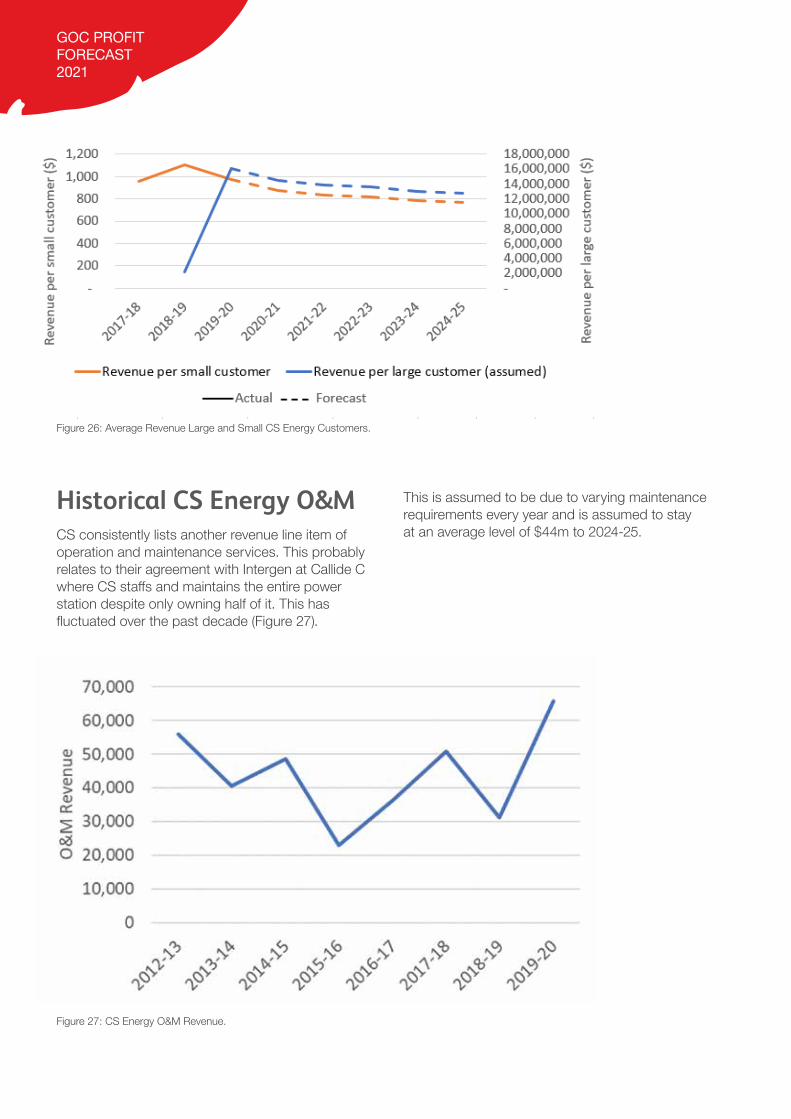
In 2017-18, before CS recruited any large customers, average revenue per small customer was around $1000/year. We assume that the average volume of electricity used by small customers remains the same so that revenue only varies based on price received. This leaves a huge inferred revenue per large customer. CS doesn’t split out energy service revenue from retail revenue in the same way that
influenced by a single outlier, e.g. a very large user, or one customer which contracted differently from Stanwell’s overall portfolio. From 2018-19 to 2019-20, the revenue per customer fell by half the fall in average price received. We will assume this relationship continues (Figure 25).
Stanwell does. This means that fees, e.g. transmission and access, are included in CS’ retail revenue. This could be contributing to the high revenue per large customer calculated. We assume that the revenue per customer changes from 2019-20 levels with changes in price received by CS Energy (Figure 26).
Figure 25: Forecast Revenue per Stanwell customer and price received.
GOC PROFIT FORECAST 2021
Historical CS Energy O&MCS consistently lists another revenue line item of operation and maintenance services. This probably relates to their agreement with Intergen at Callide C where CS staffs and maintains the entire power station despite only owning half of it. This has fluctuated over the past decade (Figure 27).
This is assumed to be due to varying maintenance requirements every year and is assumed to stay at an average level of $44m to 2024-25.
Figure 26: Average Revenue Large and Small CS Energy Customers.
Figure 27: CS Energy O&M Revenue.

26GOC PROFIT FORECAST 2021
Gas sales – StanwellStanwell was an active trader in the Walumbilla Hub and Brisbane Short Term Trading Market between 2014-15 and 2019-20. Between 2015-16 and 2018-19, gas sales through bilateral agreements, the Walumbilla Hub and transport capacity on the Roma – Brisbane pipeline generated an average of $93m annual revenue. These gas supply agreements were transferred to CleanCo. $26m in gas sales revenue was reported in 2019-20, assumed to be legacy contracts. Stanwell now has no active stake in gas sales and no revenue is assumed going forward.
Environmental Certificates – StanwellStanwell has recorded revenue from environmental certificates over the past decade, reaching up to $22m in 2014-15 from environmental certificates. The hydro
assets which create LGCs have been transferred to CleanCo so Stanwell’s revenue from environmental certificates dropped to $10m in 2019-20. Stanwell still has a significant inventory of environmental certificates, valued at $49m in 2019-20. Stanwell is likely to continue trading in LGCs through its stockpile and PPAs, but this is expected to be a small total trade and even smaller profit margin for Stanwell.
Environmental certificates revenue are assumed to be constant at 2019-20 levels of $10m.
CostsCS Energy and Stanwell’s annual reports have been examined to understand their cost centres. The cost categories reported by CS Energy and Stanwell are shown below, as a proportion of total 2019-20 costs. The categories are broken down into further detail in Figure 28.
Figure 28: Cost Breakdown CS Energy and Stanwell 2019-20.

GOC PROFIT FORECAST 2021
Electricity and energy services expensesCS Energy have provided a breakdown of this for the past three years, shown in Figure 29. Wholesale energy is primarily investment in power stations as capital works. As a proportion of electricity and energy services expenses, wholesale energy and ancillary
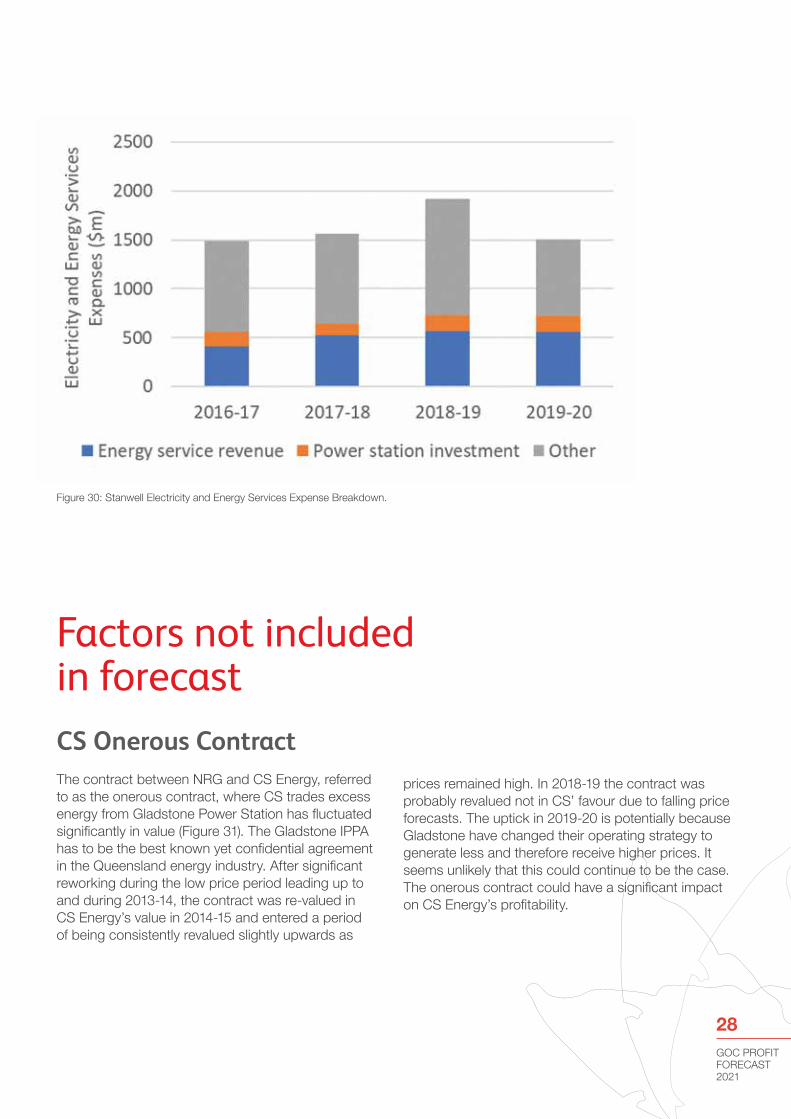
Stanwell’s energy services revenue is assumed to stay constant with customer numbers. We assume that this is a direct pass through of costs and included in electricity and energy services costs. After energy services and power station investment, there is still a large component of the energy and electricity services costs which is not broken down (Figure 30). These other costs have not been strongly correlated with price received by Stanwell or number of Stanwell customers. However they have been consistently around 32% of the total electricity revenue (wholesale, retail and energy services) and are assumed to stay at that level.
services have gone down, as prices for ancillary services have also decreased with wholesale prices in the last three years. Environmental costs have gone up, as LGC prices have gone up but also potentially indicating that more retail customers are requesting green power, requiring CS to procure more LGCs.
Figure 29: CS Energy Electricity and Energy Services Expense Breakdown.
28GOC PROFIT FORECAST 2021
CS Onerous Contract The contract between NRG and CS Energy, referred to as the onerous contract, where CS trades excess energy from Gladstone Power Station has fluctuated significantly in value (Figure 31). The Gladstone IPPA has to be the best known yet confidential agreement in the Queensland energy industry. After significant reworking during the low price period leading up to and during 2013-14, the contract was re-valued in CS Energy’s value in 2014-15 and entered a period of being consistently revalued slightly upwards as
prices remained high. In 2018-19 the contract was probably revalued not in CS’ favour due to falling price forecasts. The uptick in 2019-20 is potentially because Gladstone have changed their operating strategy to generate less and therefore receive higher prices. It seems unlikely that this could continue to be the case. The onerous contract could have a significant impact on CS Energy’s profitability.
Figure 30: Stanwell Electricity and Energy Services Expense Breakdown.
Factors not included in forecast

GOC PROFIT FORECAST 2021
ImpairmentsThe 2019-20 impairments were discussed above in the depreciation forecasts. These significantly reduced the expected recoverable value of Callide, Stanwell and Tarong power stations. Under the forecast presented above, CS and Stanwell will be hard pressed to recover any value from the assets before 2025. It is likely that CS and Stanwell, along with QTC, are working with forecasters and modellers to conduct more impairments and reduce recoverable value further. Further impairments would appear as losses on CS and Stanwell’s profit/loss reconciliation and present an even grimmer outlook for the next five years.
Non hedge accounted change in fair valueIn 2019-20, Stanwell’s reported loss included over $300m in changes to fair value of non-hedged contracts. This means contracts which have been sold, valued into the profit/loss statement but not at a fixed price. These may be tied to the eventual wholesale price with a margin, for example. This loss is expected to be so big because of the sudden drop in prices. Stanwell estimated their vulnerability to a 30% drop in forward contracts to be $123m in 2019-20. Stanwell might be expected to post an additional up to $100m loss in 2020-21, which would significantly reduce profits.
CS analysed their vulnerability to a 10% reduction in forward contracts to be $22m. If this holds true to scale up, a 30% reduction will lead to an additional $66m loss on CS’ 2020-21 accounts. This would dwarf their meagre operating profit forecast in the above methodology and instead lead to a $50m loss. The overall profits of the GOCs would then be less than half of the Queensland budget forecast.
Figure 31: Onerous Contract 2013-14 to 2019-20.

30GOC PROFIT FORECAST 2021
Sensitivity AnalysisGenerationIncreased generation would increase wholesale and hedging revenue. The relationship between retail revenue and amount generated is not clear. We have assumed that the two are not related, and retail revenue is determined by price received and number of customers. This is more likely to be true while generation is higher than direct retail sales. Potentially as generation decreases over time, retail revenue will become more dependent on generation. However, the opposite could also become true as Stanwell and CS enter into more PPAs and other procurement of renewable energy.
Coal PricesStanwell’s coal revenue sharing arrangement in 2019-20 contributed over $200m to their balance sheet. Based on the Chief Economist’s coal forecast, this will decrease to just under $145m by 2024-25. In our forecasts, Stanwell would be making an operating loss from 2023-24, without the coal
Assuming retail revenue is not dependent on generation, maintaining the generation at 2020-21 levels would ensure GOCs remain marginally profitable out to 2024-25 (Figure 32). The profits would still be materially lower than forecast in the budget though. CS Energy would still lose money from 2021-22. Alternatively, if renewable energy erodes generation faster than forecast, profits will decrease, in the same shape which is dictated by the price forecast.
revenue sharing arrangement. If coal prices do not drop as forecast in 2021-22 but instead increase at 10% per year, Stanwell could add more than $150m to its operating profits in 2024-25, compared to the base coal forecast. Conversely, if prices continue to drop to $50/tonne by 2024-25, Stanwell would lose an additional $40m.
Figure 32: Profits under different generation scenarios.

queenslandconservation.org.au
Queensland’s voice for the environment since 1969
PROTECT | CONSERVE | SUSTAIN