Forcepoint UEBA User Manual · Forcepoint UEBA Administration and Troubleshooting Manual 5...
97
© 2019 Forcepoint Forcepoint UEBA User Manual User Manual | Forcepoint UEBA | v3.0.x | 10-Jul-2018 Overview How Does Forcepoint UEBA Work? Forcepoint UEBA ingests and analyzes user activity-based scenarios (Events, such as logins, print jobs, etc) and non-activity-based scenarios (Entity information such as HR data) within a company. Forcepoint UEBA then applies a layered set of scoring functions and analytics to deliver insights based on what people do and who they are. These insights are ultimately prepared and visually delivered to provide insider threat teams with a powerful behavioral analysis to identify and mitigate internal risk. The value of Forcepoint UEBA lies not only in its analytic power, but also in its simplistic and intuitive data visualization. The Forcepoint UEBA Information Model (RIM) maps data from different sources into a consistent data model that can be easily understood and analyzed. Classifying The Data Entity An Entity is defined as “who they are”. Entities can include any of the following: ● People ● Files ● Network devices ● Phone numbers ● Bank accounts Entities have the following components: ● Identifier (e.g., John Smith) ● Aliases (e.g., "[email protected]", "456-1234", "workstation-john")
Transcript of Forcepoint UEBA User Manual · Forcepoint UEBA Administration and Troubleshooting Manual 5...
Forcepoint UEBA User Manual
User Manual | Forcepoint UEBA | v3.0.x | 10-Jul-2018
Overview
How Does Forcepoint UEBA Work?
Forcepoint UEBA ingests and analyzes user activity-based scenarios (Events, such as logins, print jobs, etc) and non-activity-based scenarios (Entity information such as HR data) within a company. Forcepoint UEBA then applies a layered set of scoring functions and analytics to deliver insights based on what people do and who they are.
These insights are ultimately prepared and visually delivered to provide insider threat teams with a powerful behavioral analysis to identify and mitigate internal risk. The value of Forcepoint UEBA lies not only in its analytic power, but also in its simplistic and intuitive data visualization. The Forcepoint UEBA Information Model (RIM) maps data from different sources into a consistent data model that can be easily understood and analyzed.
Classifying The Data
Entity
An Entity is defined as “who they are”. Entities can include any of the following:
● People
● Files
● Network devices
● Phone numbers
● Bank accounts
Entities have the following components:
● Identifier (e.g., John Smith)
● Aliases (e.g., "[email protected]", "456-1234", "workstation-john")
© 2019 Forcepoint
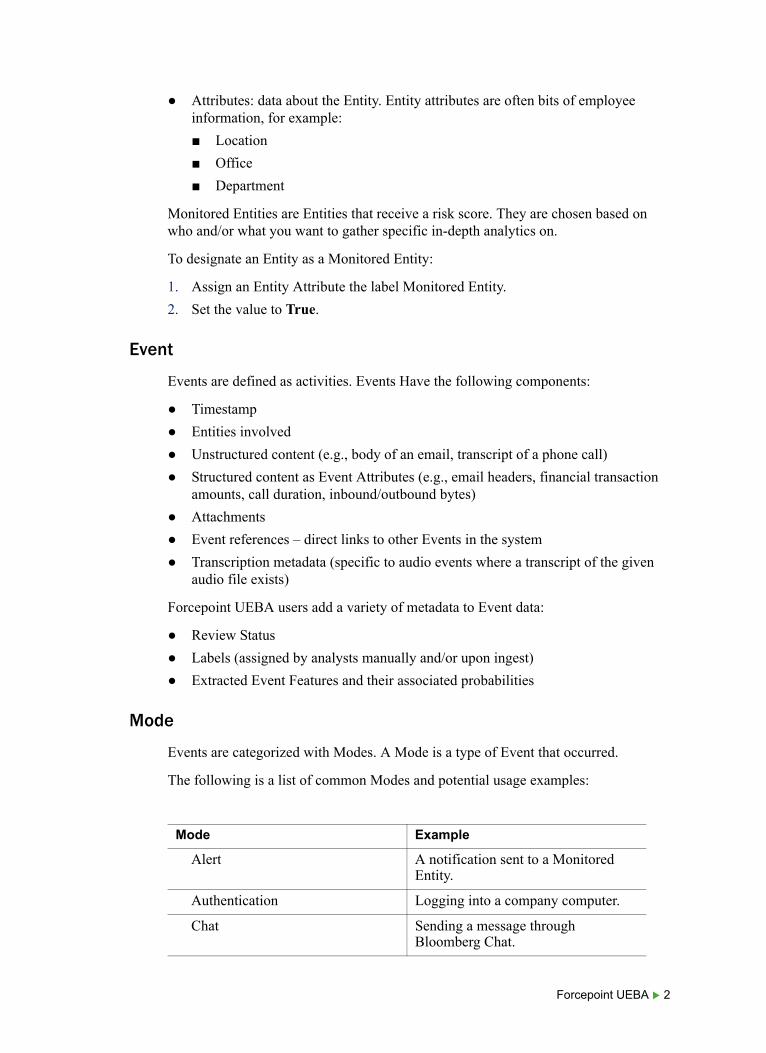
● Attributes: data about the Entity. Entity attributes are often bits of employee information, for example:
■ Location
■ Office
■ Department
Monitored Entities are Entities that receive a risk score. They are chosen based on who and/or what you want to gather specific in-depth analytics on.
To designate an Entity as a Monitored Entity:
1. Assign an Entity Attribute the label Monitored Entity.
2. Set the value to True.
Event
Events are defined as activities. Events Have the following components:
● Timestamp
● Entities involved
● Unstructured content (e.g., body of an email, transcript of a phone call)
● Structured content as Event Attributes (e.g., email headers, financial transaction amounts, call duration, inbound/outbound bytes)
● Attachments
● Event references – direct links to other Events in the system
● Transcription metadata (specific to audio events where a transcript of the given audio file exists)
Forcepoint UEBA users add a variety of metadata to Event data:
● Review Status
● Labels (assigned by analysts manually and/or upon ingest)
● Extracted Event Features and their associated probabilities
Mode
Events are categorized with Modes. A Mode is a type of Event that occurred.
The following is a list of common Modes and potential usage examples:
Mode Example
Alert A notification sent to a Monitored Entity.
Authentication Logging into a company computer.
Chat Sending a message through Bloomberg Chat.
Forcepoint UEBA 2

Identifying Risk by Profiling Behaviors
Model
While Event Features identify certain aspects of an Event, Event Models score Events. Models can include a set of Event Features or Entity Features, and help us clearly categorize single events.
Scenario
To detect increasingly risky activity over time, Scenarios are used to profile activity and anomalies of interest. Scenarios are sets of Models that assign a score to an Entity.
Scenarios are used for reporting how Entities behave within a Forcepoint UEBA deployment. Forcepoint UEBA begins deployments using a standard set of predefined Scenarios, called the Forcepoint UEBA Behavioral Analytics Model (RBAM). Scenarios are the pinnacle of all aggregated Forcepoint UEBA data, and are the tools that provide final profiles and risk scores for Entities.
Risk Score
Risk Scores help us see which Entities are behaving different than usual. If a Monitored Entity is consistently partaking in specific types of activity, the activity will not be deemed unusual. Monitored Entities who receive high Risk Scores, on the other hand, may need to be investigated. Scenario scores help us identify these habits and behaviors. The Scenario score is then rolled into a Risk Score, which represents an Entity’s overall activity.
Data-Movement Copying a file from a shared directory to a personal directory.
Email Sending an email.
Physical Badge swiping into an office.
Process Installing a new application with Ubuntu.
Trade Selling shares of a stock.
Voice Making a phone call.
Web Navigating to marketwatch.com.
Web-Search Searching for glassdoor reviews with Google.
Mode Example
Forcepoint UEBA Administration and Troubleshooting Manual 3

Getting Started
End User Requirements
A modern web browser is required to use Forcepoint UEBA. For more details on browser compatibility, see the Installation Manual.
● Chrome 65+
● Firefox 59 +
● Internet Explorer 11+
Logging Into The Forcepoint UEBA User Interface
To log into Forcepoint UEBA:
1. Navigate to the Forcepoint UEBA login URL that has been provided to you by your Forcepoint UEBA administrator.
2. In the login prompt, enter your email address and password.
3. Click Log In..
Forcepoint UEBA 4
Navigation
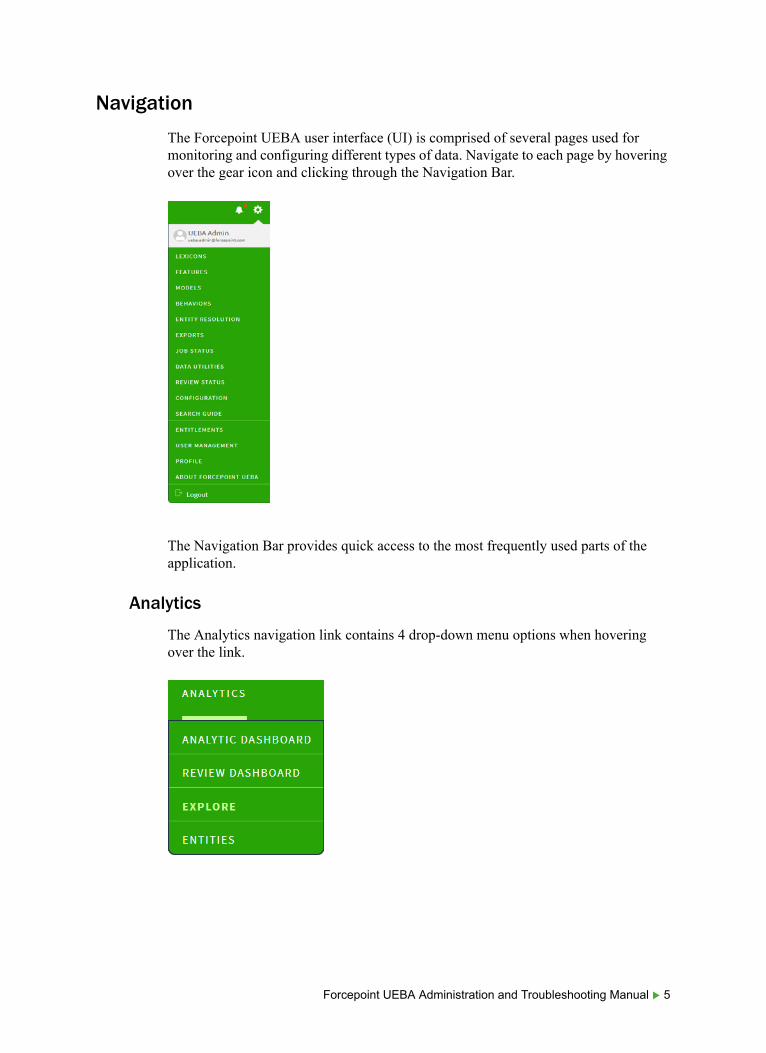
The Forcepoint UEBA user interface (UI) is comprised of several pages used for monitoring and configuring different types of data. Navigate to each page by hovering over the gear icon and clicking through the Navigation Bar.
The Navigation Bar provides quick access to the most frequently used parts of the application.
Analytics
The Analytics navigation link contains 4 drop-down menu options when hovering over the link.
Forcepoint UEBA Administration and Troubleshooting Manual 5

Analytic Dashboard
● Summarizes company behavior data and presents the Top 50 Entities of Interest sorted by risk score, as well as initial insights into recent trends and highly scored behaviors.
Review Dashboard
● Lists all Events selected for further review by Forcepoint UEBA analysts. This page allows analysts to easily review, annotate, label, and close or escalate Events in an efficient manner.
Explore
● Provides a comprehensive and high level summary of Events.
● Provides analysts the ability to freely search and explore their data. The Explore Page offers search capabilities, with either basic (selecting pre-configured options) or advanced (RQL query) search criteria, across all Forcepoint UEBA Event data.
● Provides high level overviews of events and activity through a variety of informational Cards.
● Offers drill down direct to specific individual events through the Event Viewer. The aperture can be narrowed using the search filters or various cards to select specific groups of Events (those that meet specific analytic criteria or involve specific actions) to populate the Event Viewer. Users can then widen the aperture again from a specific Event by showing the context and repopulating search Events for the Explore page.
Entities
● Allows users to identify and inspect all Entities within Forcepoint UEBA.
● Provides the ability to explore individual entity profiles, including breakdowns of their aliases, entity attributes, historical activity, and top entities with whom they interact.
● Selecting an Entity navigates users to the Entity Details Page. This page provides a deep dive into specific activity of the selected Entity, as well as the ability to add and edit Entity Features and Entity Attributes.
Behaviors Page
● Used to deep dive into a Scenario and to explore entities whose activities flagged highest in that Scenario. The Entity activity for each Scenario is further broken down into models and events that can be examined in the Event Viewer.
● Provides visual, analytic insights in the form of behavioral heat maps that are displayed on a configurable timeline. These heat-map rows are color-coded by the corresponding Models, and each interval matrix is assigned color opacity based on its interval score.
Forcepoint UEBA 6

Settings Tab
Explore Page
Logging into Forcepoint UEBA automatically opens the Explore Page. The Explore page provides a deep dive view of Events.
The view is broken down into several sub-views:
Forcepoint UEBA Administration and Troubleshooting Manual 7

● Event Viewer
● Search
● Summary Report
Event Viewer
The Event Viewer displays the raw list of Events by search query. Events provide the raw data for understanding the activities of individual entities.
The Event Viewer can be expanded, collapsed, and resorted. In addition to sorting, the Event Viewer provides:
● A set of actions that can be applied against the filtered event set.
● Analyst annotations and review status.
● Analyst-defined labels.
● A means to show context for the Event, and therefore place the specific Event alongside other related Events, such as those involving the same entities around the same time.
Forcepoint UEBA 8

Anatomy of an Event
Events, as pictured in the Event Viewer, consist of:
● Entities and Roles (configurable): Describes “who” and “what” participated in an Event and “how”.
● Event Features and Probability Scores: Indicates the raw event features associated with events and the probabilities associated with those values.
● Attachments: Some Event Modes, such as Email, contain file attachments. These attachments can be searched over, analyzed, and opened from within the Event Viewer.
● Timestamp: Indicates the time at which an event occurred. In the format of [insert format here].
● Event Metadata (Attributes): This area displays the Event's Attributes. Event Attributes are text, numeric, date, and / or boolean values that provides additional information about the Event.
● Event Content (Snippets): Unstructured content of certain Events can be lengthy. In order to focus attention on the portion of the content that matches relevant text search, Forcepoint UEBA produces and shows snippets of the unstructured content for the Event. Snippets pull and display 100 characters before AND after content that matches a text search.
Text search that is entered by a user in the Explore Page is considered active search and the matches are highlighted yellow in the snippet. These snippets only show when actively searching for the specific text.
Lexicon-based Event Features result in snippets through passive search and matches are highlighted blue. These snippets show for an Event no matter how it was listed in the Event Viewer.
By clicking the “+/-” icon to the right of the Event Mode title in the Event Viewer, you can expand and collapse additional Event Content. For the example Event below, the Event Content shows a snippet containing a Lexicon match.
Labels
The Label button at the bottom of an expanded Event Card lets you add a Label to an Event. Labels are used to identify and categorize sets of Events for further inspection.
To add a Label to an Event:
NoteSnippets are best used for inspecting text surrounding feature content matches. Inspecting snippets directly on Lexicons is not recommended.
Forcepoint UEBA Administration and Troubleshooting Manual 9

1. From an expanded Event Card, click the Label button.
2. Type the desired Label text into the New Label field, or select a pre-existing Label by clicking on a Label in the drop-down list.
3. Click Enter.
To remove the Label, click the X to the right of the Label text.
Working With An Event
The Event View provides a set of buttons that allow further interaction with each Event.
Notes
The Notes button allows you to view and add notes to an Event.
Click the Public or Private button to toggle between Public and Private notes. Public notes are viewable by all users, and Private notes are viewable by only you. Type your note content in the Leave a note area, and click the Submit button when you are satisfied with your note. Press Close to undo the process.
Show Context
The Show Context button to the right of the Note button allows you to view the Event Context. Show Context executes an automatically generated query that centers on the current Event, and typically includes a set of Events that occurred before and after, that is filtered for one or more of the Entities associated with this Event.
Forcepoint UEBA 10

Flagged Event Features
Hovering over the red Flag icon displays the Event Features that scored the Event. The button also shows the number of Event Features flagged.
Feature matches are further detailed in the red section of the Event Viewer.
For users with the Developer role, each flagged Feature displays its probability score describing the rarity of an Event.
Rarity refers to the number of Events, scored by the same Feature, with a raw Feature value less than its own. If many Events have a lesser raw Feature value, the probability score will be high. If few Events have a lesser raw Feature value, the probability score will be low. Further detail can be found in the Appendix here.
Review Status
Hover over the Review button to display review options, and Flag the Event for further review. Select a review option from the list based on Event severity.
Forcepoint UEBA Administration and Troubleshooting Manual 11
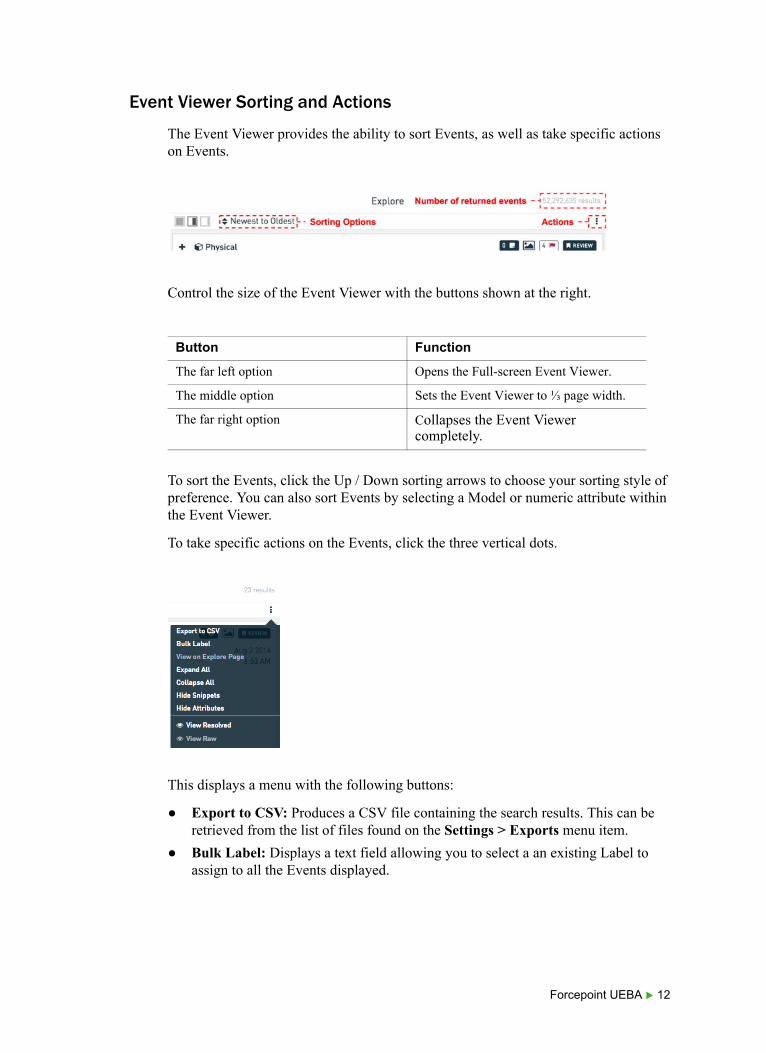
Event Viewer Sorting and Actions
The Event Viewer provides the ability to sort Events, as well as take specific actions on Events.
Control the size of the Event Viewer with the buttons shown at the right.
To sort the Events, click the Up / Down sorting arrows to choose your sorting style of preference. You can also sort Events by selecting a Model or numeric attribute within the Event Viewer.
To take specific actions on the Events, click the three vertical dots.
This displays a menu with the following buttons:
● Export to CSV: Produces a CSV file containing the search results. This can be retrieved from the list of files found on the Settings > Exports menu item.
● Bulk Label: Displays a text field allowing you to select a an existing Label to assign to all the Events displayed.
Button Function
The far left option Opens the Full-screen Event Viewer.
The middle option Sets the Event Viewer to ⅓ page width.
The far right option Collapses the Event Viewer completely.
Forcepoint UEBA 12

After selecting a Label, click the Label “X” Events button. Refresh the browser to see the labels added to your Events.
● Expand All: Expands all Events in the Event Viewer.
● Collapse All: Collapses all Events in the Event Viewer.
● Hide/Show Snippets: Displays or hides Flagged Snippets for Events that have Lexicon matches.
● Hide/Show Attributes: Displays or hides Event Attributes in collapsed Events.
● View Raw: Shows user names as they were prior to Entity Resolution.
● View Resolved: Shows user names as they appear after Entity Resolution.
Search
The Search Bar is located at the top of the Explore Page and just below the Navigation Bar. The Search Bar allows you to create, apply, and save complex searches with your data. All search results are then displayed in the Event Viewer.
Forcepoint UEBA offers two unique approaches to filtering your data:
● Basic Search (Default): Non-technical, form-based searching allowing users to enter values into text fields and drop-downs before applying a search.
● Advanced Search: Technical, free-form searching utilizing the RedOwl Query Language (RQL) for highly specified search results. See RQL section for further definition here.
Switch from Basic Search to Advanced Search by clicking the Advanced Search button at the bottom right of the Search Bar.
Once in Advanced Search, click the Basic Search button to return to Basic Search.
NoteBulk labeling can only apply an existing Label to Events. It is not possible to create a new Label in the Bulk Label tool. Create the Label first on an individual Event and it will then be available for use in the Bulk Label tool.
NoteEntity Resolution is the tool used to assign names to usernames, email addresses, and other ID’s. For example, the name John Smith is assigned to the username JSmith and the email address [email protected].
Forcepoint UEBA Administration and Troubleshooting Manual 13
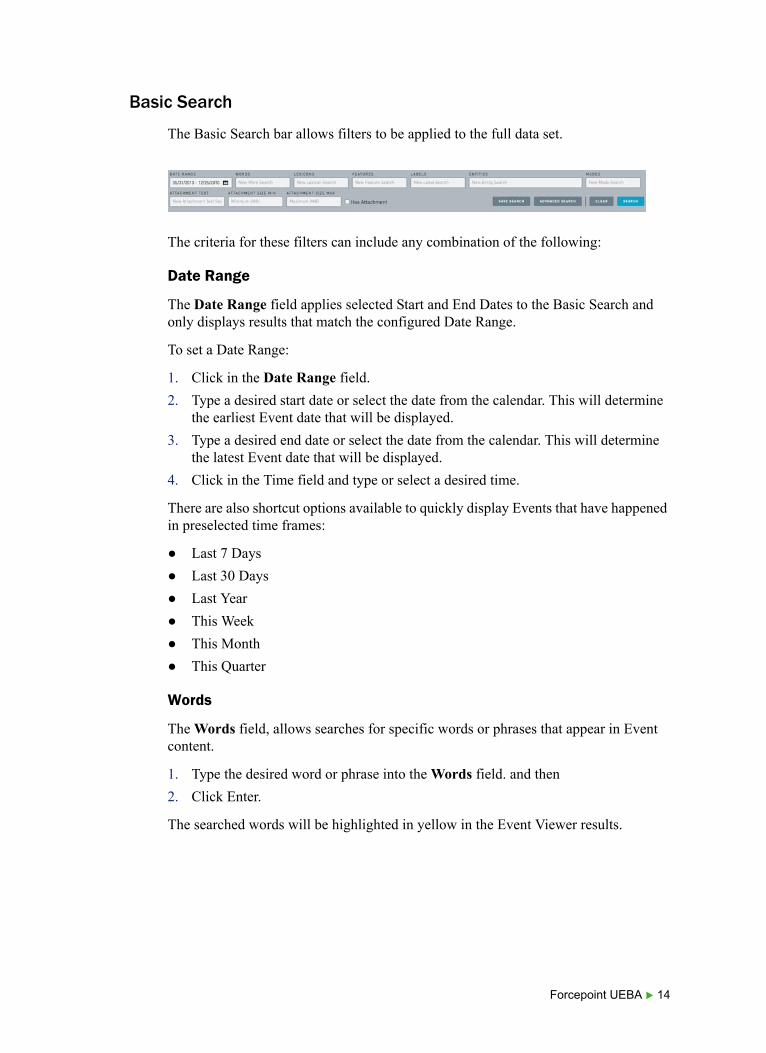
Basic Search
The Basic Search bar allows filters to be applied to the full data set.
The criteria for these filters can include any combination of the following:
Date Range
The Date Range field applies selected Start and End Dates to the Basic Search and only displays results that match the configured Date Range.
To set a Date Range:
1. Click in the Date Range field.
2. Type a desired start date or select the date from the calendar. This will determine the earliest Event date that will be displayed.
3. Type a desired end date or select the date from the calendar. This will determine the latest Event date that will be displayed.
4. Click in the Time field and type or select a desired time.
There are also shortcut options available to quickly display Events that have happened in preselected time frames:
● Last 7 Days
● Last 30 Days
● Last Year
● This Week
● This Month
● This Quarter
Words
The Words field, allows searches for specific words or phrases that appear in Event content.
1. Type the desired word or phrase into the Words field. and then
2. Click Enter.
The searched words will be highlighted in yellow in the Event Viewer results.
Forcepoint UEBA 14
To remove a word or phrase from your Basic Search criteria, press the X button to the right of the word.
Lexicons
Lexicons are flexible word lists that can include keywords, phrases, IP addresses, domain names, etc.
To search by Lexicons:
1. Click into the Lexicons field.
2. Press the space key on your keyboard to view a drop-down list of all predefined Lexicons available, or begin typing to receive search suggestions.
3. Click the desired Lexicon or press Enter to add the Lexicon to your Basic Search criteria.
4. Click Search.
5. Click the X button to the right of the Lexicon/s to remove from your Basic Search criteria.
Features
Event Features are the reasons an Event may be considered interesting.
To search by Event Features:
1. Click into the Features field.
2. Select from a predefined list of scored Event Features.
3. Click Search.
Labels
Labels are informational tags assigned to Events at the time of data ingest, or later by users.
To search by Labels:
1. Click into the Labels field.
2. Select from a predefined list of tagged Labels.
3. Click Search.
Entities
Entities include any type of known Entity, including people, devices, domains, etc.
NoteWords may also be highlighted in blue. These highlights are not related to your Basic Search criteria. Blue highlighted words indicate words related to Feature matches.
Forcepoint UEBA Administration and Troubleshooting Manual 15
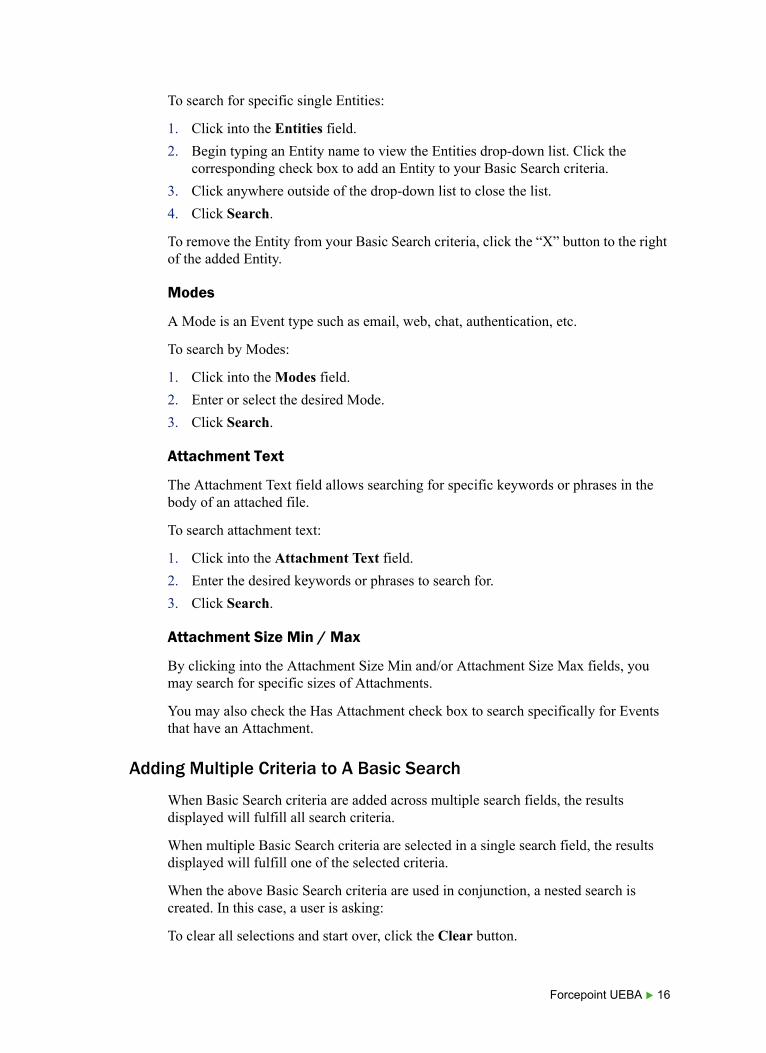
To search for specific single Entities:
1. Click into the Entities field.
2. Begin typing an Entity name to view the Entities drop-down list. Click the corresponding check box to add an Entity to your Basic Search criteria.
3. Click anywhere outside of the drop-down list to close the list.
4. Click Search.
To remove the Entity from your Basic Search criteria, click the “X” button to the right of the added Entity.
Modes
A Mode is an Event type such as email, web, chat, authentication, etc.
To search by Modes:
1. Click into the Modes field.
2. Enter or select the desired Mode.
3. Click Search.
Attachment Text
The Attachment Text field allows searching for specific keywords or phrases in the body of an attached file.
To search attachment text:
1. Click into the Attachment Text field.
2. Enter the desired keywords or phrases to search for.
3. Click Search.
Attachment Size Min / Max
By clicking into the Attachment Size Min and/or Attachment Size Max fields, you may search for specific sizes of Attachments.
You may also check the Has Attachment check box to search specifically for Events that have an Attachment.
Adding Multiple Criteria to A Basic Search
When Basic Search criteria are added across multiple search fields, the results displayed will fulfill all search criteria.
When multiple Basic Search criteria are selected in a single search field, the results displayed will fulfill one of the selected criteria.
When the above Basic Search criteria are used in conjunction, a nested search is created. In this case, a user is asking:
To clear all selections and start over, click the Clear button.
Forcepoint UEBA 16

Save Searches
If you are happy with the results of your search and would like to save the criteria for later use, click the Save Search button.
Saved Searches remain private to that user, meaning users will not see Saved Searches that they have not created.
You may select a Saved Search to populate your Review Dashboard from the Manage Saved Searches drop-down on the Explore page. There are two checkbox options for populating the Review Dashboard in the Manage Saved Searches drop-down:
● Escalations: Checking this box will populate the My Escalations Review queue with Events that result from the associated Saved Search(es).
● Reviews: Checking this box will populate the My Reviews Review queue with Events that result from the associated Saved Search(es).
The Escalations and Reviews checkboxes can both be checked for a single Saved Search. The resulting Events will be in both My Escalations and My Reviews on the Review Dashboard. If you do not want the Saved Search to populate the Review Dashboard, do not check either box.
Summary Report
The Summary Report section displays detailed breakdowns and visualizations about the filtered list of Events in the Event Viewer. These various visualizations are each
NoteAll Saved Searches, regardless of whether they appear on the Review Dashboard, will continue to populate results and be usable in the various Saved Search drop-downs throughout the application.
Forcepoint UEBA Administration and Troubleshooting Manual 17

contained within a Card. Cards are specific zones of the Summary Report that are dedicated to providing a particular view of the data.
A specific Card may be selected from the Summary Report navigation bar to view the selected Card in further detail, or scroll through the Summary Report to view all Summary Cards in a continuous feed.
The contents of each Card are interactive. For example, by clicking on the Web Mode in the Summary Report Card, the Event Viewer will automatically filter for that specific type of Event.
Summary Cards can be minimized in the Summary Report feed by clicking the down arrow at the top right of each card.
Summary Cards
Summary Report
The Summary Report Card provides a Mode-by-Mode breakdown of the filtered Events in the Event Viewer. The Summary Report Card displays the number of Total Events, the dates of the First and Last Events, and the number and percentage of total Events for each unique Mode.
Forcepoint UEBA 18
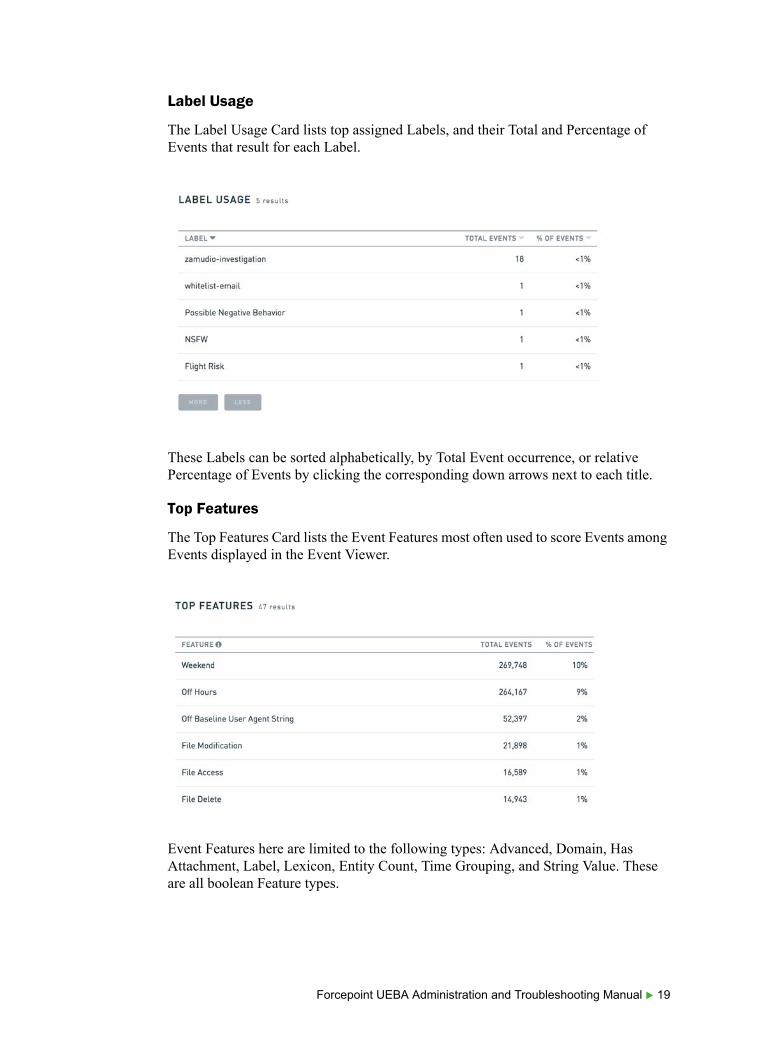
Label Usage
The Label Usage Card lists top assigned Labels, and their Total and Percentage of Events that result for each Label.
These Labels can be sorted alphabetically, by Total Event occurrence, or relative Percentage of Events by clicking the corresponding down arrows next to each title.
Top Features
The Top Features Card lists the Event Features most often used to score Events among Events displayed in the Event Viewer.
Event Features here are limited to the following types: Advanced, Domain, Has Attachment, Label, Lexicon, Entity Count, Time Grouping, and String Value. These are all boolean Feature types.
Forcepoint UEBA Administration and Troubleshooting Manual 19
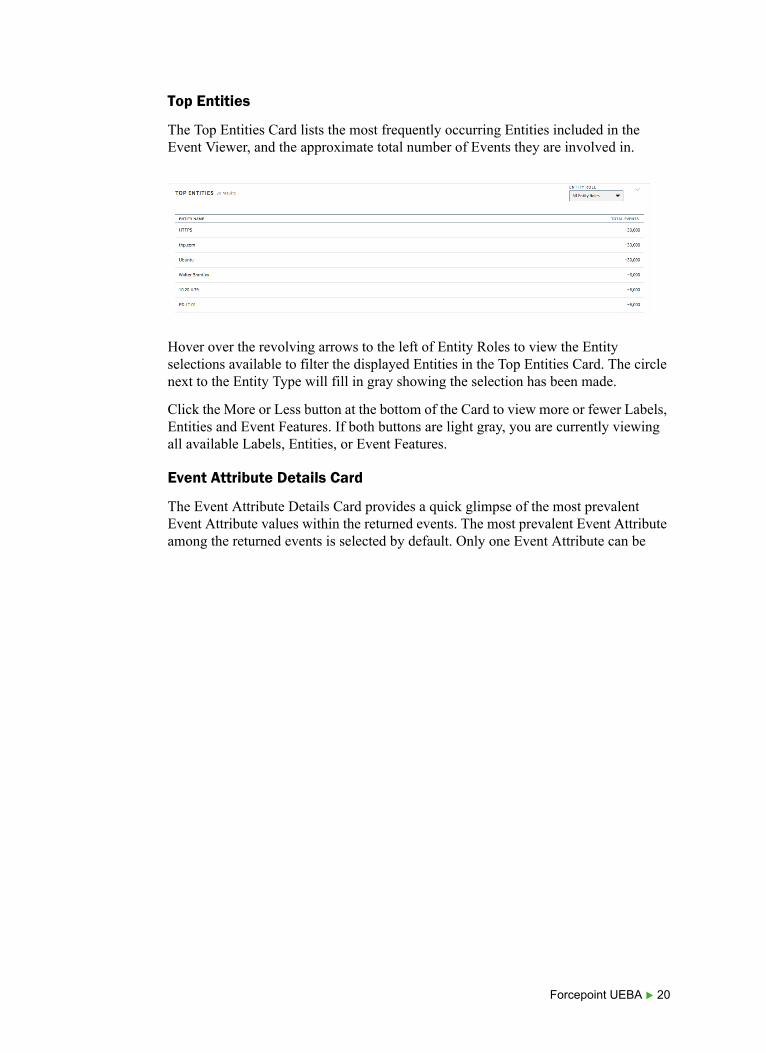
Top Entities
The Top Entities Card lists the most frequently occurring Entities included in the Event Viewer, and the approximate total number of Events they are involved in.
Hover over the revolving arrows to the left of Entity Roles to view the Entity selections available to filter the displayed Entities in the Top Entities Card. The circle next to the Entity Type will fill in gray showing the selection has been made.
Click the More or Less button at the bottom of the Card to view more or fewer Labels, Entities and Event Features. If both buttons are light gray, you are currently viewing all available Labels, Entities, or Event Features.
Event Attribute Details Card
The Event Attribute Details Card provides a quick glimpse of the most prevalent Event Attribute values within the returned events. The most prevalent Event Attribute among the returned events is selected by default. Only one Event Attribute can be
Forcepoint UEBA 20

shown on the card at a time. The Event Attribute shown can be selected using the drop-down in the top right of the card to show the values.
The card has two sections:
The top section displays summary statistics about the selected Event Attribute.
The bottom section shows a table of the Top 10 Event Attribute Values (excluding Boolean Attributes). The summary statistics differ based on the type of Event Attribute.
All Attribute types show the number of events with that Attribute, the percentage of events with that Attribute, and the total number of returned events. Some Attribute types show additional information:
● Boolean Attributes: Display the ratio of true (green) to false (red) events.
● Date Attributes: Display the date and time of the earliest and latest events with that Attribute value.
● Numeric Attributes: show min, max, and average number for those Attribute values in addition to the information above.
Note
Date Attributes shown in the table omit the timestamp from the values, so they are grouped by day.
Forcepoint UEBA Administration and Troubleshooting Manual 21

Activity Over Time
The Activity Over Time Card displays Mode occurrence based on configured time intervals. Each color represents the corresponding Mode type within the timeline. The color proportion within each bar indicates the ratio of Events during the displayed time interval.
The visualization can be configured to display by Timeline, Entities or Density using the radio buttons below the chart. The X-axis can be configured by time interval using the drop-down menu below the chart. The default display is Timeline and the default X-Axis is Week.
● Timeline: The Timeline selection displays all Modes through a stacked bar graph. The Y-Axis represents Total Events and the X-Axis represent the selected Time Interval.
● Entities: The Entities selection displays Events associated with Entities, broken down by Mode occurrence through a horizontal bar graph. The Y-Axis represents Entity type, and the X-Axis represents the number of Events.
Choose the types of Entities displayed on the Y-Axis by specifying roles in the Role 1, Role 2 and Role 3 drop-downs below the chart. For example, if you wish to see Events associated with Entities of the roles App, Category, and Destination, you may select App, Category, and Destination for Role 1, Role 2 and Role 3.
● Density: The Density selection displays the Event frequency over time. Select the Granularity desired, from Day, Week, Month or Quarter, and the Group By from Hour of Day, or Day or Week. Higher color opacity represents increased Event frequency.
Forcepoint UEBA 22
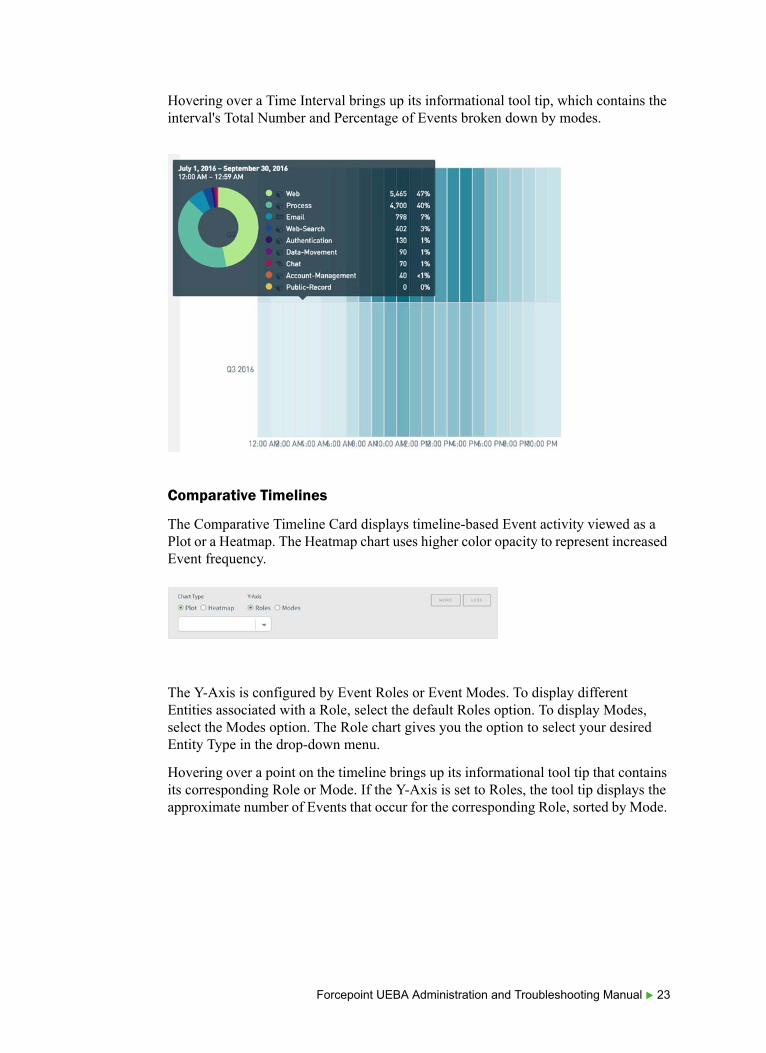
Hovering over a Time Interval brings up its informational tool tip, which contains the interval's Total Number and Percentage of Events broken down by modes.
Comparative Timelines
The Comparative Timeline Card displays timeline-based Event activity viewed as a Plot or a Heatmap. The Heatmap chart uses higher color opacity to represent increased Event frequency.
The Y-Axis is configured by Event Roles or Event Modes. To display different Entities associated with a Role, select the default Roles option. To display Modes, select the Modes option. The Role chart gives you the option to select your desired Entity Type in the drop-down menu.
Hovering over a point on the timeline brings up its informational tool tip that contains its corresponding Role or Mode. If the Y-Axis is set to Roles, the tool tip displays the approximate number of Events that occur for the corresponding Role, sorted by Mode.
Forcepoint UEBA Administration and Troubleshooting Manual 23

If the Y-Axis is set to Modes, the tool tip displays the approximate number of Events that occur for the single corresponding Modes.
Entities
The Entities Page provides the ability to thoroughly analyze Entities.
Search
The Entities Page displays a Search Bar above an empty page. To populate the Entities list, search criteria will need to be applied.
To search for a specific Entity:
1. Enter the Entity name in the Name field of the Entity Search Bar.
2. Click Search or apply more search criteria.
An attribute can be added to an Entity search, or searched for alone.
Forcepoint UEBA 24
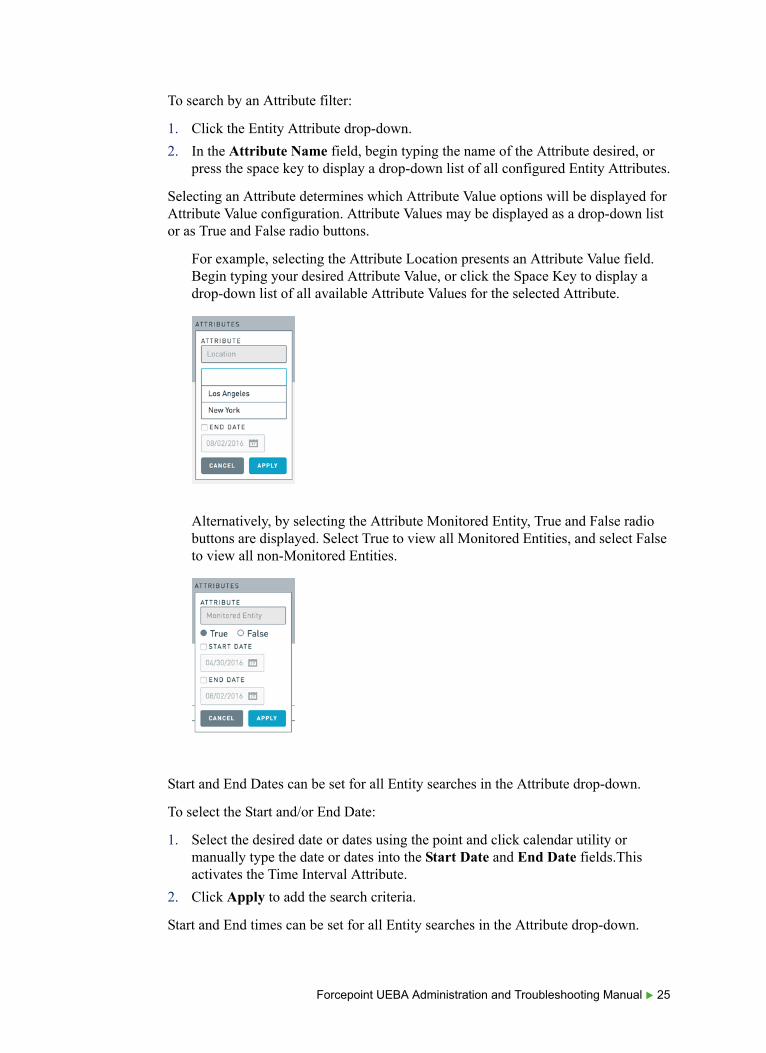
To search by an Attribute filter:
1. Click the Entity Attribute drop-down.
2. In the Attribute Name field, begin typing the name of the Attribute desired, or press the space key to display a drop-down list of all configured Entity Attributes.
Selecting an Attribute determines which Attribute Value options will be displayed for Attribute Value configuration. Attribute Values may be displayed as a drop-down list or as True and False radio buttons.
For example, selecting the Attribute Location presents an Attribute Value field. Begin typing your desired Attribute Value, or click the Space Key to display a drop-down list of all available Attribute Values for the selected Attribute.
Alternatively, by selecting the Attribute Monitored Entity, True and False radio buttons are displayed. Select True to view all Monitored Entities, and select False to view all non-Monitored Entities.
Start and End Dates can be set for all Entity searches in the Attribute drop-down.
To select the Start and/or End Date:
1. Select the desired date or dates using the point and click calendar utility or manually type the date or dates into the Start Date and End Date fields.This activates the Time Interval Attribute.
2. Click Apply to add the search criteria.
Start and End times can be set for all Entity searches in the Attribute drop-down.
Forcepoint UEBA Administration and Troubleshooting Manual 25
To delete search criteria, click the X at the top right of each added search criteria.
Once all of the desired criteria has been selected, click Search to apply the search.
When the above search criteria are used in conjunction, a nested search is created.
To reset the search criteria, click Reset. Once the search has been applied, filtered Entities will display in a list view below.
Click on the Entity name to further explore and Entity of interest and navigate to the corresponding Entity Details Page.
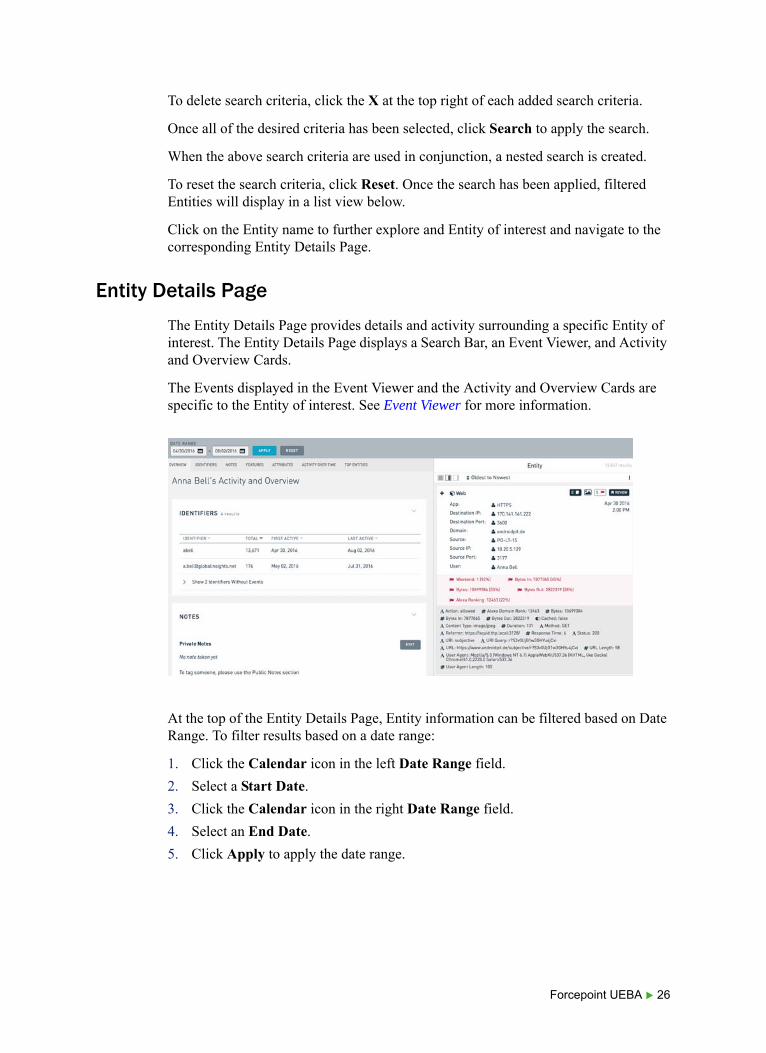
Entity Details Page
The Entity Details Page provides details and activity surrounding a specific Entity of interest. The Entity Details Page displays a Search Bar, an Event Viewer, and Activity and Overview Cards.
The Events displayed in the Event Viewer and the Activity and Overview Cards are specific to the Entity of interest. See Event Viewer for more information.
At the top of the Entity Details Page, Entity information can be filtered based on Date Range. To filter results based on a date range:
1. Click the Calendar icon in the left Date Range field.
2. Select a Start Date.
3. Click the Calendar icon in the right Date Range field.
4. Select an End Date.
5. Click Apply to apply the date range.
Forcepoint UEBA 26
To reset the Date Range configuration, click Reset.
Activity and Overview Cards
The Activity and Overview section displays detailed breakdowns and visualizations about the Entity of interest. These visualizations are contained within a Card.
The Activity and Overview navigation bar allows quick navigation through the Entity's Activity and Overview Cards in the Entity Details Page. Specific Cards may be selected from the navigation bar to view the selected Card in further detail, or scroll through the Activity and Overview Report to view all Cards in a continuous feed.
Cards in the Activity and Overview Report can be minimized in the feed by clicking the downward caret at the top right of each Card.
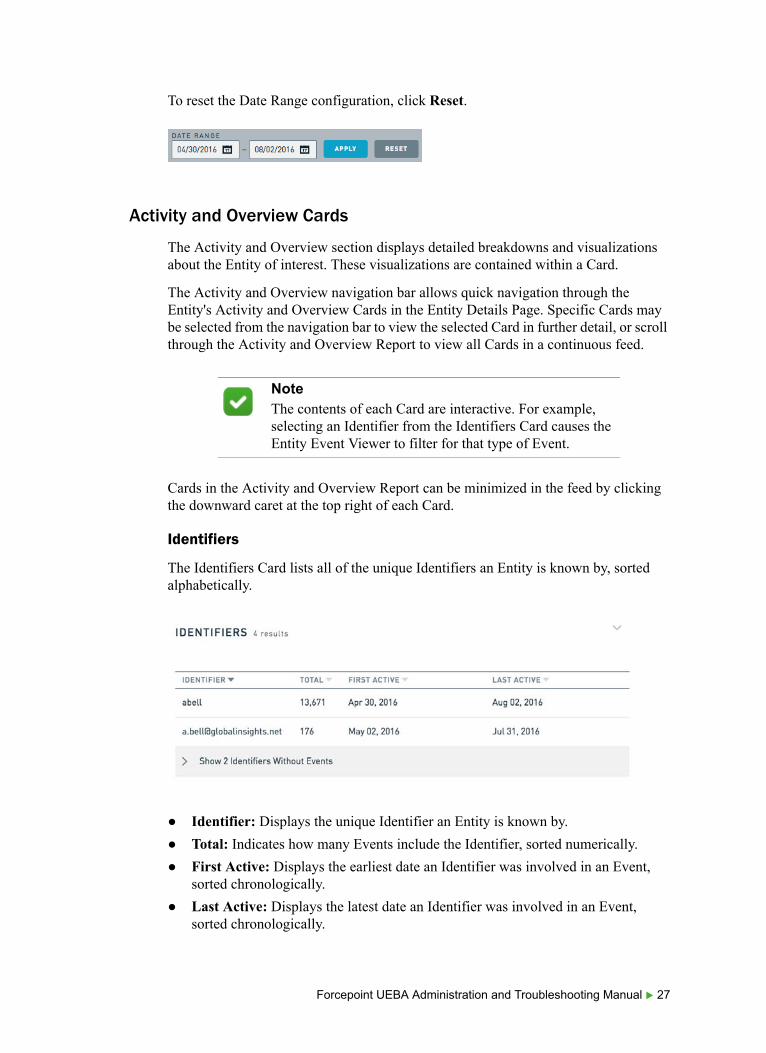
Identifiers
The Identifiers Card lists all of the unique Identifiers an Entity is known by, sorted alphabetically.
● Identifier: Displays the unique Identifier an Entity is known by.
● Total: Indicates how many Events include the Identifier, sorted numerically.
● First Active: Displays the earliest date an Identifier was involved in an Event, sorted chronologically.
● Last Active: Displays the latest date an Identifier was involved in an Event, sorted chronologically.
NoteThe contents of each Card are interactive. For example, selecting an Identifier from the Identifiers Card causes the Entity Event Viewer to filter for that type of Event.
Forcepoint UEBA Administration and Troubleshooting Manual 27
The Identifier list can be sorted by clicking on the down arrows next to each column title. Identifiers that do not have associated Events are hidden from view, but can be shown by clicking Show Identifiers Without Events.
Pseudonymization of Entity Identifiers
In order to support investigation of behavior without divulging the identity of users, Forcepoint UEBA now enables pseudonymization of entity identifiers through the concept of Shielded Users who see pseudonyms for entity identifiers rather than true entity information.
The Shielded user role is an exclusive role that may not be combined with any other role. The Shielded User is granted the abilities described below while logged on to the Forcepoint UEBA application.
● The Shielded User has access to:
■ Analytic Dashboard (the Shielded User's Landing Page)
■ Review Dashboard
■ Entity Timeline (but not the Entity Details tab of the Entity page)
■ Explore Page
■ The following pages under the Settings menu:
○ Search Guide○ Profile○ Logout○ About Forcepoint UEBA (and the EULA/OSS sub-pages)○ Configure date format
■ Notifications page
● The Shielded User can only see resolved Entity Names as Pseudonyms.
For example, the Shielded User would only see the psuedonym Quick Red Fox 34 while in this role, rather than seeing the Entity Name John Smith.
● The Shielded User cannot see raw Entity Names/Identifiers.
When viewing an email event, the Shielded User will see a resolved Entity Name of Quick Red Fox 34 (John Smith) but cannot see the underlying email address used by Quick Red Fox 34 in the message.
● Event Actions
■ The Shielded User cannot export events.
■ The Shielded User cannot view natives or download attachments.
■ The Shielded User does not have the ability to toggle between View Resolved and View Raw in the Event Viewer Actions Menu.
NoteEntity Resolution is responsible for packaging all unique Identifiers and recognizing an Entity by one overarching Entity name.
Forcepoint UEBA 28

■ The Shielded User can add labels (bulk and regular).
■ The Shielded User can use Show Context.
■ The Shielded User can review Events.
■ The Shielded User cannot print Events.
● Regarding fields with content:
■ The Shielded User cannot see Event content in the Event body.
■ The Shielded User can see Event content in the feature snippets.
■ The Shielded User can see content in attachment snippets.
■ The Shielded User can see Event content in the Event summary on the Entity Timelines page.
■ The Shielded user cannot view natives or download attachments.
■ The Shielded User cannot see active (yellow) snippets produced by active search of Event content.
■ The Shielded User cannot see the unformatted data section in the event viewer.
Pseudonyms are consistent between different Shielded Users, and they persist across sessions. John Smith will be seen as Quick Red Fox 34 to all Shielded Users every time they log on.
Pseudonyms are automatically generated by Forcepoint UEBA, or are assigned as part of an Entity Resolution (ER) key file. Pseudonyms can be refreshed across the data set to help reduce the chances that Shielded Users will start to develop an understanding of who pseudonyms reference.
Restricted User is an additional new role that has the abilities described below while logged on to the Forcepoint UEBA application:
● The Restricted User has access to:
Forcepoint UEBA Administration and Troubleshooting Manual 29

■ Explore Page
■ The following pages under the Settings menu:
○ Search Guide○ Profile○ Logout○ Configure date format○ Notifications page○ Exports Page
■ Event Actions
○ Can export (both export natives and export to CSV)○ Can add labels (regular and bulk) – but should not see popup telling them
to check their status on the jobs page○ Can use Show Context○ Can review Events
● While very similar to the User role, the Restricted User can see all Event Viewer content fields that the User role is entitled to see, but only has access to Explore.
Forcepoint UEBA users with access to the Entity page and without the Shielded User role will be able to see the Pseudonym and true identifier for an entity.
Notes
The Notes Card displays all Event Notes associated with an Entity.
Public Notes are viewable in the Entity Details Page by all users. Private Notes are only viewable by the author of the note.
To create or edit a Note:
Forcepoint UEBA 30

1. Click the Edit button.
2. Type in the text field to make the desired edits.
3. Click Save.
To undo your edits, click Cancel.
Entity Features
The Entity Features Card displays all Entity Features associated with the specific Entity and allows users to create, edit and remove Entity Features.
To add a new Entity Feature:
1. Click the “+” icon at the top right of the Entity Features Card.
2. Add a name in the Entity Feature Name field
3. Add a Value in the Value field. Values must be an integer between 1 and 10. These values represent how risky an Entity is, with regards to the Feature.
For example, if an Entity is very prone to under-performance, create an Under-performer Feature and assign it the appropriate value.
4. Click Submit.
To cancel the Feature, click Cancel.
To edit the Entity Feature Value:
1. Click the pencil icon.
2. Make the desired changes to the Value.
3. Click Submit.
To cancel the change of Value, click Cancel.
Click the Trash Can icon at the right of an Entity Feature to remove the Entity Feature.
NoteThe Entity Feature name cannot be edited once it has been created.
Forcepoint UEBA Administration and Troubleshooting Manual 31

Attributes
The Attributes Card lists all of the applied Attributes of the specific Entity and allows users to create, edit and remove Entity Attributes. The Attributes Card is also where Entities are designated as a Monitored Entities, or an Entities that are scored. Attributes are useful for providing basic information about an Entity, such as their office location and job title.
To add a new Attribute:
1. Click the “+” icon at the top right of the Entity Attributes Card.
2. Name the Attribute in the Attribute Name field.
3. Choose the desired Attribute type in the Attribute Type dropdown (Text, Number, True/False, Date).
Depending on the Attribute Type selected, the displayed Attribute Value field will change.
■ Text: Displays a Text field.
■ Number: Displays a Number selector to enter an integer value.
■ True/False: Displays True and False radio buttons.
■ Date: Displays a calendar to select a specific date. (The Date Attribute selection removes the option to select Start and End Date Ranges.)
4. Select a desired date or date range using the point and click calendar utility, or manually typing the date into the Start Date and End Date fields.
To edit an existing Attribute:
1. Click the “+” icon at the right of an Attribute.
2. Edit the date or date range using the point and click calendar utility, or manually typing the date into the Start Date and End Date fields.
To edit or delete an existing Attribute:
1. Click the arrow to the left of the Attribute.
2. Click the Pencil icon to edit the Attribute.
Forcepoint UEBA 32

3. Click the Trash Can icon to delete the Attribute.
Activity Over Time
The Activity Over Time Card displays Mode occurrence based on configured time intervals for Events including the Entity of Interest.
Each color represents the corresponding Mode type within the timeline. The color proportion within each bar indicates the ratio of Events during the displayed time interval for the Entity of Interest.
Forcepoint UEBA Administration and Troubleshooting Manual 33

Top Entities
The Top Entity Interactions Card displays all of the Entities that have interacted with the selected Entity of interest.
Top Entity Interactions are listed from largest to smallest with regards to Total Event count. To view more than 50 Top Entity Interactions, scroll to the bottom of the page, and click More. To view fewer Top Entity Interactions, click Less.
Analytic Dashboard
The Analytic Dashboard visually summarizes the most suspicious Entities detected within an organization. All Scoring tools assemble to create Scenarios. Scenarios are then combined to Score an Entity over a 7 day period.
● Event Models are sets of Event Features that are used to Score Events.
Forcepoint UEBA 34
● Scenarios use one or more Model Scores to produce a Scenario Score.
● Risk Scores are single scores we compute for an entity based on a number of Scenario scores.
Behavioral Analyst and Developer Roles
The Behavioral Analyst role controls who can see the Analytic Dashboard and the Behaviors page. The Developer role, among other things, controls who can see entity models. If a user has the Behavioral Analyst role, but not the Developer role, they will not be able to see entity models on either the Analytic Dashboard or the Behaviors page. For more information on user roles, see User Management.
Entitlements require caching a full set of results for each entitlement.
For example, if five users share the same entitlement and all have the Behavioral Analyst role, we only have to cache results once (their shared entitlement means they'll see the same results). However, if those five users have five different entitlements, we have to compute and cache everything five times to account for the entitlement differences.
Monitored Entities
A Monitored Entity is an Entity shown on the Analytics Dashboard or Behaviors page.
Monitored Entities are generally determined by the client data, and should include all employees at a company.
NoteGiving the Behavioral Analyst role to users with many different entitlements decreases performance.
WarningEvery Monitored Entity contributes to Model score normalization. Including an outlier Entity can distort the Model scores for other Entities.
Also, if the Monitored Entities list is too small, there might be no matching Events for your Models given a user's entitlement.
Forcepoint UEBA Administration and Troubleshooting Manual 35

The Analytic Dashboard uses several key visualizations to display important data.
Entity & Scenario Filters
Filter the Analytic Dashboard by Entities with a particular attribute, all Monitored Entities, and/or a single or all Scenarios. Using a filter shows Entities that meet the set criteria. The Score Comparison chart updates accordingly.
Risk Level Filter
Each Monitored Entity that is associated with a Forcepoint DLP identifier is assigned a Risk Level. Users can filter the Dashboard specifically by Risk Level.
To filter by Risk Level:
1. Click the icon that corresponds with the Level to be viewed
2. Click Apply.
The Dashboard shows only the entities with the selected Risk Level or Levels. The dashboard maintains a 7 day view, based on the date selected in the upper left hand corner. The Risk Level displayed represents the most recent Risk Level, or the Risk Level as of the end date of the view.
Summary Report Bar
The Summary Report bar across the top of the page displays the number of Active Entities in the Last 24 Hours, Total Events in the 24 Hours Since the Last Update, and the Time of Last Update.
Top 50 Entities of Interest
The Top 50 Entities of Interest lists the 50 most suspicious Monitored Entities over the last 24 hours (configurable in AppConfig only). The Name, Business Position, and Location are displayed for each Entity. The Monitored Entity’s Risk Score is
Forcepoint UEBA 36
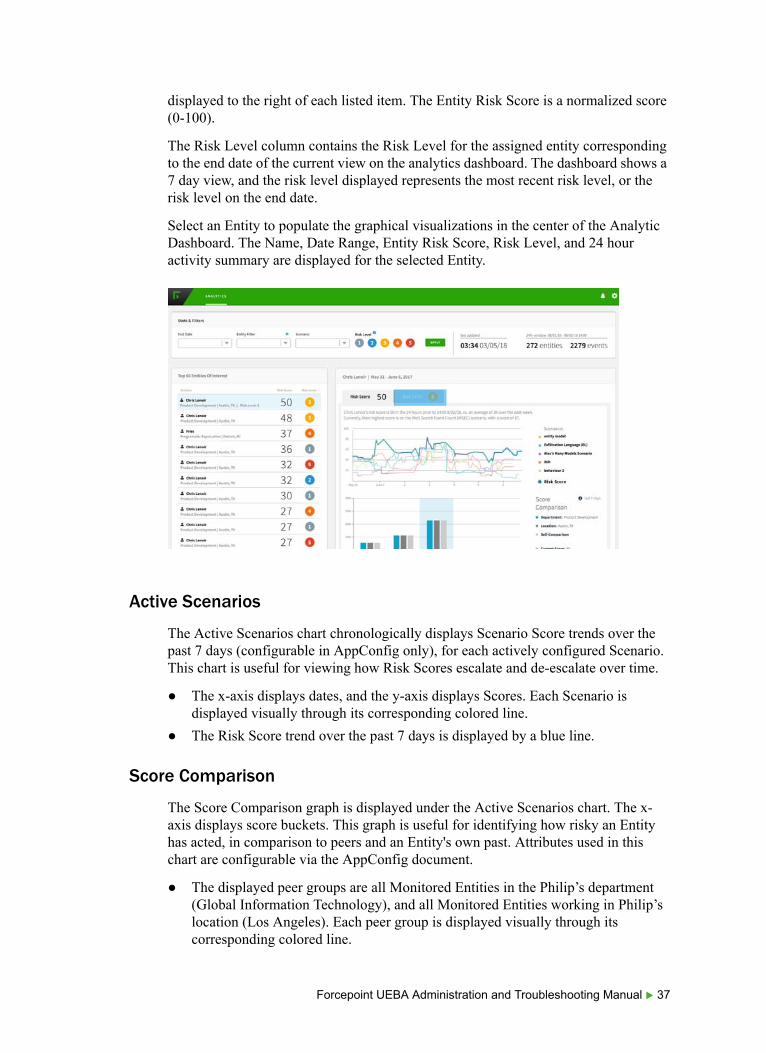
displayed to the right of each listed item. The Entity Risk Score is a normalized score (0-100).
The Risk Level column contains the Risk Level for the assigned entity corresponding to the end date of the current view on the analytics dashboard. The dashboard shows a 7 day view, and the risk level displayed represents the most recent risk level, or the risk level on the end date.
Select an Entity to populate the graphical visualizations in the center of the Analytic Dashboard. The Name, Date Range, Entity Risk Score, Risk Level, and 24 hour activity summary are displayed for the selected Entity.
Active Scenarios
The Active Scenarios chart chronologically displays Scenario Score trends over the past 7 days (configurable in AppConfig only), for each actively configured Scenario. This chart is useful for viewing how Risk Scores escalate and de-escalate over time.
● The x-axis displays dates, and the y-axis displays Scores. Each Scenario is displayed visually through its corresponding colored line.
● The Risk Score trend over the past 7 days is displayed by a blue line.
Score Comparison
The Score Comparison graph is displayed under the Active Scenarios chart. The x-axis displays score buckets. This graph is useful for identifying how risky an Entity has acted, in comparison to peers and an Entity's own past. Attributes used in this chart are configurable via the AppConfig document.
● The displayed peer groups are all Monitored Entities in the Philip’s department (Global Information Technology), and all Monitored Entities working in Philip’s location (Los Angeles). Each peer group is displayed visually through its corresponding colored line.
Forcepoint UEBA Administration and Troubleshooting Manual 37
● The y-axis represents the percentage of time in which a group was at a certain Risk Score, over the entities in the group. In the example above, the department (Global Information Technology) group (blue bar) spent roughly 50% of the last 7 days at a Risk Score between 40 and 59.
Drilling Down from the Analytic Dashboard
To drill down into the analytic results of the Scenarios that comprise an Entity’s Risk Score, hover anywhere over a Scenario’s line graph, or click on a Scenario under Active Scenarios.
Selecting a Scenario will direct you to the Timeline tab of the Entity Profile page for the selected Entity.
Behaviors
The Entity Timeline is a tab on the Entity Profile page. Click on the person icon next to an entity name anywhere in the application, search directly for an entity in the Entities Search page, or focus investigation on a particular entity and Scenario from the Analytic Dashboard to reach the timeline. Navigating from the Analytic Dashboard, the Entity Timeline will load with details about the Scenario and date which are selected in the Analytic Dashboard.
When accessing a specific entity using the person icon or from the Entities Search page, the Entity Profile page defaults to the Details tab, which lists entity attributes, features, and identifiers. Selecting the Timeline tab will activate the timeline for the first Scenario (sorted alphabetically) and for the most recent date with analytic data available. If the most recent analytic data covers only part of a day, the latest 24 hour period is shown. For example, if data is only available through 10am on a given day, the timeline will show results for 10am on the previous day through 10am on the given day.
Once on the Entity Timeline, you may select a different Scenarios or dates to display.
The Entity Timeline shows activity over time in two principal ways. The top part of the timeline is the Hourly Bar Chart. The bottom part is the Stacked Timeline. Both
NoteThe Entity Timeline is only available for Monitored Entities.
NoteOnly dates for which analytic data is available can be selected. The timeline will show results midnight-midnight on the selected date. If only partial results have been computed, the timeline will show the latest 24 hour period that is available.
Forcepoint UEBA 38
the Hourly Bar Chart and Stacked Timeline will show information based on the component models that make up the Scenario selected.
Changing the Scenario or date at the top will cause both Hourly Bar Chart and Stacked Timeline to refresh with new data. It is also possible to change the View Filter Threshold to highlight more or fewer intervals in the Hourly Bar Chart. When you change this threshold, the Stacked Timeline will also show more or fewer intervals with detailed results.
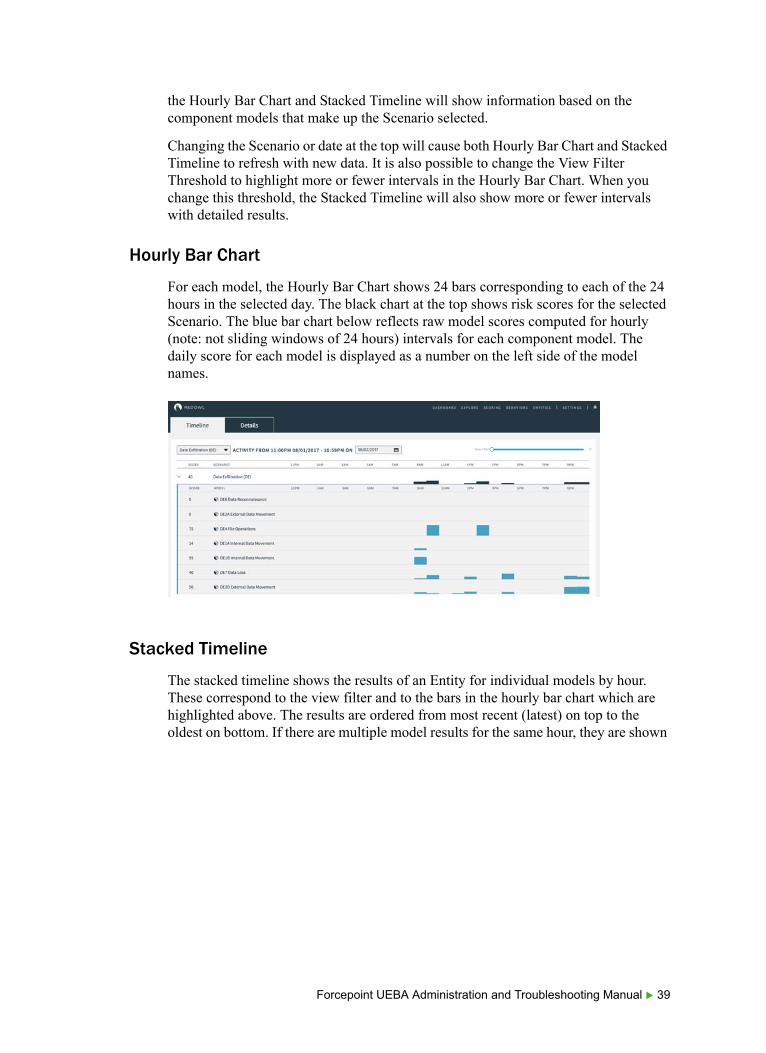
Hourly Bar Chart
For each model, the Hourly Bar Chart shows 24 bars corresponding to each of the 24 hours in the selected day. The black chart at the top shows risk scores for the selected Scenario. The blue bar chart below reflects raw model scores computed for hourly (note: not sliding windows of 24 hours) intervals for each component model. The daily score for each model is displayed as a number on the left side of the model names.
Stacked Timeline
The stacked timeline shows the results of an Entity for individual models by hour. These correspond to the view filter and to the bars in the hourly bar chart which are highlighted above. The results are ordered from most recent (latest) on top to the oldest on bottom. If there are multiple model results for the same hour, they are shown
Forcepoint UEBA Administration and Troubleshooting Manual 39

in the same card and the model titles are listed in the header. Some hours may not have any results and some may many.
Each model/hour result has three parts:
● Title: The title bars include the title of the model and a carat for collapse and expand control of the event table.
● Summary: The content shown in the summary sentences varies according to the model’s aggregation method.
● Event table: The event table lists each of the events that contribute to the model score of an Entity for a given hour. Each row in the event table shows the mode, summary, and timestamp for the event. It also gives the number of flagged features that an event has, among those features that are turned on in the model configuration. The lead column shows information such as event score or attribute value if it is appropriate for the model.
By default the event table is limited to 15 events. Events are sorted in the natural order, given the model type.
■ For models that aggregate by attribute max or sum, events are ordered by their attribute value.
■ For models that aggregate by aggregate or max event score, events are ordered by their model event score.
■ For models that aggregate by event count or secondary role cardinality, events are ordered chronologically.
If there are more than 15 events for the hour and model combination, click the More button to display more events.
Event Viewer
The Entity Timeline tab includes an Event Viewer for detailed inspection of events. Selecting an interval in the Hourly Bar Chart, or selecting rows in the Event Table will populate the Event Viewer. Depending on your roles, you will have the same ability to export events, annotate, label, and review as in other Event Viewers throughout the UI.
Forcepoint UEBA 40
Behaviors Page
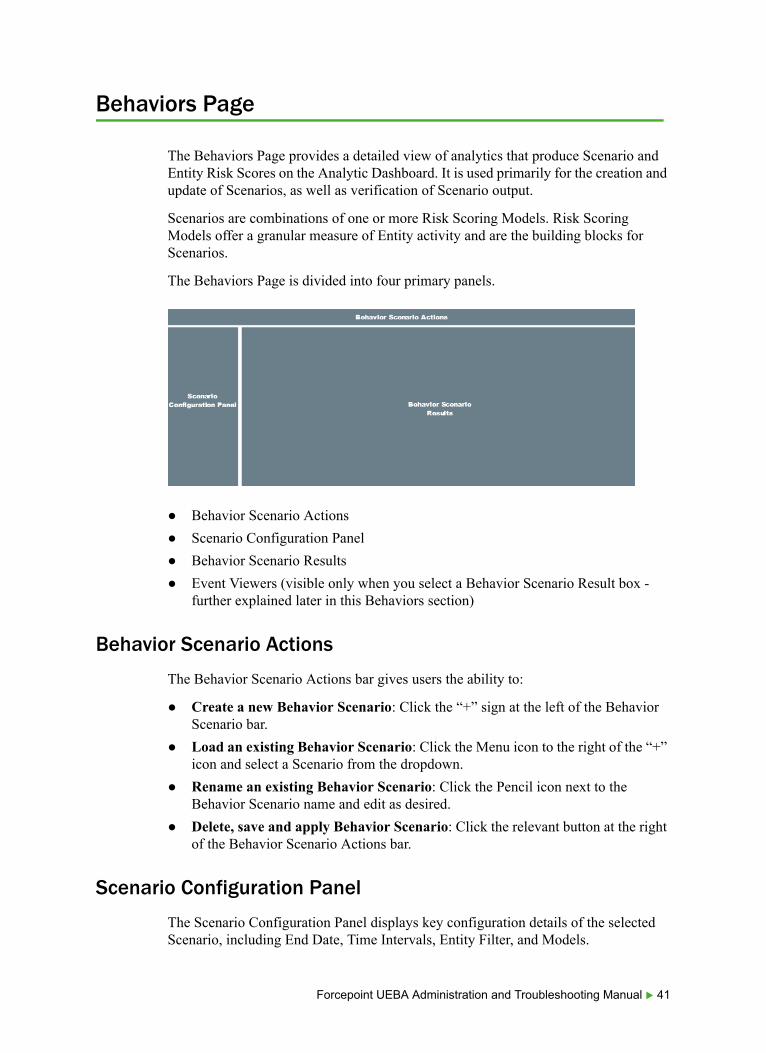
The Behaviors Page provides a detailed view of analytics that produce Scenario and Entity Risk Scores on the Analytic Dashboard. It is used primarily for the creation and update of Scenarios, as well as verification of Scenario output.
Scenarios are combinations of one or more Risk Scoring Models. Risk Scoring Models offer a granular measure of Entity activity and are the building blocks for Scenarios.
The Behaviors Page is divided into four primary panels.
● Behavior Scenario Actions
● Scenario Configuration Panel
● Behavior Scenario Results
● Event Viewers (visible only when you select a Behavior Scenario Result box - further explained later in this Behaviors section)
Behavior Scenario Actions
The Behavior Scenario Actions bar gives users the ability to:
● Create a new Behavior Scenario: Click the “+” sign at the left of the Behavior Scenario bar.
● Load an existing Behavior Scenario: Click the Menu icon to the right of the “+” icon and select a Scenario from the dropdown.
● Rename an existing Behavior Scenario: Click the Pencil icon next to the Behavior Scenario name and edit as desired.
● Delete, save and apply Behavior Scenario: Click the relevant button at the right of the Behavior Scenario Actions bar.
Scenario Configuration Panel
The Scenario Configuration Panel displays key configuration details of the selected Scenario, including End Date, Time Intervals, Entity Filter, and Models.
Forcepoint UEBA Administration and Troubleshooting Manual 41
End Date
To configure the End Date of the analyzed Scenario data set:
1. Check the End Date box.
2. Click the Calendar icon and select an End Date.
3. Click the Clock icon and select an End Time (military time).
Intervals
Interval size defines the timespan covered by each heatmap Model Score. Analytic Dashboard drill-downs will display one week of data in 7 one-day intervals by default.
To change the interval settings:
1. Click on the Intervals dropdown to expand the menu.
2. Specify the size and quantity of the interval in the Interval Size field.
3. Select the number of intervals you want shown in the Interval Shown field.
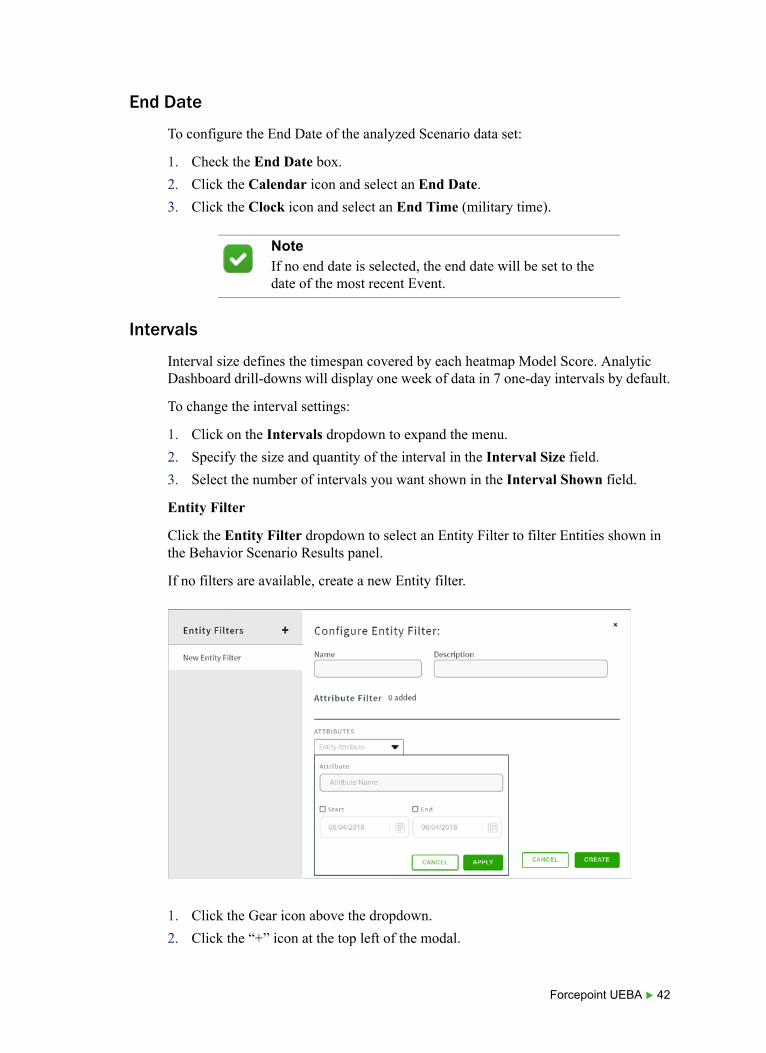
Entity Filter
Click the Entity Filter dropdown to select an Entity Filter to filter Entities shown in the Behavior Scenario Results panel.
If no filters are available, create a new Entity filter.
1. Click the Gear icon above the dropdown.
2. Click the “+” icon at the top left of the modal.
NoteIf no end date is selected, the end date will be set to the date of the most recent Event.
Forcepoint UEBA 42
3. In the Name field, Name your Entity Filter in no more than 2 words.
4. In the Description field, describe what the Entity Filter will accomplish.
5. Click the Attribute Name dropdown to select the Attribute you want to use.
6. Click the Attribute Value to specify the desired Attribute Value.
7. Click Save at the bottom right to save the Entity Filter.
8. To exit without saving, click the “X” icon at the top right of the modal.
9. Click Cancel to cancel the created Entity Filter.
10. Click Delete to delete the current Entity Filter.
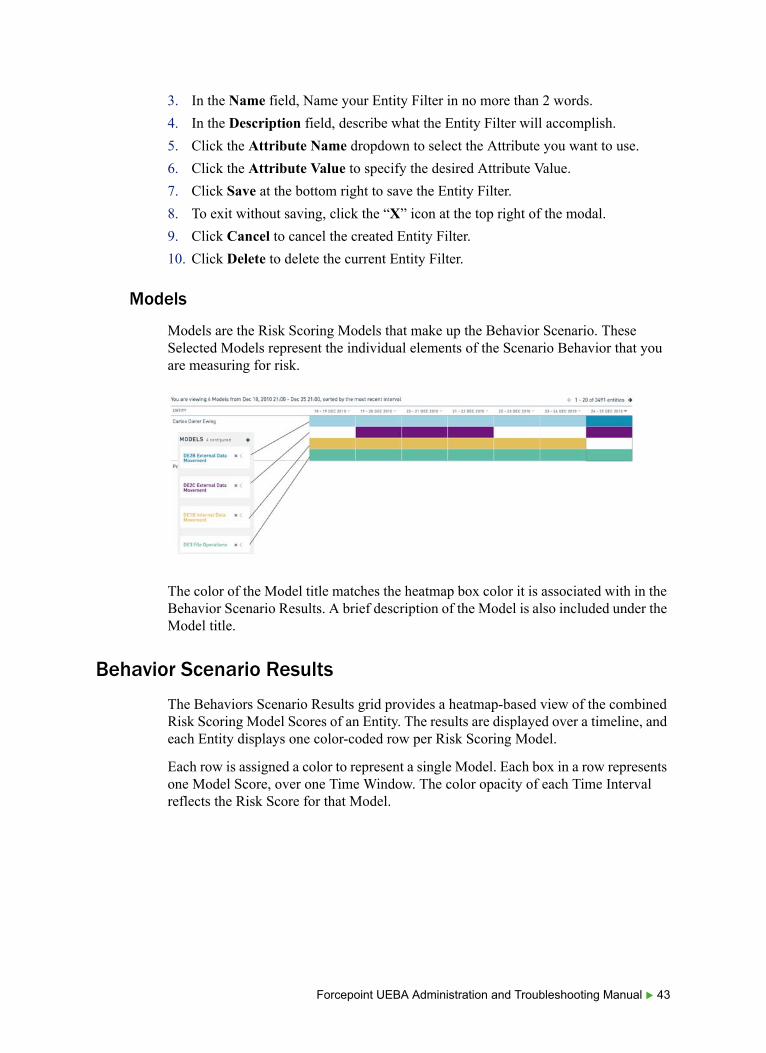
Models
Models are the Risk Scoring Models that make up the Behavior Scenario. These Selected Models represent the individual elements of the Scenario Behavior that you are measuring for risk.
The color of the Model title matches the heatmap box color it is associated with in the Behavior Scenario Results. A brief description of the Model is also included under the Model title.
Behavior Scenario Results
The Behaviors Scenario Results grid provides a heatmap-based view of the combined Risk Scoring Model Scores of an Entity. The results are displayed over a timeline, and each Entity displays one color-coded row per Risk Scoring Model.
Each row is assigned a color to represent a single Model. Each box in a row represents one Model Score, over one Time Window. The color opacity of each Time Interval reflects the Risk Score for that Model.
Forcepoint UEBA Administration and Troubleshooting Manual 43

Hover over a highlighted Time Interval to view the Raw Score for the given day and the given Scoring Model.
Click a highlighted Time Interval box to open the Event Viewer with all of the Events that were scored by the Model over the Time Interval. This Event Viewer is found at the bottom of the page.
See Event Viewer for more information.
Configuring the View
Click the horizontal arrows at the top right of the Behavior Scenario Results grid to scroll through pages of Entities. These arrows are also found at the bottom left of the Behavior Scenario Results grid.
Forcepoint UEBA 44

Review Dashboard
The Review Dashboard is accessible under the Dashboard dropdown in the Navigation Bar.
The Review Dashboard gives analysts efficient means to sift through Events of interest and to determine whether Events are significant enough to require action.
There are four primary components for users to interact with when Reviewing Events.
● My Escalations
● My Reviews
● My Reviewed
● Event Viewer, which acts as the review queue.
Before defining the interactions and Behaviors of each component, let’s discuss configuring the Review Dashboard.
Saved Searches
The Review Dashboard uses Saved Searches to populate each user’s Review queue, identifying Events based on queries written in the RedOwl Query Language (RQL). These Saved Searches used for the Review Dashboard also impact certain Behaviors during the Event Review process, as documented in the examples below.
● Anything that is supported in RQL can be used to populate the Review Dashboard.
● Include the clause “NOT reviewed:*” to return only unreviewed Events in the Review queue. As each Event is reviewed, the counter in “My Reviews” will decrease and upon page refresh or logout/login, the newly Reviewed Events will disappear from the Review queue.
WarningAvoid doing direct searches over a large event set for Lexicons or specific words and phrases. Instead use Event Features to populate the RQL, as there are significant performance benefits to leveraging Event Features over direct searches.
Forcepoint UEBA Administration and Troubleshooting Manual 45

● The first two Saved Searches for Escalated Events will automatically be OR’d together to populate a queue with all Escalations for both business and conduct risk.
● Having different entity.filter syntax can result in having Saved Searches for both “My Escalations” and “My Reviews”.
My Escalations
The My Escalations tab displays all Events returned by Saved Searches configured for Escalation. To configure a Saved Search for Escalation, the Escalation box must be selected.
A count for the number of Escalations to Review is provided in the My Escalations tab. As previously mentioned, the RQL syntax for the Saved Searches associated with My Escalations will drive the Review action for these Events. Specifically, Events are removed from the Review queue as the Review Status is changed, if the new Review Status selected is not included in the Saved Search criteria for My Escalations.
The Event Viewer is populated with the selected Events.
NoteParentheses must be used for the NOT (reviewed.status) syntax.
NoteNot all end users are responsible for configuring their Review queue via Saved Searches. See the Administration and Troubleshooting Manual to insert Saved Searches directly into the Postgres database for each end user. [HYPERTEXT LINK]
Forcepoint UEBA 46

In the Event Viewer, click the Review Status button to change the Review Status to escalate further, close, or select for review.
As these Events are placed in a different Review Status that no longer matches the My Escalations Saved Searches, the Events will be removed from the My Escalations Review queue. After the My Escalations Review queue is empty, the Event Viewer will automatically populate with all Events in the My Reviews queue.
My Reviews
If a user does not have any Events in My Escalations, or changes the Review Status of all Events in My Escalations to one that is not included in the Saved Search criteria for My Escalations, the Review Dashboard will automatically be populated with Events from My Reviews.
Alternatively, click the My Reviews tab to skip to Reviewing Events.
Like My Escalations, My Reviews automatically “ORs” together all Saved Searches associated with My Reviews to populate the user’s Review queue.
A count for the number of Events to Review is provided in the My Reviews tab. Click the My Reviews tab to see each of the Saved Searches associated with My Reviews and the corresponding Event Count in the dropdown menu. Click any of the Saved Searches to Review Events associated with the selected criteria.
Forcepoint UEBA Administration and Troubleshooting Manual 47

Events are also filtered by Reviewees, people you may be responsible for monitoring. The Reviewees are defined for each user on their User Management page, in the Review Dashboard Settings section.
Reviewees are a list of all Entities that match with at least one Entity Filter. Select a Reviewee to inspect all Events associated with that Entity.
The Reviewees subtab is located to the left of Saved Searches in the My Reviews drop-down.
Reviewees with zero associated Events in the Review queue are minimized in a collapsible dropdown. To view the additional Reviewees with zero associated Events in the Review queue, expand the dropdown.
My Reviewed
The My Reviewed tab in the header displays Events that have previously been Reviewed. The My Reviewed drop-down provides a Date Range filed to select the Date Range of Events to view that have previously been reviewed.
NoteThe Date Range looks for the date of the original Event, not the date the user reviewed the Event.
Forcepoint UEBA 48

In addition to selecting a Date Range, the Review Status(es) of the Events must be selected in order to view the Events. The Review Status selection will only query the most recent Review Status on an Event.
After clicking Apply on the My Reviewed selection dropdown, the application will search for and return all Events that meet the following three criteria in the Event Viewer:
● Date range selected in My Reviewed
● Review Status(es) selection
● Reviewed by the current user
Risk Adaptive Protection
Introduction
Risk Adaptive Protection (RAP) is the human-centric approach to security, where decisions are made based on who is participating in a security event. Dynamic Data Protection (DDP) is how RAP is made manifest when Forcepoint DLP works with Forcepoint UEBA. If an organization has both Forcepoint DLP (v8.5.2 and later) and Forcepoint UEBA (v3.0 and later), Forcepoint DLP can be configured to send select channel information to Forcepoint UEBA.
Forcepoint UEBA then ingests those events, produces risk level information about the entities involved in those events, and returns the risk level to Forcepoint DLP. Forcepoint DLP policy actions can then be configured differently for entities at different risk level.
NoteThe My Reviewed tab does not automatically update the Event count when an Event’s Review Status changes and no longer matches the selected My Reviewed filter criteria. The browser must be refreshed to update the My Reviewed tab Event count.
Forcepoint UEBA Administration and Troubleshooting Manual 49
See Dynamic Data Protection Getting Started Guide and Risk Adaptive Protection User Manager.
UEBA Publishing Service
The integration of Forcepoint DLP with Forcepoint UEBA is seamless. Once DLP is configured to send channel data to Forcepoint UEBA, those channel events will be ingested into Forcepoint UEBA. DLP adds entity information to Forcepoint UEBA and automatically sets the Monitored Entity value as True for those entities.
Starting with version 3.0, the ingest pipeline for Forcepoint UEBA is designed to accept these DLP events. In addition, a new service called the UEBA Publishing Service (UPS) produces Risk Level information and shares those Risk Levels with DLP on an hourly basis for all monitored entities.
By default, Forcepoint UEBA is configured to expect this information and run UPS. To disable that configuration, see the Forcepoint UEBA Configuration manual.
DDP in the Forcepoint UEBA User Interface
The Forcepoint UEBA UI remains the same, as does Forcepoint UEBA analytic configuration. Forcepoint UEBA produces a risk score for all monitored entities, on a scale of 0-100, with 100 being the highest.
When DDP is active, Forcepoint UEBA also produces a risk level for each monitored entity. The risk level is on a scale from 1 through 5, with 5 being the highest risk level.
Risk Level is calculated based on a weighted average of the risk score over a window of time. The weighting favors more recent high scores over less recent low scores. Risk level is more likely to rise quickly and drop slowly. This increases risk level with recent high risk scores, and reverses that rise in risk level only as the risk score stays lower for a prolonged period of time. There is not a direct relation of risk level to risk score at any given time. Two users with the same risk score may have different risk levels based on one user showing a higher risk score more frequently than the other. A user with a lower current risk score than another may have a higher risk level because the weight of recent high risk scores will lead to a higher risk level, even if the current risk score is relatively low.
When DDP is active, UEBA shows the risk level for an entity in the following places:
● On the analytics Dashboard, as a score in a circle next to the Risk Score
● On the entity timeline, above the hourly bar chart, indicating the Risk Level over time for the period covered by the entity timeline.
● On the entity profile page.
ImportantRisk Level is based on Risk Score, which is a function of scenario scores. To produce Risk Level, Forcepoint UEBA must be configured with at least one Scenario.
Forcepoint UEBA 50

There is no need to manually configure DDP entities as "Monitored Entity = True". Forcepoint DLP automatically configures the value as True for entities for which it is collecting event information.
Risk Level History is a history of what was reported to DLP. If UPS is down, for the hours that the service is down, Risk Level scores will not be sent to DLP and there will be a gap in the Risk Level History. This is not expected to happen, but if it does, and so these gaps are actually informative as they indicate a gap in the integration.
Persistence
The Forcepoint UEBA application often saves page UI configurations when navigating between views. This helps users seamlessly move around Forcepoint UEBA while investigating different types of data. Below are some persistence notes to be aware of.
Explore
Event Viewer Size: When the Event Viewer size is configured on the Explore page, the size will remain the same as users navigate to and from the Explore page.
Event Viewer Sorting: When the Event Viewer sort preference is configured on the Explore page, the sort preference will remain the same as users navigate to and from the Explore page.
Saved Search: When a search is executed on the Explore page, search criteria will remain saved as users navigate to and from the Explore page.
Card Selection: When a card is selected while in the full screen Event Viewer, the selected card will remain the same as users navigate to and from the Explore page.
Behaviors
Scenarios: When a Scenario is selected or configured on the Behaviors page, the page state will remain the same as users navigate to and from the Behavior Page.
NoteIf Monitored Entity values are set to False in the Forcepoint UEBA UI, continued integration with DLP may see those values set back to True as the DLP integration continues to share information for that entity with UEBA.
Forcepoint UEBA Administration and Troubleshooting Manual 51

Frontend Configuration
Lexicons
Lexicons are used to efficiently detect distinct types of communication through a predefined list of related keywords.
Navigate to Settings > Lexicons to configure Lexicons. Word and Domain lexicons are scored on a binary scale, where Sentiment lexicons are scored by the sentiment scoring algorithm. Scores are determined by achieving a lexicon match, not by the quantity of lexicons matched.
Words
Word Lexicons define general communication context categories and are the most commonly used Lexicon.
Domains
Define terms and phrases that indicate whether specific domains were included in an Event’s entity list.
Sentiment
Sentiment defines terms and phrases that indicate opinions and/or emotions.
For example, the official Forcepoint UEBA “Negative Sentiment” Lexicon includes:
Anger, Disappointed, Mockery, Stain, Vengeance
Forcepoint UEBA 52
Lexicon Strategy
The objective of a Lexicon is to create a list of keywords that accurately flag the type of behavior of interest without creating unnecessary false positives, like marking a benign event as suspicious.
Exact strategy for defining and creating Lexicons is dependent on individual need, and will most likely involve consistent fine tuning and attention to the performance of individual Lexicons.
Editing Standard Lexicons
Forcepoint UEBA provides a list of standard Lexicons with each new deployment.
To edit existing Lexicons:
1. Navigate to Lexicon View to view a long list of Lexicon keywords.
2. Click See Lexicon to view the keywords within any Lexicon.
3. Click Hide to Hide these keywords.
4. Enter a term or phrase into the text field to add keywords to the Lexicon. Click Add.
5. To save changes, click Save.
6. Click the X to the right of an individual keyword in the Lexicon list to remove keywords.
7. To save changes, click Save.
Creating New Lexicons
If you have a new Domain, Sentiment, or Word list that you are interested in using to flag suspicious activity, then it is time to add a new Lexicon. Scroll to the very bottom of the “Lexicon” page where you will find Upload New List.
NoteA shorter Lexicon is not necessarily better than a longer one. Context like “Negative Sentiment” is quite broad, so a larger list size is needed to cover all negative sentiment possibilities.
However, a limited scope may be best for detecting automated context such as Out-of-town or Autoreply Phrases.
Forcepoint UEBA Administration and Troubleshooting Manual 53

To create a new Lexicon list:
1. Navigate to Upload New List at the bottom of the Lexicon Page.
2. Enter the desired Lexicon label in the List Name field.
3. Select the appropriate Lexicon type for the list using the radio buttons below.
4. Choose the Lexicon Search Strategy using the radio buttons. The strategy options are:
■ Phrase is a phrase match query in Elasticsearch. This is used when searching keywords.
■ Lucene uses the Lucene "query parser" syntax (documentation available from Apache). This is used for performing wildcard searches, proximity searches, generally searching specific data fields, or performing complex queries.
■ RQL is more accurately called Embedded RQL, which is a subset of RQL. In Embedded RQL, users only specify the value or values. Those values are then OR'd together.
For example, if an RQL Lexicon had the entries "thanks", "thank you", and "price fixing", and then a search similar to "subject:{RQL Lexicon}" was performed, all subjects that contain "thanks OR thank you OR price fixing" would be searched for.
5. Enter keywords or phrases to the Add Words field to add content to the Lexicon.
6. Press Enter to add this content to the list.
7. Click the X by the added keyword / phrase to remove a keyword.
To bulk add keywords and phrases:
1. Click Choose File to upload a text file.
2. Separate each keyword or phrase must have its own line in the text file.
For example:
Let’s get fast food
NoteThe maximum number of characters allowed is 400. Long names will wrap and create multi-lined Lexicon UI items.
Forcepoint UEBA 54
I love burgers
Cheese
3. Name the Lexicon.
4. Click Submit.
Event Features
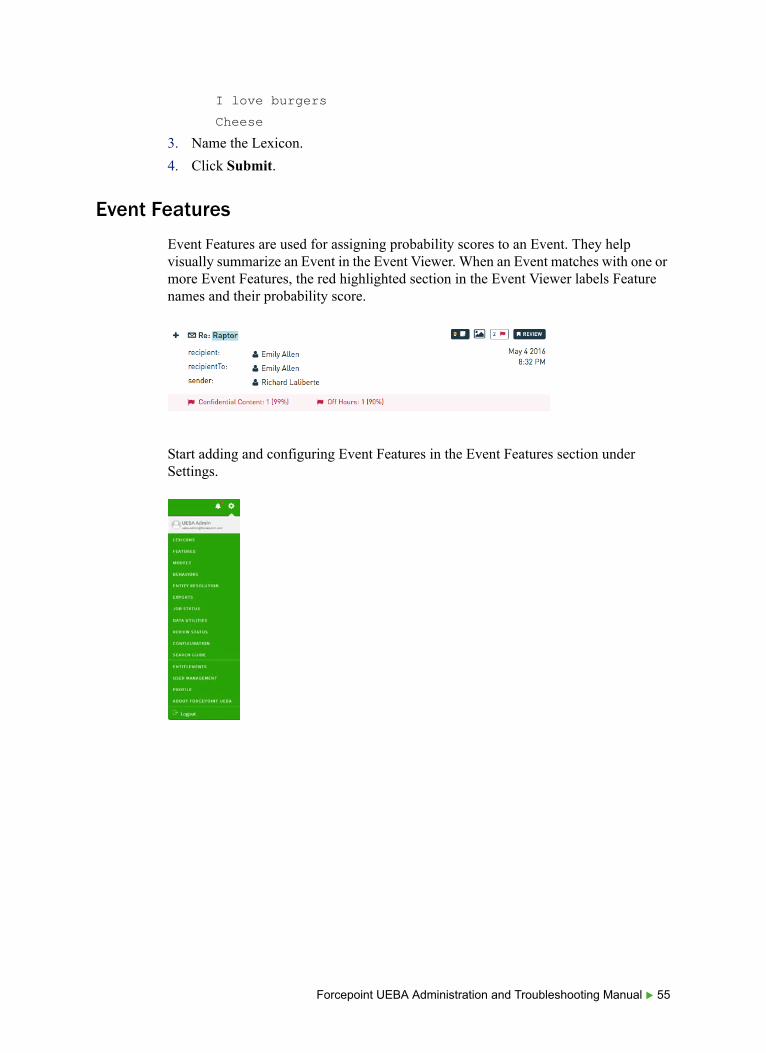
Event Features are used for assigning probability scores to an Event. They help visually summarize an Event in the Event Viewer. When an Event matches with one or more Event Features, the red highlighted section in the Event Viewer labels Feature names and their probability score.
Start adding and configuring Event Features in the Event Features section under Settings.
Forcepoint UEBA Administration and Troubleshooting Manual 55
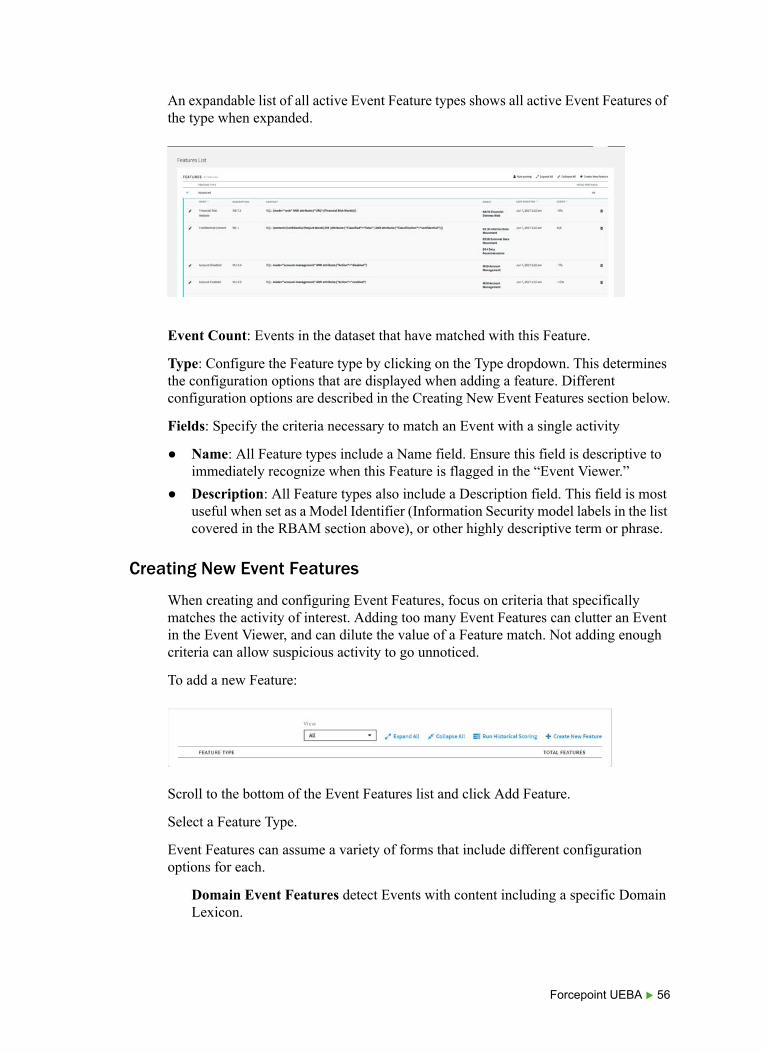
An expandable list of all active Event Feature types shows all active Event Features of the type when expanded.
Event Count: Events in the dataset that have matched with this Feature.
Type: Configure the Feature type by clicking on the Type dropdown. This determines the configuration options that are displayed when adding a feature. Different configuration options are described in the Creating New Event Features section below.
Fields: Specify the criteria necessary to match an Event with a single activity
● Name: All Feature types include a Name field. Ensure this field is descriptive to immediately recognize when this Feature is flagged in the “Event Viewer.”
● Description: All Feature types also include a Description field. This field is most useful when set as a Model Identifier (Information Security model labels in the list covered in the RBAM section above), or other highly descriptive term or phrase.
Creating New Event Features
When creating and configuring Event Features, focus on criteria that specifically matches the activity of interest. Adding too many Event Features can clutter an Event in the Event Viewer, and can dilute the value of a Feature match. Not adding enough criteria can allow suspicious activity to go unnoticed.
To add a new Feature:
Scroll to the bottom of the Event Features list and click Add Feature.
Select a Feature Type.
Event Features can assume a variety of forms that include different configuration options for each.
Domain Event Features detect Events with content including a specific Domain Lexicon.
Forcepoint UEBA 56

■ Domain options include the Domain Lexicons configured in the Lexicon page. Select a Primary Domain and Primary Role, as well as a Secondary Domain and Secondary Role.
■ The Constraint toggle requires either one or both of the Domains to flag the Feature. The following Feature will flag Events that include a Flight Risk Domain Sender AND a Domestic Media Domain Recipient.
■ Advanced Event Features use an RQL filter for Feature criteria. This specifies specific Modes, Lexicons, and Time Groupings all in one Feature.
■ The Description field is used for a specific Model Identifier.
■ The Search field is used for desired RQL queries. This Feature is flagged by Events that match the “Account-Management” Mode and an “Action”=“modified” Attribute.
Lexicon Event Features detect events with content that include specific Lexicon content. Use the Lexicon dropdown to select the Lexicon of interest. This Feature flags Events including content that matches the Broad Flight Risk Words Lexicon.
Sentiment Event Features score events by comparing an event’s body field with the words in a Sentiment Lexicon. Sentiment lexicons are configured on the Lexicon page. Sentiment feature scores are real-valued and are a function of the number of words in the body that are in the sentiment lexicon and the total number of words in the body field. Forcepoint UEBA includes two Sentiment Lexicons by
Forcepoint UEBA Administration and Troubleshooting Manual 57
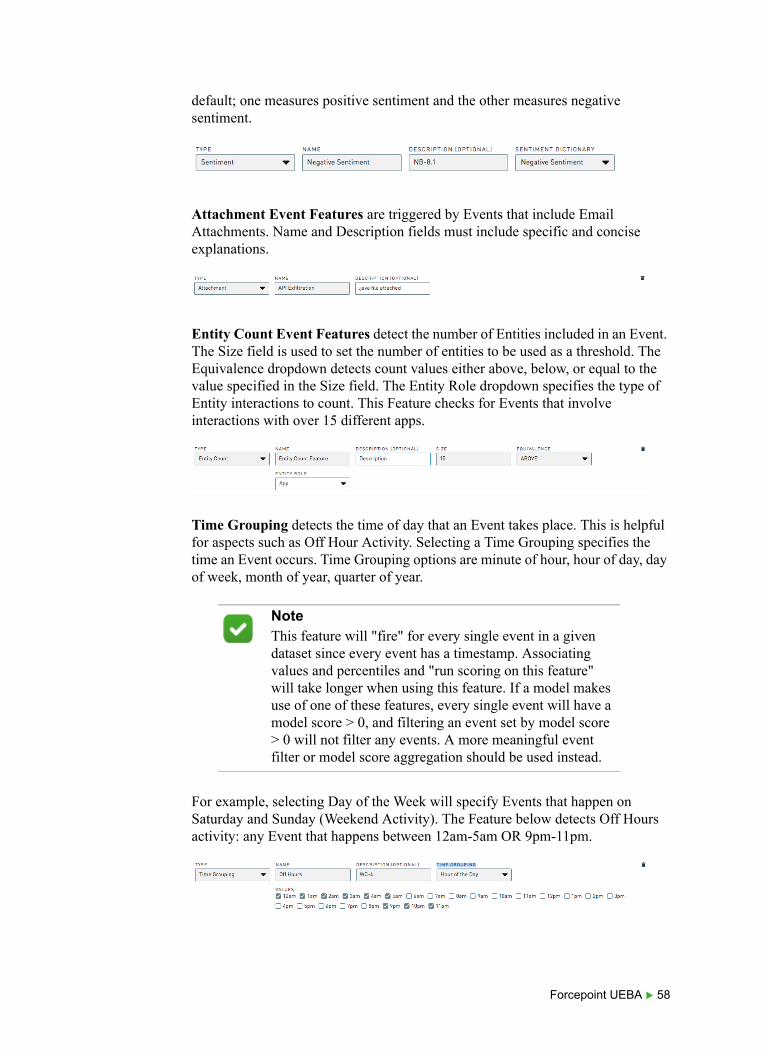
default; one measures positive sentiment and the other measures negative sentiment.
Attachment Event Features are triggered by Events that include Email Attachments. Name and Description fields must include specific and concise explanations.
Entity Count Event Features detect the number of Entities included in an Event. The Size field is used to set the number of entities to be used as a threshold. The Equivalence dropdown detects count values either above, below, or equal to the value specified in the Size field. The Entity Role dropdown specifies the type of Entity interactions to count. This Feature checks for Events that involve interactions with over 15 different apps.
Time Grouping detects the time of day that an Event takes place. This is helpful for aspects such as Off Hour Activity. Selecting a Time Grouping specifies the time an Event occurs. Time Grouping options are minute of hour, hour of day, day of week, month of year, quarter of year.
For example, selecting Day of the Week will specify Events that happen on Saturday and Sunday (Weekend Activity). The Feature below detects Off Hours activity: any Event that happens between 12am-5am OR 9pm-11pm.
NoteThis feature will "fire" for every single event in a given dataset since every event has a timestamp. Associating values and percentiles and "run scoring on this feature" will take longer when using this feature. If a model makes use of one of these features, every single event will have a model score > 0, and filtering an event set by model score > 0 will not filter any events. A more meaningful event filter or model score aggregation should be used instead.
Forcepoint UEBA 58
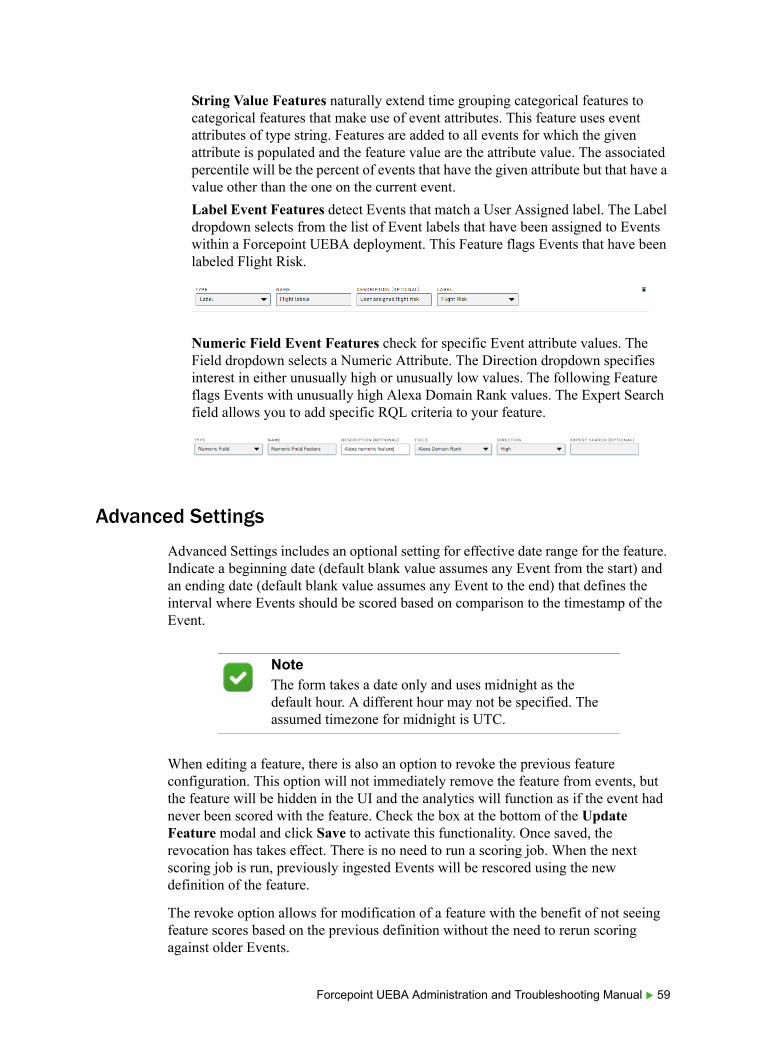
String Value Features naturally extend time grouping categorical features to categorical features that make use of event attributes. This feature uses event attributes of type string. Features are added to all events for which the given attribute is populated and the feature value are the attribute value. The associated percentile will be the percent of events that have the given attribute but that have a value other than the one on the current event.
Label Event Features detect Events that match a User Assigned label. The Label dropdown selects from the list of Event labels that have been assigned to Events within a Forcepoint UEBA deployment. This Feature flags Events that have been labeled Flight Risk.
Numeric Field Event Features check for specific Event attribute values. The Field dropdown selects a Numeric Attribute. The Direction dropdown specifies interest in either unusually high or unusually low values. The following Feature flags Events with unusually high Alexa Domain Rank values. The Expert Search field allows you to add specific RQL criteria to your feature.
Advanced Settings
Advanced Settings includes an optional setting for effective date range for the feature. Indicate a beginning date (default blank value assumes any Event from the start) and an ending date (default blank value assumes any Event to the end) that defines the interval where Events should be scored based on comparison to the timestamp of the Event.
When editing a feature, there is also an option to revoke the previous feature configuration. This option will not immediately remove the feature from events, but the feature will be hidden in the UI and the analytics will function as if the event had never been scored with the feature. Check the box at the bottom of the Update Feature modal and click Save to activate this functionality. Once saved, the revocation has takes effect. There is no need to run a scoring job. When the next scoring job is run, previously ingested Events will be rescored using the new definition of the feature.
The revoke option allows for modification of a feature with the benefit of not seeing feature scores based on the previous definition without the need to rerun scoring against older Events.
NoteThe form takes a date only and uses midnight as the default hour. A different hour may not be specified. The assumed timezone for midnight is UTC.
Forcepoint UEBA Administration and Troubleshooting Manual 59
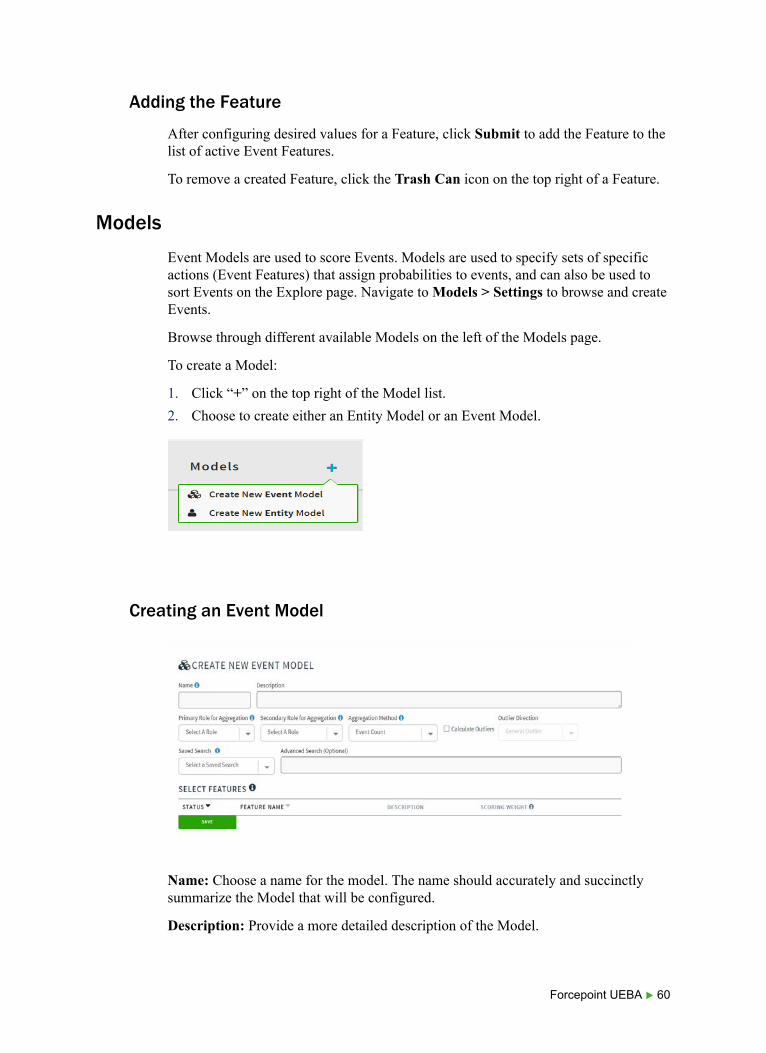
Adding the Feature
After configuring desired values for a Feature, click Submit to add the Feature to the list of active Event Features.
To remove a created Feature, click the Trash Can icon on the top right of a Feature.
Models
Event Models are used to score Events. Models are used to specify sets of specific actions (Event Features) that assign probabilities to events, and can also be used to sort Events on the Explore page. Navigate to Models > Settings to browse and create Events.
Browse through different available Models on the left of the Models page.
To create a Model:
1. Click “+” on the top right of the Model list.
2. Choose to create either an Entity Model or an Event Model.
Creating an Event Model
Name: Choose a name for the model. The name should accurately and succinctly summarize the Model that will be configured.
Description: Provide a more detailed description of the Model.
Forcepoint UEBA 60
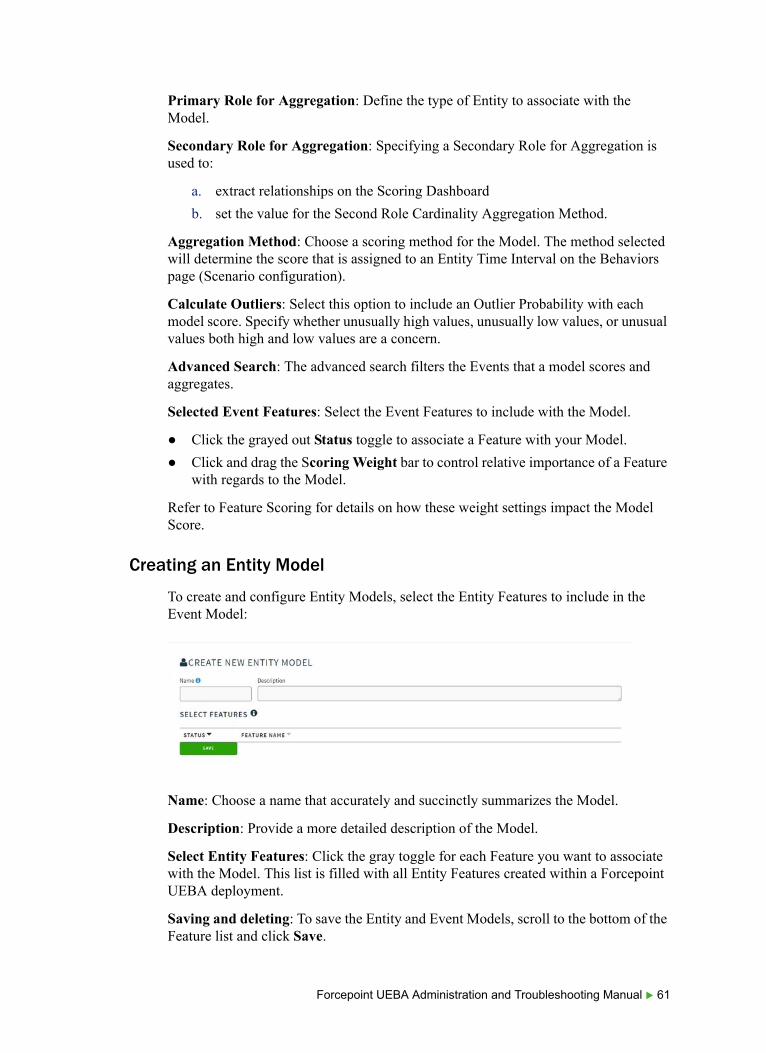
Primary Role for Aggregation: Define the type of Entity to associate with the Model.
Secondary Role for Aggregation: Specifying a Secondary Role for Aggregation is used to:
a. extract relationships on the Scoring Dashboard
b. set the value for the Second Role Cardinality Aggregation Method.
Aggregation Method: Choose a scoring method for the Model. The method selected will determine the score that is assigned to an Entity Time Interval on the Behaviors page (Scenario configuration).
Calculate Outliers: Select this option to include an Outlier Probability with each model score. Specify whether unusually high values, unusually low values, or unusual values both high and low values are a concern.
Advanced Search: The advanced search filters the Events that a model scores and aggregates.
Selected Event Features: Select the Event Features to include with the Model.
● Click the grayed out Status toggle to associate a Feature with your Model.
● Click and drag the Scoring Weight bar to control relative importance of a Feature with regards to the Model.
Refer to Feature Scoring for details on how these weight settings impact the Model Score.
Creating an Entity Model
To create and configure Entity Models, select the Entity Features to include in the Event Model:
Name: Choose a name that accurately and succinctly summarizes the Model.
Description: Provide a more detailed description of the Model.
Select Entity Features: Click the gray toggle for each Feature you want to associate with the Model. This list is filled with all Entity Features created within a Forcepoint UEBA deployment.
Saving and deleting: To save the Entity and Event Models, scroll to the bottom of the Feature list and click Save.
Forcepoint UEBA Administration and Troubleshooting Manual 61

To delete a Model, click the Trash Can icon on the top right area of the screen.
Scenarios
Scenarios are used to assign risk scores on the Analytics Dashboard, helping Analysts identify the most suspicious individuals in an organization. The list of active Scenarios in a Forcepoint UEBA deployment can be found on the Analytics Dashboard in the Active Scenarios box.
A Scenario is made up of multiple Models, which helps analysts identify overall scoring patterns of a Monitored Entity. Scenarios are also used to visualize how Monitored Entities scored with regards to specific Models and Entity Time Intervals. Scenarios are configured on the Behaviors page.
To add Models to your Scenario:
1. Click the “+” icon next to Models.
2. Select the Model from the Apply Existing Model dropdown to apply it to the Scenario.
3. Click Apply to add the Model.
4. Click Cancel to stop adding the Model to the Scenario.
Repeat steps 1-4 until the Models needed are listed.
To visualize this Scenario:
1. Click Apply at the top right of the Behavior page.
2. Click Save to the left of Apply to save the Model.
3. Click Delete to the left of Save to remove the Scenario.
Forcepoint UEBA 62
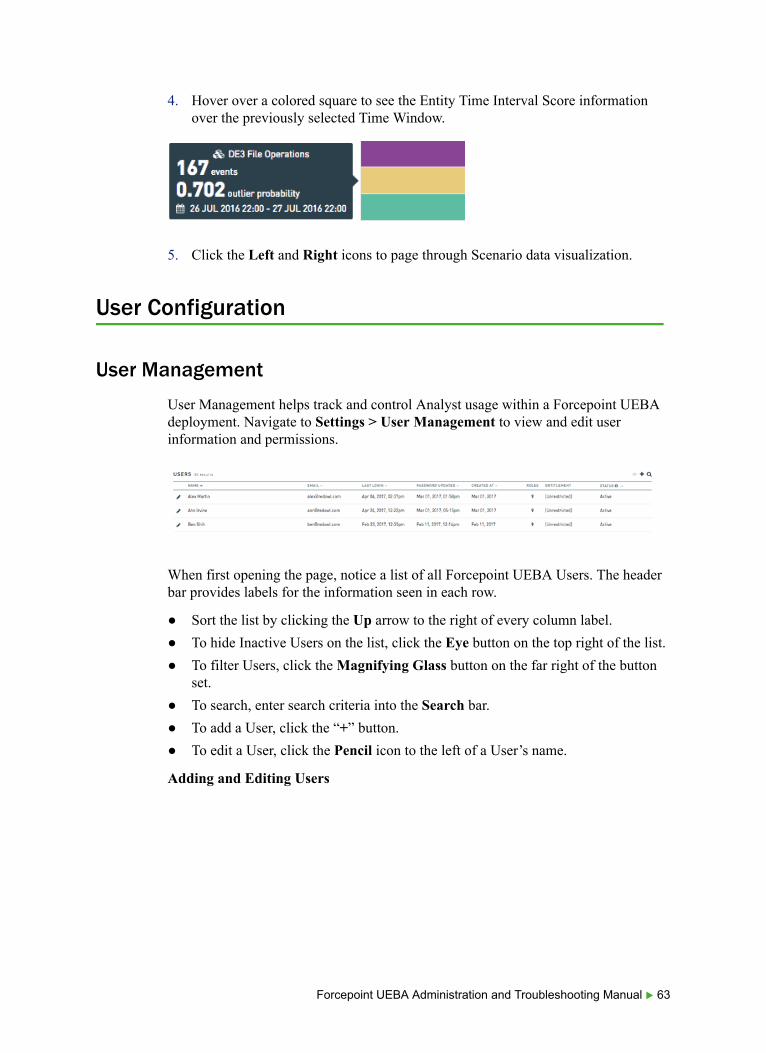
4. Hover over a colored square to see the Entity Time Interval Score information over the previously selected Time Window.
5. Click the Left and Right icons to page through Scenario data visualization.
User Configuration
User Management
User Management helps track and control Analyst usage within a Forcepoint UEBA deployment. Navigate to Settings > User Management to view and edit user information and permissions.
When first opening the page, notice a list of all Forcepoint UEBA Users. The header bar provides labels for the information seen in each row.
● Sort the list by clicking the Up arrow to the right of every column label.
● To hide Inactive Users on the list, click the Eye button on the top right of the list.
● To filter Users, click the Magnifying Glass button on the far right of the button set.
● To search, enter search criteria into the Search bar.
● To add a User, click the “+” button.
● To edit a User, click the Pencil icon to the left of a User’s name.
Adding and Editing Users
Forcepoint UEBA Administration and Troubleshooting Manual 63
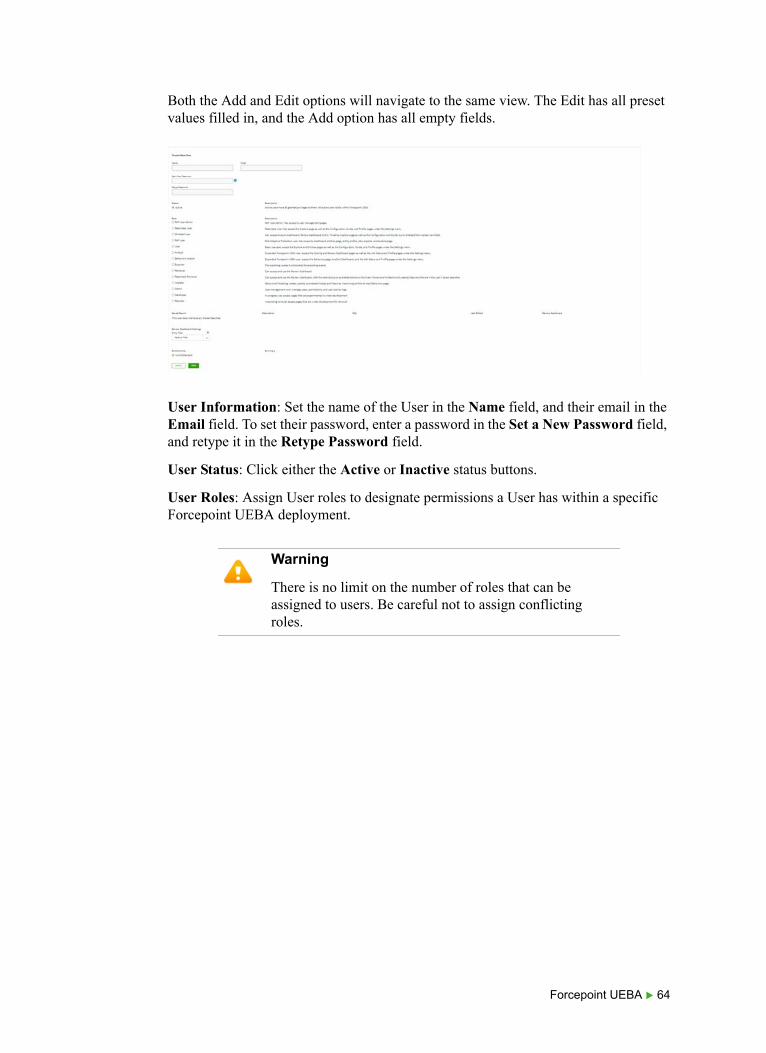
Both the Add and Edit options will navigate to the same view. The Edit has all preset values filled in, and the Add option has all empty fields.
User Information: Set the name of the User in the Name field, and their email in the Email field. To set their password, enter a password in the Set a New Password field, and retype it in the Retype Password field.
User Status: Click either the Active or Inactive status buttons.
User Roles: Assign User roles to designate permissions a User has within a specific Forcepoint UEBA deployment.
Warning
There is no limit on the number of roles that can be assigned to users. Be careful not to assign conflicting roles.
Forcepoint UEBA 64
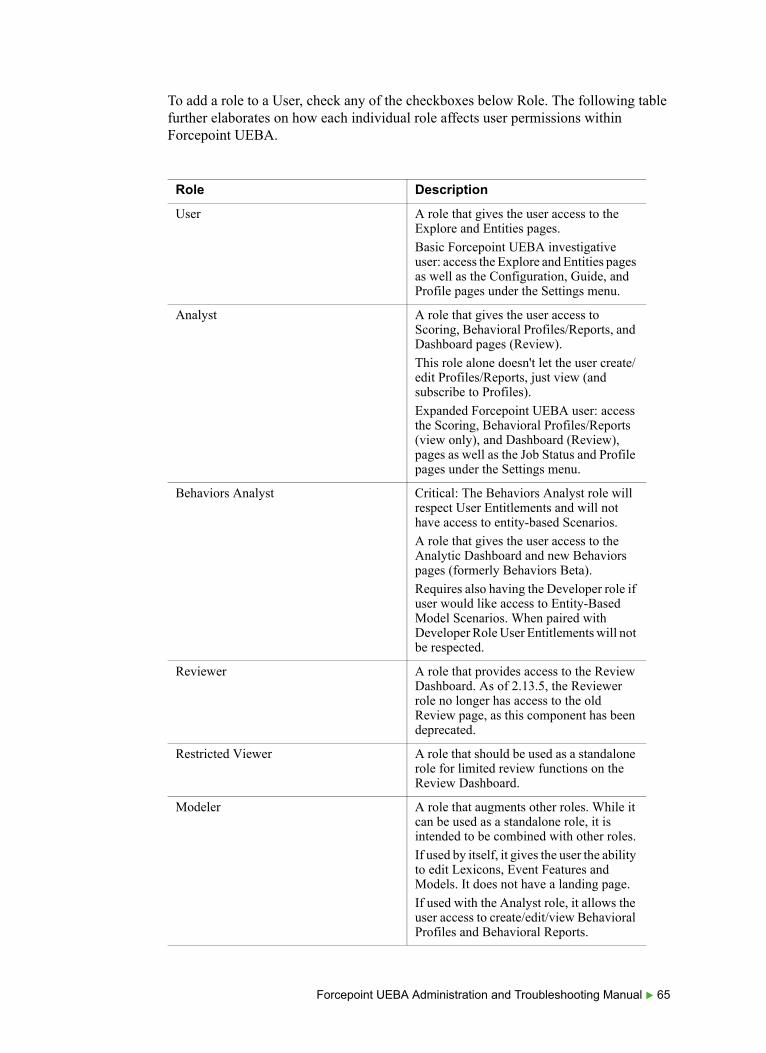
To add a role to a User, check any of the checkboxes below Role. The following table further elaborates on how each individual role affects user permissions within Forcepoint UEBA.
Role Description
User A role that gives the user access to the Explore and Entities pages.
Basic Forcepoint UEBA investigative user: access the Explore and Entities pages as well as the Configuration, Guide, and Profile pages under the Settings menu.
Analyst A role that gives the user access to Scoring, Behavioral Profiles/Reports, and Dashboard pages (Review).
This role alone doesn't let the user create/edit Profiles/Reports, just view (and subscribe to Profiles).
Expanded Forcepoint UEBA user: access the Scoring, Behavioral Profiles/Reports (view only), and Dashboard (Review), pages as well as the Job Status and Profile pages under the Settings menu.
Behaviors Analyst Critical: The Behaviors Analyst role will respect User Entitlements and will not have access to entity-based Scenarios.
A role that gives the user access to the Analytic Dashboard and new Behaviors pages (formerly Behaviors Beta).
Requires also having the Developer role if user would like access to Entity-Based Model Scenarios. When paired with Developer Role User Entitlements will not be respected.
Reviewer A role that provides access to the Review Dashboard. As of 2.13.5, the Reviewer role no longer has access to the old Review page, as this component has been deprecated.
Restricted Viewer A role that should be used as a standalone role for limited review functions on the Review Dashboard.
Modeler A role that augments other roles. While it can be used as a standalone role, it is intended to be combined with other roles.
If used by itself, it gives the user the ability to edit Lexicons, Event Features and Models. It does not have a landing page.
If used with the Analyst role, it allows the user access to create/edit/view Behavioral Profiles and Behavioral Reports.
Forcepoint UEBA Administration and Troubleshooting Manual 65
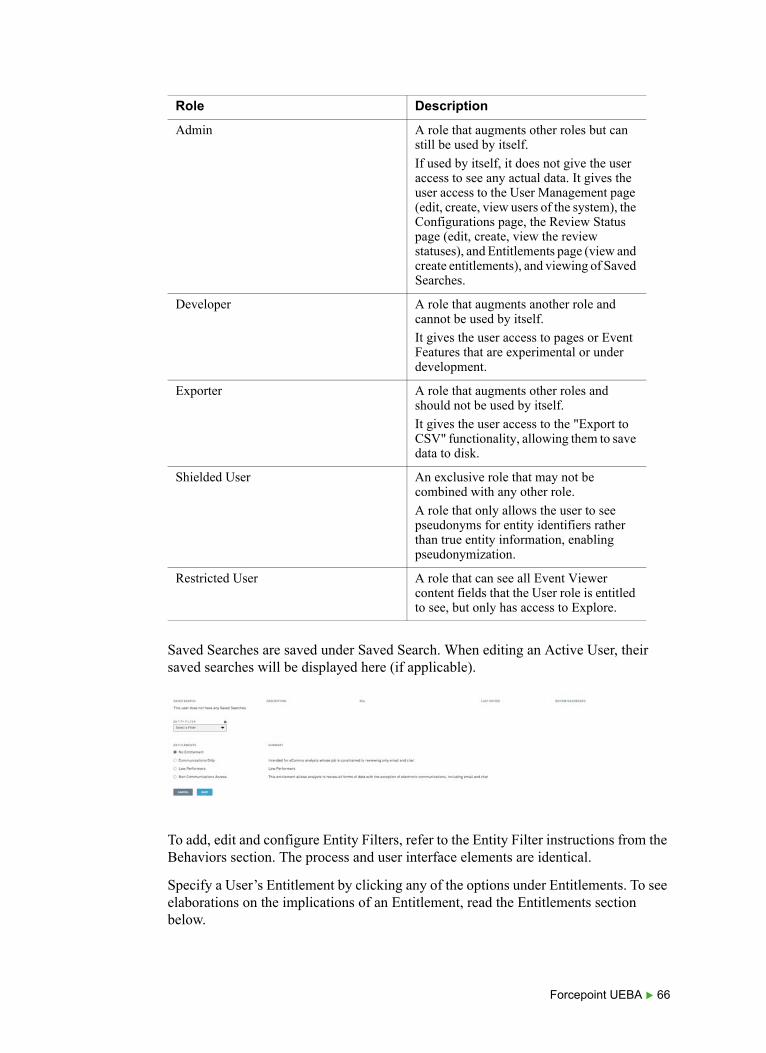
Saved Searches are saved under Saved Search. When editing an Active User, their saved searches will be displayed here (if applicable).
To add, edit and configure Entity Filters, refer to the Entity Filter instructions from the Behaviors section. The process and user interface elements are identical.
Specify a User’s Entitlement by clicking any of the options under Entitlements. To see elaborations on the implications of an Entitlement, read the Entitlements section below.
Admin A role that augments other roles but can still be used by itself.
If used by itself, it does not give the user access to see any actual data. It gives the user access to the User Management page (edit, create, view users of the system), the Configurations page, the Review Status page (edit, create, view the review statuses), and Entitlements page (view and create entitlements), and viewing of Saved Searches.
Developer A role that augments another role and cannot be used by itself.
It gives the user access to pages or Event Features that are experimental or under development.
Exporter A role that augments other roles and should not be used by itself.
It gives the user access to the "Export to CSV" functionality, allowing them to save data to disk.
Shielded User An exclusive role that may not be combined with any other role.
A role that only allows the user to see pseudonyms for entity identifiers rather than true entity information, enabling pseudonymization.
Restricted User A role that can see all Event Viewer content fields that the User role is entitled to see, but only has access to Explore.
Role Description
Forcepoint UEBA 66

Once satisfied with your User, click the blue Save button at the bottom of the view. To cancel the process, click the gray Cancel button to the left of Save.
Entitlements
Entitlements are configurable restrictions given to Users and they allow data to be assigned viewing permissions. Navigate to Settings > Entitlements to see a full list of Entitlements.
The information in each row is classified by a label at the top of each column. Sort this list of different value types by clicking on the gray Up arrow next to each label.
To filter Entitlements, click Search at the top right of the Entitlements view.
To add an Entitlement:
1. Click the “+” next to Search.
2. Select an Entitlement Type:
■ RQL-Based Entitlement: Entitlement depends on an RQL filter
■ Entity-Based Entitlement: Entitlement depends on an Entity. These are event driven.
3. In the Name field, enter a name that accurately and succinctly summarizes the Entitlement.
Forcepoint UEBA Administration and Troubleshooting Manual 67

4. In the Description field, provide a more detailed description of the Entitlement.
5. In the RQL Filter field, provide the desired RQL query.
6. In the Entity field, name the new Entity to be created as a result of the new Entity-Based Entitlement.
7. Click Save.
To cancel the process, click Cancel.
To delete an Entitlement, click the Trash Can icon to the right of an Entitlement.
Configuration View
The Configuration View is used to specify the date format used within a Forcepoint UEBA deployment, as well as the chronological context for each Event Mode. Navigate to Settings > Configuration to see the Configuration View.
Dates
To configure dates:
1. Navigate to User > Dates.
2. Click the Date Format dropdown to select the desired date/time format.
3. Click Save.
Forcepoint UEBA 68

Context
Context refers to related Events that have occurred before and after a certain Event. Navigate to Forcepoint UEBA > Show Context.
Configure the context for an Event Mode to determine the Time Window for which Events are displayed, given a certain Mode.
To configure the Time Window for each Mode:
1. Click the Time Before Event dropdown and select the amount of time, in hours or days, to determine how far back an Event Mode’s Context will reach.
2. Click the Time After Event dropdown and select the amount of time, in hours or days, to determine how far forward an Event Mode’s Context will reach.
3. Click the Select Entity Roles dropdown to specify an Entity Role filter to be associated with a Mode.
4. Click Included Modes to specify additional Modes associated with an overarching Mode.
5. Add text to the Custom Add-On RQL Filter to further filter the Mode.
6. Click Save.
To undo changes, navigate away from this page without clicking save. Changes will not be saved.
RQL Usage
RedOwl Query Language (RQL) provides a simple search format to efficiently search through the expansive set of Forcepoint UEBA data. The following describes the motivation behind creating an internal query language, as well as proving its immediate ease of use for all types of users.
While RQL may seem complex at first, it is both intuitive and powerful.
NoteTo see an Event’s Context in the Event Viewer, click the Image button between the Notes and Event Features icon.
Forcepoint UEBA Administration and Troubleshooting Manual 69
The Origins & Analytic Power of RQL
At its core, Forcepoint UEBA ingests disparate enterprise data sources and provides a centralized view over the data to identify high-risk behaviors across a wide variety of information security and regulatory surveillance use cases. The power of Forcepoint UEBA lies in standardizing these unique sorts of data sources to make them immediately comparable.
In order to Model and Normalize disparate data sources, Forcepoint UEBA relies on a foundational data model and supporting data structures in other components of the software architecture. Our goal is to abstract the underlying data structures and technologies from the user so that users can focus on identifying risks in their organization and not on learning and managing backend technologies.
Forcepoint UEBA has introduced a simplified query language that allows users to find data most relevant to their information security and regulatory surveillance use cases.
Consider the following very basic before-and-after examples of querying data in Forcepoint UEBA.
● Content Search: A user searches for all instances of the project code-word “Dynamo” in any Event content. The user must search for “Dynamo” in each of the fields of Event data. For example:
○ To search within the body field of an event:body: Dynamo
○ To search in the content field of an event:content:Dynamo
■ With RQL: a user may simply Search for Dynamo in the Advanced Search input and the application queries over all fields for that Word. A user does not need to know the data fields in Forcepoint UEBA’s data model to do this simple query.
● Entity Attribute Search: A user wants to search for any Event associated with employees in the company’s Denver office.
■ This query can easily be completed using RQL and the simple search:
entity.filter:(location=Denver).
RQL Fundamentals
Note
When copying and pasting RQL query examples into Forcepoint UEBA, make sure the quotes are straight quotes, not smart quotes. If any RQL queries show as invalid, try retyping each quote to make sure smart quotes are not causing the issue.
Forcepoint UEBA 70
An RQL statement is broken up into four distinct elements, generally taking the form of field.qualifier operator value, where the only required input is the value to search for within Event data.
● Field: The object (Entity, Attribute, Mode, etc.) to search for.
● Qualifier: Additional object criteria specific to defining the object to search for.
For example, if Entity is the selected field, check to see if the Entity is of Qualifier type App, Customer, Destination, Domain, etc.
● Operator Define how close of a value match to search for, whether between two values or exactly matching one value.
For example, “=” is used to check for string value matches. Operators such as “<, >” are used to check equality between numeric values.
● Value: The specific number, string, boolean, etc., to look for.
Execute the RQL query using the above components in the following format:
<Field>:(<Qualifier> <Operator> <Value>)
For example:
attribute:("Action"="Logon")
To look for a match in a specific content Field, specify the Field in the query:
content:"raptor"
or
Subject:"raptor"
or
body:"raptor"
Important notes to remember, regarding general RQL format:
● Fields:
■ Are NOT case sensitive
■ When not specified, search terms are executed over content Fields by default:
○ Body○ Subject○ Attachment body
■ Field names that aren’t a content search, such as rawSearch, Feature, Entity, and Model, are called ‘complex’ searches.
● Qualifiers:
■ Qualifiers may be any quoted text.
■ Qualifiers may also be any of the following non-quoted values: match, bytes, count, name, content, on, before, after, between, by, status, value, percentile.
■ Every Field has a default Qualifier and there are no Qualifiers that cannot be explicitly specified.
■ Not all Fields support all Qualifiers. Refer to the Syntax section below for accepted Qualifiers for each Field.
Forcepoint UEBA Administration and Troubleshooting Manual 71
● Operators:
■ (search over analyzed Fields)
■ = (search over not analyzed Fields)
■ = < > <= >= (numeric)
■ ( ) unary NOT
● Values:
○ Basic types: strings (including quoted strings with spaces), numbers, booleans, ranges, dates
○ References: indicated with curly brackets ( { and } ) - only used for Lexicons at the moment
○ Advanced types: indicated with round parentheses - for rawSearch, Feature, Entity filter, and Model searches
○ Inputs are analyzed when searching over analyzed Fields○ Wildcard (*) currently only for Entity Roles. To match * literally, stick to
the convention of escaping it as \*. See the Quoting strings section below.
Quoting Strings
Quoting strings is used to group Search content. For instance, if searching for the content: my monday = terrible. without quotes, Forcepoint UEBA will recognize each Word as a different object of the RQL query, as well as confuse the “=” as an Operator and not as a part of the string. Quoting strings firmly defines content and removes ambiguity.
● Value strings may be quoted anytime
content:"hello"
or
subject:"passwords"
● Values must be quoted if they:
■ Contain spaces
content:"hello friend"
■ Contain an Operator or grouping character
content:"=)"
○ Operator characters are: = : < > ○ Grouping characters are: [ ] ( ) { }
■ Start with a number
content:"5 billion"
■ Contain a reserved Word/keyword
content:"not"
or
content:"to"
● Note that * and ? must be escaped within a quoted string
Forcepoint UEBA 72

content:"are you serious\?"
● There is a special case for using * as a single character in a quoted string (as a value for an Entity Role).
● Quotes on Feature and Lexicon names
■ Quotes are required for searching by Feature name. They are needed to easily parse the Operator and value also contained within the parentheses.
■ Quotes are optional for searching by Lexicon name, but they are needed when Lexicon names contain special characters.
Boolean Operators
Boolean Operators are used to combine multiple search criteria. Given two search criteria, (i.e. content:github, content:python) very different results can be found based on how the search criteria are combined.
For example, an RQL search may be used to find email Events with certain text content.
If a Search is performed for instances where Entities where email content include discussions about python documents on github, the AND Operator. will be used. The AND Operator is denoted by simply combining two criteria, with a space in between:
content:github content:python
● Multiple predicates of the same type (e.g. multiple label searches, multiple participant searches, multiple content searches) use the OR Operator.
content:github content:python
■ The results will contain all Events that contain either the word github OR the word python OR both.
■ In Boolean terms:
○ python OR github
● Searches of different predicate types use AND
content:github subject:python
■ The results will contain all Events that contain the word github AND that contain the word python in the subject field
■ In Boolean terms:
Note
Requiring users to escape them now allows increased ability later without migrating strings.
Forcepoint UEBA Administration and Troubleshooting Manual 73
github AND subject:python
To search for instances where Entities and email content includes discussion about github documents without python being mentioned, use the NOT Operator:
content:github NOT content:python
● The NOT boolean Operator is allowed:
not content:python
● If a Search is performed for two predicates of the same type and one has a NOT, the two parts of the Search will both be respected as follows:
content:github not content:python
■ The results will contain exactly the set of Events that have the word "github" AND that do NOT have the word "python."
■ In Boolean terms: the second piece of the query is NOT'd, and then the two pieces are OR'd. More explicitly (leaving out the "content" predicate for simplicity):
(NOT python) OR github
● If a Search is performed for two predicates of the same type and both have a NOT, the two parts of the Search will both be respected as follows:
Not content:github not content:python
■ The results will contain exactly the set of Events that do not have either word. If "python" is in the document, no match will be found. If github is in the document, no match will be found. If both are in the document, no match will be found.
■ In Boolean terms: the two pieces of the query are OR'd and then collectively NOT'd. More explicitly:
NOT (python OR github)
NoteThis is consistent with the current unified search behavior: search terms within a search box of a given type are OR'd, but search terms across filter boxes are AND'd.
Forcepoint UEBA 74
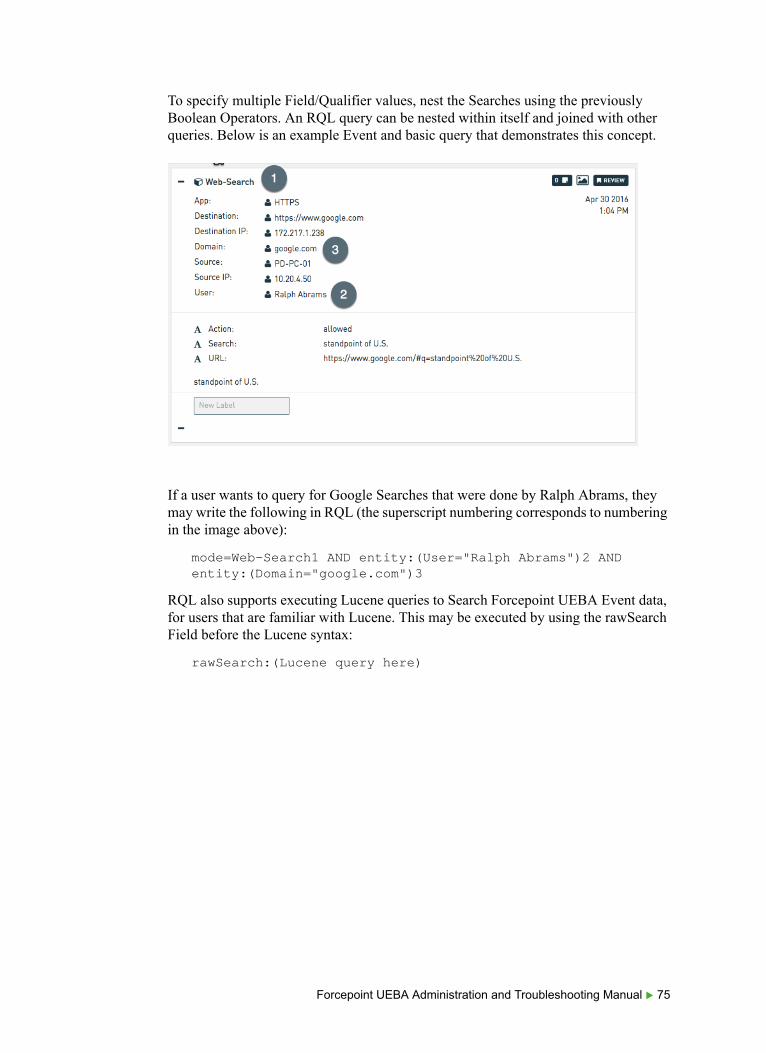
To specify multiple Field/Qualifier values, nest the Searches using the previously Boolean Operators. An RQL query can be nested within itself and joined with other queries. Below is an example Event and basic query that demonstrates this concept.
If a user wants to query for Google Searches that were done by Ralph Abrams, they may write the following in RQL (the superscript numbering corresponds to numbering in the image above):
mode=Web-Search1 AND entity:(User="Ralph Abrams")2 AND entity:(Domain="google.com")3
RQL also supports executing Lucene queries to Search Forcepoint UEBA Event data, for users that are familiar with Lucene. This may be executed by using the rawSearch Field before the Lucene syntax:
rawSearch:(Lucene query here)
Forcepoint UEBA Administration and Troubleshooting Manual 75

A complete list of Fields, Qualifiers and Operators can be found within the application’s Search Guide Page under the Settings menu.
Useful Commands
Entity Filters Find employees whose College Degree attribute equals “Russian Federation”
entity.filter:("Degree Country" = "Russian Federation")
Find employees whose College Degree attribute CONTAINS “Russian”
entity.filter:("Degree Country" : "Russian")
Simple Domain Match
Find Email Recipients with Media Email Domains
entity:("Recipient":{Domestic Media Domains})
Simple Lexicon Match
Find Email Recipients with High Risk Domains
entity:("Recipient":{High Risk Domains})
Content Search/Proximity
Content field contains Confidential Words
content:{Confidential Words}
Content field contains top AND secret separated by no more than 2 words (Order Dependent Proximity)
content:("top" "secret"~2)
Content field contains top AND secret separated by no more than 2 words (Order Independent Proximity)
content:("secret" "top"~?3)
Forcepoint UEBA 76
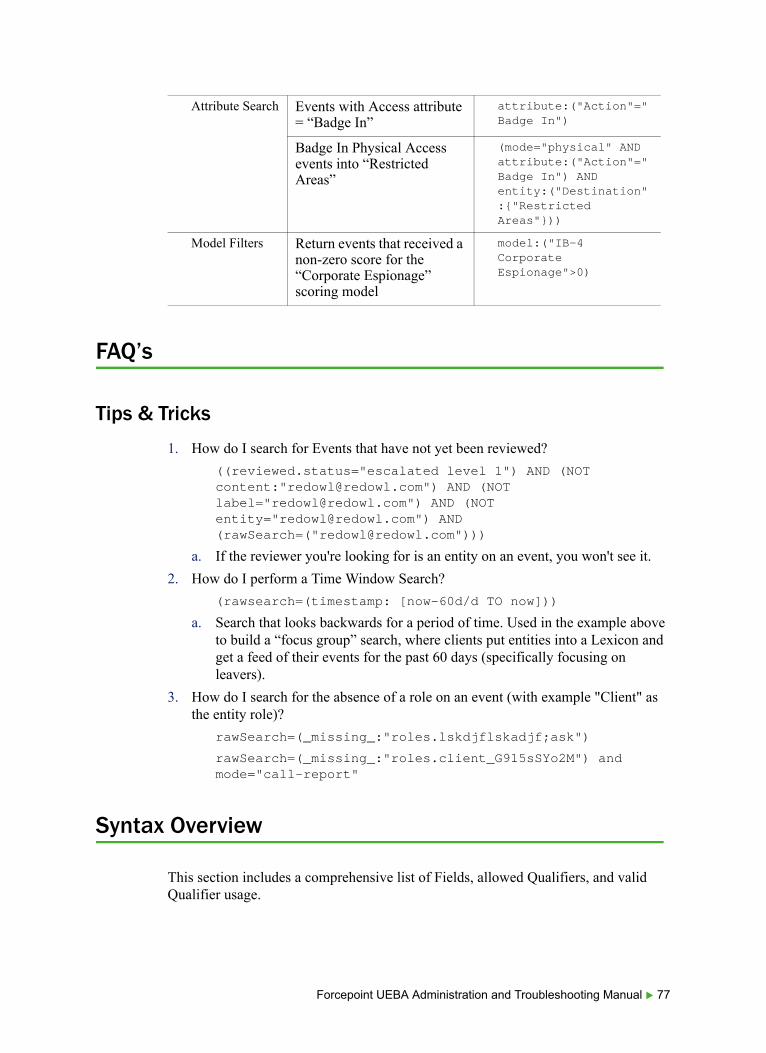
FAQ’s
Tips & Tricks
1. How do I search for Events that have not yet been reviewed?
((reviewed.status="escalated level 1") AND (NOT content:"[email protected]") AND (NOT label="[email protected]") AND (NOT entity="[email protected]") AND (rawSearch=("[email protected]")))
a. If the reviewer you're looking for is an entity on an event, you won't see it.
2. How do I perform a Time Window Search?
(rawsearch=(timestamp: [now-60d/d TO now]))
a. Search that looks backwards for a period of time. Used in the example above to build a “focus group” search, where clients put entities into a Lexicon and get a feed of their events for the past 60 days (specifically focusing on leavers).
3. How do I search for the absence of a role on an event (with example "Client" as the entity role)?
rawSearch=(_missing_:"roles.lskdjflskadjf;ask")
rawSearch=(_missing_:"roles.client_G915sSYo2M") and mode="call-report"
Syntax Overview
This section includes a comprehensive list of Fields, allowed Qualifiers, and valid Qualifier usage.
Attribute Search Events with Access attribute = “Badge In”
attribute:("Action"="Badge In")
Badge In Physical Access events into “Restricted Areas”
(mode="physical" AND attribute:("Action"="Badge In") AND entity:("Destination":{"Restricted Areas"}))
Model Filters Return events that received a non-zero score for the “Corporate Espionage” scoring model
model:("IB-4 Corporate Espionage">0)
Forcepoint UEBA Administration and Troubleshooting Manual 77

Entity
● Qualifiers
■ Default:
○ match
■ Also implemented:
○ count, aka, id, filter
● match
■ Searches over both the Entities and EntityID Fields, matching either
■ Allows users to easily Search for resolved names or aliases
■ Examples:
○ Matching _not_analyzed fields (NOTE EQUALS)[email protected]
Entity="Mike Gruen"
○ Matching analyzed Fields (NOTE COLON)Entity:"Mike Gruen"
Searches for the phrase "Mike Gruen"
Will match "Mike Gruen" or "Mike Gruen (RO)"
Entity:Mike
○ Referencing a saved Lexicon by name:Analyzed Field:
Entity:{Personal Domains}
Entity:{Internal Domains}
Not analyzed Field:
The following use case is broad in scope, but you could save a list of actor names or email addresses in a Lexicon and then search for exact matches
Entity={Shady Traders}
Entity={RedOwl Employees}
Don't get carried away with this and try to approximate actor Attribute Searches with lists of Entity names. Proper actor Attribute Searches are coming with a future RQL release.
○ Referencing a saved Lexicon by ID is available in RQL 1.1, but not the 53 release:
Analyzed Field:
Entity:{#1929494fn3-4kf}
Not analyzed Field:
Entity={#19o2ie2o94p29p}
● count
■ Uses the length of the EntityID Field
Forcepoint UEBA 78
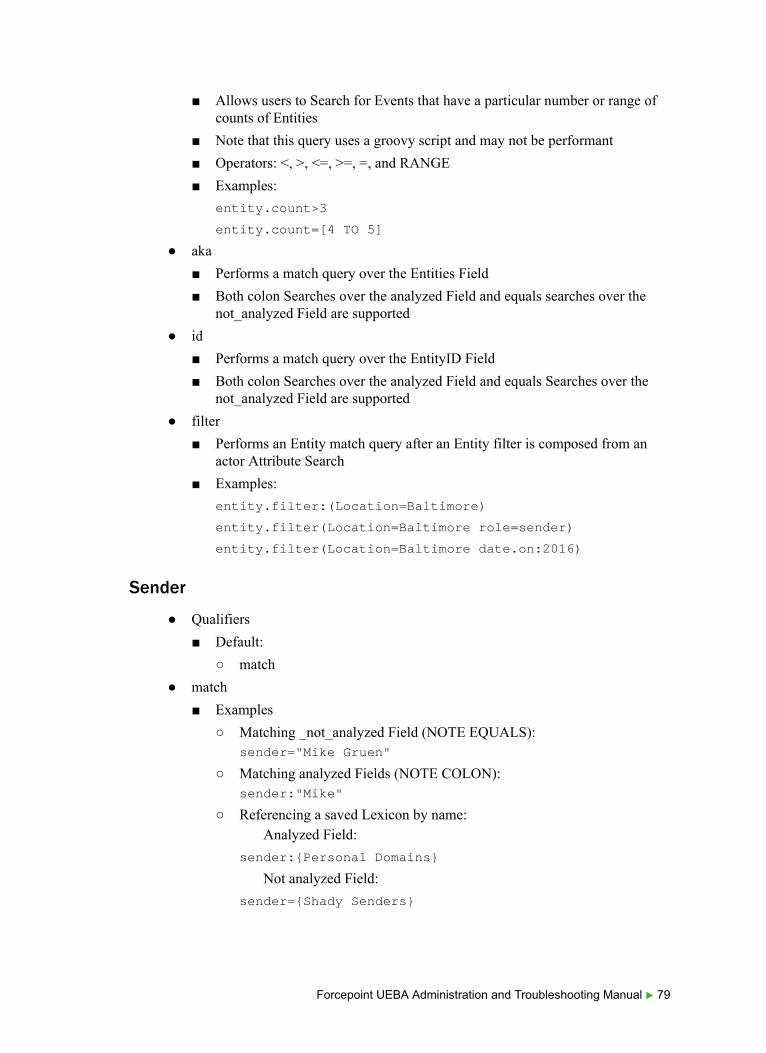
■ Allows users to Search for Events that have a particular number or range of counts of Entities
■ Note that this query uses a groovy script and may not be performant
■ Operators: <, >, <=, >=, =, and RANGE
■ Examples:
entity.count>3
entity.count=[4 TO 5]
● aka
■ Performs a match query over the Entities Field
■ Both colon Searches over the analyzed Field and equals searches over the not_analyzed Field are supported
● id
■ Performs a match query over the EntityID Field
■ Both colon Searches over the analyzed Field and equals Searches over the not_analyzed Field are supported
● filter
■ Performs an Entity match query after an Entity filter is composed from an actor Attribute Search
■ Examples:
entity.filter:(Location=Baltimore)
entity.filter(Location=Baltimore role=sender)
entity.filter(Location=Baltimore date.on:2016)
Sender
● Qualifiers
■ Default:
○ match
● match
■ Examples
○ Matching _not_analyzed Field (NOTE EQUALS):sender="Mike Gruen"
○ Matching analyzed Fields (NOTE COLON):sender:"Mike"
○ Referencing a saved Lexicon by name:Analyzed Field:
sender:{Personal Domains}
Not analyzed Field:
sender={Shady Senders}
Forcepoint UEBA Administration and Troubleshooting Manual 79
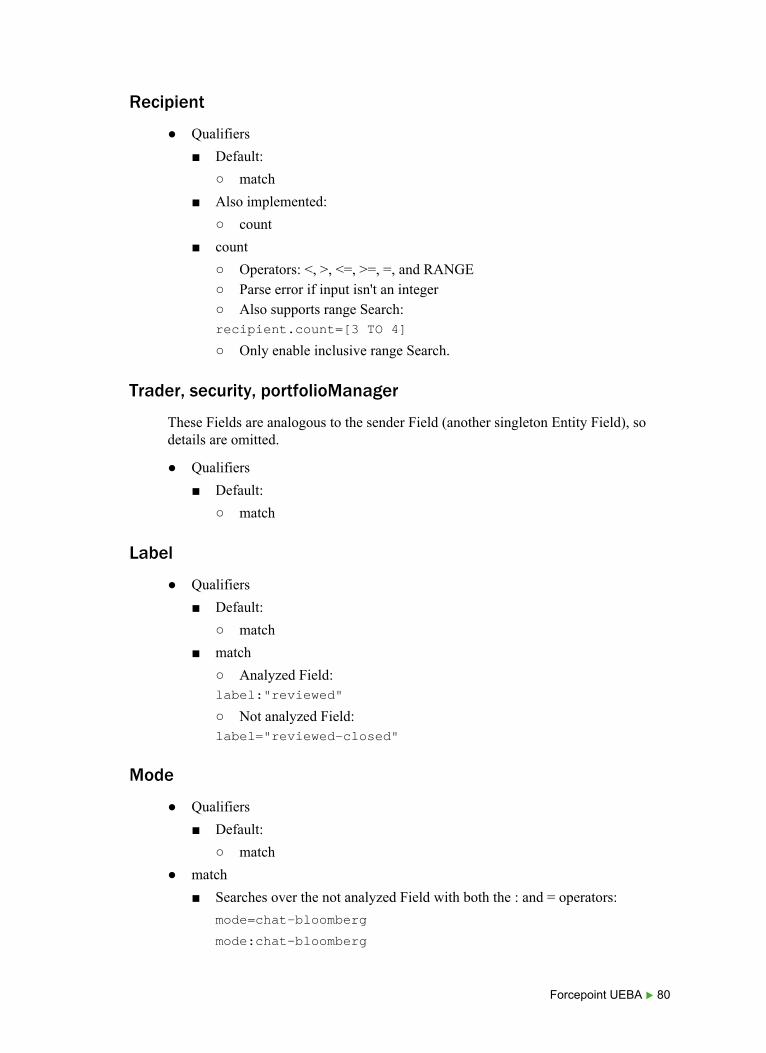
Recipient
● Qualifiers
■ Default:
○ match
■ Also implemented:
○ count
■ count
○ Operators: <, >, <=, >=, =, and RANGE○ Parse error if input isn't an integer○ Also supports range Search:recipient.count=[3 TO 4]
○ Only enable inclusive range Search.
Trader, security, portfolioManager
These Fields are analogous to the sender Field (another singleton Entity Field), so details are omitted.
● Qualifiers
■ Default:
○ match
Label
● Qualifiers
■ Default:
○ match
■ match
○ Analyzed Field:label:"reviewed"
○ Not analyzed Field:label="reviewed-closed"
Mode
● Qualifiers
■ Default:
○ match
● match
■ Searches over the not analyzed Field with both the : and = operators:
mode=chat-bloomberg
mode:chat-bloomberg
Forcepoint UEBA 80

○ Equals and colon do the same thing as each other
Content
● Qualifiers
■ Default:
○ match
■ Possible for future:
○ size in number of words?
● match
■ Searches over the body, subject, attachment bodies, attachment names, and content (a digital Field)
■ Allows users to easily Search over all content Fields
■ Examples:
○ Matching _not_analyzed Fields:NOT ALLOWED because we don't store not_analyzed versions of the body and attachment.bodies
Throw parse error if = operator requested
○ Matching analyzed fields (NOTE COLON):content:"going to quit"
○ Referencing a saved Lexicon by nameMatching analyzed Fields:
content:{Distraught Words}
content:{Flight Risk Lexicon}
Note that Searches using lucene-strategy or RQL-strategy Lexicons should function here just fine
○ Referencing a saved Lexicon by ID is available in RQL 1.1, but not the 53 release:
Matching analyzed Fields:
content:{#ooi2rp09329}
Body
● Qualifiers
■ Default:
○ match
■ Possible for future:
○ size in number of words?
■ Throw parse error if = operator requested
Forcepoint UEBA Administration and Troubleshooting Manual 81

Subject
● Qualifiers
■ Default:
○ match
■ Searches may be made on either the analyzed or the not_analyzed Fields:
subject="PCHAT-120981"
subject:"my passwords"
■ Possible for future:
○ size in number of words?
File
● Qualifiers
■ Default:
○ content○ searches over name and body
■ Also implemented:
○ body, name, count, bytes
● body
■ Searches over attachment bodies in comms data and potentially file content associated with digital data
■ Potentially multiple content Fields in an attachment, and this should search over all of them\(!\)
■ Examples:
file.body:raptor
file.body:{Distraught Words}
■ May only search using a colon and over analyzed Field, throw parse error if = operator requested
● name
■ Examples
○ Searching for file extension in analyzed name Field:file.name:xls
○ Searching for a particular file name in the not_analyzed Field:file.name="passwords.xls"
● count
■ Operators: <, >, <=, >=, =, RANGE
■ Parse error if input isn't an integer
■ Behavior of hasAttachment with file.count>0
■ Should also allow range Searches:
file.count=[10 TO 100]
Forcepoint UEBA 82
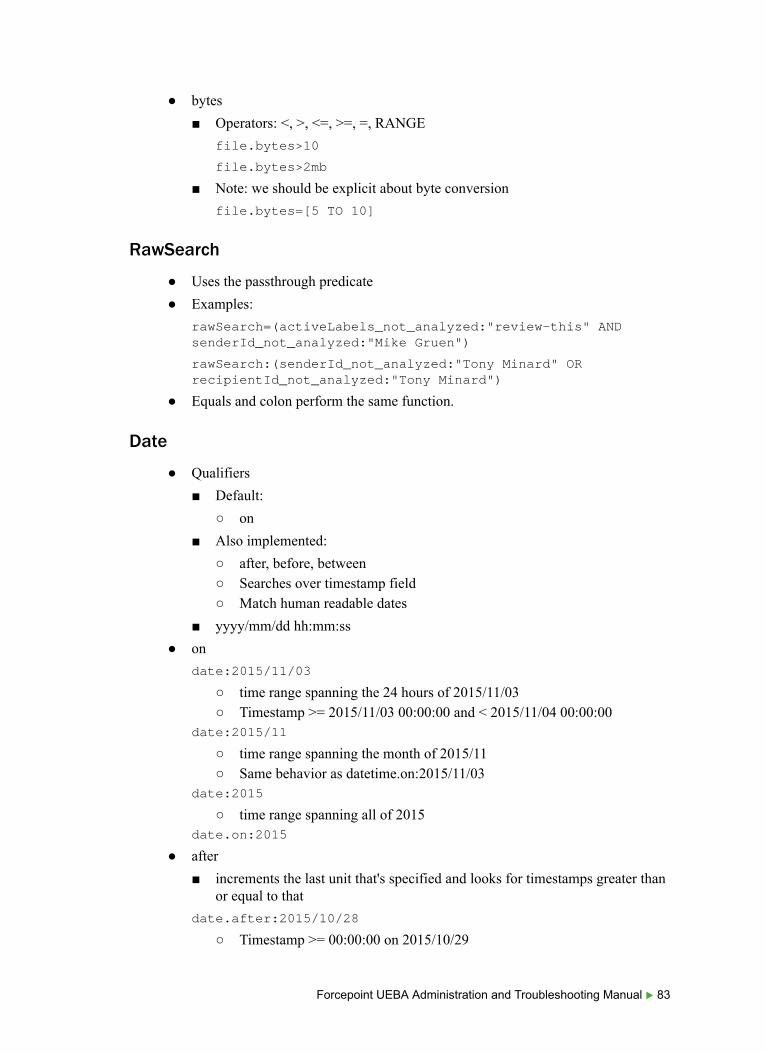
● bytes
■ Operators: <, >, <=, >=, =, RANGE
file.bytes>10
file.bytes>2mb
■ Note: we should be explicit about byte conversion
file.bytes=[5 TO 10]
RawSearch
● Uses the passthrough predicate
● Examples:
rawSearch=(activeLabels_not_analyzed:"review-this" AND senderId_not_analyzed:"Mike Gruen")
rawSearch:(senderId_not_analyzed:"Tony Minard" OR recipientId_not_analyzed:"Tony Minard")
● Equals and colon perform the same function.
Date
● Qualifiers
■ Default:
○ on
■ Also implemented:
○ after, before, between○ Searches over timestamp field○ Match human readable dates
■ yyyy/mm/dd hh:mm:ss
● on
date:2015/11/03
○ time range spanning the 24 hours of 2015/11/03○ Timestamp >= 2015/11/03 00:00:00 and < 2015/11/04 00:00:00
date:2015/11
○ time range spanning the month of 2015/11○ Same behavior as datetime.on:2015/11/03
date:2015
○ time range spanning all of 2015date.on:2015
● after
■ increments the last unit that's specified and looks for timestamps greater than or equal to that
date.after:2015/10/28
○ Timestamp >= 00:00:00 on 2015/10/29
Forcepoint UEBA Administration and Troubleshooting Manual 83

date.after:2015
○ Timestamp >= 00:00:00 on 2016/01/01date.after:2015/01
○ Timestamp >= 00:00:00 on 2015/02
● before
■ sets all unspecified units to 0 and looks for timestamps less than that
date.before:2015
○ Timestamp < 00:00:00 2015/01/01date.before:2015/11/03
○ Timestamp < 00:00:00 2015/11/03
● between
■ uses range syntax, only supporting inclusive searches for now
■ rounds down first date and rounds up the second
date.between:[2015 TO 2016]
○ > 2015/01/01 00:00:00 and < 2017/01/01 00:00:00date.between:[2015 TO 2016/02]
○ > 2015/01/01 00:00:00 and < 2017/03/01 00:00:00date.between:[2015/10/01 TO 2015/10/04]
○ Inclusive date range○ Timestamp >= 2015/10/01 00:00:00 and < 2015/10/05 00:00:00
■ Notes for the future:
○ we'll handle relative time ranges as well (e.g. 2014/01/01 +/- 2w or +2m or -1s)
○ partial seconds (e.g. 2015/11/04 09:42:11.01)
Ingested
● Qualifiers
■ Default:
○ on
■ Also implemented:
○ after, before, between
● on
ingested:2015/11/02
ingested:2015
NoteTimes should be given using a 24 hour clock (e.g. 2015/11/04 16:42:02)
Forcepoint UEBA 84

Reviewed
● Qualifiers
■ Default:
○ status
■ Also implemented:
○ on, after, before, between
■ Possible for future:
○ by
● status
■ reviewed:escalated
■ reviewed:closed
■ reviewed:any
● on
reviewed.on:2015/11/02
Feature
● Qualifiers
■ Default:
○ percentile:feature:("Late Night Hours" > 0)
feature:("Late Night Hours"=[0.5 TO 1])
feature.percentile:("Late Night Hours" > 0)
■ Also implemented:
○ value:feature.value:("Late Night Hours" > 0)
■ Equals and colon perform the same function.
Appendix
Information Security RBAM Scenarios
RedOwl Information Model (Review)
RIM provides a guideline on how to ingest data that remains consistent across different types of communication activity (emails, chats, phone calls, etc.). Frontend usage is rooted in this standard data model. Consistency regarding terms and objects helps users easily understand, interact and draw useful insights with Forcepoint UEBA.
Forcepoint UEBA Administration and Troubleshooting Manual 85

Entities: The objects that Forcepoint UEBA monitors. These can be anything from people, to printers, to domains, to files. Monitored Entities define the entities that will receive a risk score. Entities and their associated events make up the foundation for all Forcepoint UEBA analytics.
Events: The objects that summarize Entity “actions” and monitored activity. These can be anything from emails, to data-movement, to badge swipes. Events standardize all company activity so entities can be compared and profiled.
Event Features: The Event traits used to understand event specifics. Each feature on an event has a raw value, which is associated with a probability. Event Features attach a probability score to Events gauging overall riskiness and reasons in which an event may be considered interesting. Event Features are the foundation of models.
Models: Sets of features, scoring methods, and RQL queries used to score entities and events over an entity time interval. Models are used to classify events, and help us understand details about what an entity does.
Scenarios (Behaviors): Sets of models that are used to describe how monitored entities behave and assign a risk score. Scenarios assign the entity risk scores seen on the Analytics Dashboard, and help us understand a monitored entity from multiple perspectives.
RedOwl Behavioral Analytics Model (Review)
Scenarios are used for reporting how entities behave within a Forcepoint UEBA deployment. Forcepoint UEBA uses a standard set of Scenarios, called the RedOwl Behavioral Analytics Model (RBAM). Scenarios are the pinnacle of all aggregated Forcepoint UEBA data, and are the tools that provide final profiles and risk scores for Entities. Recall that Event Features build models, models build Scenarios, and Scenarios assign a score to an Entity.
Forcepoint UEBA provides a comprehensive list of predefined models and Scenarios, targeted to detect specific types of Entity behavior. Listed below are several recommended behaviors to use when administering an Information Security deployment. Each Scenario is broken down and explained with model by model explanations.
Scenario: Data Exfiltration
Behavioral Models:
● DE1A & DE1B - Internal Data Movement
■ Looking for anomalous movement of data within the enterprise, conducive with gathering data before it is exfiltrated.
● DE2A & DE2B - External Data Movement
■ Looking for anomalous data volumes moving outside of the network. This can be considered the actual exfiltration event/action.
● DE3 - Email Data Movement
Forcepoint UEBA 86

■ Looking for anomalous movement of data outside of the network. This can be considered the actual exfiltration event/action.
● DE4 - File Operations
■ Looking for anomalous interactions with files, such as opening them to check the contents of the file, accessing a file share to see if anything of interest is there, or augmented the file to prepare for exfiltration.
● DE5 - File Share Cardinality
■ Looking for anomalous number of distinct file shares accessed per user.
● DE6 - Data Reconnaissance
■ Looking for activity conducive with searching for data throughout the enterprise. This can be considered the behavior associated with finding high-value data amongst all of the enterprise's data.
● DE7 - Data Loss
■ Looking for employees who are leaking sensitive information.
Behavior: suspicious User
Models:
● MU1 - Network Reconnaissance
■ Looking for activity conducive with exploring the network to discover assets of interest.
● MU2 - Systems Administration
■ Looking for activity conducive with with either damaging system configurations or enabling various settings to allow that damage to occur.
● MU3 - suspicious Authentication
■ Looking for abnormal authentication activity that be conducive with asset discovery or special logons that enable suspicious actions.
● MU4 - Destination Cardinality
■ Looking for anomalous number of unique workstations and servers logged into per user.
● MU5 - Explicit Account Cardinality
■ Looking for anomalous number of accounts explicitly logged into per user.
● MU6 - Authenticated Process Cardinality
■ Looking for anomalous number of processes authenticated per user.
● MU7 - Process Activity
■ Looking for privileged activity that could facilitate the suspicious actions.
● MU8 - suspicious Research
■ Looking for people researching ways to commit suspicious actions.
● MU9 - Configuration Deviation
■ Looking for deviations from the approved machine baseline, that can be conducive with damaging processes or detection avoidance.
Forcepoint UEBA Administration and Troubleshooting Manual 87

● MU10 - Physical Access
■ Looking for abnormal physical access to sensitive areas or at the keyboard of high valued assets. This can be considered the gaining access portion of the suspicious incident.
● MU11 - Access Request
■ Looking for activity conducive with requests a higher-level of privileges to commit the suspicious action.
● MU12 - Account management
■ Looking for outlier account management activity, uncovering account management activity by employees who usually do not have any account management activity.
● MU13 - Code System Components
■ Looking for any interactions with core system files and components.
Behavior: Negative Workplace Behavior
Models:
● NB1 - Sexual Harassment
■ Looking for communications conducive with a sexual harassment incident.
● NB2 - Workplace Violence
■ Looking for violent communications that could indicate a workplace violence incident.
● NB3 - Obscene Content
■ Looking for obscene content activity, either through web searches or web browsing.
● NB4A - Flight Risk Communications
■ Looking for communications conducive with an employee leaving, such as emailing a resume or searching for a new job.
● NB4B - Flight Risk Web
■ Looking for activity conducive with an employee leaving, such as visiting job and resume websites.
● NB5 - Decreased Productivity
■ Looking for employees spending a large amount of time doing non work related tasks.
● NB6A - Corporate Disengagement
■ Looking for employees who are not interacting with core company assets.
● NB6A - Recipient Cardinality
■ Looking for users talking to less employees, compared to their previous baselined activity.
● NB7A - Financial Distress Communications
Forcepoint UEBA 88

■ Looking for communications activity indicative of financial turmoil and employees looking for a way to get resolve the issue.
● NB7B - Financial Distress Web
■ Looking for communications activity indicative of financial turmoil and employees looking for a way to get resolve the issue.
● NB8 - Negative Sentiment
■ Looking for negative sentiment and signs of improper discussions within communications.
● NB9 - Oversight Evasion
■ Looking for signs of oversight evasion attempts within communications.
● NB10 - IT Oversight Evasion
■ Looking for activity conducive with avoiding IT detection, either pre or post exfiltration. This can be considered covering tracks after the fact, or positioning to better avoid detection.
Illicit Workplace Behavior
Models:
● IB1 - Espionage
■ Looking for employees who are showing signs of espionage.
● IB2 - Corporate Espionage
■ Looking for employees communicating with competitors while still at their current company, but specifically mentioning their current company IP and looking to join the competitor.
● IB3 - Whistleblowing
■ Looking for activity conducive with a whistleblowing incident, where a person is in contact with media domains and showing signs of willingness to leak company information.
● IB4 - Clearance Evasion
■ Looking for people researching ways to omit security clearance information or ways to deceive a polygraph.
Unified Theory of Analytics
The Unified Theory of Analytics (UTA) defines the backend analytics process behind the various scores used within the Forcepoint UEBA application. The UTA process is used to score RBAM Scenarios. These values can be isolated to identify singular points of risk, or compounded incrementally to find the most suspicious individuals within an organization. The following section describes how each individual risk score is calculated, as well as how these scores build upon each other to compute the powerful analytic insights.
Forcepoint UEBA Administration and Troubleshooting Manual 89

Scoring Overview
Event Features define how to extract and interpret raw values from Event data. After raw values are extracted, a Probability Score is assigned to the feature based on the distribution of other raw feature values in the same dataset.
Entity Time Intervals
Entity Time Interval is a configurable time interval (1 day, 1 week, etc.) over which an Entity is scored. Each colored box shown below is a scored Entity Time Interval.
An Entity Time Interval Score is an Entity’s model score over a single Entity Time Interval. Higher scores are displayed through darker, higher color opacity.
Features
Event Features are used to assign probabilities to Events. They determine the value displayed by the red flag in the Event Viewer. The value next to the red flag is a percentile value, indicating how unusual the feature value is. If an Event includes Event Features with high percentile values, we know that the event is unusual, which means it has a higher chance of being suspicious.
Entity Features are values (1-10) that you can assign to an Entity. These values are set within the Entity Details Page, and only vary when the value of a certain Entity Feature is edited (i.e. they do not vary across time). We set Entity Feature values based on external information that we have access to. Feature values are determined by scripts that hook up to external data sources and automatically populate Entity Features.
Forcepoint UEBA 90

Entity Features are completely separate form Event Features, and are used much less frequently in RBAM.
Scoring Events and Entities
Entity Models use Entity Features to score Entity Time Intervals. To compute an Entity Model Score and apply it to an Entity Time Interval, Entity Feature scores are averaged and converted to a value between 0 and 1.
To compute the Entity Model Score, for each Entity Feature in the Entity Model:
1. Subtract 1 from each entity feature score.
For example, if a user has 2 Entity Features: Leaver Risk (5) and Insider Threat (7)
○ 5-1=4○ 7-1=6
2. Divide each score by 10
○ 4/10=0.4○ 6/10=0.6
3. Average the two values
○ (0.4 + 0.6) / 2 = 0.5
This score is eventually visualized on the Behaviors page, when viewing a score for an Entity Model. If the entity model is part of a Scenario, then this score is further used to compute the Entity risk score seen on the Analytic Dashboard.
Event Models are used for Event Selection, Event Scoring, and score aggregation for assigning Entity Time Interval Scores.
When given a list of X unscored Events, Forcepoint UEBA checks which Events match with the models.
Event Selection checks to see if Events match with a model.
Check for events with an RQL match
● Any Events that do not pass this step are automatically assigned an Event Model Score of 0, and disregarded for the following steps.
Forcepoint UEBA Administration and Troubleshooting Manual 91
● All events with an RQL match are passed on to the next step to receive a score.
Event Scoring
All events that pass the Event Selection are scored here. The scoring process starts by checking for Feature matches. Below is an example of Event Scoring.
Sample Model:
● Event Features: Lexicon including the keyword “exfiltrate” (removal), Time Grouping including Monday (mondays), Advanced Feature consisting of Local Admin Login (admin).
Sample Event:
● A suspicious system administrator logs in as an administrator on Monday, and sends an email including the phrase “I’m going to exfiltrate top secret data.”
With the sample Model and Event, we see that the Event matches with the Advanced, Monday and Exfiltration Event Features.
(removal: 1, mondays: 1 admin: 1)
Event Feature scores are called Probability Scores. Probability Scores are the probability that for a selected Event’s feature value, there is another Event with a smaller feature value.
Calculate the probability for each feature value for the sample event, and use those values to compute an overall Event Score:
As removal is given a score of "1", and there are 25 occurrences of "1" for removal in a dataset of 100 Events, the Probability Score is (1 - (25/100))= 0.75 for "removal=1". This means there is a 75% chance that there is an Event with a smaller feature value, given the current dataset.
This event occurred on a Monday, so the “mondays” feature value is given a score of “1”. There are 85 occurrences of “monday” feature values scored as “1”, so the Probability Score is (1 - (85/100))= 0.15. This means there is a 15% chance that there is an Event with a smaller feature value, given the current dataset.
As admin is given a score of "1", and there are 60 occurrences of "1" for admin in a dataset of 100 Events, the Probability Score is (1 - (60/100))= .4 for "admin=1".
NoteIf no RQL filter is specified, then all events are passed on to the next step.
NoteA theoretical dataset of 100 events is mentioned several times. Each mention references the same theoretical dataset.
Forcepoint UEBA 92

Meaning there is a 40% chance that there is an Event with a smaller feature value, given the current dataset.
The Event is then scored with each of the Event Feature values:
0.75 * 0.15 * 0.4 = 0.045
Low scores are more interesting. Events that are less likely generally have a higher probability of being suspicious. To inflate these low scores accordingly, we take the negative log of the value above to get the Event Score:
-log(0.045) = 1.35
Use this Event Score to assign a score to an Entity Time Interval for an Event Model.
Each Model score is derived from a list of Event scores that occurred within an Entity Time Interval. For example:
● Entity time interval: July 21st - 22nd
ModelScore1
EventScore1
EventScore2
EventScore3
…
EventScore100
The EventScore list under ModelScore1 represents every Event that passed Event Selection and Event Scoring for Modelscore1 on Entity Time Interval: July 21st - 22nd. Each Event is scored like the sample Event in the Event Scoring example above. These scores are aggregated, and a final Entity Time Interval Score is assigned based on one of the methods discussed below.
Scoring Models
Computing Entity Time Interval Scores relies on several parameters, configured within each individual Model.
Primary Role for Aggregation: specifies the Entity Role desired with an Event. For example If we choose “Sender” for this category, we only score Entities according to events when they appear as type “Sender” in the primary role.
NoteDon’t get this score confused with the individual Event Feature scores above. This is simply an Event Score, not a probability. Its significance lies in comparison to other event scores.
Forcepoint UEBA Administration and Troubleshooting Manual 93
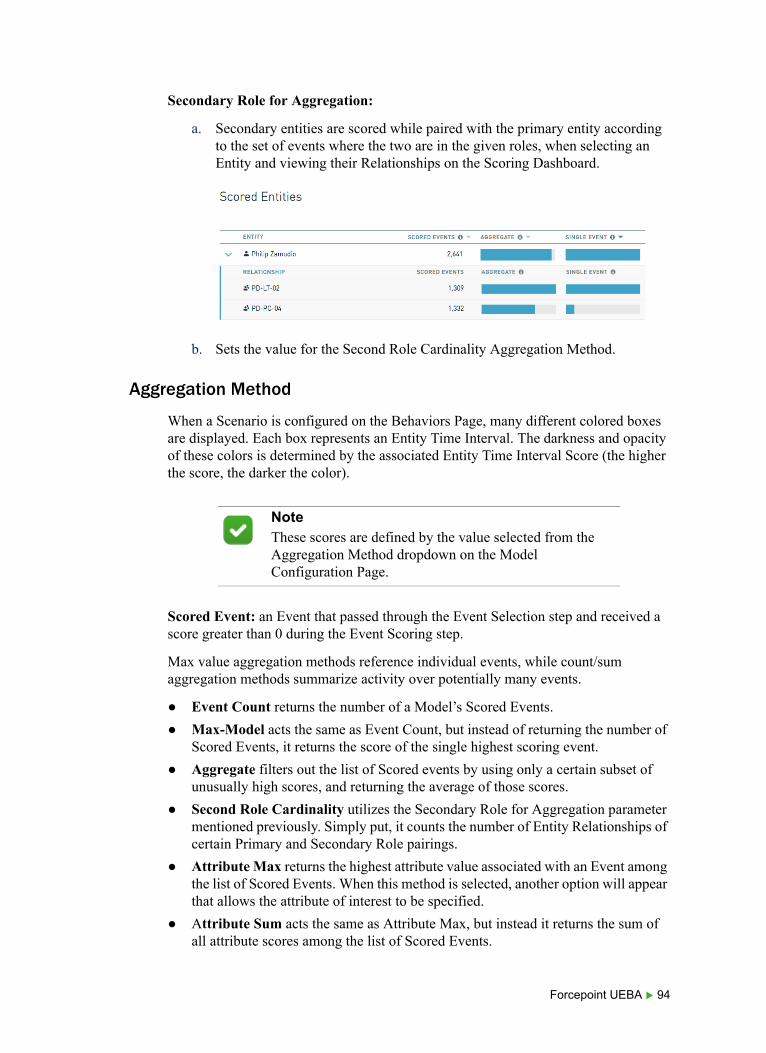
Secondary Role for Aggregation:
a. Secondary entities are scored while paired with the primary entity according to the set of events where the two are in the given roles, when selecting an Entity and viewing their Relationships on the Scoring Dashboard.
b. Sets the value for the Second Role Cardinality Aggregation Method.
Aggregation Method
When a Scenario is configured on the Behaviors Page, many different colored boxes are displayed. Each box represents an Entity Time Interval. The darkness and opacity of these colors is determined by the associated Entity Time Interval Score (the higher the score, the darker the color).
Scored Event: an Event that passed through the Event Selection step and received a score greater than 0 during the Event Scoring step.
Max value aggregation methods reference individual events, while count/sum aggregation methods summarize activity over potentially many events.
● Event Count returns the number of a Model’s Scored Events.
● Max-Model acts the same as Event Count, but instead of returning the number of Scored Events, it returns the score of the single highest scoring event.
● Aggregate filters out the list of Scored events by using only a certain subset of unusually high scores, and returning the average of those scores.
● Second Role Cardinality utilizes the Secondary Role for Aggregation parameter mentioned previously. Simply put, it counts the number of Entity Relationships of certain Primary and Secondary Role pairings.
● Attribute Max returns the highest attribute value associated with an Event among the list of Scored Events. When this method is selected, another option will appear that allows the attribute of interest to be specified.
● Attribute Sum acts the same as Attribute Max, but instead it returns the sum of all attribute scores among the list of Scored Events.
NoteThese scores are defined by the value selected from the Aggregation Method dropdown on the Model Configuration Page.
Forcepoint UEBA 94
● Outlier Probabilities is an additional criteria that can be selected, along with the aggregation method. This performs additional calculations that describe exactly how relatively unlikely an entity time interval score is for a given entity. Specify whether the values of interest are unusually high values, unusually low values, or unusual values on both ends (high and low).
Normalizing
The values listed above cannot always be compared fairly. In theory, a severe Max-Model score of 0.89 can be dwarfed by an insignificant Second Role Cardinality score of 12. Normalize Model Scores by assigning each score a value that is greater than or equal to 0, and less than 1 to generate values that help compare relative difference between Entity Time Interval scores for different Aggregation Methods.
Normalized values help create accurate relative color densities on the Behaviors page. This allows visual comparisons of relative score differences between different Aggregation Methods. A light pink will indicate similar significance to a light blue, just as a dark pink will indicate heavier significance than a medium blue.
Max Based Normalization
Max Based Normalization focuses on a maximum event score (Max Value) over a given Entity Time Interval. Because the Max Value is the same across all Entities for a given analytic window, there only needs to be one computation for each Entity Time Interval.
This Aggregation Method bases all Entity Scores around the Max Value. The Max Value is used as the common denominator when computing all scores.
Rank Based Scoring Method
This scoring method only considers the rank of the Entity.
score = 1 - (rank/100)
For example, if there are 100 Entities monitored:
● 1st ranked:
1 - (1/100) = 0.99
● 2nd ranked:
1 - (2/100) = 0.98
● 3rd ranked:
1 - (3/100) = 0.97
● 4th ranked:
1 - (4/100) = 0.96
● 5th ranked:
1 - (5/100) = 0.95
Max Value Scoring method
This method considers the max score of the Entity.
Forcepoint UEBA Administration and Troubleshooting Manual 95
score = (score - 1) / Max Score
For example, if the same scores from above are used:
● 1st had a Model score of 21:
(21 - 1) / 21 =0.952
● 2nd had a Model score of 18:
(18 - 1) / 21 = 0.810
● 3rd had a Model score of 17:
(17 - 1) / 21 = 0.762
● 4th had a Model score of 5:
(5 - 1) / 21 = 0.190
● 5th had a Model score of 3:
(3 - 1) / 21 = 0.095
Max-Based Scoring method
This method uses the highest score within the Entities being compared to normalize the scores.
score = (.99)*(log(score + 1) / log(maxScore + 1))
For example, if:
● User 1: 30
log(30 + 1) / log(30 + 1) = 0.99
● User 2: 26
log(26 + 1) / log(30 + 1) = 0.95
● User 3: 17
log(17 + 1) / log(30 + 1) = 0.83
Scenario Scoring method
This method is used to assign a final risk score to a Monitored Entity.
(-log(1 - model1Score) - log(1 - model2Score))/(number of models)
For example, if:
● User scored a 0.83 for Model 1 (model1Score), and he received a score of 0.67 for Model 2 (model2Score):
(-log(1 - 0.83) - log(1 - 0.67))/2 = 0.63
This value is computed for each Scenario. The higher the individual Model scores, the higher the overall Scenario score for an Entity Time Interval. Entities are ranked within a given Entity Time Interval with these Scenario scores.
The sum of log probabilities is a measure called perplexity. We only use Scenario perplexity scores for ranking on the Behaviors page - they are not displayed to the user on the UI.
Forcepoint UEBA 96

Display on the Analytics Dashboard
Once all Scenarios have scores, combine these scores to calculate the final risk score for each Entity. These scores are the values seen in the Top 50 Entities of Interest on the Analytics Dashboard.
To compute the Final Display Scoring method:
score = (ScenarioOne + ScenarioTwo) / (number of Scenarios) -> finalScore = 1 - exp(-(score))
For example, if a user has a Scenario score of 0.63 (ScenarioOne), and a second Scenario with a score of 0.78 (ScenarioTwo):
Score = (0.63 + 0.78) / (2) -> 0.705
Final Score = 1 - exp(-(0.705)) = 0.51
Multiply this by 100 to convert the score to a percentage. This score is displayed to the right of an Entity’s name in the Top 50 Entities of Interest view on the Analytics Dashboard.
©2018 Forcepoint. Forcepoint and the FORCEPOINT logo are trademarks of Forcepoint. Raytheon is a registered trademark of Raytheon Company. All other trademarks used in this document are the property of their respective owners.
Forcepoint UEBA Administration and Troubleshooting Manual 97