For the year ended 31 December 2017 · Audited Annual Results For The Year Ended 31 December 2017...
33
Audited Annual Results For the year ended 31 December 2017
-
Upload
nguyendung -
Category
Documents
-
view
212 -
download
0
Transcript of For the year ended 31 December 2017 · Audited Annual Results For The Year Ended 31 December 2017...
Audited Annual ResultsFor the year ended 31 December 2017

CONTENTS
Overview
Market Review
Operational Review
Financial Review
Outlook

OVERVIEW

Audited Annual Results For The Year Ended 31 December 2017
Strong performance despite challenging conditions
SAFETY, HEALTH and ENVIRONMENT
> No fatalities, in line with our commitment to zero harm
> Two million fatality-free shifts on 20 July 2017
> Reduction in the HIV prevalence rate and the TB incidence rate
> Awarded a position on the 2017 CDP A list for the second year running
OPERATIONAL
> 36.8% increase in tonnes delivered from Styldrift to 561kt (2016: 410kt)
> 5.7% increase in stoping efficiency
> 9.4% increase in tonnes milled to 3 021kt (2016: 2 762kt)
> 7.9% increase in 4E ounces to 328koz (2016: 304koz)
> 2.4% decrease in cash cost per tonne milled to R1 149 (2016: R1 177)
FINANCIAL
> R2 billion debt funding package
> Successful issue of R1.2 billion convertible bond
> 5.7% increase in cash generated by operating activities
> Strong cash position of R1.3 billion (2016: R835.5 million)
HUMAN and SOCIAL> BRPM went through a section 189 process in June 2017
> Invested R40.5 million in our social and labour plans
PGM MARKET
> Relatively tough year for platinum demand
> Gross demand, excluding investment, estimated to have fallen by 3.6% (-280koz)
> Slight increase in platinum supply to market
4

MARKET REVIEW

Audited Annual Results For The Year Ended 31 December 2017
Platinum demand to increase marginally in 2018
2.02.0
5.3
3.1
4.2
0,0
1,0
2,0
3,0
4,0
5,0
6,0
7,0
8,0
9,0
Moz
Global primary supply Recycling SA supply
Peak = 6.9
5.92014 = 4.9
7 4907 580
7 4907 580
(70) 50
110 13860
35 (46) (97)
7 000
7 200
7 400
7 600
7 800
8 000
8 200
Supply
> Total platinum supply (incl. recycling) forecast to decrease by 2.1% to
7.8Moz in 2018 (1.2% increase in 2017)
> Global platinum production from mines could drop by 3.7% to 5.9Moz
in 2018 (0.7% increase in 2017)
> South African mine output forecast to decrease by around 195koz
(2.7% increase in 2017)
> Platinum recycling projected to increase by 3.0% to 2.0Moz in 2018
> Total rhodium supply expected to decline by 3.7% to 1.05Moz in 2018
Demand
> Autocatalyst demand expected to fall by 70koz (-2.1%) in 2018
> W. Europe remains largest market despite accelerated decline in diesel
share in 2017
• Erosion of diesel share expected to slow to 4% in 2018
> Jewellery demand predicted to increase by 50koz (+2.1%)
• Demand in China expected to be flat after losing 110koz in 2017
• Demand in India estimated to grow by 25koz in 2018 (+15% YoY)
> Industrial demand set to recover 2017 losses
• 110koz (6.8%) growth in 2018 due to petroleum sector rebound
> Platinum ETF holdings have been steady, adding 94koz in 2017
• Global ETF holdings at 2.6MozSource: SFA (Oxford)
Note: Excludes investment demand
koz
Global platinum supply forecast Global platinum demand forecast
6

Audited Annual Results For The Year Ended 31 December 2017
Palladium market set to be in a structural deficit of >1Moz in 2018
Global palladium supply forecast Global palladium demand forecast
2.3 2.4
1.9
2.4
0,0
1,0
2,0
3,0
4,0
5,0
6,0
7,0
8,0
9,0
10,0
Moz
Global primary supply Recycling SA supply
6.82014 = 6.4
Peak = 7.0
10 27010 180
10 27010 180
(17) (1) (71)65 35 (35) (70)
(85)
9 400
9 600
9 800
10 000
10 200
10 400
10 600
koz
Supply
> Total palladium supply estimated to fall slightly (-1.9%) to 9.2Moz
(4.4% growth in 2017)
> Global palladium production from mines forecast to decline by 3.4%
to 6.8Moz (3.6% increase in 2017)
Demand
> Light vehicle sales in China up 2.0% to 28.6M units in 2017
[source: LMC Automotive]
> In the US, light vehicle sales down by -1.9% to 17.2M units in 2017
[source: LMC Automotive]
> Palladium demand expected to see a slight decline in all segments
in 2018
> Decline in palladium ETF holdings eased in 2017 with net sales of
372koz, compared to 641koz in 2016, leaving total global ETF holdings
at around 1.3Moz
> Palladium deficit set to contract slightly in 2018, but still remains
above 1MozSource: SFA (Oxford)
Note: Excludes investment demand
7

OPERATIONAL REVIEW

Audited Annual Results For The Year Ended 31 December 2017
Towards Operational Excellence Build Flexibility
> Two million fatality free shifts,
however disappointing injury
frequency rates
> Continued labour stability
> Organisational restructuring and
suspension of South shaft UG2
> Improved labour productivity
> YoY unit cost reduction
> BRPM operational flexibility
maintained
> Maseve acquisition – additional
concentrating and dual processing
capacity
> Toll treatment capacity for UG2 ore
> Styldrift mine design and ramp-up
strategy
Pursue Value Enhancing Opportunities Organic Growth
> Maseve acquisition
> Impala royalties
> Ongoing assessment of value
enhancing opportunities
> Steady progress at Styldrift I
> Phase 1 ramp-up progressing well
> Maseve acquisition – removes
processing constraint to ramp-up
to 230ktpm
Strategy continues to drive value creation and competitive operating platform
9
Audited Annual Results For The Year Ended 31 December 2017
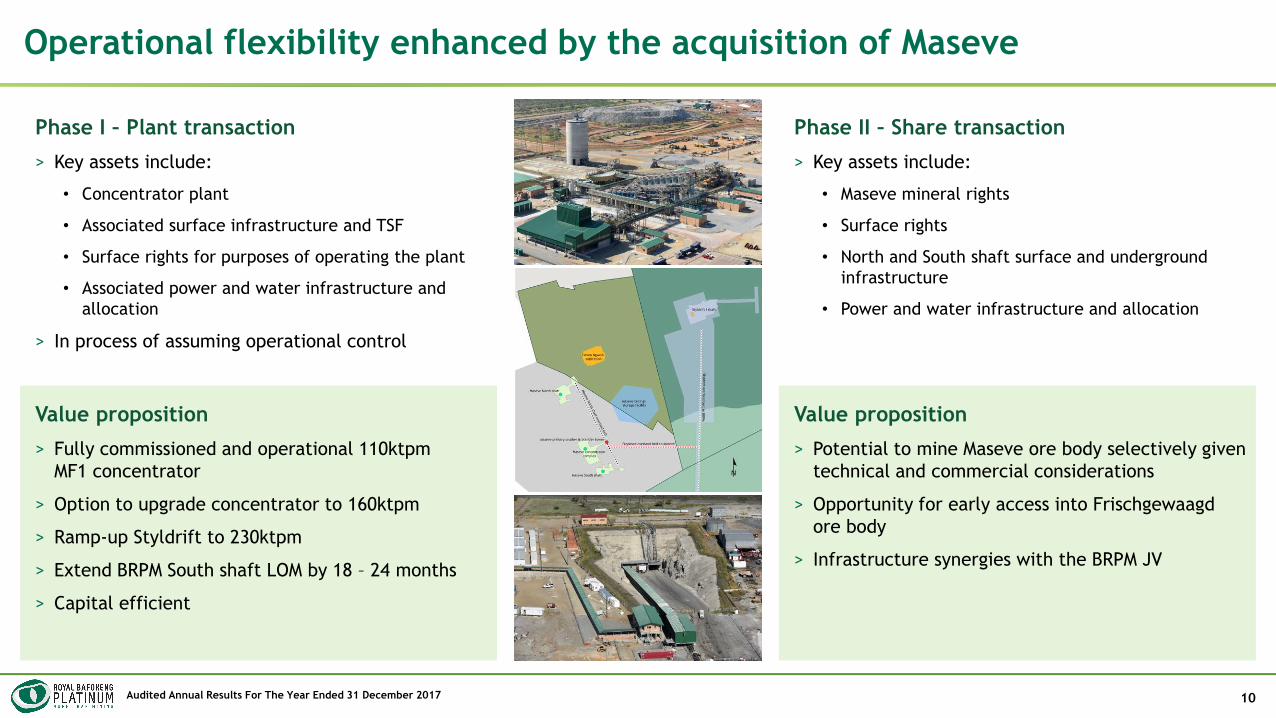
Phase I – Plant transaction
> Key assets include:
• Concentrator plant
• Associated surface infrastructure and TSF
• Surface rights for purposes of operating the plant
• Associated power and water infrastructure and
allocation
> In process of assuming operational control
Phase II – Share transaction
> Key assets include:
• Maseve mineral rights
• Surface rights
• North and South shaft surface and underground
infrastructure
• Power and water infrastructure and allocation
Value proposition
> Fully commissioned and operational 110ktpm
MF1 concentrator
> Option to upgrade concentrator to 160ktpm
> Ramp-up Styldrift to 230ktpm
> Extend BRPM South shaft LOM by 18 – 24 months
> Capital efficient
Value proposition
> Potential to mine Maseve ore body selectively given
technical and commercial considerations
> Opportunity for early access into Frischgewaagd
ore body
> Infrastructure synergies with the BRPM JV
Operational flexibility enhanced by the acquisition of Maseve
10

Audited Annual Results For The Year Ended 31 December 2017
Description Unit 2015 2016 2017 % Var
Fatal injuries No. 5 1 - 100
LTIFR rate 0.409 0.380 0.562 (47.9)
SIFR rate 0.133 0.216 0.287 (32.9)
TIFR rate 2.112 1.446 2.035 (40.7)
Safety stoppages No. 16 11 11 0
Production shifts affected No. 75 42 57 (35.7)
Milled tonnes lost kt 275 102 72 29.4
4E Ounces lost koz 32.3 12.0 8.5 29.2
Safe production remains our number one priority
Safety
> No fatalities, in line with our goal of zero harm
> Achieved two million fatality free shifts on 20 July 2017
> 47.9% increase in LTIFR
> 32.9% increase in SIFR
> 40.7% increase in TIFR
0,133
0,216
0,287
0,00
0,05
0,10
0,15
0,20
0,25
0,30
0,35
2015 2016 2017
/200 0
00 h
rs
2 2
5
1 00,0
0,1
0,2
0,3
0,4
0,5
0,6
0,7
0,8
0,9
1,0
2013 2014 2015 2016 2017
/200 0
00 h
rs
BRPM JV Fatalities BRPM JV Industry Average
2,112
1,446
2,035
0,00
0,50
1,00
1,50
2,00
2,50
2015 2016 2017
/200 0
00 h
rs
BRPM JV fatalities
Serious injury frequency rate Total injury frequency rate
Lost time injury frequency rate
Platinum industry average
11

Audited Annual Results For The Year Ended 31 December 2017
52
4751
46
0
10
20
30
40
50
60
2015 2016 2017 Target 2017
kW
h/t
onne m
ille
d
Baseline
6467
5964
0
10
20
30
40
50
60
70
80
2015 2016 2017 Target 2017
kW
h/t
onne h
ois
ted
Baseline
24,3% 24,5%23,1%
0%
5%
10%
15%
20%
25%
30%
2015 2016 2017
HIV
pre
vale
nce r
ate
937
767 765
0
200
400
600
800
1000
2015 2016 2017
\100 0
00 p
eople
Employee health is a critical factor for our strategic objective
Health
> Roll out of personalised hearing protection
> Our efforts to improve the health of our employees:
HIV
> 622 employees on Anti retro-viral treatment
> HIV prevalence rate down 5.6%
> 99.9% of employees and contractors counselled
– 94.6% know their HIV status
TB
> 13.9% increase in TB screenings to 49 360
> 59 employees completed treatment and were cured of TB
Environment
> Long-term environmental economic sustainability
> A global leader in sustainable water management (CDP)
> Improved BRPM concentrator environmental management
performance
• Water efficiency 11.9% better than target
• Energy efficiency 9.4% better than target
> Maintain ISO 14001 certification at BRPM and Styldrift.
Compliance with the updated ISO 14001:2015 requirements
BRPM mining energy efficiencyHIV prevalence rate TB incidence rate BRPM concentrator energy efficiency
12

Audited Annual Results For The Year Ended 31 December 2017
Description Unit 2015 2016 2017 % Var
Total development km 35.5 36.2 36.1 (0.3)
BRPM km 33.9 31.1 29.3 (5.8)
Styldrift capital development km 1.6 5.0 6.8 36.0
IMS panel ratio (BRPM) ratio 1.51 1.58 1.68 6.3
Total tonnes delivered kt 2 457 2 759 2 992 8.4
BRPM kt 2 382 2 349 2 431 3.5
Styldrift kt 75 410 561 36.8
Merensky kt 1 872 2 176 2 437 12.0
UG2 kt 585 583 555 (4.8)
Built-up head grade (4E) g/t 4.11 4.03 3.94 (2.2)
BRPM g/t 4.14 4.18 4.16 (0.5)
Styldrift g/t 3.06 3.12 2.99 (4.2)
Solid mining performance at BRPM and Styldrift
> BRPM development 6.1% − remains aligned with depletion rates
> BRPM IMS panel ratio of 1.68
> Capital development at Styldrift 36%
> Tonnes delivered 8.4%
> Built-up head grade 2.2%
BRPM2 382
BRPM2 349
BRPM2 431
Styldrift75
Styldrift410
Styldrift561
-
500
1 000
1 500
2 000
2 500
3 000
3 500
2015 2016 2017
kt
4,14 4,18 4,16
3,06 3,12 2,99
0,0
0,5
1,0
1,5
2,0
2,5
3,0
3,5
4,0
4,5
2015 2016 2017
g/t
BRPM Styldrift
Built-up head gradeTonnes delivered
13

Audited Annual Results For The Year Ended 31 December 2017
180196
212
0
50
100
150
200
250
2015 2016 2017
koz
BRPM2 389
BRPM2 348
BRPM2 449
Styldrift72
Styldrift414
Styldrift572
0
500
1 000
1 500
2 000
2 500
3 000
3 500
2015 2016 2017
kt
Description Unit 2015 2016 2017 % Var
Total tonnes milled kt 2 461 2 762 3 021 9.4
BRPM kt 2 389 2 348 2 449 4.3
Styldrift kt 72 414 572 38.2
Merensky kt 1 874 2 180 2 464 13.0
UG2 kt 587 582 557 (4.3)
UG2% milled % 24% 21% 18% 14.3
BRPM concentrator tonnes milled kt 2 044 2 453 2 701 10.1
Merensky kt 1 874 2 180 2 464 13.0
UG2 kt 170 273 237 (13.2)
UG2% milled % 8% 11% 9% 18.2
Tonnes milled - UG2 Toll kt 417 309 320 3.6
Built-up head grade (4E) g/t 4.11 4.03 3.94 (2.2)
BRPM g/t 4.14 4.18 4.16 (0.5)
Styldrift g/t 3.06 3.12 2.99 (4.2)
Merensky g/t 4.20 4.08 3.93 (3.7)
UG2 g/t 3.79 3.82 3.99 4.5
Recovery - 4E (total concentrating) % 85.68 84.98 85.71 0.9
Recovery - 4E BRPM concentrator % 86.58 85.59 86.28 0.8
4E metals in concentrate koz 278 304 328 7.9
Pt metal in concentrate koz 180 196 212 8.2
250ktpm concentrator upgrade supports Styldrift ramp-up
> Tonnes milled 9.4%
• Merensky tonnes milled 13.0%
• UG2 tonnes milled 4.3%
• UG2 toll treatment 3.6%
• UG2 18% of total tonnes milled
> Metals in concentrate 7.9% 4E and 8.2% Pt
Pt metal in concentrateTonnes milled - total
14

Audited Annual Results For The Year Ended 31 December 2017
6 256 6 271
5 691
0
1 000
2 000
3 000
4 000
5 000
6 000
7 000
2015 2016 2017
num
ber
999 1 103
2 659
0
500
1 000
1 500
2 000
2 500
3 000
2015 2016 2017
num
ber
Description Unit 2015 2016 2017 % Var
Total labour No. 7 255 7 374 8 350 (13.2)
Working cost labour No. 6 256 6 271 5 691 9.2
Capital labour No. 999 1 103 2 659 (141.1)
Stoping efficiency – total m2/crew 321 334 353 5.7
Tonnes milled/TEC t/TEC 31.8 30.8 34.2 11.0
Restructuring process drives improved business performance
> 9.2% year-on-year reduction in working cost labour
• Restructuring exercise completed in H1 2017
> 141.1% in capital labour
• In line with increased mining and construction activities at Styldrift
> Improved labour efficiencies
• 5.7% in stoping efficiency
• 11.0% in tonnes milled per TEC
321 334
353
0
50
100
150
200
250
300
350
400
2015 2016 2017
m2 /
cre
w
31,830,8
34,2
10
15
20
25
30
35
40
2015 2016 2017
t/TE
C
Mining capital labourTotal working cost labour
Total milled / TECBRPM stoping efficiency - total
15

Audited Annual Results For The Year Ended 31 December 2017
14 504
15 639 15 414
0
2 000
4 000
6 000
8 000
10 000
12 000
14 000
16 000
18 000
2015 2016 2017
R/o
z
1 066
1 177 1 149
0
200
400
600
800
1 000
1 200
1 400
2015 2016 2017
R/t
Description Unit 2015 2016 2017 % Var
Cash operating costs R'm 2 548 2 765 2 815 (1.8)
Cash operating cost/tonne milled R/t 1 066 1 177 1 149 2.4
Mining cost/tonne milled R/t 748 845 826 2.2
Processing cost/tonne milled R/t 181 176 172 2.3
Services cost/tonne milled R/t 138 156 151 3.2
Cash operating cost/4E oz R/oz 9 359 10 068 9 941 1.3
Cash operating cost/Pt oz R/oz 14 504 15 639 15 414 1.4
Year-on-year reduction in cash operating unit costs
16
Key drivers
> Inflation at 5.46%
> Above inflation increases
• Contractors (4.2%)
• Sundries (1.0%)
• Enrolled labour (1.3%)
> Below inflation increases
• Stores and sundries (1.1%)
• Utilities (0.5%)
1 177
1 149
6222 17
41
54
1 000
1 050
1 100
1 150
1 200
1 250
1 300
R/t
onne
BRPM JV – Cash operating cost per tonne milled (2016 vs. 2017)
Cash operating cost / Pt ozCash operating cost / tonne milled

Audited Annual Results For The Year Ended 31 December 2017
Description Unit 2015 2016 2017 % Var
Stay-in-business capital (SIB) R'm 112 110 118 7.3
SIB % of operating cost % 4.4% 4.0% 4.2% 5.0
Replacement capital R'm 205 44 34 (22.7)
Phase III R'm 203 44 33 (25.0)
BRPM optimisation R'm 3 - - 0
BRPM UG2 R'm - - 1 0
Expansion capital R'm 1 692 972 2 008 106.6
Styldrift I R'm 1 659 968 2 005 107.1
Styldrift exploration drilling R'm 15 1 3 200.0
Styldrift II R'm 18 3 - (100.0)
Total capital expenditure R'm 2 009 1 126 2 160 91.8
Increase in expansion capital aligned to Styldrift 150ktpm ramp-up
17
2 009
1 126
2 160
0
500
1 000
1 500
2 000
2 500
2015 2016 2017
R‘m
illion
1 659
968
2 005
0
500
1 000
1 500
2 000
2 500
2015 2016 2017
R‘m
illion
Stay-in-business
capital
R118 million - 4.2% of operating cost
˃ Expenditure in line with ongoing operational
requirements
Replacement
capital
R34 million for 2017
˃ Phase III expenditure of R34 million for the
year in line with deferment strategy and meets
scheduled planning requirements
− PTD R1.070 billion
˃ South shaft UG2 strategy optimisation study
Expansion
capital
R2 008 million – 106.6% increase
˃ Styldrift I expenditure of R2 005 million – in
line with 150ktpm project mining and
construction schedule (concentrator, overland
belt and underground mining and construction)
˃ Three million in expansion expenditure
Styldrift capital expenditureTotal capital expenditure
Audited Annual Results For The Year Ended 31 December 2017
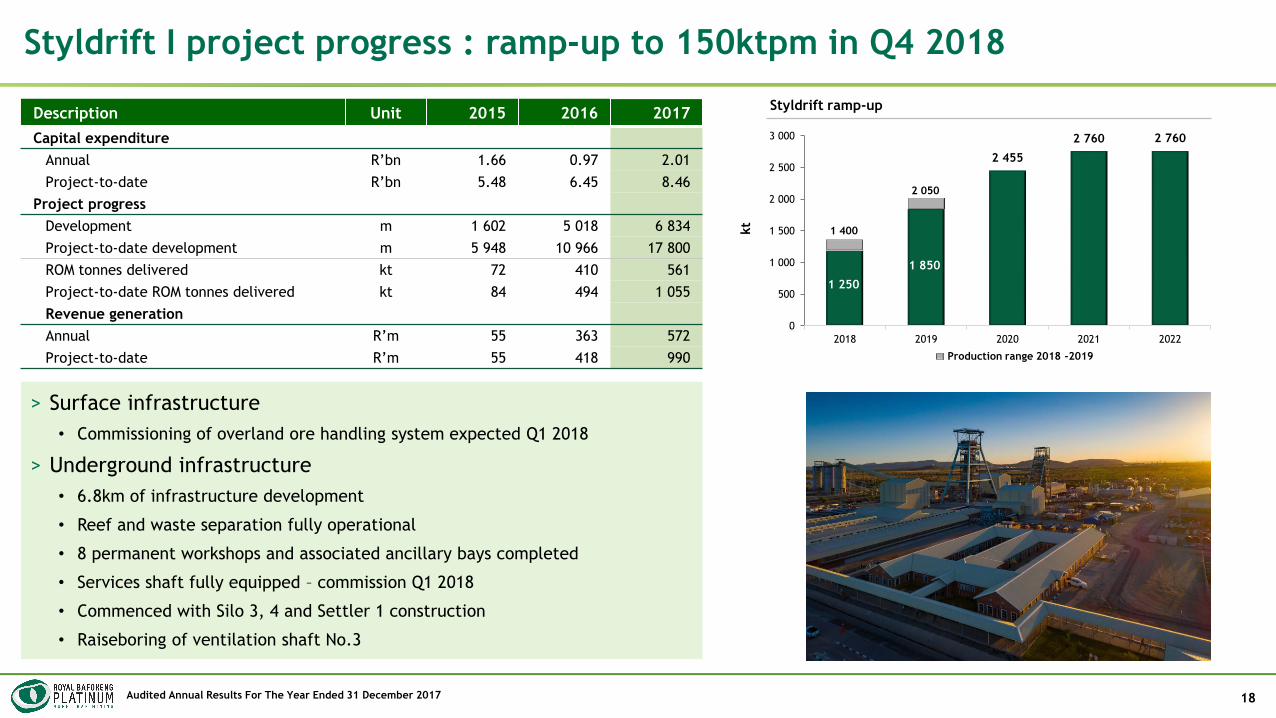
Description Unit 2015 2016 2017
Capital expenditure
Annual R’bn 1.66 0.97 2.01
Project-to-date R’bn 5.48 6.45 8.46
Project progress
Development m 1 602 5 018 6 834
Project-to-date development m 5 948 10 966 17 800
ROM tonnes delivered kt 72 410 561
Project-to-date ROM tonnes delivered kt 84 494 1 055
Revenue generation
Annual R’m 55 363 572
Project-to-date R’m 55 418 990
Styldrift I project progress : ramp-up to 150ktpm in Q4 2018
18
> Surface infrastructure
• Commissioning of overland ore handling system expected Q1 2018
> Underground infrastructure
• 6.8km of infrastructure development
• Reef and waste separation fully operational
• 8 permanent workshops and associated ancillary bays completed
• Services shaft fully equipped – commission Q1 2018
• Commenced with Silo 3, 4 and Settler 1 construction
• Raiseboring of ventilation shaft No.3
1 250
1 850
2 455
2 760 2 760
0
500
1 000
1 500
2 000
2 500
3 000
2018 2019 2020 2021 2022
kt
1 400
2 050
Production range 2018 -2019
Styldrift ramp-up
Audited Annual Results For The Year Ended 31 December 2017
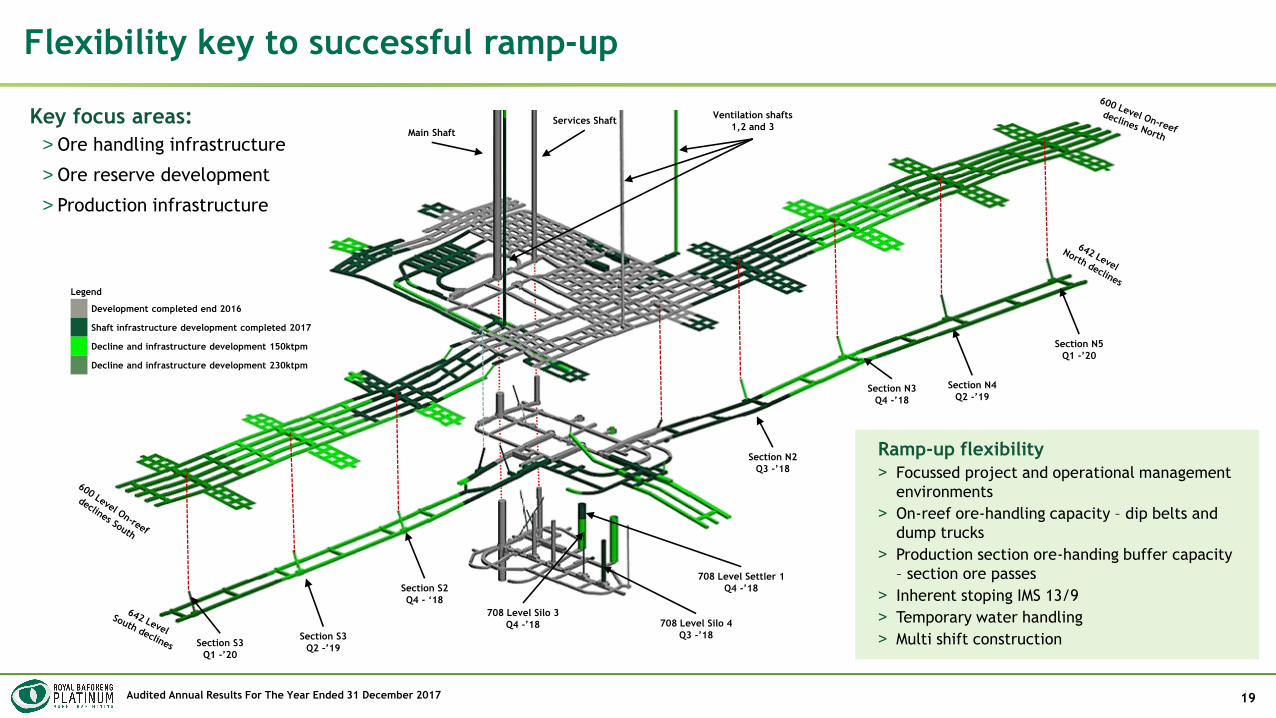
Flexibility key to successful ramp-up
19
Services Shaft
Main Shaft
Section N4
Q2 -’19Section N3
Q4 -’18
Section N2
Q3 -’18
Section S2
Q4 - ‘18
Section S3
Q2 -’19
Section N5
Q1 -’20
Ventilation shafts
1,2 and 3
708 Level Silo 4
Q3 -’18
708 Level Settler 1
Q4 -’18
708 Level Silo 3
Q4 -’18
Ramp-up flexibility
˃ Focussed project and operational management
environments
˃ On-reef ore-handling capacity – dip belts and
dump trucks
˃ Production section ore-handing buffer capacity
– section ore passes
˃ Inherent stoping IMS 13/9
˃ Temporary water handling
˃ Multi shift construction
Legend
Development completed end 2016
Shaft infrastructure development completed 2017
Decline and infrastructure development 150ktpm
Decline and infrastructure development 230ktpm
Key focus areas:
> Ore handling infrastructure
> Ore reserve development
> Production infrastructure
Section S3
Q1 -’20

FINANCIAL REVIEW

Audited Annual Results For The Year Ended 31 December 2017 21
Increase in profitability due to improved operational performance
Description Unit 2017 2016
YoY
% change
Average basket price R/Pt oz 19 156 18 906 1.3
Average R:US$ exchange rate R:US$ 13.29 14.21 (6.5)
Revenue R’m 3 498.5 3 342.2 4.7
Cost of sales R’m (3 186.5) (3 101.5) (2.7)
Gross profit R’m 312.0 240.7 29.6
Administration expenses and other income R’m (56.7) (67.5) 16.0
Restructuring costs R’m (49.0) -
Impairment of non-financial assets R’m (864.3) (2.6) NMF
Net finance income R’m 85.1 84.4 0.8
(Loss)/profit before tax R’m (572.9) 255.0 (324.7)
Operating profit R’m 206.3 173.2 19.1
EBITDA R’m 572.2 489.7 16.8
Audited Annual Results For The Year Ended 31 December 2017 22
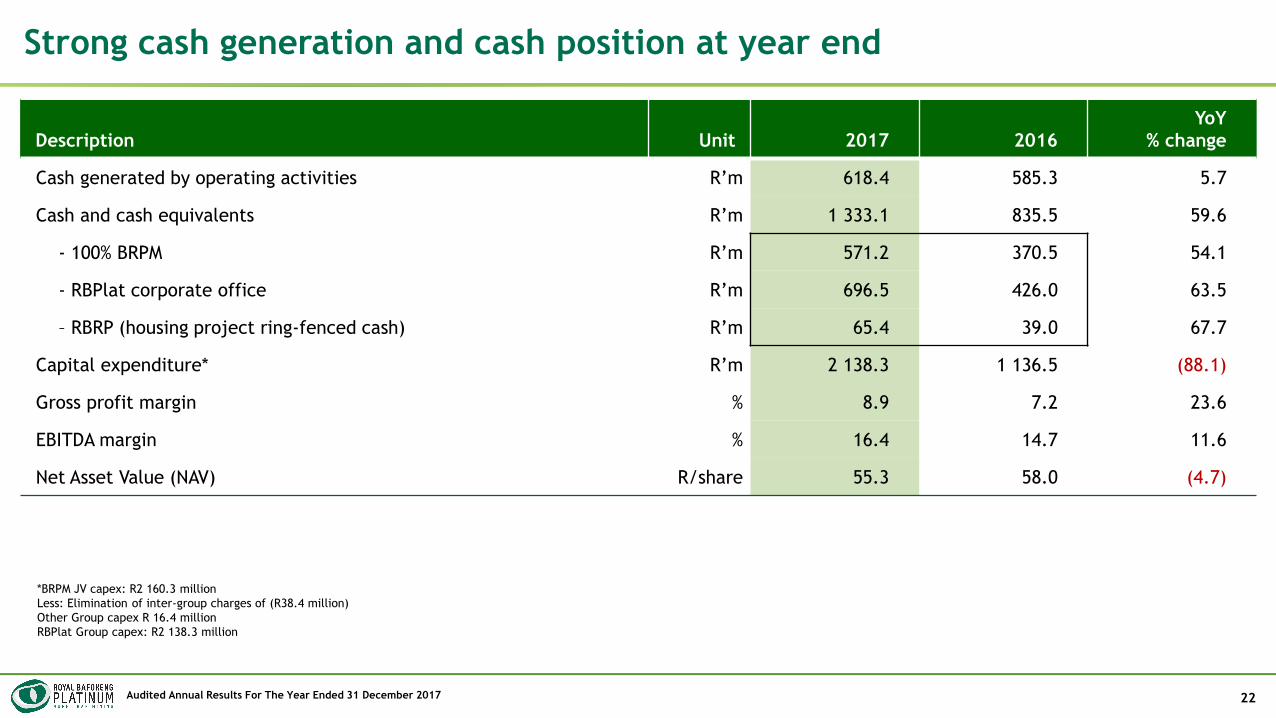
Strong cash generation and cash position at year end
Description Unit 2017 2016
YoY
% change
Cash generated by operating activities R’m 618.4 585.3 5.7
Cash and cash equivalents R’m 1 333.1 835.5 59.6
- 100% BRPM R’m 571.2 370.5 54.1
- RBPlat corporate office R’m 696.5 426.0 63.5
– RBRP (housing project ring-fenced cash) R’m 65.4 39.0 67.7
Capital expenditure* R’m 2 138.3 1 136.5 (88.1)
Gross profit margin % 8.9 7.2 23.6
EBITDA margin % 16.4 14.7 11.6
Net Asset Value (NAV) R/share 55.3 58.0 (4.7)
*BRPM JV capex: R2 160.3 million
Less: Elimination of inter-group charges of (R38.4 million)
Other Group capex R 16.4 million
RBPlat Group capex: R2 138.3 million

Audited Annual Results For The Year Ended 31 December 2017 23
Improvement in all US$ metal prices except platinum
Description Unit 2017 2016
Volume* US$ Volume* US$
Platinum oz 182 638 934/oz 176 777 984/oz
Palladium oz 75 593 939/oz 73 668 658/oz
Gold oz 8 220 1273/oz 7 989 1 238/oz
Rhodium oz 16 750 1264/oz 16 175 702/oz
Iridium oz 5 610 950/oz 5 446 607/oz
Ruthenium oz 28 513 109/oz 27 526 38/oz
Nickel tonne 1 687 4.88/lb 1 527 4.60/lb
Copper tonne 1 070 2.86/lb 981 2.24/lb
55,1%
22,9%
3,4%
6,8%
1,7%
1,0%5,9%
2,2% 1,0%
Revenue contribution - 2017
Platinum Palladium Gold Rhodium Iridium
Ruthenium Nickel Copper Cobalt
The table above illustrates the average prices received by the BRPM JV in terms of the disposal of concentrate
agreement (excluding the pipeline revaluation) grossed up to 100%.
* Excludes Styldrift I
2017
64,1%17,2%
3,4%
4,9%
1,1%0,4%
6,5%2,0% 0,4%
Revenue contribution - 2016
Platinum Palladium Gold Rhodium Iridium
Ruthenium Nickel Copper Cobalt
2016

Audited Annual Results For The Year Ended 31 December 2017
-0,9
-0,1
-0,2
-0,8
-0,1 -0,1
-0,8
-0,5
0,3
-0,1
-0,8
0,2
-1
-0,8
-0,6
-0,4
-0,2
0
0,2
Platinum Gold Rhodium Palladium
5 Year7 Year 3 Year 2 Year 1 Year
Diminished correlation between US$ metal prices and ZAR:US$ exchange rate
24
Source: Treasury One
Audited Annual Results For The Year Ended 31 December 2017 25
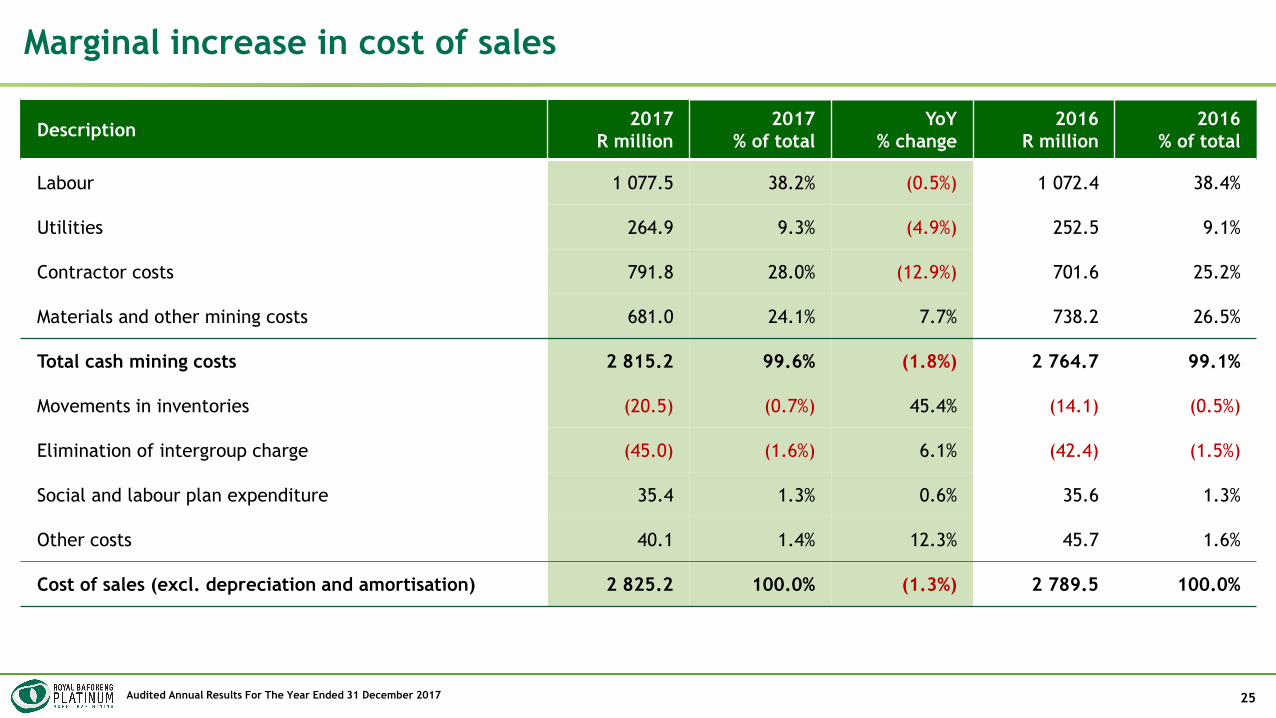
Marginal increase in cost of sales
Description2017
R million
2017
% of total
YoY
% change
2016
R million
2016
% of total
Labour 1 077.5 38.2% (0.5%) 1 072.4 38.4%
Utilities 264.9 9.3% (4.9%) 252.5 9.1%
Contractor costs 791.8 28.0% (12.9%) 701.6 25.2%
Materials and other mining costs 681.0 24.1% 7.7% 738.2 26.5%
Total cash mining costs 2 815.2 99.6% (1.8%) 2 764.7 99.1%
Movements in inventories (20.5) (0.7%) 45.4% (14.1) (0.5%)
Elimination of intergroup charge (45.0) (1.6%) 6.1% (42.4) (1.5%)
Social and labour plan expenditure 35.4 1.3% 0.6% 35.6 1.3%
Other costs 40.1 1.4% 12.3% 45.7 1.6%
Cost of sales (excl. depreciation and amortisation) 2 825.2 100.0% (1.3%) 2 789.5 100.0%
Audited Annual Results For The Year Ended 31 December 2017 26
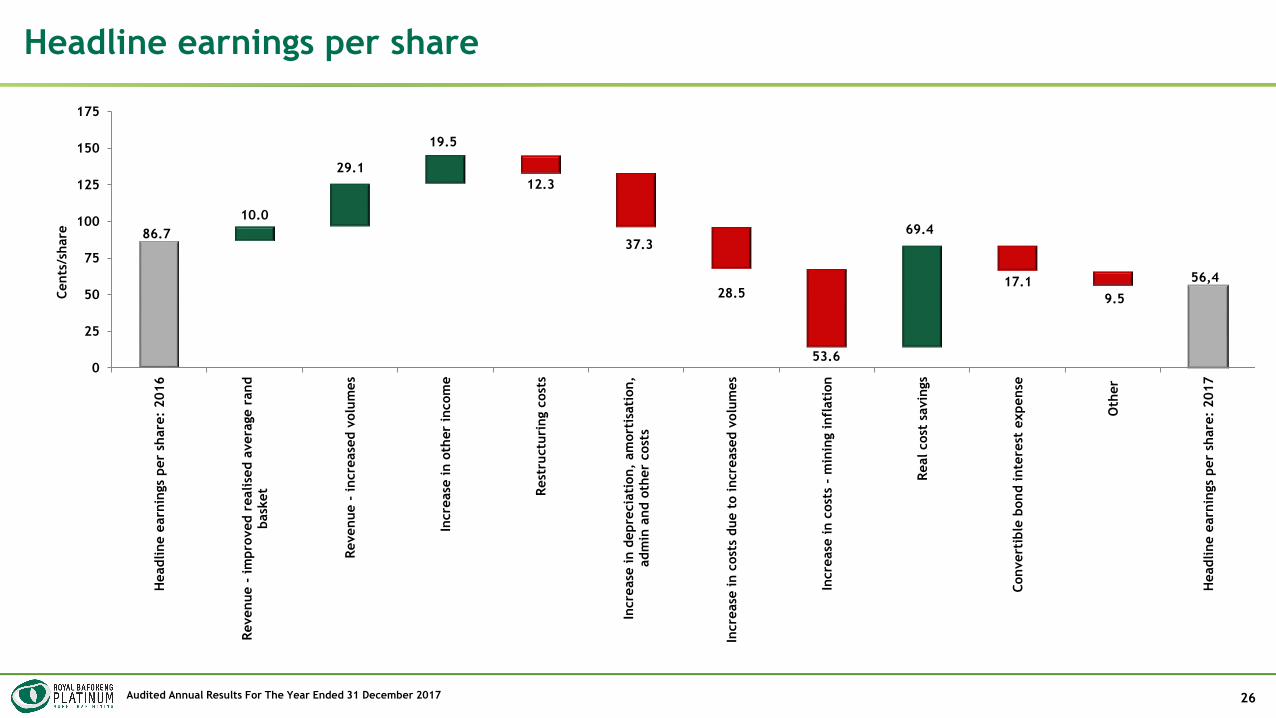
Headline earnings per share
86.7
29.1
19.5
12.3
37.3
28.5
53.6
69.4
17.1
9.5
56,4
0
25
50
75
100
125
150
175
Headline e
arn
ings
per
share
: 2016
Revenue -
im
pro
ved r
ealise
d a
vera
ge r
and
bask
et
Revenue -
incre
ase
d v
olu
mes
Incre
ase
in o
ther
incom
e
Rest
ructu
ring c
ost
s
Incre
ase
in d
epre
cia
tion,
am
ort
isati
on,
adm
in a
nd o
ther
cost
s
Incre
ase
in c
ost
s due t
o incre
ase
d v
olu
mes
Incre
ase
in c
ost
s -
min
ing infl
ati
on
Real cost
savin
gs
Convert
ible
bond inte
rest
expense
Oth
er
Headline e
arn
ings
per
share
: 2017
Cents
/share
10.0

Audited Annual Results For The Year Ended 31 December 2017 27
“Normalised” headline earnings per share
Group
Year ended 31 December
Description Unit 2017 2016
YoY
% change
Headline earnings R million 108.8 166.7 (34.7)
Weighted average shares outstanding #m 192.7 192.1 0.3
Headline earnings per share R/share 0.56 0.86 (34.9)
Restructuring costs R/share 0.17 -
Tax impact of restructuring R/share (0.04) -
Once-off tax adjustment R/share - (0.24)
“Normalised” headline earnings per share R/share 0.69 0.62 11.3
Dividend per share R/share - -
Audited Annual Results For The Year Ended 31 December 2017
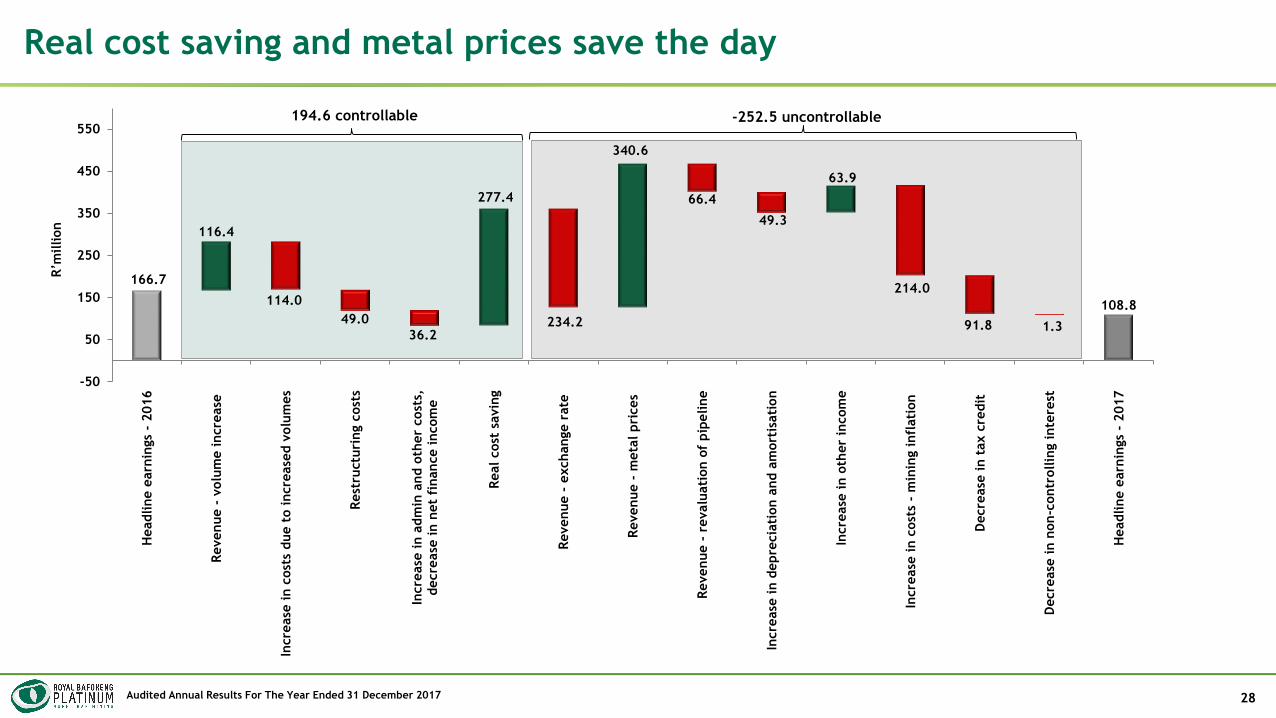
166.7
116.4
114.0
49.0
36.2
277.4
234.2
340.6
66.4
49.3
63.9
214.0
91.8 1.3
108.8
-50
50
150
250
350
450
550
Headline e
arn
ings
- 2016
Revenue -
volu
me i
ncre
ase
Incre
ase
in c
ost
s due t
o incre
ase
d v
olu
mes
Rest
ructu
ring c
ost
s
Incre
ase
in a
dm
in a
nd o
ther
cost
s,decre
ase
in n
et
finance incom
e
Real cost
savin
g
Revenue -
exchange r
ate
Revenue -
meta
l pri
ces
Revenue -
revalu
ati
on o
f pip
eline
Incre
ase
in d
epre
cia
tion a
nd a
mort
isati
on
Incre
ase
in o
ther
incom
e
Incre
ase
in c
ost
s -
min
ing infl
ati
on
Decre
ase
in t
ax c
redit
Decre
ase
in n
on
-contr
ollin
g inte
rest
Headline e
arn
ings
- 2017
R’m
illion
194.6 controllable -252.5 uncontrollable
Real cost saving and metal prices save the day
28

Audited Annual Results For The Year Ended 31 December 2017
835.5
48.9
451.1
119.2 34.1
1 985.0
444.2
535.0
493.9 40.0
1 171,0
8,5 41,4
1 333.1
-400
-200
0
200
400
600
800
1 000
1 200
1 400
1 600
1 800
2 000
2 200
2 400
2 600
Cas
h a
nd
cas
h e
qu
iva
len
ts -
1 J
anu
ary
20
17
Cas
h g
en
era
ted
by
op
era
tio
ns
Inte
rest
, div
ide
nd
s an
d t
ax
Cas
h g
en
era
ted
fro
m S
tyd
rift
In
cid
en
tal r
eve
nu
e
SIB
cap
ex
Re
pla
cem
en
t ca
pe
x
Exp
ansi
on
ca
pe
x
Incr
ea
se in
am
ou
nt
du
e t
o R
PM
Dra
wd
ow
n o
n P
IC h
ou
sin
g fa
cilil
ty
Acq
uis
itio
n o
f e
mp
loye
e h
ou
sin
g as
sets
Re
pay
me
nt
of
PIC
fac
ility
Ne
t p
roce
eds
fro
m c
on
vert
ible
bo
nd
s is
sue
d
Emp
loye
e h
ou
sin
g re
ceiv
able
- c
apit
al r
ep
aym
en
tsre
ceiv
ed
an
d in
cre
ase
in e
nvi
ron
me
nta
l tru
std
ep
osi
ts
De
po
sit
pai
d f
or
Mas
eve
acq
uis
itio
n
Cas
h a
nd
cas
h e
qu
iva
len
ts -
31
De
cem
be
r 2
01
7
R’m
illion
569.5
465.0
370.5
571.2
761.9
1 069.5 2 138.3
Strong operational cash generation
29
BRPM JV
RBPlat

Audited Annual Results For The Year Ended 31 December 2017
In summary
30
> Year of two halves
> Flat revenue basket price for the year
> Completed successful restructuring/organisational redesign
• 1.4% reduction in year-on-year cash unit costs
• 2.6% reduction in cash fixed cost base from 74.4% to 71.8% of total cash costs
• Enhanced quality of revenue stream
> 5.7% improvement in cash generated by operating activities to R618.4 million
> 50% of R2.1 billion capital expenditure funded from cash generated by operating activities and Styldrift on-reef
development revenue receipts
> Prudent impairment of goodwill
> Strong cash and funding position
• R1.3 billion cash on hand for the Group
• R1.9 billion unutilised funding facilities available to RBPlat
> Good progress made with strategic Maseve acquisition
• Phase 1 closed on 14 February 2018
• Phase 2 subject to section 11 approval

OUTLOOK

Audited Annual Results For The Year Ended 31 December 2017
Strongly positioned to achieve our goals in 2018
32
> Prospects of a market improvement for platinum in 2018
• A market that is close to balance, after investment, is likely
> Ramp up Styldrift I to 150ktpm by year-end and incorporate Maseve into our business
> Forecast 4E built-up head grade of 3.95g/t to 4.04g/t
> Production for 2018 forecast to be between 3.35Mt and 3.50Mt yielding between 370koz and 387koz (4E) metals
in concentrate
> Achieve below inflation cash operating unit cost increases
> Total capex for 2018 forecast at approximately R2.3 billion
> Continue with our pursuit of strategic value enhancing opportunities and our strategic objective of creating and
maintaining optimal flexibility
> We welcome the appointment of the new Minister of Mineral Resources
• We’re hopeful that the mining industry and government will work together to ensure a sustainable future of the industry

Audited Annual ResultsFor the year ended 31 December 2017