For the week ending September 20 the ocean freight rate ... › sites › default › files ›...
21
A weekly publication of the Agricultural Marketing Service www.ams.usda.gov/GTR September 27, 2018 Contents Article/ Calendar Grain Transportation Indicators Rail Barge Truck Exports Ocean Brazil Mexico Grain Truck/Ocean Rate Advisory Datasets Specialists Subscription Information -------------- The next release is October 4, 2018 Preferred citation: U.S. Dept. of Agriculture, Agricultural Marketing Service. Grain Transportation Report. September 27, 2018. Web: http://dx.doi.org/10.9752/TS056.09-27-2018 Grain Transportation Report Contact Us WEEKLY HIGHLIGHTS U.S. Army Corps of Engineers to get $7 billion in FY 2019 On September 21, 2018, the President signed into law: H.R. 5895, the “Energy and Water, Legislative Branch, and Military Construction and Veterans Affairs Appropriations Act, 2019,” which provides full-year funding through September 30, 2019, for a combination of appropriation bills. Of particular interest to grain transportation interests is the increased funding for the U.S. Army Corps of Engineers (Corps) of $6.99 billion for FY 2019. Trade media has reported this level of funding includes full work plan allocations for five construction projects, of which the Chickamauga Lock and Dam on the Tennessee River will receive 15 percent from the Inland Waterway Trust Fund (IWTF) and 85 percent from Federal funding. The remaining four projects, which have not yet been specifically identified, will be funded through a 50 percent share from the IWTF and a 50 percent Federal share. Grain Inspections Up for Second Consecutive Week For the week ending September 20, total inspections of grain (corn, wheat, and soybeans) for export from all major U.S. export regions reached 2.40 million metric tons (mmt), up 5 percent from the previous week, up 2 percent from last year, and 5 percent above the 3-year average. Total corn inspections continued to rise, increasing 22 percent from the previous week. Year-to-date inspections of corn are up 19 percent from last year, with increased shipments to Asia, Europe, and Africa. Total inspections of wheat were unchanged from the previous week, while soybean inspections decreased 12 percent. Grain inspections were up 9 percent from the previous week in the Mississippi Gulf and up 4 percent in the Pacific Northwest. Union Pacific Implements New Operating Plan Last week, Union Pacific Railroad (UP) announced it will implement a new operating plan on October 1 that applies “precision scheduled railroading” principles. Termed “Unified Plan 2020,” the plan includes shifting the focus from moving trains to moving cars, minimizing car dwell, and improving the utilization of crews and rail assets. When announcing the plan, UP said it intends to communicate thoroughly with customers. UP has also agreed to have weekly update calls with the Surface Transportation Board to keep it fully informed of operating changes and impacts to customers. According to the announcement, Unified Plan 2020 will be rolled out in phases across the entire network, beginning first along UP’s eastern North/South corridor (between Wisconsin and Texas). Snapshots by Sector Export Sales For the week ending September 13, unshipped balances of wheat, corn, and soybeans totaled 35.5 mmt, up 12 percent from the same time last year. Net weekly wheat export sales were .468 mmt, up 21 percent from the previous week. Net corn export sales were 1.38 mmt, up 79 percent from the previous week. Net soybean export sales were .918 mmt, up 32 percent from the past week. Rail U.S. Class I railroads originated 21,270 grain carloads for the week ending September 15, up 6 percent from the previous week, 2 percent from last year, and 4 percent from the 3-year average. Average October shuttle secondary railcar bids/offers per car were $33 above tariff for the week ending September 20, up $33 from last week, and $479 lower than last year. Average non-shuttle secondary railcar bids/offers per car were $275 above tariff, up $105 from last week. There were no non-shuttle bids/offers this week last year. Barge For the week ending September 22, barge grain movements totaled 668,650 tons, 24 percent higher than the previous week and up 95 percent from the same period last year. For the week ending September 22, 433 grain barges moved down river, 76 barges more than the previous week. There were 746 grain barges unloaded in New Orleans, 4 percent lower than the previous week. Ocean For the week ending September 20, 37 ocean-going grain vessels were loaded in the Gulf, 16 percent more than the same period last year. Sixty-one vessels are expected to be loaded within the next 10 days, 11 percent more than the same period last year. For the week ending September 20 the ocean freight rate for shipping bulk grain, from the Gulf to Japan, was $46.75 per metric ton, 1 percent more than the previous week. The cost of shipping, from the PNW to Japan, was $25.50 per metric ton, 2 percent more than the previous week. Fuel For the week ending September 24, the U.S. average diesel fuel price increased 0.3 cents, from the previous week, to $3.271 per gallon, 48.3 cents above the same week last year.
Transcript of For the week ending September 20 the ocean freight rate ... › sites › default › files ›...

A weekly publication of the Agricultural Marketing Service www.ams.usda.gov/GTR
September 27, 2018
Contents
Article/ Calendar
Grain Transportation
Indicators
Rail
Barge
Truck
Exports
Ocean
Brazil
Mexico
Grain Truck/Ocean Rate Advisory
Datasets
Specialists
Subscription Information
--------------
The next release is
October 4, 2018
Preferred citation: U.S. Dept. of Agriculture, Agricultural Marketing Service. Grain Transportation Report. September 27, 2018. Web: http://dx.doi.org/10.9752/TS056.09-27-2018
Grain Transportation Report
Contact Us
WEEKLY HIGHLIGHTS
U.S. Army Corps of Engineers to get $7 billion in FY 2019
On September 21, 2018, the President signed into law: H.R. 5895, the “Energy and Water, Legislative Branch, and Military
Construction and Veterans Affairs Appropriations Act, 2019,” which provides full-year funding through September 30, 2019, for a
combination of appropriation bills. Of particular interest to grain transportation interests is the increased funding for the U.S. Army
Corps of Engineers (Corps) of $6.99 billion for FY 2019. Trade media has reported this level of funding includes full work plan
allocations for five construction projects, of which the Chickamauga Lock and Dam on the Tennessee River will receive 15 percent
from the Inland Waterway Trust Fund (IWTF) and 85 percent from Federal funding. The remaining four projects, which have not yet
been specifically identified, will be funded through a 50 percent share from the IWTF and a 50 percent Federal share.
Grain Inspections Up for Second Consecutive Week
For the week ending September 20, total inspections of grain (corn, wheat, and soybeans) for export from all major U.S. export
regions reached 2.40 million metric tons (mmt), up 5 percent from the previous week, up 2 percent from last year, and 5 percent above
the 3-year average. Total corn inspections continued to rise, increasing 22 percent from the previous week. Year-to-date inspections of
corn are up 19 percent from last year, with increased shipments to Asia, Europe, and Africa. Total inspections of wheat were
unchanged from the previous week, while soybean inspections decreased 12 percent. Grain inspections were up 9 percent from the
previous week in the Mississippi Gulf and up 4 percent in the Pacific Northwest.
Union Pacific Implements New Operating Plan
Last week, Union Pacific Railroad (UP) announced it will implement a new operating plan on October 1 that applies “precision
scheduled railroading” principles. Termed “Unified Plan 2020,” the plan includes shifting the focus from moving trains to moving
cars, minimizing car dwell, and improving the utilization of crews and rail assets. When announcing the plan, UP said it intends to
communicate thoroughly with customers. UP has also agreed to have weekly update calls with the Surface Transportation Board to
keep it fully informed of operating changes and impacts to customers. According to the announcement, Unified Plan 2020 will be
rolled out in phases across the entire network, beginning first along UP’s eastern North/South corridor (between Wisconsin and
Texas).
Snapshots by Sector
Export Sales
For the week ending September 13, unshipped balances of wheat, corn, and soybeans totaled 35.5 mmt, up 12 percent from the same
time last year. Net weekly wheat export sales were .468 mmt, up 21 percent from the previous week. Net corn export sales were
1.38 mmt, up 79 percent from the previous week. Net soybean export sales were .918 mmt, up 32 percent from the past week.
Rail
U.S. Class I railroads originated 21,270 grain carloads for the week ending September 15, up 6 percent from the previous week, 2
percent from last year, and 4 percent from the 3-year average.
Average October shuttle secondary railcar bids/offers per car were $33 above tariff for the week ending September 20, up $33 from
last week, and $479 lower than last year. Average non-shuttle secondary railcar bids/offers per car were $275 above tariff, up $105
from last week. There were no non-shuttle bids/offers this week last year.
Barge
For the week ending September 22, barge grain movements totaled 668,650 tons, 24 percent higher than the previous week and up
95 percent from the same period last year.
For the week ending September 22, 433 grain barges moved down river, 76 barges more than the previous week. There were 746
grain barges unloaded in New Orleans, 4 percent lower than the previous week.
Ocean
For the week ending September 20, 37 ocean-going grain vessels were loaded in the Gulf, 16 percent more than the same period last
year. Sixty-one vessels are expected to be loaded within the next 10 days, 11 percent more than the same period last year.
For the week ending September 20 the ocean freight rate for shipping bulk grain, from the Gulf to Japan, was $46.75 per metric ton, 1
percent more than the previous week. The cost of shipping, from the PNW to Japan, was $25.50 per metric ton, 2 percent more than
the previous week.
Fuel
For the week ending September 24, the U.S. average diesel fuel price increased 0.3 cents, from the previous week, to $3.271 per
gallon, 48.3 cents above the same week last year.

September 27, 2018 Grain Transportation Report 2
Feature Article/Calendar
Sept. 30 - Oct. 2 IAOM - Southeast Asia Region Conference Pasay City, Manila https://www.iaom.info/southeastasia/
Oct. 18-21
North American Millers' Assocation Annual
Meeting Sea Island, GA http://www.namamillers.org/meetings/
Oct. 22-24 Inland Distribution Conference Oak Brook, IL https://events.joc.com/inland-2018
Oct. 22-24 Export Exchange 2018 Minneapolis, MN http://www.exportexchange.org/
Oct. 22-25 JOC Inalnd Distribution Conference Oak Broook, IL https://events.joc.com/inland-2018
Oct. 22-25IAOM - Mideast & Africa Region
Conference/Expo Nairobi, Kenya968-2471-2338
Oct. 27-31American Trucking Assoication Management
Conference & Exhibition Austin, TXhttps://mce.trucking.org/
Oct. 30 - Nov. 2Wheat Industry Fall Conference Tampa Bay, FL
https://www.wheatworld.org/newsroom/
events/
Nov. 4-6 Whole Grains Council Conference: Global
Traditions & Trends Seattle, WA
https://wholegrainscouncil.org/get-
involved/attend-our-conference
Nov. 6-8 Oklahoma AgriBusiness Expo Norman, OK 580-233-9516
Nov. 13 AgTC Workshop Riverside, MO https://agtrans.org/events/
Nov. 14 AgTC Workshop Atlanta, GA https://agtrans.org/events/
Nov. 13-15 Global Grain Geneva ConferenceGeneva, Switzerland
http://www.globalgrainevents.com/geneva/detail
s.html
Nov. 14-15 Kansas Agri Business Expo Wichita, KS http://www.ksabe.org/
Nov. 14-16Waterways Council Annual Meeting and 15th
Annual SymposiumChicago, IL http://waterwayscouncil.org/
Nov. 29Montana Grain growers Association Annual
ConventionGreat Falls, MT
https://mgga.org/events/annual-
convention/registration-2/
Dec. 2-4NGFA Country Elevator Conference and
Trade Show St. Louis, MO
https://www.ngfa.org/country-elevator-
conference/
Dec. 6 AgTC Workshop Minneapolis, MN https://agtrans.org/events/
Jan. 14-16, 2019 Micigam Agribusiness Association Lansing, MI https://miagbiz.org/
Jan. 16-17 South Dakota Ag Expo Conference Sioux Falls, SD https://www.agexpo-sd.org/
Jan. 20-22 North Dakota Grain Deales Association
Covention Fargo, ND701-235-4184
Jan. 24-25 TEGMA 2019 Annual Meeting Scottsdale, AZ http://www.tegma.org/meetings
Jan. 30- Feb 1 Ohio Agribusiness Association Convention Columbus, OH 614-326-7520
Feb. 11-16 Wheat Industry Winter Conference Washington, DChttps://www.wheatworld.org/newsroom/events/
Feb. 17-19 Grain & Feed Association of Illinois Meeting Schaumberg, IL 217-787-0810
Feb. 12-142019 Waterways Council Washington
Meeting Washington, DChttp://waterwayscouncil.org/calendar/
Feb. 21-22 USDA Agricultural Outlook Forum Washington, DC https://www.usda.gov/oce/forum/
Feb. 28 - Mar. 2Wheat 2019 Commodity Classic Orlanda, FL
https://www.wheatworld.org/newsroom/eve
nts/
Mar. 4-6Minnesota Grain & Feed Association
Meeting Bloommington, MN651-454-8212
March 17-19 NGFA 123rd Annual Convention Amelia Island, FL https://www.ngfa.org/upcoming-events/
September 27, 2018
Grain Transportation Report 3
Grain Transportation Indicators
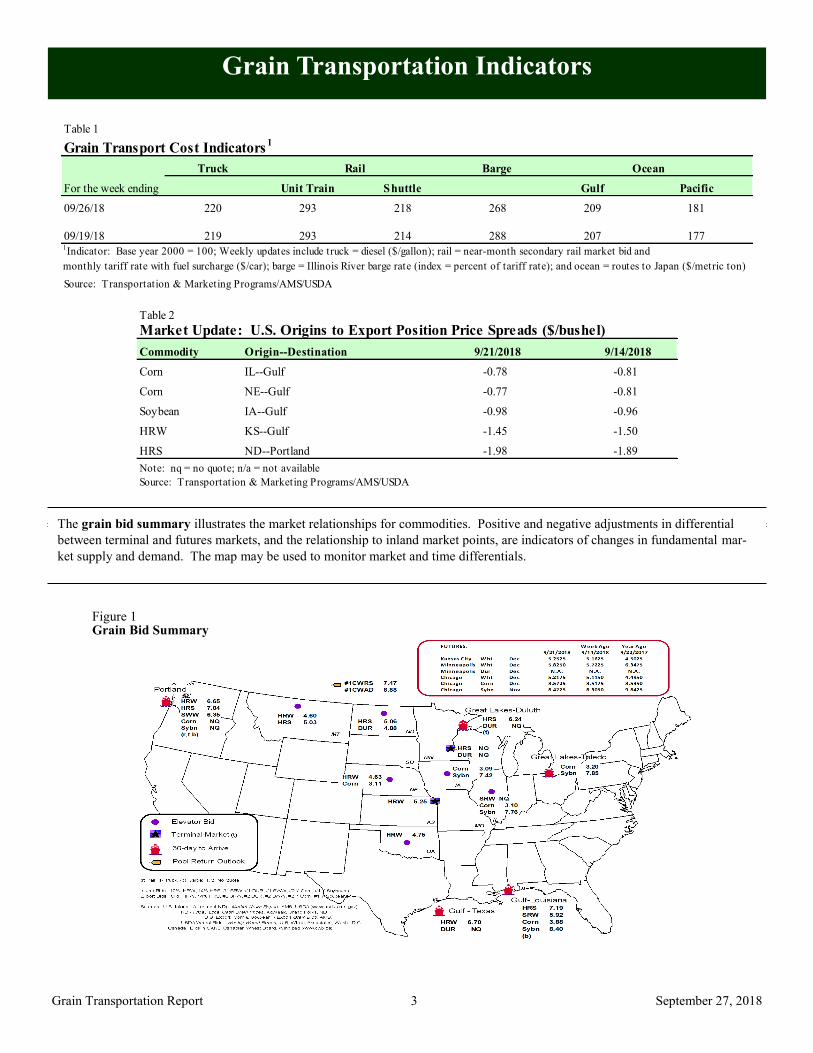
The grain bid summary illustrates the market relationships for commodities. Positive and negative adjustments in differential
between terminal and futures markets, and the relationship to inland market points, are indicators of changes in fundamental mar-
ket supply and demand. The map may be used to monitor market and time differentials.
Table 2
Market Update: U.S. Origins to Export Position Price Spreads ($/bushel)
Commodity Origin--Destination 9/21/2018 9/14/2018
Corn IL--Gulf -0.78 -0.81
Corn NE--Gulf -0.77 -0.81
Soybean IA--Gulf -0.98 -0.96
HRW KS--Gulf -1.45 -1.50
HRS ND--Portland -1.98 -1.89
Note: nq = no quote; n/a = not available
Source: Transportation & Marketing Programs/AMS/USDA
Table 1
Grain Transport Cost Indicators1
Truck Barge Ocean
For the week ending Unit Train Shuttle Gulf Pacific
09/26/18 220 293 218 268 209 1810 % 0 % - 7% 1% 2 %
09/19/18 219 293 214 288 207 177
Source: Transportation & Marketing Programs/AMS/USDA
Rail
1Indicator: Base year 2000 = 100; Weekly updates include truck = diesel ($/gallon); rail = near-month secondary rail market bid and
monthly tariff rate with fuel surcharge ($/car); barge = Illinois River barge rate (index = percent of tariff rate); and ocean = routes to Japan ($/metric ton)
Figure 1 Grain Bid Summary

September 27, 2018
Grain Transportation Report 4
Rail Transportation
Railroads originate approximately 24 percent of U.S. grain shipments. Trends in these loadings are indicative of
market conditions and expectations.
Table 3
Rail Deliveries to Port (carloads)1
Mississippi Pacific Atlantic & Cross-Border
For the Week Ending Gulf Texas Gulf Northwest East Gulf Total Week ending Mexico3
09/19/2018p
438 255 5,430 174 6,297 9/15/2018 2,417
09/12/2018r
573 605 3,633 253 5,064 9/8/2018 2,480
2018 YTDr
16,046 37,864 243,458 14,808 312,176 2018 YTD 88,288
2017 YTDr
18,450 62,243 203,625 13,693 298,011 2017 YTD 88,494
2018 YTD as % of 2017 YTD 87 61 120 108 105 % change YTD 100
Last 4 weeks as % of 20172
158 49 197 124 152 Last 4wks % 2017 99
Last 4 weeks as % of 4-year avg.2
157 37 137 107 112 Last 4wks % 4 yr 120
Total 2017 28,796 76,545 289,178 21,999 416,518 Total 2017 119,661
Total 2016 36,925 88,035 299,604 29,007 453,571 Total 2016 92,9821 Data is incomplete as it is voluntarily provided2 Compared with same 4-weeks in 2017 and prior 4-year average. 3
Cross-border weekly data is approximately 15 percent below the Association of American Railroads' reported weekly carloads received by Mexican railroads
to reflect switching between KCSM and Grupo Mexico.
YTD = year-to-date; p = preliminary data; r = revised data; n/a = not available
Source: Transportation & Marketing Programs/AMS/USDA
Figure 2
Rail Deliveries to Port
0
1,000
2,000
3,000
4,000
5,000
6,000
7,000
8,000
9,000
10,000
01/0
6/1
6
03/0
2/1
6
04/2
7/1
6
06/2
2/1
6
08/1
7/1
6
10/1
2/1
6
12/0
7/1
6
02/0
1/1
7
03/2
9/1
7
05/2
4/1
7
07/1
9/1
7
09/1
3/1
7
11/0
8/1
7
01/0
3/1
8
02/2
8/1
8
04/2
5/1
8
06/2
0/1
8
08/1
5/1
8
10/1
0/1
8
12/0
5/1
8
Ca
rlo
ad
s -
4-w
eek
ru
nn
ing
average
Pacific Northwest: 4 wks. ending 9/19--up 97% from same period last year; up 37 % from 4-year average
Texas Gulf: 4 wks. ending 9/19--down 51% from same period last year; down 63% from the 4-year average
Miss. River : 4 wks. ending 9/19--up 58% from same period last year; up 57% from 4-year average
Cross-border: 4 wks. ending 9/15--down 1% from same period last year ; up 20% from the 4-year average
Source: Transportation & Marketing Programs/AMS/USDA

September 27, 2018
Grain Transportation Report 5
Table 4
Class I Rail Carrier Grain Car Bulletin (grain carloads originated)
For the week ending:
9/15/2018 CSXT NS BNSF KCS UP CN CP
This week 1,253 2,892 12,144 578 4,403 21,270 4,608 4,970
This week last year 1,394 2,220 10,742 1,268 5,233 20,857 3,398 5,188
2018 YTD 70,120 95,109 459,062 34,495 193,442 852,228 143,754 172,255
2017 YTD 60,598 101,560 409,132 34,838 210,350 816,478 138,647 168,294
2018 YTD as % of 2017 YTD 116 94 112 99 92 104 104 102
Last 4 weeks as % of 2017* 121 100 122 70 107 113 136 99
Last 4 weeks as % of 3-yr avg.** 117 106 113 80 97 107 144 103
Total 2017 89,465 142,750 578,964 50,223 289,574 1,150,976 198,414 244,766
*The past 4 weeks of this year as a percent of the same 4 weeks last year.
**The past 4 weeks as a percent of the same period from the prior 3-year average. YTD = year-to-date.
Source: Association of American Railroads (www.aar.org)
East WestU.S. total
Canada
Table 5
Railcar Auction Offerings1
($/car)2
Oct-18 Oct-17 Nov-18 Nov-17 Dec-18 Dec-17 Jan-19 Jan-18
CO T grain units 0 no bids 0 0 0 no bids no bids no bids
CO T grain single-car5 0 0 1 0 2 0 0 0
GCAS/Region 1 no offer 10 no offer no bids no offer no bids n/a n/a
GCAS/Region 2 no offer 44 no offer no bids no offer no bids n/a n/a
1Auctio n o fferings a re fo r s ingle-car and unit tra in s hipments o nly.2Average premium/dis co unt to ta riff, las t auc tio n
3BNSF - COT = Certifica te o f Trans po rta tio n; no rth gra in and s o uth gra in bids were co mbined effec tive the week ending 6/24/06.
4UP - GCAS = Grain Car Allo ca tio n Sys tem
Regio n 1 inc ludes : AR, IL, LA, MO, NM, OK, TX, WI, and Duluth, MN.
Regio n 2 inc ludes : CO, IA, KS, MN, NE, WY, and Kans as City and St. J o s eph, MO.
5Range is s ho wn becaus e average is no t ava ilable . No t ava ilable = n/a .
So urce : Trans po rta tio n & Marketing P ro grams /AMS/USDA.
UP4
Delivery period
BNSF3
For the week ending:
9/20/2018
Figure 3
Total Weekly U.S. Class I Railroad Grain Car Loadings
15,000
17,000
19,000
21,000
23,000
25,000
27,000
29,000
Car
lo
ads
Prior 3-year, 4-week average Current 4-week average
For the 4 weeks ending September 15, grain carloadings were down 2 percent from the previous week, up 13 percent from last year, and up 7 percent from the 3-year average.
Source: Association of American Railroads

September 27, 2018
Grain Transportation Report 6
The secondary rail market information reflects trade values for service that was originally purchased from the railroad carrier as some form of guaranteed freight. The auction and secondary rail values are indicators of rail service quality and demand/supply.
Figure 4
Bids/Offers for Railcars to be Delivered in October 2018, Secondary Market
-200
0
200
400
600
800
1000
1200
3/1
/201
8
3/1
5/2
018
3/2
9/2
018
4/1
2/2
018
4/2
6/2
018
5/1
0/2
018
5/2
4/2
018
6/7
/201
8
6/2
1/2
018
7/5
/201
8
7/1
9/2
018
8/2
/201
8
8/1
6/2
018
8/3
0/2
018
9/1
3/2
018
9/2
7/2
018
10/1
1/2
018
Aver
age
pre
miu
m/d
isco
unt
to tar
iff
($/c
ar)
Shuttle Non-Shuttle
Shuttle prior 3-yr avg. (same week) Non-Shuttle prior 3-yr avg. (same week)9/20/2018
Non-shuttle bids include unit-train and single-car bids. n/a = not available.Source: Transportation & Marketing Programs/AMS/USDA
n/a
UPBNSF
$33
$275
n/aShuttle
Non-Shuttle
Average Non-shuttle bids/offers rose $105 this week, and are $200 below the peak.
Average Shuttle bids/offers rose $33 this week and are $1,067 below the peak.
Figure 5
Bids/Offers for Railcars to be Delivered in November 2018, Secondary Market
-400
-200
0
200
400
600
800
1000
3/2
9/2
018
4/1
2/2
018
4/2
6/2
018
5/1
0/2
018
5/2
4/2
018
6/7
/201
8
6/2
1/2
018
7/5
/201
8
7/1
9/2
018
8/2
/201
8
8/1
6/2
018
8/3
0/2
018
9/1
3/2
018
9/2
7/2
018
10/1
1/2
018
10/2
5/2
018
11
/8/2
018
Av
erag
e p
rem
ium
/dis
cou
nt
to tar
iff
($/c
ar)
Shuttle Non-Shuttle
Shuttle prior 3-yr avg. (same week) Non-Shuttle prior 3-yr avg. (same week)9/20/2018
Non-shuttle bids include unit-train and single-car bids. n/a = not available.Source: Transportation & Marketing Programs/AMS/USDA
n/a
UPBNSF
n/a
$300
$0Shuttle
Non-Shuttle
Average Non-shuttle bids/offers fell $75 this week, and are $150 below the peak.
Average Shuttle bids/offers are unchanged this week and are $350 below the peak.

September 27, 2018
Grain Transportation Report 7
Figure 6
Bids/Offers for Railcars to be Delivered in December 2018, Secondary Market
-300
-200
-100
0
100
200
300
400
500
5/3
/201
8
5/1
7/2
018
5/3
1/2
018
6/1
4/2
018
6/2
8/2
018
7/1
2/2
018
7/2
6/2
018
8/9
/201
8
8/2
3/2
018
9/6
/201
8
9/2
0/2
018
10
/4/2
018
10/1
8/2
018
11
/1/2
018
11/1
5/2
018
11/2
9/2
018
12/1
3/2
018
Av
erag
e p
rem
ium
/dis
cou
nt
to tar
iff
($/c
ar)
Shuttle Non-Shuttle
Shuttle prior 3-yr avg. (same week) Non-Shuttle prior 3-yr avg. (same week)9/20/2018
Non-shuttle bids include unit-train and single-car bids. n/a = not available.Source: Transportation & Marketing Programs/AMS/USDA
n/a
UPBNSF
$0
$400
$0Shuttle
Non-Shuttle
Average Non-shuttle bids/offers rose $25 this week, and are at the peak.
Average Shuttle bids/offers are unchanged this week and are $188 below the peak.
Table 6
Weekly Secondary Railcar Market ($/car)1
Oct-18 Nov-18 Dec-18 Jan-19 Feb-19 Mar-19
BNSF-GF n/a n/a n/a n/a n/a n/a
Change from last week n/a n/a n/a n/a n/a n/a
Change from same week 2017 n/a n/a n/a n/a n/a n/a
UP-Pool 275 300 400 n/a n/a n/a
Change from last week (38) (75) 25 n/a n/a n/a
Change from same week 2017 n/a n/a n/a n/a n/a n/a
BNSF-GF 33 n/a 0 n/a n/a n/a
Change from last week n/a n/a 0 n/a n/a n/a
Change from same week 2017 (392) n/a 50 n/a n/a n/a
UP-Pool n/a 0 0 n/a n/a n/a
Change from last week n/a 0 0 n/a n/a n/a
Change from same week 2017 n/a 0 100 n/a n/a n/a
1Average premium/dis co unt to ta riff, $ /car-las t week
No te : Bids lis ted are market INDICATORS o nly & are NOT guaranteed prices ,
n/a = no t ava ilable ; GF = guaranteed fre ight; P o o l = guaranteed po o l
So urces : Trans po rta tio n and Marketing P ro grams /AMS/USDA
Data fro m J ames B. J o iner Co ., Tradewes t Bro kerage Co .
No
n-s
hu
ttle
For the week ending:
9/20/2018
Sh
utt
le
Delivery period

September 27, 2018
Grain Transportation Report 8
The tariff rail rate is the base price of freight rail service, and together with fuel surcharges and any auction and secondary rail values constitute the full cost of shipping by rail. Typically, auction and secondary rail values are a small fraction of the full cost of shipping by rail relative to the tariff rate. High auction and secondary rail values, during times of high rail demand or short supply, can exceed the cost of the tariff rate plus fuel surcharge.
Table 7
Tariff Rail Rates for Unit and Shuttle Train Shipments1
Percent
Tariff change
September, 2018 Origin region3
Destination region3
rate/car metric ton bushel2
Y/Y4
Unit train
Wheat Wichita, KS St. Louis, MO $3,983 $116 $40.71 $1.11 4
Grand Forks, ND Duluth-Superior, MN $4,268 $0 $42.38 $1.15 3
Wichita, KS Los Angeles, CA $7,175 $0 $71.25 $1.94 2
Wichita, KS New Orleans, LA $4,540 $205 $47.12 $1.28 3
Sioux Falls, SD Galveston-Houston, TX $6,911 $0 $68.63 $1.87 2
Northwest KS Galveston-Houston, TX $4,816 $224 $50.05 $1.36 3
Amarillo, TX Los Angeles, CA $5,121 $312 $53.95 $1.47 6
Corn Champaign-Urbana, IL New Orleans, LA $3,931 $231 $41.33 $1.05 11
Toledo, OH Raleigh, NC $6,344 $0 $63.00 $1.60 5
Des Moines, IA Davenport, IA $2,258 $49 $22.91 $0.58 1
Indianapolis, IN Atlanta, GA $5,446 $0 $54.08 $1.37 5
Indianapolis, IN Knoxville, TN $4,540 $0 $45.08 $1.15 5
Des Moines, IA Little Rock, AR $3,609 $144 $37.27 $0.95 5
Des Moines, IA Los Angeles, CA $5,327 $419 $57.06 $1.45 7
Soybeans Minneapolis, MN New Orleans, LA $4,131 $238 $43.39 $1.18 19
Toledo, OH Huntsville, AL $5,287 $0 $52.50 $1.43 5
Indianapolis, IN Raleigh, NC $6,460 $0 $64.15 $1.75 5
Indianapolis, IN Huntsville, AL $4,764 $0 $47.31 $1.29 5
Champaign-Urbana, IL New Orleans, LA $4,745 $231 $49.42 $1.34 9
Shuttle Train
Wheat Great Falls, MT Portland, OR $4,078 $0 $40.50 $1.10 3
Wichita, KS Galveston-Houston, TX $4,296 $0 $42.66 $1.16 3
Chicago, IL Albany, NY $5,663 $0 $56.24 $1.53 3
Grand Forks, ND Portland, OR $5,736 $0 $56.96 $1.55 2
Grand Forks, ND Galveston-Houston, TX $6,056 $0 $60.14 $1.64 2
Northwest KS Portland, OR $5,912 $368 $62.36 $1.70 6
Corn Minneapolis, MN Portland, OR $5,000 $0 $49.65 $1.26 0
Sioux Falls, SD Tacoma, WA $4,960 $0 $49.26 $1.25 0
Champaign-Urbana, IL New Orleans, LA $3,731 $231 $39.35 $1.00 11
Lincoln, NE Galveston-Houston, TX $3,700 $0 $36.74 $0.93 0
Des Moines, IA Amarillo, TX $3,970 $181 $41.22 $1.05 5
Minneapolis, MN Tacoma, WA $5,000 $0 $49.65 $1.26 0
Council Bluffs, IA Stockton, CA $4,820 $0 $47.86 $1.22 2
Soybeans Sioux Falls, SD Tacoma, WA $5,750 $0 $57.10 $1.55 3
Minneapolis, MN Portland, OR $5,800 $0 $57.60 $1.57 3
Fargo, ND Tacoma, WA $5,650 $0 $56.11 $1.53 3
Council Bluffs, IA New Orleans, LA $4,775 $267 $50.07 $1.36 9
Toledo, OH Huntsville, AL $4,352 $0 $43.22 $1.18 3
Grand Island, NE Portland, OR $5,710 $377 $60.44 $1.65 91A unit train refers to shipments of at least 25 cars. Shuttle train rates are generally available for qualified shipments of
75-120 cars that meet railroad efficiency requirements.
2Approximate load per car = 111 short tons (100.7 metric tons): corn 56 lbs./bu., wheat and soybeans 60 lbs./bu.
3Regional economic areas are defined by the Bureau of Economic Analysis (BEA)
4Percentage change year over year calculated using tariff rate plus fuel surcharge
Sources: www.bnsf.com, www.cn.ca, www.csx.com, www.up.com
Tariff plus surcharge per:Fuel
surcharge
per car

September 27, 2018
Grain Transportation Report 9
Figure 7
Railroad Fuel Surcharges, North American Weighted Average1
$0.00
$0.10
$0.20
$0.30
$0.40
$0.50
$0.60
$0.70
Do
llar
s p
er r
ailc
ar m
ile
3-Year Monthly Average
Fuel Surcharge* ($/mile/railcar)
September, 2018: $0.17/mile, unchanged from last month's surcharge of $0.18/mile; up 14 cents from the
September 2017 surcharge of $0.03/mile; and up 13 cents from the September prior 3-year average of $0.04/mile.
1 Weighted by each Class I railroad's proportion of grain traffic for the prior year. * Beginning January 2009, the Canadian Pacific fuel surcharge is computed by a monthly average of the bi -weekly fuel surcharge.**CSX strike price changed from $2.00/gal. to $3.75/gal. starting January 1, 2015.
Sources: www.bnsf.com, www.cn.ca, www.cpr.ca, www.csx.com, www.kcsi.com, www.nscorp.com, www.uprr.com
Table 8
Tariff Rail Rates for U.S. Bulk Grain Shipments to MexicoDate: Percent
Tariff change4
Commodity Destination region rate/car1
metric ton3 bushel
3Y/Y
Wheat MT Chihuahua, CI $7,284 $0 $74.43 $2.02 -2
OK Cuautitlan, EM $6,743 $160 $70.54 $1.92 3
KS Guadalajara, JA $7,371 $396 $79.36 $2.16 3
TX Salinas Victoria, NL $4,292 $98 $44.86 $1.22 1
Corn IA Guadalajara, JA $8,313 $358 $88.59 $2.25 3
SD Celaya, GJ $7,700 $0 $78.68 $2.00 2
NE Queretaro, QA $8,013 $337 $85.32 $2.17 4
SD Salinas Victoria, NL $6,743 $0 $68.90 $1.75 2
MO Tlalnepantla, EM $7,379 $329 $78.76 $2.00 4
SD Torreon, CU $7,300 $0 $74.59 $1.89 2
Soybeans MO Bojay (Tula), HG $8,209 $333 $87.28 $2.37 -3
NE Guadalajara, JA $8,767 $363 $93.29 $2.54 0
IA El Castillo, JA $9,110 $0 $93.08 $2.53 2
KS Torreon, CU $7,564 $267 $80.01 $2.18 3
Sorghum NE Celaya, GJ $7,345 $331 $78.43 $1.99 5
KS Queretaro, QA $7,819 $200 $81.94 $2.08 4
NE Salinas Victoria, NL $6,452 $161 $67.56 $1.71 5
NE Torreon, CU $6,790 $257 $72.00 $1.83 51Rates are based upon published tariff rates for high-capacity shuttle trains. Shuttle trains are available for qualified
shipments of 75--110 cars that meet railroad efficiency requirements.2Fuel surcharge adjusted to reflect the change in Ferrocarril Mexicano, S.A. de C.V railroad fuel surcharge policy as of 10/01/20093Approximate load per car = 97.87 metric tons: Corn & Sorghum 56 lbs/bu, Wheat & Soybeans 60 lbs/bu4Percentage change calculated using tariff rate plus fuel surchage
Sources: www.bnsf.com, www.uprr.com, www.kcsouthern.com
Fuel
surcharge
per car2
Tariff plus surcharge per:Origin
state
September, 2018

September 27, 2018
Grain Transportation Report 10
Barge Transportation
Figure 9 Benchmark tariff rates Calculating barge rate per ton: (Rate * 1976 tariff benchmark rate per ton)/100
Select applicable index from market quotes included in tables on this page. The 1976 benchmark rates per ton are provided in map.
Twin Cities 6.19
Mid-Mississippi 5.32
St. Louis 3.99
Cairo-Memphis 3.14
Illinois 4.64 Cincinnati 4.69
Lower Ohio 4.04
Figure 8
Illinois River Barge Freight Rate1,2
1Rate = percent of 1976 tariff benchmark index (1976 = 100 percent); 24-week moving average of the 3-year average.
Source: Transportation & Marketing Programs/AMS/USDA
0
200
400
600
800
1000
120009/2
6/1
7
10/1
0/1
7
10/2
4/1
7
11/0
7/1
7
11/2
1/1
7
12/0
5/1
7
12/1
9/1
7
01/0
2/1
8
01/1
6/1
8
01/3
0/1
8
02/1
3/1
8
02/2
7/1
8
03/1
3/1
8
03/2
7/1
8
04/1
0/1
8
04/2
4/1
8
05/0
8/1
8
05/2
2/1
8
06/0
5/1
8
06/1
9/1
8
07/0
3/1
8
07/1
7/1
8
07/3
1/1
8
08/1
4/1
8
08/2
8/1
8
09/1
1/1
8
09/2
5/1
8
Per
cen
t of
tar
iff Weekly rate
3-year avg. for
the week
For the week ending September 25: 7 percent lower than last week, 21 percent lower than last year,and 1 percent higher than the 3-year average.
Table 9
Weekly Barge Freight Rates: Southbound Only
Twin
Cities
Mid-
Mississippi
Lower
Illinois
River St. Louis Cincinnati
Lower
Ohio
Cairo-
Memphis
Rate1
9/25/2018 488 475 483 393 465 465 338
9/18/2018 538 525 518 433 513 513 450
$/ton 9/25/2018 30.21 25.27 22.41 15.68 21.81 18.79 10.61
9/18/2018 33.30 27.93 24.04 17.28 24.06 20.73 14.13
Current week % change from the same week:
Last year -19 -17 -21 -23 -26 -26 -29
3-year avg. 2
-2 0 1 1 -4 -4 -9-2 6 6
Rate1
October 513 503 508 415 493 493 393
December - - 395 313 350 375 288
Source: Transportation & Marketing Programs/AMS/USDA
1Rate = percent of 1976 tariff benchmark index (1976 = 100 percent); 24-week moving average; ton = 2,000 pounds;

September 27, 2018
Grain Transportation Report 11
Figure 10
Barge Movements on the Mississippi River1 (Locks 27 - Granite City, IL)
1 The 3-year average is a 4-week moving average.
Source: U.S. Army Corps of Engineers
0
200
400
600
800
1,000
1,20009
/23/
17
10/0
7/1
7
10/2
1/1
7
11/0
4/1
7
11/1
8/1
7
12/0
2/1
7
12/1
6/1
7
12/3
0/1
7
01/1
3/1
8
01/2
7/1
8
02/1
0/1
8
02/2
4/1
8
03/1
0/1
8
03/2
4/1
8
04/0
7/1
8
04/2
1/1
8
05/0
5/1
8
05/1
9/1
8
06/0
2/1
8
06/1
6/1
8
06/3
0/1
8
07/1
4/1
8
07/2
8/1
8
08/1
1/1
8
08/2
5/1
8
09/0
8/1
8
09/2
2/1
8
10/0
6/1
8
10/2
0/1
8
1,0
00
to
ns
Soybeans
Wheat
Corn
3-Year Average
For the week ending September 22: 190 percent higher than last year,and 30 percent higher than the3-yr avg.
Table 10
Barge Grain Movements (1,000 tons)
For the week ending 09/22/2018 Corn Wheat Soybeans Other Total
Mississippi River
Rock Island, IL (L15) 133 10 31 0 173
Winfield, MO (L25) 257 17 92 0 366
Alton, IL (L26) 405 22 114 0 541
Granite City, IL (L27) 393 21 120 0 534
Illinois River (L8) 73 2 9 0 84
Ohio River (L52) 78 0 37 0 115
Arkansas River (L1) 1 6 13 0 20
Weekly total - 2018 472 26 170 0 669
Weekly total - 2017 124 58 158 3 343
2018 YTD1
18,170 1,372 9,093 88 28,723
2017 YTD 17,597 1,884 10,202 228 29,911
2018 as % of 2017 YTD 103 73 89 39 96
Last 4 weeks as % of 20172
210 94 92 15 143
Total 2017 22,242 2,210 16,123 360 40,936
2 As a percent of same period in 2017.
Source: U.S. Army Corps of Engineers
Note: Total may not add exactly, due to rounding.
1 Weekly total, YTD (year-to-date) and calendar year total includes Miss/27, Ohio/52, and Ark/1; "Other" refers to oats, barley,
sorghum, and rye.

September 27, 2018
Grain Transportation Report 12
Figure 12
Grain Barges for Export in New Orleans Region
Source: U.S. Army Corps of Engineers and GIPSA
0
200
400
600
800
1000
1200
1400
6/3
/17
6/1
7/1
7
7/1
/17
7/1
5/1
7
7/2
9/1
7
8/1
2/1
7
8/2
6/1
7
9/9
/17
9/2
3/1
7
10
/7/1
7
10
/21
/17
11
/4/1
7
11
/18
/17
12
/2/1
7
12
/16
/17
12
/30
/17
1/1
3/1
8
1/2
7/1
8
2/1
0/1
8
2/2
4/1
8
3/1
0/1
8
3/2
4/1
8
4/7
/18
4/2
1/1
8
5/5
/18
5/1
9/1
8
6/2
/18
6/1
6/1
8
6/3
0/1
8
7/1
4/1
8
7/2
8/1
8
8/1
1/1
8
8/2
5/1
8
9/8
/18
9/2
2/1
8
Downbound Grain Barges Locks 27, 1, and 52
Grain Barges Unloaded in New Orleans
Nu
mb
er o
f b
arges
For the week ending September 22: 433 grain barges moved down river, 76 barges more than last week;
746 grain barges were unloaded in New Orleans, 4 percent lower than the previous week.
Figure 11
Source: U.S. Army Corps of Engineers
Upbound Empty Barges Transiting Mississippi River Locks 27, Arkansas River
Lock and Dam 1, and Ohio River Locks and Dam 52
0
100
200
300
400
500
600
700
800
11/
11/
17
11/
18/
17
11/
25/
17
12/
2/1
7
12/
9/1
7
12/
16/
17
12/
23/
17
12/
30/
17
1/6
/18
1/1
3/1
8
1/2
0/1
8
1/2
7/1
8
2/3
/18
2/1
0/1
8
2/1
7/1
8
2/2
4/1
8
3/3
/18
3/1
0/1
8
3/1
7/1
8
3/2
4/1
8
3/3
1/1
8
4/7
/18
4/1
4/1
8
4/2
1/1
8
4/2
8/1
8
5/5
/18
5/1
2/1
8
5/1
9/1
8
5/2
6/1
8
6/2
/18
6/9
/18
6/1
6/1
8
6/2
3/1
8
6/3
0/1
8
7/7
/18
7/1
4/1
8
7/2
1/1
8
7/2
8/1
8
8/4
/18
8/1
1/1
8
8/1
8/1
8
8/2
5/1
8
9/1
/18
9/8
/18
9/1
5/1
8
9/2
2/1
8
Nu
mb
er o
f B
arg
es
Miss. Locks 27 Ark Lock 1 Ohio Locks 52
For the week ending September 22: 532 barges transited the locks, 10 barges more than the previous week, and 30 percent higher than the 3-year avg.

September 27, 2018
Grain Transportation Report 13
The weekly diesel price provides a proxy for trends in U.S. truck rates as diesel fuel is a significant expense for truck grain move-
ments.
Truck Transportation
Table 11
Change from
Region Location Price Week ago Year ago
I East Coast 3.254 0.002 0.443
New England 3.270 0.003 0.508
Central Atlantic 3.416 0.001 0.491
Lower Atlantic 3.136 0.001 0.396
II Midwest2 3.218 0.010 0.477
III Gulf Coast3 3.052 -0.004 0.428
IV Rocky Mountain 3.355 -0.008 0.523
V West Coast 3.759 0.004 0.656
West Coast less California 3.473 0.000 0.465
California 3.986 0.007 0.806
Total U.S. 3.271 0.003 0.483
1Diesel fuel prices include all taxes. Prices represent an average of all types of diesel fuel.
2Same as North Central 3Same as South Central
Source: Energy Information Administration/U.S. Department of Energy (www.eia.doe.gov)
Retail on-Highway Diesel Prices, Week Ending 9/24/2018 (US $/gallon)
Figure 13
Weekly Diesel Fuel Prices, U.S. Average
Source: Retail On-Highway Diesel Prices, Energy Information Administration, Dept. of Energy
$3.271$2.788
$2.000
$2.100
$2.200
$2.300
$2.400
$2.500
$2.600
$2.700
$2.800
$2.900
$3.000
$3.100
$3.200
$3.300
3/26
/201
8
4/2/
2018
4/9/
2018
4/16
/201
8
4/23
/201
8
4/30
/201
8
5/7/
2018
5/14
/201
8
5/21
/201
8
5/28
/201
8
6/4/
2018
6/11
/201
8
6/18
/201
8
6/25
/201
8
7/2/
2018
7/9/
2018
7/16
/201
8
7/23
/201
8
7/30
/201
8
8/6/
2018
8/13
/201
8
8/20
/201
8
8/27
/201
8
9/3/
2018
9/10
/201
8
9/17
/201
8
9/24
/201
8
$ p
er g
allo
n
Last Year Current YearFor the week ending September 24, the U.S. average diesel fuel price increased
0.3 cents from the previous week to $3.271 per gallon, 48.3 cents above the same
week last year.

September 27, 2018
Grain Transportation Report 14
Grain Exports
Table 12
U.S. Export Balances and Cumulative Exports (1,000 metric tons)
Wheat Corn Soybeans Total
For the week ending HRW SRW HRS SWW DUR All wheat
Export Balances1
9/13/2018 1,396 553 1,349 1,039 170 4,508 14,750 16,236 35,494
This week year ago 1,532 552 1,336 1,304 122 4,846 9,612 17,236 31,693
Cumulative exports-marketing year 2
2018/19 YTD 1,568 707 1,738 1,599 86 5,700 1,805 1,697 9,201
2017/18 YTD 3,360 737 2,196 1,815 129 8,237 1,418 2,096 11,752
YTD 2018/19 as % of 2017/18 47 96 79 88 67 69 127 81 78
Last 4 wks as % of same period 2017/18 91 100 99 73 143 91 96 56 73
2017/18 Total 9,150 2,343 5,689 4,854 384 22,419 57,209 56,214 135,842
2016/17 Total 11,096 2,285 7,923 4,254 484 26,042 41,864 51,156 119,0621 Current unshipped (outstanding) export sales to date2 Shipped export sales to date; new marketing year now in effect for corn, soybeans, and wheat
Note: YTD = year-to-date. Marketing Year: wheat = 6/01-5/31, corn & soybeans = 9/01-8/31
Source: Foreign Agricultural Service/USDA (www.fas.usda.gov)
Table 13
Top 5 Importers 1 of U.S. Corn
For the week ending 9/13/2018 % change Exports3
2018/19 2017/18 current MY 3-year avg
Current MY Last MY from last MY 2015-2017
Mexico 4,958 5,152 (4) 13,691
Japan 2,628 1,299 102 11,247
Korea 1,464 75 1,857 4,754
Colombia 432 712 (39) 4,678
Peru 379 520 (27) 2,975
Top 5 Importers 9,860 7,758 27 37,344
Total US corn export sales 16,555 11,030 50 53,184
% of Projected 27% 18%
Change from prior week2
1,384 527
Top 5 importers' share of U.S. corn
export sales 60% 70% 70%
USDA forecast, September 2018 61,069 61,705 (1)
Corn Use for Ethanol USDA forecast,
September 2018 143,510 142,240 1
1Based on FAS Marketing Year Ranking Reports for 2017/18 - www.fas.usda.gov; Marketing year (MY) = Sep 1 - Aug 31.
Total Commitments2
- 1,000 mt -
3FAS Marketing Year Ranking Reports - http://apps.fas.usda.gov/export-sales/myrkaug.htm; 3-yr average
2Cumulative Exports (shipped) + Outstanding Sales (unshipped), FAS Weekly Export Sales Report, or Export Sales Query--
http://www.fas.usda.gov/esrquery/. Total commitments change (net sales) from prior week could include revisions from previous
week's outstanding sales or accumulated sales.
(n) indicates negative number.

September 27, 2018
Grain Transportation Report 15
Table 14
Top 5 Importers1 of U.S. Soybeans
For the week ending 9/13/2018 % change
Exports3
2018/19 2017/18 current MY 3-yr avg.
Current MY Last MY from last MY 2015-2017
- 1,000 mt - - 1,000 mt -
China 1,454 8,655 (83) 31,228
Mexico 2,220 1,052 111 3,716
Indonesia 636 415 53 2,250
Japan 567 566 0 2,145
Netherlands 136 0 0 2,209
Top 5 importers 5,013 10,687 (53) 41,549
Total US soybean export sales 17,932 19,332 (7) 55,113
% of Projected 32% 33%
Change from prior week2
918 2,338
Top 5 importers' share of U.S.
soybean export sales 28% 55% 75%
USDA forecast, September 2018 56,131 58,038 97
1Bas ed o n FAS Marketing Year Ranking Repo rts fo r 2017/18 - www.fas .us da .go v; Marketing year (MY) = Sep 1 - Aug 31.
3 FAS Marketing Year Fina l Repo rts - www.fas .us da .go v/expo rt-s a les /myfi_rpt.htm. (Carryo ver plus Accumula ted Expo rts )
(n) indicates negative number.
2Cumula tive Expo rts (s hipped) + Outs tanding Sales (uns hipped), FAS Weekly Expo rt Sa les Repo rt, o r Expo rt Sa les Query--
http://www.fas .us da .go v/es rquery/. The to ta l co mmitments change (ne t s a les ) fro m prio r week co uld inc lude re ivis io ns fro m previo us week's
o uts tanding s a les and/o r accumula ted s a les
Total Commitments2
Table 15
Top 10 Importers1 of All U.S. Wheat
For the week ending 9/13/2018 % change Exports3
2018/19 2017/18 current MY 3-yr avg
Current MY Last MY from last MY 2015-2017
- 1,000 mt -
Mexico 1,214 1,641 (26) 2,781
Japan 1,191 1,225 (3) 2,649
Philippines 1,601 1,559 3 2,441
Korea 851 1,026 (17) 1,257
Nigeria 470 693 (32) 1,254
Indonesia 357 611 (42) 1,076
Taiwan 508 568 (11) 1,066
China 0 532 (100) 944
Colombia 287 198 45 714
Thailand 514 440 17 618
Top 10 importers 6,992 8,493 (18) 14,800
Total US wheat export sales 10,207 13,083 (22) 22,869
% of Projected 37% 53%
Change from prior week2
468 307
Top 10 importers' share of U.S.
wheat export sales 69% 65% 65%
USDA forecast, September 2018 27,929 24,550 14
1 Based on FAS Marketing Year Ranking Reports for 2017/18 - www.fas.usda.gov; Marketing year = Jun 1 - May 31.
outstanding and/or accumulated sales
Total Commitments2
3 FAS Marketing Year Final Reports - www.fas.usda.gov/export-sales/myfi_rpt.htm.
(n) indicates negative number.
2 Cumulative Exports (shipped) + Outstanding Sales (unshipped), FAS Weekly Export Sales Report, or Export Sales Query--
http://www.fas.usda.gov/esrquery/. Total commitments change (net sales) from prior week could include revisions from the previous week's
- 1,000 mt -

September 27, 2018
Grain Transportation Report 16
The United States exports approximately one-quarter of the grain it produces. On average, this includes nearly 45 percent of U.S.-grown wheat, 50 percent of U.S.-grown soybeans, and 20 percent of the U.S.-grown corn. Approximately 55 percent of the U.S. export grain ship-ments departed through the U.S. Gulf region in 2017.
Table 16
Grain Inspections for Export by U.S. Port Region (1,000 metric tons)
For the Week Ending Previous Current Week 2018 YTD as
09/20/18 Week* as % of Previous 2017 YTD* % of 2017 YTD Last Year Prior 3-yr. avg.
Pacific Northwest
Wheat 178 282 63 9,386 11,600 81 93 81 14,805
Corn 438 235 187 15,862 10,047 158 506 141 10,928
Soybeans 0 74 0 6,400 5,690 112 116 218 13,246
Total 615 591 104 31,648 27,337 116 155 117 38,978
Mississippi Gulf
Wheat 59 85 69 2,947 3,518 84 85 56 4,198
Corn 616 563 109 25,749 23,750 108 144 118 28,690
Soybeans 680 598 114 17,819 17,977 99 75 98 32,911
Total 1,354 1,246 109 46,515 45,245 103 99 102 65,800
Texas Gulf
Wheat 72 0 n/a 2,311 5,159 45 55 37 6,354
Corn 30 25 123 621 591 105 201 53 733
Soybeans 0 0 n/a 69 0 n/a 0 0 292
Total 103 25 418 3,000 5,750 52 70 41 7,379
Interior
Wheat 43 42 104 1,193 1,425 84 128 111 1,727
Corn 129 177 73 6,343 6,516 97 70 89 8,758
Soybeans 47 80 58 4,834 3,614 134 116 187 5,508
Total 219 299 73 12,370 11,554 107 87 110 15,993
Great Lakes
Wheat 78 23 333 611 516 118 293 150 711
Corn 0 19 0 342 173 197 56 27 192
Soybeans 0 42 1 554 342 162 162 485 890
Total 78 84 94 1,507 1,031 146 194 145 1,793
Atlantic
Wheat 1 0 n/a 68 44 154 27 4 46
Corn 28 0 n/a 103 14 762 395 100 32
Soybeans 4 33 11 1,434 1,001 143 80 102 2,001
Total 33 33 99 1,606 1,059 152 114 84 2,079
U.S. total from ports*
Wheat 431 432 100 16,517 22,262 74 94 72 27,841
Corn 1,241 1,018 122 49,019 41,090 119 149 113 49,333
Soybeans 730 827 88 31,110 28,623 109 84 116 54,847
Total 2,402 2,277 105 96,646 91,975 105 108 103 132,021
*Data includes revisions from prior weeks; some regional totals may not add exactly due to rounding.
Source: Grain Inspection, Packers and Stockyards Administration/USDA (www.gipsa.usda.gov); YTD= year-to-date; n/a = not applicable
Last 4-weeks as % of:
Port Regions 2017 Total*2018 YTD*

September 27, 2018
Grain Transportation Report 17
Figure 14
U.S. grain inspected for export (wheat, corn, and soybeans)
Source: Grain Inspection, Packers and Stockyards Administration/USDA (www.gipsa.usda.gov)
Note: 3-year average consists of 4-week running average
0
20
40
60
80
100
120
140
160
180
2002/2
3/2
017
3/2
3/2
017
4/2
0/2
017
5/1
8/2
017
6/1
5/2
017
7/1
3/2
017
8/1
0/2
017
9/7
/201
7
10
/5/2
017
11
/2/2
017
11
/30/2
017
12
/28/2
017
1/2
5/2
018
2/2
2/2
018
3/2
2/2
018
4/1
9/2
018
5/1
7/2
018
6/1
4/2
018
7/1
2/2
018
8/9
/201
8
9/6
/201
8
10
/4/2
018
11
/1/2
018
11
/29/2
018
12
/27/2
018
1/2
4/2
019
Mil
lion
bu
shels
(m
bu
)
Current week 3-year average
For the week ending Sep. 20: 91.5 mbu, up 6 percent from the previous week, up 2 percent from same week last year, and up 5 percent from the 3-year average.
Figure 15
U.S. Grain Inspections: U.S. Gulf and PNW1 (wheat, corn, and soybeans)
-
10
20
30
40
50
60
70
80
90
100
2/2
/17
3/2
/17
4/2
/17
5/2
/17
6/2
/17
7/2
/17
8/2
/17
9/2
/17
10
/2/1
7
11
/2/1
7
12
/2/1
7
1/2
/18
2/2
/18
3/2
/18
4/2
/18
5/2
/18
6/2
/18
7/2
/18
8/2
/18
9/2
/18
10
/2/1
8
11
/2/1
8
12
/2/1
8
1/2
/19
Mil
lion
bu
shels
(m
bu
)
Miss. Gulf 3-Year avg - Miss. Gulf
PNW 3-Year avg - PNW
Texas Gulf 3-Year avg - TX Gulf
Source: Grain Inspection, Packers and Stockyards Administration/USDA (www.gipsa.usda.gov)
Last Week:
Last Year (same week):
3-yr avg. (4-wk. mov. Avg):
MS Gulf TX Gulf U.S. Gulf PNW
up 9
down 2
up 10
up 298
down 52
down 42
up 15
down 9
up 3
up 6
up 103
up 19
Percent change from:Week ending 09/20/18 inspections (mbu):
Mississippi Gulf:
PNW:
Texas Gulf:
51.4
23.8
3.9

September 27, 2018
Grain Transportation Report 18
Ocean Transportation
Table 17
Weekly Port Region Grain Ocean Vessel Activity (number of vessels)
Pacific
Gulf Northwest
Loaded Due next
Date In port 7-days 10-days In port
9/20/2018 29 37 61 12
9/13/2018 31 33 56 8
2017 range (25..66) (28..54) (37..87) (5..44)
2017 avg. 46 38 56 20
Source: Transportation & Marketing Programs/AMS/USDA
Figure 16
U.S. Gulf Vessel Loading Activity
0
10
20
30
40
50
60
70
05/0
3/2
018
05/1
0/2
018
05/1
7/2
018
05/2
4/2
018
05/3
1/2
018
06/0
7/2
018
06/1
4/2
018
06/2
1/2
018
06/2
8/2
018
07/0
5/2
018
07/1
2/2
018
07/1
9/2
018
07/2
6/2
018
08/0
2/2
018
08/0
9/2
018
08/1
6/2
018
08/2
3/2
018
08/3
0/2
018
09/0
6/2
018
09/1
3/2
018
09/2
0/2
018
Nu
mb
er
of
ve
ssel
s
Loaded Last 7 Days Due Next 10 days Loaded 4 Year Average
Source:Transportation & Marketing Programs/AMS/USDA1U.S. Gulf includes Mississippi, Texas, and East Gulf.
For the week ending September 20 Loaded Due Change from last year 15.6% 10.9%
Change from 4-year avg. -5.7% -0.4 %
September 27, 2018
Grain Transportation Report 19
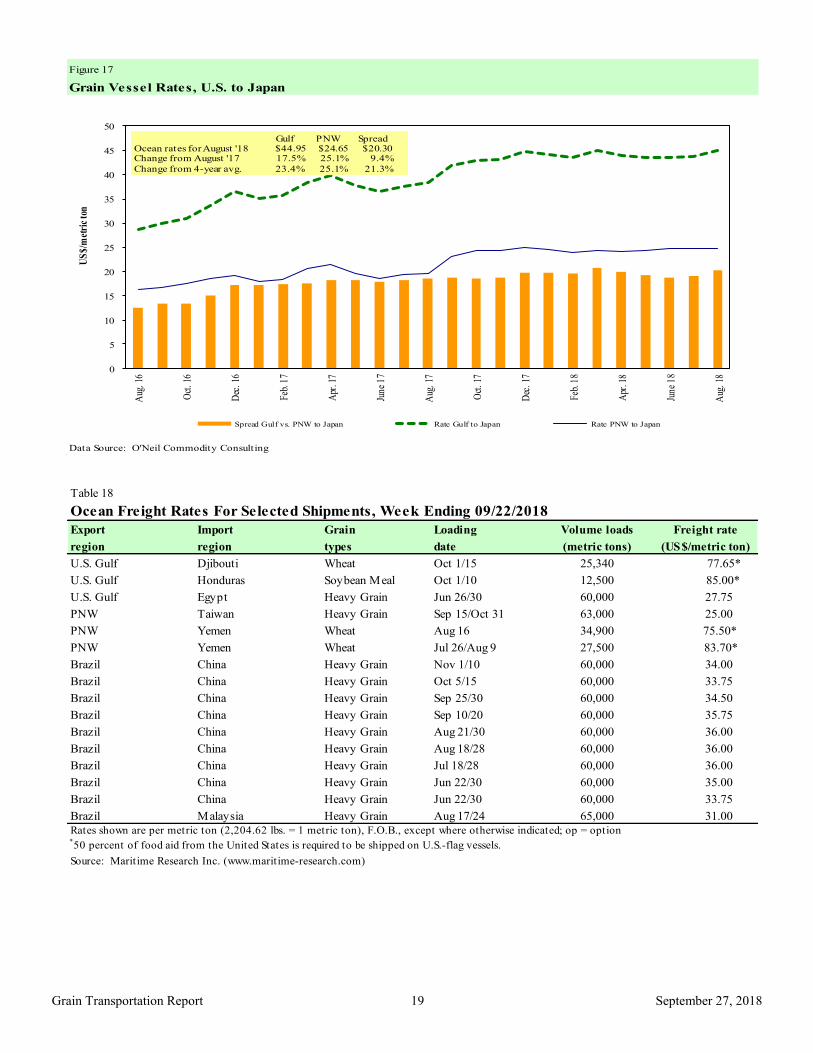
Figure 17
Grain Vessel Rates, U.S. to Japan
Data Source: O'Neil Commodity Consulting
0
5
10
15
20
25
30
35
40
45
50
Aug
. 16
Oct
. 16
Dec
. 16
Feb.
17
Apr
. 17
June
17
Aug
. 17
Oct
. 17
Dec
. 17
Feb.
18
Apr
. 18
June
18
Aug
. 18
US
$/m
etri
c to
n
Spread Gulf vs. PNW to Japan Rate Gulf to Japan Rate PNW to Japan
Gulf PNW Spread Ocean rates for August '18 $44.95 $24.65 $20.30 Change from August '17 17.5% 25.1% 9.4%
Change from 4-year avg. 23.4% 25.1% 21.3%
Table 18
Ocean Freight Rates For Selected Shipments, Week Ending 09/22/2018
Export Import Grain Loading Volume loads Freight rate
region region types date (metric tons) (US$/metric ton)
U.S. Gulf Djibouti Wheat Oct 1/15 25,340 77.65*
U.S. Gulf Honduras Soybean Meal Oct 1/10 12,500 85.00*
U.S. Gulf Egypt Heavy Grain Jun 26/30 60,000 27.75
PNW Taiwan Heavy Grain Sep 15/Oct 31 63,000 25.00
PNW Yemen Wheat Aug 16 34,900 75.50*
PNW Yemen Wheat Jul 26/Aug 9 27,500 83.70*
Brazil China Heavy Grain Nov 1/10 60,000 34.00
Brazil China Heavy Grain Oct 5/15 60,000 33.75
Brazil China Heavy Grain Sep 25/30 60,000 34.50
Brazil China Heavy Grain Sep 10/20 60,000 35.75
Brazil China Heavy Grain Aug 21/30 60,000 36.00
Brazil China Heavy Grain Aug 18/28 60,000 36.00
Brazil China Heavy Grain Jul 18/28 60,000 36.00
Brazil China Heavy Grain Jun 22/30 60,000 35.00
Brazil China Heavy Grain Jun 22/30 60,000 33.75
Brazil Malaysia Heavy Grain Aug 17/24 65,000 31.00
Rates shown are per metric ton (2,204.62 lbs. = 1 metric ton), F.O.B., except where otherwise indicated; op = option *50 percent of food aid from the United States is required to be shipped on U.S.-flag vessels.
Source: Maritime Research Inc. (www.maritime-research.com)

September 27, 2018
Grain Transportation Report 20
In 2017, containers were used to transport 7 percent of total U.S. waterborne grain exports. Approximately 62 percent of U.S. wa-terborne grain exports in 2017 went to Asia, of which 10 percent were moved in containers. Approximately 93 percent of U.S. wa-terborne containerized grain exports were destined for Asia.
Figure 18
Top 10 Destination Markets for U.S. Containerized Grain Exports, January-May 2018
Source: USDA/Agricultural Marketing Service/Transportation Services Division analysis of Port Import Export Reporting
Service (PIERS) data
Note: The following Harmonized Tariff Codes are used to calculate containerized grains movements: 100190, 100200,
100300, 100400, 100590, 100700, 110100, 230310, 110220, 110290, 120100, 230210, 230990, 230330, and 120810.
Taiwan19%
Vietnam
17%
Thailand13%
Indonesia11%
China8%
Korea7%
Japan4%
Malaysia4%
Philipplines2%
Sri Lanka2%
Other13%
Figure 19
Monthly Shipments of Containerized Grain to Asia
Source: USDA/Agricultural Marketing Service/Transportation Services Division analysis of Port Import Export Reporting Service (PIERS) data.
Note: The following Harmonized Tariff Codes are used to calculate containerized grains movements: 100190, 100200, 100300, 100400, 100590,
100700, 110100, 110220, 110290, 120100, 120810, 230210, 230310, 230330, and 230990.
0
5
10
15
20
25
30
35
40
45
50
55
60
65
70
75
80
Jan.
Feb
.
Mar
.
Apr.
May
Jun
.
Jul.
Aug
.
Sep
.
Oct
.
Nov
.
Dec
.
Th
ou
san
d
20
-ft
equ
ivale
nt
un
its
2017
2018
5-year avg
May 2018: Down 63% from last year and 68% lower than
the 5-year average

September 27, 2018
Grain Transportation Report 21
Coordinators Surajudeen (Deen) Olowolayemo [email protected] (202) 720 - 0119 Pierre Bahizi [email protected] (202) 690 - 0992 Adam Sparger [email protected] (202) 205 - 8701
Weekly Highlight Editors Surajudeen (Deen) Olowolayemo [email protected] (202) 720 - 0119 April Taylor [email protected] (202) 720 - 7880 Nicholas Marathon [email protected] (202) 690 - 4430
Grain Transportation Indicators Surajudeen (Deen) Olowolayemo [email protected] (202) 720 - 0119
Rail Transportation Adam Sparger [email protected] (202) 205 - 8701 Johnny Hill [email protected] (202) 690 - 3295 Jesse Gastelle [email protected] (202) 690 - 1144 Peter Caffarelli [email protected] (202) 690 - 3244
Barge Transportation Nicholas Marathon [email protected] (202) 690 - 4430 April Taylor [email protected] (202) 720 - 7880 Matt Chang [email protected] (202) 720 - 0299
Truck Transportation April Taylor [email protected] (202) 720 - 7880
Grain Exports Johnny Hill [email protected] (202) 690 - 3295 Ocean Transportation Surajudeen (Deen) Olowolayemo [email protected] (202) 720 - 0119 (Freight rates and vessels) April Taylor [email protected] (202) 720 - 7880 (Container movements)
Subscription Information: Send relevant information to [email protected] for an electronic copy (printed copies are also available upon request).
Preferred citation: U.S. Dept. of Agriculture, Agricultural Marketing Service. Grain Transportation Report. September 27, 2018. Web: http://dx.doi.org/10.9752/TS056.09-27-2018
Contacts and Links
In accordance with Federal civil rights law and U.S. Department of Agriculture (USDA) civil rights regulations and policies, the USDA, its Agencies, offices, and employees, and institutions participating in or administering USDA programs are prohibited from discriminating based on race, color, national origin, religion, sex, gender identity (including gender expression), sexual orientation, disability, age, marital status, family/parental status, income derived from a public assistance program, political beliefs, or reprisal or retaliation for prior civil rights activity, in any program or activity conducted or funded by USDA (not all bases apply to all programs). Remedies and complaint filing deadlines vary by pro-gram or incident. Persons with disabilities who require alternative means of communication for program information (e.g., Braille, large print, audiotape, American Sign Language, etc.) should contact the responsible Agency or USDA's TARGET Center at (202) 720-2600 (voice and TTY) or contact USDA through the Federal Relay Service at (800) 877-8339. Additionally, program information may be made available in languages other than English. To file a program discrimination complaint, complete the USDA Program Discrimination Complaint Form, AD-3027, found online at How to File a Program Discrimination Complaint and at any USDA office or write a letter addressed to USDA and provide in the letter all of the infor-mation requested in the form. To request a copy of the complaint form, call (866) 632-9992. Submit your completed form or letter to USDA by: (1) mail: U.S. Department of Agriculture, Office of the Assistant Secretary for Civil Rights, 1400 Independence Avenue, SW, Washington, D.C. 20250-9410; (2) fax: (202) 690-7442; or (3) email: [email protected]. USDA is an equal opportunity provider, employer, and lender.