For the quarter ended March 31, 2019
45
1 May 14, 2019 IIFL Holdings Limited (with group companies) For the quarter ended March 31, 2019 Bloomberg: IIFL IN
Transcript of For the quarter ended March 31, 2019

1
May 14, 2019
IIFL Holdings Limited
(with group companies)
For the quarter ended March 31, 2019
Bloomberg: IIFL IN

2
Index
I: IIFL Group Performance Overview
(i) IIFL Finance
(ii) IIFL Wealth
(iii) IIFL Securities
3
8
32
36
23
II: Ownership, Management and Governance
41
30

3
IIFL Group – Structure and Ownership Simplified structure – Three businesses to be separately listed
(Publicly listed)
84.5% 53.3% 100.0%
Products
Home loans, Business loans,
Gold loans, Microfinance,
Developer & Construction
finance, Capital Market finance
Products
Family office, AIFs, advisory
and distribution services
Products
Retail and institutional broking,
investment banking
Loan AUM
₹ 34,904 Cr of largely retail
diversified asset portfolio
Financials FY19
Income: ₹ 2,603.2 Cr
PAT: ₹ 717.4 Cr
Wealth AUM
₹ 1,69,312 Cr from 10,000+
high networth families
Financials FY19
Income: ₹ 1,059.2 Cr
PAT: ₹ 384.0 Cr
Customers and network
24 Lakh customers serviced
from 1,400+ locations
Financials FY19
Income: ₹ 761.6 Cr
PAT: ₹ 171.1 Cr
Promoters: 29.0%
Fairfax: 35.4%
Others: 35.8%(i)
Note:
(i) ‘Others’ includes Employees and Public shareholders
IIFL Wealth and IIFL Securities have been demerged. Record date will be announced soon
IIFL Holdings to be renamed to IIFL Finance post merger

4
IIFL Group – Proforma results at a glance Year ended March 2019
₹ Cr
Income
Y-o-Y
(%)
Profit
Before
Tax
Y-o-Y
(%)
Profit
After
Tax
Y-o-Y
(%)
IIFL Finance 2,603.2 39% 1,052.9 53% 717.4 55%
IIFL Finance excl
exceptional items 2,603.2 39% 948.1 38% 633.0 36%
IIFL Wealth 1,059.2 - 537.4 12% 384.0 4%
IIFL Securities 761.6 (7%) 255.2 (10%) 171.1 (8%)
Other Adjustments (119.5) (17.5) (19.6)
IIFL Consolidated 4,304.5 16% 1,828.0 26% 1,252.9 23%
Minority Interest - - - - 288.2 28%
IIFL Consolidated
(post minority) 4,304.5 16% 1,828.0 26% 964.7 22%
Key highlights of the period
Continuing business
Loan AUM growth at
29%
ROE stands at 18.3%
and ROA at 2.2% for
FY19
Wealth assets grew
28% y-o-y to
`1,69,312 Cr
Consolidated ROE is at
17.5% and
ROA is at 2.2%
Notes: (i) Income is net of interest expense
Excluding gain from
slump sale of CV
business
Lower capital market
volumes

5
` Cr Q4FY19 Q4FY18 Y-o-Y FY19 FY18 Y-o-Y
Revenue from Operations 1,940.9 1,673.8 16% 7,235.8 6,271.7 15%
Other income 57.0 (8.7) 755% 178.6 147.0 21%
Total Income 1,997.9 1,665.1 20% 7,414.4 6,418.7 16%
Employee cost 329.2 309.4 6% 1,270.3 1,056.9 20%
Administration and other expenses 381.5 238.1 60% 1,110.6 1,127.7 (2%)
EBITDA 1,287.2 1,117.6 15% 5,033.5 4,234.1 19%
Interest costs 722.2 700.5 3% 3,109.9 2,722.0 14%
Depreciation and amortization 29.8 18.7 59% 95.6 67.0 43%
Profit before tax 535.2 398.4 34% 1,828.0 1,445.1 26%
Provision for taxation 156.8 118.9 32% 575.4 422.7 36%
Profit after tax 378.4 279.5 35% 1,252.6 1,022.4 23%
Other comprehensive income (5.4) 6.6 0.3 (4.6)
Total Comprehensive Income/ (loss) 373.0 286.1 30% 1,252.9 1,017.8 23%
Total Comprehensive Income/ (loss) attributable to
Owners of the company 294.9 233.5 26% 964.7 793.1 22%
Non - Controlling Interest 78.1 52.6 48% 288.2 224.7 28%
IIFL Group – Consolidated results (Proforma) Quarter ended March 2019
Note: Previous periods figures have been regrouped / rearranged wherever necessary

6
2.0%
2.6% 2.4% 2.4% 2.4%
2.2%
FY14 FY15 FY16 FY17 FY18 FY19
9.4
14.8 16.3
21.6
28.6
37.0
FY14 FY15 FY16 FY17 FY18 FY19
73 82 106
138 159
181
FY14 FY15 FY16 FY17 FY18 FY19
13.5%
19.0% 17.3% 17.7%
19.3% 17.5%
FY14 FY15 FY16 FY17 FY18 FY19
278 447 511
686 793
965
FY14 FY15 FY16 FY17 FY18 FY19
2,152 2,558 3,352
4,381 5,066
5,953
FY14 FY15 FY16 FY17 FY18 FY19
Notes :
• Profit is post-minority
• FY18 & FY19 numbers are as per IND AS. Previous years’ numbers are as per IGAAP
• Despite strong profit growth, ROE is lower because of capital infusion in IIFL Wealth in mid FY19
Return on Assets (%)
Profit after tax (` Cr)
Net-worth (` Cr)
Return on Equity (%)
Book Value Per Share (`)
Earnings Per Share (`)
IIFL Group – Consolidated financial trends (Proforma) Proforma results show performance of listed company as on March 2019

7
I: IIFL Group Performance Overview
(i) IIFL Finance
(ii) IIFL Wealth
(iii) IIFL Securities
II: Ownership, Management and Governance

8
Top-tier NBFC in India
Unique advantages of IIFL Finance
₹ 34,904 Cr
Assets under Management
Company snapshot
85% Retail
15% Wholesale
16.0% / 19.2%
Tier 1 / Total Capital Adequacy
1,947
Branches
1.95% / 0.62%
Gross NPAs / Net NPAs
2.2%
Return on Assets
and 18.3% Return on Equity
139%
Provisioning of GNPA
16,779
Employees
• Focus on small-ticket retail loans leading to low delinquencies
• Loan book with a track record of consistent superior quality
Granular and diversified asset portfolio
• Widest physical network with brand visibility and connect with the customer
• One-stop shop for financial products facilitating capture of maximum share of customer wallet
Vast physical network with a large presence in Tier-2 /Tier-3 locations
• Leveraged technology to streamline processes, reduce turnaround times and provide operating leverage
• Data driven analytical models have helped manage delinquencies
Pioneer in adoption of end-to-end digitization across processes
• Additionally, c.85% of portfolio is readily saleable to banks, providing ability to assign and generate liquidity
Access to diverse sources of funding and demonstrated support from existing marquee investors
9
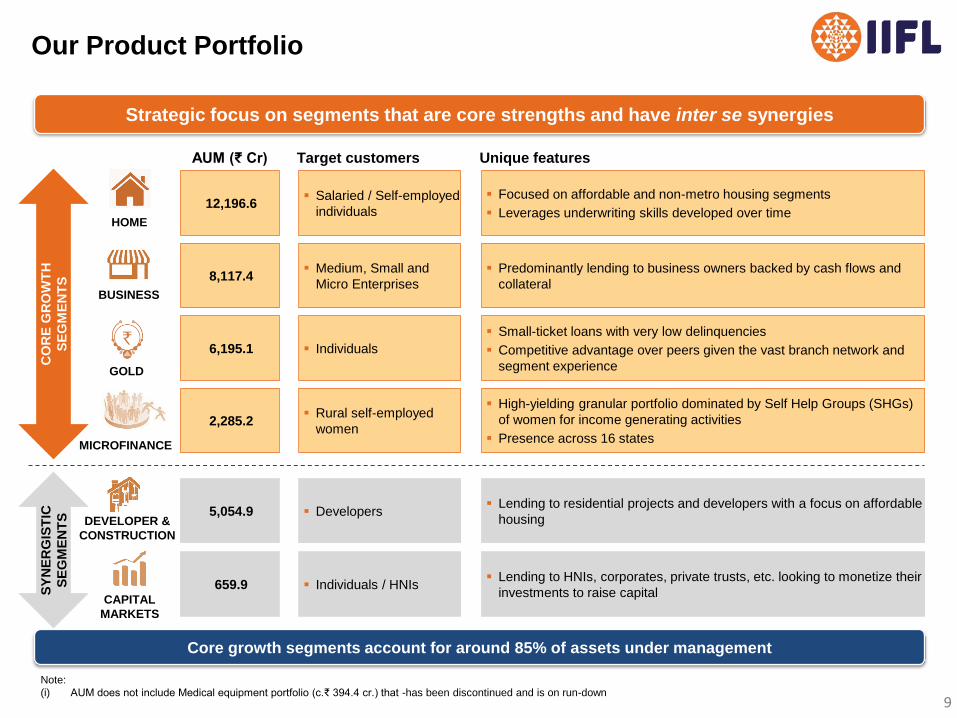
Our Product Portfolio
HOME
BUSINESS
GOLD
MICROFINANCE
CAPITAL
MARKETS
DEVELOPER &
CONSTRUCTION
AUM (₹ Cr) Target customers
12,196.6 Salaried / Self-employed
individuals
Focused on affordable and non-metro housing segments
Leverages underwriting skills developed over time
Unique features
Note:
(i) AUM does not include Medical equipment portfolio (c.₹ 394.4 cr.) that -has been discontinued and is on run-down
Core growth segments account for around 85% of assets under management
8,117.4 Medium, Small and
Micro Enterprises
Predominantly lending to business owners backed by cash flows and
collateral
6,195.1 Individuals
Small-ticket loans with very low delinquencies
Competitive advantage over peers given the vast branch network and
segment experience
5,054.9 Developers Lending to residential projects and developers with a focus on affordable
housing
2,285.2 Rural self-employed
women
High-yielding granular portfolio dominated by Self Help Groups (SHGs)
of women for income generating activities
Presence across 16 states
659.9 Individuals / HNIs Lending to HNIs, corporates, private trusts, etc. looking to monetize their
investments to raise capital
CO
RE
GR
OW
TH
SE
GM
EN
TS
SY
NE
RG
IST
IC
SE
GM
EN
TS
Strategic focus on segments that are core strengths and have inter se synergies

10
Granular and diversified asset portfolio
Focus on small-ticket retail loans leading to low delinquencies
Split of AUM (as on 31 Mar 2019)
Well-diversified across product segments and geographic regions
Home, 35%
Business, 23%
Gold, 18%
Microfinance, 7%
Developer & Construction
, 15%
Capital markets, 2%
State-wise AUM composition (as on 31 Mar 2019)
Mumbai, 15%
Delhi, 13%
Rest of Maharashtra + Goa, 11%
Gujarat, 11%
Andhra Pradesh, 9%
Karnataka, 6%
Uttar Pradesh, 6%
Madhya Pradesh, 5%
Others, 23%
Home Loans
Business Loans
Gold Loans
Developer and Construction
Microfinance Capital Markets
-1.0%
0.0%
1.0%
2.0%
3.0%
4.0%
5.0%
-10 0 10 20 30 40 50 60 70
GNPAs (%)
Average Ticket Size (₹ lacs)
Note:
(i) Does not include Medical equipment portfolio (c.₹ 394.4 cr.) that has been discontinued and is on run-down
Size of bubble indicates AUM
sheetal.pawar
Highlight
sheetal.pawar
Highlight
sheetal.pawar
Highlight

11
Vast physical network spread across the country
35%
15% 11%
39% South North
East West
c.85% of branches are in Tier 2 and Tier 3 locations
Wide spread network across 25 states and over 600 locations
191
1,161
1,947
Mar'11 Mar'15 Mar'19
Regional split of branches
Branches are strategically located in business districts in small towns/cities offering a significant opportunity for IIFL Finance to
capture the credit market in these locations
Number of branches

12
Ability to leverage physical presence and cross-sell
HOME LOAN 197k BUSINESS LOAN
440k FIXED DEPOSIT
MUTUAL FUND
CURRENCIES
COMMODITIES
DERIVATIVES FINANCIAL PLANNING
₹
EQUITIES
LIFE INSURANCE
HEALTH INSURANCE GOLD LOAN 24 lacs
MFI 10 lacs
One stop shop for retail customers, building relationship for Life
Under penetration of financial products in Tier 2 and 3
locations
Fee income generation by being distribution partner for
investment and insurance products
In-house expertise to capture the cross-sell opportunity
Branch set-up necessary for gold loans to store pledged gold
Gold loan being a core product in physical branches pays off
for most fixed overheads, enabling additional products to be
launched at minimal cost
Benefit from operating leverage
13
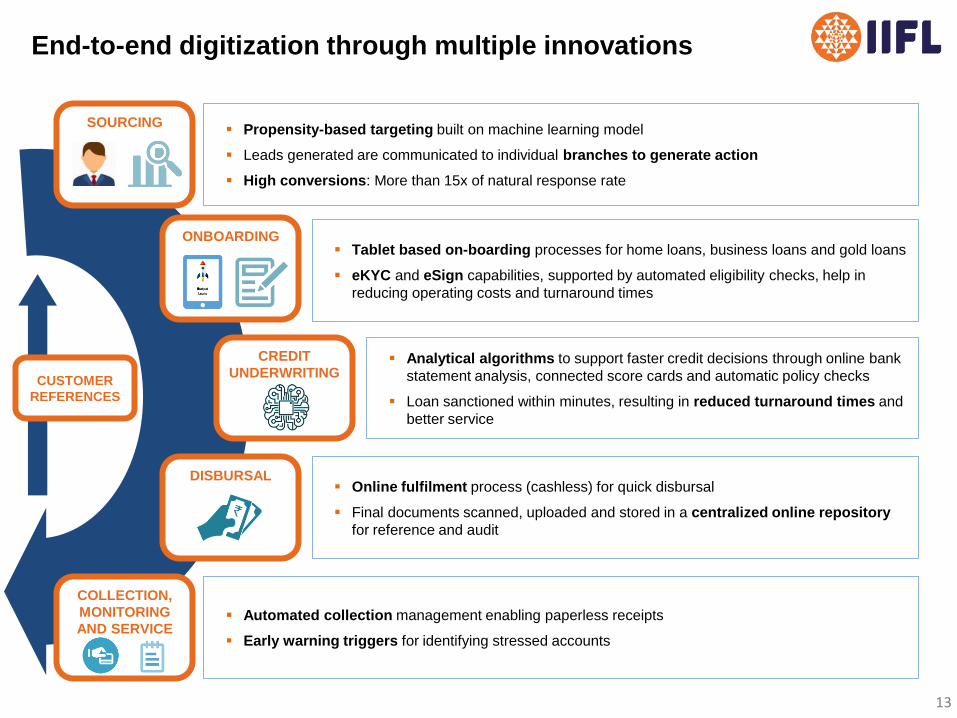
End-to-end digitization through multiple innovations
SOURCING
ONBOARDING
CREDIT
UNDERWRITING
DISBURSAL
COLLECTION,
MONITORING
AND SERVICE
Propensity-based targeting built on machine learning model
Leads generated are communicated to individual branches to generate action
High conversions: More than 15x of natural response rate
Tablet based on-boarding processes for home loans, business loans and gold loans
eKYC and eSign capabilities, supported by automated eligibility checks, help in
reducing operating costs and turnaround times
Analytical algorithms to support faster credit decisions through online bank
statement analysis, connected score cards and automatic policy checks
Loan sanctioned within minutes, resulting in reduced turnaround times and
better service
Online fulfilment process (cashless) for quick disbursal
Final documents scanned, uploaded and stored in a centralized online repository
for reference and audit
Automated collection management enabling paperless receipts
Early warning triggers for identifying stressed accounts
CUSTOMER
REFERENCES

14
₹ Cr Q4FY19 Q4FY18 Y-o-Y FY19 FY18 Y-oY
Loan book 26,575 23,388 14% 26,575 23,388 14%
Securitization / Assignment 8,329 3,774 121% 8,329 3,774 121%
Assets under management 34,904 27,162 29% 34,904 27,162 29%
CV Divested 4,066 4,066
Assets under management incl. CV 34,904 31,228 12% 34,904 31,228 12%
Interest income 1,323.0 981.2 35% 4,785.7 3,682.3 30%
Less: Interest expense 629.5 544.0 16% 2,585.7 2,088.0 24%
Net Interest income 693.5 437.2 59% 2,200.0 1,594.3 38%
Other income 72.9 55.0 33% 298.4 276.4 8%
Exceptional Item 104.6 104.6
Total income 871.0 492.2 77% 2,603.0 1,870.7 39%
Less: Operating expense 344.5 230.3 50% 1,171.2 747.2 57%
Less: Loan losses & provision 177.4 42.8 314% 379.1 436.9 (13%)
Profit before tax (PBT) 349.5 219.1 60% 1,052.7 686.6 53%
PBT (excl. exceptional items) 244.9 219.1 12% 948.1 686.6 38%
Less: Provision for tax 90.5 69.4 30% 325.3 221.9 47%
Profit after tax (PAT) 259.0 149.7 73% 727.4 464.7 57%
PAT (excl. exceptional items) 175.3 149.7 17% 643.7 464.7 39%
OCI (6.6) 0.2 (10.2) (1.5)
Total Comprehensive Income 252.4 149.9 68% 717.4 463.2 55%
Total Comprehensive Income (excl.
exceptional items) 168.7 149.9 13%
633.5 463.2 37%
IIFL Finance – Consolidated results (as per IND AS) Quarter ended March 2019 (NBFC, HFC and MFI)
Exceptional item includes gain on slump sale of CV business (₹94 Cr net of tax) and goodwill write off (Rs10.7 Cr)

15
210
301 339
423 463
717
FY14 FY15 FY16 FY17 FY18 FY19
11,562 16,176
19,514 22,281
31,228 34,904
FY14 FY15 FY16 FY17 FY18 FY19
Achieving volume & profit growth with superior asset mix Quarter ended March 2019
Notes
• Business Loan includes SME, LAP, Healthcare equipment and Digital finance
• FY18 & FY19 numbers are as per IND AS. Previous years’ numbers are as per IGAAP
• #AUM excluding divested Commercial Vehicle business
Profit After Tax (₹ Cr)
● Focus getting sharper on
small ticket retail loans,
dispersing risk with
granular assets
● Affordable home loans,
small business loans,
gold loans and micro
loans for income
generating activities are
core growth drivers
● Developer & Construction
finance, LAP and Capital
Markets will see their
share falling in total
portfolio
● Commercial Vehicle
business was divested as
a going concern as at
March 31, 2019
Home Loan, 35%
Business Loan, 24%
Gold Loan, 18%
Developer &
Construction
Finance, 14%
Micro-finance,
7%
Capital Market
Finance, 2%
AUM break-up (%) Loan AUM (₹ Cr) FY19 FY18 Y-o-Y
Home Loan 8,362 7,493 12%
Business Loan 6,868 7,127 (4%)
Developer &
Construction Finance 5,032 4,513 12%
Gold Loan 4,594 4,037 14%
Capital Market Finance 659.9 1,063 (38%)
Microfinance 2,010 824 144%
Total Loan Book 27,525 25,057 14%
Off Book Assets 7.379 2,105 121%
Total AUM# 34,904 27,162 29%
AUM (₹ Cr)
sheetal.pawar
Highlight

16
Increasing diversification across products and customers
Diversified portfolio disperses exposure and balances cyclical vagaries
9%
91%
24.0% 76.0
%
Exposure to 20 largestborrowers
Others
Limited concentration of exposure to large borrowers
AUM split on 31 Mar 2019
Business mix shifting towards a diversified mix of superior quality retail assets
54%
30% 26% 28% 24%
36%
13% 16% 5% 2%
6%
3% 5% 25% 35%
4%
44%
25% 13%
18%
10%
20% 14%
14%
1% 8%
14% 1% 7%
FY11 FY13 FY15 FY17 FY19
AUM(i)
(₹ Cr) 3,289 9,867 16,176 22,281 34,904
Commercial vehicle finance
Microfinance
Developer & Construction
Gold loans
Home loans
Capital markets finance
Business loans
Note:
(i) Does not include Medical equipment portfolio (c.₹ 394.4 cr.) that -has been discontinued and is on run-down

17
0.86% 1.27% 1.44%
1.82% 1.71% 1.95%
FY14 FY15 FY16 FY17 FY18 FY19
0.33% 0.54% 0.54% 0.58%
0.68% 0.62%
FY14 FY15 FY16 FY17 FY18 FY19
Through cycles, maintaining superior quality of assets Provisioning of GNPA at 139%
Gross NPA (%)
● GNPA stood at 1.9%
and NNPA at 0.6%
● Under Ind AS, provision
coverage (incl. standard
assets provision) on
NPAs stands at 139%
● 85% of our loans are
retail in nature and 41%
are PSL compliant
150
DPD
180
DPD
120
DPD
Net NPA (%)
%
Portfolio
Share
ECL
Coverage
(%)
NNPA% Yield %
Average
Ticket
Size LTV %
(`Lakh)
Home Loan 35% 50% 0.7% 10.3% 18.0 69%
Developer & Construction
Finance 14% 192% 0.0% 17.1% 2,120.0 49%
Gold 18% 162% 0.1% 18.1% 0.6 69%
Capital Market 2% 101% 0.0% 12.3% 143.0 41%
Business Loans 24% 107% 1.5% 15.7% 22.0 50%
Micro-finance 7% 270% 0.1% 20.3% 0.2 -
Total 100% 139% 0.6% 14.7%
Note : FY18 & FY19 numbers are as per IND AS. Previous years’ numbers are as per IGAAP
90
DPD
150
DPD
180
DPD
120
DPD
90
DPD
90
DPD
90
DPD

18
Stable asset quality across products
Credit quality has been steady across key product segments, with gross NPA c.2% or lower
1.2% 1.0% 0.7% 0.8% 0.8%
FY15 FY16 FY17 FY18 FY19
Home loans
2.7%
2.0%
2.7% 2.2%
3.1%
FY15 FY16 FY17 FY18 FY19
Th
ou
san
ds
Business loans
0.8% 0.6% 0.4% 0.3% 0.2%
FY15 FY16 FY17 FY18 FY19
Th
ou
sa
nd
s
Gold loans
0.4% 0.6% 0.7%
2.4%
4.4%
FY15 FY16 FY17 FY18 FY19
Th
ou
sa
nd
s
Developer & Construction finance
0.9%
2.6%
4.9%
0.0%
1.5%
FY15 FY16 FY17 FY18 FY19
Th
ou
sa
nd
s
Capital markets finance
0.5% 0.2%
0.5% 0.8%
0.4%
FY15 FY16 FY17 FY18 FY19
Microfinance
Gross NPAs (%) Gross NPAs (%) Gross NPAs (%)
Gross NPAs (%) Gross NPAs (%) Gross NPAs (%)
Core growth segments Synergistic segments
Note:
(i) Gross NPAs for FY19 are as per IndAS (include securitized assets); other numbers are as per IGAAP
19
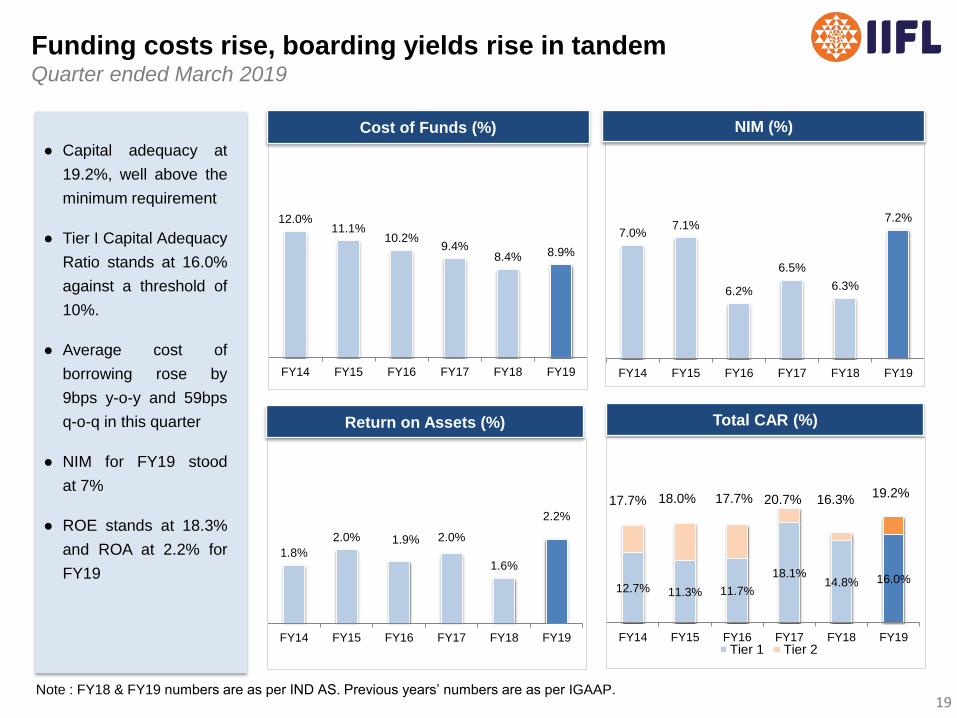
1.8%
2.0% 1.9% 2.0%
1.6%
2.2%
FY14 FY15 FY16 FY17 FY18 FY19
12.7% 11.3% 11.7%
18.1% 14.8% 16.0%
FY14 FY15 FY16 FY17 FY18 FY19Tier 1 Tier 2
7.0% 7.1%
6.2%
6.5%
6.3%
7.2%
FY14 FY15 FY16 FY17 FY18 FY19
12.0% 11.1%
10.2% 9.4%
8.4% 8.9%
FY14 FY15 FY16 FY17 FY18 FY19
● Capital adequacy at
19.2%, well above the
minimum requirement
● Tier I Capital Adequacy
Ratio stands at 16.0%
against a threshold of
10%.
● Average cost of
borrowing rose by
9bps y-o-y and 59bps
q-o-q in this quarter
● NIM for FY19 stood
at 7%
● ROE stands at 18.3%
and ROA at 2.2% for
FY19
Funding costs rise, boarding yields rise in tandem Quarter ended March 2019
Note : FY18 & FY19 numbers are as per IND AS. Previous years’ numbers are as per IGAAP.
17.7% 17.7% 20.7% 16.3% 19.2% 18.0%
Cost of Funds (%) NIM (%)
Total CAR (%) Return on Assets (%)
20
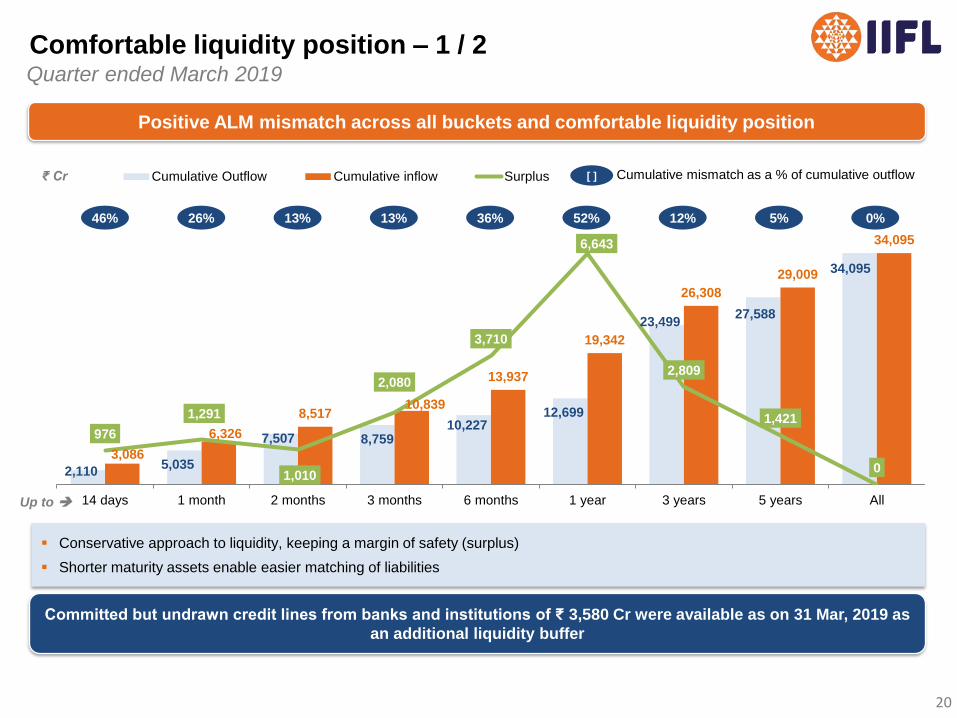
Quarter ended March 2019
Comfortable liquidity position – 1 / 2
Positive ALM mismatch across all buckets and comfortable liquidity position
2,110 5,035
7,507 8,759 10,227
12,699
23,499 27,588
34,095
3,086
6,326
8,517 10,839
13,937
19,342
26,308
29,009
34,095
976
1,291
1,010
2,080
3,710
6,643
2,809
1,421
0
14 days 1 month 2 months 3 months 6 months 1 year 3 years 5 years All
Cumulative Outflow Cumulative inflow Surplus
46% 13%
₹ Cr
26% 13% 52% 36% 12% 0% 5%
[ ] Cumulative mismatch as a % of cumulative outflow
Up to
Committed but undrawn credit lines from banks and institutions of ₹ 3,580 Cr were available as on 31 Mar, 2019 as
an additional liquidity buffer
Conservative approach to liquidity, keeping a margin of safety (surplus)
Shorter maturity assets enable easier matching of liabilities

21
Quarter ended March 2019
Comfortable liquidity position – 2 / 2
Raised long term funding in H2FY19 despite sector-wide liquidity crunch
Type of debt raised (₹ Cr) Q1FY19 Q2FY19 Q3FY19 Q4FY19
Long term (NCDs + Term loans / Refinance) 3,428 3,734 2,122 1,939
Securitization/ Direct assignment 2,273 1,403 5,321 2,562
Total 5,701 5,137 7,443 4,501
4.7%
11.6%
4.8%
14.1%
8.1% 8.1%
1.4%
7.6%
5.1% 5.9% 6.0% 5.8% 6.1% 6.3% 6.2% 6.5%
8.8% 8.5% 8.4% 8.6% 8.6% 8.7% 9.0% 9.1%
Q1FY18 Q2FY18 Q3FY18 Q4FY18 Q1FY19 Q2FY19 Q3FY19 Q4FY19
AUM growth (QoQ) Spread (%) Cost of Funds (%)
Note :
(i) Growth of AUM excluding CV portfolio
(i)
Recent increase in Spread reflects ability to pass on increase in Cost of Funds to retail customers
(i)
22
Quarter ended March 2019
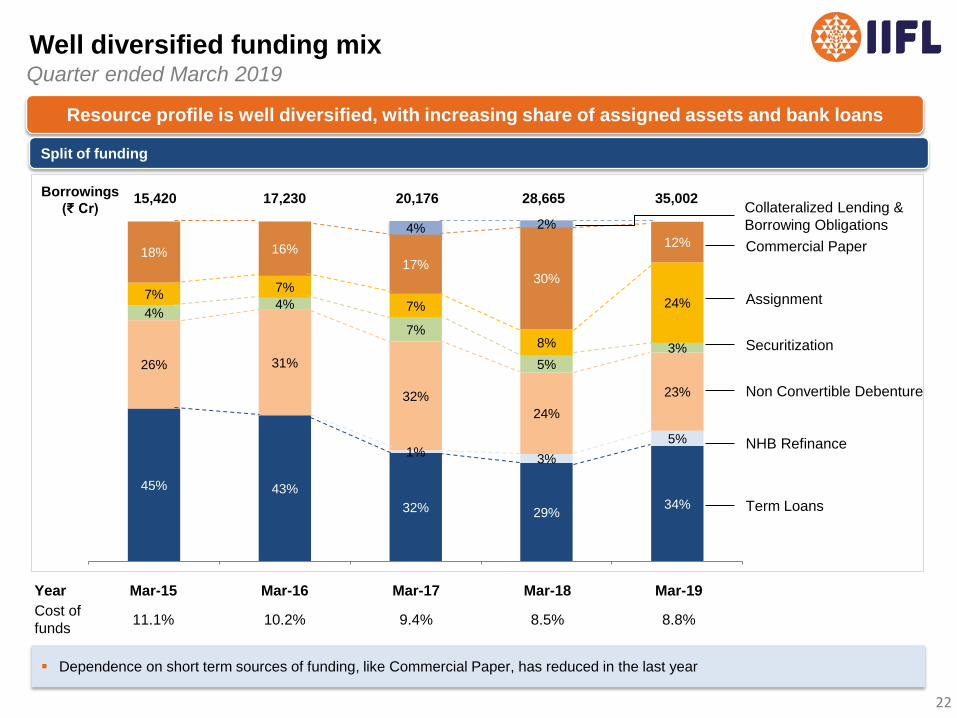
Well diversified funding mix
Resource profile is well diversified, with increasing share of assigned assets and bank loans
45% 43%
32% 29% 34%
1% 3%
5%
26% 31%
32%
24%
23%
4% 4%
7%
5%
3%
7% 7%
7%
8%
24%
18% 16%
17% 30%
12% 4% 2%
Split of funding
Year Mar-15 Mar-16 Mar-17 Mar-18 Mar-19
Cost of
funds 11.1% 10.2% 9.4% 8.5% 8.8%
Borrowings
(₹ Cr) 15,420 17,230 20,176 28,665 35,002
Dependence on short term sources of funding, like Commercial Paper, has reduced in the last year
Collateralized Lending &
Borrowing Obligations
Commercial Paper
Assignment
Securitization
NHB Refinance
Term Loans
Non Convertible Debenture

23
Execute
Oversee
Empower
Scope
Risk Strategy & Advisory
on Risk Appetite
Approve large-ticket
cases
Risk policies
Controls & Review
Organizational
communications
Policy implementation
Risk monitoring &
reporting
Check
Board of directors
Risk
Committee
Credit Underwriting
Fraud Control Unit Business Functions
Internal Audit Department + Risk Analytics
Authority
Strong risk management framework under the Board’s
direct supervision
7
Multi-level risk governance for efficient monitoring and control of product and entity level risks
Board Credit
Committee
Information
Security
Asset Liability
Committee
Audit
Committee
Environment, Social &
Governance
Independent reviews
Reporting to Board
Committees
Credit Policy
Committee
Operational Risk
Committee Compliance
Process definition
Policy formulation Formulate
CRO CCO
24
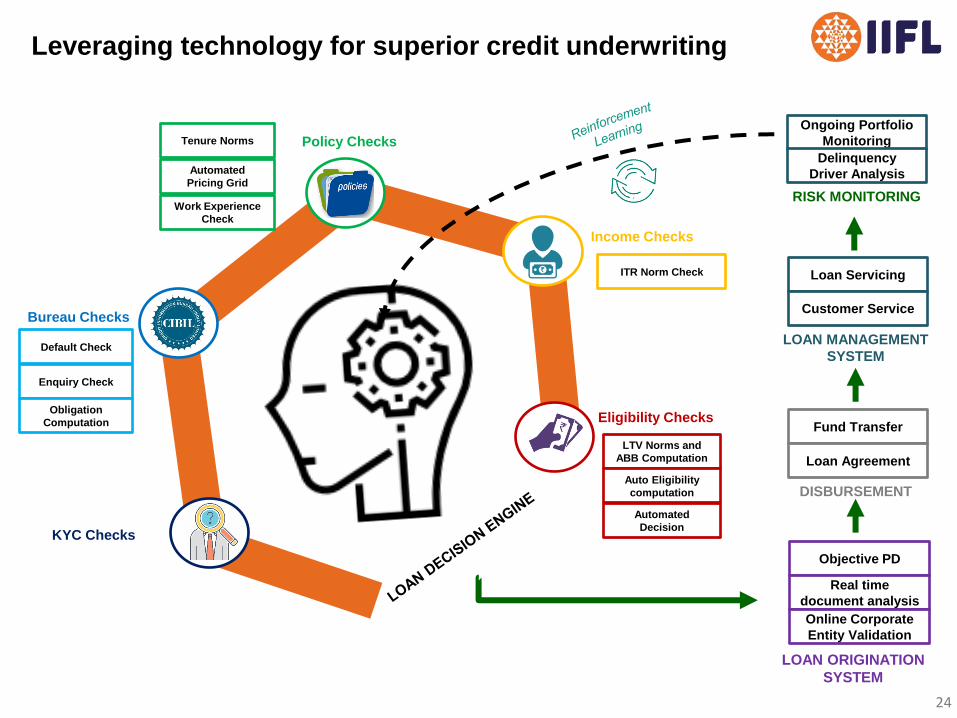
Leveraging technology for superior credit underwriting
KYC Checks
Bureau Checks
Policy Checks
Income Checks
Eligibility Checks
Default Check
Enquiry Check
Obligation
Computation
Work Experience
Check
Tenure Norms
Automated
Pricing Grid
ITR Norm Check
LTV Norms and
ABB Computation
Auto Eligibility
computation
Automated
Decision
Objective PD
Real time
document analysis
Online Corporate
Entity Validation
Loan Servicing
Customer Service
Fund Transfer
Loan Agreement
LOAN ORIGINATION
SYSTEM
LOAN MANAGEMENT
SYSTEM
DISBURSEMENT
Ongoing Portfolio
Monitoring
Delinquency
Driver Analysis
RISK MONITORING
25
IIFL Finance - Developer and Construction Finance
additional Information
26
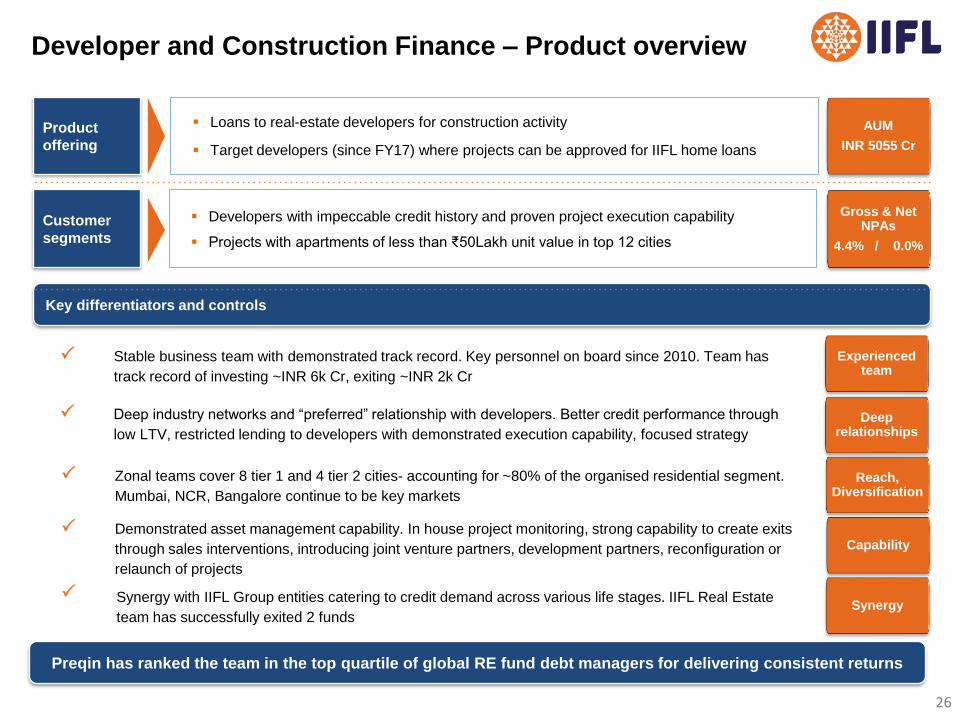
Developer and Construction Finance – Product overview
AUM
INR 5055 Cr
Gross & Net NPAs
4.4% / 0.0%
Key differentiators and controls
Product
offering
Loans to real-estate developers for construction activity
Target developers (since FY17) where projects can be approved for IIFL home loans
Customer
segments
Developers with impeccable credit history and proven project execution capability
Projects with apartments of less than ₹50Lakh unit value in top 12 cities
Stable business team with demonstrated track record. Key personnel on board since 2010. Team has
track record of investing ~INR 6k Cr, exiting ~INR 2k Cr
Synergy with IIFL Group entities catering to credit demand across various life stages. IIFL Real Estate
team has successfully exited 2 funds
Experienced team
Deep relationships
Deep industry networks and “preferred” relationship with developers. Better credit performance through
low LTV, restricted lending to developers with demonstrated execution capability, focused strategy
Reach, Diversification
Zonal teams cover 8 tier 1 and 4 tier 2 cities- accounting for ~80% of the organised residential segment.
Mumbai, NCR, Bangalore continue to be key markets
Capability
Demonstrated asset management capability. In house project monitoring, strong capability to create exits
through sales interventions, introducing joint venture partners, development partners, reconfiguration or
relaunch of projects
Synergy
Preqin has ranked the team in the top quartile of global RE fund debt managers for delivering consistent returns
27
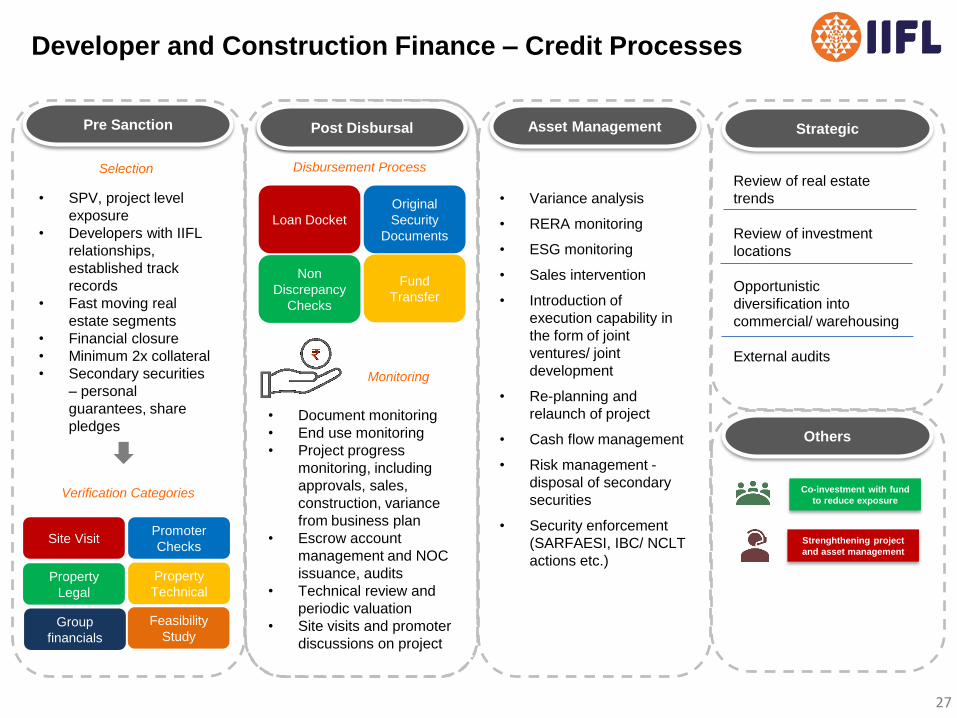
Developer and Construction Finance – Credit Processes
Sanction Loan Amount
Pre Sanction
• SPV, project level
exposure
• Developers with IIFL
relationships,
established track
records
• Fast moving real
estate segments
• Financial closure
• Minimum 2x collateral
• Secondary securities
– personal
guarantees, share
pledges
Selection
Site Visit Promoter
Checks
Verification Categories
Property
Legal
Property
Technical
Feasibility
Study Group
financials
Post Disbursal
Loan Docket
Original
Security
Documents
Non
Discrepancy
Checks
Fund
Transfer
Disbursement Process
• Document monitoring
• End use monitoring
• Project progress
monitoring, including
approvals, sales,
construction, variance
from business plan
• Escrow account
management and NOC
issuance, audits
• Technical review and
periodic valuation
• Site visits and promoter
discussions on project
Monitoring
Strategic
Co-investment with fund
to reduce exposure
Strenghthening project
and asset management
Others
Asset Management
• Variance analysis
• RERA monitoring
• ESG monitoring
• Sales intervention
• Introduction of
execution capability in
the form of joint
ventures/ joint
development
• Re-planning and
relaunch of project
• Cash flow management
• Risk management -
disposal of secondary
securities
• Security enforcement
(SARFAESI, IBC/ NCLT
actions etc.)
Review of real estate
trends
Review of investment
locations
Opportunistic
diversification into
commercial/ warehousing
External audits

28
IIFL Finance – Developer and Construction Finance Portfolio Quarter ended March 2019
Geographical Spread
Zonal Distribution of which
Nort
h (
30
%)
27% Delhi NCR
New Delhi 7%
Gurgaon, Faridabad 47%
Indirapuram, Noida, Greater Noida, Ghaziabad 46%
3% North-Tier II Jaipur, Chandigarh, Ludhiana, Lucknow, Sonepat
West 5
1%
43% Mumbai
Palghar, Virar, Boisar, Borivali, Dahisar 21%
Malad, Jogeshwari 17%
Ghatkopar, Kanjur Marg, Thane 18%
Navi Mumbai, Kalyan, Badlapur 1%
Andheri, Vile Parle, Santacruz, Khar, Bandra 29%
Chembur, Sion, Govandi 12%
Dadar, Parel (E) 2%
7% Pune
1% West-Tier II Ahmedabad, Indore, Bhopal
So
uth
19
%
16% Bangalore
2% Chennai
1% South-Tier II Hyderabad, Vizag
100% Total

29
IIFL Finance – led by an independent and illustrious Board…
V. K. Chopra, Chairman
Chartered Accountant and Former
Whole-Time Member, SEBI
Former Chairman & MD - Corporation
Bank and SIDBI
Nirmal Jain, Whole-time Director
MBA from IIM Ahmedabad, rank-holder
CA and Cost Accountant. Worked with
Unilever for 5 years
Founded and led IIFL since 1995
R Venkataraman, Whole-time Director
MBA from IIM Bangalore, B-Tech from
IIT Kharagpur
Worked with ICICI Bank, Barclays, GE
Capital
Co-founder of IIFL
Geeta Mathur, Independent Director
Co-chair for the India Chapter of Women Corporate
Directors Foundation
Chartered Accountant with over 20 years of experience
as a Finance professional
Nilesh Vikamsey, Independent Director
Senior Partner at Khimji Kunverji & Co
Past President of The Institute of Chartered
Accountants of India
Sumit Bali, Executive Director & CEO
MBA from IIM Ahmedabad
More than 24 years of banking experience, including
heading the retail asset portfolio of Kotak Mahindra
Bank
Nagarajan Srinivasan, Non Executive Director
Head of South Asia, CDC Advisers
More than 30 years of investing and financial services
experience

30
… and supported by highly experienced senior management
Sumit Bali
MBA from IIM Ahmedabad
More than 24 years of
banking experience,
including heading the retail
asset portfolio of Kotak
Mahindra Bank
IIFL Finance
Kaumudi Biyani
(Financial Controller)
Chartered Accountant and
Company Secretary
18 years of banking and
consulting experience with
Arthur Anderson, Ernst &
Young, ICICI Bank, SCB
Anujeet Kudva
Chartered Accountant
17 years of experience
with PwC and Edelweiss
in Internal Audit,
Operational Risk
Management and Fraud
Control
IIFL Home Finance Samasta Microfinance
Chief
Executive
Officer
Chief
Financial
Officer
Chief Risk
Officer
Amit Gupta
20+ years of varied
experience in financial
services viz. accounting,
finance, audit and
compliance
Sanjeev Srivastava
Chartered Accountant
Industry veteran with 20
years of experience
within financial services
Monu Ratra
Qualified architect and
MBA
Over two decades of
mortgage experience
having worked with
HDFC, ICICI Bank and
Indiabulls Housing
Narayanswamy Venkatesh
20 years of experience in
the financial services sector
Completed program for
strategic leadership in
microfinance at Harvard
Business School
Sreepal Jain
10+ years of varied
experience in financial
services viz. Corporate
Finance, Teasury
Operations, Mergers &
Acquisitions and
Financial controls
Sabari Krishna
ACS, CAIIB
13+ years of experience
in Risk Management ,
Operational Risk, Risk
Assessment,
Compliance and Capital
Raising

31
I: IIFL Group Business Overview
(i) IIFL Finance
(ii) IIFL Wealth
(iii) IIFL Securities
II: Ownership, Management and Governance

32
`Cr Q4FY19 Q4FY18 Y-o-Y FY19 FY18 Y-o-Y
Assets under advice, management and distribution 1,69,312 1,31,762 28% 1,69,312 1,31,762 28%
Fee based income 195.8 233.0 (16%) 852.0 881.1 (3%)
Less: Direct Cost 30.8 22.7 36% 86.5 79.7 9%
Net Commission / Fee Income 165.0 210.3 (22%) 765.5 801.4 (4%)
Fund based income 155.5 187.6 (17%) 722.1 816.2 (12%)
Less: Interest expense 74.9 143.1 (48%) 428.4 560.5 (24%)
Net fund based income 80.6 44.5 81% 293.7 255.7 15%
Total income 245.6 254.8 (4%) 1,059.2 1,057.1 0%
Employee cost 59.8 110.6 (46%) 336.6 393.8 (15%)
Other operating expense 58.0 48.6 19% 192.6 171.4 12%
Provision 0.1 4.9 (98%) (7.4) 13.6 (154%)
Total expenses 117.9 164.1 (28%) 521.8 578.8 (10%)
Profit before tax 127.7 90.7 41% 537.4 478.3 12%
Provision for taxation 44.0 18.7 135% 163.3 109.7 49%
Profit after tax 83.7 72.0 16% 374.1 368.6 1%
Other comprehensive income (0.1) 3.4 9.9 0.7
Total comprehensive income (after tax) 83.6 75.4 10% 384.0 369.3 4%
IIFL Wealth – Consolidated results (as per IND AS) Quarter ended March 2019
• Q4FY18 Employee cost includes Rs 42 Cr of variable cost
• Tax rate FY19 - 30% v/s FY18 22% mainly on account of IIFL Wealth Finance, which had a lower marginal tax rate in previous year

33
7,293
10,405 8,459
22,535
25,053
18,409
FY14 FY15 FY16 FY17 FY18 FY19
74
164
226
363
478 537
51
112
169
251
369 384
FY14 FY15 FY16 FY17 FY18 FY19
PBT PAT
35,631
56,672 62,164
94,919
1,31,762
1,69,312
FY14 FY15 FY16 FY17 FY18 FY19
1,31,762
1,60,573 1,69,312 5,377 - 3,420
(58)
Ma
r-1
8
Dec-1
8
Net
New
Mo
ne
y
Inorg
anic
Gro
wth
Ma
rket
Pe
rform
an
ce
Fo
rex
Flu
ctu
atio
n
Ma
r-1
9
Leading Wealth manager in India Quarter ended March 2019
● IIFL Wealth offers a broad
range of product and
services to participate in a
larger share of the client
wallet, including financial
products distribution,
advisory, brokerage, asset
management, credit solutions
and estate planning.
● AUM growth remains robust
at 28% y-o-y
● IIFL Wealth has presence in
33 locations (including
multiple branches within
cities) across 7 geographies
● Largest fund manager of
AIFs. AUM grew 33% y-o-y
to `15,661 Cr
Total assets (` Cr) Profit before and after tax (` Cr)
Net new money raised (` Cr) AUM movement (` Cr)
Note : FY19 and FY18 numbers are as per IND AS. Previous years’ numbers are as per IGAAP

34
14% 24%
38% 49%
59%
84% 67% 54%
44% 24%
2% 3% 3% 3%
6%
6% 5% 4% 5%
6%
FY15 FY16 FY17 FY 18 FY19
AIF Offshore MF PMS Advisory
59% 58% 51% 47% 42%
22% 29% 32%
31% 24%
12% 6% 12% 17%
22%
4% 3% 1% 1%
6%
2% 4%
3% 4% 6%
FY15 FY16 FY17 FY 18 FY19
Advisory Assets Wealth Managed - PMS
Custody Assets Brokerage / Equity Fixed Income
Third Party Distribution
123 139
195 226
330
401
FY14 FY15 FY16 FY17 FY18 FY19
84 74 80 61
8 35 26
23
FY16 FY17 FY18 FY19
Net commission/fee income Fund based activities
109 106 84 92
Broadening advisory and asset management services Quarter ended March 2019
● Wealth NBFC, which
mainly offers loans
against securities to
clients had a loan book
of `4,798 Cr as at March
31, 2019
● Added 5 bankers during
Q4FY19, taking the total
number to 401, to further
drive the growth
momentum
● For the year ended
March 31, 2019, the
retention yield stands at
84 bps
Retention yield ex-Custody assets (bps)
Break-up of AMC Assets (%)
No. of bankers
Break-up of Wealth Mgmt Assets (%)
*Offshore assets pertain to IIFL Investment Managers –Singapore

35
I: IIFL Group Performance Overview
(i) IIFL Finance
(ii) IIFL Wealth
(iii) IIFL Securities
II: Ownership, Management and Governance

36
IIFL Securities – Consolidated results (as per IND AS) Quarter ended March 2019
` in Crore Q4FY19 Q4FY18 Y-o-Y FY19 FY18 Y-o-Y
Revenue from Operations 206.3 221.9 (7%) 834.7 838.9 (1%)
Other income 9.1 35.9 (75%) 41.6 124.9 (67%)
Total income 215.4 257.8 (16%) 876.3 963.8 (9%)
Employee cost 72.0 63.6 13% 257.7 212.4 21%
Finance Cost 20.6 30.3 (32%) 114.7 144.6 (21%)
Depreciation and amortisation expense 11.2 10.4 8% 42.6 37.1 15%
Administration and other expense 53.0 64.3 (18%) 206.1 287.6 (28%)
Total Expenses 156.8 168.6 (7%) 621.1 681.7 (9%)
Profit before tax 58.6 89.2 (34%) 255.2 282.1 (10%)
Provision for tax 20.5 30.4 (33%) 84.9 94.8 (10%)
Profit after tax 38.1 58.8 (35%) 170.3 187.3 (9%)
Other Comprehensive Income (0.1) 0.7 0.8 (0.8)
Total Comprehensive Income 38.0 59.5 (36%) 171.1 186.5 (8%)

37
4.0% 3.7% 3.7% 3.5% 3.5%
Q4FY18 Q1FY19 Q2FY19 Q3FY19 Q4FY19
Quarterly
2.0% 1.9% 1.9%
1.5% 1.6%
Q4FY18 Q1FY19 Q2FY19 Q3FY19 Q4FY19
17,455 16,677
21,070
16,370 17,134
Q4FY18 Q1FY19 Q2FY19 Q3FY19 Q4FY19
1,563
1,215 1,334
1,183 1,239
Q4FY18 Q1FY19 Q2FY19 Q3FY19 Q4FY19
IIFL Securities – Turnover and market share Quarter ended March 2019
Quarterly
Quarterly
● IIFL is a key player in both
retail and institutional
segments with a 3.5%
share of daily cash
turnover
● Average daily cash
turnover was up 5% q-o-q
to `1,239 Cr versus 1%
q-o-q growth in exchange
cash turnover
● Average daily F&O
turnover was up 5% q-o-q
to `15,894 Cr versus 3%
q-o-q growth in exchange
F&O turnover
● Total average daily
turnover (including F&O)
was up 5% q-o-q to
`17,134 Cr versus 3%
q-o-q growth in exchange
turnover
Note - Exchange turnover includes both NSE and BSE turnover for equity segment
Average daily turnover – Cash (` Cr) Average daily turnover - Total (` Cr)
NSE Market Share – Total (%)
NSE Market Share - Cash (%)
Quarterly

38
● Wide network – retail branches,
franchisees, sub-brokers and
online
● Coverage of 500+ stocks
● Mobile brokerage ~39% of total
41% 36%
44% 48%
52%
Q4FY18 Q1FY19 Q2FY19 Q3FY19 Q4FY19
Mobile trading clients (% of total)
Distinguished Apps
● 1000+ market and stock related
news notifications.
● Launched new features :
(i) 360 degree report.
(ii) Research reports
(iii) Screeners- Clients can pick the
stocks based on pre defined
variable in live market
(iv) Superstar Portfolio v)Advance
TMO (Trade Multiple Order)
Highest rated (4.3) and
Most downloaded (26.8L) stock trading app amongst peers
Internationally acclaimed research
736 772 783 787 806
Q4FY18 Q1FY19 Q2FY19 Q3FY19 Q4FY19
In ‘000
Number of retail customers
India Life Insurance
IIFL Markets
India RBL Bank
IIFL Mutual Funds
● Financial Plan 360 - Goal
based advisory and
investment solution
● Single view of all MF
holdings within industry
A deep dive into
India’s life insurance,
focusing on the
growth potential for
protection insurance
A report on RBL
Bank on the cusp of
high growth,
improving synergies
and improving
profitability
Rated 4.3
● Pedigreed institutional equities
team comprising 25 analysts and
200+ stocks under coverage
● Stellar track record in block
placements with institutional
investors
● Known for market leading
distribution franchise across
investor segments
Digitization and Research backed institutional &
retail equity businesses Quarter ended March 2019

39
Marquee Issues
IIFL completed more than 15 transactions in the year, including 3 IPOs, 4 QIPs and 1 ReIT, despite market
volatility
Maintained market leadership in equity raising for private sector corporates for the period FY18+FY19; having
been ranked #1 in equity capital markets covering equity IPOs, FPOs, QIPs , ReITs, InvITs and IPPs by Capital
Finance International
IPO
Varroc Engineering
`1,955 Cr
(June 2018) `885 Cr
(April 2018)
QIP + Block Deal
HDFC Asset Management
` 2,800 Cr
(July 2018)
Credit Access Grameen
`1,131 Cr
(August 2018)
HDFC Bank
`2,775 Cr
(August 2018)
Investment Banking has made significant strides Quarter ended March 2019
National Stock Exchange of
India
` 504 Cr
(November 2018)
ECL Finance
` Rs.910 Cr
(December 2018)
QIP
Simplex Infrastructures
`402 Cr
(May 2018)
Private Equity
IIFL Wealth Management
`746 Cr
(June 2018)
QIP
Aarti Industries
`750 Cr
(March 2019)
Magma Fincorp
(Public Issue of NCDs)
Private Placement QIP IPO
IPO
IPO
QIP
Embassy Office Parks ReIT
`4,750 Cr
(March 2019)
India Infoline Finance Ltd
Divestment of CV Finance business
(March 2019)
Well positioned to take advantage of the market opportunity once the markets stabilize

40
I: IIFL Group Business Overview
(i) IIFL Finance
(ii) IIFL Wealth
(iii) IIFL Securities
II: Ownership, Management and Governance
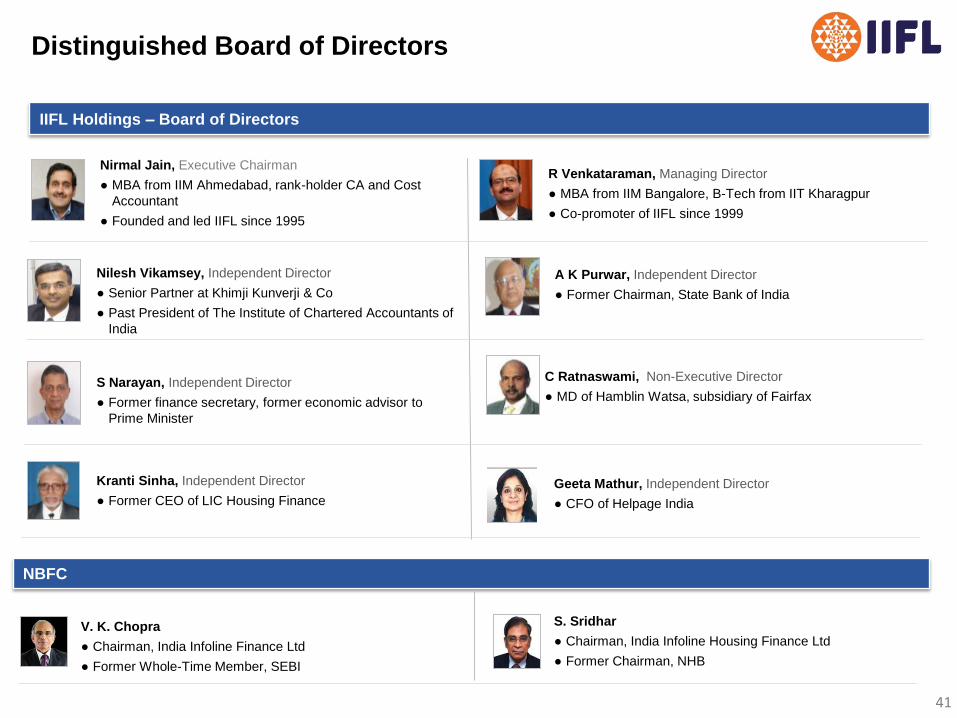
41
Nirmal Jain, Executive Chairman
● MBA from IIM Ahmedabad, rank-holder CA and Cost
Accountant
● Founded and led IIFL since 1995
C Ratnaswami, Non-Executive Director
● MD of Hamblin Watsa, subsidiary of Fairfax
Kranti Sinha, Independent Director
● Former CEO of LIC Housing Finance
A K Purwar, Independent Director
● Former Chairman, State Bank of India
Nilesh Vikamsey, Independent Director
● Senior Partner at Khimji Kunverji & Co
● Past President of The Institute of Chartered Accountants of
India
R Venkataraman, Managing Director
● MBA from IIM Bangalore, B-Tech from IIT Kharagpur
● Co-promoter of IIFL since 1999
S Narayan, Independent Director
● Former finance secretary, former economic advisor to
Prime Minister
Geeta Mathur, Independent Director
● CFO of Helpage India
IIFL Holdings – Board of Directors
Distinguished Board of Directors
NBFC
V. K. Chopra
● Chairman, India Infoline Finance Ltd
● Former Whole-Time Member, SEBI
S. Sridhar
● Chairman, India Infoline Housing Finance Ltd
● Former Chairman, NHB
42
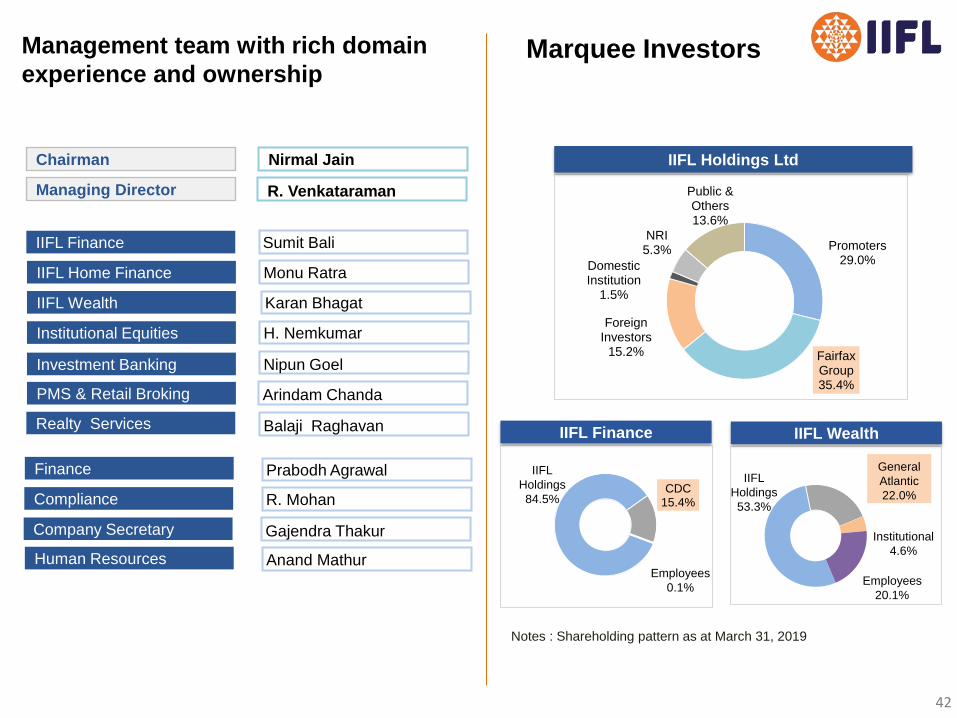
Marquee Investors
Management team with rich domain
experience and ownership
Chairman Nirmal Jain
Managing Director R. Venkataraman
Institutional Equities
IIFL Wealth
Investment Banking
Karan Bhagat
Nipun Goel
IIFL Home Finance Monu Ratra
PMS & Retail Broking Arindam Chanda
H. Nemkumar
Realty Services Balaji Raghavan
Compliance
Finance
Company Secretary
Prabodh Agrawal
R. Mohan
Gajendra Thakur
Notes : Shareholding pattern as at March 31, 2019
Promoters 29.0%
Fairfax Group 35.4%
Foreign Investors
15.2%
Domestic Institution
1.5%
NRI 5.3%
Public & Others 13.6%
IIFL Holdings Ltd
CDC 15.4%
IIFL Finance IIFL Wealth
General
Atlantic
22.0%
IIFL Finance Sumit Bali
Institutional
4.6%
Employees
20.1%
IIFL
Holdings
53.3%
IIFL
Holdings
84.5%
Employees
0.1%
Human Resources Anand Mathur

43
The Mobby’s
Award for Best
Financial Website
at World Marketing
Congress
Financial Services Company of the
Year
at VC Circle Awards 2019
IIFL’s brand and credibility are substantiated by
multiple awards
Excellence in Wealth
Management - India
Domestic at Asian
Private Banker Awards
for Distinction 2018
Best Artificial
Intelligence award at
2018 DMAASIA Echo
Awards
Best Product Category:
Alternative Investment Fund at
The India Wealth Awards 2018
IIFL IB was rated
Best IPO Lead
Manager for FY18
& FY19 by Capital
Finance
International
Best use of Technology to improve
Customer Service in Financial
Industry at ET Now Making of
Developed India (MODI) Awards
IIFL Securities IIFL Finance
Customer Excellence in NBFC
Sector by Zendesk
Technology
Initiative of the
Year Award for
‘Jhatpat Loans’ at
ET NOW BFSI
Awards
Best Green
Initiative in
Affordable Housing
segment at ET Now
Green Future
Leadership Awards
‘19
IIFL Wealth

44
Corporate Social Responsibility
Water Conservation at Aurangabad
IIFL took the lead to address the issue of acute water
shortage faced by farmers in Maharashtra by undertaking
construction of water trenches across 5 villages of
Aurangabad in different capacities
Annual Health Camp 2019 at Barsana
IIFL hosts a health camp at the renowned pilgrimage place Barsana every year, providing free of cost eye and dental check
up and treatments to the devotees.
Eye Care
2,863 beneficiaries screened and 1,096 patients were operated
for cataract surgery. Post operative care including shelter, food,
medicines and supervision check ups was made available to all
the patients.
Dental treatment
Dental Services were provided to 1,416 beneficiaries. General
orientation on oral hygiene was conducted along with sessions
creating awareness on oral cancer. Dental kits were also
provided to children of nearby schools
Sakhiyon ki Baadi (Rajasthan)
An initiative undertaken in rural, remote areas of Rajasthan,
to promote education of out-of-school and illiterate girls
10
Districts
37,482
Children
enrolled
1,156
Community
Schools

45
Thank you
Published in May 2019 © IIFL Holdings Ltd 2019-20
IIFL Holdings Ltd. All rights reserved. Regd. Off: IIFL House, Sun Infotech Park, Road No. 16V, Plot No.B-23, Thane Industrial Area, Wagle Estate,
Thane – 400604.
Tel.: +(91 22)4007 7000 Fax: 2685 0451.
This report is for information purposes only and does not construe to be any investment, legal or taxation advice. It is not intended as an offer or
solicitation for the purchase and sale of any financial instrument. Any action taken by you on the basis of the information contained herein is your
responsibility alone and IIFL Holdings Ltd (hereinafter referred as IHL) and its subsidiaries or its employees or directors, associates will not be liable in
any manner for the consequences of such action taken by you. We have exercised due diligence in checking the correctness and authenticity of the
information contained herein, but do not represent that it is accurate or complete. IHL or any of its subsidiaries or associates or employees shall not be
in any way responsible for any loss or damage that may arise to any person from any inadvertent error in the information contained in this publication.
The recipients of this report should rely on their own investigations. IHL and/or its subsidiaries and/or directors, employees or associates may have
interests or positions, financial or otherwise in the securities mentioned in this report.