FOR RELEASE APRIL 29, 2015 - assets.pewresearch.org · 2 PEW RESEARCH CENTER In addition, Senior...
98
FOR RELEASE APRIL 29, 2015 FOR FURTHER INFORMATION ON THIS REPORT: Amy Mitchell, Director Journalism Research Dana Page, Communications Manager 202.419.4372 www.pewresearch.org RECOMMENDED CITATION: Pew Research Center, April, 2015, “State of the News Media 2015” NUMBERS, FACTS AND TRENDS SHAPING THE WORLD
Transcript of FOR RELEASE APRIL 29, 2015 - assets.pewresearch.org · 2 PEW RESEARCH CENTER In addition, Senior...
FOR RELEASE APRIL 29, 2015
FOR FURTHER INFORMATION
ON THIS REPORT:
Amy Mitchell, Director Journalism Research
Dana Page, Communications Manager
202.419.4372
www.pewresearch.org
RECOMMENDED CITATION: Pew Research Center, April, 2015, “State of the News Media 2015”
NUMBERS, FACTS AND TRENDS SHAPING THE WORLD

1
PEW RESEARCH CENTER
www.pewresearch.org
About This Report
The State of the News Media 2015 is the twelfth edition of an annual report by the Pew Research
Center’s Journalism Project examining the landscape of American journalism. This year’s study
includes 13 data-filled fact sheets, each of which provides the latest audience, economic, news
investment and ownership trends for key sectors of news media, from cable TV to African-
American media to news magazines. This study also includes a searchable Media & News
Indicators database.
Pew Research Center is a nonpartisan fact tank that informs the public about the issues, attitudes
and trends shaping America and the world. It does not take policy positions. It conducts public
opinion polling, demographic research, media content analysis and other empirical social science
research. The center studies U.S. politics and policy views; media and journalism; internet and
technology; religion and public life; Hispanic trends; global attitudes and U.S. social and
demographic trends. All of the center’s reports are available at www.pewresearch.org. Pew
Research Center is a subsidiary of The Pew Charitable Trusts.
Many individuals contributed to this report. Director of Journalism Research Amy Mitchell
oversaw the effort, edited the fact sheets and wrote the overview. Pew Research analysts conducted
data analysis and aggregation and also served as primary writers for the fact sheets as follows:
African-American Media Fact Sheet – Nancy Vogt, Research Analyst
Alternative Weeklies Fact Sheet – Elisa Shearer, Research Assistant
Audio Fact Sheet – Nancy Vogt, Research Analyst
Cable News Fact Sheet – Jesse Holcomb, Senior Researcher
Digital News-Audience Fact Sheet – Kenneth Olmstead, Research Associate and Elisa Shearer,
Research Assistant
Digital News-Revenue Fact Sheet – Kenneth Olmstead, Research Associate and Kristine Lu,
Research Assistant
Hispanic Media Fact Sheet – Katerina Eva Matsa, Research Associate
Local TV Fact Sheet – Katerina Eva Matsa, Research Associate
Network News Fact Sheet – Katerina Eva Matsa, Research Associate
News Magazines Fact Sheet – Katerina Eva Matsa, Research Associate and Elisa Shearer,
Research Assistant
Newspapers Fact Sheet – Michael Barthel, Research Associate
Podcasting Fact Sheet - Nancy Vogt, Research Analyst
Public Broadcasting – Nancy Vogt, Research Analyst and Katerina Eva Matsa, Research
Associate

2
PEW RESEARCH CENTER
www.pewresearch.org
In addition, Senior Researcher Jesse Holcomb served as a second editor of the fact sheets.
Research Associate Katerina Eva Matsa served as the project manager. Research Associate Jeffrey
Gottfried helped manage the number checking process. Pew Research President Michael Dimock
helped guide the project, and Vice President of Research Claudia Deane and Vice President of
Digital and Communications Robyn Tomlin provided thoughtful feedback. Many other Pew
Research staffers provided communications, digital, editorial and graphics counsel and support,
including: Informational Graphic Designer Margaret Porteus; Editorial Web Producer Andrea
Caumont; Administrative Manager Cheryl Elzey; Web Developer Russell Heimlich;
Communications Manager Dana Page; Director of Digital Strategy Michael Piccorossi; Art Director
Diana Yoo; Senior Researcher Paul Hitlin; Associate Digital Producers Joanna Brenner, Michael
Suh and Ben Wormald; and copy editor David Kent.

3
PEW RESEARCH CENTER
www.pewresearch.org
Table of Contents
State of the News Media 2015 Overview ............................................................................................... 4
Digital News – Audience Fact Sheet .................................................................................................... 10
Digital News – Revenues Fact Sheet .................................................................................................... 17
Newspapers Fact Sheet ......................................................................................................................... 24
Cable News Fact Sheet .......................................................................................................................... 32
Network News Fact Sheet ..................................................................................................................... 36
Local TV News Fact Sheet ..................................................................................................................... 44
Podcasting Fact Sheet .......................................................................................................................... 52
Audio Fact Sheet .................................................................................................................................... 57
Public Broadcasting Fact Sheet............................................................................................................ 63
News Magazine Fact Sheet ................................................................................................................... 70
Alternative Weekly Fact Sheet .............................................................................................................. 77
Hispanic Media Fact Sheet ................................................................................................................... 78
African-American Media Fact Sheet ..................................................................................................... 87
State of the News Media Methodologies ............................................................................................. 96

4
PEW RESEARCH CENTER
www.pewresearch.org
State of the News Media 2015 Overview
BY Amy Mitchell
Call it a mobile majority. At the
start of 2015, 39 of the top 50
digital news websites have
more traffic to their sites and
associated applications coming
from mobile devices than from
desktop computers, according
to Pew Research Center’s
analysis of comScore data.
At the same time, though,
desktop visitors to these sites
tend to spend more time per visit than do mobile visitors. For half of these top 50 news sites –
which include legacy print, cable, network, international and public broadcasting outlets as well as
digital-only entities – visitors from desktops stay longer than those coming through mobile. The
reverse is true for only 10 of the sites, while for 15 sites the time spent is roughly equal.
In tandem with the growth of mobile has been the further rise of the social Web, where the flow of
information embodies a whole new dynamic. Some of our 2014 research revealed that nearly half
of Web-using adults report getting news about politics and government in the past week on
Facebook, a platform where influence is driven to a strong degree by friends and algorithms.
Americans’ changing news habits have a tremendous impact on how and to what extent our
country functions within an informed society. So too does the state of the organizations producing
the news and making it available to citizens day in and day out. Pew Research Center’s State of the
News Media report focuses primarily on the latter, tracking the expanding and diversifying news
industry over time and across a variety of indicators. Understanding the industry in turn allows
researchers to ask and answer important questions about the relationship between information
and democracy – whether this means exploring the degree to which like-minded consumers
gravitate to the same sources, the opportunities consumers have or don’t have to stay on top of the
activities of their elected officials, or how connected residents feel to their local communities.
Even as mobile and social news habits evolve, legacy platforms have by no means been abandoned,
though some are faring better than others. Local TV continues to capture broadcast viewers, with
Mobile Drives Online Traffic
Source: comScore Media Metrix, January 2015, U.S.
PEW RESEARCH CENTER
5
PEW RESEARCH CENTER
www.pewresearch.org
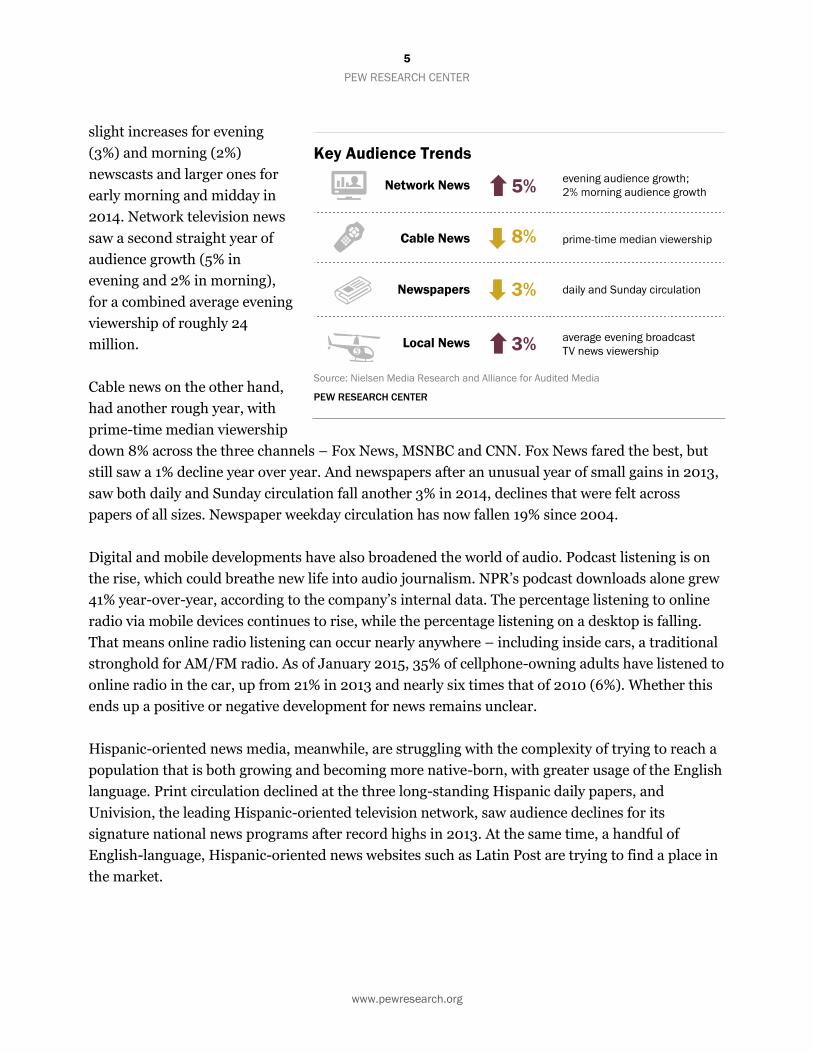
slight increases for evening
(3%) and morning (2%)
newscasts and larger ones for
early morning and midday in
2014. Network television news
saw a second straight year of
audience growth (5% in
evening and 2% in morning),
for a combined average evening
viewership of roughly 24
million.
Cable news on the other hand,
had another rough year, with
prime-time median viewership
down 8% across the three channels – Fox News, MSNBC and CNN. Fox News fared the best, but
still saw a 1% decline year over year. And newspapers after an unusual year of small gains in 2013,
saw both daily and Sunday circulation fall another 3% in 2014, declines that were felt across
papers of all sizes. Newspaper weekday circulation has now fallen 19% since 2004.
Digital and mobile developments have also broadened the world of audio. Podcast listening is on
the rise, which could breathe new life into audio journalism. NPR’s podcast downloads alone grew
41% year-over-year, according to the company’s internal data. The percentage listening to online
radio via mobile devices continues to rise, while the percentage listening on a desktop is falling.
That means online radio listening can occur nearly anywhere – including inside cars, a traditional
stronghold for AM/FM radio. As of January 2015, 35% of cellphone-owning adults have listened to
online radio in the car, up from 21% in 2013 and nearly six times that of 2010 (6%). Whether this
ends up a positive or negative development for news remains unclear.
Hispanic-oriented news media, meanwhile, are struggling with the complexity of trying to reach a
population that is both growing and becoming more native-born, with greater usage of the English
language. Print circulation declined at the three long-standing Hispanic daily papers, and
Univision, the leading Hispanic-oriented television network, saw audience declines for its
signature national news programs after record highs in 2013. At the same time, a handful of
English-language, Hispanic-oriented news websites such as Latin Post are trying to find a place in
the market.
Key Audience Trends
Source: Nielsen Media Research and Alliance for Audited Media
PEW RESEARCH CENTER
6
PEW RESEARCH CENTER
www.pewresearch.org
These are some of the findings of Pew Research Center’s 2015 State of the News Media Report,
now in its 12th year. This year we have created 13 data-filled fact sheets, each of which paints the
portrait of one segment of the industry – from cable TV to African-American media to news
magazines. Researchers have aggregated and analyzed data from nearly 20 different sources
across 10 different segments of the industry. Each individual fact sheet, which will be updated
annually, contains embeddable graphics that also link to full, annual data. This overview highlights
and weaves together trends across the industry.
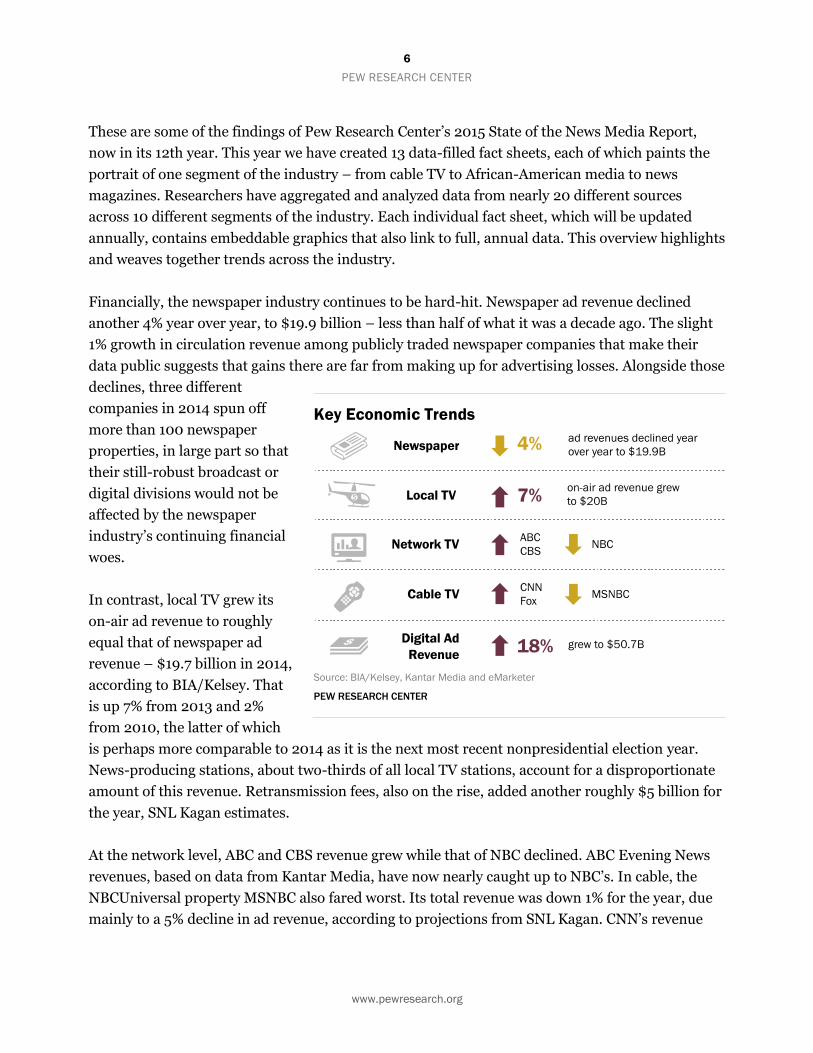
Financially, the newspaper industry continues to be hard-hit. Newspaper ad revenue declined
another 4% year over year, to $19.9 billion – less than half of what it was a decade ago. The slight
1% growth in circulation revenue among publicly traded newspaper companies that make their
data public suggests that gains there are far from making up for advertising losses. Alongside those
declines, three different
companies in 2014 spun off
more than 100 newspaper
properties, in large part so that
their still-robust broadcast or
digital divisions would not be
affected by the newspaper
industry’s continuing financial
woes.
In contrast, local TV grew its
on-air ad revenue to roughly
equal that of newspaper ad
revenue – $19.7 billion in 2014,
according to BIA/Kelsey. That
is up 7% from 2013 and 2%
from 2010, the latter of which
is perhaps more comparable to 2014 as it is the next most recent nonpresidential election year.
News-producing stations, about two-thirds of all local TV stations, account for a disproportionate
amount of this revenue. Retransmission fees, also on the rise, added another roughly $5 billion for
the year, SNL Kagan estimates.
At the network level, ABC and CBS revenue grew while that of NBC declined. ABC Evening News
revenues, based on data from Kantar Media, have now nearly caught up to NBC’s. In cable, the
NBCUniversal property MSNBC also fared worst. Its total revenue was down 1% for the year, due
mainly to a 5% decline in ad revenue, according to projections from SNL Kagan. CNN’s revenue
Key Economic Trends
Source: BIA/Kelsey, Kantar Media and eMarketer
PEW RESEARCH CENTER
7
PEW RESEARCH CENTER
www.pewresearch.org
was projected to rise 3%, while Fox News revenue was projected to rise 6%, and was the only one
of the three channels to report an increase in profit (10%). Subscriber revenue for all three was
expected to see continued growth.
For all of these legacy news sectors, significant digital revenues remain largely on the wish list.
None get more than a small share of their total revenue from digital, even though digital ad
revenue across all media grew 18% in 2014 to $50.7 billion, according to eMarketer. Mobile ad
spending alone increased 78%, though that is a slowdown from the two years prior. Mobile ad
spending now accounts for 37% of all digital ad spending, up from 25% in 2013. While new
relationships have been struck between news organizations and tech companies like Facebook, the
tech companies still control more of the arrangement and reap most of the financial benefit.
Facebook now pulls in roughly a quarter (24%) of all display ad revenue and more than a third
(37%) of mobile display.
There is no organized method as yet for tracking the growing digital-only segment of the news
media. In the 2014 report, we made a first effort through intense reporting to put a number on
these ventures and the newsroom jobs and revenue associated with them. Over the past year,
several of those that garnered attention for staff hires and journalistic investments had bumpy
rides, revealing the financial and journalistic challenges that exist even for news outlets with a
digital-first approach.
First Look Media, which launched in January 2014 with an infusion of $50 million from
eBay founder Pierre Omidyar, closed one of its signature news products, The Racket,
before publishing a single story after star Editor-in-Chief Matt Taibbi walked out in
October 2014, citing conflicts with management. Another key hire, former Los Angeles
Times journalist Ken Silverstein, resigned from First Look’s investigative outlet, The
Intercept, in early 2015, also attributing his departure to management style.
The tech journalism outlet Gigaom, funded with over $20 million in venture capital
including $8 million in 2014, shut down on March 9, 2015, with no warning even to staff
when it found itself unable to pay its creditors.
BuzzFeed built up its investigative and foreign teams over the past year but also had to deal
with ethical questions surrounding the removal of posts that spoke negatively of key
advertisers.
And The New Republic – not digital-native by any means, but purchased by Facebook co-
founder Chris Hughes in 2012 with the mission of re-creating it for the digital era – faced
mass resignation from newsroom employees who clashed with the direction in which CEO
Guy Vidra, formerly of Yahoo, planned to take the publication.

8
PEW RESEARCH CENTER
www.pewresearch.org
At the same time, though, several others took journalistic strides.
Vice News, launched in March 2014, cites 1.1 million subscribers and 175 million video
views as of early 2015, and Pew Research Center’s analysis of comScore data finds more
than 15 million unique visitors to its main website, Vice.com, as well as associated apps in
the month of January. Its journalistic accomplishments included the first interview with
the architect of the CIA detention program, James Mitchell, which drew 350,000 video
views in the first four days of its posting, according to shared internal data and, in March
2015, an interview with President Barack Obama.
Vox.com, the news site of Vox Media launched in April 2014 under the leadership of former
Washington Post journalist Ezra Klein, met its revenue goals and surpassed its traffic goals
in its first six months, according to co-founder Melissa Bell. And in January 2015, it had
almost 14 million unique visitors, according to Pew Research analysis of comScore data,
ranking it 35th in the top 50 news sites. The company overall is valued at $380 million.
Politico, launched in 2007 by two former Washington Post reporters as a news outlet for
Washington politics, announced plans to open bureaus in Florida and New Jersey and
possibly other states, and it launched Brussels-based Politico Europe in April 2015.
Business-oriented Quartz, a 3-year-old venture owned by Atlantic Media, announced in
March 2015 that it will expand its reporting staff into Africa.
At the local and state level, digital nonprofit journalism continues to develop and, according to
Pew Research Center’s study on local news ecosystems, can help provide a kind of second tier of
news. Yet the staffing capacity and financial maturity across these outlets varies dramatically. The
Texas Tribune, for example, has more than 40 staff members with a 2013 budget of more than $7
million, according to a recent Knight Foundation report, and through new grant money in 2014
began staffing a Washington bureau. The New Orleans-based investigative outfit The Lens, on the
other hand, scaled back its reporting after unanticipated funding shortfalls. On the for-profit side,
Billy Penn, the Philadelphia-focused, mobile-first news site launched by former editor-in-chief of
Digital First Media Jim Brady in late 2014, reported more than 100,000 page views in February
2015. Up to this point, though, while the site is for-profit in name, it is still largely funded by Brady
himself.
Overall, digital news entrants and experimentation, whether from longtime providers or new, are
on the one hand now so numerous and varied that they are difficult to keep track of. On the other
hand, the pace of technological evolution and the multiplicity of choices – from platforms to
devices to pathways – show no sign of slowing down. With each new pathway or platform, the old
ones continue to be used, posing a nearly unattainable challenge to an industry in financial

9
PEW RESEARCH CENTER
www.pewresearch.org
difficulty. And if news in the social space is more incidental and driven to a large degree by friends
and algorithms, then gaining a foothold there may be even more elusive – or at least less in the
industry’s own hands – than a secure financial model.

10
PEW RESEARCH CENTER
www.pewresearch.org
Digital News – Audience Fact Sheet
BY Kenneth Olmstead AND Elisa Shearer
Updated on May 18 to include a correction to the list of sites
A Pew Research Center analysis of digital traffic data provided by the analytics firm comScore
reveals a mix of legacy (websites and associated apps of news organizations that have non-digital
arms like newspapers) and digital-only news entities ranking among the most visited news
organizations by U.S. digital audiences.1
The data, from January 2015, show that for the majority of these 50 most visited online news
entities, mobile visits outpace desktop ones. But only for a minority do mobile visitors spend more
time per visit.
1 Data provided by comScore includes both desktop and mobile traffic via websites and associated mobile apps.

11
PEW RESEARCH CENTER
www.pewresearch.org
127,995
101,540
101,145
100,000
84,153
78,804
77,992
57,132
56,857
51,181
59,099
53,544
42,207
44,184
36,431
37,718
22,749
29,013
28,091
21,153
93,160
64,632
69,810
67,095
58,303
50,195
57,724
34,802
35,406
33,844
Yahoo-ABC
News
CNN Network
NBC News
Digital
Huffington Post
CBS News
USA Today
Sites
BuzzFeed
The New York
Times Brand
Fox News
Digital Network
Mail Online /
Daily Mail
Total digital population Desktop Mobile
The top 50 news websites and associated applications in January 2015 – based on comScore’s
measure of total U.S. desktop and mobile Web audience – include legacy news outlets, digital-only
organizations, and some international news brands. Even among the top 10, though, total website
and associated app audience
varies dramatically – from
roughly 130 million at the
Yahoo-ABC digital network to
just over 50 million for the
U.K.-based Daily Mail. At the
bottom of this list, The Dallas
Morning News attracted 7
million visitors in the sample
month of study.2 (See the full
list of the top 50 news
websites and associated apps,
and read more about how
Pew Research assembled it.)
[Accordion text begins:]
As digital brands merge,
splinter and mature, it
becomes increasingly
complicated to identify and
rank the most popular digital
news destinations. In order to
provide as clear a sense as
possible of the digital news
leaders among U.S.
audiences, researchers took
several steps using comScore
analytics.
2 The data have been corrected to include an earlier omission. NJ.com has been added as number 41 on the list, and entities after that each moved down one ranking. Thus, the list now includes 51 outlets, but all findings are still based on the top 50 and have not changed.
Top Digital News Entities
Total number of unique visitors for January 2015 (in thousands)
Source: comScore Media Metrix, January 2015, U.S.
Note: Total digital population is the unduplicated combination of the desktop (Web browsing
and video) and mobile (websites and apps) traffic figures. For that reason, desktop and
mobile figures combined may exceed the total digital population number.
PEW RESEARCH CENTER
12
PEW RESEARCH CENTER
www.pewresearch.org
First, we analyzed listings in comScore’s General News category and their separate Newspaper
category. In addition, we obtained audience data from comScore on roughly 400 digital-only news
outlets identified by the Pew Research Center. Within those lists, researchers took a number of
steps to focus as much as possible on the website level (such as a consumer-facing and
recognizable dot com, rather than the bundled holdings of its corporate parent). From there,
researchers assembled the list of top 50 news websites and associated apps, based on unique
visitors. Some news organizations list their Web entities in comScore’s database differently than
others. To be as consistent as possible, we created the following guidelines listed below. There are
still some instances where, because of an organization’s structure, there could be additional traffic
that is not represented here. We have tried to footnote all such cases.
For listings that own several sub-entities which are a part of the main Web presence (i.e. a user
would have access to the sub-entity content once on the main website) we used the following
guidelines:
o If more than half of those sub-entities are news-focused, researchers defaulted to
the larger entity as the listing and the unit of measure (an example here would be
the Yahoo-ABC News Network).
o If fewer than half of the sub-entities are news-focused, researchers used the largest
news channel listed as the unit of measure. For example, U.S. News and World
Report includes RankingsandReviews.com as well as USNews.com; we chose to
break out and report USNews.com.
For listings that own sub-entities that are entirely different websites, but nevertheless are
listed under a common owner, researchers examined the traffic for each of the websites (and
any associated apps) separately. (An example here would be Cox Media Group or Media
General, both of which own multiple local news entities that do not share any Web presence
with each other or with their corporate parent.) [Accordion text ends.]
While desktop visits are still valuable to publishers – especially when it comes to time spent on the
site – the number of mobile visits now outpaces desktop visits for the majority of the top 50 sites
and associated apps. (The total traffic number reflects the unduplicated combination of a site’s
mobile and desktop U.S. audiences, while the separate desktop and mobile numbers represent the
totals within each platform. For that reason, desktop and mobile figures combined may exceed the
total unduplicated audience figure.)

13
PEW RESEARCH CENTER
www.pewresearch.org
22,138
21,231
21,177
9,442
8,752
5,302
4,746
6,033
14,479
11,307
7,556
6,421
3,593
3,417
MSN News
BBC
CNET.com
USNews.com
Chron.com
Engadget.com
Techcrunch.com
Desktop Mobile
Indeed, 39 of the top 50 news sites and
associated apps had more mobile visitors than
desktop in the time period studied.3 (In
addition, four had roughly similar amounts of
mobile and desktop traffic, and seven had
more desktop traffic than mobile.) MSN news,
part of the Web portal launched by Microsoft
in the mid-1990s, shows the heaviest reliance
on desktop visits, which in January amounted
to nearly four times that of mobile. At the
other end of the spectrum, sites including
EliteDaily.com, UpWorthy.com,
BuzzFeed.com and BleacherReport.com stood
out for having the greatest portion of their
audience arrive through a mobile device.
3 Pew Research Center considered the difference between a site’s desktop and mobile traffic to be significant if one was 10% greater than the other.
Few News Outlets Have More Desktop
Traffic Than Mobile
Total number of unique visitors for January 2015 (in
thousands)
Source: comScore Media Metrix, January 2015, U.S.
Note: Total digital population is the unduplicated combination of the
desktop (Web browsing and video) and mobile (websites and apps)
traffic figures. For that reason, desktop and mobile figures
combined may exceed the total digital population number.
PEW RESEARCH CENTER
14
PEW RESEARCH CENTER
www.pewresearch.org
2.9
2.2
2.1
1.7
1.7
1.7
1.6
1.6
1.3
1.2
3.3
3.5
2.3
2.2
1.9
2.3
2.0
1.8
1.7
2.1
CNN Network
BleacherReport.com
Chicago Tribune
Vice.com
Chron.com
Gawker.com
Salon.com
Boston.com
Mashable.com
LA Times
Desktop Mobile
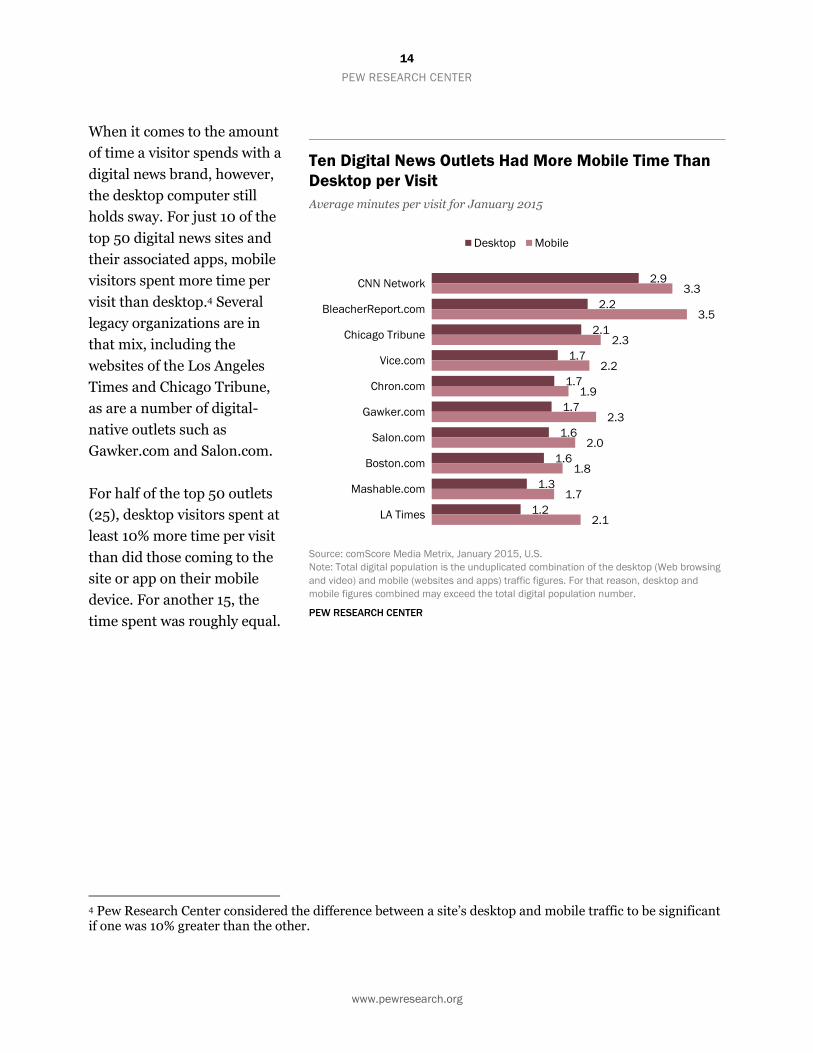
When it comes to the amount
of time a visitor spends with a
digital news brand, however,
the desktop computer still
holds sway. For just 10 of the
top 50 digital news sites and
their associated apps, mobile
visitors spent more time per
visit than desktop.4 Several
legacy organizations are in
that mix, including the
websites of the Los Angeles
Times and Chicago Tribune,
as are a number of digital-
native outlets such as
Gawker.com and Salon.com.
For half of the top 50 outlets
(25), desktop visitors spent at
least 10% more time per visit
than did those coming to the
site or app on their mobile
device. For another 15, the
time spent was roughly equal.
4 Pew Research Center considered the difference between a site’s desktop and mobile traffic to be significant if one was 10% greater than the other.
Ten Digital News Outlets Had More Mobile Time Than
Desktop per Visit
Average minutes per visit for January 2015
Source: comScore Media Metrix, January 2015, U.S.
Note: Total digital population is the unduplicated combination of the desktop (Web browsing
and video) and mobile (websites and apps) traffic figures. For that reason, desktop and
mobile figures combined may exceed the total digital population number.
PEW RESEARCH CENTER

15
PEW RESEARCH CENTER
www.pewresearch.org
100,000
77,992
44,429
37,309
30,482
20,951
18,346
15,558
14,079
13,598
44,184
22,749
14,645
15,278
21,177
9,669
7,525
4,193
5,724
6,070
67,095
57,724
32,938
24,101
11,307
12,029
11,533
9,375
8,954
7,862
HuffingtonPost.com
BuzzFeed.com
BleacherReport.com
BusinessInsider.com
CNET.com
Mashable.com
Slate.com
Vice.com
Gawker.com
Vox.com
Total digital population Desktop Mobile
To better understand how newer
organizations not tied to a legacy
platform are performing on the
Web, Pew Research Center
requested data on more than 400
digital-only news outlets identified
in our Growth in Digital Reporting
chapter of the 2014 State of the
News Media report. Some of these
organizations, such as The
Huffington Post and BuzzFeed,
also make it onto the list of the top
news entities overall, but many
others attract a much smaller
audience. Of the full 400, only 50
had a large enough audience in the
sample month studied (January
2015) to meet comScore’s
reporting threshold.5
Among these 50, a similar mobile-
vs.-desktop pattern emerges as
with the larger news outlets
described above. For most of those
with mobile traffic data, more
visits came through a mobile
device than through desktop.
5 For comScore to report on a site, at least five of its panelists must visit that site during the time period studied.
Top Digital-Native News Entities
Total number of unique visitors for January 2015 (in thousands)
Source: comScore Media Metrix, January 2015, U.S.
Note: Total digital population is the unduplicated combination of the desktop (web browsing
and video) and mobile (websites and apps) traffic figures. For that reason, desktop and
mobile figures combined may exceed the total digital population number.
PEW RESEARCH CENTER
16
PEW RESEARCH CENTER
www.pewresearch.org
21,177
5,302
4,746
3,265
3,943
2,805
1,205
815
213
11,307
3,593
3,417
2,952
2,290
1,561
842
651
147
CNET.com
Engadget.com
TechCrunch.com
LiveScience.com
Politico.com
ArsTechnica.com
Gigaom.com
Recode.net
PopMatters.com
Desktop Mobile
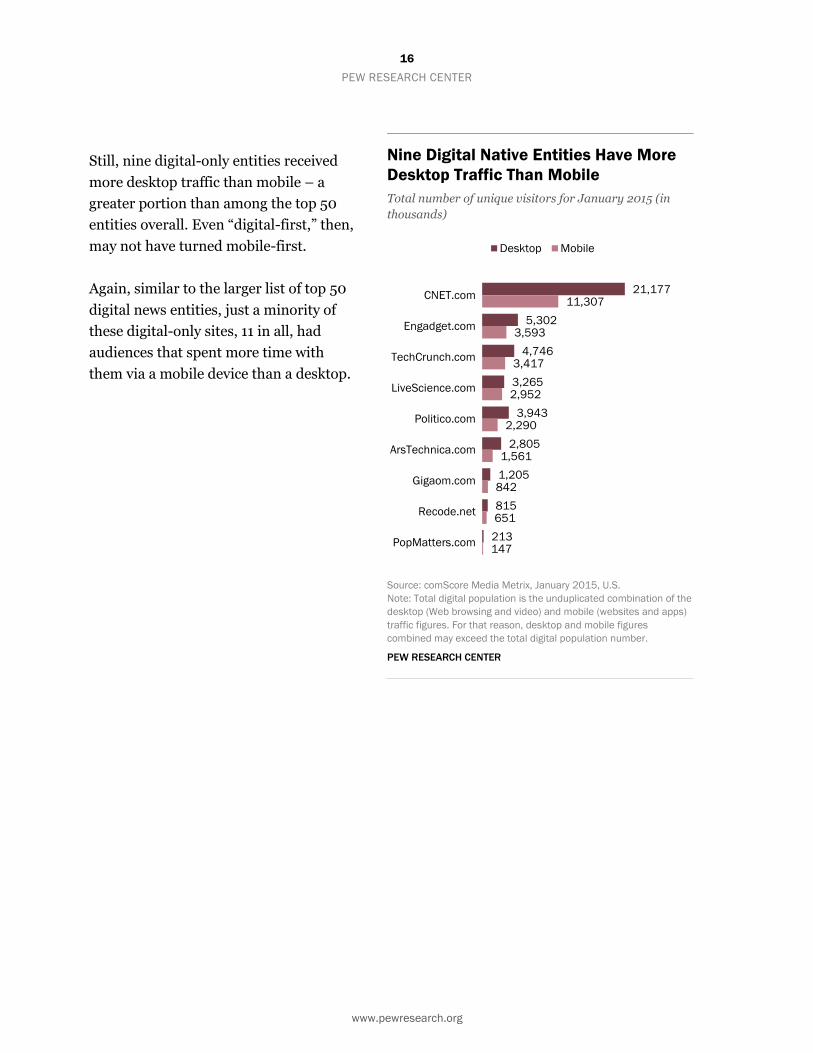
Still, nine digital-only entities received
more desktop traffic than mobile – a
greater portion than among the top 50
entities overall. Even “digital-first,” then,
may not have turned mobile-first.
Again, similar to the larger list of top 50
digital news entities, just a minority of
these digital-only sites, 11 in all, had
audiences that spent more time with
them via a mobile device than a desktop.
Nine Digital Native Entities Have More
Desktop Traffic Than Mobile
Total number of unique visitors for January 2015 (in
thousands)
Source: comScore Media Metrix, January 2015, U.S.
Note: Total digital population is the unduplicated combination of the
desktop (Web browsing and video) and mobile (websites and apps)
traffic figures. For that reason, desktop and mobile figures
combined may exceed the total digital population number.
PEW RESEARCH CENTER
17
PEW RESEARCH CENTER
www.pewresearch.org
Digital News – Revenues Fact Sheet
BY Kenneth Olmstead AND Kristine Lu
Last updated May 2015
In 2014, spending on digital advertising as a whole continued to grow at roughly the same rate as
in 2013. One segment of that – mobile advertising spending – showed sharp increases, though the
pace has not kept up with the triple-digit percentage growth rates from 2011-2013. The main
benefactors of digital ad spending continue to be social media and technology companies. Google
still holds about a third of total digital (38%) and mobile (37%) ad revenue, but Facebook saw
stronger year-over-year growth than the search giant. Facebook’s strength lies in display
advertising, the category of digital ads that news companies rely on most: The company is now the
top recipient of both total display and mobile display revenue.
(Read more on Digital News Audience.)

18
PEW RESEARCH CENTER
www.pewresearch.org
32 37 43 51
126 128
128 129
2011 2012 2013 2014
Other
Digital
Total Media
Ad Spending 158
171 180
165
In 2014, $50.7 billion was spent on digital ads, including mobile, up 18% from $43.1 billion in
2013. That is on par with the 17% increase a
year earlier.
Digital advertising has also grown as a
percentage of total media advertising across
all platforms: 28% in 2014, up from 25% in
2013.
Digital Ad Revenue Continues to Grow
Annual media ad spending (billions of U.S. dollars)
Source: eMarketer. “US Ad Spending Forecast.” October 2012,
December 2013, December 2014. “Mobile Advertising Goes
Mainstream,” October 2011.
PEW RESEARCH CENTER

19
PEW RESEARCH CENTER
www.pewresearch.org
1 1 4 11
19
25 31
32
32
32
2010 2011 2012 2013 2014
Other
Mobile
Total Digital
32
43
51
37
26
In 2014, $19 billion was spent on mobile
advertising, up 78% from the $10.7 billion
spent in 2013. Even that huge increase is far
less than increases of the past two years,
which saw growth rates of more than 170%.6
Mobile ad spending now accounts for 37% of
all digital ad spending, up from 25% last year.
6 In its 2013 report, eMarketer updated its 2012 projections from $2.61 billion to $4.36 billion. In 2014, eMarketer updated its 2013 mobile
ad spending from $9.60 billion in its 2013 projections to $10.67 billion in its 2014 report. The 2013-2014 updates were spurred because
the first estimate was based on the first two quarters of 2013; after the second half of the year, eMarketer updated its projections because
large companies like Google and Facebook posted larger mobile revenue figures than expected.
Mobile Ad Revenue Grows Rapidly in
Past Two Years
Annual digital ad revenue (billions of U.S. dollars)
Source: eMarketer. “US Ad Spending Forecast.” October 2012,
December 2013, December 2014. Note: Numbers may not add up
to total due to rounding.
PEW RESEARCH CENTER
20
PEW RESEARCH CENTER
www.pewresearch.org
0
2
4
6
8
10
12
14 billion
2008 2013 2012 2010 2009 2014
Rich Media
Sponsorship
Banner Ads
Video Ads
2011
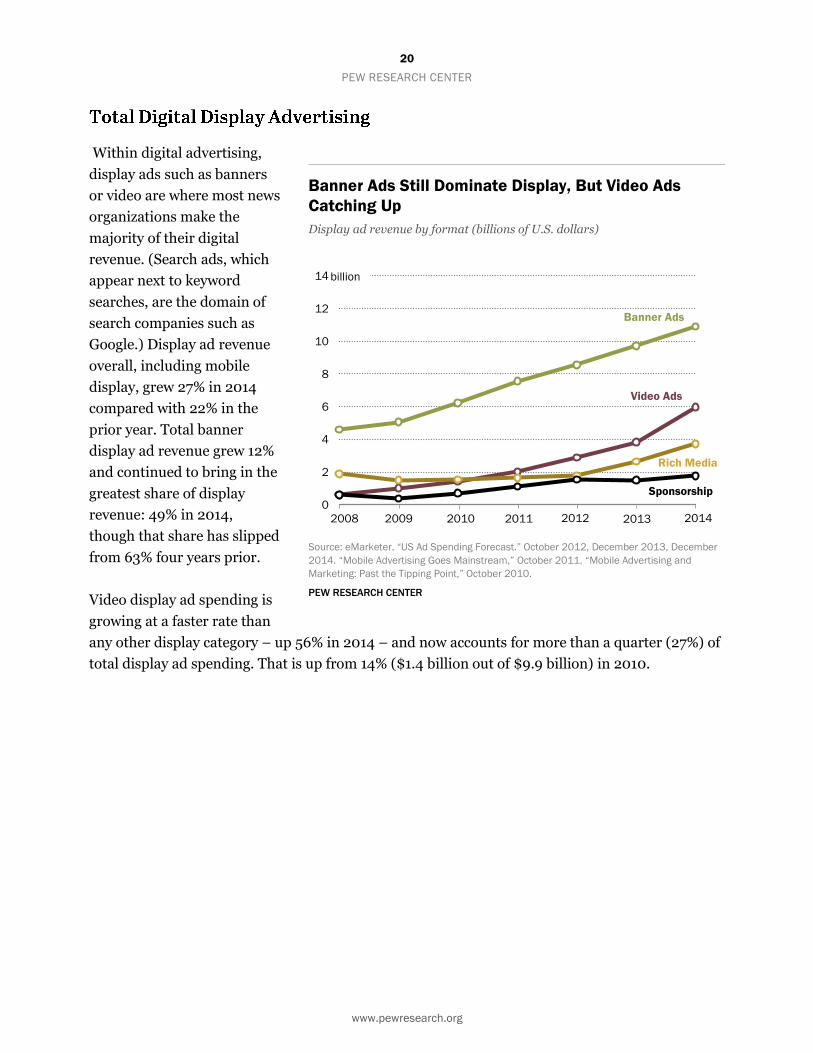
Within digital advertising,
display ads such as banners
or video are where most news
organizations make the
majority of their digital
revenue. (Search ads, which
appear next to keyword
searches, are the domain of
search companies such as
Google.) Display ad revenue
overall, including mobile
display, grew 27% in 2014
compared with 22% in the
prior year. Total banner
display ad revenue grew 12%
and continued to bring in the
greatest share of display
revenue: 49% in 2014,
though that share has slipped
from 63% four years prior.
Video display ad spending is
growing at a faster rate than
any other display category – up 56% in 2014 – and now accounts for more than a quarter (27%) of
total display ad spending. That is up from 14% ($1.4 billion out of $9.9 billion) in 2010.
Banner Ads Still Dominate Display, But Video Ads
Catching Up
Display ad revenue by format (billions of U.S. dollars)
Source: eMarketer. “US Ad Spending Forecast.” October 2012, December 2013, December
2014. “Mobile Advertising Goes Mainstream,” October 2011. “Mobile Advertising and
Marketing: Past the Tipping Point,” October 2010.
PEW RESEARCH CENTER

21
PEW RESEARCH CENTER
www.pewresearch.org
Five companies – Google, Facebook, Microsoft, Yahoo and AOL – still generated 61% of total
domestic digital ad revenue in 2014, $30.9 billion out of a total $50.7 billion. However, their
combined share has decreased incrementally, about 1 percentage point every year since 2010.
Google still leads the pack, accounting for 38% ($19.3 billion), though this is down from 40% of
total digital ad revenue in 2013 ($17.1 billion). Facebook has become a stronger generator of
overall digital advertising revenue over the past two years. In 2014, taking nearly 10% of total
digital ad revenue, Facebook increased its digital ad revenue 52% to $5.0 billion, which is more
than double its $2.2 billion in 2012.
22
PEW RESEARCH CENTER
www.pewresearch.org
19
14
7
4 4
52
Other Google
Yahoo
AOL Microsoft
2013
24
14
6
4 4
49 Other
Yahoo
AOL Twitter
2014
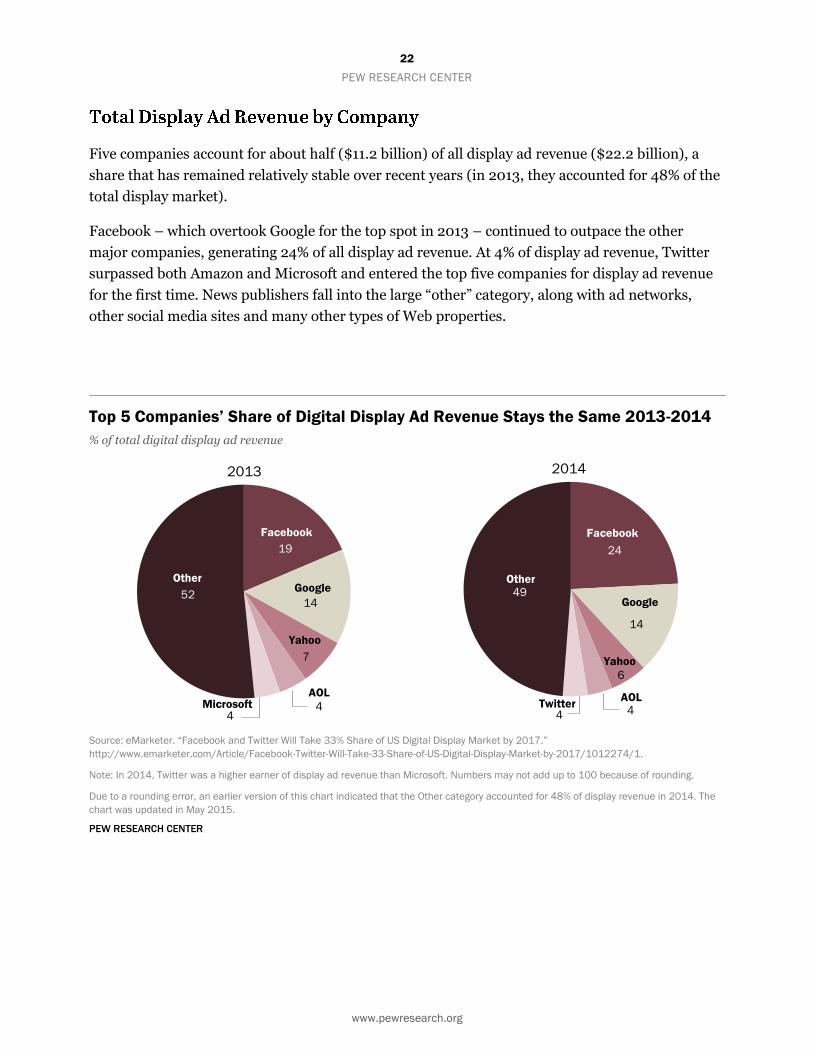
Five companies account for about half ($11.2 billion) of all display ad revenue ($22.2 billion), a
share that has remained relatively stable over recent years (in 2013, they accounted for 48% of the
total display market).
Facebook – which overtook Google for the top spot in 2013 – continued to outpace the other
major companies, generating 24% of all display ad revenue. At 4% of display ad revenue, Twitter
surpassed both Amazon and Microsoft and entered the top five companies for display ad revenue
for the first time. News publishers fall into the large “other” category, along with ad networks,
other social media sites and many other types of Web properties.
Top 5 Companies’ Share of Digital Display Ad Revenue Stays the Same 2013-2014
% of total digital display ad revenue
Source: eMarketer. “Facebook and Twitter Will Take 33% Share of US Digital Display Market by 2017.”
http://www.emarketer.com/Article/Facebook-Twitter-Will-Take-33-Share-of-US-Digital-Display-Market-by-2017/1012274/1.
Note: In 2014, Twitter was a higher earner of display ad revenue than Microsoft. Numbers may not add up to 100 because of rounding.
Due to a rounding error, an earlier version of this chart indicated that the Other category accounted for 48% of display revenue in 2014. The
chart was updated in May 2015.
PEW RESEARCH CENTER

23
PEW RESEARCH CENTER
www.pewresearch.org
29
12
7
6
5
41
Other
Pandora
Apple (iAd)
2013
37
12
7 6
5
33
Other
Pandora
Apple (iAd)
2014
When it comes to mobile display ad revenue, the top five companies – in this case, Facebook,
Google, Twitter, Pandora and Apple (iAd) – took in nearly two-thirds (64%) of the total in 2014, or
$6.4 billion out of $9.6 billion. That brings their share back to 2012 levels after a slight dip in 2013
to 59%.
Facebook continued to lead in mobile display ad revenue, generating more than one-third (37%) of
all mobile display ad revenue in 2014. Facebook’s mobile display revenue grew 131% (from $1.5
billion to $3.5 billion) in 2014, though at a slower rate than its 292% growth last year. Twitter also
saw steep growth in mobile display revenue in 2014. The third-highest generator of mobile display
ad revenue in 2014 (7% of the total), Twitter saw a 111% jump last year (from $0.3 billion to $0.7
billion), though this is also slower than the 178% growth it enjoyed in 2013.
According to an earlier eMarketer report, on both Facebook and Twitter, the percentage growth of
mobile display advertising equaled the percentage decline of another more mature category:
desktop display ads. 7 Facebook’s share of revenue from mobile ads increased 20 percentage points
while its share of revenue from desktop ads fell 20 percentage points, and Twitter’s share of
revenue from mobile ads increased 10 percentage points while its share of revenue from desktop
ads fell 10 percentage points.
7 eMarketer. “US Ad Spending Q4 2014 Complete Forecast.” December 2014.
Top 5 Companies Grow Share of Mobile Display Ad Revenue
% of total mobile display ad revenue
Source: eMarketer. “Facebook and Twitter Will Take 33% Share of US Digital Display Market by 2017.”
http://www.emarketer.com/Article/Facebook-Twitter-Will-Take-33-Share-of-US-Digital-Display-Market-by-2017/1012274/1.
Note: Updated with latest eMarketer estimates, published March 2015.
PEW RESEARCH CENTER

24
PEW RESEARCH CENTER
www.pewresearch.org
-12
-10
-8
-6
-4
-2
0
2
4
2002 2004 2006 2008 2010 2012 2014
DAILY
SUNDAY
%
Newspapers Fact Sheet
BY Michael Barthel
Last updated April 2015
After a year of slight gains, newspaper circulation fell again in 2014 (though tracking these data is
becoming more complicated each year due to measurement changes). Revenue from circulation
rose, but ad revenue continued to fall, with gains in digital ad revenue failing to make up for falls
in print ad revenue. Despite widespread talk of a shift to digital, most newspaper readership
continues to be in print. Online, more traffic to the top newspaper websites and associated apps
comes from mobile than from desktop users, and the average visitor only stays on the site for three
minutes per visit. And several larger media conglomerates spun off their newspaper divisions as
separate companies in an attempt to prevent the newspaper industry’s woes from affecting the
health of their broadcast divisions.
Circulation
After posting slight gains last
year, both weekday and
Sunday circulation fell around
3% from 2013 to 2014,
according to a Pew Research
Center analysis of Association
for Audited Media (AAM)
data. The decline in weekday
circulation fell almost equally
across all categories. This
includes top tier newspapers
(those with average weekday
circulation of 500,000 or
more) whose weekday
circulation fell 4% in 2014
after seeing a 22% spike from
2012 to 2013. In Sunday
circulation, top-tier papers felt
less of a blow than others in 2014.
Newspaper Circulation Falls in 2014
% change in total average circulation
Source: Alliance for Audited Media
PEW RESEARCH CENTER

25
PEW RESEARCH CENTER
www.pewresearch.org
Note: The circulation picture is complicated by rule changes from the circulation auditing body,
AAM. Due to these rule changes, AAM recommends avoiding baseline year-over-year
comparisons. Thus, our research team adjusted the raw data to allow for valid comparisons.
In 2014, AAM began allowing publishers to report circulation for all so-called “branded editions,”
which are editions produced by one publisher but not distributed under that publisher’s flagship
name. In early years, branded-edition copies given away for free or included inside another
publication were not counted. This addition led to dramatic increases in circulation for some
papers.
Publishers were also newly allowed in 2014 to include traffic from mobile applications, even if the
app was free, for each day of the week. As a result, some publishers are listed as having digital
non-replica circulation even on days they have no print circulation. All circulation for any days on
which no print edition was published is excluded from our analysis. Circulation numbers here,
then, are the total weekday or Sunday average, excluding branded editions, for days on which a
print edition was for sale.
The table shows what the year-
over-year change in total
average circulation would have
been under four scenarios: 1)
with no additional stipulation
besides what AAM reported; 2)
if circulation of branded
editions is omitted entirely for
both years; 3) if digital non-
replica circulation is omitted
for days on which no print
edition is distributed; and 4) if
both conditions two and three are in place. It is this scenario under which we have arrived at our
final number.
Circulation Changes – But Direction Depends on Rules
% change in total average circulation, 2013-2014, under four different
scenarios
Daily Sunday
All daily U.S. newspapers reporting average circulation 5.0% 8.5%
Excluding circulation for branded editions -0.3 1.9
Excluding circulation for digital non-replica on days with no print edition 2.1 -1.7
Excluding both (final estimate) -3.3 -3.4
Source: Alliance for Audited Media Snapshot for periods ending Sept. 30, 2013, and Sept.
30, 2014.
PEW RESEARCH CENTER

26
PEW RESEARCH CENTER
www.pewresearch.org
Readership
Although the public conversation about newspapers focuses on
the shift to digital, most newspaper reading still happens in print.
According to readership data from Nielsen Scarborough’s 2014
Newspaper Penetration Report, 56% of those who consume a
newspaper read it exclusively in print, while 11% also read it on
desktop or laptop computers; 5% also read it on mobile; and
another 11% read it in print, on desktop and on mobile. In total,
more than eight-in-ten of those who read a newspaper do so in
print, at least sometimes. Only 5% read newspapers exclusively on
mobile devices.
The general demographics of newspaper readers remain
consistent as well. The most likely to read newspapers are those
with more education or more income, and who are white.
Newspaper Audience
Distribution by Platform
% of newspaper readership that
takes place in …
2013 2014
Print only 55% 56%
Print/desktop 15 11
Print/desktop/ mobile 10 11
Desktop only 7 6
Desktop/mobile 5 7
Print/mobile 4 5
Mobile only 3 5
Source: Scarborough USA + Study, R1,
2014
PEW RESEARCH CENTER

27
PEW RESEARCH CENTER
www.pewresearch.org
44.9 46.7 47.4 46.6 42.2
34.7
24.8 22.8 20.7 18.9 17.3 16.4
1.2 1.5 2
2.7
3.2
3.1
2.7 3
3.2 3.4 3.4 3.5
0
10
20
30
40
50
60
2003 2004 2005 2006 2007 2008 2009 2010 2011 2012 2013 2014
Digital
For the past five years, newspaper ad revenue has maintained a consistent trajectory: Print ads
have produced less revenue (down 5%), while digital ads have produced more revenue (up 3%) –
but not enough to make up for the fall in print revenue. Print ad revenue fell 4%, to just $16.4
billion.
Though detailed circulation revenue figures were not available for all publications at the time of
writing, such figures are available for seven publicly traded newspaper companies (Gannett, E.W.
Scripps, The New York Times Co., A.H. Belo, Journal Communications, McClatchy, and Lee
Enterprises; New Media Investment Group is excluded because it purchased a number of new
properties in 2014, making one-to-one comparisons with 2013 impossible). For these companies,
circulation revenue was up 1%. Newspapers received a roughly similar mix of ad, circulation and
other revenue in 2013 and 2014. Last year, the mix was 57% advertising, 36% circulation and 6%
other (such as from events or research). For these companies, ad revenues fell nearly equally
across categories: down 5% for retail, 6% for national, and 5% for classified.
Newspaper Ad Revenue from Digital and Print
Annual revenue in billions of U.S. dollars
Source: Newspaper Association of America (through 2013), BIA/Kelsey (2014)
PEW RESEARCH CENTER

28
PEW RESEARCH CENTER
www.pewresearch.org
0
10,000
20,000
30,000
40,000
50,000
60,000
1978 1983 1988 1993 1998 2003 2008 2013
Total
Minority
Women
Overall newsroom workforce
declined, though the rate of
decline is slowing somewhat.
According to the American
Society of News Editors’
Newsroom Employment
Census, after falling 11% in
2008 and 6% in 2012, overall
newsroom employment was
down 3% in 2013 – the most
recent year for which figures
are available – to 36,700. The
percentage of newsroom
employees who are minorities
(including Native Americans,
African Americans, Latinos
and Asian Americans) has
remained a steady 11-14% for the past 20 years.
The number of female newsroom employees fell little. Women have made up 36-38% of newsroom
employees since ASNE began measuring their employment in 1998.
Newsroom Employment Continues Falling
Total number of newsroom employees
Source: American Society for News Editors Newsroom Employment Census, 1979-2014.
PEW RESEARCH CENTER

29
PEW RESEARCH CENTER
www.pewresearch.org
In 2014, several media companies spun off their publishing divisions: Gannett, E.W. Scripps and
Journal Communications, and Tribune. (Tribune emerged from bankruptcy, spun off its
newspapers in August, and bought the Chicago Sun-Times’ suburban papers, which the Sun-Times
was spinning off in a bid to build a national network of local news websites. Both the Gannett and
Scripps deals were still in progress in mid-April 2015.)
The Los Angeles Register, launched by Freedom Communications in April 2014 as a
counterintuitive bet on print, ceased publication the following September – after the similarly
failing Long Beach Register (launched in August 2013) was merged into it. These troubles had a
negative effect on Freedom’s flagship publication, the Orange County Register, which was so
strapped for cash that it asked employees to help deliver the paper. And Digital First Media, one of
the biggest newspaper groups in the country, was put up for sale in September, but the sale (to
Apollo Global Management, according to reports) has not been finalized.
This is not to say all the news was bad. New Media Investment Group (formerly Gatehouse), which
emerged from bankruptcy in 2013 after its holding company purchased the Dow Jones Local
Media Group, continued its acquisition spree. Most notably, it announced an acquisition of
Halifax Media’s 36 community papers in November.

30
PEW RESEARCH CENTER
www.pewresearch.org
In the digital space, many of the newspapers
with the highest digital traffic, according to data
provided by the analytics firm comScore, are
also those with the greatest U.S. circulation –
but there are some exceptions. Five UK-based
outlets are in the top 25 newspaper websites and
associated apps (a list produced through a Pew
Research Center analysis of comScore data): the
Mail Online (third-highest in traffic on Pew
Research’s list), the Guardian (fifth) the Daily
Telegraph (tenth), the Mirror (twelfth) and the
Independent (fourteenth) – while one of the top
U.S. papers by print circulation, the Wall Street
Journal, is absent.
What also stands out in these data is the mix of
mobile versus desktop traffic. For 19 of the top
25 newspaper sites and associated apps in
overall traffic, mobile traffic exceeded desktop
by at least 10%. For five of the 25, the split was
about equal (i.e., less than a 10% difference
between the two), and for just one – the Houston
Chronicle – desktop traffic still accounted for
more visits than mobile.
For 13 of the top 25, desktop visitors spent more
time on the sites and apps than did mobile
visitors (exceeding by at least 10%), while mobile
visitors spent more time for five newspapers: the
Los Angeles Times, Houston Chronicle,
Washington Times, Seattle Times and Newsday.
Mobile and desktop visitors spent roughly the
same amount of time for seven newspaper web
destinations.
For these largest newspapers, their digital
audience numbers far outpace circulation: The
New York Times reported an average weekday
Top 25 Newspapers by Digital Traffic
Total number of unique visitors for January 2015 (in
thousands)
Total Digital Population Desktop Mobile
USAToday.com 54,548 25,198 34,621
NYTimes.com 53,966 28,974 31,481
DailyMail.co.uk 51,108 21,095 33,817
WashingtonPost.com 47,815 21,328 30,393
TheGuardian.com 28,152 13,120 16,483
NYDailynews.com 25,900 11,294 15,692
LATimes.com 25,185 12,943 13,484
NYPost.com 22,940 9,831 14,192
SFGate.com 19,043 9,948 10,080
Telegraph.co.uk 16,751 8,378 9,058
Chron.com 14,424 8,752 6,421
Mirror.co.uk 12,036 4,368 7,958
ChicagoTribune.com 12,006 5,157 7,283
Independent.co.uk 11,516 4,980 6,810
Freep.com 10,632 3,911 6,972
BostonGlobe.com 9,840 4,535 5,571
WashingtonTimes.com 7,015 3,318 3,793
DallasNews.com 7,001 3,069 4,032
AZCentral.com 6,570 3,154 3,514
Cleveland.com 6,497 2,513 4,114
OregonLive.com 6,339 2,553 3,940
SeattleTimes.com 6,094 3,147 3,041
Nola.com 6,046 2,002 4,142
Newsday.com 6,005 2,780 3,754
OrlandoSentinel.com 5,588 2,358 2,891
Source: comScore Media Metrix, January 2015, U.S. Total digital
population is the unduplicated combination of the desktop (web
browsing + video) and mobile (website + apps) traffic figures. For
that reason, desktop and mobile figures combined may exceed the
total digital population number. Some sites are part of larger
properties; for this reason, the numbers here may differ from
newspaper web traffic data reflected in other State of the News
Media fact sheets.
Note: Figures for USAToday.com do not include app traffic.
comScore does capture that traffic separately but is not able to
unduplicate it from traffic to the website to create a combined total
number of unique visitors. Mobile app unique visitors in January
totaled 2.3 million.
PEW RESEARCH CENTER
31
PEW RESEARCH CENTER
www.pewresearch.org
print circulation of less than 650,000 in September 2014. But their website and associated apps
attracted nearly 54 million unique visitors in January 2015, and the majority of their paid
circulation comes from digital sources (about 1.4 million). Yet far more people report reading a
newspaper in print than on a digital device. Why this discrepancy? One clue lies in the time spent.
The average visit to The New York Times’ website and associated apps in January 2015 lasted only
4.6 minutes – and this was the highest of the top 25. Thus, most online newspaper visitors are
“flybys,” arriving perhaps through a link on a social networking site or sent in an email, and so
may not think of this experience as “reading a newspaper” but simply browsing an article online.
And from our local news ecology work, we know the vast majority of local residents prefer their
local paper to national newspaper brands such as the Times. Despite these massive traffic
numbers, only a small portion of newspapers’ revenue comes from digital advertising.
32
PEW RESEARCH CENTER
www.pewresearch.org
2,019 2,207
1,905 1,922 1,938 1,938 1,798
2008 2009 2010 2011 2012 2013 2014
0
1
2
3
2005 2006 2007 2008 2009 2010 2011 2012 2013 2014
Fox
CNN
MSNBC
Million
Cable News Fact Sheet
BY Jesse Holcomb
Last updated April 30, 2015 to include new digital analyses provided by comScore.
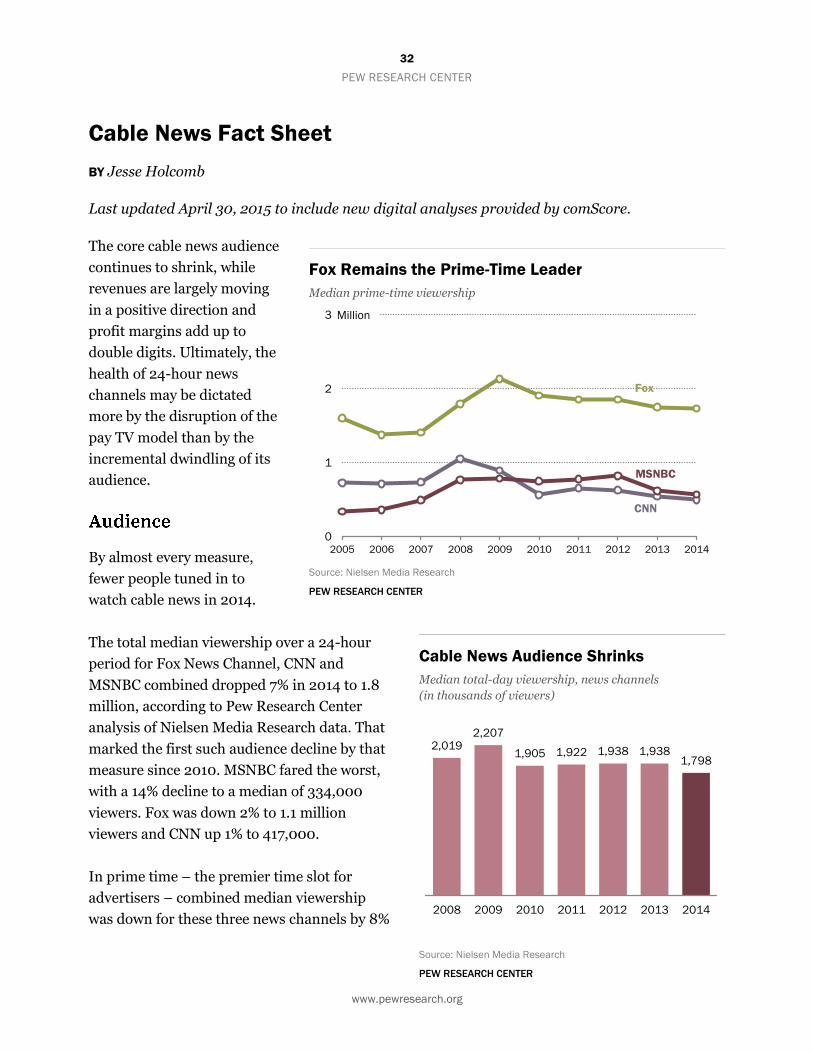
The core cable news audience
continues to shrink, while
revenues are largely moving
in a positive direction and
profit margins add up to
double digits. Ultimately, the
health of 24-hour news
channels may be dictated
more by the disruption of the
pay TV model than by the
incremental dwindling of its
audience.
By almost every measure,
fewer people tuned in to
watch cable news in 2014.
The total median viewership over a 24-hour
period for Fox News Channel, CNN and
MSNBC combined dropped 7% in 2014 to 1.8
million, according to Pew Research Center
analysis of Nielsen Media Research data. That
marked the first such audience decline by that
measure since 2010. MSNBC fared the worst,
with a 14% decline to a median of 334,000
viewers. Fox was down 2% to 1.1 million
viewers and CNN up 1% to 417,000.
In prime time – the premier time slot for
advertisers – combined median viewership
was down for these three news channels by 8%
Fox Remains the Prime-Time Leader
Median prime-time viewership
Source: Nielsen Media Research
PEW RESEARCH CENTER
Cable News Audience Shrinks
Median total-day viewership, news channels
(in thousands of viewers)
Source: Nielsen Media Research
PEW RESEARCH CENTER

33
PEW RESEARCH CENTER
www.pewresearch.org
0
1
2
3
2005 2006 2007 2008 2009 2010 2011 2012 2013 2014
Fox
CNN
MSNBC
Billion
to 2.8 million. Fox News remained relatively steady, losing only 1% of its viewership with 1.7
million watching nightly. But CNN (down 9% to 495,000 viewers) and MSNBC (down 8% to
568,000) struggled.
Between the hours of 6 a.m. and 6 p.m., median viewership for the three channels combined
dropped 5% to 1.9 million. Once again, MSNBC stood out for its audience decline, losing fully 18%
of its viewership and ending the year with a median of 291,000 viewers during the day. CNN was
flat at 453,000 viewers, and Fox experienced a small decline of 3%, leaving it with 1.1 million
daytime viewers in 2014.
For the three main news
channels combined (Fox,
CNN and MSNBC), total
revenues were projected to
increase by a modest 4% in
2014, to a total of $3.7
billion, according to Pew
Research analysis of SNL
Kagan data.
Fox News was projected to
experience higher revenue
growth (up 6% to $2.04
billion) than that of CNN (3%
to $1.13 billion) or MSNBC
(down 1% to $501 million).
Cable channels draw revenue
from two main sources – advertising and subscriber (affiliate) fees, which come out of consumers’
monthly cable bills. Fox was projected to grow its subscriber-fee revenue by 7% to $1.2 billion in
2014, compared with CNN’s 2% growth to $710 million and MSNBC’s 3% growth to $274 million.
In advertising, CNN was projected to experience the strongest rate of growth, up 6% to $339
million (compared with Fox’s 2% growth to $794 million and MSNBC’s projected decline of 5% to
$221 million).
Revenue Growth Largely Stagnant for News Channels
Projected annual revenue (in U.S. dollars)
Source: SNL Kagan
PEW RESEARCH CENTER
34
PEW RESEARCH CENTER
www.pewresearch.org
Of the three main news channels, only Fox News was projected to grow its profits in 2014 (up 10%
to $1.2 billion). CNN was projected to experience a 5% decline in profit to $327 million, and
MSNBC was projected to decline by 8% to $206 million. Still, all three channels continued to enjoy
double-digit profit margins: 61% at Fox, 41% at MSNBC and 29% at CNN.
Among the news channels that occupy a smaller niche than Fox, CNN and MSNBC, the three
financial news outlets were each projected to have grown in revenue in 2014: Fox Business
Network with 17% growth to $205 million; CNBC with 5% growth to $702 million; and Bloomberg
TV with 7% growth to $191 million.
On the other hand, amid weak ratings the relatively new Al Jazeera America was projected to
decline in revenue 2%, to $93 million.
Despite flagging audiences, none of the three main cable news channels were expected to cut back
on their news operations in 2014 (though a reallocation of resources at Turner Broadcasting
resulted in layoffs at CNN, which accompanied the promise of more investment in digital and
original programming).
Overall, newsroom spending was projected to increase by 4% to $1.9 billion for the three main
news channels combined, according to Pew Research analysis of SNL Kagan data.
CNN was projected to increase its spending the most (7% to $805 million) followed by MSNBC, up
5% to $296 million. Fox was projected to remain steady at $803
million.
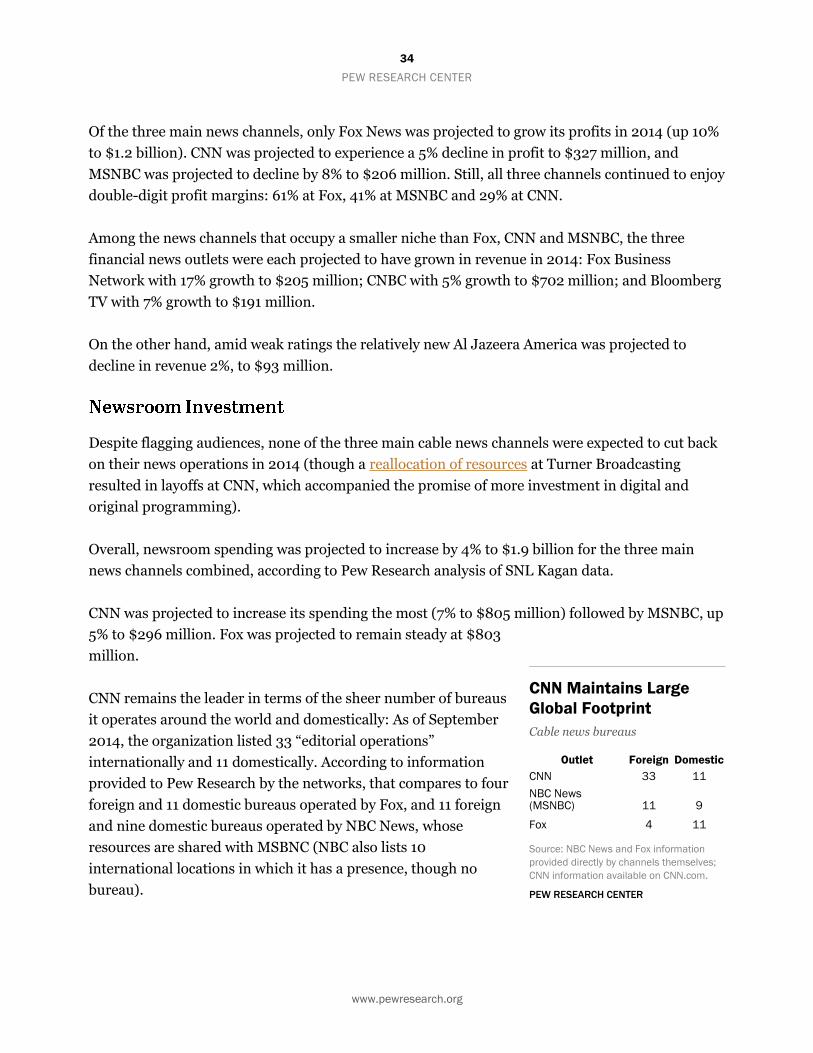
CNN remains the leader in terms of the sheer number of bureaus
it operates around the world and domestically: As of September
2014, the organization listed 33 “editorial operations”
internationally and 11 domestically. According to information
provided to Pew Research by the networks, that compares to four
foreign and 11 domestic bureaus operated by Fox, and 11 foreign
and nine domestic bureaus operated by NBC News, whose
resources are shared with MSBNC (NBC also lists 10
international locations in which it has a presence, though no
bureau).
CNN Maintains Large
Global Footprint
Cable news bureaus
Outlet Foreign Domestic
CNN 33 11
NBC News (MSNBC) 11 9
Fox 4 11
Source: NBC News and Fox information
provided directly by channels themselves;
CNN information available on CNN.com.
PEW RESEARCH CENTER

35
PEW RESEARCH CENTER
www.pewresearch.org
49,912
6,894
55,492
31,444
3,259
26,978
25,226
3,728
34,818
CNN.com
MSNBC.com
FoxNews.com
Total Digital (unduplicated) Desktop Mobile
In the digital space, both CNN and Fox News command far more audience than MSNBC,
according to Pew Research Center analysis of comScore data.
The exact measures get
complicated due to how news
entities organize their data.
Web traffic data taken from a
sample month, January 2015
(including desktop, mobile and
apps), shows the total digital
traffic for FoxNews.com at
about 55 million unique
visitors. In the same month,
CNN’s total digital traffic
amounted to around 64 million
unique visitors and MSNBC’s
roughly 7 million.
All three of these are a part of
larger digital networks. For
example, MSNBC.com sits
within the broader NBC News
family (NBCNews.com drew
about 30 million unique
visitors in January 2015).
(Read here for more
information about digital
audience trends in news.)
Fox News Is a Leader Online
Total number of unique visitors for January 2015 (in thousands)
Source: comScore Media Metrix, January 2015, U.S.
Notes: : In new conversations with comScore, Pew Research Center was informed of and
provided with new digital populations that are inclusive of app traffic and in the case of
CNN the addition of some sub-domains which are tracked separately in comScore. For
most other news entities analyzed in this report, all relevant sub-domains are already
included. In addition, Total Digital Population is the unduplicated combination of the
desktop (web browsing and video) and mobile (websites and apps where applicable) traffic
figures. For that reason, desktop and mobile figures combined may exceed the total digital
population number.
PEW RESEARCH CENTER
36
PEW RESEARCH CENTER
www.pewresearch.org
22.9 22.3 21.6 22.5 22.1 22.6 23.7
2008 2009 2010 2011 2012 2013 2014
Network News Fact Sheet
BY Katerina Eva Matsa
Last updated April 2015
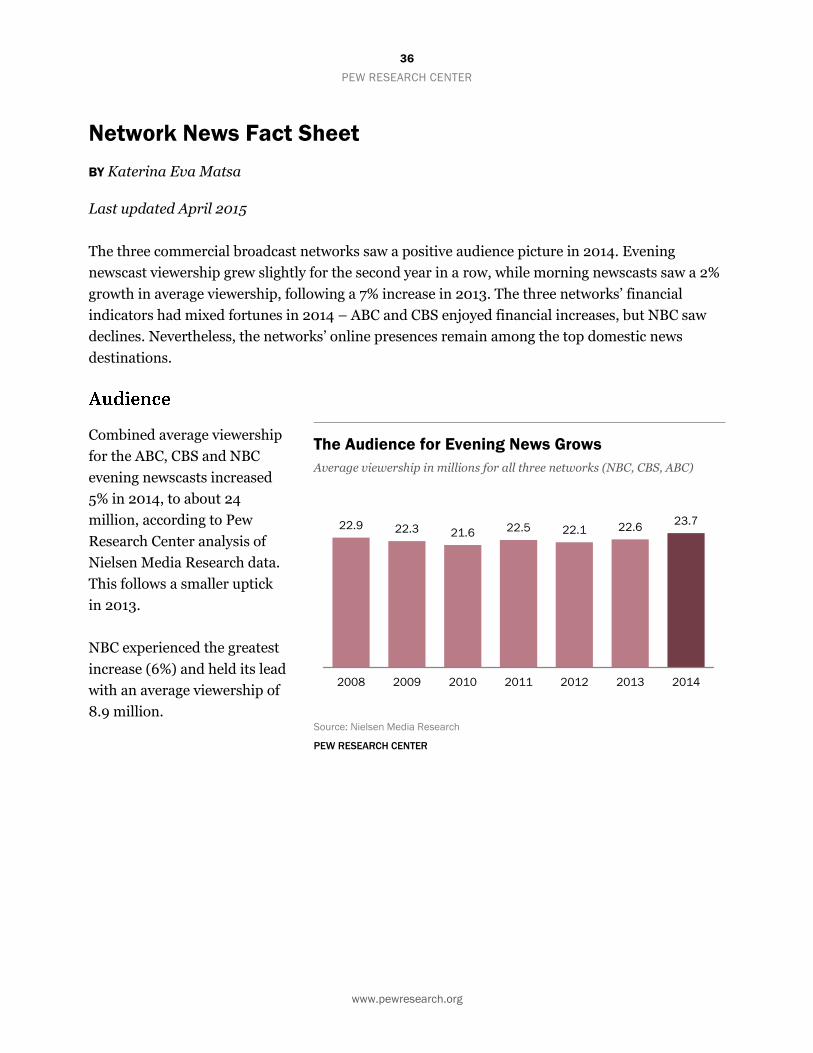
The three commercial broadcast networks saw a positive audience picture in 2014. Evening
newscast viewership grew slightly for the second year in a row, while morning newscasts saw a 2%
growth in average viewership, following a 7% increase in 2013. The three networks’ financial
indicators had mixed fortunes in 2014 – ABC and CBS enjoyed financial increases, but NBC saw
declines. Nevertheless, the networks’ online presences remain among the top domestic news
destinations.
Combined average viewership
for the ABC, CBS and NBC
evening newscasts increased
5% in 2014, to about 24
million, according to Pew
Research Center analysis of
Nielsen Media Research data.
This follows a smaller uptick
in 2013.
NBC experienced the greatest
increase (6%) and held its lead
with an average viewership of
8.9 million.
The Audience for Evening News Grows
Average viewership in millions for all three networks (NBC, CBS, ABC)
Source: Nielsen Media Research
PEW RESEARCH CENTER
37
PEW RESEARCH CENTER
www.pewresearch.org
0
2
4
6
8
10
2008 2009 2010 2011 2012 2013 2014
NBC ABC CBS
million
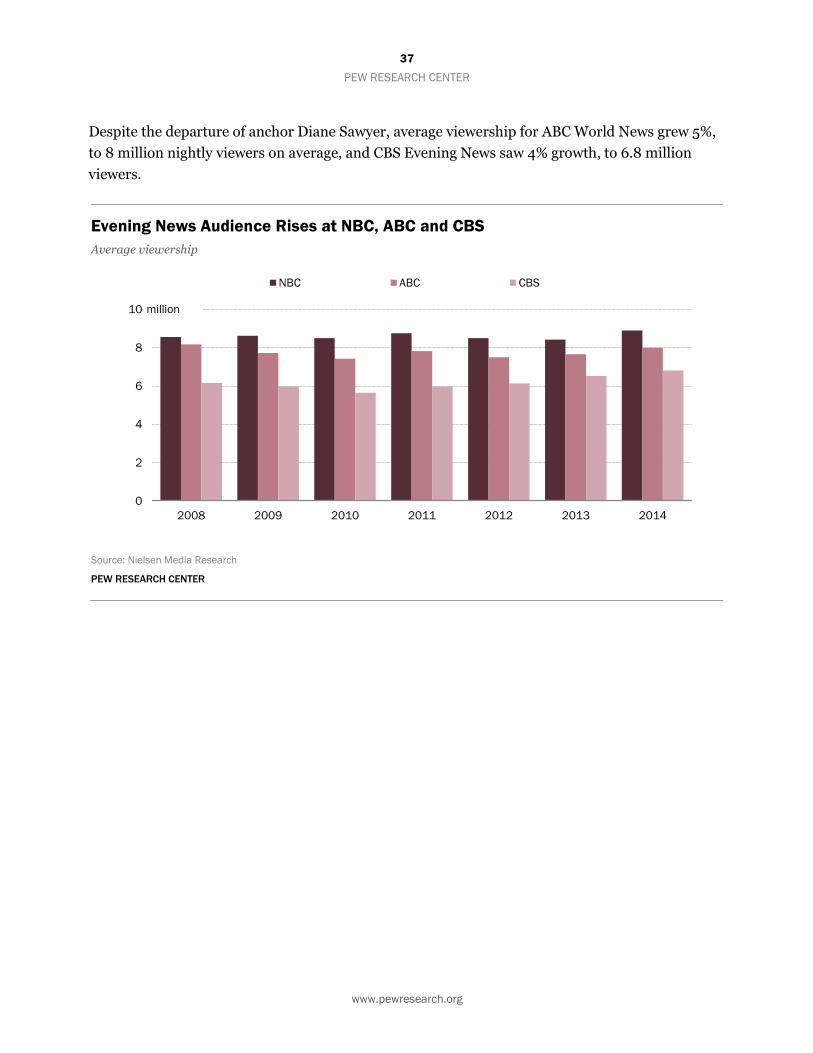
Despite the departure of anchor Diane Sawyer, average viewership for ABC World News grew 5%,
to 8 million nightly viewers on average, and CBS Evening News saw 4% growth, to 6.8 million
viewers.
Evening News Audience Rises at NBC, ABC and CBS
Average viewership
Source: Nielsen Media Research
PEW RESEARCH CENTER
38
PEW RESEARCH CENTER
www.pewresearch.org
0
2
4
6
2008 2009 2010 2011 2012 2013 2014
NBC ABC CBS
million
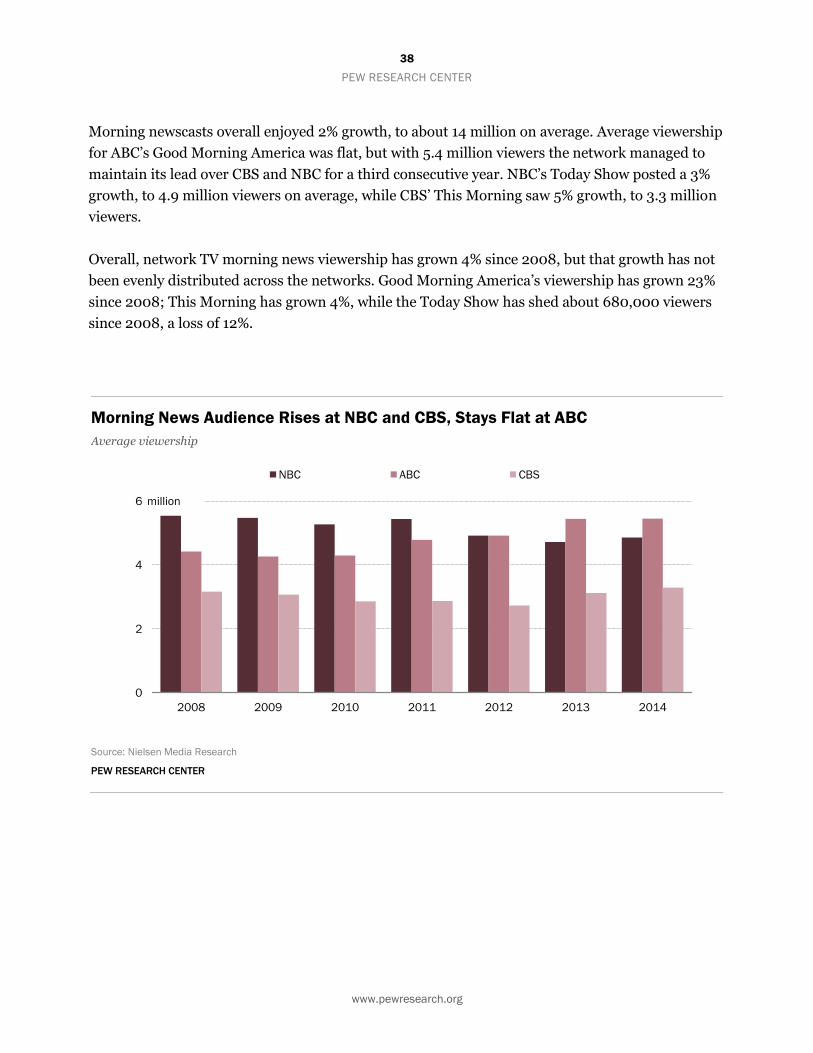
Morning newscasts overall enjoyed 2% growth, to about 14 million on average. Average viewership
for ABC’s Good Morning America was flat, but with 5.4 million viewers the network managed to
maintain its lead over CBS and NBC for a third consecutive year. NBC’s Today Show posted a 3%
growth, to 4.9 million viewers on average, while CBS’ This Morning saw 5% growth, to 3.3 million
viewers.
Overall, network TV morning news viewership has grown 4% since 2008, but that growth has not
been evenly distributed across the networks. Good Morning America’s viewership has grown 23%
since 2008; This Morning has grown 4%, while the Today Show has shed about 680,000 viewers
since 2008, a loss of 12%.
Morning News Audience Rises at NBC and CBS, Stays Flat at ABC
Average viewership
Source: Nielsen Media Research
PEW RESEARCH CENTER

39
PEW RESEARCH CENTER
www.pewresearch.org
0
1
2
3
4
2012* 2013 2014
Fox News
Sunday
Meet the Press
This Week
Face the Nation
million
Sunday Morning Talk Shows
The combined average
audience for the Sunday
political talk shows on ABC,
CBS and NBC in 2014 was 8.6
million people, trailing the
weekly morning news
audience by about 5 million.
CBS’ Face the Nation
remained at the top, attracting
more than 3 million viewers
on average, up 2% from the
year before. ABC’s This Week
came in second with 2.8
million viewers, up 7% from
2013.
NBC’s Meet the Press, on the
other hand, continued to lose
viewers in 2014. After a 6%
decline in 2013, the show lost
another 4% in 2014, to an average of 2.7 million people. And that decline cut across the entire
year, even after the network in September replaced David Gregory with Chuck Todd (down 5%
between September and December 2014, compared with the same period in 2013).
For the past 19 years, Fox has provided its broadcast affiliates with a Sunday morning talk show,
Fox News Sunday, which came in fourth place with 1.2 million viewers, up 6% from the year
before.
Meet the Press Viewership Continues to Decline
Average viewership
Source: Nielsen Media Research
Note: 2012 average viewership includes data from July to December 2012. 2013 and 2014
averages reflect full year data. 2012 data are not available for Fox News Sunday.
PEW RESEARCH CENTER

40
PEW RESEARCH CENTER
www.pewresearch.org
0
3
6
9
12
15
2009 2010 2011 2012 2013 2014
48 Hours
60 Minutes
Dateline Sunday
Nightline
Dateline Friday 20/20
million
TV News Magazines
Audiences for most television
news magazine programs were
down or flat in 2014. The two
exceptions were ABC’s 20/20
(15% growth) and Dateline
NBC’s Friday edition (up
10%).
TV News Magazine Viewership
Average viewership
Source: Nielsen Media Research
Note: Dateline Sunday only airs in the spring; Dateline Friday data for April 2013 are not
available and therefore are not included in the 2013 average.
PEW RESEARCH CENTER
41
PEW RESEARCH CENTER
www.pewresearch.org
0
50
100
150
200
2013 2014
NBC (Nightly News) ABC (World News Tonight) CBS (Evening News)
million
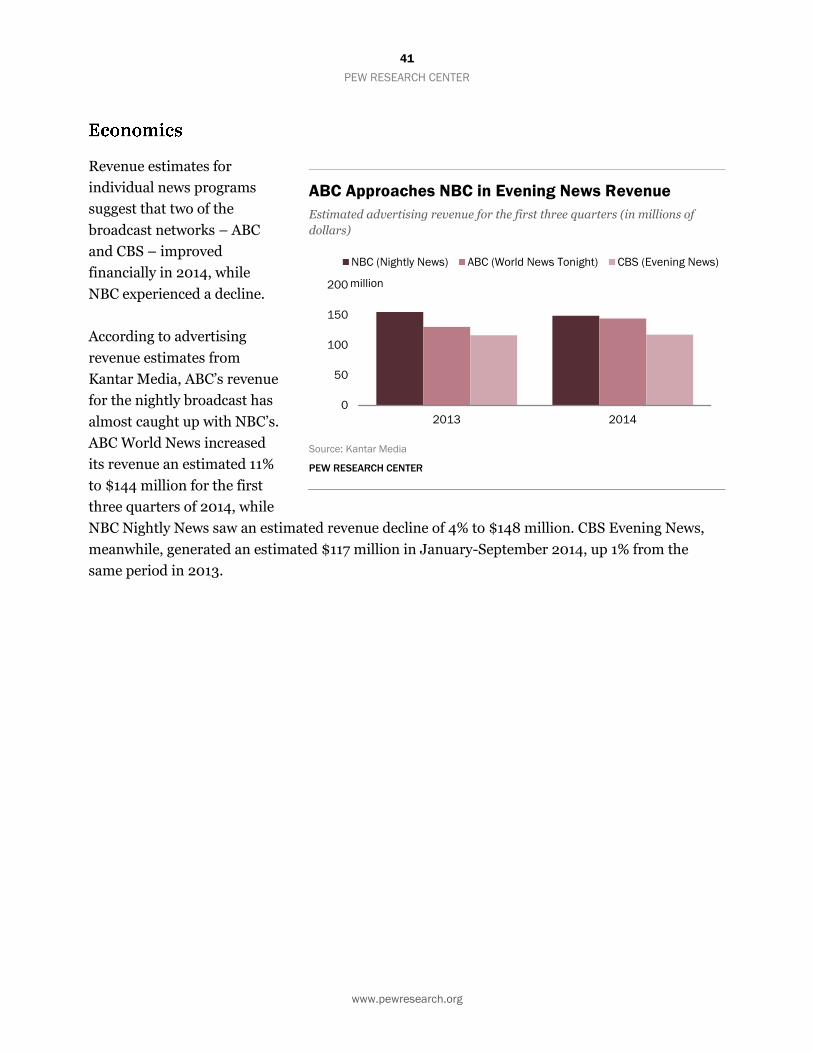
Revenue estimates for
individual news programs
suggest that two of the
broadcast networks – ABC
and CBS – improved
financially in 2014, while
NBC experienced a decline.
According to advertising
revenue estimates from
Kantar Media, ABC’s revenue
for the nightly broadcast has
almost caught up with NBC’s.
ABC World News increased
its revenue an estimated 11%
to $144 million for the first
three quarters of 2014, while
NBC Nightly News saw an estimated revenue decline of 4% to $148 million. CBS Evening News,
meanwhile, generated an estimated $117 million in January-September 2014, up 1% from the
same period in 2013.
ABC Approaches NBC in Evening News Revenue
Estimated advertising revenue for the first three quarters (in millions of
dollars)
Source: Kantar Media
PEW RESEARCH CENTER

42
PEW RESEARCH CENTER
www.pewresearch.org
0
100
200
300
400
500
600
2013 2014
NBC (Today) ABC (GMA) CBS (This Morning)
million
In the morning, CBS’ This
Morning saw the greatest
year-to-year growth (11%) but
the show brought in the least
revenue for 2014 – $162
million, according to the
same data. ABC’s Good
Morning America generated
more than twice as much –
an estimated $363 million,
up 4% from 2013. NBC’s
Today Show remained the
revenue leader at an
estimated $435 million, but
saw its revenue decline 12%
from 2013.
Today Show Remains Morning Show Revenue Leader
Annual estimated advertising revenue (in millions of dollars)
Source: Kantar Media
PEW RESEARCH CENTER
43
PEW RESEARCH CENTER
www.pewresearch.org
65,300
56,424
47,053
28,381
22,353
18,371
39,616
37,153
31,471
ABC News
NBC News
CBS News
Total Digital Population Desktop Mobile
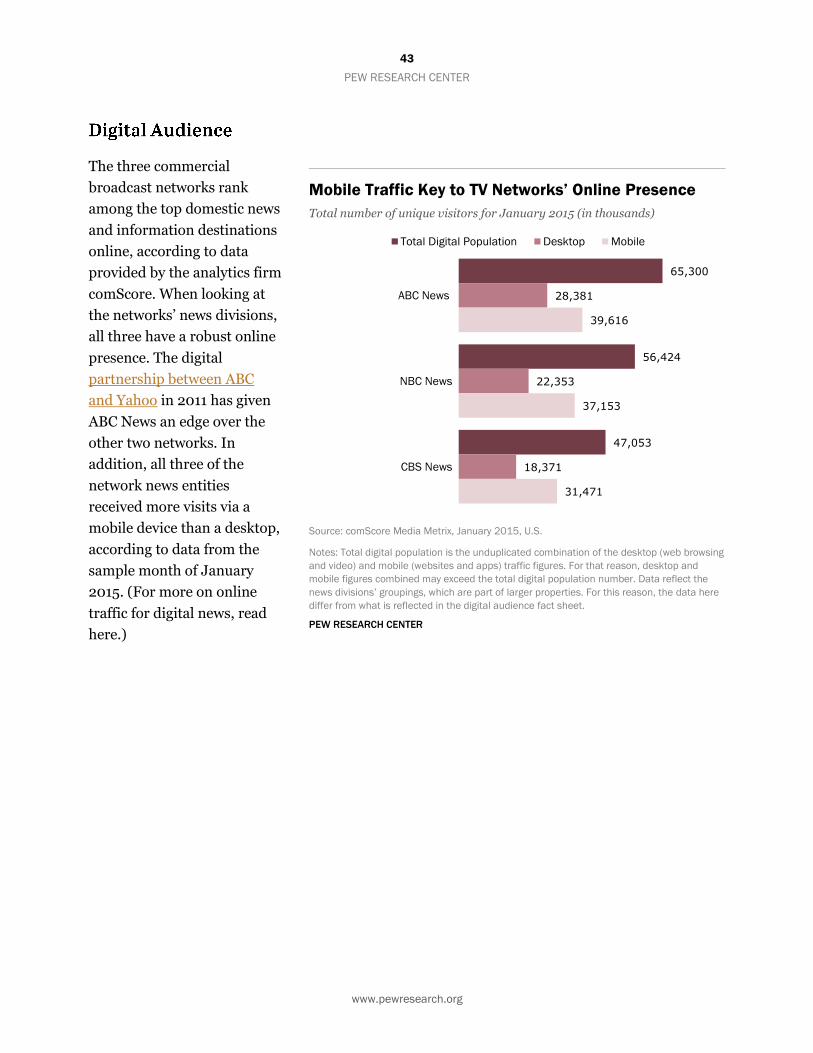
The three commercial
broadcast networks rank
among the top domestic news
and information destinations
online, according to data
provided by the analytics firm
comScore. When looking at
the networks’ news divisions,
all three have a robust online
presence. The digital
partnership between ABC
and Yahoo in 2011 has given
ABC News an edge over the
other two networks. In
addition, all three of the
network news entities
received more visits via a
mobile device than a desktop,
according to data from the
sample month of January
2015. (For more on online
traffic for digital news, read
here.)
Mobile Traffic Key to TV Networks’ Online Presence
Total number of unique visitors for January 2015 (in thousands)
Source: comScore Media Metrix, January 2015, U.S.
Notes: Total digital population is the unduplicated combination of the desktop (web browsing
and video) and mobile (websites and apps) traffic figures. For that reason, desktop and
mobile figures combined may exceed the total digital population number. Data reflect the
news divisions’ groupings, which are part of larger properties. For this reason, the data here
differ from what is reflected in the digital audience fact sheet.
PEW RESEARCH CENTER

44
PEW RESEARCH CENTER
www.pewresearch.org
0
5
10
15
20
25
30
2010 2011 2012 2013 2014
Early Evening
News
Late Night
News
Morning News
million
Local TV News Fact Sheet
BY Katerina Eva Matsa
Last updated April 2015
Local television stations enjoyed a year of higher revenue and slightly higher viewership in 2014.
Growth in advertising revenue largely resulted from increased political advertising spending.
Viewership increased in two of the three key time slots, following gains from the previous year.
At local network affiliate television stations, viewership in 2014 increased slightly in morning and
early evening time slots – 2%
and 3% respectively
compared with 2013,
according to a Pew Research
Center analysis of Nielsen
Media Research data. Late
night newscasts lost 1% of
their audience. The numbers
were much better for
nontraditional dayparts. Very
early morning news remained
the biggest growth area, with
4:30 a.m. newscasts seeing a
6% boost from the year
before. Stations also
continued to experiment with
news at 4 a.m., starting and
stopping newscasts at that
time throughout the four
sweeps months. In February,
for example, 22 ABC affiliates
aired news at 4 a.m., but only four were doing so in November. News at midday posted 8% growth,
while local news at 7 p.m. Eastern time or equivalent (after the network news or early evening local
news) was up more than 10%.
Local News Viewership Increases in Early Evening and
Morning News; Slight Decline for Late Night News
Source: Nielsen Media Research
Note: Numbers represent ABC, CBS, Fox and NBC affiliates.
PEW RESEARCH CENTER

45
PEW RESEARCH CENTER
www.pewresearch.org
0
2
4
6
8
10
2010 2011 2012 2013 2014
Prime-Time News
Morning News
million
The 2014 picture was more mixed for local Fox affiliates. Morning newscasts gained 5% more
audience on average in 2014,
after a 9% increase in 2013.
Since 2010, Fox morning
newscasts have increased
their average viewers 13%.
But the hourlong newscasts
aired at 10 p.m. Eastern time
or the equivalent lost 4% of
their audience in 2014, for a
total loss of 17% since 2010.
Prime-Time Fox Local Newscasts Continue to
Lose Viewers
Source: Nielsen Media Research
Note: Numbers represent Fox affiliates only.
PEW RESEARCH CENTER

46
PEW RESEARCH CENTER
www.pewresearch.org
0
5
10
15
20
25
2004 2005 2006 2007 2008 2009 2010 2011 2012 2013 2014 2015 2016 2017 2018 2019
Over-the-Air Onlinebillion
Local TV stations continued to fare well economically. Much of this is due to political advertising
spending, which after the Supreme Court’s Citizens United ruling seems to guarantee windfalls to
local TV stations in even-numbered years. In 2014 total on-air ad revenue for local stations
reached $20 billion, according to consulting firm BIA/Kelsey, up 7% from the year before and
down 3% compared with 2012, the last election year.
News-producing stations account for the disproportionate amount of the on-air ad revenue. While
68% of all TV stations produce their own news (812 out of 1186 viable, commercial and English-
language stations), they accounted for 84% of the on-air revenue in 2013, the most recent year for
which station-level data are available ($15 billion of the total $18 billion).
Online revenue still accounts for a tiny portion of the total – BIA/Kelsey estimates just 4% in 2014
($800 million). That percentage is not projected to grow much over the next five years.
Local Broadcast TV Advertising Revenue Grew in 2014
Source: BIA/Kelsey
Notes: 2014 is an estimate. 2015-2019 are projections. Online revenue numbers are not available prior to 2010.
PEW RESEARCH CENTER

47
PEW RESEARCH CENTER
www.pewresearch.org
39.7 46.1 42.8 44.9
42 45 43.5 44.7 46.8 48.2 48.6 50
2002 2003 2004 2005 2006 2007 2008 2009 2010 2011 2012 2013
To get a sense of how much of the ad revenue at these news-producing stations goes to news
programming, we consulted another dataset. Survey responses from news directors across the
country indicate that half of the revenue news-producing stations make comes from local news
(RTDNA surveys).
Share of Total Revenue Produced by News Hits a New Record
% of share
Source: RTDNA/Hofstra University Surveys
Notes: Based on survey responses of news directors at all commercial local TV stations in 2013.
PEW RESEARCH CENTER

48
PEW RESEARCH CENTER
www.pewresearch.org
0
1
2
3
4
5
6
7
8
9
10
2006 2007 2008 2009 2010 2011 2012 2013 2014 2015 2016 2017 2018 2019 2020
billion
Other sources of revenue for the local TV industry have been growing. Retransmission payments
have been increasing rapidly in the past decade, according to data from SNL Kagan. In 2014,
retransmission revenue were estimated to reach almost $5 billion, and SNL Kagan projects that
this figure will nearly double by 2020.
Retransmission Fee Revenue for Local Television Signals
Expected to Continuously Grow
Source: SNL Kagan estimates
Notes: Last updated October 2014.
PEW RESEARCH CENTER

49
PEW RESEARCH CENTER
www.pewresearch.org
0
1
2
3
4
5
6
2003 2006 2009 2012
hours
The average amount of weekday local TV news programming declined by 6 minutes in 2013 to 5
hours and 18 minutes, following a drop of another 6 minutes from the year before, according to
RTDNA.
Average Number of News Hours per Weekday
Hits a Plateau
Source: RTDNA/Hofstra University Surveys
Note: Based on survey responses of news directors at all commercial local TV stations in
2013.
PEW RESEARCH CENTER

50
PEW RESEARCH CENTER
www.pewresearch.org
85
65
63
56
45
31
35
31
32
30
85
65
64
55
45
31
32
30
37
28
News Director
Assist. News
Director
News Anchor
Weathercaster
Sports Anchor
News Producer
Graphics
Specialist
News Reporter
News Writer
News Assistant
2013 2012
Staffing levels in the local TV sector were down slightly in 2013, the last year data are available,
according to an annual Hofstra University survey. The survey identified 27,300 full-time jobs in
local television news – down about 400 jobs from 2012. Local TV newsroom salaries rose 2% in
2013.
News Staff Salaries Stagnant in 2013
Median salaries (thousands of U.S. dollars)
Source: RTDNA/Hofstra University Surveys
Notes: Based on survey responses of news directors at all
commercial local TV stations in 2013.
PEW RESEARCH CENTER
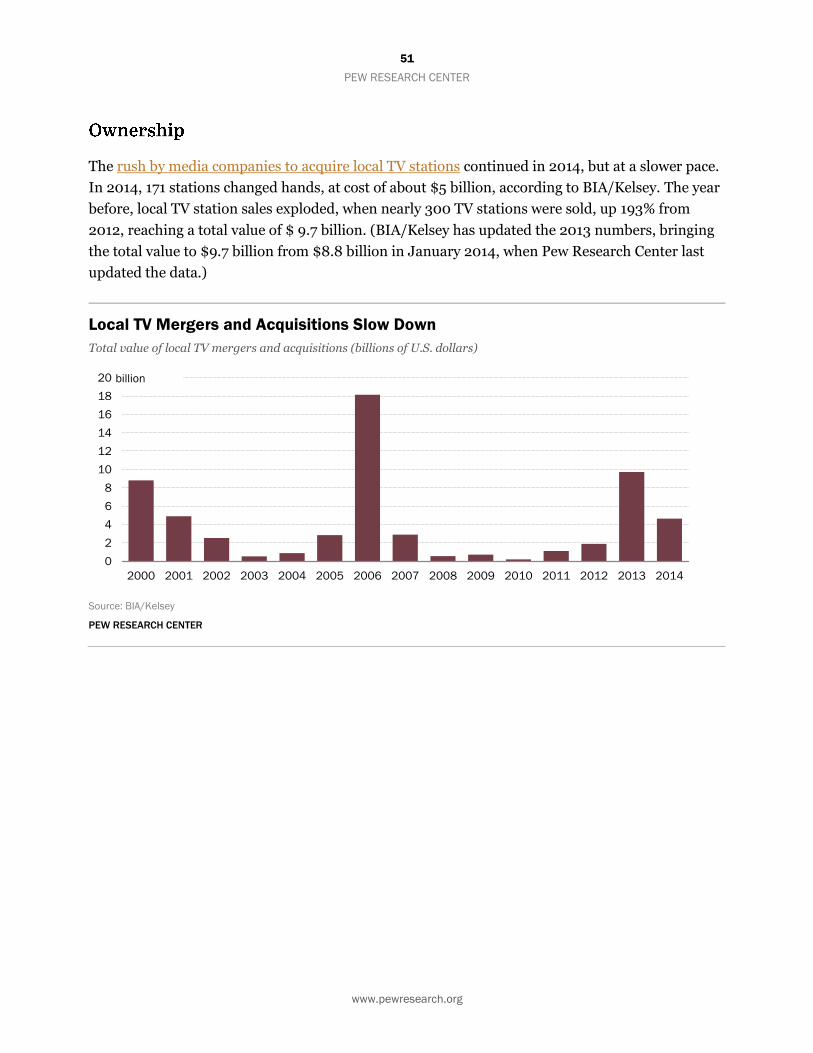
51
PEW RESEARCH CENTER
www.pewresearch.org
0
2
4
6
8
10
12
14
16
18
20
2000 2001 2002 2003 2004 2005 2006 2007 2008 2009 2010 2011 2012 2013 2014
billion
The rush by media companies to acquire local TV stations continued in 2014, but at a slower pace.
In 2014, 171 stations changed hands, at cost of about $5 billion, according to BIA/Kelsey. The year
before, local TV station sales exploded, when nearly 300 TV stations were sold, up 193% from
2012, reaching a total value of $ 9.7 billion. (BIA/Kelsey has updated the 2013 numbers, bringing
the total value to $9.7 billion from $8.8 billion in January 2014, when Pew Research Center last
updated the data.)
Local TV Mergers and Acquisitions Slow Down
Total value of local TV mergers and acquisitions (billions of U.S. dollars)
Source: BIA/Kelsey
PEW RESEARCH CENTER

52
PEW RESEARCH CENTER
www.pewresearch.org
Podcasting Fact Sheet
BY Nancy Vogt
Last updated April 2015
In the fall of 2014, the medium of podcasting achieved a milestone moment. The podcast Serial –
which reinvestigated the 1999 murder of Maryland high school student Hae Min Lee – became the
fastest podcast to reach 5 million streams or downloads in iTunes history. Although the success of
Serial – a spinoff of WBEZ’s This American Life – clearly represented a new peak in the popularity
of podcasts, Pew Research Center data show that the medium has, in fact, been steadily growing
its audience over the past two years. Advances in technology – in particular, the rapid growth in
use of smartphones and mobile devices in addition to the increased ease of in-car listening – have
contributed to the uptick of interest in podcasts.
The increased reach and upward trend line of podcast consumption is evident in every available
measure – the percentage of Americans who are listening to podcasts, the level of public
awareness, and how many podcasts are being hosted and downloaded. An additional indicator of
the strong growth of podcasts in 2014 is reflected in the launch of three new podcast networks by
public radio alone: Radiotopia by PRX (February), SoundWorks by PRI (May) and Infinite Guest
by APM (August).

53
PEW RESEARCH CENTER
www.pewresearch.org
0
10
20
30
40
50
60
70
80
90
100
2008 2009 2010 2011 2012 2013 2014 2015
%
The percentage of Americans
who have listened to a
podcast in the past month
has almost doubled since
2008, from 9% to 17% by
January of 2015. The
percentage listening in 2015
was up two points over 2014
levels (15%).
Americans Who Have Listened to a Podcast in the Past
Month Nearly Doubled Since 2008
% U.S. population age 12 or older
Source: Edison Research
Note: Edison surveys are conducted in January and February of each year.
PEW RESEARCH CENTER

54
PEW RESEARCH CENTER
www.pewresearch.org
0
10
20
30
40
50
60
70
80
90
100
2006 2007 2008 2009 2010 2011 2012 2013 2014 2015
%
Edison Research also reported that fully one-third (33%) of all Americans 12 years of age or older
now say they have listened to
at least one podcast.
One-Third of Americans Have Listened to a Podcast
% of population age 12 or older
Source: Edison Research
Note: Edison surveys are conducted in January and February of each year.
PEW RESEARCH CENTER

55
PEW RESEARCH CENTER
www.pewresearch.org
0
10
20
30
40
50
60
70
80
90
100
2006 2007 2008 2009 2010 2011 2012 2013 2014 2015
%
Awareness of podcasting
among Americans 12 years of
age and older has more than
doubled since 2006, when
Nielsen measured it at 22%.
Overall awareness of
podcasting is increasing at a
modest pace, with roughly
half (49%) of Americans ages
12 and up aware of
podcasting by early 2015, up
only slightly since 2010
(45%).
Awareness of Podcasts Has More Than Doubled
Since 2006
% of U.S. population age 12 or older
Source: Edison Research
Note: Edison surveys are conducted in January and February of each year.
PEW RESEARCH CENTER
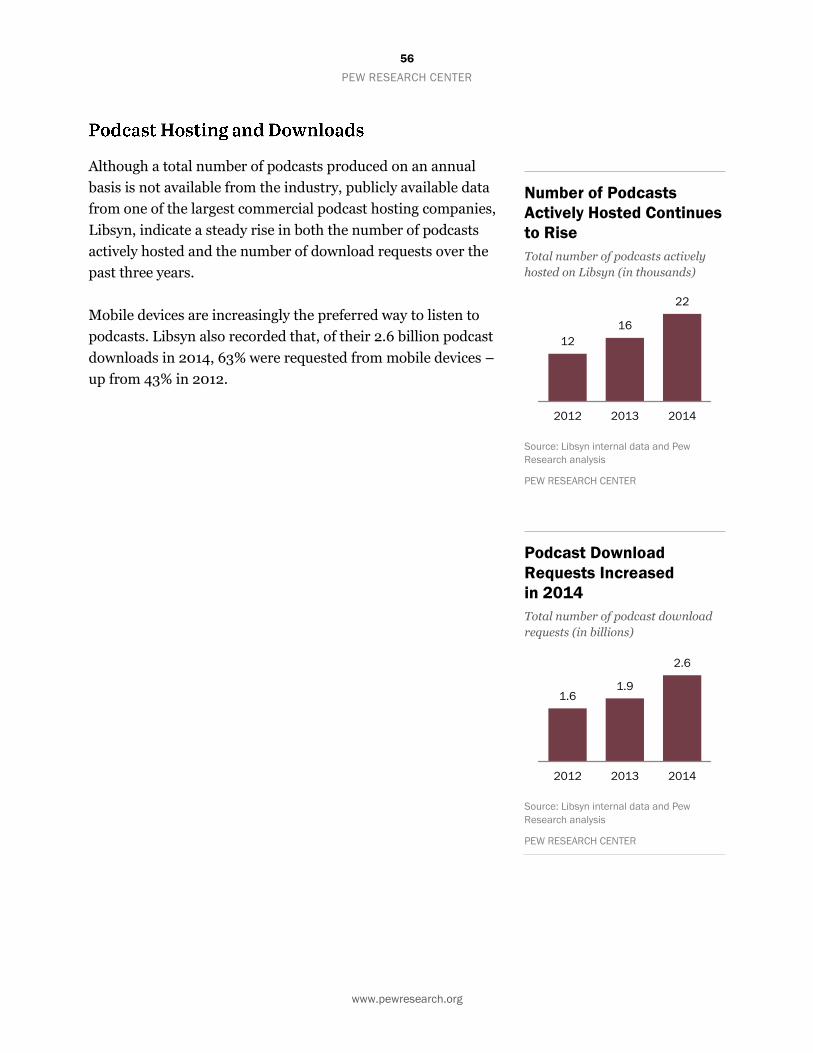
56
PEW RESEARCH CENTER
www.pewresearch.org
12
16
22
2012 2013 2014
1.6 1.9
2.6
2012 2013 2014
Although a total number of podcasts produced on an annual
basis is not available from the industry, publicly available data
from one of the largest commercial podcast hosting companies,
Libsyn, indicate a steady rise in both the number of podcasts
actively hosted and the number of download requests over the
past three years.
Mobile devices are increasingly the preferred way to listen to
podcasts. Libsyn also recorded that, of their 2.6 billion podcast
downloads in 2014, 63% were requested from mobile devices –
up from 43% in 2012.
Number of Podcasts
Actively Hosted Continues
to Rise
Total number of podcasts actively
hosted on Libsyn (in thousands)
Source: Libsyn internal data and Pew
Research analysis
PEW RESEARCH CENTER
Podcast Download
Requests Increased
in 2014
Total number of podcast download
requests (in billions)
Source: Libsyn internal data and Pew
Research analysis
PEW RESEARCH CENTER

57
PEW RESEARCH CENTER
www.pewresearch.org
Audio Fact Sheet
BY Nancy Vogt
Last updated April 2015
More than half of Americans ages 12 and older have listened to online radio in the past month,
according to 2015 survey data from Edison Research – a clear indication that online listening
continues to move rapidly into the consumer mainstream. And more of that listening is now being
done through mobile devices than through desktops. Traditional AM/FM radio, meanwhile,
continues to reach the overwhelming majority of the American public – 91% of Americans ages 12
and older had listened in the week before they were surveyed in 2014, according to a Pew Research
Center analysis of Nielsen Media Research data, essentially unchanged from 2013. And Sirius XM
– the only satellite radio platform in the U.S. – reported a boost in subscriber numbers of almost
7% from 2013.
On the financial side, AM/FM’s revenue from “spot” advertising (ads aired during radio
broadcasts, its main revenue source) declined slightly in 2014 while revenue from digital and off-
air advertising both posted strong gains. Sirius XM saw an increase in revenue of 10%, up from
$3.8 billion in 2013 to $4.2 billion in 2014.
According to Nielsen, the number of all-news radio stations declined slightly in 2014, to 31.
News/talk/information remains one of the most popular broadcast formats for American radio
listeners, second only to the category of country and new country – but the number of stations has
fluctuated over the past few years.
Data on podcasts – which also had a breakthrough year of sorts largely due to the popularity of the
show Serial – and on NPR are analyzed in separate fact sheets.

58
PEW RESEARCH CENTER
www.pewresearch.org
0
10
20
30
40
50
60
2007 2008 2009 2010 2011 2012 2013 2014 2015
%
In 2015, the percentage of Americans 12 years of age or older who reported listening to radio
online in the past month rose
to 53% – nearly double the
percentage who had done so
only five years earlier in 2010
(27%). Smartphones are
becoming the device of choice
for online radio listening:
73% listened via smartphones
in the last week, up from 66%
in 2014. Desktops and
laptops are not far behind, at
61%, though this was down
from the previous year (67%).
Monthly Online Radio Listeners Have Doubled Since
2010
% of Americans ages 12 or older who have listened to online radio in the past
month
Source: Edison Research
Note: Edison surveys are conducted in January and February of each year.
PEW RESEARCH CENTER
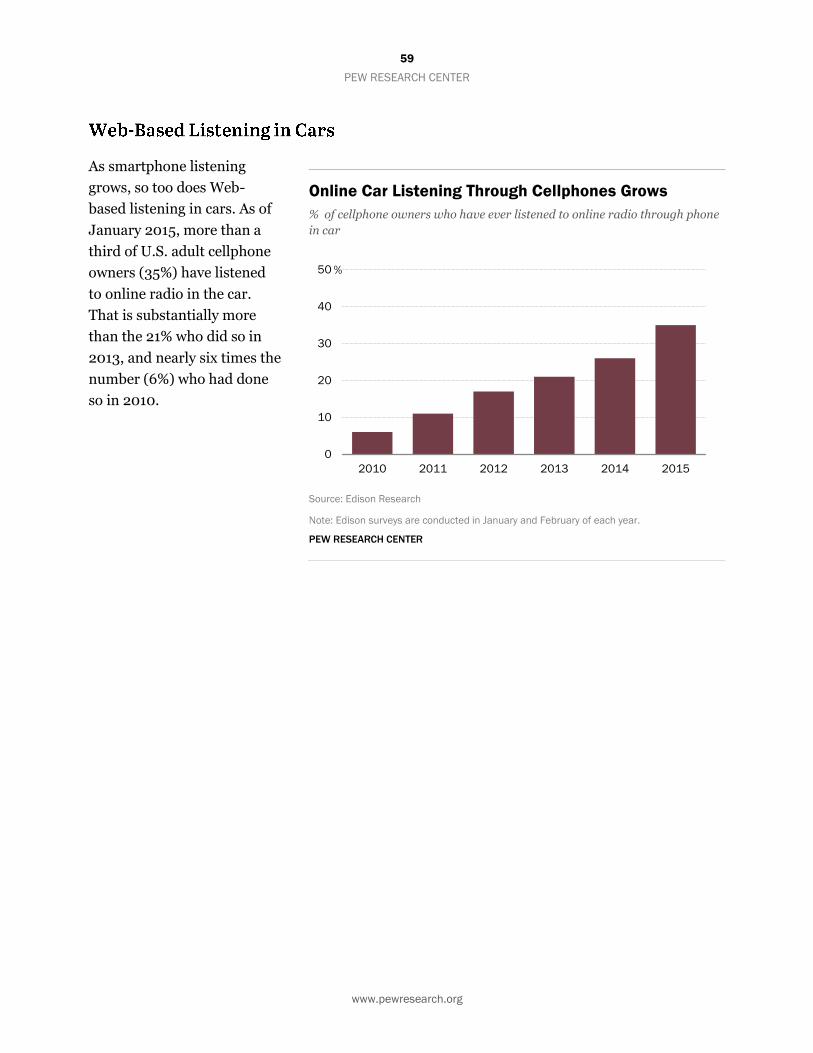
59
PEW RESEARCH CENTER
www.pewresearch.org
0
10
20
30
40
50
2010 2011 2012 2013 2014 2015
%
As smartphone listening
grows, so too does Web-
based listening in cars. As of
January 2015, more than a
third of U.S. adult cellphone
owners (35%) have listened
to online radio in the car.
That is substantially more
than the 21% who did so in
2013, and nearly six times the
number (6%) who had done
so in 2010.
Online Car Listening Through Cellphones Grows
% of cellphone owners who have ever listened to online radio through phone
in car
Source: Edison Research
Note: Edison surveys are conducted in January and February of each year.
PEW RESEARCH CENTER
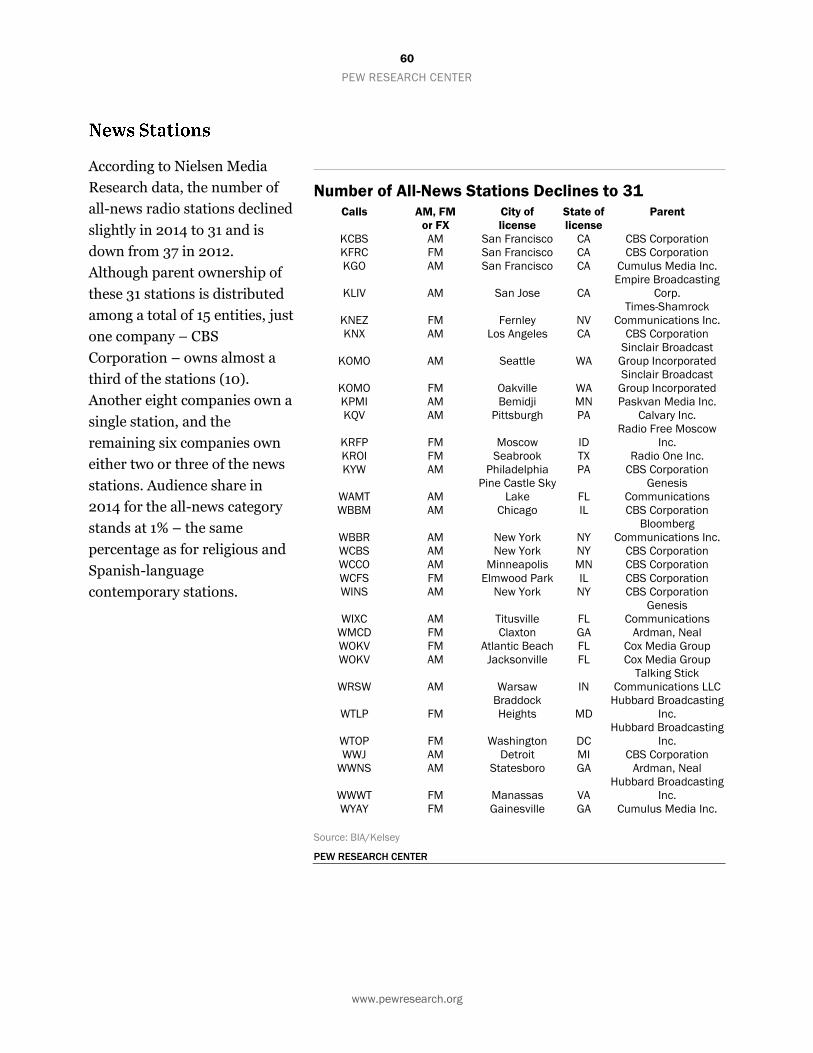
60
PEW RESEARCH CENTER
www.pewresearch.org
According to Nielsen Media
Research data, the number of
all-news radio stations declined
slightly in 2014 to 31 and is
down from 37 in 2012.
Although parent ownership of
these 31 stations is distributed
among a total of 15 entities, just
one company – CBS
Corporation – owns almost a
third of the stations (10).
Another eight companies own a
single station, and the
remaining six companies own
either two or three of the news
stations. Audience share in
2014 for the all-news category
stands at 1% – the same
percentage as for religious and
Spanish-language
contemporary stations.
Number of All-News Stations Declines to 31 Calls AM, FM
or FX
City of
license
State of
license
Parent
KCBS AM San Francisco CA CBS Corporation
KFRC FM San Francisco CA CBS Corporation
KGO AM San Francisco CA Cumulus Media Inc.
KLIV AM San Jose CA
Empire Broadcasting
Corp.
KNEZ FM Fernley NV
Times-Shamrock
Communications Inc.
KNX AM Los Angeles CA CBS Corporation
KOMO AM Seattle WA
Sinclair Broadcast
Group Incorporated
KOMO FM Oakville WA
Sinclair Broadcast
Group Incorporated
KPMI AM Bemidji MN Paskvan Media Inc.
KQV AM Pittsburgh PA Calvary Inc.
KRFP FM Moscow ID
Radio Free Moscow
Inc.
KROI FM Seabrook TX Radio One Inc.
KYW AM Philadelphia PA CBS Corporation
WAMT AM
Pine Castle Sky
Lake FL
Genesis
Communications
WBBM AM Chicago IL CBS Corporation
WBBR AM New York NY
Bloomberg
Communications Inc.
WCBS AM New York NY CBS Corporation
WCCO AM Minneapolis MN CBS Corporation
WCFS FM Elmwood Park IL CBS Corporation
WINS AM New York NY CBS Corporation
WIXC AM Titusville FL
Genesis
Communications
WMCD FM Claxton GA Ardman, Neal
WOKV FM Atlantic Beach FL Cox Media Group
WOKV AM Jacksonville FL Cox Media Group
WRSW AM Warsaw IN
Talking Stick
Communications LLC
WTLP FM
Braddock
Heights MD
Hubbard Broadcasting
Inc.
WTOP FM Washington DC
Hubbard Broadcasting
Inc.
WWJ AM Detroit MI CBS Corporation
WWNS AM Statesboro GA Ardman, Neal
WWWT FM Manassas VA
Hubbard Broadcasting
Inc.
WYAY FM Gainesville GA Cumulus Media Inc.
Source: BIA/Kelsey
PEW RESEARCH CENTER

61
PEW RESEARCH CENTER
www.pewresearch.org
0
400
800
1,200
1,600
2,000
2,400
2010 2011 2012 2013 2014
News/talk/information
stations make up one of the
most popular broadcast radio
formats, garnering an 11%
share of listeners among the
age 12-and-up demographic in
2014. That is second only to
country music. The number of
stations, however, has seen
some fluctuation over the past
few years.
Number of News/Talk/Information Radio Stations
Fluctuates Between 1,900 and 2,000
Number of news/talk/information radio stations
Source: Nielsen Media Research
PEW RESEARCH CENTER
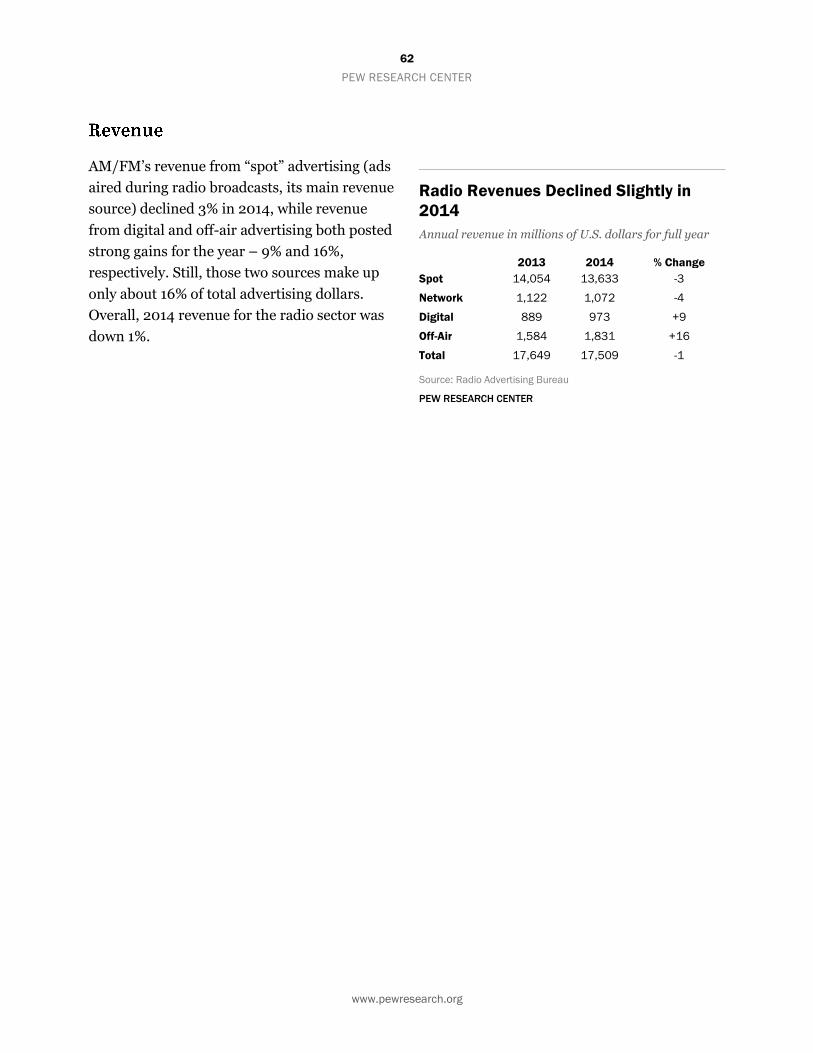
62
PEW RESEARCH CENTER
www.pewresearch.org
AM/FM’s revenue from “spot” advertising (ads
aired during radio broadcasts, its main revenue
source) declined 3% in 2014, while revenue
from digital and off-air advertising both posted
strong gains for the year – 9% and 16%,
respectively. Still, those two sources make up
only about 16% of total advertising dollars.
Overall, 2014 revenue for the radio sector was
down 1%.
Radio Revenues Declined Slightly in
2014
Annual revenue in millions of U.S. dollars for full year
2013 2014 % Change
Spot 14,054 13,633 -3
Network 1,122 1,072 -4
Digital 889 973 +9
Off-Air 1,584 1,831 +16
Total 17,649 17,509 -1
Source: Radio Advertising Bureau
PEW RESEARCH CENTER

63
PEW RESEARCH CENTER
www.pewresearch.org
Public Broadcasting Fact Sheet
BY Nancy Vogt AND Katerina Eva Matsa
Last updated April 2015
Note: The Pew Research Center was unable to obtain the same audience and financial data from
PBS Newshour that we have relied upon in past years, but Web traffic data provided by the
analytics firm comScore is included here.
NPR saw a number of significant developments in 2014. On July 1, veteran media executive Jarl
Mohn took the helm at the public radio network as new president and CEO, becoming the fifth
leader of the organization in the past several years. Mohn signed a five-year contract and is
charged with erasing a multimillion-dollar deficit by the end of the 2015 fiscal year. NPR also
continued to focus throughout the year on expanding its digital presence across multiple
platforms. These efforts included the launch of the NPR One application, a partnership with Apple
making it the first news provider on iTunes; plans to work with several automakers to stream
digital content in connected cars; and the creation of two new topical online verticals. The network
also opened a bureau in Seoul, South Korea.
Although the broadcaster saw a slight decline in the number of member organizations in 2014,
there were increases in the number of associate and full member stations, as well as in the number
of stations airing NPR programming. The public radio network gained a double-digit increase in
audience over 2013 for both NPR.org and station websites. Overall digital revenue continued to
grow in 2014, in part as the result of substantial increases in podcast underwriting.
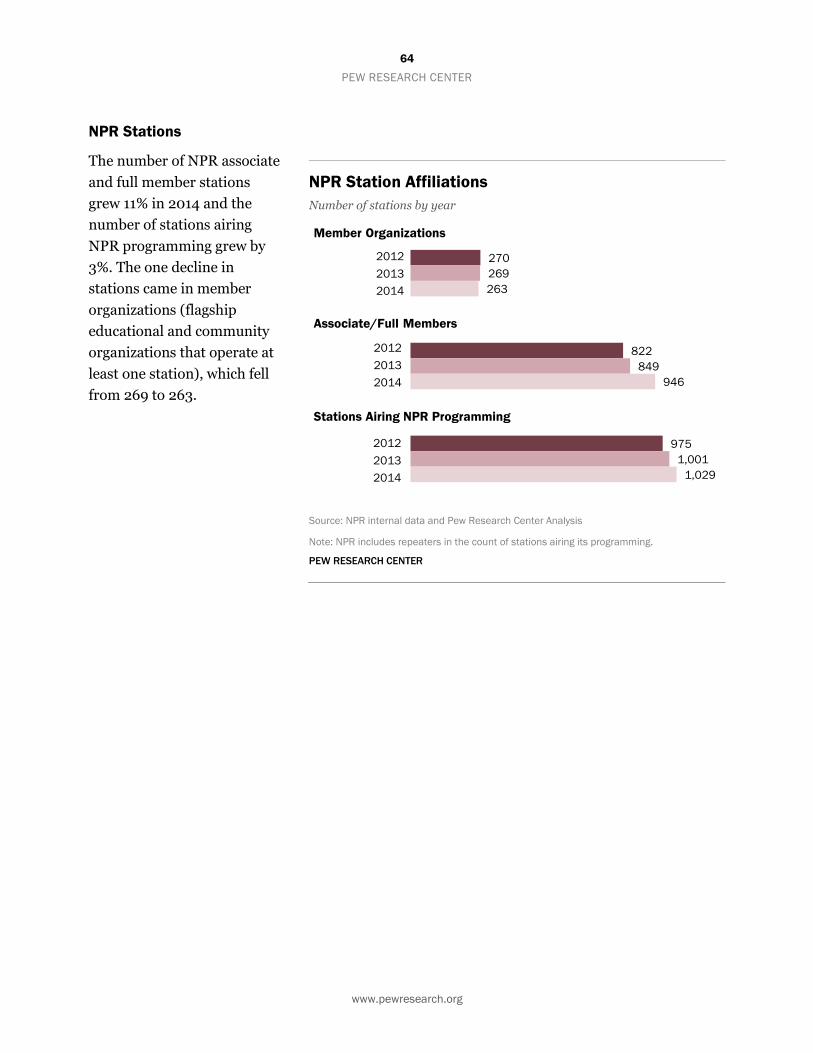
64
PEW RESEARCH CENTER
www.pewresearch.org
270
822
975
269
849
1,001
263
946
1,029
2012
2013
2014
2012
2013
2014
2012
2013
2014
Member Organizations
Associate/Full Members
Stations Airing NPR Programming
NPR Stations
The number of NPR associate
and full member stations
grew 11% in 2014 and the
number of stations airing
NPR programming grew by
3%. The one decline in
stations came in member
organizations (flagship
educational and community
organizations that operate at
least one station), which fell
from 269 to 263.
NPR Station Affiliations
Number of stations by year
Source: NPR internal data and Pew Research Center Analysis
Note: NPR includes repeaters in the count of stations airing its programming.
PEW RESEARCH CENTER
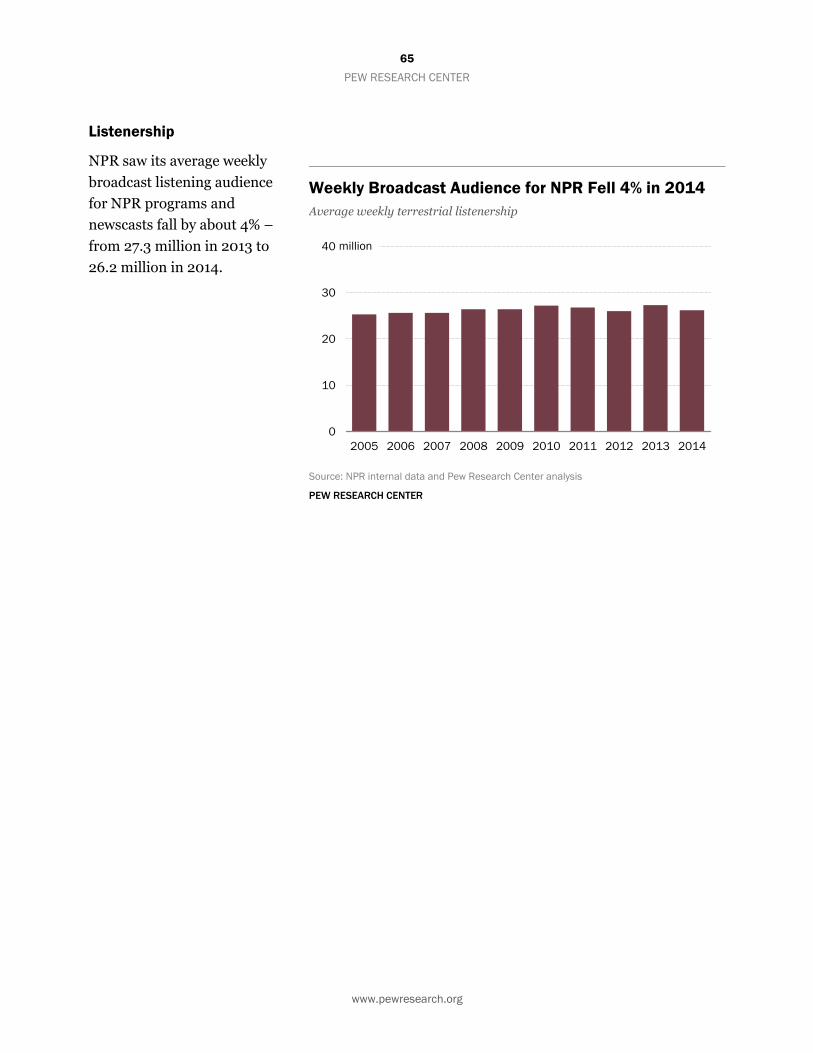
65
PEW RESEARCH CENTER
www.pewresearch.org
0
10
20
30
40
2005 2006 2007 2008 2009 2010 2011 2012 2013 2014
million
Listenership
NPR saw its average weekly
broadcast listening audience
for NPR programs and
newscasts fall by about 4% –
from 27.3 million in 2013 to
26.2 million in 2014.
Weekly Broadcast Audience for NPR Fell 4% in 2014
Average weekly terrestrial listenership
Source: NPR internal data and Pew Research Center analysis
PEW RESEARCH CENTER
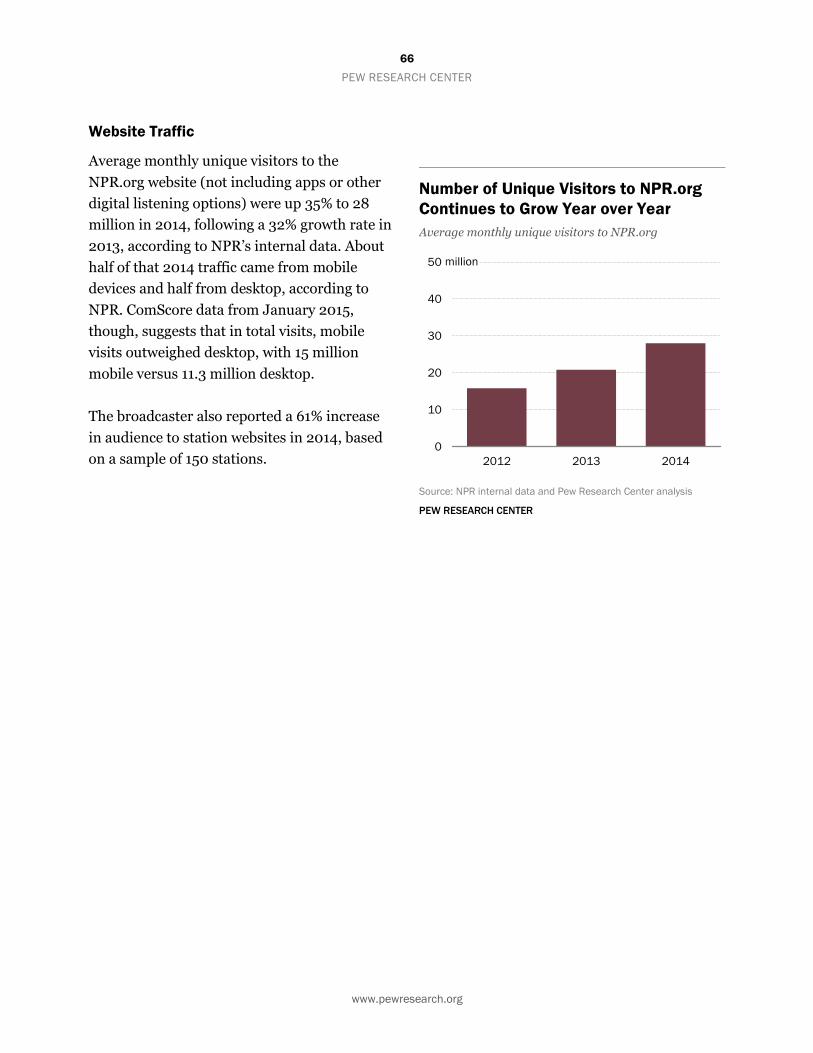
66
PEW RESEARCH CENTER
www.pewresearch.org
0
10
20
30
40
50
2012 2013 2014
million
Website Traffic
Average monthly unique visitors to the
NPR.org website (not including apps or other
digital listening options) were up 35% to 28
million in 2014, following a 32% growth rate in
2013, according to NPR’s internal data. About
half of that 2014 traffic came from mobile
devices and half from desktop, according to
NPR. ComScore data from January 2015,
though, suggests that in total visits, mobile
visits outweighed desktop, with 15 million
mobile versus 11.3 million desktop.
The broadcaster also reported a 61% increase
in audience to station websites in 2014, based
on a sample of 150 stations.
Number of Unique Visitors to NPR.org
Continues to Grow Year over Year
Average monthly unique visitors to NPR.org
Source: NPR internal data and Pew Research Center analysis
PEW RESEARCH CENTER

67
PEW RESEARCH CENTER
www.pewresearch.org
38
54
2013 2014
Podcasts at NPR
Podcasting is a big area for growth at NPR, both in audience
and revenue. The average number of monthly podcast
downloads from NPR in 2014 is up over 40% from 2013. While
some of this growth can be attributed to the general growth in
podcast listening overall, NPR also actively promoted its
podcasts. Underwriting for NPR podcasts continues to trend
upward and is a strong contributor to digital revenue growth.
The broadcaster reported that podcast underwriting doubled
from fiscal 2013 to fiscal 2014 and that – only five months in to
fiscal 2015 – podcast revenue has already exceeded that of fiscal
2014.8
8 NPR does not release the actual revenue numbers, only the rate of growth.
Average Monthly NPR
Podcast Downloads Up in
2014
Average monthly podcast
downloads (in millions)
Source: NPR internal data and Pew
Research Center analysis.
Note: 2013 includes months of March–
December only. 2014 does not include May
due to an iTunes methodological issue.
PEW RESEARCH CENTER

68
PEW RESEARCH CENTER
www.pewresearch.org
0
10
20
30
40
50
60
70
Jan Feb Mar Apr May Jun Jul Aug Sep Oct Nov Dec
million
The generally upward trend
of podcast downloads from
NPR in 2014 is visible on a
month-to-month basis.
Nearly Steady Month-by-Month Increase in 2014 NPR
Podcast Downloads
Total number of downloaded NPR podcasts by month
Source: NPR internal data and Pew Research Center analysis
Note: NPR reported a methodological issue with iTunes across their podcast partners for the
month of May.
PEW RESEARCH CENTER

69
PEW RESEARCH CENTER
www.pewresearch.org
The online home for PBS’ NewsHour—the
flagship news program—drew nearly 4 million
unique visitors in the month of January 2015.
How does that compare to the web traffic of the
three commercial network news divisions?
During the same month, 56 million visited NBC
News, 47 million visited CBS News and 65
million for Yahoo/ABC News, according to data
provided by comScore.
Online traffic to other public media entities,
such as Marketplace and MPRNews.org, is
relatively low compared with PBS NewsHour.
Mobile Traffic Key to PBS NewsHour
Total number of unique visitors for January 2015 (in
thousands)
Total Digital Population Desktop Mobile
PBS NewsHour 3,905 1,509 2,405
American Public Media Marketplace 506 295 210
MPRNews.org 869 445 426
Source: comScore Media Matrix, January 2015, U.S.
Notes: “Total digital population” is the unduplicated combination of
the desktop (web browsing and video) and mobile (websites and
apps) traffic figures. For that reason, desktop and mobile figures
combined may exceed the total unduplicated population number.
PEW RESEARCH CENTER

70
PEW RESEARCH CENTER
www.pewresearch.org
News Magazine Fact Sheet
BY Katerina Eva Matsa AND Elisa Shearer
Last updated May 2015
Sales of newsstand copies – both print and digital – for 15 news magazines tracked by Pew
Research Center (five that we have tracked for the past seven years and 10 that we added this year)
were down just slightly in 2014 – 1% on average. That is much smaller than the decline felt in the
magazine industry overall, 14%, though there were large differences across the outlets. The group
also grew their sales of digital issues.
News magazines also sparked some major headlines in 2014. The century-old New Republic
magazine fired two top editors, and more than a dozen staff members departed in protest over its
editorial direction and digital strategy. In November 2014, Rolling Stone published “A Rape on
Campus,” a story about an alleged gang rape at a University of Virginia fraternity house, which was
found to involve a number of inconsistencies. Poynter Institute called it the “Error of the Year.”

71
PEW RESEARCH CENTER
www.pewresearch.org
While newsstand sales are a small percentage of most magazines’ print circulation (roughly 7% of
the total), they are considered an important barometer of a magazine’s editorial appeal, since they
are not influenced by discount programs and promotions the way subscription circulation is.
While the overall decline was minimal, some news magazines suffered much greater losses. The
Week was the hardest hit, losing 24% of its newsstand sales, after a 7% decline in 2013. The New
Republic also saw a significant decline in 2014, down 20% from the year before. New York
Magazine, on the other hand, posted significant gains – up 110% – followed by The Atlantic and
Rolling Stone, which increased their sales by 22% and 21% respectively.
News Magazine Single Copy Sales
Average single copy sale circulation
2008 2009 2010 2011 2012 2013 2014
The Atlantic 50,565 44,473 44,505 40,842 37,835 33,468 40,863
The Week 1,817 3,791 2,096 2,080 1,713 1,588 1,203
The New Yorker 43,878 37,049 31,893 32,535 28,532 33,021 33,008
The Economist 71,333 59,890 53,098 46,459 38,437 32,279 28,058
Time 116,780 94,987 75,719 80,176 58,294 61,867 60,145
Newsweek 94,435 63,562 42,762 43,452 41,354 N/A N/A
The Nation N/A N/A N/A 1,469 1,421 1,057 1,018
National Review N/A N/A N/A 6,677 2,717 2,793 2,555
Fortune N/A N/A N/A 24,692 23,304 25,325 27,611
Forbes N/A N/A N/A 25,848 26,311 31,030 28,671
The New Republic N/A N/A N/A N/A 1,942 2,855 2,270
Rolling Stone N/A N/A N/A 97,105 79,666 65,714 79,642
Vanity Fair N/A N/A N/A 336,757 296,129 246,661 207,921
New York Magazine N/A N/A N/A 14,204 12,759 17,706 37,173
Bloomberg
BusinessWeek
N/A N/A N/A 16,596 12,122 11,923 12,272
Wired N/A N/A N/A 77,841 65,391 62,290 58,995
Source: Alliance for Audited Media, AAM Audits and Publisher Statements
Note: National Review, Bloomberg and New York Magazine 12-month audits come out in June. 2011 data for Bloomberg BusinessWeek,
National Review and New York Magazine are from the 6-month publisher’s statements ending in December 2011. 2012 data for The New
Republic are for 3 months ending December 2012; before 2012, The New Republic was not audited by AAM. Newsweek hasn’t been audited
since August 2013.
PEW RESEARCH CENTER
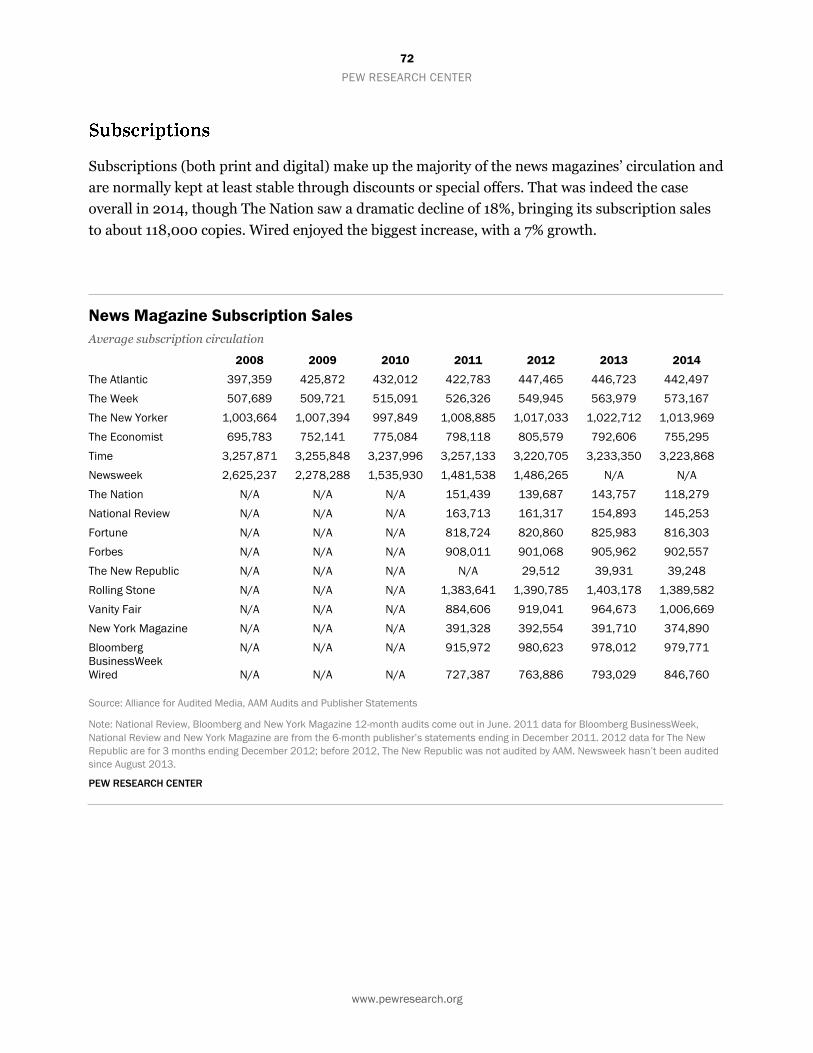
72
PEW RESEARCH CENTER
www.pewresearch.org
Subscriptions (both print and digital) make up the majority of the news magazines’ circulation and
are normally kept at least stable through discounts or special offers. That was indeed the case
overall in 2014, though The Nation saw a dramatic decline of 18%, bringing its subscription sales
to about 118,000 copies. Wired enjoyed the biggest increase, with a 7% growth.
News Magazine Subscription Sales
Average subscription circulation
2008 2009 2010 2011 2012 2013 2014
The Atlantic 397,359 425,872 432,012 422,783 447,465 446,723 442,497
The Week 507,689 509,721 515,091 526,326 549,945 563,979 573,167
The New Yorker 1,003,664 1,007,394 997,849 1,008,885 1,017,033 1,022,712 1,013,969
The Economist 695,783 752,141 775,084 798,118 805,579 792,606 755,295
Time 3,257,871 3,255,848 3,237,996 3,257,133 3,220,705 3,233,350 3,223,868
Newsweek 2,625,237 2,278,288 1,535,930 1,481,538 1,486,265 N/A N/A
The Nation N/A N/A N/A 151,439 139,687 143,757 118,279
National Review N/A N/A N/A 163,713 161,317 154,893 145,253
Fortune N/A N/A N/A 818,724 820,860 825,983 816,303
Forbes N/A N/A N/A 908,011 901,068 905,962 902,557
The New Republic N/A N/A N/A N/A 29,512 39,931 39,248
Rolling Stone N/A N/A N/A 1,383,641 1,390,785 1,403,178 1,389,582
Vanity Fair N/A N/A N/A 884,606 919,041 964,673 1,006,669
New York Magazine N/A N/A N/A 391,328 392,554 391,710 374,890
Bloomberg
BusinessWeek
N/A N/A N/A 915,972 980,623 978,012 979,771
Wired N/A N/A N/A 727,387 763,886 793,029 846,760
Source: Alliance for Audited Media, AAM Audits and Publisher Statements
Note: National Review, Bloomberg and New York Magazine 12-month audits come out in June. 2011 data for Bloomberg BusinessWeek,
National Review and New York Magazine are from the 6-month publisher’s statements ending in December 2011. 2012 data for The New
Republic are for 3 months ending December 2012; before 2012, The New Republic was not audited by AAM. Newsweek hasn’t been audited
since August 2013.
PEW RESEARCH CENTER

73
PEW RESEARCH CENTER
www.pewresearch.org
When it comes to overall circulation – the combination of single copy sales and subscriptions – the
15 news magazines saw a relatively small decline of 1%. The Nation’s subscription decline left it
down 18% overall, while Wired was the big winner. The strong subscription gains helped overcome
the single copy sales losses and increase its overall circulation by 6% in 2014, the highest in the
group.
News Magazine Overall Circulation
Average overall circulation
2008 2009 2010 2011 2012 2013 2014
The Atlantic 448,000 470,345 476,517 463,625 485,300 480,191 483,360
The Week 509,000 513,512 517,187 528,406 551,658 565,567 574,370
The New Yorker 1,047,000 1,044,443 1,029,742 1,041,420 1,045,565 1,055,732 1,046,977
The Economist 767,000 812,031 828,181 844,577 844,016 824,885 783,353
Time 3,374,000 3,350,835 3,313,715 3,337,308 3,278,999 3,295,217 3,284,012
Newsweek 2,720,000 2,309,416 1,578,691 1,524,989 1,527,619 N/A N/A
The Nation N/A N/A N/A 152,908 141,108 144,814 119,297
National Review N/A N/A N/A 170,390 164,034 157,686 147,808
Fortune N/A N/A N/A 843,416 844,164 851,308 843,914
Forbes N/A N/A N/A 933,859 927,379 936,992 931,228
The New Republic N/A N/A N/A N/A 31,454 42,786 41,518
Rolling Stone N/A N/A N/A 1,480,746 1,470,451 1,468,892 1,469,223
Vanity Fair N/A N/A N/A 1,221,363 1,215,170 1,211,334 1,214,590
New York Magazine N/A N/A N/A 405,532 405,313 409,416 412,062
Bloomberg
BusinessWeek
N/A N/A N/A 932,568 992,745 989,935 992,043
Wired N/A N/A N/A 805,228 829,277 855,319 905,755
Source: Alliance for Audited Media, AAM Audits and Publisher Statements
Note: National Review, Bloomberg and New York Magazine 12-month audits come out in June. 2011 data for Bloomberg BusinessWeek,
National Review and New York Magazine are from the 6-month publisher's statements ending in December 2011. 2012 data for The New
Republic are for 3 months ending December 2012; before 2012, The New Republic was not audited by AAM. Newsweek hasn’t been audited
since August 2013.
PEW RESEARCH CENTER
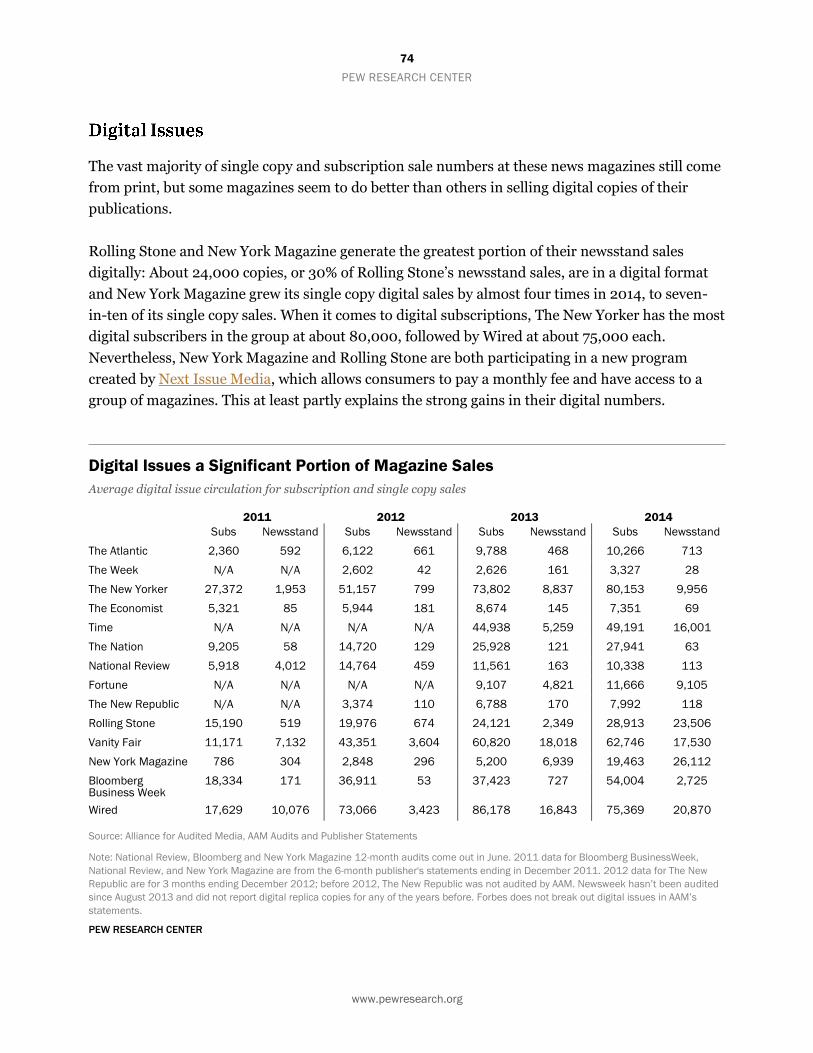
74
PEW RESEARCH CENTER
www.pewresearch.org
The vast majority of single copy and subscription sale numbers at these news magazines still come
from print, but some magazines seem to do better than others in selling digital copies of their
publications.
Rolling Stone and New York Magazine generate the greatest portion of their newsstand sales
digitally: About 24,000 copies, or 30% of Rolling Stone’s newsstand sales, are in a digital format
and New York Magazine grew its single copy digital sales by almost four times in 2014, to seven-
in-ten of its single copy sales. When it comes to digital subscriptions, The New Yorker has the most
digital subscribers in the group at about 80,000, followed by Wired at about 75,000 each.
Nevertheless, New York Magazine and Rolling Stone are both participating in a new program
created by Next Issue Media, which allows consumers to pay a monthly fee and have access to a
group of magazines. This at least partly explains the strong gains in their digital numbers.
Digital Issues a Significant Portion of Magazine Sales
Average digital issue circulation for subscription and single copy sales
2011 2012 2013 2014
Subs Newsstand Subs Newsstand Subs Newsstand Subs Newsstand
The Atlantic 2,360 592 6,122 661 9,788 468 10,266 713
The Week N/A N/A 2,602 42 2,626 161 3,327 28
The New Yorker 27,372 1,953 51,157 799 73,802 8,837 80,153 9,956
The Economist 5,321 85 5,944 181 8,674 145 7,351 69
Time N/A N/A N/A N/A 44,938 5,259 49,191 16,001
The Nation 9,205 58 14,720 129 25,928 121 27,941 63
National Review 5,918 4,012 14,764 459 11,561 163 10,338 113
Fortune N/A N/A N/A N/A 9,107 4,821 11,666 9,105
The New Republic N/A N/A 3,374 110 6,788 170 7,992 118
Rolling Stone 15,190 519 19,976 674 24,121 2,349 28,913 23,506
Vanity Fair 11,171 7,132 43,351 3,604 60,820 18,018 62,746 17,530
New York Magazine 786 304 2,848 296 5,200 6,939 19,463 26,112
Bloomberg Business Week
18,334 171 36,911 53 37,423 727 54,004 2,725
Wired 17,629 10,076 73,066 3,423 86,178 16,843 75,369 20,870
Source: Alliance for Audited Media, AAM Audits and Publisher Statements
Note: National Review, Bloomberg and New York Magazine 12-month audits come out in June. 2011 data for Bloomberg BusinessWeek,
National Review, and New York Magazine are from the 6-month publisher's statements ending in December 2011. 2012 data for The New
Republic are for 3 months ending December 2012; before 2012, The New Republic was not audited by AAM. Newsweek hasn’t been audited
since August 2013 and did not report digital replica copies for any of the years before. Forbes does not break out digital issues in AAM’s
statements.
PEW RESEARCH CENTER

75
PEW RESEARCH CENTER
www.pewresearch.org
In the digital realm, about half of the news magazines studied here received significantly more
visits via a mobile device than a desktop (at least 10% more traffic via mobile than desktop),
according to data provided by the analytics firm comScore for the month of January 2015.
About Half of the News Magazines Have More Online Traffic via Mobile Devices
than Desktop Computers
Total number of unique visitors for January 2015 (in thousands)
Total Digital Population Desktop Mobile
Forbes.com 36,398 19,581 19,372
Time.com 22,688 10,025 13,289
RollingStone.com 13,630 5,540 8,511
Wired.com 9,339 5,240 4,412
NYMag.com 9,296 3,884 5,685
TheAtlantic.com 9,166 4,422 4,977
NewYorker.com 8,784 3,622 5,332
BusinessWeek.com 8,271 5,042 3,465
Fortune.com 6,837 4,601 2,465
TheWeek.com 6,733 2,525 4,298
VanityFair.com 5,300 2,076 3,288
Economist.com 3,999 2,133 1,933
Newsweek.com 3,815 2,271 1,607
NationalReview.com 1,422 849 604
NewRepublic.com 1,405 704 703
TheNation.com 374 374 n/a
Source: comScore Media Metrix, January 2015, U.S.
Notes: Total digital population is the unduplicated combination of the desktop (web browsing and video) and mobile (websites and
associated apps) traffic figures. For that reason, desktop and mobile figures combined may exceed the total digital population number. Table
updated with Forbes.com data.
PEW RESEARCH CENTER

76
PEW RESEARCH CENTER
www.pewresearch.org
-15
-10
-5
0
5
10
15
2008 2009 2010 2011 2012 2013 2014
Overall Subscriptions Single Copy Sales
%
The broader consumer
magazine industry
experienced another difficult
year in 2014. Overall
magazine circulation
(including single-copy sales
and subscriptions) fell for the
seventh year in a row (-2%).
Things were particularly bad
for newsstand sales, which
fell 14%, the biggest decline
since 2008, when Pew
Research started tracking.
The 1% decline seen in
subscription numbers looked
good by comparison.
Advertising spending at
consumer magazines also
experienced losses in 2014,
according to Kantar Media.
Magazine publishers suffered a 5% loss in advertising revenue, compared with 2013, after a 3%
increase the year before.
Newsstand Circulation in the Magazine Industry
Plummets
% of change
Source: Alliance for Audited Media
PEW RESEARCH CENTER

77
PEW RESEARCH CENTER
www.pewresearch.org
Alternative Weekly Fact Sheet
BY Elisa Shearer
Last updated April 2015
Many alternative weekly newspapers faced
dropping circulation or outright closure in 2014.
The San Francisco Bay Guardian closed in
October 2014 after operating for 48 years,
Knoxville’s Metro Pulse was shut down by E.W.
Scripps in the same month, and Real Detroit
Weekly merged with the Detroit Metro Times in
May. Only three of the top 20 newsweeklies saw
an increase in circulation in the last year.
Amid these struggles, however, some highlights
emerged. Staff from The San Francisco Bay
Guardian successfully spearheaded a
crowdfunding campaign to produce a final extra-
large issue. And former staffers of Metro Pulse
used crowdfunding to create the Knoxville
Mercury, which launched on March 12, 2015.
The combined average weekly circulation of the
top 20 newsweeklies decreased 6% from 2013
to 2014.
The Metro Times’ dramatic circulation increase
(65%) is mainly due to its merger with Real
Detroit Weekly. The only other publications
among the top 20 to show gains were the
Chicago Reader (up 23%) and SF Weekly (1%); the circulation of all the other weeklies either
dropped or remained the same. (The Chicago Reader’s increase this year came after a significant
drop in circulation the year before.) The Village Voice’s circulation showed the largest drop (-25%)
in the group. As a result, LA Weekly led in circulation for 2014, with an average weekly circulation
of about 115,000 copies.
Top 20 Alternative Weekly Newspapers
U.S. publications ranked by circulation
Publication 2014 Overall Circulation
% Change from 2013
LA Weekly 114,571 -18%
Village Voice 110,384 -25%
San Diego Reader 110,265 -7%
Chicago Reader 90,040 23%
Austin Chronicle 72,437 -2%
Willamette Week 70,000 0%
Sacramento News & Review 68,233 -1%
Phoenix New Times* 67,096 -16%
Creative Loafing (Georgia)* 67,003 -6%
SF Weekly 65,962 1%
Westword* 65,112 -13%
Metro Times* 65,000 65%
Washington City Paper 63,829 -4%
Pittsburgh City Paper* 63,766 -0.2%
OC Weekly 63,249 -6%
Philadelphia Weekly* 62,958 -12%
The Stranger 61,859 -2%
Dallas Observer 60,000 -11%
Las Vegas Weekly 58,594 -4%
City Pages (Minneapolis) 57,843 -23%
Source: Alliance for Audited Media, Verified Audit Circulation,
Association of Alternative Newsmedia and Circulation Verification
Council. Willamette Week and SF Weekly’s circulation numbers are
self-reported.
*Publisher’s statements were used to analyze circulation data.
Note: In 2014, Metro Times reported that the circulation would be
increased to above 65,000. AAN reports 65,000 as the 2014
circulation as of June 2014.
PEW RESEARCH CENTER

78
PEW RESEARCH CENTER
www.pewresearch.org
Hispanic Media Fact Sheet
BY Katerina Eva Matsa
Last updated April 2015
At 54 million in 2013, Hispanics account for 17% of the U.S. population and are responsible for
half the nation’s growth between 2000 and 2012. Much of this growth since 2000 has come from
the births of Hispanics in the U.S. rather than the arrival of new immigrants. As a result, English
use among Hispanic adults is on the rise. Today, about six-in-ten U.S. adult Hispanics (62%) speak
English or are bilingual.
One question this raises for the news media is to what degree this population turns to outlets
dedicated to coverage – in both Spanish and English – presented through a Hispanic lens.
Audiences for news programs on Univision, the largest Spanish-language media company in the
U.S, were down in 2014 compared with 2013 both at national and local levels, as was circulation
among Spanish-language daily newspapers. However, the news audience at Telemundo, the
smaller Hispanic television network, grew in 2014. Newer, English-language players such as
Fusion, Latin Post and the now defunct Voxxi are also emerging. It is still unclear, though, to what
extent they will gain a foothold with their target audience: younger, English-speaking Hispanics.

79
PEW RESEARCH CENTER
www.pewresearch.org
In 2014, three major long-standing Hispanic
daily newspapers saw decreases in print
circulation, according to data from the Alliance
for Audited Media. Miami’s El Nuevo Herald,
which was founded in 1975, lost 7% of its
circulation overall in 2014 compared with 2013.
Los Angeles’ La Opinion, which is the largest
daily Spanish-language newspaper in the U.S.,
had the greatest decline in circulation, at 10%.
And circulation at El Diario La Prensa, a daily
in New York City, dropped 9%.
Spanish Daily Newspaper Circulation
Down in 2014
Total average circulation
2013 2014 % change
El Nuevo Herald 51,947 48,079 -7
La Opinion 118,483 106,563 -10
El Diario La Prensa 35,421 32,150 -9
Source: Alliance for Audited Media, AAM audits and publisher
statements
PEW RESEARCH CENTER

80
PEW RESEARCH CENTER
www.pewresearch.org
Pew Research Center also
identified 31 weekly newspapers
for which audited data are
available. For the group, total
circulation grew 4% in 2014.
About half (17) enjoyed
increases, eight were either
stable or did not have trendable
2013 data, and six posted losses.
About Half of Hispanic Weekly Newspapers’
Circulation Was Up in 2014
Total average circulation
2013 2014 % change
El Especialito (Union City, NJ) 257,275 257,350 *
La Voz de Houston (Houston, TX) 189,913 207,476 9
Impacto USA (Los Angeles, CA) 194,877 204,585 5
La Raza (Chicago, IL) 153,620 153,620 0
South Florida Sun – El Sentinel (Fort Lauderdale, FL)
133,927 131,941 -1
Semana News (Houston, TX) 118,912 129,936 9
Orlando El Sentinel (Orlando, FL) 105,635 124,258 18
Hoy Los Angeles (Los Angeles, CA) 112,842 114,378 1
Al Dia (Dallas, TX) 112,464 113,384 1
El Mensajero (San Francisco, CA) 103,800 103,800 0
La Estrella (Fort Worth, TX) 122,671 102,386 -17
Orange County Register – Unidos (Santa Ana, CA)
N/A 75,886 N/A
El Periodico USA (McAllen, TX) N/A 68,106 N/A
El Paso y Mas (El Paso, TX) 48,340 61,375 27
Las Vegas Review-Journal-El Tiempo (Las Vegas, NV)
49,679 59,245 19
Impacto Latin News (New York, NY) 55,368 57,000 3
Monitor – El Extra (McAllen, TX) 27,511 53,169 93
El Tiempo Latino (Washington, D.C.) 50,371 46,594 -7
Vida en el Valle (Fresno, CA) 46,098 45,400 -2
Vida en el Valle (Modesto, CA) 43,829 43,801 *
Al Dia (Philadelphia, PA) 38,073 42,425 11
Novedades News (Dallas, TX) 37,800 37,800 0
La Prensa – Orlando (Longwood, FL) 35,000 35,000 0
Vida en el Valle (Sacramento, CA) 34,250 34,233 *
La Voz Bilingue (Denver, CO) 29,883 30,845 3
Washington Hispanic (Silver Spring, MD)
30,550 30,590 *
Valley Morning Star – El Extra (Harlingen, TX)
N/A 21,858 N/A
El Hispano News (Dallas, TX) 20,010 20,390 2
Republican – El Pueblo Latino (Springfield, MA)
14,051 18,955 35
Bajo El Sol (Yuma, AZ) 15,000 15,000 0
Adelante Valle (El Centro, CA) 9,545 9,605 1
Source: Alliance for Audited Media, AAM audits and publisher statements
*Indicates a change smaller than 1%
PEW RESEARCH CENTER
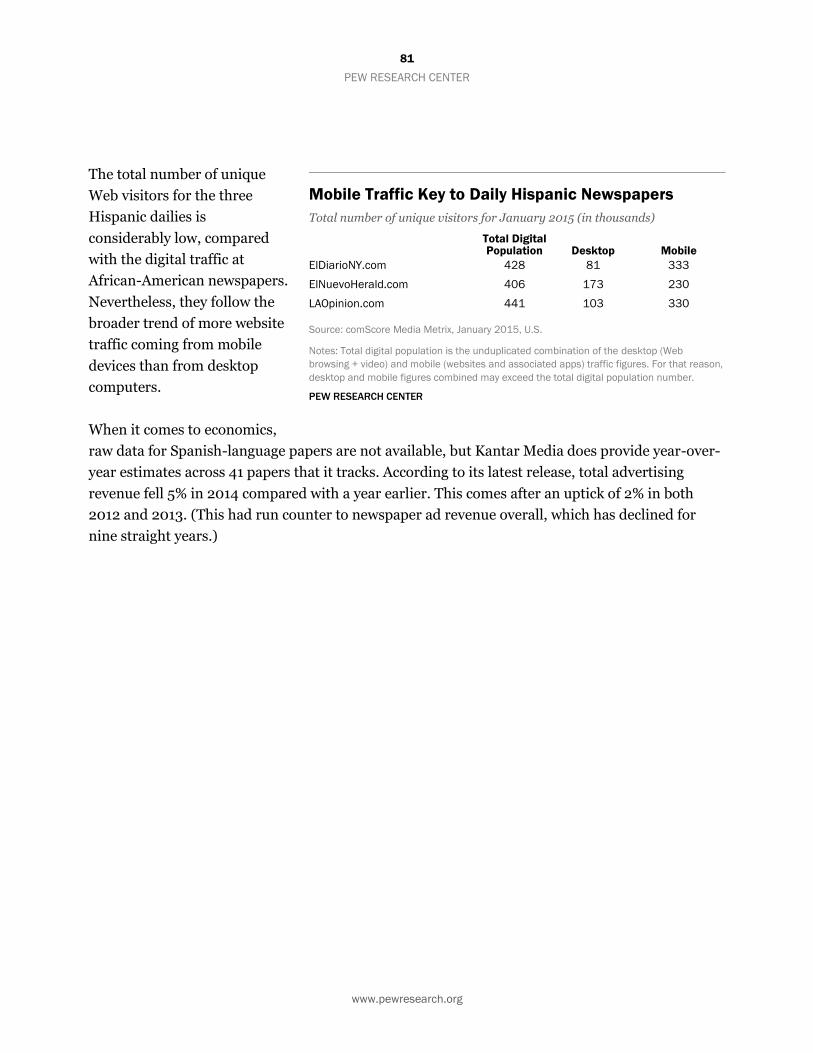
81
PEW RESEARCH CENTER
www.pewresearch.org
The total number of unique
Web visitors for the three
Hispanic dailies is
considerably low, compared
with the digital traffic at
African-American newspapers.
Nevertheless, they follow the
broader trend of more website
traffic coming from mobile
devices than from desktop
computers.
When it comes to economics,
raw data for Spanish-language papers are not available, but Kantar Media does provide year-over-
year estimates across 41 papers that it tracks. According to its latest release, total advertising
revenue fell 5% in 2014 compared with a year earlier. This comes after an uptick of 2% in both
2012 and 2013. (This had run counter to newspaper ad revenue overall, which has declined for
nine straight years.)
Mobile Traffic Key to Daily Hispanic Newspapers
Total number of unique visitors for January 2015 (in thousands)
Total Digital Population Desktop Mobile
ElDiarioNY.com 428 81 333
ElNuevoHerald.com 406 173 230
LAOpinion.com 441 103 330
Source: comScore Media Metrix, January 2015, U.S.
Notes: Total digital population is the unduplicated combination of the desktop (Web
browsing + video) and mobile (websites and associated apps) traffic figures. For that reason,
desktop and mobile figures combined may exceed the total digital population number.
PEW RESEARCH CENTER

82
PEW RESEARCH CENTER
www.pewresearch.org
Univision has come a long way
since it began in 1962 as a single
television station in San
Antonio, Texas. Today, it is by
far the largest Spanish-language
media company in the U.S.
when it comes to revenues,
ratings and stations owned. But
its news programs still trail most
U.S. network newscasts – a gap
that widened in 2014 as
Univision’s news programs saw
ratings fall from record highs in 2013. Univision’s half-hour evening newscast lost 8% of its
audience in 2014, after enjoying an 11% growth the year before. Its early evening news show,
Primer Impacto, fell 11% to 1.4 million daily viewers on average. And the Sunday nighttime news
magazine Aquí y Ahora fared the worst, with a 14% decline to 1.9 million nightly viewers. By
comparison, Sunday morning political show Al Punto saw a decline of just 3%.
Univision News Programs Lose Audience in 2014
Average daily audience (in thousands)
2012 2013 2014 % change
2013-2014
Al Punto 778 826 802 -3%
Aqui y Ahora 1,798 1,931 1,655 -14%
Noticiero Univision 1,852 2,053 1,899 -8%
Noticiero Univision: Edicion Nocturna 1,583 1,541 1,396 -9%
Primer Impacto 1,518 1,617 1,436 -11%
Source: Nielsen Media Research
PEW RESEARCH CENTER
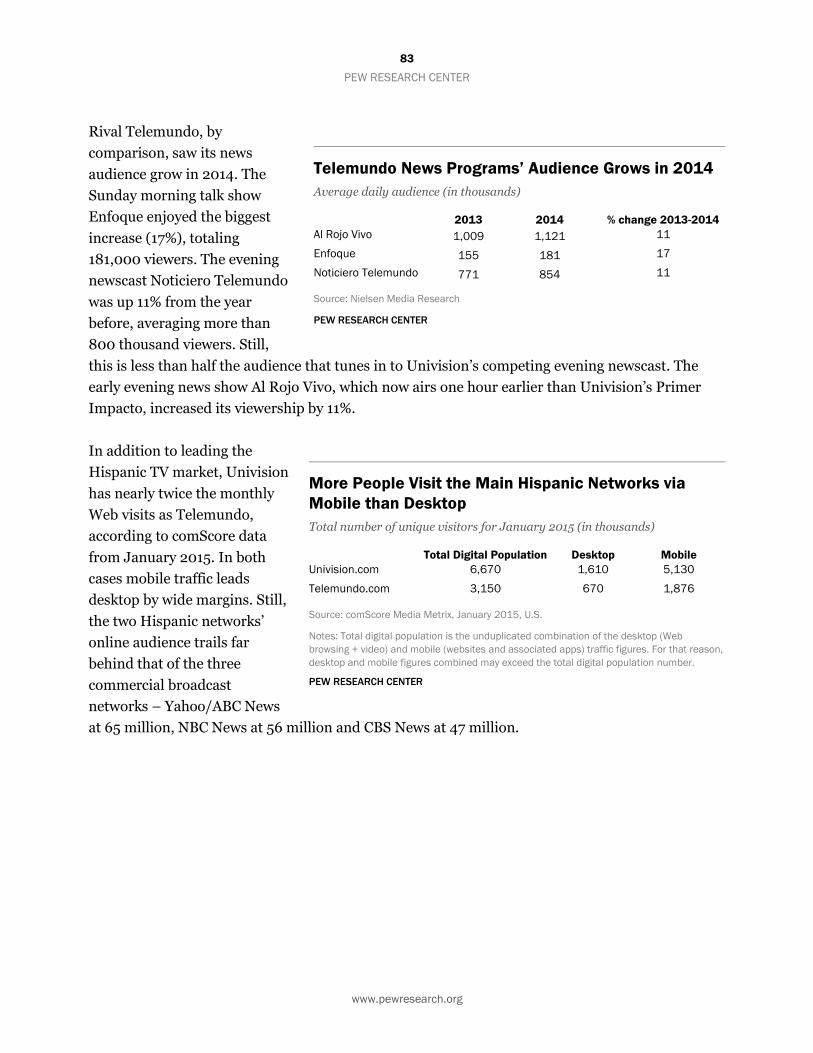
83
PEW RESEARCH CENTER
www.pewresearch.org
Rival Telemundo, by
comparison, saw its news
audience grow in 2014. The
Sunday morning talk show
Enfoque enjoyed the biggest
increase (17%), totaling
181,000 viewers. The evening
newscast Noticiero Telemundo
was up 11% from the year
before, averaging more than
800 thousand viewers. Still,
this is less than half the audience that tunes in to Univision’s competing evening newscast. The
early evening news show Al Rojo Vivo, which now airs one hour earlier than Univision’s Primer
Impacto, increased its viewership by 11%.
In addition to leading the
Hispanic TV market, Univision
has nearly twice the monthly
Web visits as Telemundo,
according to comScore data
from January 2015. In both
cases mobile traffic leads
desktop by wide margins. Still,
the two Hispanic networks’
online audience trails far
behind that of the three
commercial broadcast
networks – Yahoo/ABC News
at 65 million, NBC News at 56 million and CBS News at 47 million.
Telemundo News Programs’ Audience Grows in 2014
Average daily audience (in thousands)
2013 2014 % change 2013-2014
Al Rojo Vivo 1,009 1,121 11
Enfoque 155 181 17
Noticiero Telemundo 771 854 11
Source: Nielsen Media Research
PEW RESEARCH CENTER
More People Visit the Main Hispanic Networks via
Mobile than Desktop
Total number of unique visitors for January 2015 (in thousands)
Total Digital Population Desktop Mobile
Univision.com 6,670 1,610 5,130
Telemundo.com 3,150 670 1,876
Source: comScore Media Metrix, January 2015, U.S.
Notes: Total digital population is the unduplicated combination of the desktop (Web
browsing + video) and mobile (websites and associated apps) traffic figures. For that reason,
desktop and mobile figures combined may exceed the total digital population number.
PEW RESEARCH CENTER

84
PEW RESEARCH CENTER
Despite declining news
program ratings, Univision’s
financial picture for 2014 was
much brighter. Overall,
Univision’s total revenue grew
11% in 2014, from $2.6 billion
to $2.9 billion. On-air
television revenue, which
accounts for the vast majority
of the total and includes
revenues from entertainment
as well as news programs, grew 11% to 2.5 billion. Its digital properties, while just 5% of the total,
nearly doubled year over year thanks in part to advertising revenue from the 2014 FIFA World
Cup. Radio properties, on the other hand, experienced losses of 8%.
Despite these gains, Univision still carries a sizable amount of debt ($9.2 billion), largely the
results of the 2006 decision to take the company private and the 2007-2009 economic recession.
In March 2015, Univision hired underwriters to lead an initial public offering, which is expected in
the second half of the year.
Telemundo’s revenues are not available for analysis, as its parent company, Comcast, does not
provide network-specific revenues.
Univision Revenues Show Strong Year-to-Year Growth
Annual revenue (in thousands of U.S. dollars)
2012 2013 2014 % change 2013-2014
Total Revenue 2,442,000 2,627,400 2,911,400 11%
Television 2,009,800 2,219,900 2,454,600 11%
Radio 336,300 329,700 302,000 -8%
Digital 95,900 77,800 154,800 99%
Source: Univision press releases and SEC filings.
PEW RESEARCH CENTER
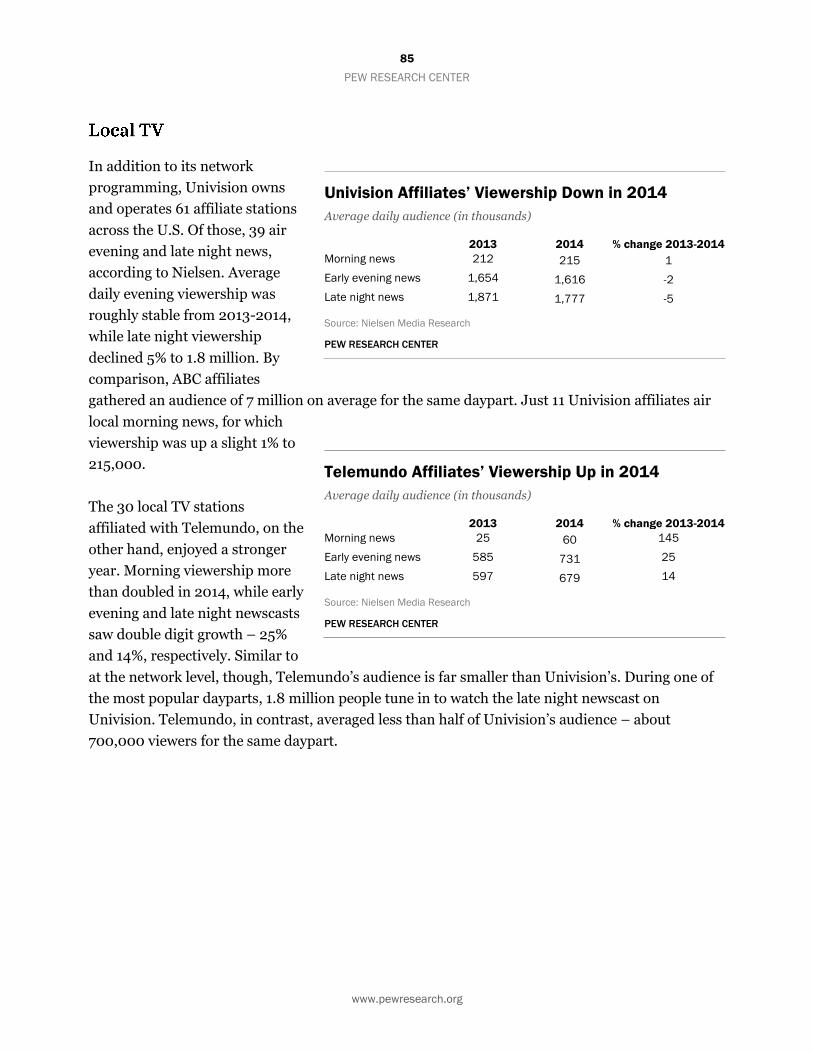
85
PEW RESEARCH CENTER
www.pewresearch.org
In addition to its network
programming, Univision owns
and operates 61 affiliate stations
across the U.S. Of those, 39 air
evening and late night news,
according to Nielsen. Average
daily evening viewership was
roughly stable from 2013-2014,
while late night viewership
declined 5% to 1.8 million. By
comparison, ABC affiliates
gathered an audience of 7 million on average for the same daypart. Just 11 Univision affiliates air
local morning news, for which
viewership was up a slight 1% to
215,000.
The 30 local TV stations
affiliated with Telemundo, on the
other hand, enjoyed a stronger
year. Morning viewership more
than doubled in 2014, while early
evening and late night newscasts
saw double digit growth – 25%
and 14%, respectively. Similar to
at the network level, though, Telemundo’s audience is far smaller than Univision’s. During one of
the most popular dayparts, 1.8 million people tune in to watch the late night newscast on
Univision. Telemundo, in contrast, averaged less than half of Univision’s audience – about
700,000 viewers for the same daypart.
Univision Affiliates’ Viewership Down in 2014
Average daily audience (in thousands)
2013 2014 % change 2013-2014
Morning news 212 215 1
Early evening news 1,654 1,616 -2
Late night news 1,871 1,777 -5
Source: Nielsen Media Research
PEW RESEARCH CENTER
Telemundo Affiliates’ Viewership Up in 2014
Average daily audience (in thousands)
2013 2014 % change 2013-2014
Morning news 25 60 145
Early evening news 585 731 25
Late night news 597 679 14
Source: Nielsen Media Research
PEW RESEARCH CENTER

86
PEW RESEARCH CENTER
www.pewresearch.org
More than 500 radio stations that exist in the United
States run on a Spanish-language format, but only 30 air
news and talk programming. While listenership for those
30 is not available, researchers were able to gather
revenue data. From 2013 to 2014, combined revenue for
Spanish radio stations that air news was down 7% to
about $900,000, according to BIA/Kelsey. The biggest
loss (29%) since 2007 came during the recession, in
2009.
Ad Revenues at Spanish Radio
Stations Offering News and Talk
Continue to Decline
In thousands
Year Average Ad Revenue
2007 1,538
2008 1,378
2009 984
2010 1,063
2011 1,038
2012 1,010
2013 964
2014 899
Source: BIA/Kelsey
PEW RESEARCH CENTER
87
PEW RESEARCH CENTER
www.pewresearch.org
African-American Media Fact Sheet
BY Nancy Vogt
Last updated April 2015
African American-oriented news media, one of the long-standing minority news genres in the U.S.,
maintains a presence in print, broadcast and now the Web. Weekly newspapers aimed at this
population are still the most prevalent, but most of those with data that the Pew Research Center
can track lost audience in 2014. In broadcast, a few new African American-oriented television
news programs emerged in 2014 and at least one new syndicated radio program emerged. But Soul
of the South, the digital television network launched in 2013, may be at risk of shutting down. In
the digital space, NBC launched a new vertical in early 2015 aimed at its African-American
audience.
In U.S. newsrooms more broadly, the portion of full-time daily newspaper jobs filled by African
Americans has remained relatively steady while the portion inside television newsrooms has
increased slightly. And seven full power TV stations came under black ownership in 2014 – up
from zero in 2013.

88
PEW RESEARCH CENTER
www.pewresearch.org
Newspapers
The number of African-American newspapers – primarily weeklies – continues to hover around
200, according to the National Newspaper Publishers Association. They are hard to measure as a
group, though, because
few have audited
audience figures.
Among the five larger
African-American
newspapers that do,
four saw sizable
declines in total paid
circulation (which
includes both print and
digital) from 2013 to
2014 – ranging from
7% for the New York
Amsterdam News to
19% for the Chicago
Defender.
Only one of the five
papers examined, The
Philadelphia Tribune, saw an overall increase in circulation in 2014. The total growth was 40% –
though all but 2% of this is attributed to 5,200 copies of their digital replica edition distributed as
a part of the Newspapers in Education Program.
African-American Newspaper Circulation
Total average circulation for the six-month period ending Sept.30
New York
Amsterdam News Baltimore
Afro-American Washington
Afro-American Philadelphia
Tribune Chicago Defender
2009 17,477 7,244 6,592 12,543 11,158
2010 9,750 6,923 7,211 14,177 8,603
2011 12,607 7,394 11,858 14,955 8,396
2012 14,042 6,840 6,007 13,320 7,737
2013 13,588 5,595 7,172 13,745 6,741
2014 12,587* 5,146 5,948 19,265 5,477
Source: Alliance for Audited Media for all papers but the Chicago Defender (Verified Audit Circulation
Publisher’s Statement for April 1-Sept. 30)
*Year to year data was not available for the New York Amsterdam News. Data is through March 2014.
Note: This chart tracks Tuesday’s circulation for The Philadelphia Tribune. Total circulation includes
educational copies, employee and independent contractor copies and copies provided in retail
businesses.
PEW RESEARCH CENTER

89
PEW RESEARCH CENTER
www.pewresearch.org
The digital space is not
providing much relief. The two
papers examined which offered
subscriptions to digital replicas
in both 2013 and 2014 – the
Baltimore and Washington
editions of the Afro-American
– also lost significant
circulation in their digital
editions.
Inside daily newspaper
newsrooms, the number of
black journalists has declined
at roughly the same rate as
newsroom jobs overall. Their
share of all newsroom jobs,
then, has remained steady
over the past five years,
settling at 4.8% in 2013.
Afro-American Papers Lose Circulation in Both Print
and Digital Editions in 2014
Total average circulation for the six-month period ending Sept. 30
Washington Afro-American 2013 2014 % Change
Print 6,283 5,158 -18
Digital 889 790 -11
Baltimore Afro-American
Print 5,120 4,740 -7
Digital 475 406 -15
Source: Alliance for Audited Media, publisher’s statements.
PEW RESEARCH CENTER
African Americans as a Percentage of Overall
Newspaper Employment
% of total workforce
Year Total Workforce Total African American % African American
2003 54,194 2,938 5.4
2004 53,134 2,985 5.6
2005 53,561 2,950 5.5
2006 55,045 2,900 5.3
2007 52,598 2,790 5.3
2008 46,670 2,412 5.2
2009 41,419 2,029 4.9
2010 41,609 1,949 4.7
2011 40,566 1,886 4.6
2012 37,982 1,790 4.7
2013 36,722 1,754 4.8
Source: American Society of News Editors
PEW RESEARCH CENTER

90
PEW RESEARCH CENTER
www.pewresearch.org
Magazines
In the magazine industry, four titles geared toward African Americans have audited circulation
data: Ebony, Jet, Essence and
Black Enterprise. Essence saw
a circulation increase in 2014
while Ebony and Black
Enterprise circulation
declined, and the 60-year old
Jet ceased print publication
altogether midyear,
relaunching as a weekly digital
application. (In 2013, Jet had
already reduced its publication
frequency to every three
weeks.)
African-American Magazine Circulation
Total average circulation for the six-month period ending June 30
Year Ebony Jet Essence Black Enterprise
2006 1,463,604 936,751 1,104,854 —
2007 1,403,483 909,579 1,088,495 —
2008 1,451,427 929,599 1,051,130 —
2009 1,301,760 868,983 1,092,721 527,655
2010 1,114,849 762,250 1,066,482 502,711
2011 1,235,865 820,557 1,050,013 500,107
2012 1,255,542 745,809 1,080,633 518,602
2013 1,293,565 733,961 1,061,103 534,752
2014 1,260,564 — 1,083,461 524,887
Source: Alliance for Audited Media
Note: Jet ceased publication of its printed edition at the end of June 2014.
PEW RESEARCH CENTER
91
PEW RESEARCH CENTER
www.pewresearch.org
While there is far less television news programming than newspapers aimed specifically at
African-American audiences, the genre saw a handful of developments over the past year, both
positive and negative. WBTV, the CBS affiliate in Charlotte, N.C., began producing three hours of
daily news programming targeted at its black audience on its Bounce subchannel: a 7-9 a.m.
morning news program and a one-hour 8 p.m. newscast with two African-American hosts. In
addition, the long-planned launch of the Black Television News Channel (BTNC) is now slated for
fall 2015. In March, an 11-year deal was announced between Florida A&M University and BTNC
for a 24-hour multiplatform cable news network. BTNC plans to produce 14 hours of original news
programming daily.
On the other hand, Soul of the South (SSN) – a multicast, digital television network launched in
2013 – may be at risk of shutting down. The network, headquartered in Little Rock, Ark., and
which had been airing in 25 markets, laid off about a dozen of its news employees in March 2015
and ceased original news production. Then, in early April, CEO Doug McHenry said he was
considering winding down the entire Soul of the South operation due to financial strains and the
inability to secure a spot on cable.

92
PEW RESEARCH CENTER
www.pewresearch.org
TV Newsroom Investment
In late 2014, seven9 full-
powered television stations
were poised to come under
black ownership10 – largely as a
result of the FCC’s March ruling
that bars companies from
controlling two or more
stations in the same markets.
This was something of a
breakthrough in that it reversed
the downward trend in the
number of stations owned by
African Americans, which had
hit zero by the close of 2013.
Four of the seven stations were formerly owned by Nexstar (three Fox affiliates sold to media
executive Pluria Marshall Jr. and a CBS affiliate sold to DuJoan McCoy of Bayou Broadcasting).
The other three stations – two ABC sub-channels (WCFT and WJSU) and a MyNetwork affiliate
(WWMP) – were Sinclair Broadcasting properties sold to conservative commentator Armstrong
Williams.
Inside TV newsrooms, African Americans made slight gains. According to the latest data available
from RTDNA, the share of television newsroom employment filled by African Americans rose
slightly from 9.9% in 2012 to 10.4% in 2013. The gain was bigger for TV news directors –
increasing from 2.9% of all of those jobs in 2012 to the highest level ever in 2013 – 4.3%.
9 In late 2013 Armstrong Williams had secured FCC approval for the purchase of WEYI-TV and WWMB-TV, but these two stations were operated as “sidecar” agreements with Sinclair. 10 Issues surrounding African American-owned media also surfaced in another context in late 2014 and early 2015 when the National Association of African American Owned Media (NAAAOM) filed several lawsuits. A $10 billion lawsuit against AT&T and DirecTV was filed on Dec. 3 alleging that a disproportionately small percentage of advertising dollars was being spent on 100% African American-owned companies. On Feb. 20, 2015, a $20 billion lawsuit was filed against Comcast, Time Warner Cable and several other entities charging racial discrimination in contracting.
Seven Television Stations Came Under Black
Ownership in 2014
FCC media board-approved transactions in December 2014
Call Sign Affiliate City State Seller Buyer
KMSS FOX Shreveport LA Nexstar Pluria Marshall
KPEJ FOX Odessa TX Nexstar Pluria Marshall
KLJB FOX Davenport IA Nexstar Pluria Marshall
WEVV CBS Evansville IN Nexstar DuJuan McCoy
WMMP MyNetwork Charleston SC Sinclair Armstrong Williams
WCFT ABC Tuscaloosa AL Sinclair Armstrong Williams
WJSU ABC Anniston AL Sinclair Armstrong Williams
Source: FCC
PEW RESEARCH CENTER
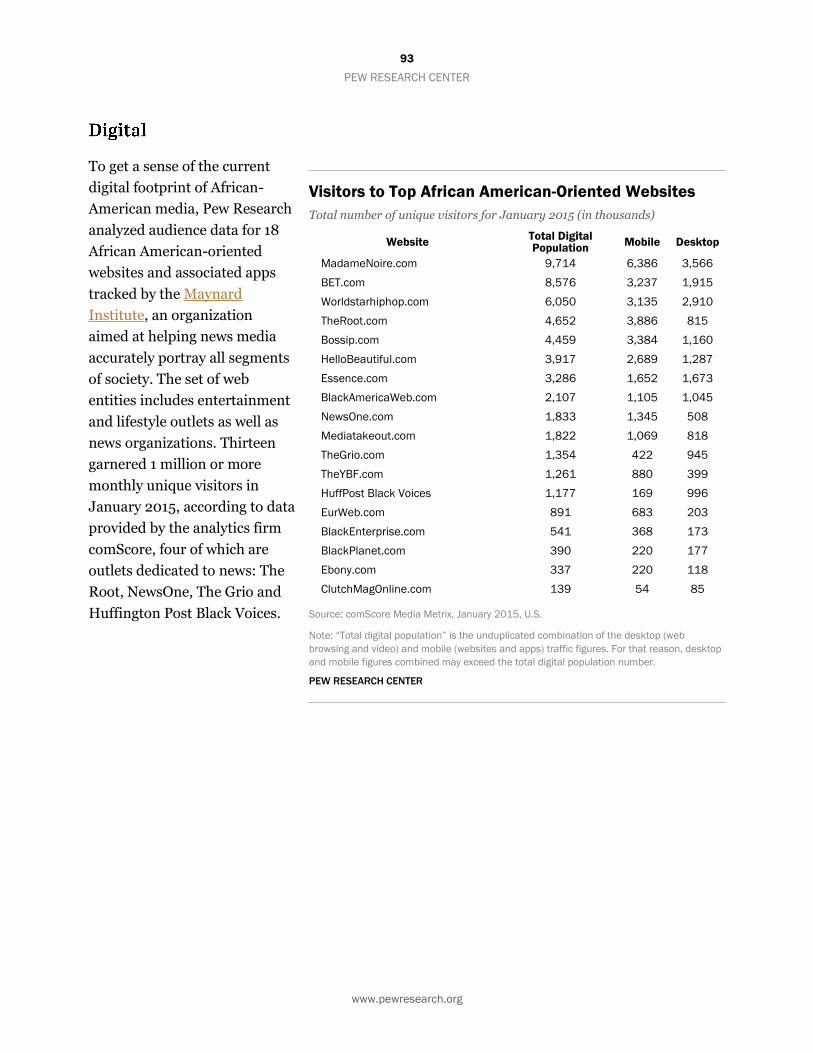
93
PEW RESEARCH CENTER
www.pewresearch.org
To get a sense of the current
digital footprint of African-
American media, Pew Research
analyzed audience data for 18
African American-oriented
websites and associated apps
tracked by the Maynard
Institute, an organization
aimed at helping news media
accurately portray all segments
of society. The set of web
entities includes entertainment
and lifestyle outlets as well as
news organizations. Thirteen
garnered 1 million or more
monthly unique visitors in
January 2015, according to data
provided by the analytics firm
comScore, four of which are
outlets dedicated to news: The
Root, NewsOne, The Grio and
Huffington Post Black Voices.
Visitors to Top African American-Oriented Websites
Total number of unique visitors for January 2015 (in thousands)
Website Total Digital Population
Mobile Desktop
MadameNoire.com 9,714 6,386 3,566
BET.com 8,576 3,237 1,915
Worldstarhiphop.com 6,050 3,135 2,910
TheRoot.com 4,652 3,886 815
Bossip.com 4,459 3,384 1,160
HelloBeautiful.com 3,917 2,689 1,287
Essence.com 3,286 1,652 1,673
BlackAmericaWeb.com 2,107 1,105 1,045
NewsOne.com 1,833 1,345 508
Mediatakeout.com 1,822 1,069 818
TheGrio.com 1,354 422 945
TheYBF.com 1,261 880 399
HuffPost Black Voices 1,177 169 996
EurWeb.com 891 683 203
BlackEnterprise.com 541 368 173
BlackPlanet.com 390 220 177
Ebony.com 337 220 118
ClutchMagOnline.com 139 54 85
Source: comScore Media Metrix, January 2015, U.S.
Note: “Total digital population” is the unduplicated combination of the desktop (web
browsing and video) and mobile (websites and apps) traffic figures. For that reason, desktop
and mobile figures combined may exceed the total digital population number.
PEW RESEARCH CENTER

94
PEW RESEARCH CENTER
As a group, the majority of the
sites and apps (12) received at
least 10% more of their traffic
from mobile devices than from
desktop, according to
comScore. But among the four
focused on news, two (The
Root and NewsOne) garnered
more traffic from mobile than
desktop, while the other two
(The Grio and Huffington Post
Black Voices) saw more traffic
from desktop users. This differs
from news websites and
associated apps overall, where
a majority receives at least 10%
more traffic from mobile device
users than from desktop.
The metric of time spent on
African American-oriented
websites and their apps,
however, reveals a somewhat
different picture. Taken as a
group overall, 12 of the 18 had
desktop visitors spending more
time than mobile visitors. And
among the four African
American-dedicated news outlets, two – The Root and NewsOne – had desktop users spending
more time, while the other two – The Grio and Huffington Post Black Voices – saw mobile users
spending at least 10% more time than those using desktop. This stands in contrast to patterns of
time spent on news websites and apps overall, where time spent on desktop visits outpaces time
spent on mobile devices.
Editorially, NBC made two changes over the past year that are likely to affect their coverage of
African American-focused news: It sold their website TheGrio.com back to its original owners, and
it launched a new vertical focusing on the African-American audience – NBCBLK.com, which went
live in January 2015.
Average Number of Minutes per Visit to African-
American Websites
Average time spent from mobile device vs. desktop, January 2015
Average Time Spent per Visit (Minutes)
Website Mobile Desktop
MadameNoire.com 3.9 6.5
BET.com 2.4 2.1
Worldstarhiphop.com 4.4 5.2
TheRoot.com 1.2 2.8
Bossip.com 4.5 4.8
HelloBeautiful.com 2.5 8.9
Essence.com 2.1 2.6
BlackAmericaWeb.com 4.8 9.5
NewsOne.com 1.9 4.9
Mediatakeout.com 2.5 4.7
TheGrio.com 4.6 2.9
TheYBF.com 3.6 1.9
HuffPost Black Voices 2.1 1.3
EurWeb.com 1.0 1.3
BlackEnterprise.com 1.9 2.1
BlackPlanet.com 4.6 20
Ebony.com 1.7 2.0
ClutchMagOnline.com 2.0 0.4
Source: comScore Media Metrix, January 2015, U.S.
Note: Desktop figures include web browsing and video, and mobile figures include websites
and apps.
PEW RESEARCH CENTER

95
PEW RESEARCH CENTER
www.pewresearch.org

96
PEW RESEARCH CENTER
www.pewresearch.org
State of the News Media Methodologies
The State of the News Media report uses a range of different methodologies to study the health of
the U.S. news industry, including custom analysis of news audience behavior, secondary analysis
of industry data, and direct reporting to solicit information unavailable elsewhere.
The data for the State of the News Media 2015 fact sheets consists of data originally generated by
other people or organizations that the Pew Research Center then collected and aggregated.
For the data aggregated from other researchers, the Pew Research Center’s team took several
steps. First, we tried to determine what data had been collected and by whom for the media sectors
studied. In many cases, this included securing rights to data through license fees or other means,
and often including paying for use of the data.
Next, we studied the data closely to determine where elements reinforced each other and where
there were apparent contradictions or gaps. In doing so, the Pew Research Center endeavored to
determine the value and validity of each data set. That, in many cases, involved going back to the
sources that collected the research in the first place. Where data conflicted, we have included all
relevant sources and tried to explain their differences, either in footnotes or in the narratives.
All sources are cited in footnotes or within the narrative.
In order to provide as clear a sense as possible of the digital news leaders among U.S. audiences,
researchers took several steps using comScore analytics.
First, we analyzed listings in comScore’s General News category and their separate Newspaper
category. In addition, we obtained audience data from comScore on roughly 400 digital-only news
outlets identified by the Pew Research Center. Within those lists, researchers took a number of
steps to focus as much as possible on the website level (such as a consumer-facing and
recognizable dot com, rather than the bundled holdings of its corporate parent). From there,
researchers assembled the list of top 50 news websites and associated apps, based on unique
visitors. Some news organizations list their Web entities in comScore’s database differently than
others. To be as consistent as possible, we created the following guidelines listed below. There are
still some instances where, because of an organization’s structure, there could be additional traffic
that is not represented here. We have tried to footnote all such cases.
97
PEW RESEARCH CENTER
www.pewresearch.org
For listings that own several sub-entities which are a part of the main Web presence (i.e. a user
would have access to the sub-entity content once on the main website) we used the following
guidelines:
o If more than half of those sub-entities are news-focused, researchers defaulted to
the larger entity as the listing and the unit of measure (an example here would be
the Yahoo-ABC News Network).
o If fewer than half of the sub-entities are news-focused, researchers used the largest
news channel listed as the unit of measure. For example, U.S. News and World
Report includes RankingsandReviews.com as well as USNews.com; we chose to
break out and report USNews.com.
For listings that own sub-entities that are entirely different websites, but nevertheless are
listed under a common owner, researchers examined the traffic for each of the websites (and
any associated apps) separately. (An example here would be Cox Media Group or Media
General, both of which own multiple local news entities that do not share any Web presence
with each other or with their corporate parent.)
In new conversations with comScore in late April 2015, Pew Research Center was informed of and
provided with new digital populations that are inclusive of app traffic for sites in the Cable News
Fact sheet and in the case of CNN the addition of some sub-domains which are tracked separately
in comScore.
All data for this report is from the month of January 2015.
For more information about comScore’s methodology, read here.
This database consists largely of data originally generated by other people or organizations that
the Pew Research Center then collected and aggregated. The data was then put into a chart format
and the charts were organized by topic. The database can be viewed here.