
For personal use onlycentrexmetals.com.au/wp-content/sharelink/20160920...This final rationalisation...
62
ASX : CXM Annual Report 2016 WWW.CENTREXMETALS.COM.AU For personal use only
Transcript of For personal use onlycentrexmetals.com.au/wp-content/sharelink/20160920...This final rationalisation...

ASX : CXMAnnual Report 2016
W W W . C E N T R E X M E T A L S . C O M . A U
For
per
sona
l use
onl
y

Page intentionally left blank
For
per
sona
l use
onl
y
2016 Annual Report - Page | 3
Contents
Chairman’s Report 4
Chief Executive’s Report 5
Mining Exploration Entity Annual Reporting Requirements 10
Directors’ Report 14
Lead Auditor’s Independence Declaration 28
Consolidated Statement of Profit or Loss and Other Comprehensive Income 30
Consolidated Statement of Changes in Equity 31
Consolidated Statement of Financial Position 32
Consolidated Statement of Cash Flows 33
Notes to the Consolidated Financial Statements 34
Directors’ Declaration 56
Independent Auditor’s Report 57
ASX Additional Information 59
For
per
sona
l use
onl
y
Page | 4 – 2016 Annual Report
Chairman’s Report
The 2016 financial year finished just as the Oxley Potassium Project Scoping Study was being finalised. The Company’s positive outlook for this project was confirmed with an independent review of the Scoping Study results which indicated the basis for a globally competitive operation with significant upside for large-scale expansion from the extensive deposit. On 8th August 2016 the Company announced the approval of the Prefeasibility Study (PFS) which takes the project into the next phase of development.
The Company has been advised that it may not release cost estimates or financial results while the project is based solely on Inferred Mineral Resources. A central tenet of the Company’s investor relations strategy in the medium term and a key aspect of the PFS is the inclusion of further resource drilling. Once the Company has defined a significant portion of Indicated Mineral Resource it will be able to make public key financial information including: annual production; scale; operating and capital cost; as well as economic returns. It is envisaged that the Company will be in this position in the latter half of the 2017 calendar year. In the meantime Centrex will gradually increase its investor relations activity focussing on those competitive advantages for the project that are able to be disclosed.
A number of independent recognised engineering firms contributed to the finalisation of the Scoping Study. Following on from their role in 2015 of assessing processing route options and establishing the bench scale testwork program, Amec Foster Wheeler provided engineering design along with preparation of initial capital and operating cost estimates. Clough completed a conceptual study into the construction of the nitric acid plant at the Oxley site which fed into the Scoping Study. Numerous other organisations were utilised not just in Australia but globally in Canada, the US, and Germany where the leading technical centres exist for the processing circuit components considered in the study.
The work to date has provided a number of technical routes for production of potassium fertilisers from the Oxley potash feldspar rich deposit. Preliminary engineering has already commenced to further analyse and select the most economical of these routes that will form the basis of the PFS. Swiss based licensor and engineering firm Casale have been engaged to complete a feasibility study for ammonia and nitric acid plants located at Oxley. Separately Canadian based potash engineering experts Novopro have been engaged to analyse and recommend optimisations of the hydrometallurgical circuit. Further appointments will be made soon for the other key project areas drawing on the best global knowledge bases available.
In addition to the work being undertaken in the PFS the Company will soon commence some very exciting research to be conducted at the University of South Australia (UniSA) with support from the Minerals Research Institute of Western Australia and the Mining, and Petroleum Centre of Excellence (an initiative of the South Australian Government). It is pleasing that our Company has been able to identify synergies with current research streams that have application to the project. Should the research prove successful it could result in a further step change for the project in terms of its cost and economic return.
Consistent with the Company’s diversification strategy and the focus on the Oxley Potassium Project has been the shift away from iron ore. Centrex has continued to rationalise its iron ore portfolio and during the year disposed of surplus land holdings as well as putting in place an agreement with Baotou Iron & Steel (Group) Co. (“Baotou”) to bring Centrex’s involvement with the Bungalow joint venture to a close. The Company is also confident of reaching a resolution with Wugang Australian Resources Investment Pty Ltd (“WARI”) that will bring to an end the Port Spencer joint venture and place the Eyre Iron joint venture on care and maintenance.
This final rationalisation of the iron ore portfolio has resulted in impairments of $3.7 million being recorded for the year while exploration of $2.6 million was capitalised with $1.8 million relating to the Oxley project.
David Klingberg AO FTSE Non-Executive Chairman Dated at Adelaide this 20th day of September 2016.
For
per
sona
l use
onl
y
2016 Annual Report - Page | 5
Chief Executive’s Report
A year devoted to the development of the Oxley Potassium Project (“Oxley”) acquired by the Company late last year , culminated in the completion of a positive Scoping Study showing globally competitive economic potential for an initial start-up high value potassium nitrate (“NOP”) speciality fertiliser operation.
The start-up NOP operation was supported by the Project’s maiden Inferred Mineral Resource of 155 million tonne announced during the year. This Mineral Resource represents just 3km of the 32km strike length of the outcropping ultrapotassic lava deposit, showing large expansion potential for not just NOP but also bulk potassium fertiliser production such as potassium sulphate (SOP) or potassium chloride (MOP).
A multitude of testwork and process design studies throughout the year with consultants and laboratories around the globe has provided Centrex ownership of significant intellectual property for the production of potassium fertilisers from potassium feldspar, and in particular in molten salt processing. Grants were also awarded by two Australian State Governments to further this knowledge via research based on Oxley to commence next year at the University of South Australia.
Centrex is now undertaking a Prefeasibility Study (“PFS”) for Oxley that signifies its transition from iron ore explorer to process developer, focusing on the fertiliser and chemicals space. Oxley provides a key focus for revenue generation in the future with all efforts being made to accelerate its progress in line with appropriate technical risk mitigation.
Due diligence has commenced on deposits outside of potash where Centrex can apply its process knowledge gained from Oxley, and this has already shown positive application in other industries based on testwork completed. Centrex intends to file for patents over this technology in the coming year.
The Company has reformed its team moving towards a more minerals processing focus, welcoming Steve Klose as its new General Manager Projects. Steve’s process engineering and capital projects background provides key additional technical engineering capability to the team.
OXLEY POTASH PROJECT, WA (CENTREX 100%)
A number of significant milestones were achieved during the year for Oxley that resulted in the completion of a positive Scoping Study for a start-up specialty NOP fertiliser operation.
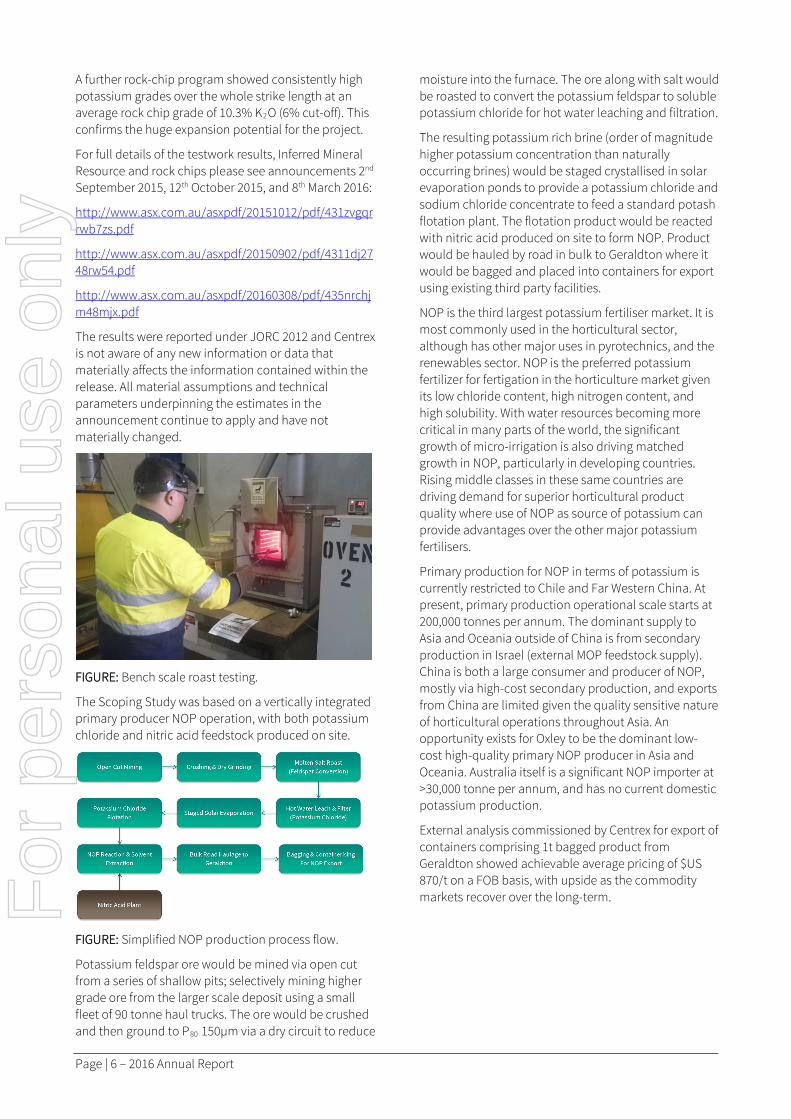
FIGURE: Oxley regional infrastructure map.
The first of these milestones was completion of bench scale molten salt roast and leach testwork demonstrating ability to convert more than 90% of potassium from potash feldspar (KAlSi3O8) into a soluble form. Potash feldspar hosts potassium and forms the bulk of the unit mineralogy in the ultrapotassic lava flow that forms the basis of the project.
The second milestone for the year was establishment of the project’s maiden Inferred Mineral Resource of 155 million tonnes at 8.3% K2O (6% cut-off), including 38 million tonnes at 10% K20 (9% cut-off), the latter underpinning the Scoping Study. The Inferred Mineral Resource was defined from just 3km of the overall 32km strike of the outcropping ore body.
For
per
sona
l use
onl
y
Page | 6 – 2016 Annual Report
A further rock-chip program showed consistently high potassium grades over the whole strike length at an average rock chip grade of 10.3% K2O (6% cut-off). This confirms the huge expansion potential for the project.
For full details of the testwork results, Inferred Mineral Resource and rock chips please see announcements 2nd September 2015, 12th October 2015, and 8th March 2016:
http://www.asx.com.au/asxpdf/20151012/pdf/431zvgqrrwb7zs.pdf
http://www.asx.com.au/asxpdf/20150902/pdf/4311dj2748rw54.pdf
http://www.asx.com.au/asxpdf/20160308/pdf/435nrchjm48mjx.pdf
The results were reported under JORC 2012 and Centrex is not aware of any new information or data that materially affects the information contained within the release. All material assumptions and technical parameters underpinning the estimates in the announcement continue to apply and have not materially changed.
FIGURE: Bench scale roast testing.
The Scoping Study was based on a vertically integrated primary producer NOP operation, with both potassium chloride and nitric acid feedstock produced on site.
FIGURE: Simplified NOP production process flow.
Potassium feldspar ore would be mined via open cut from a series of shallow pits; selectively mining higher grade ore from the larger scale deposit using a small fleet of 90 tonne haul trucks. The ore would be crushed and then ground to P80 150µm via a dry circuit to reduce
moisture into the furnace. The ore along with salt would be roasted to convert the potassium feldspar to soluble potassium chloride for hot water leaching and filtration.
The resulting potassium rich brine (order of magnitude higher potassium concentration than naturally occurring brines) would be staged crystallised in solar evaporation ponds to provide a potassium chloride and sodium chloride concentrate to feed a standard potash flotation plant. The flotation product would be reacted with nitric acid produced on site to form NOP. Product would be hauled by road in bulk to Geraldton where it would be bagged and placed into containers for export using existing third party facilities.
NOP is the third largest potassium fertiliser market. It is most commonly used in the horticultural sector, although has other major uses in pyrotechnics, and the renewables sector. NOP is the preferred potassium fertilizer for fertigation in the horticulture market given its low chloride content, high nitrogen content, and high solubility. With water resources becoming more critical in many parts of the world, the significant growth of micro-irrigation is also driving matched growth in NOP, particularly in developing countries. Rising middle classes in these same countries are driving demand for superior horticultural product quality where use of NOP as source of potassium can provide advantages over the other major potassium fertilisers.
Primary production for NOP in terms of potassium is currently restricted to Chile and Far Western China. At present, primary production operational scale starts at 200,000 tonnes per annum. The dominant supply to Asia and Oceania outside of China is from secondary production in Israel (external MOP feedstock supply). China is both a large consumer and producer of NOP, mostly via high-cost secondary production, and exports from China are limited given the quality sensitive nature of horticultural operations throughout Asia. An opportunity exists for Oxley to be the dominant low-cost high-quality primary NOP producer in Asia and Oceania. Australia itself is a significant NOP importer at >30,000 tonne per annum, and has no current domestic potassium production.
External analysis commissioned by Centrex for export of containers comprising 1t bagged product from Geraldton showed achievable average pricing of $US 870/t on a FOB basis, with upside as the commodity markets recover over the long-term.
For
per
sona
l use
onl
y
2016 Annual Report - Page | 7
GOULBURN POLYMETALLIC PROJECT, NSW (CENTREX 100%)
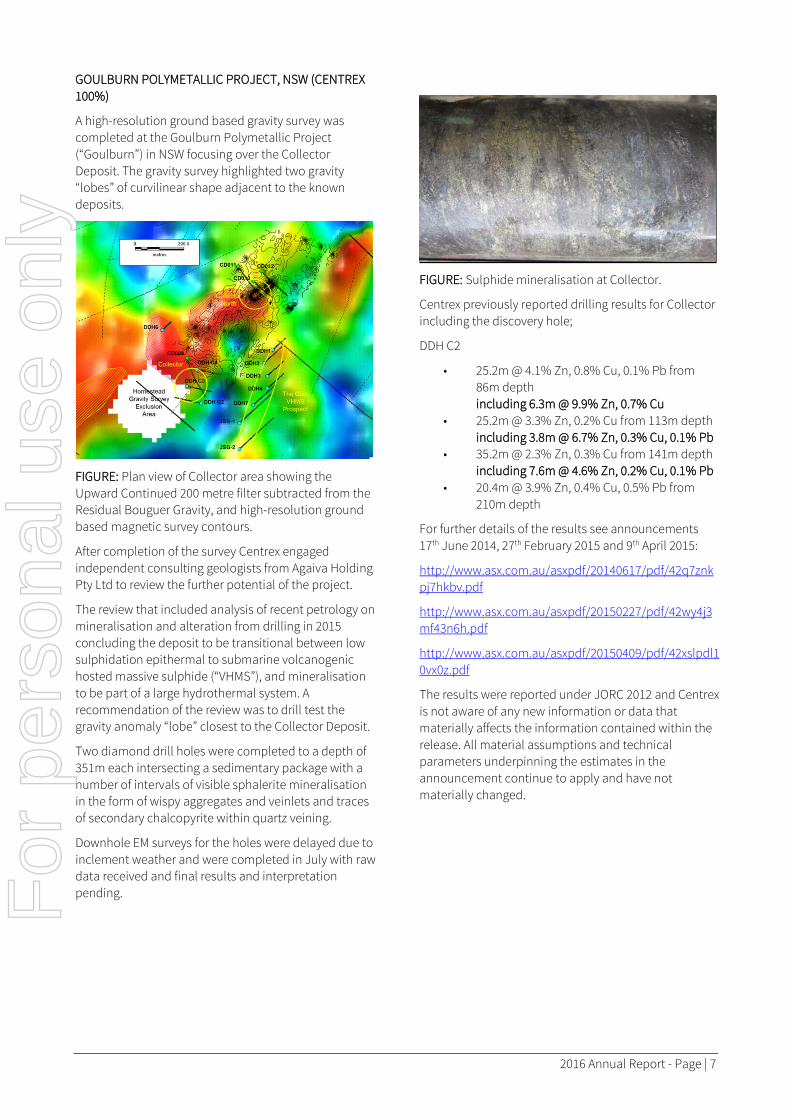
A high-resolution ground based gravity survey was completed at the Goulburn Polymetallic Project (“Goulburn”) in NSW focusing over the Collector Deposit. The gravity survey highlighted two gravity “lobes” of curvilinear shape adjacent to the known deposits.
FIGURE: Plan view of Collector area showing the Upward Continued 200 metre filter subtracted from the Residual Bouguer Gravity, and high-resolution ground based magnetic survey contours.
After completion of the survey Centrex engaged independent consulting geologists from Agaiva Holding Pty Ltd to review the further potential of the project.
The review that included analysis of recent petrology on mineralisation and alteration from drilling in 2015 concluding the deposit to be transitional between low sulphidation epithermal to submarine volcanogenic hosted massive sulphide (“VHMS”), and mineralisation to be part of a large hydrothermal system. A recommendation of the review was to drill test the gravity anomaly “lobe” closest to the Collector Deposit.
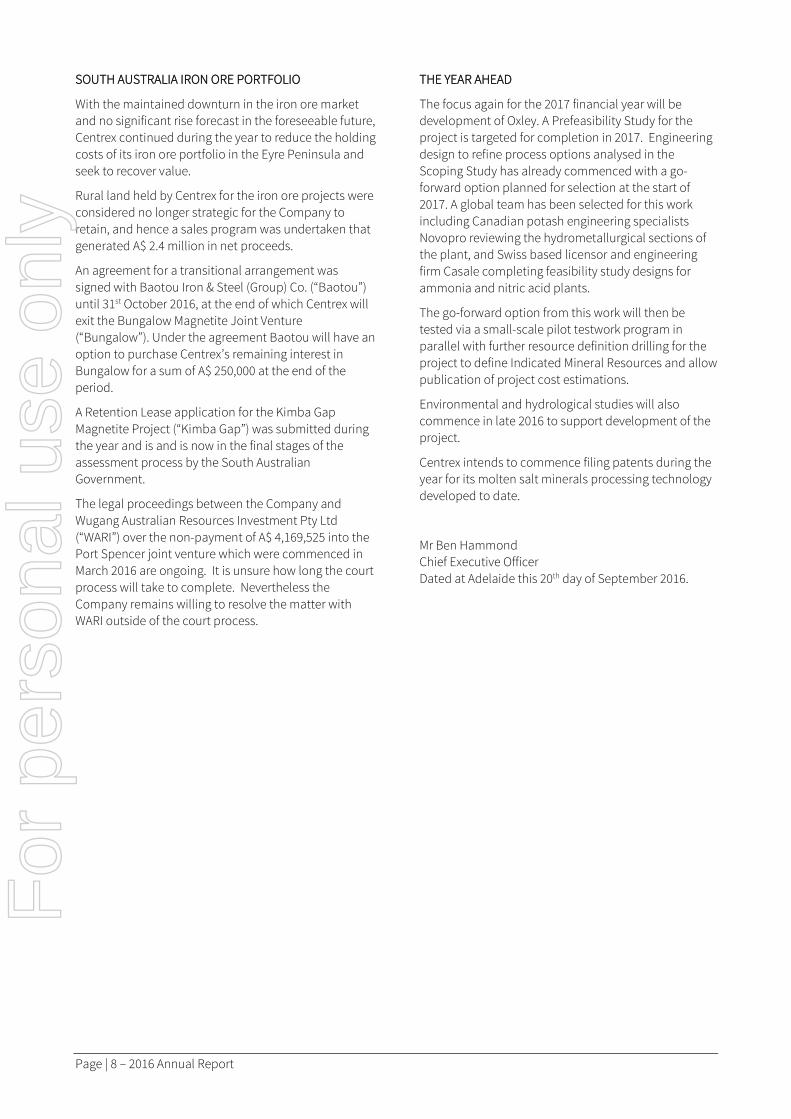
Two diamond drill holes were completed to a depth of 351m each intersecting a sedimentary package with a number of intervals of visible sphalerite mineralisation in the form of wispy aggregates and veinlets and traces of secondary chalcopyrite within quartz veining.
Downhole EM surveys for the holes were delayed due to inclement weather and were completed in July with raw data received and final results and interpretation pending.
FIGURE: Sulphide mineralisation at Collector.
Centrex previously reported drilling results for Collector including the discovery hole;
DDH C2
• 25.2m @ 4.1% Zn, 0.8% Cu, 0.1% Pb from 86m depth including 6.3m @ 9.9% Zn, 0.7% Cu
• 25.2m @ 3.3% Zn, 0.2% Cu from 113m depth including 3.8m @ 6.7% Zn, 0.3% Cu, 0.1% Pb
• 35.2m @ 2.3% Zn, 0.3% Cu from 141m depth including 7.6m @ 4.6% Zn, 0.2% Cu, 0.1% Pb
• 20.4m @ 3.9% Zn, 0.4% Cu, 0.5% Pb from 210m depth
For further details of the results see announcements 17th June 2014, 27th February 2015 and 9th April 2015:
http://www.asx.com.au/asxpdf/20140617/pdf/42q7znkpj7hkbv.pdf
http://www.asx.com.au/asxpdf/20150227/pdf/42wy4j3mf43n6h.pdf
http://www.asx.com.au/asxpdf/20150409/pdf/42xslpdl10vx0z.pdf
The results were reported under JORC 2012 and Centrex is not aware of any new information or data that materially affects the information contained within the release. All material assumptions and technical parameters underpinning the estimates in the announcement continue to apply and have not materially changed.
For
per
sona
l use
onl
y
Page | 8 – 2016 Annual Report
SOUTH AUSTRALIA IRON ORE PORTFOLIO
With the maintained downturn in the iron ore market and no significant rise forecast in the foreseeable future, Centrex continued during the year to reduce the holding costs of its iron ore portfolio in the Eyre Peninsula and seek to recover value.
Rural land held by Centrex for the iron ore projects were considered no longer strategic for the Company to retain, and hence a sales program was undertaken that generated A$ 2.4 million in net proceeds.
An agreement for a transitional arrangement was signed with Baotou Iron & Steel (Group) Co. (“Baotou”) until 31st October 2016, at the end of which Centrex will exit the Bungalow Magnetite Joint Venture (“Bungalow”). Under the agreement Baotou will have an option to purchase Centrex’s remaining interest in Bungalow for a sum of A$ 250,000 at the end of the period.
A Retention Lease application for the Kimba Gap Magnetite Project (“Kimba Gap”) was submitted during the year and is and is now in the final stages of the assessment process by the South Australian Government.
The legal proceedings between the Company and Wugang Australian Resources Investment Pty Ltd (“WARI”) over the non-payment of A$ 4,169,525 into the Port Spencer joint venture which were commenced in March 2016 are ongoing. It is unsure how long the court process will take to complete. Nevertheless the Company remains willing to resolve the matter with WARI outside of the court process.
THE YEAR AHEAD
The focus again for the 2017 financial year will be development of Oxley. A Prefeasibility Study for the project is targeted for completion in 2017. Engineering design to refine process options analysed in the Scoping Study has already commenced with a go-forward option planned for selection at the start of 2017. A global team has been selected for this work including Canadian potash engineering specialists Novopro reviewing the hydrometallurgical sections of the plant, and Swiss based licensor and engineering firm Casale completing feasibility study designs for ammonia and nitric acid plants.
The go-forward option from this work will then be tested via a small-scale pilot testwork program in parallel with further resource definition drilling for the project to define Indicated Mineral Resources and allow publication of project cost estimations.
Environmental and hydrological studies will also commence in late 2016 to support development of the project.
Centrex intends to commence filing patents during the year for its molten salt minerals processing technology developed to date.
Mr Ben Hammond Chief Executive Officer Dated at Adelaide this 20th day of September 2016.
For
per
sona
l use
onl
y
For
per
sona
l use
onl
y

Page | 10 – 2016 Annual Report
Mining Exploration Entity Annual Reporting Requirements
LIST OF TENEMENTS IN WHICH THE GROUP HAS AN INTEREST
1 Centrex Metals Limited 2 South Australian Iron Ore Group Pty Ltd (a wholly owned subsidiary of Centrex Metals Limited) 3 Lachlan Metals Pty Ltd (a wholly owned subsidiary of Centrex Metals Limited) 4 Centrex Potash Pty Ltd (a wholly owned subsidiary of Centrex Metals Limited)
TENEMENT LIST AS AT 30TH JUNE 2016
Location Exploration Licence number
Description Held by: Interest
%
South Australia
EL 4884 Bungalow / Minbrie CXM1 70
EL 5170 Kimba Gap SAIOG2 100
EL 5617 Stony Hill SAIOG2 100
EL 5559 Wanilla CXM1 40
EL 5641 Wilgerup CXM1 100
EL 4885 Greenpatch CXM1 40
EL 5712 Dutton Bay CXM1 40
EL 5065 Mount Hill SAIOG2 40
EL 4998 Carrow SAIOG2 40
New South Wales
EL 7388 Goulburn LM3 100
EL 7503 Archer LM3 100
EL 8215 Woolgarlo LM3 100
Western Australia
E70/3777 Oxley A CPPL4 100
E70/4004 Oxley B CPPL4 100
E70/4318 Oxley C CPPL4 100
E70/4319 Oxley D CPPL4 100
E70/4320 Oxley E CPPL4 100
E70/4378 Oxley F CPPL4 100
E70/4729 Oxley G CPPL4 100
For
per
sona
l use
onl
y
2016 Annual Report - Page | 11
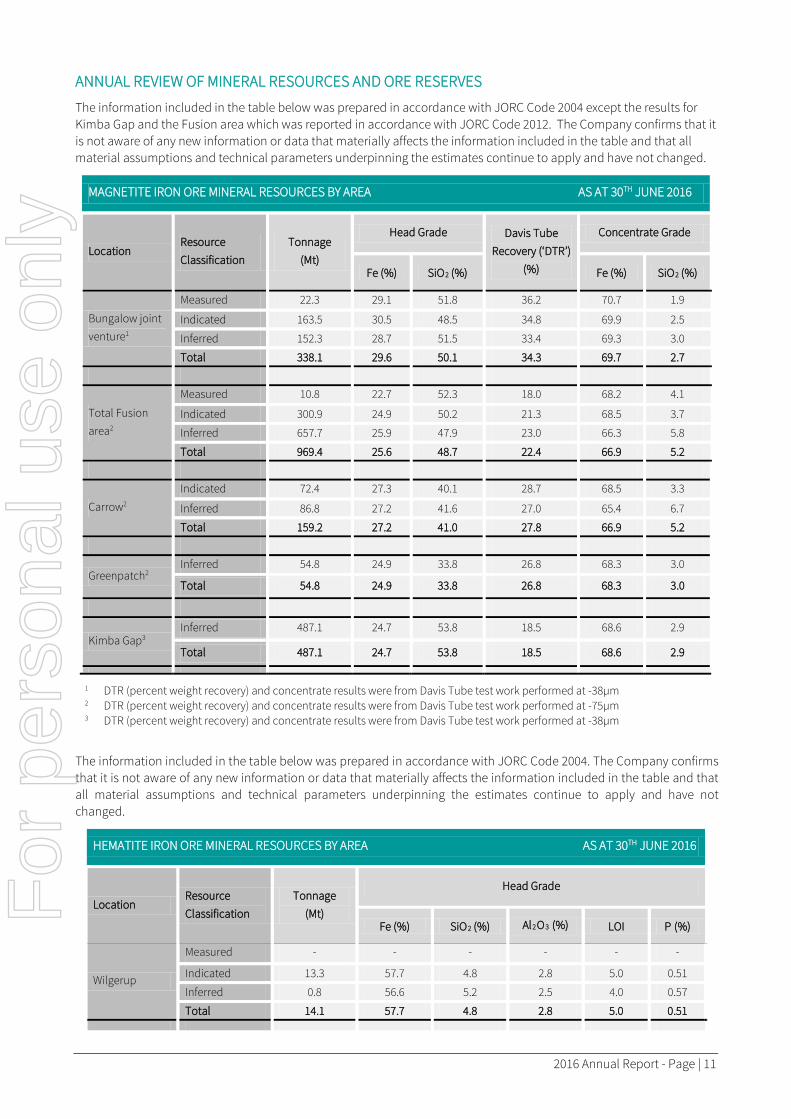
ANNUAL REVIEW OF MINERAL RESOURCES AND ORE RESERVES
The information included in the table below was prepared in accordance with JORC Code 2004 except the results for Kimba Gap and the Fusion area which was reported in accordance with JORC Code 2012. The Company confirms that it is not aware of any new information or data that materially affects the information included in the table and that all material assumptions and technical parameters underpinning the estimates continue to apply and have not changed.
1 DTR (percent weight recovery) and concentrate results were from Davis Tube test work performed at -38µm 2 DTR (percent weight recovery) and concentrate results were from Davis Tube test work performed at -75µm 3 DTR (percent weight recovery) and concentrate results were from Davis Tube test work performed at -38µm
The information included in the table below was prepared in accordance with JORC Code 2004. The Company confirms that it is not aware of any new information or data that materially affects the information included in the table and that all material assumptions and technical parameters underpinning the estimates continue to apply and have not changed.
MAGNETITE IRON ORE MINERAL RESOURCES BY AREA AS AT 30TH JUNE 2016
Location Resource Classification
Tonnage (Mt)
Head Grade Davis Tube Recovery (‘DTR’)
(%)
Concentrate Grade
Fe (%) SiO2 (%) Fe (%) SiO2 (%)
Bungalow joint venture1
Measured 22.3 29.1 51.8 36.2 70.7 1.9
Indicated 163.5 30.5 48.5 34.8 69.9 2.5
Inferred 152.3 28.7 51.5 33.4 69.3 3.0
Total 338.1 29.6 50.1 34.3 69.7 2.7
Total Fusion area2
Measured 10.8 22.7 52.3 18.0 68.2 4.1
Indicated 300.9 24.9 50.2 21.3 68.5 3.7
Inferred 657.7 25.9 47.9 23.0 66.3 5.8
Total 969.4 25.6 48.7 22.4 66.9 5.2
Carrow2
Indicated 72.4 27.3 40.1 28.7 68.5 3.3
Inferred 86.8 27.2 41.6 27.0 65.4 6.7
Total 159.2 27.2 41.0 27.8 66.9 5.2
Greenpatch2 Inferred 54.8 24.9 33.8 26.8 68.3 3.0
Total 54.8 24.9 33.8 26.8 68.3 3.0
Kimba Gap3 Inferred 487.1 24.7 53.8 18.5 68.6 2.9
Total 487.1 24.7 53.8 18.5 68.6 2.9
HEMATITE IRON ORE MINERAL RESOURCES BY AREA AS AT 30TH JUNE 2016
Location Resource Classification
Tonnage (Mt)
Head Grade
Fe (%) SiO2 (%) Al2O3 (%) LOI P (%)
Wilgerup
Measured - - - - - -
Indicated 13.3 57.7 4.8 2.8 5.0 0.51
Inferred 0.8 56.6 5.2 2.5 4.0 0.57
Total 14.1 57.7 4.8 2.8 5.0 0.51
For
per
sona
l use
onl
y
Page | 12 – 2016 Annual Report
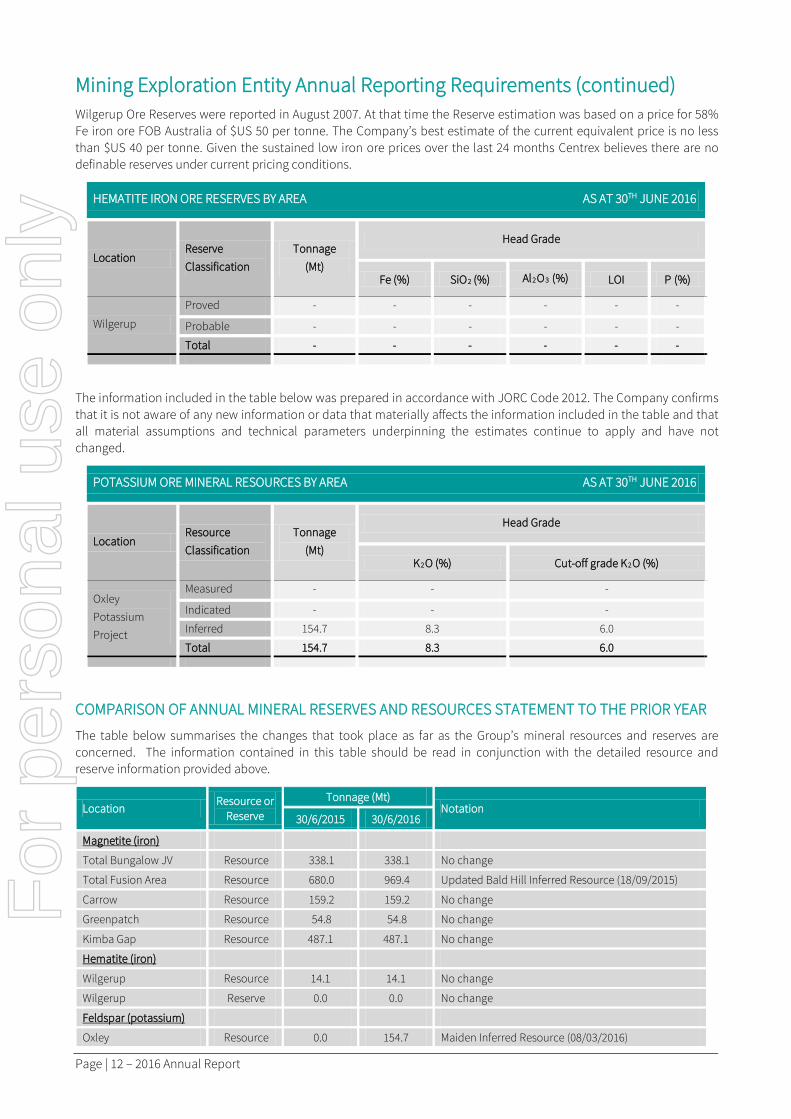
Mining Exploration Entity Annual Reporting Requirements (continued) Wilgerup Ore Reserves were reported in August 2007. At that time the Reserve estimation was based on a price for 58% Fe iron ore FOB Australia of $US 50 per tonne. The Company’s best estimate of the current equivalent price is no less than $US 40 per tonne. Given the sustained low iron ore prices over the last 24 months Centrex believes there are no definable reserves under current pricing conditions.
The information included in the table below was prepared in accordance with JORC Code 2012. The Company confirms that it is not aware of any new information or data that materially affects the information included in the table and that all material assumptions and technical parameters underpinning the estimates continue to apply and have not changed.
COMPARISON OF ANNUAL MINERAL RESERVES AND RESOURCES STATEMENT TO THE PRIOR YEAR
The table below summarises the changes that took place as far as the Group’s mineral resources and reserves are concerned. The information contained in this table should be read in conjunction with the detailed resource and reserve information provided above.
Location Resource or
Reserve
Tonnage (Mt) Notation
30/6/2015 30/6/2016
Magnetite (iron)
Total Bungalow JV Resource 338.1 338.1 No change
Total Fusion Area Resource 680.0 969.4 Updated Bald Hill Inferred Resource (18/09/2015)
Carrow Resource 159.2 159.2 No change
Greenpatch Resource 54.8 54.8 No change
Kimba Gap Resource 487.1 487.1 No change
Hematite (iron)
Wilgerup Resource 14.1 14.1 No change
Wilgerup Reserve 0.0 0.0 No change
Feldspar (potassium)
Oxley Resource 0.0 154.7 Maiden Inferred Resource (08/03/2016)
HEMATITE IRON ORE RESERVES BY AREA AS AT 30TH JUNE 2016
Location Reserve Classification
Tonnage (Mt)
Head Grade
Fe (%) SiO2 (%) Al2O3 (%) LOI P (%)
Wilgerup
Proved - - - - - -
Probable - - - - - -
Total - - - - - -
POTASSIUM ORE MINERAL RESOURCES BY AREA AS AT 30TH JUNE 2016
Location Resource Classification
Tonnage (Mt)
Head Grade
K2O (%) Cut-off grade K2O (%)
Oxley Potassium Project
Measured - - -
Indicated - - -
Inferred 154.7 8.3 6.0
Total 154.7 8.3 6.0
For
per
sona
l use
onl
y

2016 Annual Report - Page | 13
SUMMARY OF GOVERNANCE ARRANGEMENTS AND INTERNAL CONTROLS IN PLACE FOR THE REPORTING OF MINERAL RESOURCES AND ORE RESERVES
Mineral Resources and Ore Reserves are estimated by suitably qualified consultants in accordance with the JORC Code, using industry standard techniques and internal guidelines for the estimation and reporting of Ore Reserves and Mineral Resources. These estimates and the supporting documentation are then reviewed by suitably qualified Competent Persons from the Company.
All Ore Reserve estimates are prepared in conjunction with pre-feasibility studies which consider all material factors.
The Mineral Resources and Ore Reserves Statements included in the Annual Report are reviewed by suitably qualified Competent Persons from the Company prior to its inclusion.
CROSS REFERENCING OF THE RESOURCES ANNOUNCMENTS
For more detail regarding the Kimba Gap resource please see the announcement of 29th July 2014.
http://www.asx.com.au/asxpdf/20140729/pdf/42r2y42ddx4sh1.pdf
For more detail regarding the Bungalow resource please see the announcement of 25th May 2012.
http://www.asx.com.au/asxpdf/20120525/pdf/426gp0l17x8p6l.pdf
For more detail regarding the Fusion area, Carrow and Greenpatch resources please see the announcement of 18th September 2015.
http://www.asx.com.au/asxpdf/20150918/pdf/431f68b3p86hln.pdf
For more detail regarding the Wilgerup resources please see the announcement of 23rd October 2009.
http://www.asx.com.au/asxpdf/20091023/pdf/31lk86y343jpv1.pdf
For more detail regarding the Oxley resources please see the announcement of 8th March 2016.
http://www.asx.com.au/asxpdf/20160308/pdf/435nrchjm48mjx.pdf
COMPETENT PERSONS STATEMENT
The information in this report relating to Exploration Results (contained in the Chief Executive Officer’s report) and the resources and reserves data magnetite and hematite iron resources contained in the previous two pages is based on information either compiled or reviewed by Mr Alastair Watts who is a Member of the Australasian Institute of Mining and Metallurgy. Mr Watts is the General Manager Exploration of Centrex Metals Limited. Mr Watts has sufficient experience, which is relevant to the style of mineralization and type of deposit under consideration and to the activity, which he is undertaking to qualify as a Competent Person as defined in the 2012 Edition of the “Australasian Code for Reporting of Exploration Results, Mineral Resources and Ore Reserves”. Mr Watts consents to the inclusion in the report of the matters based on his information in the form and context in which it appears. The information in this report relating to the Mineral Resources of the Oxley Potassium Project is based on and accurately reflects information compiled by Ms Sharron Sylvester of OreWin Pty Ltd, who is a consultant and adviser to Centrex Metals Limited and who is a Member of the Australian Institute of Geoscientists (RPGeo). Ms Sylvester has sufficient experience relevant to the style of mineralisation and type of deposit under consideration and to the activity she is undertaking to qualify as a Competent Person as defined in the 2012 Edition of the “Australasian Code for Reporting of Exploration Results, Mineral Resources and Ore Reserves”. Ms Sylvester consents to the inclusion in the report of the matters based on this information in the form and context in which it appears. F
or p
erso
nal u
se o
nly

Page | 14 – 2016 Annual Report
Directors’ Report For the Year Ended 30th June 2016
The Directors present their report together with the consolidated financial report of Centrex Metals Limited (“Company”) and its controlled entities (“Group”), for the financial year ended 30th June 2016 and the auditor’s report thereon.
Section Contents of Directors’ Report
1 Directors and the Company Secretary
2 Executives considered to be Key Management Personnel
3 Directors’ Meetings
4 Corporate Governance Statement
5 Remuneration Report (audited)
6 Principal Activity
7 Operating and Financial Review
8 Dividends
9 Events subsequent to year end
10 Likely Developments
11 Directors’ Interests in Shares and Options
12 Share Rights
13 Indemnification and insurance of Directors and Officers
14 Environmental Regulation and Performance
15 Non-audit services
16 Lead Auditor’s Independence Declaration
For
per
sona
l use
onl
y
2016 Annual Report - Page | 15
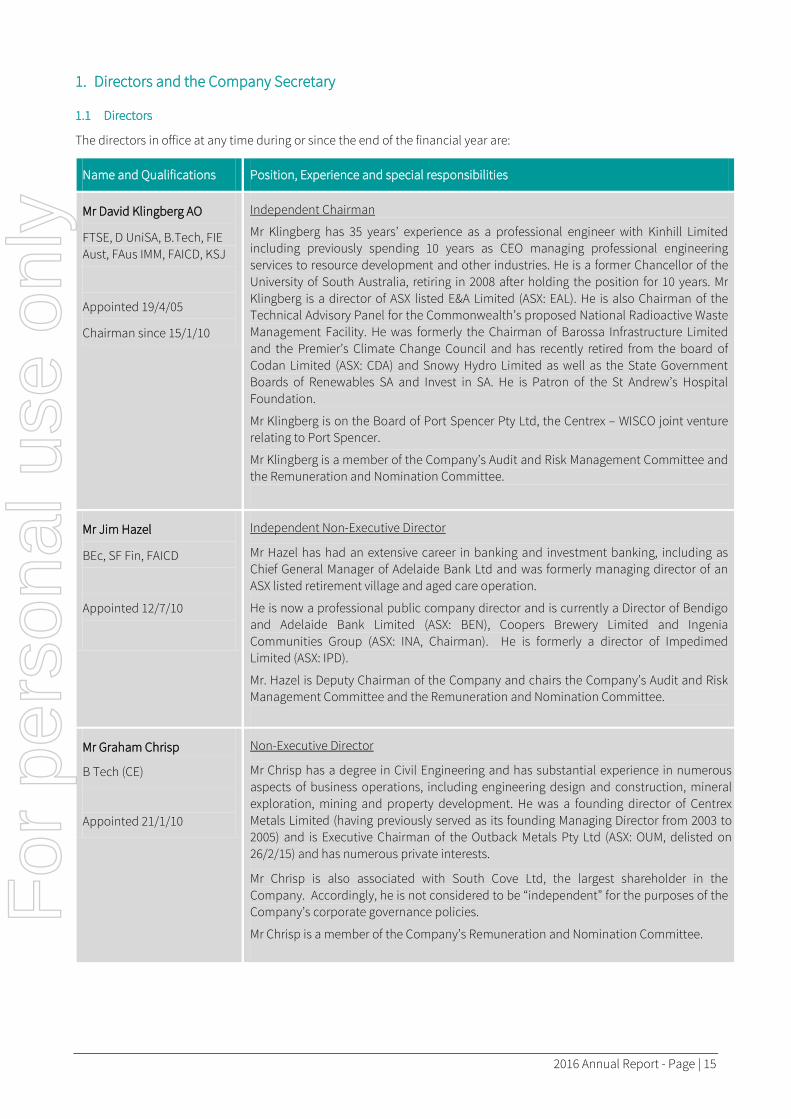
1. Directors and the Company Secretary
1.1 Directors
The directors in office at any time during or since the end of the financial year are:
Name and Qualifications Position, Experience and special responsibilities
Mr David Klingberg AO
FTSE, D UniSA, B.Tech, FIE Aust, FAus IMM, FAICD, KSJ
Appointed 19/4/05
Chairman since 15/1/10
Independent Chairman
Mr Klingberg has 35 years’ experience as a professional engineer with Kinhill Limited including previously spending 10 years as CEO managing professional engineering services to resource development and other industries. He is a former Chancellor of the University of South Australia, retiring in 2008 after holding the position for 10 years. Mr Klingberg is a director of ASX listed E&A Limited (ASX: EAL). He is also Chairman of the Technical Advisory Panel for the Commonwealth’s proposed National Radioactive Waste Management Facility. He was formerly the Chairman of Barossa Infrastructure Limited and the Premier’s Climate Change Council and has recently retired from the board of Codan Limited (ASX: CDA) and Snowy Hydro Limited as well as the State Government Boards of Renewables SA and Invest in SA. He is Patron of the St Andrew’s Hospital Foundation.
Mr Klingberg is on the Board of Port Spencer Pty Ltd, the Centrex – WISCO joint venture relating to Port Spencer.
Mr Klingberg is a member of the Company’s Audit and Risk Management Committee and the Remuneration and Nomination Committee.
Mr Jim Hazel
BEc, SF Fin, FAICD
Appointed 12/7/10
Independent Non-Executive Director
Mr Hazel has had an extensive career in banking and investment banking, including as Chief General Manager of Adelaide Bank Ltd and was formerly managing director of an ASX listed retirement village and aged care operation.
He is now a professional public company director and is currently a Director of Bendigo and Adelaide Bank Limited (ASX: BEN), Coopers Brewery Limited and Ingenia Communities Group (ASX: INA, Chairman). He is formerly a director of Impedimed Limited (ASX: IPD).
Mr. Hazel is Deputy Chairman of the Company and chairs the Company’s Audit and Risk Management Committee and the Remuneration and Nomination Committee.
Mr Graham Chrisp
B Tech (CE)
Appointed 21/1/10
Non-Executive Director
Mr Chrisp has a degree in Civil Engineering and has substantial experience in numerous aspects of business operations, including engineering design and construction, mineral exploration, mining and property development. He was a founding director of Centrex Metals Limited (having previously served as its founding Managing Director from 2003 to 2005) and is Executive Chairman of the Outback Metals Pty Ltd (ASX: OUM, delisted on 26/2/15) and has numerous private interests.
Mr Chrisp is also associated with South Cove Ltd, the largest shareholder in the Company. Accordingly, he is not considered to be “independent” for the purposes of the Company’s corporate governance policies.
Mr Chrisp is a member of the Company’s Remuneration and Nomination Committee.
For
per
sona
l use
onl
y
Directors’ Report (continued)
Page | 16 – 2016 Annual Report
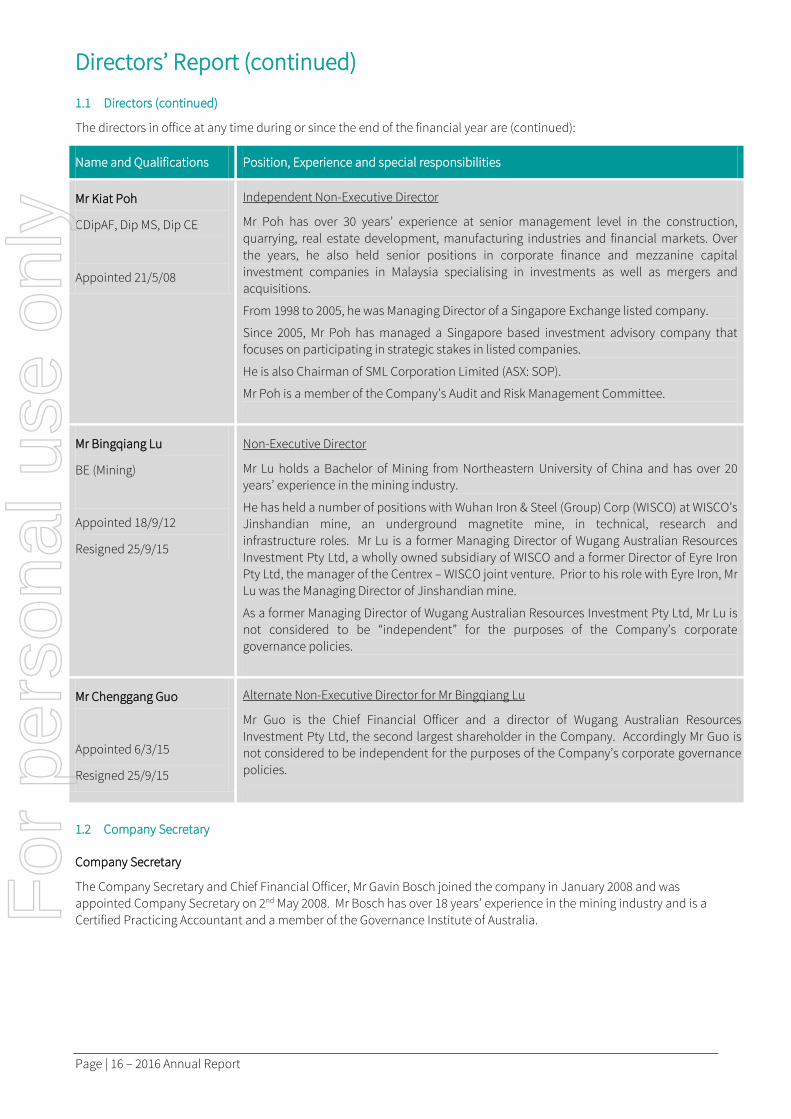
1.1 Directors (continued)
The directors in office at any time during or since the end of the financial year are (continued):
Name and Qualifications Position, Experience and special responsibilities
Mr Kiat Poh
CDipAF, Dip MS, Dip CE
Appointed 21/5/08
Independent Non-Executive Director
Mr Poh has over 30 years’ experience at senior management level in the construction, quarrying, real estate development, manufacturing industries and financial markets. Over the years, he also held senior positions in corporate finance and mezzanine capital investment companies in Malaysia specialising in investments as well as mergers and acquisitions.
From 1998 to 2005, he was Managing Director of a Singapore Exchange listed company.
Since 2005, Mr Poh has managed a Singapore based investment advisory company that focuses on participating in strategic stakes in listed companies.
He is also Chairman of SML Corporation Limited (ASX: SOP).
Mr Poh is a member of the Company’s Audit and Risk Management Committee.
Mr Bingqiang Lu
BE (Mining)
Appointed 18/9/12
Resigned 25/9/15
Non-Executive Director
Mr Lu holds a Bachelor of Mining from Northeastern University of China and has over 20 years’ experience in the mining industry.
He has held a number of positions with Wuhan Iron & Steel (Group) Corp (WISCO) at WISCO’s Jinshandian mine, an underground magnetite mine, in technical, research and infrastructure roles. Mr Lu is a former Managing Director of Wugang Australian Resources Investment Pty Ltd, a wholly owned subsidiary of WISCO and a former Director of Eyre Iron Pty Ltd, the manager of the Centrex – WISCO joint venture. Prior to his role with Eyre Iron, Mr Lu was the Managing Director of Jinshandian mine.
As a former Managing Director of Wugang Australian Resources Investment Pty Ltd, Mr Lu is not considered to be “independent” for the purposes of the Company’s corporate governance policies.
Mr Chenggang Guo
Appointed 6/3/15
Resigned 25/9/15
Alternate Non-Executive Director for Mr Bingqiang Lu
Mr Guo is the Chief Financial Officer and a director of Wugang Australian Resources Investment Pty Ltd, the second largest shareholder in the Company. Accordingly Mr Guo is not considered to be independent for the purposes of the Company’s corporate governance policies.
1.2 Company Secretary
Company Secretary
The Company Secretary and Chief Financial Officer, Mr Gavin Bosch joined the company in January 2008 and was appointed Company Secretary on 2nd May 2008. Mr Bosch has over 18 years’ experience in the mining industry and is a Certified Practicing Accountant and a member of the Governance Institute of Australia.
For
per
sona
l use
onl
y
2016 Annual Report - Page | 17
2. Executives considered to be Key Management Personnel
The executives considered to be key management personnel in office at any time during or since the end of the financial year are:
Chief Executive Officer
The Chief Executive Officer, Mr Ben Hammond was appointed on 1st July 2013, and was Acting Chief Executive Office since 13th February 2013. Prior to this Mr Hammond was the company’s Chief Development Officer as well as Chief Operating Officer for Eyre Iron Pty Ltd, Centrex’s iron ore joint venture with Wuhan Iron & Steel (Group) Co. Mr Hammond remains a Director of Eyre Iron Pty Ltd.
Mr Hammond holds a degree in Geology as well as an MBA. He has spent his career in bulk commodities with Centrex Metals, Illawarra Coal and BHP Billiton Iron Ore. His roles have spanned business development, project management, business improvement, mine geology and exploration. His operational experience extends beyond mining having also worked in ports, rail and maintenance. In 2012 Mr Hammond became a member of the Australian Institute of Company Directors.
General Manager, Exploration
The General Manager, Exploration, Mr Alastair Watts was appointed on 15th March 2007.
Mr Watts is a geologist with 24 years’ experience in mining and exploration geology and is a member of the Australian Institute of Mining and Metallurgy. He has worked extensively within a range of commodities and mine sites across Australasia including the gold mining regions near Kalgoorlie, Western Australia, Charters Towers, Queensland, the Solomon Islands, nickel laterite in Indonesia and phosphate in Queensland. More recently he held a 3 year position with BHP Iron Ore as the Superintendent of Geology and Quality Control at Newman, Western Australia.
Mr Watts holds a Bachelor of Science (Geology) from Flinders University of South Australia and a Diploma of Business (Front Line Management) from the Australian Institute of Management.
Chief Financial Officer
Mr Gavin Bosch is the Company Secretary and Chief Financial Officer and is considered to be a member of key management personnel and his qualifications are listed above at item 1.2 of this Directors’ Report.
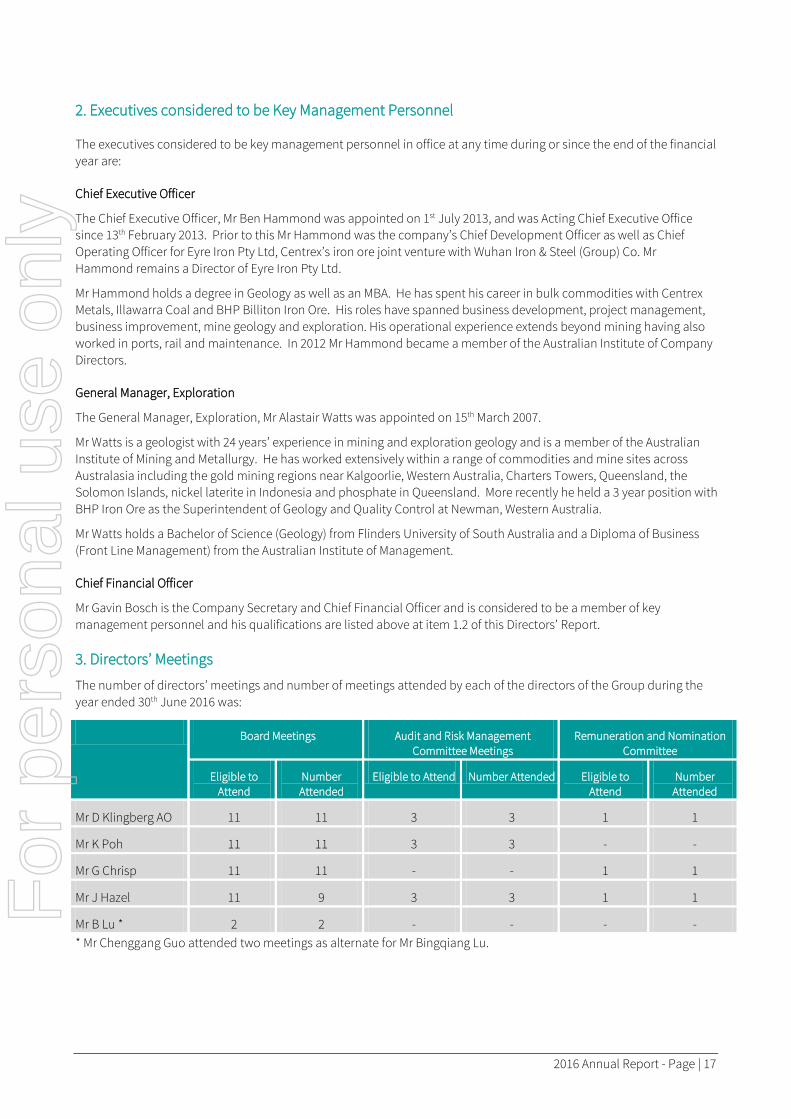
3. Directors’ Meetings
The number of directors’ meetings and number of meetings attended by each of the directors of the Group during the year ended 30th June 2016 was:
Board Meetings Audit and Risk Management Committee Meetings
Remuneration and Nomination Committee
Eligible to Attend
Number Attended
Eligible to Attend Number Attended Eligible to Attend
Number Attended
Mr D Klingberg AO 11 11 3 3 1 1
Mr K Poh 11 11 3 3 - -
Mr G Chrisp 11 11 - - 1 1
Mr J Hazel 11 9 3 3 1 1
Mr B Lu * 2 2 - - - - * Mr Chenggang Guo attended two meetings as alternate for Mr Bingqiang Lu.
For
per
sona
l use
onl
y
Directors’ Report (continued)
Page | 18 – 2016 Annual Report
4. Corporate Governance Statement
The Board is committed to the principles underpinning best practice in corporate governance. The Company must comply with the ASX Listing Rules which require it to report annually on the extent to which it complied with the Corporate Governance Principles and Recommendations (Principles) as published by the ASX Corporate Governance Council. The Board believes that the Company has complied with the Principles for the current reporting period unless otherwise stated in the Appendix 4G which is lodged on the Company announcements platform at the same time as the annual report.
A description of the Company’s main corporate governance practices are available on the Company’s website located at:
http://centrexmetals.com.au/governance/
5. Remuneration Report - audited
5.1 Principles of compensation
The remuneration report provides details of the remuneration of the Company’s directors and the senior executives identified as those who had authority for planning, directing and controlling the Company’s activities during the reporting period (key management personnel).
Total remuneration packages for directors and executives of the Group are competitively set to attract and retain appropriately qualified and experienced people. The Remuneration and Nomination Committee assists the Board in setting remuneration strategy. Furthermore, the Board utilises industry data with particular reference to the practices of companies in the lowest quartile of the data (i.e. those with a similar market capitalisation and with a similar sized workforce) to determine the appropriateness of the remuneration packages paid by the Company which takes account of trends in comparative companies and the objectives of the Company’s remuneration strategy to attract suitably qualified candidates, reward the achievement of strategic objectives, and achieve the broader outcome of creation of value for shareholders.
Non-Executive Directors
Total compensation for all Non-Executive Directors, pursuant to the constitution must not exceed $500,000 per annum. Fees were set with reference to standard practice by comparator companies.
For the year ended 30th June 2016, the Non-Executive Directors’ compensation comprised Directors’ base fees of $81,000 per annum (2015: $81,000 per annum) for the Chairman and $49,500 per annum (2015: $49,500 per annum) for the other Non-Executive Directors. In
addition, $9,000 per annum (2015: $9,000 per annum) was paid for membership of the Audit and Risk Management Committee or for representation on the board of Eyre Iron Pty Ltd, with an additional $2,250 per annum (2015: $2,250 per annum) for the Chairman of the Audit and Risk Management Committee.
Superannuation is paid on behalf of the Non-Executive Directors at the rate of 9.5% per annum as is legislated. Where the Company engages a director as a consultant the value of superannuation benefits that would otherwise have been payable are paid as additional fees. For the year ended 30th June 2016 Messer’s Klingberg, Poh and Chrisp had the value of superannuation benefits paid as additional consultancy fees.
Chief Executive Officer and Company Executives
Remuneration packages for the Chief Executive Officer and other Company executives include a mix of fixed and variable compensation, the variable compensation using short and long term incentives. The remuneration packages take into account market practice of comparable organisations within the industry and reflect capability, role and experience of each executive.
The fixed remuneration component (cash, superannuation and fringe benefits) was set by utilising industry surveys with particular reference to the practices of companies in the lowest quartile of the survey (i.e. those with a similar market capitalisation and with a similar sized workforce). Total remuneration (base salary packages and variable remuneration) provides the opportunity for executives to reach compensation levels in the next quartile as outlined within the industry surveys through the following variable awards:
• the Short Term Incentive (“STI”) Plan, which awards a cash bonus of between 0% and 20% of base salary subject to individual and Company targets being met; and
• the Long Term Incentive (“LTI”) Plan, under which the executive may be granted incentive rights, some of which vest after an extended period of continuous employment (Retention Rights), the others vesting after an assessment of performance (Performance Rights).
For the 2016 financial year there were no awards made under either the STI or LTI plans. F
or p
erso
nal u
se o
nly

2016 Annual Report - Page | 19
Mr Ben Hammond
Mr Hammond was appointed Chief Executive Officer on 1st July 2013. For the 2016 financial year Mr Hammond volunteered a 10% reduction in his salary effective from 1st September 2015 making his total remuneration package for the year $393,141 (2015: $428,218). Should the Company commence either a Definitive or Bankable Feasibility Study at a future date, Mr Hammond will revert to his previous salary level.
If Mr Hammond’s employment is terminated without cause or due to a failure to provide the services required under the agreement, he will be entitled to 6 months written notice (or payment of salary in lieu of) and any accrued but not yet paid salary and leave entitlements. He will also be entitled to any right or entitlement accrued under an incentive scheme (provided all necessary approvals have been obtained in relation to that right or entitlement before cessation of employment).
Where Mr Hammond’s employment is terminated with cause, such as due to a serious or persistent breach of the terms of the agreement or the failure to comply with the lawful directions of the Board, notice of termination will be effective immediately without payment of any amount or the provision of any benefit, other than salary and leave entitlements accrued to the date of termination and not yet paid.
Mr Hammond is also entitled to participate in the Company’s short term and long term incentive schemes as outlined above.
Other Executives considered to be Key Management Personnel
In addition to the Non-Executive Directors and executives listed above, the following persons are considered to be key management personnel of the Group:
Mr Alastair Watts General Manager Exploration
Mr Gavin Bosch Chief Financial Officer
The experience of these persons has been listed in sections 1.2 and 2 of this Directors’ Report.
Service Agreements
The Company has service contracts with each executive listed above. Each contract is for an unlimited term, but can be terminated by either party by giving up to three months written notice. The Company reserves the right to terminate the contract without notice in the event of misconduct or dishonesty.
For
per
sona
l use
onl
y
Directors’ Report (continued)
Page | 20 – 2016 Annual Report
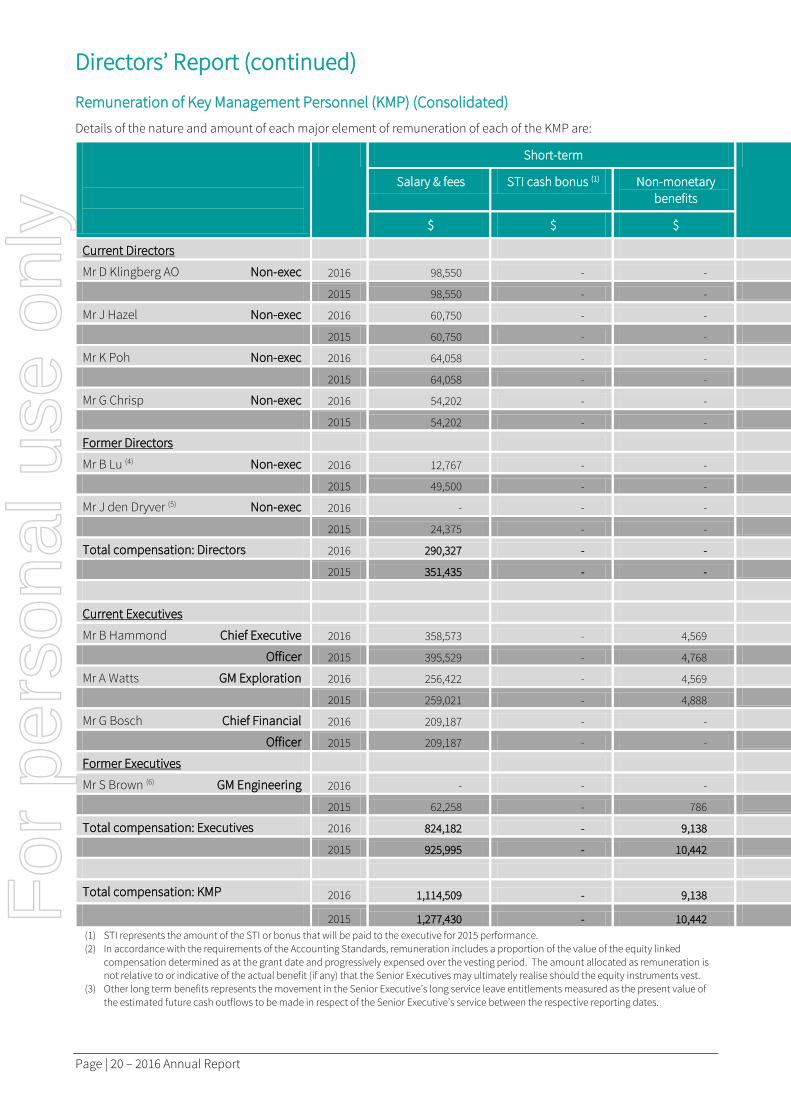
Remuneration of Key Management Personnel (KMP) (Consolidated)
Details of the nature and amount of each major element of remuneration of each of the KMP are:
Short-term
Salary & fees STI cash bonus (1) Non-monetary benefits
$ $ $
Current Directors
Mr D Klingberg AO Non-exec 2016 98,550 - -
2015 98,550 - -
Mr J Hazel Non-exec 2016 60,750 - -
2015 60,750 - -
Mr K Poh Non-exec 2016 64,058 - -
2015 64,058 - -
Mr G Chrisp Non-exec 2016 54,202 - -
2015 54,202 - -
Former Directors
Mr B Lu (4) Non-exec 2016 12,767 - -
2015 49,500 - -
Mr J den Dryver (5) Non-exec 2016 - - -
2015 24,375 - -
Total compensation: Directors 2016 290,327 - -
2015 351,435 - -
Current Executives
Mr B Hammond Chief Executive 2016 358,573 - 4,569
Officer 2015 395,529 - 4,768
Mr A Watts GM Exploration 2016 256,422 - 4,569
2015 259,021 - 4,888
Mr G Bosch Chief Financial 2016 209,187 - -
Officer 2015 209,187 - -
Former Executives
Mr S Brown (6) GM Engineering 2016 - - -
2015 62,258 - 786
Total compensation: Executives 2016 824,182 - 9,138
2015 925,995 - 10,442
Total compensation: KMP 2016 1,114,509 - 9,138
2015 1,277,430 - 10,442
(1) STI represents the amount of the STI or bonus that will be paid to the executive for 2015 performance. (2) In accordance with the requirements of the Accounting Standards, remuneration includes a proportion of the value of the equity linked
compensation determined as at the grant date and progressively expensed over the vesting period. The amount allocated as remuneration is not relative to or indicative of the actual benefit (if any) that the Senior Executives may ultimately realise should the equity instruments vest.
(3) Other long term benefits represents the movement in the Senior Executive’s long service leave entitlements measured as the present value of the estimated future cash outflows to be made in respect of the Senior Executive’s service between the respective reporting dates.
For
per
sona
l use
onl
y
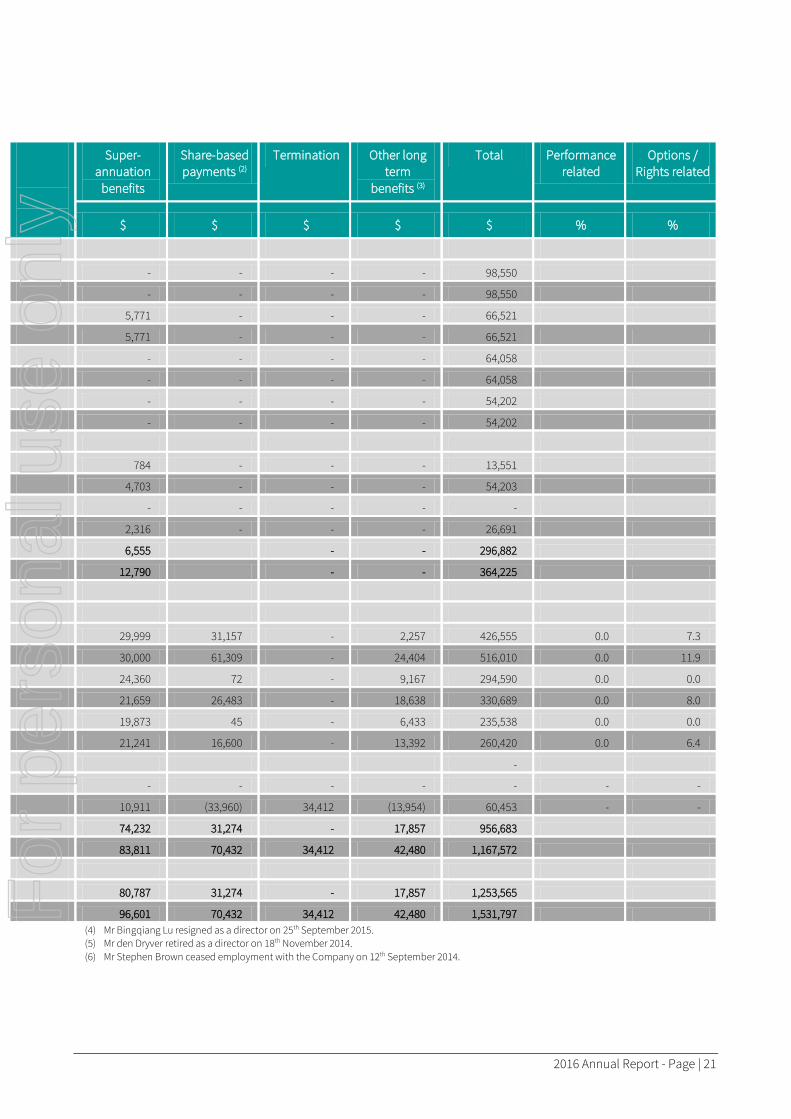
2016 Annual Report - Page | 21
Super-annuation
benefits
Share-based payments (2)
Termination Other long term
benefits (3)
Total Performance related
Options / Rights related
$ $ $ $ $ % %
- - - - 98,550
- - - - 98,550
5,771 - - - 66,521
5,771 - - - 66,521
- - - - 64,058
- - - - 64,058
- - - - 54,202
- - - - 54,202
784 - - - 13,551
4,703 - - - 54,203
- - - - -
2,316 - - - 26,691
6,555 - - 296,882
12,790 - - 364,225
29,999 31,157 - 2,257 426,555 0.0 7.3
30,000 61,309 - 24,404 516,010 0.0 11.9
24,360 72 - 9,167 294,590 0.0 0.0
21,659 26,483 - 18,638 330,689 0.0 8.0
19,873 45 - 6,433 235,538 0.0 0.0
21,241 16,600 - 13,392 260,420 0.0 6.4
-
- - - - - - -
10,911 (33,960) 34,412 (13,954) 60,453 - -
74,232 31,274 - 17,857 956,683
83,811 70,432 34,412 42,480 1,167,572
80,787 31,274 - 17,857 1,253,565
96,601 70,432 34,412 42,480 1,531,797 (4) Mr Bingqiang Lu resigned as a director on 25th September 2015. (5) Mr den Dryver retired as a director on 18th November 2014. (6) Mr Stephen Brown ceased employment with the Company on 12th September 2014.
For
per
sona
l use
onl
y
Directors’ Report (continued)
Page | 22 – 2016 Annual Report
5. Remuneration Report – audited (continued)
Consequences of performance on shareholder wealth
The variable components of the Company’s executives’ remuneration (the short and long term incentives) seek to encourage alignment of management performance and shareholders’ interests by linking remuneration to performance of the Company as a whole.
The award of any short term or long term incentive is always at the discretion of the Board which will also take into account the following indices when assessing performance, although the Board acknowledges that as an exploration company the use of such indices does not fully reflect Company performance.
2016 2015 2014 2013 2012
Profit / (loss) attributable to owners of the company
(4,987,053) (14,821,127) (734,552) $1,004,564 $673,476
Dividends paid (per share) - - $0.05 $0.05 -
Share price at 30 June $0.06 $0.08 $0.09 $0.13 $0.19
Short Term Incentive – Cash Bonus
The STI Plan ordinarily involves the setting of key performance indicators which must be achieved to be awarded the short term incentive (cash bonus). These relate to overall Company performance, business unit performance and individual performance set by the Board and the Chief Executive Officer for the relevant period.
For the period ending 30th June 2016 the Company did not set any key performance indicators and accordingly no bonuses for performance for the same period have been accrued.
Director / Company Executive Amount Accrued For Year Ended 30th June 2016
Awarded Forfeited Included in
Remuneration
% % $
Mr B Hammond Chief Executive Officer Nil 100 Nil
Mr A Watts General Manager Exploration Nil 100 Nil
Mr G Bosch Chief Financial Officer Nil 100 Nil
Long Term Incentive – Equity based
The Company’s Long Term Incentive Plan is intended to reward efforts and results that promote long term growth in shareholder value. The key performance indicator which must be achieved for the vesting of Company executives’ Performance Rights is the growth in the Company’s share price.
The other component of the long term incentive plan is the grant of Retention Rights. Retention Rights vest on the completion of a period of service with the Company. The purpose of granting Retention Rights is to retain executives who over the time of their employment accumulate significant intellectual property of value to the Company, and to ensure the continuity of that knowledge and in turn promote a stable and efficient executive team.
No Performance Rights or Retention Rights have been issued by the Company since July 2013.
Rights
Performance rights over 1,000,000 shares were held by the Chief Executive Officer at 30th June 2016. These rights have since lapsed. The Company did not issue any rights to directors or key management personnel during the year. Further information on the rights held by KMP is disclosed in note 18 of the financial statements.
For
per
sona
l use
onl
y

2016 Annual Report - Page | 23
6. Principal Activity
The principal activity of the Group during the reporting year was exploration on the following areas: • Potash exploration over wholly owned tenements in Western Australia. • Gold and base metals exploration in New South Wales; • Iron ore exploration in conjunction with joint venture partners; and • Iron ore exploration over wholly owned tenements.
7. Operating and Financial Review
A review of the operations of the Group during the year and the results of those operations are as follows: The net loss for the reporting year, after providing for income tax was:
2016 $
2015 $
Net loss after income tax (4,987,053) (14,821,127)
The Group incurred expenditure of $2,615,760 (2015: $5,821,586) on mineral tenements during the year. Further details can be found in Note 8 to the financial statements.
Further information on the Group’s operating activities can be found in the Operations Report.
8. Dividends
No dividends were declared during the year.
9. Events subsequent to year end
There has not arisen in the interval between the end of the financial year and the date of this report any item, transaction or event of a material and unusual nature likely, in the opinion of the directors of the Company, to affect significantly the operations of the Group, the results of those operations or the state of affairs of the Group, in future years.
For
per
sona
l use
onl
y
Directors’ Report (continued)
Page | 24 – 2016 Annual Report
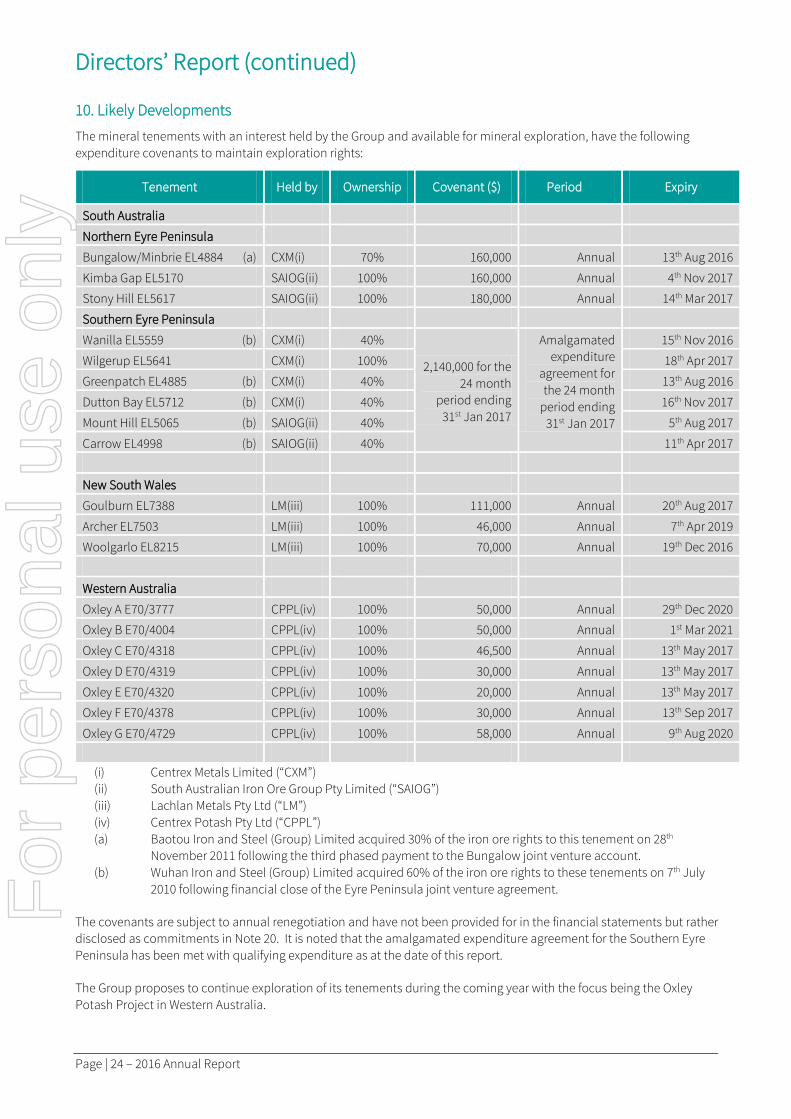
10. Likely Developments
The mineral tenements with an interest held by the Group and available for mineral exploration, have the following expenditure covenants to maintain exploration rights:
Tenement Held by Ownership Covenant ($) Period Expiry
South Australia
Northern Eyre Peninsula
Bungalow/Minbrie EL4884 (a) CXM(i) 70% 160,000 Annual 13th Aug 2016
Kimba Gap EL5170 SAIOG(ii) 100% 160,000 Annual 4th Nov 2017
Stony Hill EL5617 SAIOG(ii) 100% 180,000 Annual 14th Mar 2017
Southern Eyre Peninsula
Wanilla EL5559 (b) CXM(i) 40%
2,140,000 for the 24 month
period ending 31st Jan 2017
Amalgamated expenditure
agreement for the 24 month
period ending 31st Jan 2017
15th Nov 2016
Wilgerup EL5641 CXM(i) 100% 18th Apr 2017
Greenpatch EL4885 (b) CXM(i) 40% 13th Aug 2016
Dutton Bay EL5712 (b) CXM(i) 40% 16th Nov 2017
Mount Hill EL5065 (b) SAIOG(ii) 40% 5th Aug 2017
Carrow EL4998 (b) SAIOG(ii) 40% 11th Apr 2017
New South Wales
Goulburn EL7388 LM(iii) 100% 111,000 Annual 20th Aug 2017
Archer EL7503 LM(iii) 100% 46,000 Annual 7th Apr 2019
Woolgarlo EL8215 LM(iii) 100% 70,000 Annual 19th Dec 2016
Western Australia
Oxley A E70/3777 CPPL(iv) 100% 50,000 Annual 29th Dec 2020
Oxley B E70/4004 CPPL(iv) 100% 50,000 Annual 1st Mar 2021
Oxley C E70/4318 CPPL(iv) 100% 46,500 Annual 13th May 2017
Oxley D E70/4319 CPPL(iv) 100% 30,000 Annual 13th May 2017
Oxley E E70/4320 CPPL(iv) 100% 20,000 Annual 13th May 2017
Oxley F E70/4378 CPPL(iv) 100% 30,000 Annual 13th Sep 2017
Oxley G E70/4729 CPPL(iv) 100% 58,000 Annual 9th Aug 2020
(i) Centrex Metals Limited (“CXM”) (ii) South Australian Iron Ore Group Pty Limited (“SAIOG”) (iii) Lachlan Metals Pty Ltd (“LM”) (iv) Centrex Potash Pty Ltd (“CPPL”) (a) Baotou Iron and Steel (Group) Limited acquired 30% of the iron ore rights to this tenement on 28th
November 2011 following the third phased payment to the Bungalow joint venture account. (b) Wuhan Iron and Steel (Group) Limited acquired 60% of the iron ore rights to these tenements on 7th July
2010 following financial close of the Eyre Peninsula joint venture agreement.
The covenants are subject to annual renegotiation and have not been provided for in the financial statements but rather disclosed as commitments in Note 20. It is noted that the amalgamated expenditure agreement for the Southern Eyre Peninsula has been met with qualifying expenditure as at the date of this report.
The Group proposes to continue exploration of its tenements during the coming year with the focus being the Oxley Potash Project in Western Australia.
For
per
sona
l use
onl
y

2016 Annual Report - Page | 25
Some of the mineral tenements listed above have expiry dates that precede the date of this report. Each of those tenements is in the process of being renewed by the relevant government department and the Group has no reason to expect that the renewal will not take place.
The Directors have assessed the status of all of the Group’s tenements and believe all tenements have sufficient remaining mineral potential to warrant continued exploration. Tenement exploration will continue to be prioritised to maximise the benefit to be received from exploration.
Lincoln Minerals Limited has the right to explore for and exploit minerals other than iron ore on the above tenements held by Centrex Metals Limited in the Northern Eyre Peninsula and Southern Eyre Peninsula listed above.
11. Directors’ Interests in Shares and Options
The relevant interest of each Director in the shares or options over such instruments issued by the Company and other related bodies corporate, as notified by the Directors to the Australian Stock Exchange in accordance with S205G(1) of the Corporations Act 2001, at the date of this report is as follows:
Name Shares held Options held
Number Price/Expiry
Patna Properties Pty Ltd (a company associated with Mr David Klingberg AO)
1,742,810 - -
Mr Kiat Poh 1,918,880 - -
South Cove Ltd (a company associated with Mr Graham Chrisp)
80,876,005 - -
SEL Holding Ltd (a company associated with Mr Graham Chrisp)
16,198,000 - -
Lodge Ltd (a company associated with Mr Graham Chrisp) 4,366,667 - -
Wugang Australian Resources Investment Pty Ltd (a company associated with Mr Bingqiang Lu).
40,399,599 - -
Candlegrove Pty Ltd (a company associated with Mr Jim Hazel)
503,073 - -
Other than transactions as detailed in Note 18 to the financial statements, no director has received or become entitled to receive, during or since the end of the reporting year, a benefit because of a contract made by the Group or a related body corporate with a director, a firm of which a director is a member or a Company in which a director has a substantial financial interest.
12. Share Rights
Rights granted to Directors and executives of the Group
The Company did not grant any options and rights during or since the end of the year.
Unissued shares under rights
At the date of this report unissued ordinary shares of the Company under options or rights as detailed in Note 15 to the financial statements are:
Option / Right class Expiry date Exercise price
Unissued shares at
30th Jun 2016
No. cancelled since
30th Jun 2016
No. exercised since
30th Jun 2016
No. of unissued
shares
2016 Perform. Rights 31st Jul 2016 $0.20 1,000,000 1,000,000 - -
For
per
sona
l use
onl
y
Directors’ Report (continued)
Page | 26 – 2016 Annual Report
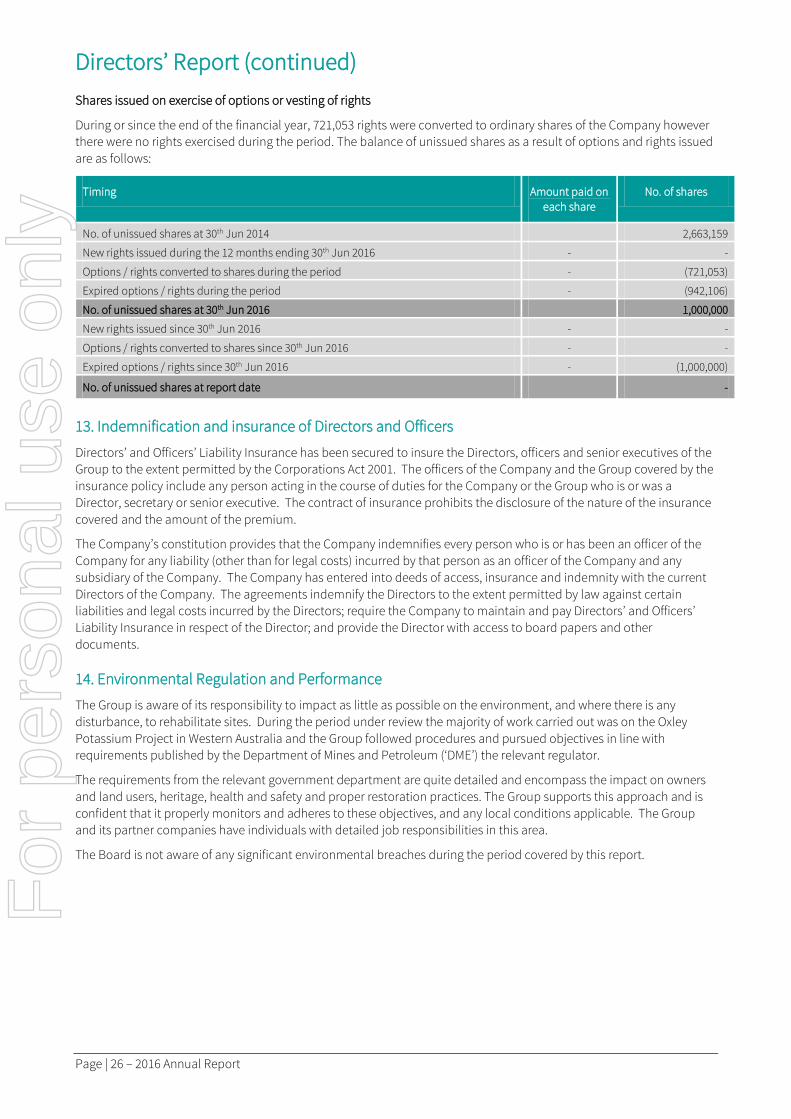
Shares issued on exercise of options or vesting of rights
During or since the end of the financial year, 721,053 rights were converted to ordinary shares of the Company however there were no rights exercised during the period. The balance of unissued shares as a result of options and rights issued are as follows:
Timing Amount paid on each share
No. of shares
No. of unissued shares at 30th Jun 2014 2,663,159
New rights issued during the 12 months ending 30th Jun 2016 - -
Options / rights converted to shares during the period - (721,053)
Expired options / rights during the period - (942,106)
No. of unissued shares at 30th Jun 2016 1,000,000
New rights issued since 30th Jun 2016 - -
Options / rights converted to shares since 30th Jun 2016 - -
Expired options / rights since 30th Jun 2016 - (1,000,000)
No. of unissued shares at report date -
13. Indemnification and insurance of Directors and Officers
Directors’ and Officers’ Liability Insurance has been secured to insure the Directors, officers and senior executives of the Group to the extent permitted by the Corporations Act 2001. The officers of the Company and the Group covered by the insurance policy include any person acting in the course of duties for the Company or the Group who is or was a Director, secretary or senior executive. The contract of insurance prohibits the disclosure of the nature of the insurance covered and the amount of the premium.
The Company’s constitution provides that the Company indemnifies every person who is or has been an officer of the Company for any liability (other than for legal costs) incurred by that person as an officer of the Company and any subsidiary of the Company. The Company has entered into deeds of access, insurance and indemnity with the current Directors of the Company. The agreements indemnify the Directors to the extent permitted by law against certain liabilities and legal costs incurred by the Directors; require the Company to maintain and pay Directors’ and Officers’ Liability Insurance in respect of the Director; and provide the Director with access to board papers and other documents.
14. Environmental Regulation and Performance
The Group is aware of its responsibility to impact as little as possible on the environment, and where there is any disturbance, to rehabilitate sites. During the period under review the majority of work carried out was on the Oxley Potassium Project in Western Australia and the Group followed procedures and pursued objectives in line with requirements published by the Department of Mines and Petroleum (‘DME’) the relevant regulator.
The requirements from the relevant government department are quite detailed and encompass the impact on owners and land users, heritage, health and safety and proper restoration practices. The Group supports this approach and is confident that it properly monitors and adheres to these objectives, and any local conditions applicable. The Group and its partner companies have individuals with detailed job responsibilities in this area.
The Board is not aware of any significant environmental breaches during the period covered by this report.
For
per
sona
l use
onl
y

2016 Annual Report - Page | 27
15. Non-audit services
During the year KPMG, the Company’s auditor, has performed certain other services in addition to their statutory duties.
The Board has considered the non-audit services provided during the year by the auditor and in accordance with written advice provided by resolution of the Audit and Risk Management Committee is satisfied that the provision of those non-audit services during the year by the auditor is compatible with, and did not compromise, the auditor independence requirements of the Corporations Act 2001 for the following reasons:
• all non-audit services were subject to the corporate governance procedures adopted by the Company and have been reviewed by the Audit and Risk Management Committee to ensure they do not impact the integrity and objectivity of the auditor; and
• the non-audit services provided do not undermine the general principles relating to auditor independence as set out in APES 110 Code of Ethics for Professional Accountants, as they did not involve reviewing or auditing the auditor’s own work, acting in a management or decision making capacity for the Company, acting as an advocate for the Company or jointly sharing risks and rewards.
Details of the amounts paid or accrued to the auditor of the Company, KPMG, and its related practices for audit and non-audit services provided during the year are set out below.
2016 $
2015 $
Audit Services 49,750 62,500
Other services - taxation services 16,589 30,265
Auditor's of the company - KPMG 66,339 92,765
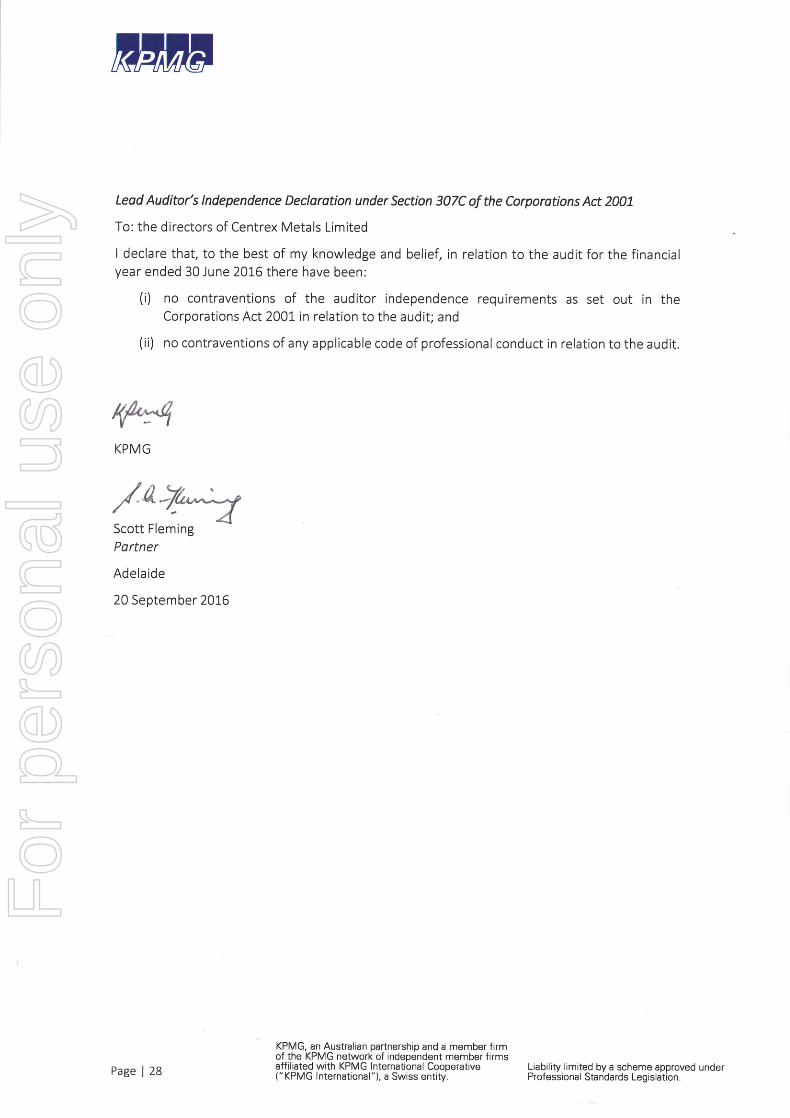
16. Lead Auditor’s Independence Declaration
The Lead auditor’s independence declaration is set out on page 28 and forms part of the Directors’ Report for the financial year ended 30th June 2016. Signed in accordance with a Resolution of the Board of Directors:
Mr David Klingberg AO Chairman
Dated at Adelaide this 20th day of September 2016.
For
per
sona
l use
onl
y
For
per
sona
l use
onl
y

For
per
sona
l use
onl
y
Page | 30 - 2016 Annual Report
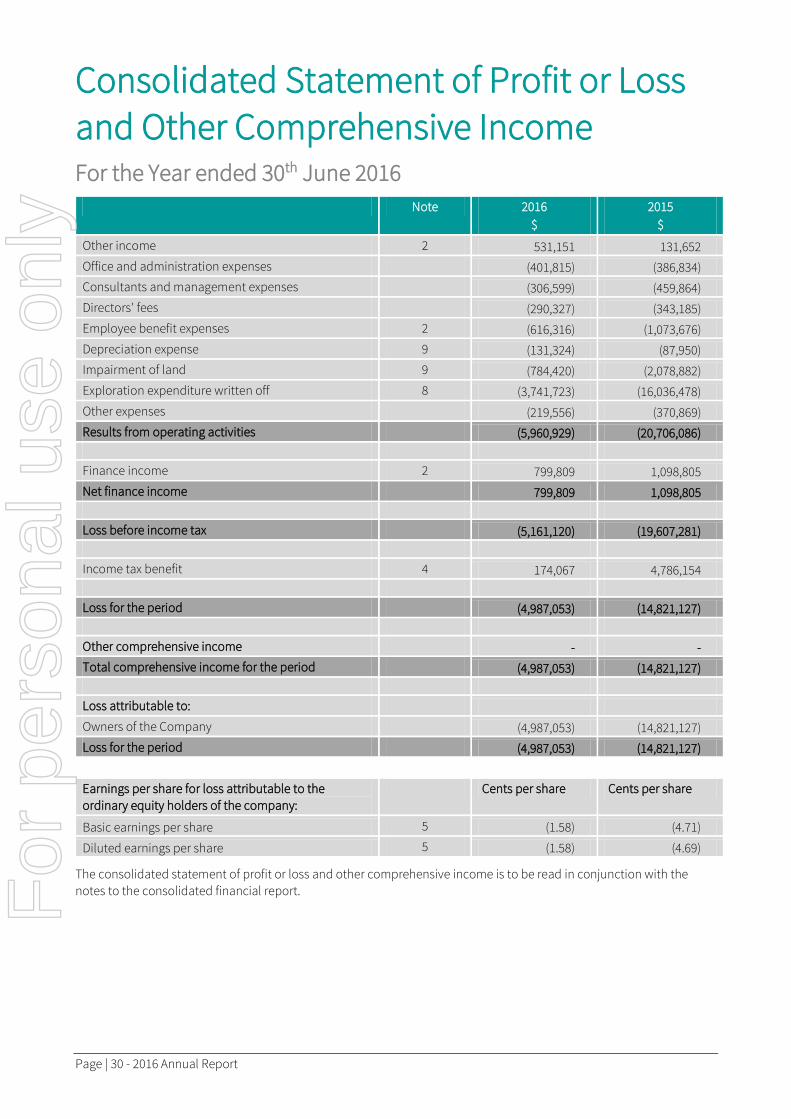
Consolidated Statement of Profit or Loss and Other Comprehensive Income For the Year ended 30th June 2016
Note 2016 $
2015 $
Other income 2 531,151 131,652 Office and administration expenses (401,815) (386,834) Consultants and management expenses (306,599) (459,864) Directors' fees (290,327) (343,185) Employee benefit expenses 2 (616,316) (1,073,676) Depreciation expense 9 (131,324) (87,950) Impairment of land 9 (784,420) (2,078,882) Exploration expenditure written off 8 (3,741,723) (16,036,478) Other expenses (219,556) (370,869) Results from operating activities (5,960,929) (20,706,086) Finance income 2 799,809 1,098,805 Net finance income 799,809 1,098,805 Loss before income tax (5,161,120) (19,607,281) Income tax benefit 4 174,067 4,786,154 Loss for the period (4,987,053) (14,821,127) Other comprehensive income - - Total comprehensive income for the period (4,987,053) (14,821,127) Loss attributable to: Owners of the Company (4,987,053) (14,821,127) Loss for the period (4,987,053) (14,821,127)
Earnings per share for loss attributable to the ordinary equity holders of the company:
Cents per share Cents per share
Basic earnings per share 5 (1.58) (4.71)
Diluted earnings per share 5 (1.58) (4.69)
The consolidated statement of profit or loss and other comprehensive income is to be read in conjunction with the notes to the consolidated financial report. F
or p
erso
nal u
se o
nly
2016 Annual Report - Page | 31
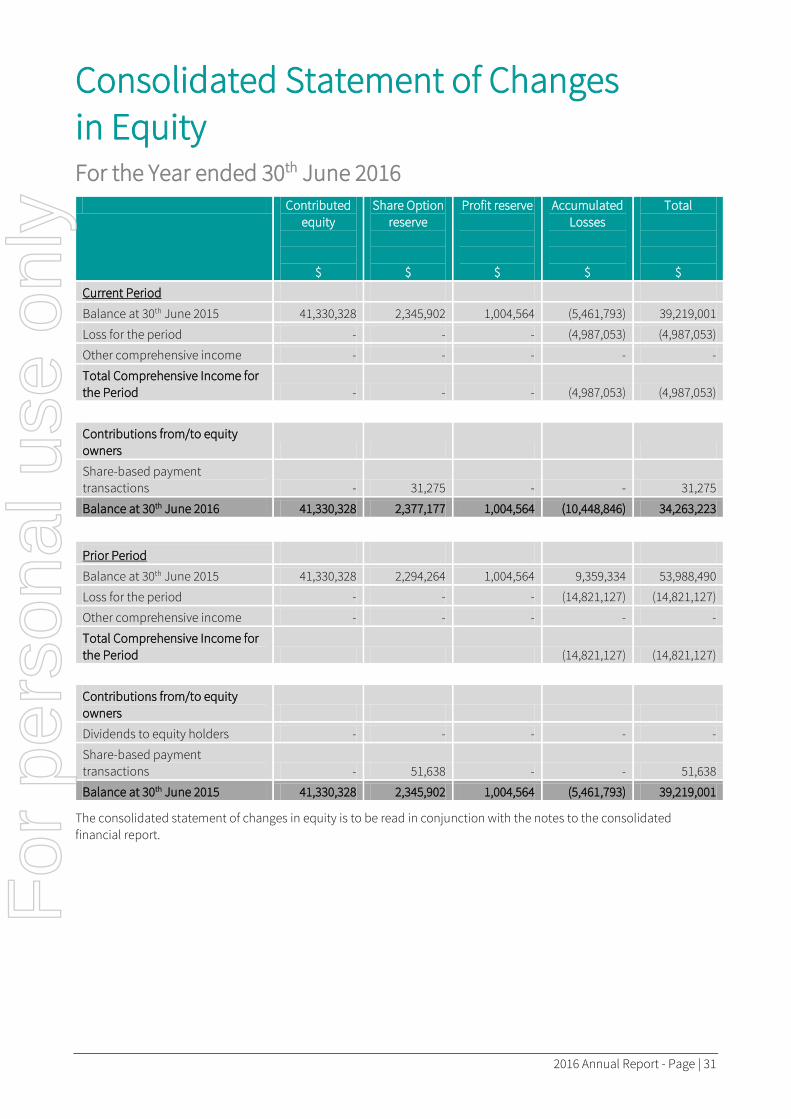
Consolidated Statement of Changes in Equity For the Year ended 30th June 2016
Contributed equity
$
Share Option reserve
$
Profit reserve
$
Accumulated Losses
$
Total
$
Current Period
Balance at 30th June 2015 41,330,328 2,345,902 1,004,564 (5,461,793) 39,219,001
Loss for the period - - - (4,987,053) (4,987,053)
Other comprehensive income - - - - -
Total Comprehensive Income for the Period - - - (4,987,053) (4,987,053)
Contributions from/to equity owners
Share-based payment transactions - 31,275 - - 31,275
Balance at 30th June 2016 41,330,328 2,377,177 1,004,564 (10,448,846) 34,263,223
Prior Period
Balance at 30th June 2015 41,330,328 2,294,264 1,004,564 9,359,334 53,988,490
Loss for the period - - - (14,821,127) (14,821,127)
Other comprehensive income - - - - -
Total Comprehensive Income for the Period (14,821,127) (14,821,127)
Contributions from/to equity owners
Dividends to equity holders - - - - -
Share-based payment transactions - 51,638 - - 51,638
Balance at 30th June 2015 41,330,328 2,345,902 1,004,564 (5,461,793) 39,219,001
The consolidated statement of changes in equity is to be read in conjunction with the notes to the consolidated financial report.
For
per
sona
l use
onl
y

Page | 32 - 2016 Annual Report
Consolidated Statement of Financial Position As at 30th June 2016
Note As at
30th June 2016 $
30th June 2015 $
Assets
Cash and cash equivalents 6 1,714,633 8,585,743
Term deposits 6 25,362,482 19,587,926
Receivables and other assets 7 578,616 423,722
Total Current Assets 27,655,731 28,597,391
Exploration and evaluation expenditure 8 6,649,919 7,775,882
Land and buildings 9 630,643 3,480,997
Plant and equipment 9 19,295 46,072
Total Non-Current Assets 7,299,857 11,302,951
Total assets 34,955,588 39,900,342
Liabilities
Trade and other payables 10 326,301 261,962
Employee benefits 11 143,838 158,823
Total Current Liabilities 470,139 420,785
Deferred income tax liabilities 4 - -
Employee benefits 11 222,226 260,556
Total Non-Current Liabilities 222,226 260,556
Total Liabilities 692,365 681,341
Net assets 34,263,223 39,219,001
Equity
Contributed equity 41,330,328 41,330,328
Share option reserve 2,377,177 2,345,902
Profit reserve 1,004,564 1,004,564
Accumulated losses (10,448,846) (5,461,793)
Total equity 34,263,223 39,219,001
The consolidated statement of financial position is to be read in conjunction with the notes to the consolidated financial report. F
or p
erso
nal u
se o
nly
2016 Annual Report - Page | 33
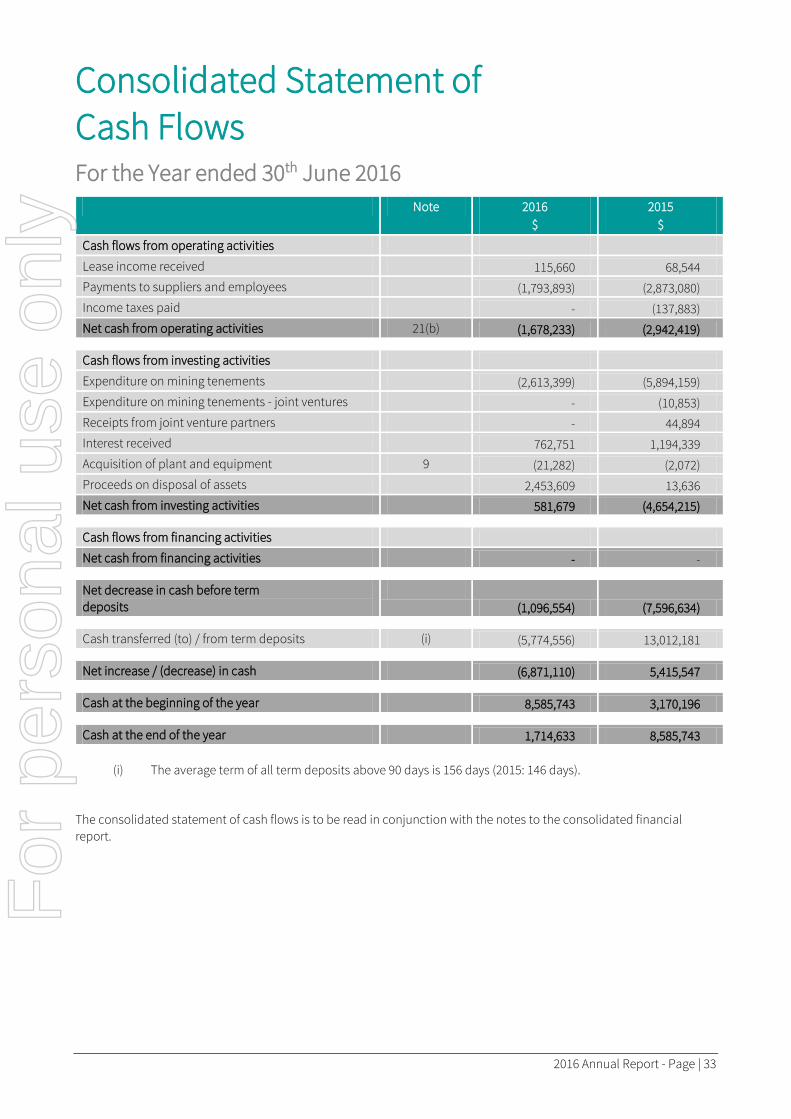
Consolidated Statement of Cash Flows For the Year ended 30th June 2016
Note 2016 $
2015 $
Cash flows from operating activities
Lease income received 115,660 68,544 Payments to suppliers and employees (1,793,893) (2,873,080) Income taxes paid - (137,883) Net cash from operating activities 21(b) (1,678,233) (2,942,419) Cash flows from investing activities Expenditure on mining tenements (2,613,399) (5,894,159) Expenditure on mining tenements - joint ventures - (10,853) Receipts from joint venture partners - 44,894 Interest received 762,751 1,194,339 Acquisition of plant and equipment 9 (21,282) (2,072) Proceeds on disposal of assets 2,453,609 13,636 Net cash from investing activities 581,679 (4,654,215) Cash flows from financing activities Net cash from financing activities - - Net decrease in cash before term deposits
(1,096,554) (7,596,634)
Cash transferred (to) / from term deposits (i) (5,774,556) 13,012,181 Net increase / (decrease) in cash (6,871,110) 5,415,547 Cash at the beginning of the year 8,585,743 3,170,196 Cash at the end of the year 1,714,633 8,585,743
(i) The average term of all term deposits above 90 days is 156 days (2015: 146 days).
The consolidated statement of cash flows is to be read in conjunction with the notes to the consolidated financial report.
For
per
sona
l use
onl
y
Page | 34 – 2016 Annual Report
Notes to the Consolidated Financial Statements For the Year ended 30th June 2016 1. STATEMENT OF SIGNIFICANT ACCOUNTING POLICIES
On 26th February 2016 the Company relocated its registered office to Level 6, 44 Waymouth Street Adelaide, SA 5000. Prior to this the registered office of the Company was Level 11, 147 Pirie Street Adelaide, SA 5000. The consolidated financial report of the Company for the financial year ended 30th June 2016 comprises the Company and its subsidiaries (together referred to as the ‘Group’). The Group is a for profit entity and is primarily involved in minerals exploration in Australia.
The financial report was authorised for issue by the directors on 20th September 2016.
a) Statement of Compliance
The financial report is a general purpose financial report, which has been prepared in accordance with Australian Accounting Standards (‘AASBs’) (including Australian Interpretations) adopted by the Australian Accounting Standards Board (‘AASB’) and the Corporations Act 2001. The consolidated financial statements of the Group complies with International Financial Reporting Standards (‘IFRSs’) and interpretations adopted by the International Accounting Standards Board (‘IASB’).
b) Basis of Measurement and Presentation
The financial report is presented in Australian dollars, which is the Group’s functional currency.
It has been prepared on the basis of historical cost and, except where stated, does not take into account changing money values or current valuations of non-current assets.
c) Accounting estimates and judgements
The Group’s estimates and judgements that have a significant risk of causing a material adjustment to the carrying amounts of assets and liabilities within the next financial year are discussed below.
Estimates and assumptions
Income Tax – Note 1(i)
Determination of future taxable profits requires estimates and assumptions as to future events and circumstances, in particular, whether successful
development and commercial exploitation, or alternatively sale, of the respective area of interest will be achieved. At this point in time the Group has assumed there is insufficient probability of generating income and as such has not recognised a deferred tax asset in relation to the Group’s carried forward tax losses in excess of the value to offset its deferred tax liabilities.
Exploration, evaluation and development assets – Note 1(j)
Determining the recoverability of exploration, evaluation and development expenditure capitalised in accordance with the Group’s accounting policy (refer Note 1(j)), requires estimates and assumptions as to future events and circumstances in particular, whether successful development and commercial exploitation, or alternatively sale, of the respective areas of interest will be achieved. Critical to this assessment are estimates and assumptions as to ore reserves, the timing of expected cash flows, exchange rates, commodity prices and future capital requirements. Changes in these estimates and assumptions as new information about the presence or recoverability of an ore reserve becomes available, may impact the assessment of the recoverable amount of exploration, evaluation and development assets. If, after having capitalised the expenditure under policy 1(j), a judgement is made that recovery of the expenditure is unlikely, an impairment loss is recorded in accordance with accounting policy 1(o).
d) Principles of Consolidation
Subsidiaries
Subsidiaries are entities controlled by the Group. The consolidated financial statements of the Group include the financial statements of the Company, being the parent entity, and its wholly owned subsidiaries, from the date that control commences until the date control ceases:
• DSO Development Pty Ltd • Flinders Pastoral Pty Ltd • Lachlan Metals Pty Ltd • Kimba Gap Iron Project Pty Ltd • Port Spencer Holdings Pty Ltd • South Australia Iron Ore Group Pty Ltd • Sturt Pastoral Pty Ltd • Centrex Potash Pty Ltd
For
per
sona
l use
onl
y

2016 Annual Report - Page | 35
In addition, the company holds a 50% interest in Port Spencer Pty Ltd which manages the port joint arrangement.
e) Joint Arrangements
Joint arrangements are those entities over whose activities the consolidated entity has joint control, established by contractual agreement.
Jointly controlled operations and assets
The interest of the consolidated entity in jointly controlled operations and jointly controlled assets are brought to account by recognising in its financial statements the assets it controls and the liabilities that it incurs, and the expenses it incurs and its share of income that it earns from the sale of goods or services produced by the joint arrangement. To the extent that the Company is being “free-carried” in the jointly controlled assets it will not reflect a share of such expenditure.
The balances and effects of transactions between controlled entities included in the consolidated financial statements have been eliminated.
f) Revenue Recognition
Revenue and expenses are brought to account on an accrual basis.
Interest income
Interest income is recognised as it accrues and is included in finance income.
Lease income
The Group receives lease income from the properties which it has purchased. The properties were purchased for the purpose of evaluating the potential recoverability of resources. This income is recognised as it accrues.
Gain or loss on disposal of interest in mineral tenements
The Group recognises a gain or loss on disposal of interest in mineral tenements as the difference between the carrying amount of the asset at the time of the disposal and the proceeds of disposal, less any direct costs. This income is recognised when the risks and rewards of ownership have passed to the buyer.
g) Government Grants
Grants that compensate the Group for exploration and evaluation expenditure incurred are offset against the exploration and evaluation capitalised asset in the same period in which the capitalised expenditure is recognised.
h) Cash and Cash Equivalents and term deposits
(i) Cash and cash equivalents comprise cash balances and call deposits which can be readily accessed and have maturities of 90 days or less.
(ii) Term deposits comprise cash deposits with maturities of more than 90 days.
i) Income Tax
Income tax expense comprises current and deferred tax. Income tax is recognised in profit or loss except to the extent that it relates to items recognised directly in equity, in which case it is recognised in equity.
Current tax is the expected tax payable on the taxable income for the year, using tax rates enacted or substantively enacted at the balance sheet date, and any adjustment to tax payable in respect of previous years.
Deferred tax is recognised using the balance sheet liability method, providing for temporary differences between the carrying amounts of assets and liabilities for financial reporting purposes and the amounts used for taxation purposes. The following temporary differences are not provided for: recognition of assets or liabilities that affect neither accounting nor taxable profit, and differences relating to investments in subsidiaries to the extent that they will probably not reverse in the foreseeable future. The amount of deferred tax provided is based on the expected manner of realisation or settlement of the carrying amount of assets and liabilities, using tax rates enacted or substantively enacted at the balance sheet date.
Deferred tax assets and liabilities are offset if there is a legally enforceable right to offset current tax liabilities and assets, and they relate to taxes levied by the same tax authority on the same taxable entity, or on different tax entities, but they intend to settle current tax liabilities and assets on a net basis or their tax assets and liabilities will be realised simultaneously.
A deferred tax asset is recognised only to the extent that it is probable that future taxable profits will be available against which the asset can be utilised. Deferred tax assets are reduced to the extent that it is no longer probable that the related tax benefit will be realised. Determination of future taxable profits requires estimates and assumptions as to future events and circumstances, in particular, whether successful development and commercial exploitation, or alternatively sale, of the respective area of interest will be achieved. This includes estimates and judgements about commodity prices, ore reserves, exchange rates, future capital requirements, future operational performance and the timing of estimated cash flows. Changes in these estimates and assumptions could impact on the amount and probability of estimated
For
per
sona
l use
onl
y
Notes to the Consolidated Financial Statements (continued)
Page | 36 – 2016 Annual Report
taxable profits and accordingly the recoverability of deferred tax assets.
The company and its wholly owned Australian resident subsidiaries commenced being a tax consolidation group on 27th January 2005 and are therefore taxed as a single entity. The head entity within the tax consolidation group is Centrex Metals Limited.
j) Exploration, Evaluation and Development
Expenditure
Exploration for and evaluation of mineral resources is the search for mineral resources after the entity has obtained legal rights to explore in a specific area, as well as the determination of the technical feasibility and commercial viability of extracting the mineral resource. Accordingly, exploration and evaluation expenditures are those expenditures incurred by the Group in connection with the exploration for and evaluation of mineral resources before the technical feasibility and commercial viability of extracting mineral resources are demonstrable.
Costs associated with exploration, evaluation and development expenditure will be accumulated in respect of each separate ‘area of interest’. An ‘area of interest’ is an individual geological area which is considered to constitute a favourable environment for the presence of a mineral deposit or has been proved to contain such a deposit.
Expenditure incurred on activities that precede exploration and evaluation of mineral resources, including all expenditure incurred prior to securing legal rights to explore an area, is expensed as incurred. For each area of interest the expenditure is recognised as an exploration and evaluation asset where the following conditions are satisfied:
(a) The rights to tenure of the area are current; and
(b) At least one of the following conditions is also met:
i. The expenditure is expected to be recouped through successful development and commercial exploitation of an area of interest, or alternatively by its sale; or
ii. Exploration and evaluation activities in the area of interest have not, at reporting date, reached a stage which permits a reasonable assessment of the existence or otherwise of ‘economically recoverable reserves’ and active and significant operations in, or in relation to, the area of interest are continuing. Economically recoverable reserves are the estimated quantity of product in an area of interest that can be expected to be profitably extracted, processed
and sold under current and foreseeable conditions.
Exploration and evaluation assets include:
• Acquisition of rights to explore;
• Topographical, geological, geochemical and geophysical studies;
• Exploratory drilling, trenching, and sampling; and
• Activities in relation to evaluating the technical feasibility and commercial viability of extracting the mineral resource.
General and administrative costs are allocated to, and included in, the cost of exploration and evaluation assets only to the extent that those costs can be related directly to the operational activities in the area of interest to which the exploration and evaluation assets relate. In all other instances, these costs are expensed as incurred.
Exploration and evaluation assets are classified as tangible or intangible according to the nature of the assets. Assets that are classified as tangible include: piping and pumps; and, vehicles and drilling equipment. Assets that are intangible include: acquired rights to explore and exploratory drilling costs.
Exploration and evaluation assets are transferred to Development Assets once technical feasibility and commercial viability of an area of interest is demonstrable. Exploration and evaluation assets are assessed for impairment, and any impairment loss is recognised, prior to being reclassified.
Exploration and evaluation assets are assessed for impairment annually if (i) sufficient data exists to determine technical feasibility and commercial viability, and (ii) facts and circumstances suggest that the carrying amount exceeds the recoverable amount (see impairment accounting policy (o)). For the purposes of impairment testing, exploration and evaluation assets are allocated to cash-generating units to which the exploration activity relates. The cash generating unit shall not be larger than the area of interest.
k) Provisions
A provision is recognised in the consolidated statement of financial position when the Group has a present legal or constructive obligation that can be measured reliably as a result of a past event, and it is probable that an outflow of economic benefits will be required to settle the obligation. Provisions are determined by discounting the expected future cash flows at a pre-tax rate that reflects current market assessments of the time value of money and, where appropriate, the risks specific to the liability.
For
per
sona
l use
onl
y

2016 Annual Report - Page | 37
l) Provision for Restoration and Rehabilitation
No provision has been made in the accounts for restoration and rehabilitation of areas from which natural resources are extracted on the basis that no significant disturbance in relation to the Group’s exploration activities has occurred. This policy is subject to annual review.
m) Property, Plant and Equipment
Property, plant and equipment is brought to account at cost, less where applicable any accumulated depreciation and impairment losses. The carrying amount of property, plant and equipment is reviewed annually by the Directors to ensure it is not in excess of the recoverable amount of those assets (refer Note 1(o)).
The gain or loss on disposal of fixed assets is determined as the difference between the carrying amount of the asset at the time of disposal and the proceeds of disposal, and is included in operating profit before income tax in the year of disposal.
The depreciable amount of all fixed assets is depreciated over their useful lives commencing from the date the assets are held ready for use.
n) Depreciation
With the exception of exploration, evaluation and development assets, depreciation is charged to profit or loss on a straight-line basis over the estimated useful lives of each part of an item of plant and equipment. Following the re-classification of Exploration and evaluation assets as development assets, they are depreciated on a unit of production basis over the life of the economically recoverable reserves, once production commences.
Land is not depreciated.
The estimated useful lives of plant and equipment in the current and comparative periods are as follows:
Motor vehicles 3-5 years
Fixtures and fittings 3-5 years
Other plant and equipment 3-5 years
Buildings 50 years
o) Impairment
The carrying amounts of the Group’s non-financial assets are reviewed at each balance sheet date to determine whether there is any indication of impairment. If any such indication exists, the asset’s recoverable amount is estimated.
An impairment loss is recognised whenever the carrying amount of an asset or its cash-generating unit exceeds its recoverable amount. Impairment losses are charged to profit or loss, unless an asset has previously been revalued, in which case the impairment loss is recognised as a reversal to the extent of that previous revaluation with any excess recognised through profit or loss.
Impairment losses recognised in respect of cash-generating units are allocated first to reduce the carrying amount of any goodwill allocated to cash-generating units (group of units) and then, to reduce the carrying amount of the other assets in the unit (group of units) on a pro rata basis.
The recoverable amount of other assets is the greater of their fair value less costs to sell and value in use. In assessing value in use, the estimated future cash flows are discounted to their present value using a pre-tax discount rate that reflects current market assessments of the time value of money and the risks specific to the asset. For an asset that does not generate largely independent cash inflows, the recoverable amount is determined for the cash-generating unit to which the asset belongs.
Impairment losses are reversed when there is an indication that the impairment loss may no longer exist and there has been a change in the estimate used to determine the recoverable amount. An impairment loss is reversed only to the extent that the asset’s carrying amount does not exceed the carrying amount that would have been determined, net of depreciation or amortisation, if no impairment loss had been recognised.
p) Leased Assets
Leases of plant and equipment are classified as operating leases where the lessor retains substantially all the risks and benefits of ownership. Minimum lease payments are charged to profit or loss on a straight line basis over the lease terms except where an alternative basis would be more representative of the pattern of benefit to be derived for the leased asset.
q) Goods and Services Tax
Revenues, expenses and assets are recognised net of the amount of goods and services tax (GST), except where the amount of GST incurred is not recoverable from the taxation authority. In these circumstances, the GST is recognised as part of the cost of acquisition of the asset or as part of the expense.
Receivables and payables are stated with the amount of GST included. The net amount of GST recoverable from, or payable to the ATO, is included as a current asset or
For
per
sona
l use
onl
y
Notes to the Consolidated Financial Statements (continued)
Page | 38 – 2016 Annual Report
liability in the consolidated statement of financial position.
Cash flows are presented in the cash flow statement on a gross basis. The GST component of cash flows arising from investing and financing activities which are recoverable or payable to the ATO, are disclosed as operating cash flows.
r) Payables
Liabilities are recognised for amounts to be paid in the future for goods or services received. Trade accounts payable are normally settled within 60 days.
s) Interest Bearing Liabilities
Interest-bearing borrowings are recognised initially at fair value less attributable transaction costs. Subsequent to initial recognition, interest-bearing borrowings are stated at amortised cost with any difference between cost and redemption value being recognised in profit or loss over the period of the borrowings on an effective interest basis.
t) Share capital
Transaction costs of an equity transaction are accounted for as a deduction from equity, net of any related income tax benefit.
u) Employee benefits
Short-term employee benefits
Short-term employee benefits are expensed as the related service is provided. A liability is recognised for the amount expected to be paid if the Group has a present legal or constructive obligation to pay this amount as a result of past service provided by the employee and the obligation can be estimated reliably.
Long-term service benefits
The Group’s net obligation in respect of long-term service benefits, is the amount of future benefit that employees have earned in return for their service in the current and prior periods. The obligation is calculated using expected future increases in wage and salary rates including related on-costs and expected settlement dates, and is discounted using the rates attached to the corporate bonds at the balance sheet date which have maturity dates approximating to the terms of the Group’s obligations. Remeasurements are recognised in profit or loss in the period in which they arise.
Defined contribution superannuation funds
Obligations for contributions to defined contribution superannuation funds are recognised as an expense in the profit or loss as incurred.
Wages, salaries, annual leave and non-monetary benefits
Liabilities for employee benefits for wages, salaries, and annual leave that are expected to be settled within 12 months of the reporting date represent present obligations resulting from employees’ services provided to reporting date and are calculated at undiscounted amounts based on remuneration wage and salary rates that the Group expects to pay as at the reporting date including related on-costs, such as workers compensation insurance and payroll tax. Non-accumulating non-monetary benefits, such as housing and cars, are expensed based on the net marginal cost to the Group as the benefits are taken by the employees.
Termination benefits
Termination benefits are recognised as an expense when the Group is demonstrably committed, without realistic probability of withdrawal, to a formal detailed plan to either terminate employment before the normal retirement date, or to provide termination benefits as a result of an offer made to encourage voluntary redundancy. Termination benefits for voluntary redundancies are recognised as an expense if the Group has made an offer of voluntary redundancy, it is probable that the offer will be accepted, and the number of acceptances can be estimated reliably.
v) Share and option compensation
Where shares or share options are issued to employees or directors as remuneration for past services, the fair value of options granted is recognised as an employee expense with a corresponding increase in equity. The fair value is measured at grant date and recognised over the period during which the employees become unconditionally entitled to the options. Unless otherwise stated, the fair value of the options granted is measured using an option-pricing model, taking into account the terms and conditions upon which the options were granted. The amount recognised as an expense is adjusted to reflect the actual number of share options that vest except for those that fail to vest due to market conditions or non vesting conditions not being met.
The fair value of the employee share options and rights is measured using the Black-Scholes formula. Measurement inputs include the share price on measurement date, the exercise price of the instrument, expected volatility based on the Company’s historic volatility, particularly over the period commensurate with the expected term and the risk free interest rate. Service and non-market performance conditions attached to the transactions are not taken into account in determining fair value.
For
per
sona
l use
onl
y
2016 Annual Report - Page | 39
w) Segmental reporting
The Group determines and presents operating segments based on the information that internally is provided to the Chief Executive Officer, who is the Group’s chief operating decision maker.
The Chief Executive Officer receives information internally based on the geographical location of the Group’s assets. It has been determined that as all of the assets are in one country (Australia) and operations relate predominantly to mining exploration, it is appropriate to have one operating segment.
x) Earnings per share
The Group presents basic and diluted earnings per share (EPS) data for its ordinary shares. Basic EPS is calculated by dividing the profit or loss attributable to ordinary shares of the Company by the weighted average number of ordinary shares outstanding during the period. Diluted EPS is determined by adjusting the profit or loss attributable to ordinary shareholders and the weighted average number of ordinary shares outstanding for the effects of all dilutive potential ordinary shares, which comprise any convertible notes, share options, and rights granted to employees.
y) Research and development
Expenditure on research activities, undertaken with the prospect of gaining new scientific or technical knowledge and understanding, is recognised in profit or loss when incurred.
Development activities involve a plan or design for the production of new or substantially improved products and processes. Development expenditure is only capitalised if development costs can be measured reliably, the product or process is technically and commercially feasible, future economic benefits are probable, and the Group intends to and has sufficient resources to complete development and to use or sell the asset. The expenditure capitalised includes the cost of materials, direct labour and overhead costs that are directly attributable to preparing the asset for its intended use. Borrowing costs related to the development of qualifying assets are recognised in profit or loss as incurred. Other development expenditure is recognised in profit or loss as incurred.
Capitalised development expenditure is measured at cost less accumulated amortisation and accumulated impairment losses.
z) New standards and interpretations
In the current year, the Group has adopted all of the new and revised Standards and Interpretations issued by the Australian Accounting Standards Board that are
relevant to its operations and effective for the current annual reporting period.
The adoption of these new and revised Australian Accounting Standards and Interpretations has had no significant impact on the Group’s accounting policies or the amounts reported during the financial year.
At the date of authorisation of these financial statements, certain new standards, amendments and interpretations to existing standards have been published but are not yet effective, and have not been adopted early by the Group. Management anticipates that all of the relevant pronouncements will be adopted in the Group’s accounting policies for the first period beginning after the effective date of the pronouncement. Information on new standards, amendments and interpretations that are expected to be relevant to the Group’s financial statements is provided below.
Year ended 30th June 2017: Amendments to AASB 116 and AASB 138, Clarification of acceptable methods of depreciation and amortisation
This standard will clarify that revenue based methods to calculate depreciation and amortisation are not considered appropriate. The Group does not use any revenue based methods for depreciation or amortisation and as such no impact of the change is anticipated.
Year ended 30th June 2019: AASB 15: Revenue from Contracts with Customers
This standard will change the timing and in some cases the quantum of revenue recognised from customers. AASB 15 requires an entity to recognise revenue by identifying for each customer contract, the performance obligations in the contract and the transaction price. The transaction price is then allocated against the performance obligations in the contract with revenue recognised when (or as) the entity satisfies each performance obligation. Management has assessed the impact of the new standard and concluded that it does not have a material impact on the financial performance of the Group.
Year ended 30th June 2019: AASB9: Financial instruments
AASB 9, approved in December 2014, replaces the existing guidance in AASB 139 Financial Instruments: Recognition and Measurement. AASB 9 includes revised guidance on the classification and measurement of financial instruments, including a new expected credit loss model for calculating impairment on financial assets, and the new general hedge accounting requirements. It also carries forward the guidance on recognition and derecognition of financial instruments from AASB 139. AASB 9 is effective for annual reporting periods beginning on or after 1st January 2018, with early adoption permitted. Management has assessed
For
per
sona
l use
onl
y
Notes to the Consolidated Financial Statements (continued)
Page | 40 – 2016 Annual Report
the impact of the new standard and concluded that it does not have a material impact on the consolidated financial statements.
Year ended 30th June 2020: AASB16: Leases
AASB 16: Leases was approved in February 2016, and replaces AASB 117 Leases. AASB 16 no longer differentiates between operating and finance leases with regard to which type of lease is included in the statement of financial position. All leases (subject to some minimum thresholds) will now be included in the
statement of financial position. AASB 16 is effective for annual reporting periods beginning on or after 1st January 2019, with early adoption permitted. Management has assessed the potential impact of the revised standard and anticipates there being a small impact on the statement of financial position (albeit with one new asset line item and one new liability line item) and a negligible impact on the statement of financial performance.
2. PROFIT FROM CONTINUING OPERATIONS
2016 $
2015 $
Finance Income and Costs
Interest income on bank accounts 752,937 1,057,862
Interest income on restricted cash 46,872 40,943
799,809 1,098,805
Other income Lease income 60,211 118,016
Gain on asset sales 470,940 13,636
531,151 131,652
Employee Benefit Expenses
Wages and salaries (i) 406,064 655,415
Contributions to defined contribution superannuation funds 109,668 139,362
Employee liability movements (53,315) 31,008
Equity settled share based payment transactions 31,275 51,638
Other employee costs 122,624 196,253
616,316 1,073,676
(i) In addition, wages and salaries of $722,596 (2015: $728,574) are capitalised into exploration and evaluation expenditure (Note 8); wages and salaries of $ nil (2015: $3,704) are on-charged to joint venture arrangements for work undertaken in those joint arrangements.
3. AUDITOR’S REMUNERATION
2016 $
2015 $
Audit Services 49,750 62,500
Other services - taxation services 16,589 30,265
Auditor's of the company - KPMG 66,339 92,765
For
per
sona
l use
onl
y

2016 Annual Report - Page | 41
4. TAXATION
The consolidated entity is not recognising a deferred tax liability or a deferred tax asset in 2016 (2015: it did not recognise a deferred tax asset or deferred tax liability). Details of the current and deferred income tax expense is shown below:
2016 $
2015 $
Current income tax expense / (benefit)
Current period (174,067) 65,974
(174,067) 65,974
Deferred tax expense / (benefit) Origination and reversal of temporary differences - (4,852,128)
- (4,852,128)
Total income tax benefit (174,067) (4,786,154)
Deferred Tax assets Property, plant and equipment (295,468) (722,737)
Provisions and accrued expenses (250,440) (316,856)
Deferred Tax liabilities Exploration and evaluation assets 1,268,533 1,553,869
Interest receivable 54,356 43,239
Net tax liabilities 776,981 557,515
Tax losses recognised (776,981) (557,515)
Deferred tax liability - -
Reconciliation of effective tax rate Loss for the year (4,987,053) (14,821,127)
Total income tax benefit (174,067) (4,786,154)
Loss excluding income tax (5,161,120) (19,607,281)
Prima facie income tax benefit calculated at 30% (2015: 30%) (1,548,336) (5,882,184)
Non-deductible expenses 10,089 18,172
Tax incentives (Research & Development) (174,067) -
Tax losses not recognised 1,538,247 1,077,858
Total income tax benefit (174,067) (4,786,154)
Unrecognised tax losses at 30% (2015: 30%) 2,499,335 1,082,702 For
per
sona
l use
onl
y

Notes to the Consolidated Financial Statements (continued)
Page | 42 – 2016 Annual Report
5. EARNINGS PER SHARE
Basic earnings per share
The calculation of basic earnings per share at 30th June 2016 was based on the loss attributable to ordinary shareholders of $4,987,053 (2015: loss of $14,821,127) and a weighted average number of ordinary shares outstanding during the financial year ended 30th June 2016 of 315,341,392 (2015: 314,750,770).
2016 $
2015 $
Loss attributable to ordinary shareholders Loss for the period (4,987,053) (14,821,127) Loss attributable to ordinary shareholders (4,987,053) (14,821,127)
Weighted average number of ordinary shares Issued ordinary shares at beginning of year 314,784,304 314,064,304 Effect of shares issued in the first quarter (to 30th September) 557,088 686,466 Effect of shares issued in the second quarter (to 31st December) - - Effect of shares issued in the third quarter (to 31st March) - - Effect of shares issued in the fourth quarter (to 30th June) - - Weighted average number of ordinary shares at year end 315,341,392 314,750,770
Earnings per share for continuing and discontinued operations
Basic earnings – cents per share (1.58) (4.71) Diluted earnings – cents per share (1.58) (4.69)
Options on issue are considered to be potential shares and are therefore excluded from the weighted average number of ordinary shares used in the calculation of basic earnings per share. Where dilutive, potential ordinary shares are included in the calculation of dilutive earnings per share. For the year ended 30th June 2016 the weighted average number of ordinary shares outstanding during the financial year after adjustment for the effects of all dilutive potential ordinary shares was 315,701,033 (2015: 315,843,862).
6. CASH AND CASH EQUIVALENTS AND TERM DEPOSITS
2016 $
2015 $
Cash and cash equivalents 554,444 7,127,307 Restricted cash held in joint arrangements 1,160,189 1,458,436 1,714,633 8,585,743
The Company also has term deposits of $25,362,482 as at 30th June 2016 (2015: $19,587,926).
For
per
sona
l use
onl
y
2016 Annual Report - Page | 43
7. RECEIVABLES AND OTHER ASSETS
2016 $
2015 $
Current
Port Spencer joint arrangement (i) 6,916 61,913
Bungalow joint arrangement (ii) 3,900 4,299
Prepayments and other receivables 194,451 201,473
Research and development refund 174,067 -
Interest due on term deposits 181,187 144,130
GST Receivable 18,095 11,907
578,616 423,722
(i) The Company has a 50% interest in the Port Spencer Joint Venture. The balance owed by the Joint Venture relates principally to land lease rent for land owned 100% by the Company.
(ii) The Company has a 70% interest in the Bungalow Joint Venture. The balance owed by the joint arrangement relates principally to wages and salaries of Company employees that have been seconded to the Joint Venture.
8. EXPLORATION AND EVALUATION EXPENDITURE
Tenements
The exploration and evaluation expenditure assets comprise of exploration expenditure incurred since acquiring the exploration licenses. The expenditure is capitalised on a tenement by tenement (“area of interest”) basis.
The recoverability of the carrying amounts of exploration and evaluation assets is dependent on the successful development and commercial exploitation or sale of the respective area of interest. In light of the significant and sustained deterioration of the iron ore spot price since the first half of the 2015 calendar year the Company has chosen to impair all of its iron ore related tenements.
A summary of the total exploration expenditure written off is shown below:
2016 $
2015 $
Tenements relinquished - 912,748
Tenements impaired 3,741,723 15,123,730
Exploration expenditure written off 3,741,723 16,036,478
Farm-out arrangements
In the year ended 30th June 2014 the Company ceased being “free-carried” in the Eyre Iron JV and accordingly is recognising its share of the jointly controlled assets, liabilities and expenses. The other joint arrangement; relating to the Bungalow tenement (EL 4884) with Baotou Iron & Steel Group Company Limited (‘Baotou’) remains in the “free-carry” stage and accordingly to the extent that the Company is being “free-carried” in the joint controlled assets it will not reflect a share of such expenditure. The Company notes that it will cease its involvement in this joint arrangement from October 2016 by way of mutual agreement with Baotou.
In addition to the exploration “farm-in” joint arrangements detailed above, the Company signed a joint agreement for the Port Spencer port development on 9th March 2012.
For
per
sona
l use
onl
y

Notes to the Consolidated Financial Statements (continued)
Page | 44 – 2016 Annual Report
Cumulative Expenditure to
30th Jun 15
Expenditure 12 months to 30th
Jun 16
Tenements relinquished to
30th Jun 16
Tenements impaired to 30th Jun 16
Cumulative Expenditure to
30th Jun 16
$ $ $ $ $
Centrex Metals Limited
Greenpatch EL4885 W - 2,013 - (2,013) -
Bungalow/Minbrie EL4884 B - 12,840 - (12,840) -
Wilgerup EL5641 - 36,309 - (36,309) -
Wanilla EL5559 W - 1,769 - (1,769) -
Dutton Bay EL5712 W - 2,102 - (2,102) -
Cockabidnie North EL4539 - - - - -
- 55,033 - (55,033) -
South Australian Iron Ore Group Pty Ltd Mount Hill EL5065 W - 195,604 - (195,604) -
Carrow EL4998 W - 47,770 - (47,770) -
Kimba Gap EL5170 2,987,335 39,502 - (3,026,837) -
Stony Hill EL5617 - 7,894 - (7,894) -
2,987,335 290,770 - (3,278,105) -
Lachlan Metals Pty Ltd Goulburn (NSW) EL7388 1,382,080 359,434 - - 1,741,514
Archer (NSW) EL7503 187,731 14,921 - - 202,652
Woolgarlo (NSW) EL8215 309,352 99,233 - (408,585) -
1,879,163 473,588 - (408,585) 1,944,166
Centrex Potash Pty Ltd Oxley A E70/3777 483,502 274,526 - - 758,028
Oxley B E70/4004 483,502 185,328 - - 668,830
Oxley C E70/4318 483,502 667,375 - - 1,150,877
Oxley D E70/4319 483,502 169,642 - - 653,144
Oxley E E70/4320 483,502 166,753 - - 650,255
Oxley F E70/4378 483,502 170,122 - - 653,624
Oxley G E70/4729 8,372 162,623 - - 170,995
2,909,384 1,796,369 - - 4,705,753
Total 7,775,882 2,615,760 - (3,741,723) 6,649,919
(B) Baotou has earned a 30% interest in the iron ore rights of the Bungalow tenement (EL 4884) as a consequence of remitting $24 million into the joint venture bank account in three staged payments.
(W) WISCO has acquired a 60% interest in the iron ore rights to the 5 tenements identified above as a consequence of the execution of all documents included in the Eyre Iron Joint Venture (‘Eyre Iron JV’) which covers the same tenements.
For
per
sona
l use
onl
y

2016 Annual Report - Page | 45
9. LAND AND BUILDINGS, PLANT AND EQUIPMENT
2016 $
2015 $
Land and buildings
Balance at beginning of year 3,480,997 5,596,947
Additions 7,524 -
Depreciation charge for the year (90,789) (37,068)
Disposal of land (1,982,669) -
Impairment of land (i) (784,420) (2,078,882)
Balance at end of year 630,643 3,480,997
Plant and Equipment - Cost Balance at beginning of year 890,221 933,246
Additions 13,758 2,071
Disposals (166,594) (45,096)
Balance at end of year 737,385 890,221
Plant and Equipment - Depreciation Balance at beginning of year 844,149 838,363
Charge for the year 40,535 50,882
Disposals (166,594) (45,096)
Balance at end of year 718,090 844,149
Plant and Equipment - Net book value Balance at beginning of year 46,072 94,883
Additions/(Disposals) 13,758 2,071
Depreciation charge for the year (40,535) (50,882)
Balance at end of year 19,295 46,072
(i) As a result of the impairment associated with the iron ore exploration tenements (refer to Note 8: Exploration and Evaluation Expenditure) the carrying value of land associated with the iron ore projects has been impaired to its estimated recoverable amount.
10. TRADE AND OTHER PAYABLES
2016 $
2015 $
Current liabilities
Trade payables 49,846 62,452
Other trade payables and accruals 276,455 199,510
326,301 261,962
No interest is payable on trade payables.For
per
sona
l use
onl
y
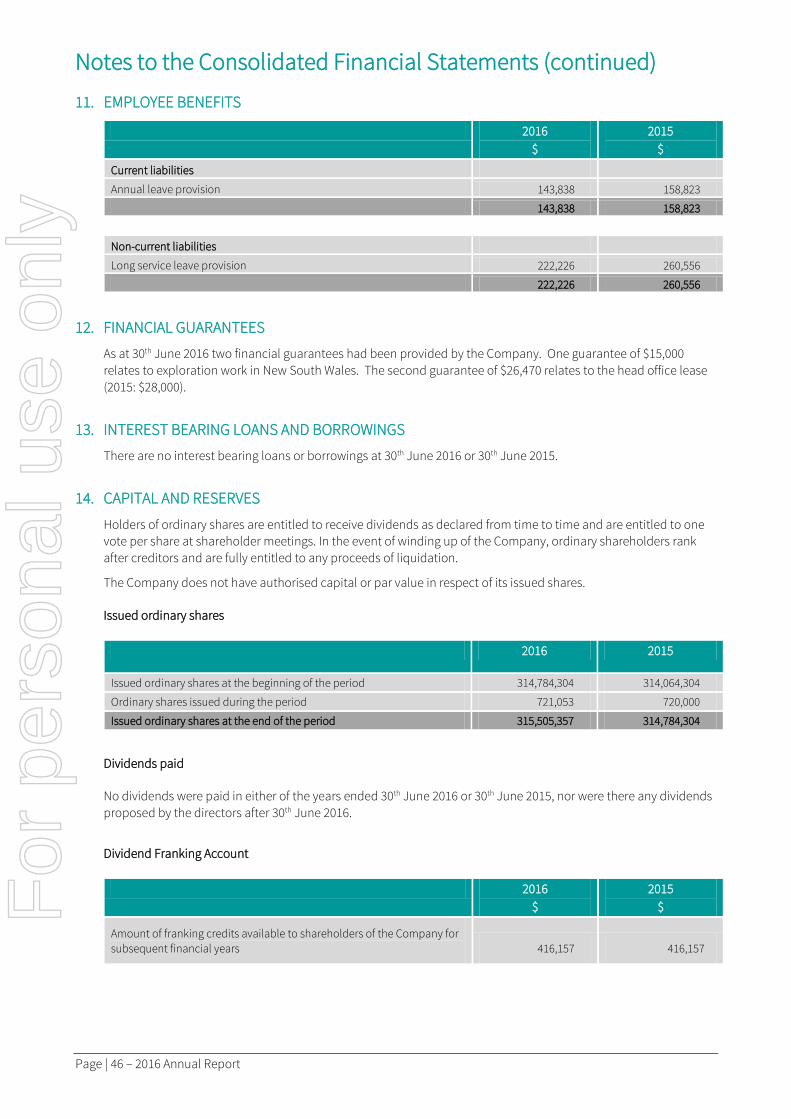
Notes to the Consolidated Financial Statements (continued)
Page | 46 – 2016 Annual Report
11. EMPLOYEE BENEFITS
2016 $
2015 $
Current liabilities
Annual leave provision 143,838 158,823
143,838 158,823
Non-current liabilities Long service leave provision 222,226 260,556
222,226 260,556
12. FINANCIAL GUARANTEES
As at 30th June 2016 two financial guarantees had been provided by the Company. One guarantee of $15,000 relates to exploration work in New South Wales. The second guarantee of $26,470 relates to the head office lease (2015: $28,000).
13. INTEREST BEARING LOANS AND BORROWINGS
There are no interest bearing loans or borrowings at 30th June 2016 or 30th June 2015.
14. CAPITAL AND RESERVES
Holders of ordinary shares are entitled to receive dividends as declared from time to time and are entitled to one vote per share at shareholder meetings. In the event of winding up of the Company, ordinary shareholders rank after creditors and are fully entitled to any proceeds of liquidation.
The Company does not have authorised capital or par value in respect of its issued shares.
Issued ordinary shares
2016 2015
Issued ordinary shares at the beginning of the period 314,784,304 314,064,304
Ordinary shares issued during the period 721,053 720,000
Issued ordinary shares at the end of the period 315,505,357 314,784,304
Dividends paid
No dividends were paid in either of the years ended 30th June 2016 or 30th June 2015, nor were there any dividends proposed by the directors after 30th June 2016.
Dividend Franking Account
2016 $
2015 $
Amount of franking credits available to shareholders of the Company for subsequent financial years 416,157 416,157
For
per
sona
l use
onl
y
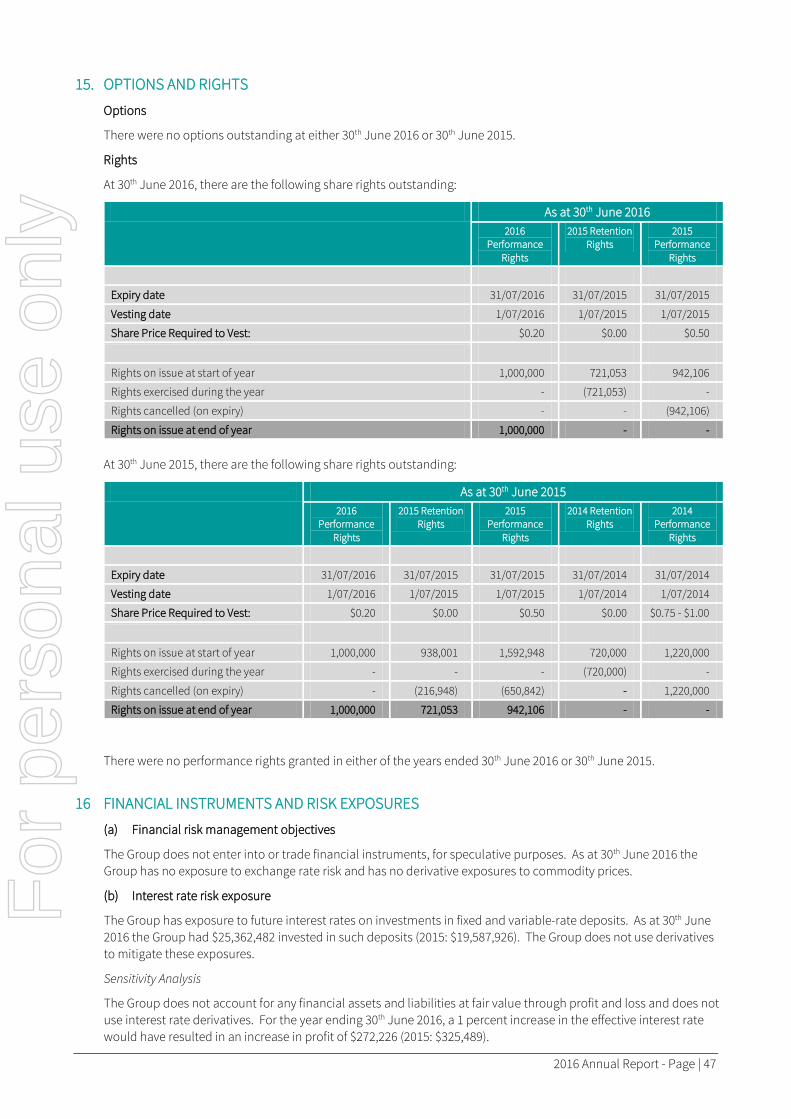
2016 Annual Report - Page | 47
15. OPTIONS AND RIGHTS
Options
There were no options outstanding at either 30th June 2016 or 30th June 2015.
Rights
At 30th June 2016, there are the following share rights outstanding:
As at 30th June 2016 2016
Performance Rights
2015 Retention Rights
2015 Performance
Rights
Expiry date 31/07/2016 31/07/2015 31/07/2015
Vesting date 1/07/2016 1/07/2015 1/07/2015
Share Price Required to Vest: $0.20 $0.00 $0.50
Rights on issue at start of year 1,000,000 721,053 942,106
Rights exercised during the year - (721,053) -
Rights cancelled (on expiry) - - (942,106)
Rights on issue at end of year 1,000,000 - -
At 30th June 2015, there are the following share rights outstanding:
As at 30th June 2015 2016
Performance Rights
2015 Retention Rights
2015 Performance
Rights
2014 Retention Rights
2014 Performance
Rights
Expiry date 31/07/2016 31/07/2015 31/07/2015 31/07/2014 31/07/2014
Vesting date 1/07/2016 1/07/2015 1/07/2015 1/07/2014 1/07/2014
Share Price Required to Vest: $0.20 $0.00 $0.50 $0.00 $0.75 - $1.00
Rights on issue at start of year 1,000,000 938,001 1,592,948 720,000 1,220,000
Rights exercised during the year - - - (720,000) -
Rights cancelled (on expiry) - (216,948) (650,842) - 1,220,000
Rights on issue at end of year 1,000,000 721,053 942,106 - -
There were no performance rights granted in either of the years ended 30th June 2016 or 30th June 2015.
16 FINANCIAL INSTRUMENTS AND RISK EXPOSURES
(a) Financial risk management objectives
The Group does not enter into or trade financial instruments, for speculative purposes. As at 30th June 2016 the Group has no exposure to exchange rate risk and has no derivative exposures to commodity prices.
(b) Interest rate risk exposure
The Group has exposure to future interest rates on investments in fixed and variable-rate deposits. As at 30th June 2016 the Group had $25,362,482 invested in such deposits (2015: $19,587,926). The Group does not use derivatives to mitigate these exposures.
Sensitivity Analysis
The Group does not account for any financial assets and liabilities at fair value through profit and loss and does not use interest rate derivatives. For the year ending 30th June 2016, a 1 percent increase in the effective interest rate would have resulted in an increase in profit of $272,226 (2015: $325,489).
For
per
sona
l use
onl
y
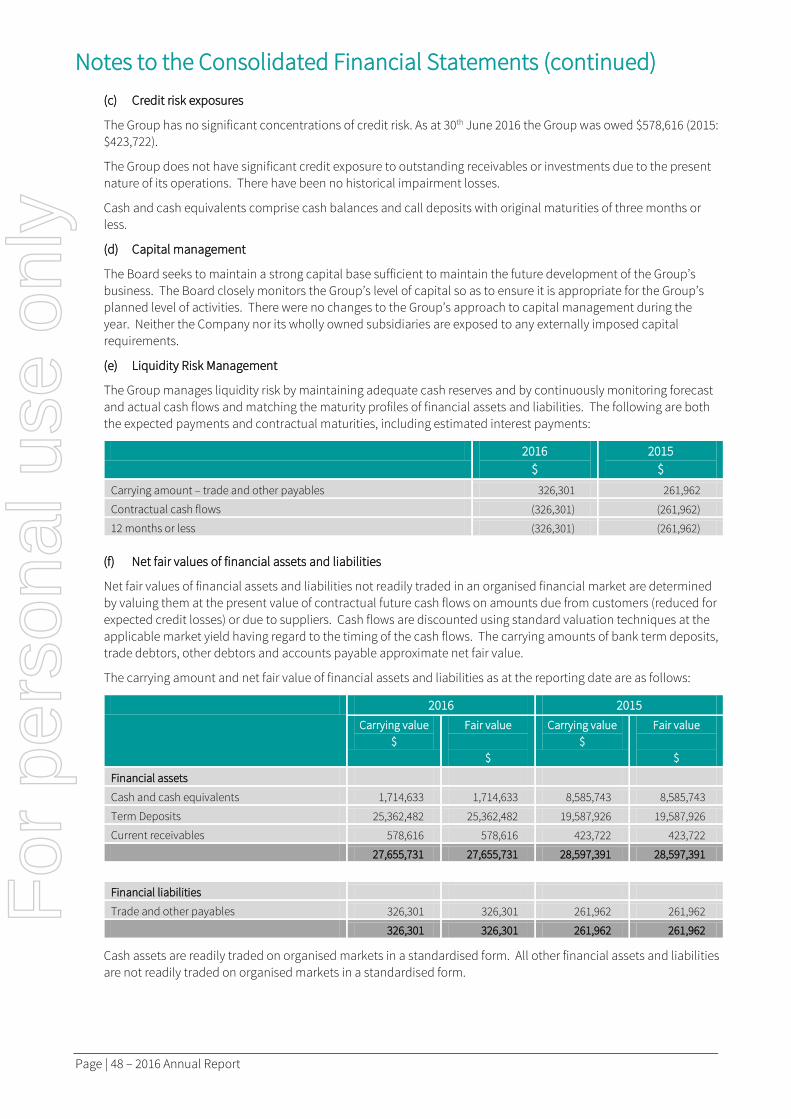
Notes to the Consolidated Financial Statements (continued)
Page | 48 – 2016 Annual Report
(c) Credit risk exposures
The Group has no significant concentrations of credit risk. As at 30th June 2016 the Group was owed $578,616 (2015: $423,722).
The Group does not have significant credit exposure to outstanding receivables or investments due to the present nature of its operations. There have been no historical impairment losses.
Cash and cash equivalents comprise cash balances and call deposits with original maturities of three months or less.
(d) Capital management
The Board seeks to maintain a strong capital base sufficient to maintain the future development of the Group’s business. The Board closely monitors the Group’s level of capital so as to ensure it is appropriate for the Group’s planned level of activities. There were no changes to the Group’s approach to capital management during the year. Neither the Company nor its wholly owned subsidiaries are exposed to any externally imposed capital requirements.
(e) Liquidity Risk Management
The Group manages liquidity risk by maintaining adequate cash reserves and by continuously monitoring forecast and actual cash flows and matching the maturity profiles of financial assets and liabilities. The following are both the expected payments and contractual maturities, including estimated interest payments:
2016 $
2015 $
Carrying amount – trade and other payables 326,301 261,962
Contractual cash flows (326,301) (261,962)
12 months or less (326,301) (261,962)
(f) Net fair values of financial assets and liabilities
Net fair values of financial assets and liabilities not readily traded in an organised financial market are determined by valuing them at the present value of contractual future cash flows on amounts due from customers (reduced for expected credit losses) or due to suppliers. Cash flows are discounted using standard valuation techniques at the applicable market yield having regard to the timing of the cash flows. The carrying amounts of bank term deposits, trade debtors, other debtors and accounts payable approximate net fair value.
The carrying amount and net fair value of financial assets and liabilities as at the reporting date are as follows:
2016 2015 Carrying value
$ Fair value
$
Carrying value $
Fair value
$
Financial assets
Cash and cash equivalents 1,714,633 1,714,633 8,585,743 8,585,743
Term Deposits 25,362,482 25,362,482 19,587,926 19,587,926
Current receivables 578,616 578,616 423,722 423,722
27,655,731 27,655,731 28,597,391 28,597,391
Financial liabilities
Trade and other payables 326,301 326,301 261,962 261,962
326,301 326,301 261,962 261,962
Cash assets are readily traded on organised markets in a standardised form. All other financial assets and liabilities are not readily traded on organised markets in a standardised form.
For
per
sona
l use
onl
y
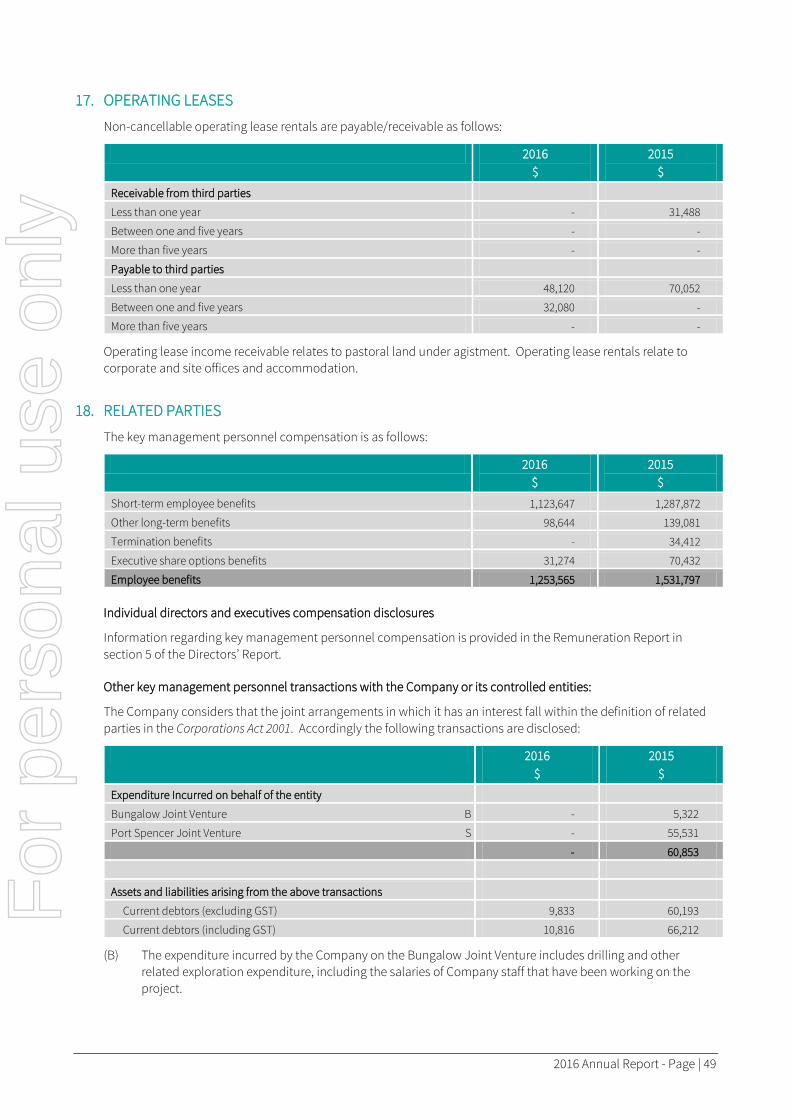
2016 Annual Report - Page | 49
17. OPERATING LEASES
Non-cancellable operating lease rentals are payable/receivable as follows:
2016 $
2015 $
Receivable from third parties
Less than one year - 31,488
Between one and five years - -
More than five years - -
Payable to third parties Less than one year 48,120 70,052
Between one and five years 32,080 -
More than five years - -
Operating lease income receivable relates to pastoral land under agistment. Operating lease rentals relate to corporate and site offices and accommodation.
18. RELATED PARTIES
The key management personnel compensation is as follows:
2016 $
2015 $
Short-term employee benefits 1,123,647 1,287,872
Other long-term benefits 98,644 139,081
Termination benefits - 34,412
Executive share options benefits 31,274 70,432
Employee benefits 1,253,565 1,531,797
Individual directors and executives compensation disclosures
Information regarding key management personnel compensation is provided in the Remuneration Report in section 5 of the Directors’ Report.
Other key management personnel transactions with the Company or its controlled entities:
The Company considers that the joint arrangements in which it has an interest fall within the definition of related parties in the Corporations Act 2001. Accordingly the following transactions are disclosed:
2016 $
2015 $
Expenditure Incurred on behalf of the entity
Bungalow Joint Venture B - 5,322
Port Spencer Joint Venture S - 55,531
- 60,853
Assets and liabilities arising from the above transactions Current debtors (excluding GST) 9,833 60,193
Current debtors (including GST) 10,816 66,212
(B) The expenditure incurred by the Company on the Bungalow Joint Venture includes drilling and other related exploration expenditure, including the salaries of Company staff that have been working on the project.
For
per
sona
l use
onl
y
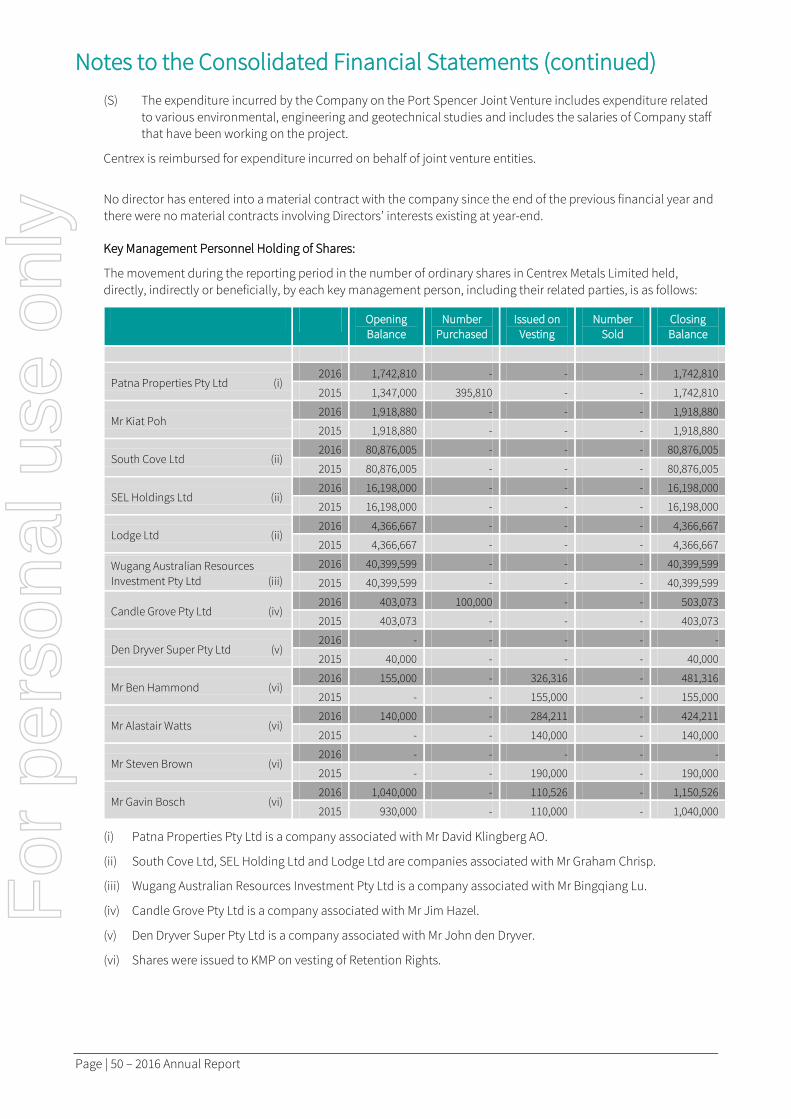
Notes to the Consolidated Financial Statements (continued)
Page | 50 – 2016 Annual Report
(S) The expenditure incurred by the Company on the Port Spencer Joint Venture includes expenditure related to various environmental, engineering and geotechnical studies and includes the salaries of Company staff that have been working on the project.
Centrex is reimbursed for expenditure incurred on behalf of joint venture entities.
No director has entered into a material contract with the company since the end of the previous financial year and there were no material contracts involving Directors’ interests existing at year-end.
Key Management Personnel Holding of Shares:
The movement during the reporting period in the number of ordinary shares in Centrex Metals Limited held, directly, indirectly or beneficially, by each key management person, including their related parties, is as follows:
Opening Balance
Number Purchased
Issued on Vesting
Number Sold
Closing Balance
Patna Properties Pty Ltd (i) 2016 1,742,810 - - - 1,742,810
2015 1,347,000 395,810 - - 1,742,810
Mr Kiat Poh 2016 1,918,880 - - - 1,918,880
2015 1,918,880 - - - 1,918,880
South Cove Ltd (ii) 2016 80,876,005 - - - 80,876,005
2015 80,876,005 - - - 80,876,005
SEL Holdings Ltd (ii) 2016 16,198,000 - - - 16,198,000
2015 16,198,000 - - - 16,198,000
Lodge Ltd (ii) 2016 4,366,667 - - - 4,366,667
2015 4,366,667 - - - 4,366,667
Wugang Australian Resources Investment Pty Ltd (iii)
2016 40,399,599 - - - 40,399,599
2015 40,399,599 - - - 40,399,599
Candle Grove Pty Ltd (iv) 2016 403,073 100,000 - - 503,073
2015 403,073 - - - 403,073
Den Dryver Super Pty Ltd (v) 2016 - - - - -
2015 40,000 - - - 40,000
Mr Ben Hammond (vi) 2016 155,000 - 326,316 - 481,316
2015 - - 155,000 - 155,000
Mr Alastair Watts (vi) 2016 140,000 - 284,211 - 424,211
2015 - - 140,000 - 140,000
Mr Steven Brown (vi) 2016 - - - - -
2015 - - 190,000 - 190,000
Mr Gavin Bosch (vi) 2016 1,040,000 - 110,526 - 1,150,526
2015 930,000 - 110,000 - 1,040,000
(i) Patna Properties Pty Ltd is a company associated with Mr David Klingberg AO.
(ii) South Cove Ltd, SEL Holding Ltd and Lodge Ltd are companies associated with Mr Graham Chrisp.
(iii) Wugang Australian Resources Investment Pty Ltd is a company associated with Mr Bingqiang Lu.
(iv) Candle Grove Pty Ltd is a company associated with Mr Jim Hazel.
(v) Den Dryver Super Pty Ltd is a company associated with Mr John den Dryver.
(vi) Shares were issued to KMP on vesting of Retention Rights.
For
per
sona
l use
onl
y
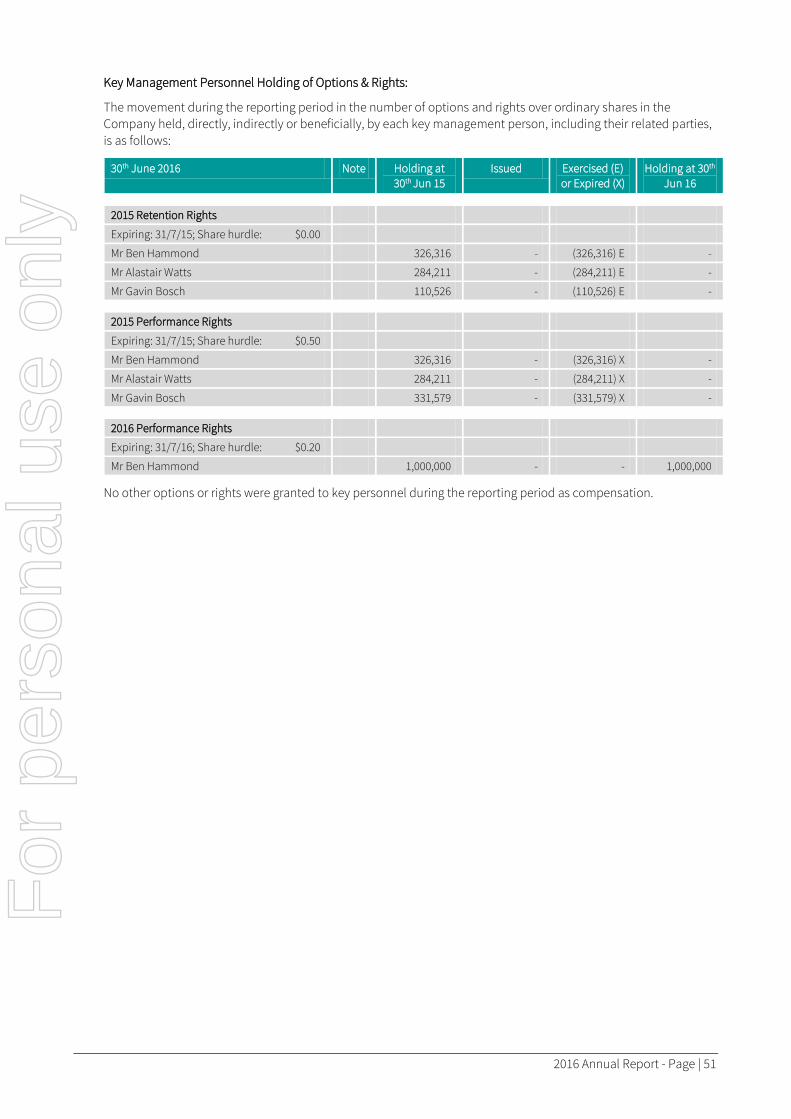
2016 Annual Report - Page | 51
Key Management Personnel Holding of Options & Rights:
The movement during the reporting period in the number of options and rights over ordinary shares in the Company held, directly, indirectly or beneficially, by each key management person, including their related parties, is as follows:
30th June 2016 Note Holding at 30th Jun 15
Issued Exercised (E) or Expired (X)
Holding at 30th Jun 16
2015 Retention Rights
Expiring: 31/7/15; Share hurdle: $0.00
Mr Ben Hammond 326,316 - (326,316) E -
Mr Alastair Watts 284,211 - (284,211) E -
Mr Gavin Bosch 110,526 - (110,526) E -
2015 Performance Rights
Expiring: 31/7/15; Share hurdle: $0.50
Mr Ben Hammond 326,316 - (326,316) X -
Mr Alastair Watts 284,211 - (284,211) X -
Mr Gavin Bosch 331,579 - (331,579) X -
2016 Performance Rights
Expiring: 31/7/16; Share hurdle: $0.20
Mr Ben Hammond 1,000,000 - - 1,000,000
No other options or rights were granted to key personnel during the reporting period as compensation.
For
per
sona
l use
onl
y
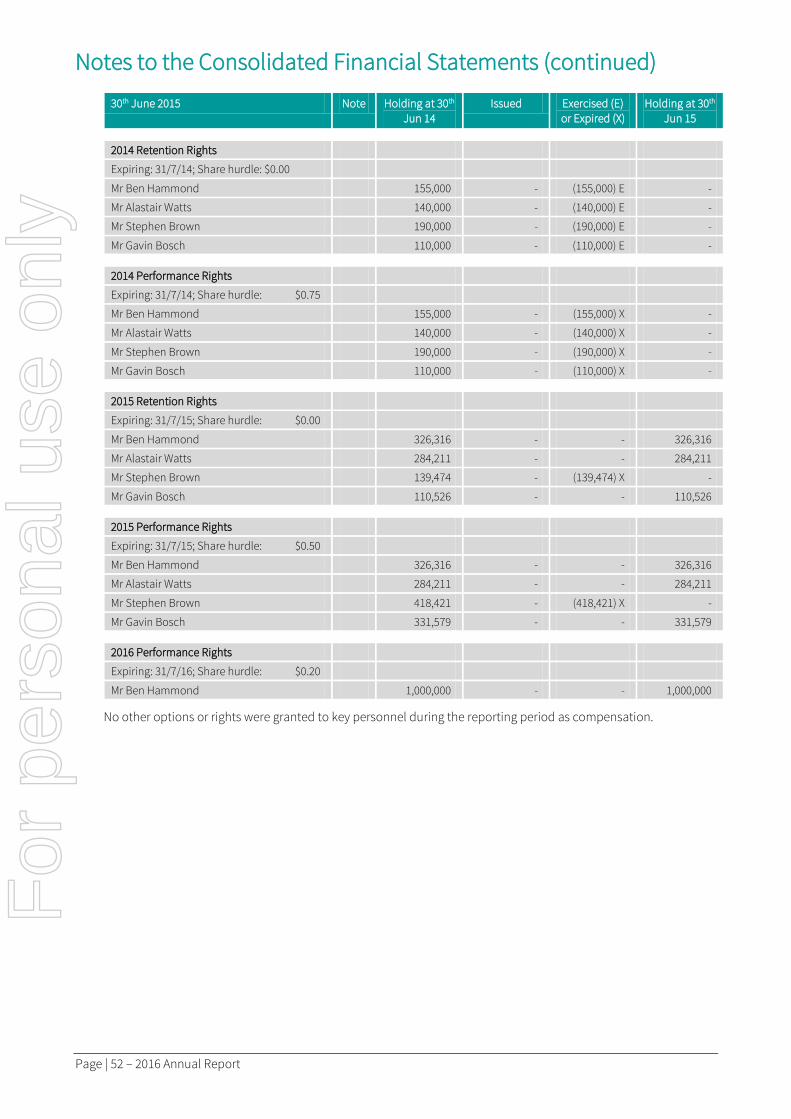
Notes to the Consolidated Financial Statements (continued)
Page | 52 – 2016 Annual Report
30th June 2015 Note Holding at 30th Jun 14
Issued Exercised (E) or Expired (X)
Holding at 30th Jun 15
2014 Retention Rights
Expiring: 31/7/14; Share hurdle: $0.00
Mr Ben Hammond 155,000 - (155,000) E -
Mr Alastair Watts 140,000 - (140,000) E -
Mr Stephen Brown 190,000 - (190,000) E -
Mr Gavin Bosch 110,000 - (110,000) E -
2014 Performance Rights
Expiring: 31/7/14; Share hurdle: $0.75
Mr Ben Hammond 155,000 - (155,000) X -
Mr Alastair Watts 140,000 - (140,000) X -
Mr Stephen Brown 190,000 - (190,000) X -
Mr Gavin Bosch 110,000 - (110,000) X -
2015 Retention Rights
Expiring: 31/7/15; Share hurdle: $0.00
Mr Ben Hammond 326,316 - - 326,316
Mr Alastair Watts 284,211 - - 284,211
Mr Stephen Brown 139,474 - (139,474) X -
Mr Gavin Bosch 110,526 - - 110,526
2015 Performance Rights
Expiring: 31/7/15; Share hurdle: $0.50
Mr Ben Hammond 326,316 - - 326,316
Mr Alastair Watts 284,211 - - 284,211
Mr Stephen Brown 418,421 - (418,421) X -
Mr Gavin Bosch 331,579 - - 331,579
2016 Performance Rights
Expiring: 31/7/16; Share hurdle: $0.20
Mr Ben Hammond 1,000,000 - - 1,000,000
No other options or rights were granted to key personnel during the reporting period as compensation.
For
per
sona
l use
onl
y
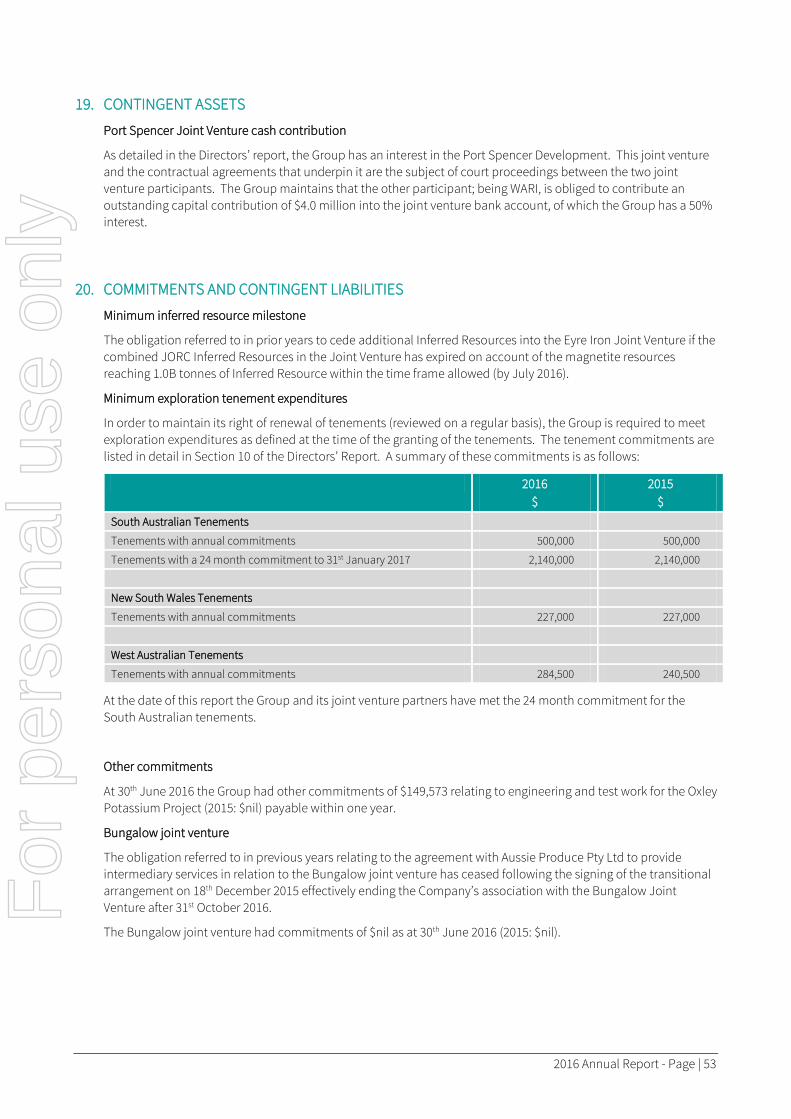
2016 Annual Report - Page | 53
19. CONTINGENT ASSETS
Port Spencer Joint Venture cash contribution
As detailed in the Directors’ report, the Group has an interest in the Port Spencer Development. This joint venture and the contractual agreements that underpin it are the subject of court proceedings between the two joint venture participants. The Group maintains that the other participant; being WARI, is obliged to contribute an outstanding capital contribution of $4.0 million into the joint venture bank account, of which the Group has a 50% interest.
20. COMMITMENTS AND CONTINGENT LIABILITIES
Minimum inferred resource milestone
The obligation referred to in prior years to cede additional Inferred Resources into the Eyre Iron Joint Venture if the combined JORC Inferred Resources in the Joint Venture has expired on account of the magnetite resources reaching 1.0B tonnes of Inferred Resource within the time frame allowed (by July 2016).
Minimum exploration tenement expenditures
In order to maintain its right of renewal of tenements (reviewed on a regular basis), the Group is required to meet exploration expenditures as defined at the time of the granting of the tenements. The tenement commitments are listed in detail in Section 10 of the Directors’ Report. A summary of these commitments is as follows:
2016 $
2015 $
South Australian Tenements
Tenements with annual commitments 500,000 500,000
Tenements with a 24 month commitment to 31st January 2017 2,140,000 2,140,000
New South Wales Tenements
Tenements with annual commitments 227,000 227,000
West Australian Tenements
Tenements with annual commitments 284,500 240,500
At the date of this report the Group and its joint venture partners have met the 24 month commitment for the South Australian tenements.
Other commitments
At 30th June 2016 the Group had other commitments of $149,573 relating to engineering and test work for the Oxley Potassium Project (2015: $nil) payable within one year.
Bungalow joint venture
The obligation referred to in previous years relating to the agreement with Aussie Produce Pty Ltd to provide intermediary services in relation to the Bungalow joint venture has ceased following the signing of the transitional arrangement on 18th December 2015 effectively ending the Company’s association with the Bungalow Joint Venture after 31st October 2016.
The Bungalow joint venture had commitments of $nil as at 30th June 2016 (2015: $nil).
For
per
sona
l use
onl
y
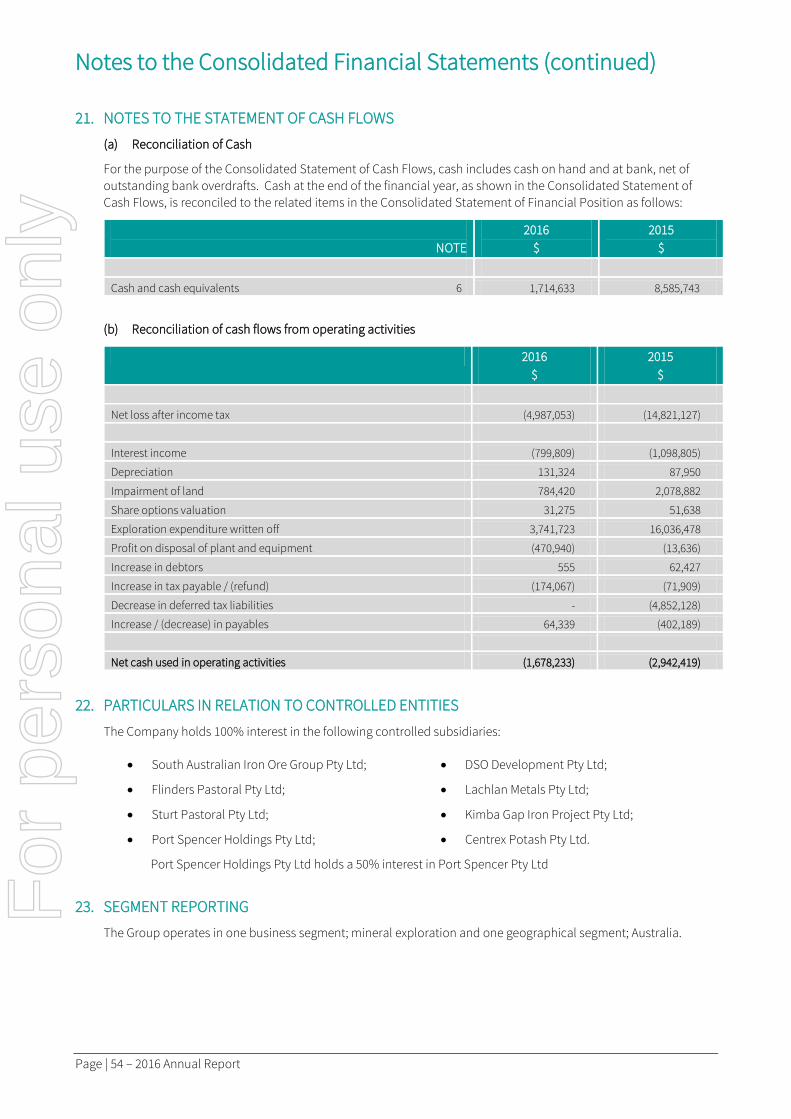
Notes to the Consolidated Financial Statements (continued)
Page | 54 – 2016 Annual Report
21. NOTES TO THE STATEMENT OF CASH FLOWS
(a) Reconciliation of Cash
For the purpose of the Consolidated Statement of Cash Flows, cash includes cash on hand and at bank, net of outstanding bank overdrafts. Cash at the end of the financial year, as shown in the Consolidated Statement of Cash Flows, is reconciled to the related items in the Consolidated Statement of Financial Position as follows:
NOTE
2016 $
2015 $
Cash and cash equivalents 6 1,714,633 8,585,743
(b) Reconciliation of cash flows from operating activities
2016 $
2015 $
Net loss after income tax (4,987,053) (14,821,127)
Interest income (799,809) (1,098,805)
Depreciation 131,324 87,950
Impairment of land 784,420 2,078,882
Share options valuation 31,275 51,638
Exploration expenditure written off 3,741,723 16,036,478
Profit on disposal of plant and equipment (470,940) (13,636)
Increase in debtors 555 62,427
Increase in tax payable / (refund) (174,067) (71,909)
Decrease in deferred tax liabilities - (4,852,128)
Increase / (decrease) in payables 64,339 (402,189)
Net cash used in operating activities (1,678,233) (2,942,419)
22. PARTICULARS IN RELATION TO CONTROLLED ENTITIES
The Company holds 100% interest in the following controlled subsidiaries:
• South Australian Iron Ore Group Pty Ltd; • DSO Development Pty Ltd;
• Flinders Pastoral Pty Ltd; • Lachlan Metals Pty Ltd;
• Sturt Pastoral Pty Ltd; • Kimba Gap Iron Project Pty Ltd;
• Port Spencer Holdings Pty Ltd; • Centrex Potash Pty Ltd.
Port Spencer Holdings Pty Ltd holds a 50% interest in Port Spencer Pty Ltd
23. SEGMENT REPORTING
The Group operates in one business segment; mineral exploration and one geographical segment; Australia.
For
per
sona
l use
onl
y

2016 Annual Report - Page | 55
24. PARENT ENTITY DISCLOSURES
As at, and throughout the year the parent company of the Group was Centrex Metals Limited.
Company
2016 $
2015 $
Result of the parent entity
Loss for the period (811,913) (12,500,530)
Other comprehensive income - -
Total comprehensive income for the period (811,913) (12,500,530)
Financial position of the parent entity
Current assets 27,655,731 28,597,391
Total assets 27,680,669 29,538,143
Current liabilities 13,628,537 14,667,043
Total liabilities 13,850,763 14,927,599
Net assets 13,829,906 14,610,544
Equity of the parent entity Contributed equity 41,330,328 41,330,328
Share options issues 2,377,177 2,345,902
Accumulated losses (29,877,599) (29,065,686)
Total equity 13,829,906 14,610,544
Commitments and contingent liabilities of the parent entity
The commitments and contingent liabilities of the parent entity are the same as those identified at note 20 with one exception. The Department of State Development (‘DSD”) agreed commitments for the South Australian tenements for the parent entity exclude the commitments made on behalf of the wholly owned South Australian Iron Ore Group Pty Ltd. These commitments are part of an amalgamated expenditure agreement undertaken with DSD which makes the separation of commitments between the two entities not practicable.
25. EVENTS SUBSEQUENT TO BALANCE DATE
There has not arisen in the interval between the end of the financial year and the date of this report any item, transaction or event of a material and unusual nature likely, in the opinion of the directors of the Company, to affect significantly the operations of the Group, the results of those operations, or the state of affairs of the Group, in future financial years.
For
per
sona
l use
onl
y
Page | 56 – 2016 Annual Report
Directors’ Declaration
In the opinion of the Directors of Centrex Metals Limited (‘the Company’):
1 (a) the consolidated financial statements and notes set out on pages 30 to 55, and the Remuneration report in the Directors' Report, are in accordance with the Corporations Act 2001, including:
(i) giving a true and fair view of the Group’s financial position as at 30th June 2016 and of its performance, for the financial year ended on that date; and
(ii) complying with Australian Accounting Standards (including the Australian Accounting Interpretations) and the Corporations Regulations 2001; and
(b) there are reasonable grounds to believe that the Company will be able to pay its debts as and when they become due and payable.
2 The Directors have been given the declarations by the Chief Executive Officer and Chief Financial Officer for the financial year ended 30th June 2016 pursuant to Section 295A of the Corporations Act 2001.
3 The Directors draw attention to Note 1(a) of the financial statements, which includes a statement of compliance with International Financial Reporting Standards.
Signed in accordance with a resolution of the Directors:
Mr David Klingberg AO
Dated at Adelaide this 20th day of September 2016
For
per
sona
l use
onl
y

For
per
sona
l use
onl
y

For
per
sona
l use
onl
y
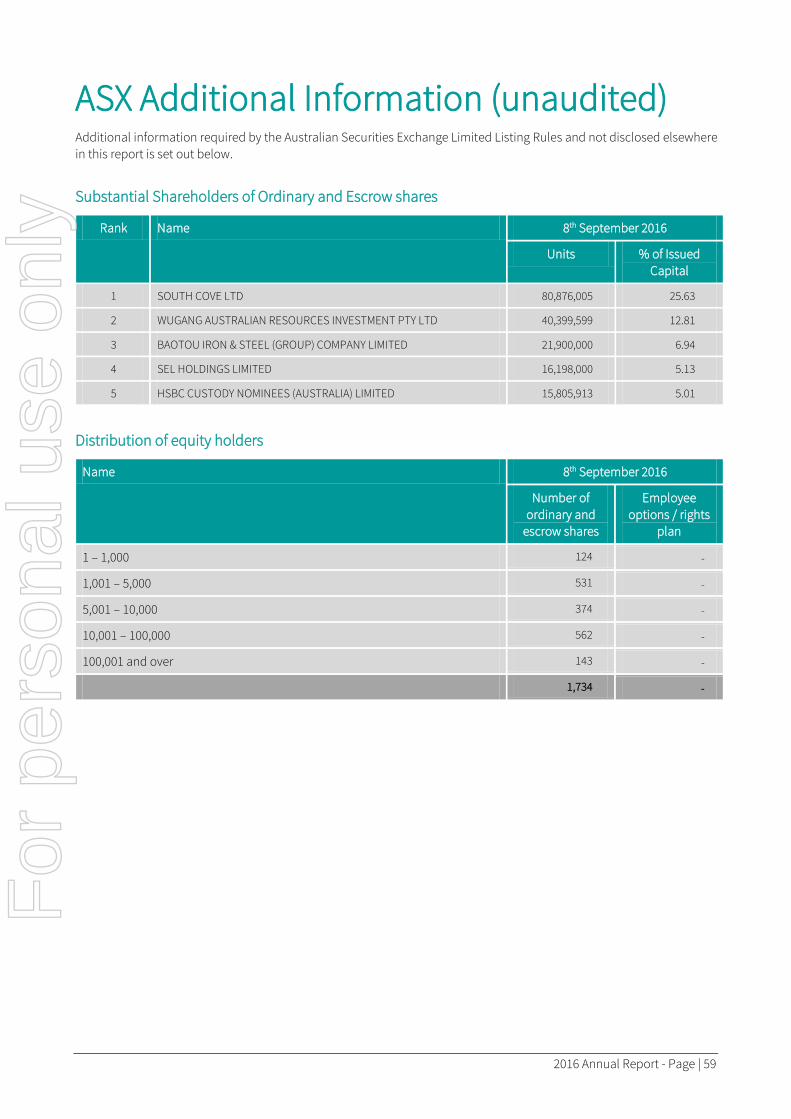
2016 Annual Report - Page | 59
ASX Additional Information (unaudited) Additional information required by the Australian Securities Exchange Limited Listing Rules and not disclosed elsewhere in this report is set out below.
Substantial Shareholders of Ordinary and Escrow shares
Rank Name 8th September 2016
Units % of Issued Capital
1 SOUTH COVE LTD 80,876,005 25.63
2 WUGANG AUSTRALIAN RESOURCES INVESTMENT PTY LTD 40,399,599 12.81
3 BAOTOU IRON & STEEL (GROUP) COMPANY LIMITED 21,900,000 6.94
4 SEL HOLDINGS LIMITED 16,198,000 5.13
5 HSBC CUSTODY NOMINEES (AUSTRALIA) LIMITED 15,805,913 5.01
Distribution of equity holders
Name 8th September 2016
Number of ordinary and
escrow shares
Employee options / rights
plan
1 – 1,000 124 -
1,001 – 5,000 531 -
5,001 – 10,000 374 -
10,001 – 100,000 562 -
100,001 and over 143 -
1,734 -
For
per
sona
l use
onl
y
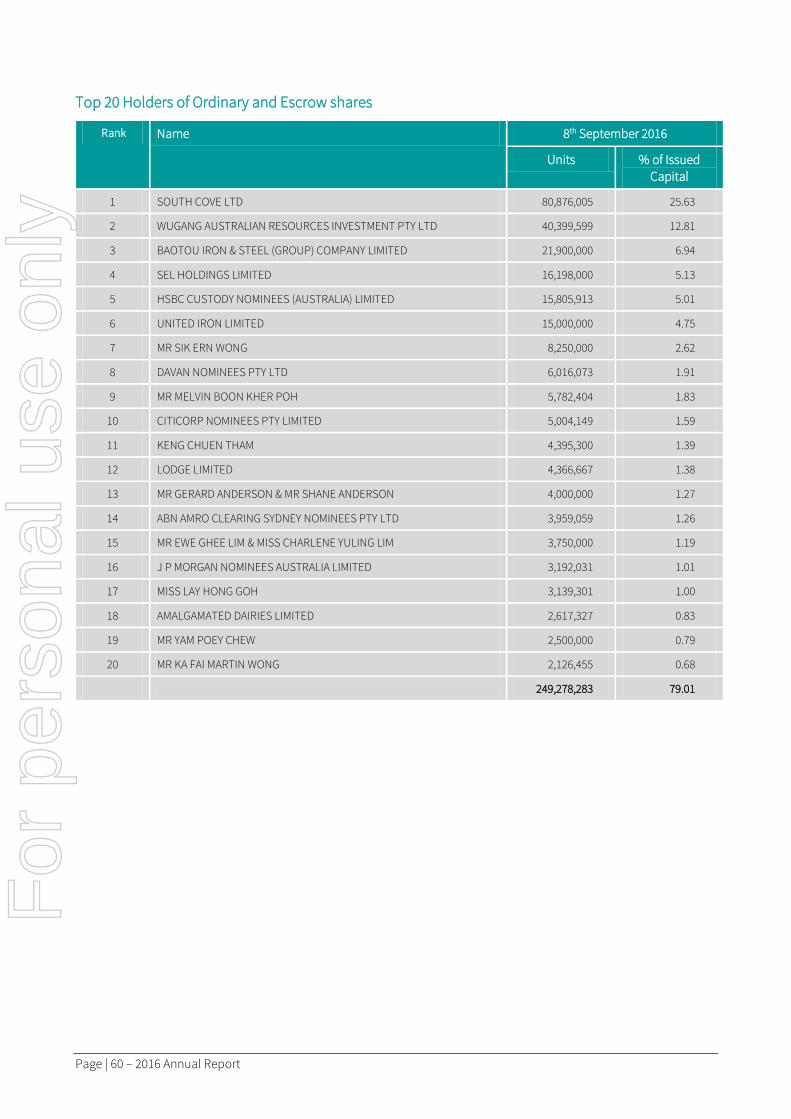
Page | 60 – 2016 Annual Report
Top 20 Holders of Ordinary and Escrow shares
Rank Name 8th September 2016
Units % of Issued Capital
1 SOUTH COVE LTD 80,876,005 25.63
2 WUGANG AUSTRALIAN RESOURCES INVESTMENT PTY LTD 40,399,599 12.81
3 BAOTOU IRON & STEEL (GROUP) COMPANY LIMITED 21,900,000 6.94
4 SEL HOLDINGS LIMITED 16,198,000 5.13
5 HSBC CUSTODY NOMINEES (AUSTRALIA) LIMITED 15,805,913 5.01
6 UNITED IRON LIMITED 15,000,000 4.75
7 MR SIK ERN WONG 8,250,000 2.62
8 DAVAN NOMINEES PTY LTD 6,016,073 1.91
9 MR MELVIN BOON KHER POH 5,782,404 1.83
10 CITICORP NOMINEES PTY LIMITED 5,004,149 1.59
11 KENG CHUEN THAM 4,395,300 1.39
12 LODGE LIMITED 4,366,667 1.38
13 MR GERARD ANDERSON & MR SHANE ANDERSON 4,000,000 1.27
14 ABN AMRO CLEARING SYDNEY NOMINEES PTY LTD 3,959,059 1.26
15 MR EWE GHEE LIM & MISS CHARLENE YULING LIM 3,750,000 1.19
16 J P MORGAN NOMINEES AUSTRALIA LIMITED 3,192,031 1.01
17 MISS LAY HONG GOH 3,139,301 1.00
18 AMALGAMATED DAIRIES LIMITED 2,617,327 0.83
19 MR YAM POEY CHEW 2,500,000 0.79
20 MR KA FAI MARTIN WONG 2,126,455 0.68
249,278,283 79.01
For
per
sona
l use
onl
y

2016 Annual Report - Page | 61
Company Directory
Company Secretaries
Gavin Mathew Bosch CPA
Principal Registered Office
Centrex Metals Limited
Level 6, 44 Waymouth Street
Adelaide SA 5000
08 8213 3100
08 8231 4014
www.centrexmetals.com.au
Locations of Share Registries
Boardroom Pty Limited
Level 7, 207 Kent Street
Sydney NSW 2000
GPO Box 3993
Sydney NSW 2001
Telephone: (02) 9290 9600
Fax: (02) 9279 0664
Email: [email protected]
Web: www.boardroomlimited.com.au
Australian Securities Exchange
The Company listed on the Australian Securities Exchange on 17 July 2006. The Home exchange is Adelaide.
ASX Codes
Shares: CXM
Auditors
KPMG
Chartered Accountants
151 Pirie Street
Adelaide SA 5000
For
per
sona
l use
onl
y
W W W . C E N T R E X M E T A L S . C O M . A U
For
per
sona
l use
onl
y


