
For personal use only riotinto.com. · The Independent Expert’s Report is set out in Part II...
252
Rio Tinto Limited (ABN 96 004 458 404) Proposed disposal of Coal & Allied Industries Limited to Yancoal Australia Limited and Notice of Rio Tinto Limited General Meeting Shareholder Helpline If you have any questions in relation to the Transaction, please contact the Rio Tinto Shareholder Helpline: • within Australia on 1800 813 292 (toll free); or • from outside Australia on +61 3 9415 4030, at any time between 8.30 a.m. to 5.30 p.m. (AEST) Monday to Friday, or visit the Rio Tinto website at riotinto.com. For personal use only
Transcript of For personal use only riotinto.com. · The Independent Expert’s Report is set out in Part II...

Rio Tinto Limited(ABN 96 004 458 404)
Proposed disposal of Coal & Allied Industries Limited
to
Yancoal Australia Limited
and
Notice of Rio Tinto Limited General Meeting
Shareholder Helpline
If you have any questions in relation to the Transaction, please contact the Rio Tinto Shareholder Helpline:
• within Australia on 1800 813 292 (toll free); or
• from outside Australia on +61 3 9415 4030,
at any time between 8.30 a.m. to 5.30 p.m. (AEST) Monday to Friday, or visit the Rio Tinto website atriotinto.com.
For
per
sona
l use
onl
y

[Page deliberately left blank]
For
per
sona
l use
onl
y
THIS DOCUMENT (COMPRISING AN EXPLANATORY MEMORANDUM AND NOTICE OFGENERAL MEETING) AND THE ACCOMPANYING PROXY FORM ARE IMPORTANT ANDREQUIRE YOUR IMMEDIATE ATTENTION. If you are in any doubt as to the action you should take,you are recommended to seek your own financial advice immediately from your stockbroker, bankmanager, solicitor, accountant or other independent professional adviser.
The release, publication or distribution of this document in certain jurisdictions other than Australia may berestricted by laws of those jurisdictions and therefore persons in such jurisdictions into which this document isreleased, published or distributed should inform themselves about and observe any such restrictions.
Rio Tinto Limited(ABN 96 004 458 404)
Proposed disposal of Coal & Allied Industries Limited
to
Yancoal Australia Limited
and
Notice of Rio Tinto Limited General Meeting
This document should be read as a whole. Your attention is drawn to the letter from the Chairman of RioTinto which is set out on pages 4 to 9 of this document and which contains the recommendation of theBoard that you vote in favour of the Transaction and the resolution to be proposed at the Rio TintoLimited General Meeting convened by the notice set out in this document. The Independent Expert hasconcluded that the terms of the Transaction are fair and reasonable for Rio Tinto Limited Shareholders.The Independent Expert’s Report is set out in Part II (Independent Expert’s Report) of this document.
Notice of the Rio Tinto Limited General Meeting, to be held at 11.00 a.m. (AEST) on 29 June 2017 is set out atthe end of this document. Rio Tinto Limited Shareholders will find enclosed with this document a Proxy Formfor use in connection with the Rio Tinto Limited General Meeting. To be valid, the Proxy Form should becompleted, signed and returned, with any power of attorney under which it is executed (or a duly certified copyof any such power), must be received by Rio Tinto Limited’s share registry at Computershare Investor ServicesPty Ltd, GPO Box 242, Melbourne, Victoria, 3067, or at Rio Tinto Limited’s registered office or by facsimile to1800 783 447 (within Australia) or +61 3 9473 2555 (outside Australia), by 11.00 a.m. (AEST) on Tuesday,27 June 2017.
Completion and return of a completed Proxy Form will not prevent you from attending and voting in person atthe Rio Tinto Limited General Meeting, or any adjournment thereof, if you so wish and are so entitled.
This document does not constitute or form part of any offer or invitation to purchase, otherwise acquire,subscribe for, sell, otherwise dispose of or issue, or any solicitation of any offer to sell, otherwise dispose of,issue, purchase, otherwise acquire or subscribe for, any security.
IMPORTANT INFORMATION
Rio Tinto Limited Shareholders should rely only on the information contained in this document. No person hasbeen authorised to give any information or to make any representations other than those contained in thisdocument in connection with the Transaction and, if given or made, such information or representations must notbe relied upon as having been authorised by or on behalf of Rio Tinto or the Directors.
For
per
sona
l use
onl
y

The contents of this document are not to be construed as legal, business, financial or tax advice. Each Rio TintoShareholder should consult his or her own lawyer, financial adviser or tax adviser for legal, financial or taxadvice in relation to the Transaction.
PRESENTATION OF INFORMATION
Unless otherwise indicated, financial information for Coal & Allied Industries in this document is presented inAustralian dollars and has been prepared in accordance with International Financial Reporting Standards asissued by the International Accounting Standards Board and interpretations issued from time to time by the IFRSInterpretations Committee which are mandatory as at 31 December 2016. Certain figures included in thisdocument have been subject to rounding adjustments.
DEFINITIONS
Some words and expressions used in this document have defined meanings, which are set out in Part IV(Definitions) of this document. A reference to time in this document is to Australian Eastern Standard Time(unless otherwise stated) for events occurring in Australia or to London time (unless otherwise stated) for eventsin the UK.
CAUTIONARY NOTE REGARDING FORWARD-LOOKING STATEMENTS
This document contains statements which constitute “forward-looking statements” about Rio Tinto. The words“intend”, “aim”, “project”, “anticipate”, “estimate”, “plan”, “believes”, “expects”, “may”, “should”, “will”, orsimilar expressions, commonly identify such forward-looking statements.
Examples of forward-looking statements in this document include, among others, statements regarding theproposed Transaction; the financial condition, results of operations or economic conditions affecting the businessof Rio Tinto; future implications of the Transaction; and management plans and objectives. Forward-lookingstatements involve known and unknown risks, uncertainties, assumptions and other factors set forth in thisdocument that are beyond Rio Tinto’s control.
In light of these risks, uncertainties and assumptions, actual results could be materially different from projectedfuture results expressed or implied by these forward-looking statements which speak only as at the date of thisdocument. Except as required by applicable regulations or by law, Rio Tinto does not undertake any obligation topublicly update or revise any forward-looking statements, whether as a result of new information or futureevents. Rio Tinto cannot guarantee that its forward-looking statements will not differ materially from actualresults.
The date of this document is 19 May 2017.
2
For
per
sona
l use
onl
y

TABLE OF CONTENTS
LETTER FROM THE CHAIRMAN OF RIO TINTO . . . . . . . . . . . . . . . . . . . . . . . . . . . . . . . . . . . . . . . . . . . 4
EXPECTED TIMETABLE OF PRINCIPAL EVENTS . . . . . . . . . . . . . . . . . . . . . . . . . . . . . . . . . . . . . . . . . . 10
PART I DETAILS OF THE TRANSACTION . . . . . . . . . . . . . . . . . . . . . . . . . . . . . . . . . . . . . . . . . . . . . . . . . 11
PART II INDEPENDENT EXPERT’S REPORT . . . . . . . . . . . . . . . . . . . . . . . . . . . . . . . . . . . . . . . . . . . . . . 16
PART III ADDITIONAL INFORMATION . . . . . . . . . . . . . . . . . . . . . . . . . . . . . . . . . . . . . . . . . . . . . . . . . . . 240
PART IV DEFINITIONS . . . . . . . . . . . . . . . . . . . . . . . . . . . . . . . . . . . . . . . . . . . . . . . . . . . . . . . . . . . . . . . . . 243
NOTICE OF GENERAL MEETING . . . . . . . . . . . . . . . . . . . . . . . . . . . . . . . . . . . . . . . . . . . . . . . . . . . . . . . . 246
3
For
per
sona
l use
onl
y
LETTER FROM THE CHAIRMAN OF RIO TINTO
Rio Tinto Limited(ABN 96 004 458 404)
Registered and Head Office:Level 33, 120 Collins StreetMelbourne 3000 VictoriaAustralia
19 May 2017
Dear Shareholder
Proposed disposal of Rio Tinto’s shareholding in Coal & Allied Industries to Yancoal
1 Introduction
On 24 January 2017, Rio Tinto announced that it had reached a binding agreement for the sale of its 100 percent. interest in the issued share capital of Coal & Allied Industries to Yancoal. Under the Transaction, thetotal purchase price payable by Yancoal amounts to US$2.45 billion, comprising:
• an initial payment of US$1.95 billion, payable at completion of the Transaction; and
• US$500 million in aggregate deferred cash payments, payable as annual instalments of US$100 millionover the five years following completion of the Transaction.
After the Transaction is completed, Rio Tinto will potentially also be entitled to royalties.
Subject to all approvals and other conditions precedent being satisfied, it is expected that the Transactionwill complete during the third quarter of 2017.
Under the ASX Listing Rules, the acquisition or disposal of a substantial asset by a listed company from orto a person in a position of influence requires the approval of the shareholders of the listed company. For thepurposes of the ASX Listing Rules, Coal & Allied Industries is considered to be a substantial asset ofRio Tinto and Yancoal is considered to be a person in a position of influence in relation to Rio Tinto, andthe Transaction is accordingly considered to be a transaction requiring the approval of Rio TintoShareholders.
Under the UK Listing Rules, a transaction (other than a transaction in the ordinary course of business)between a listed company and a related party requires the approval of the shareholders of the listedcompany. For the purposes of the UK Listing Rules, Yancoal is considered to be a related party of Rio Tintoand the Transaction is accordingly considered to be a related party transaction requiring the approval ofRio Tinto Shareholders.
Accordingly, the Rio Tinto Limited General Meeting has been convened for 11.00 a.m. (AEST) on 29 June2017 at the Grand Ballroom, The Westin Sydney, 1 Martin Place, Sydney, New South Wales and theRio Tinto plc General Meeting has been convened for 11.00 a.m. (London time) on 27 June 2017 at TheQueen Elizabeth II Conference Centre, Broad Sanctuary, Westminster, London, SW1P 3EE, UnitedKingdom. As a Rio Tinto Limited Shareholder, you will be asked to approve the Transaction at the RioTinto Limited General Meeting.
The Board considers the Transaction to be fair and reasonable as far as Rio Tinto Limited Shareholders areconcerned and in the best interests of Rio Tinto Shareholders as a whole. Accordingly, the Boardrecommends that you vote in favour of the Resolution as each member of the Board intends to do in respectof any Rio Tinto Shares over which he or she has voting control.
2 Background to and reasons for the Transaction
The divestment of Coal & Allied Industries is consistent with Rio Tinto’s strategy of continuouslyreviewing its asset portfolio and seeking attractive opportunities for the most effective re-allocation ofcapital to ensure Rio Tinto delivers superior returns for its shareholders. Rio Tinto has announced orcompleted at least US$7.7 billion of divestments since 2013. The Transaction represents the latestdivestment undertaken by Rio Tinto to ensure the most effective use of capital and delivery of returns forRio Tinto Shareholders.
4
For
per
sona
l use
onl
y

These recent divestments include the sale of Rio Tinto’s interests in the Clermont coal mine, the Bengallacoal mine and the Mount Pleasant coal project. In addition, prior to the sale of Rio Tinto’s interest in theBengalla coal mine and the Mount Pleasant coal project, a restructuring of the ownership of Coal & AlliedIndustries’ assets was completed in 2016 with the Mitsubishi Group (Rio Tinto’s joint venture partner)pursuant to which Rio Tinto agreed to assume 100 per cent. ownership of Coal & Allied Industries and theMitsubishi Group agreed to move from holding a 20 per cent. interest in Coal & Allied Industries to holdinga direct 32.4 per cent. interest in the Hunter Valley Joint Venture.
The Transaction represents the culmination of an extensive assessment of all strategic options for Coal &Allied Industries’ assets. Rio Tinto has conducted a comprehensive market testing and price discoveryprocess and has held extensive discussions with several potential acquirers of Coal & Allied Industries’assets. The Board of Rio Tinto believes that the terms of the Coal & Allied Industries sale, which have beenagreed with Yancoal, represent compelling value for Rio Tinto Shareholders.
Yancoal is listed on the ASX. Rio Tinto understands that Yancoal owns and operates a portfolio of nine coalmines, numerous projects under feasibility study, a suite of exploration assets and infrastructureshareholdings across NSW, Queensland and Western Australia.
3 Business description
Coal & Allied Industries is the holding company for Rio Tinto’s thermal coal business in the Hunter Valleyregion of NSW. Coal & Allied Industries owns and operates multiple, multi-seam open cut mines in theHunter Valley. It has a 67.6 per cent. interest in the Hunter Valley Operations mine, an 80 per cent. interestin the Mount Thorley mine, a 55.6 per cent. interest in the Warkworth mine, a 36.5 per cent. interest in PortWaratah Coal Services (which owns a coal export terminal located at the Port of Newcastle) and otherundeveloped coal assets, including various landholdings.
The Hunter Valley Operations, Mount Thorley and Warkworth mines together produced 25.9 million tonnesof saleable thermal and semi-soft coking coal in 2016 (17.1 million tonnes being Rio Tinto’s share). The netassets subject to the Transaction had earnings before tax of A$347.1 million in the year to 31 December2016, and a gross asset value attributable to them of A$1,964.2 million as at 31 December 2016.1
A summary of the recent financial performance of Coal & Allied Industries (as extracted from its auditedfinancial statements for the years ended 31 December 2014, 31 December 2015 and 31 December 2016)together with a summary of the financial position of Coal & Allied Industries for the years ended31 December 2015 and 31 December 2016 are set out in section 3.5 of the Independent Expert’s Report.
Recent geopolitical developments have led to volatility permeating across global markets and this volatilityis expected to remain an ongoing feature of seaborne coal markets. However, thermal coal is a cost-effectiveand abundant energy source that plays an important role in the global energy mix and its medium to longterm demand outlook remains sound even if pricing could be more volatile.
Last year saw significant changes in the supply and demand balance, driving spot prices for both thermaland metallurgical coal from low levels early in 2016 to favourable highs in the second half of the year. Thechanging market dynamics were primarily driven by changes in Chinese policy, curtailing supply throughthe implementation of restricted operating days for coal mines. This directive has since been relaxed,however uncertainties are likely to continue to affect coal markets in the short to medium term.
Even though market prices for both thermal and metallurgical coal remain firm, producers are wary of thepotential for rapid fluctuations in market conditions. Ongoing achievements by Coal & Allied Industries inreducing costs and improving productivity at its operations in the Hunter Valley have ensured they are wellpositioned to be resilient for changes in the macro-economic environment.
In the medium to long term, it is anticipated that strong energy demand in the developing economies,particularly China and India, combined with the rising costs and logistical constraints associated withdomestic production in these countries, will provide some support for seaborne thermal and metallurgicalcoal markets.
1 This financial information has been prepared under International Accounting Standards and Rio Tinto accounting policies, and reflectsthe financial results attributable to the net assets subject of the sale to Yancoal. The financial information given above reflects the resultsof a restructure to the Coal & Allied Industries group completed on 3 February 2016 in which Rio Tinto obtained 100 per cent.ownership of Coal & Allied Industries and a 67.6 per cent. interest in the Hunter Valley Operations joint venture. Earnings before tax andgross assets attributable to Coal & Allied Industries’ former ownership of the Mount Pleasant project and a 40 per cent. interest in theBengalla joint venture have been excluded.
5
For
per
sona
l use
onl
y
4 Key terms of the Transaction
Completion of the Transaction will deliver to Rio Tinto an initial cash payment of US$1.95 billion, payableat completion and US$500 million in aggregate deferred cash payments, payable as annual instalments ofUS$100 million over the five years following completion of the Transaction.
In addition, Rio Tinto will become entitled to a quarterly coal price linked royalty calculated as US$2 pertonne (subject to an annual Australian CPI adjustment over the term of the royalty) of attributable saleableproduction (excluding certain production) from subsidiaries of Coal & Allied Industries, for a period of10 years beginning on the third anniversary of completion. This royalty will be payable if the Newcastlebenchmark thermal coal price exceeds US$75 per tonne (subject to an annual Australian CPI adjustmentover the term of the royalty). The aggregate amount of royalties is subject to a US$650 million cap.
In addition to the cash consideration payable by Yancoal upon completion of the Transaction andRio Tinto’s future royalties entitlement:
• earnings and cash flow generated by Coal & Allied Industries until completion of the Transaction willcontinue for the benefit of Rio Tinto (with the exception of sales proceeds generated from the potentialsale of the Minmi landholdings in the Lower Hunter Valley. To the extent realised, any such salesproceeds would not be material in the context of Coal & Allied Industries or the Transaction);
• Yancoal will assume an agreed base working capital value for Coal & Allied Industries of negativeA$161 million and there will be customary completion adjustments for the working capital varianceand any net debt of Coal & Allied Industries as at the effective completion time;
• there will be a reduction of US$90 million to the consideration payable by Yancoal if certainoutstanding subordinate approvals relevant to the Warkworth mine are not obtained within five years ofcompletion of the Transaction; and
• Yancoal will assume Rio Tinto’s coal supply obligations in relation to BLCP under the Coal Supplyand Transportation Agreement and Yancoal will continue to use Rio Tinto Marine’s freight services forthe sea freight component of such agreement.
The SPA contains customary terms and conditions that restrict Rio Tinto from soliciting a competingproposal from any third party, or entering into negotiations or discussions in relation to a competingproposal with any third party, subject to customary exceptions if the Board determines that a competingproposal is (or is reasonably likely to become) a superior proposal available to Rio Tinto and thatcompliance with the restriction would constitute a breach of their fiduciary or statutory duties. Please referto section 5 of Part I (Details of the Transaction) for further information.
In accordance with Rio Tinto’s obligations under the HVO Joint Venture Agreement, Rio Tinto will procurethat Yancoal also make a ‘tag’ offer to the relevant Mitsubishi Group member to acquire its 32.4 per cent.interest in the Hunter Valley Joint Venture, subject to any contrary arrangements agreed between Yancoaland the Mitsubishi Group. Please refer to section 6 of Part I (Details of the Transaction) for furtherinformation.
5 Financial effect of the Transaction
Completion of the Transaction is not expected to have a material impact on Rio Tinto’s earnings per share.
6 Use of proceeds
Rio Tinto will use the consideration received from the Transaction for general corporate purposes. In thenear term, completion of the Transaction will reduce the net indebtedness of Rio Tinto.
7 Risks, regulatory consents and other conditions to the Transaction
Prior to making any decision to vote in favour of the proposed Transaction, Rio Tinto Shareholders shouldcarefully consider, together with all other information contained in this document, the specific factors andrisks described below. Rio Tinto considers the following to be the main factors relating to the Transactionfor Rio Tinto Shareholders to consider:
• Rio Tinto Shareholders might disagree with the assessment of the Board and the Independent Expert asto the value of the interests which Yancoal is acquiring under the Transaction and whether Yancoal ispaying a sufficient price for those interests.
6
For
per
sona
l use
onl
y
• Rio Tinto Shareholders might believe that commodity prices in the future will outperform currentexpectations and that, therefore, the price that Yancoal is paying in connection with the Transactiondoes not adequately compensate Rio Tinto Shareholders for the divestment of Coal & Allied Industries.
• Rio Tinto Shareholders might also wish to retain exposure to the interests being sold as part of theTransaction and to share in the potential value that could be generated by Coal & Allied Industries inthe future.
Yancoal intends to fund the Transaction by way of a capital raising and pro-rata renounceable rights issue ofordinary shares. The Yancoal rights issue is expected to occur in the third quarter of 2017.
The Transaction is subject to certain conditions being satisfied, including regulatory approvals (approvalfrom the NSW Minister for Resources, Chinese regulatory approvals, Chinese anti-trust approval, SouthKorean anti-trust approval, which was received on 26 April 2017, and Australian foreign investmentapproval, receipt of which was confirmed by Yancoal in an announcement on 13 April 2017) and consentfrom BLCP to the novation to a Yancoal Group entity of all the rights and obligations of Rio Tinto under theCoal Supply and Transportation Agreement (or the establishment of alternative supply arrangements). TheTransaction is also subject to a vote by the shareholders of Yanzhou. Yankuang, which owns 56 per cent. ofYanzhou, has irrevocably undertaken to vote in favour of the Transaction at the Yanzhou shareholdermeeting.
There is a risk that one or more of these conditions may not be satisfied, which could cause the Transactionnot to complete.
8 Rio Tinto General Meetings
The Transaction is a transaction with a person in a position of influence for the purposes of the ASX ListingRules and requires shareholder approval pursuant to those rules, as well as pursuant to the related partytransaction rules under the UK Listing Rules.
Relevantly, pursuant to ASX Listing Rule 10.1, Rio Tinto shareholder approval is required for the disposalof any substantial asset to an associate of a substantial shareholder of Rio Tinto. Coal & Allied is considereda ‘substantial asset’ for these purposes.
Yancoal is 78 per cent. owned by Yanzhou and Yanzhou is 56 per cent. owned by Yankuang. Yankuang iscontrolled by the State-owned Assets Supervision and Administration Commission of Shandong Province inthe People’s Republic of China.
Chinalco holds a 13.10 per cent. interest in Rio Tinto plc through Shining Prospect Pte. Ltd. Chinalco iscontrolled by the State-owned Assets Supervision and Administration Commission of the State Council ofthe People’s Republic of China. For the purposes of the ASX Listing Rules, Chinalco is treated as a personin a position of influence in relation to Rio Tinto since it is entitled to exercise, or to control the exercise of,10 per cent. or more of the votes able to be cast on all or substantially all matters at general meetings.
As a result of Chinalco and Yankuang each being owned by state-owned entities ultimately controlled bythe State Council of the People’s Republic of China, Yancoal is considered to be an associate of Chinalcoand hence a person in a position of influence in relation to Rio Tinto Limited. Accordingly, the Transactionis a transaction requiring Rio Tinto Shareholder approval pursuant to ASX Listing Rule 10.1. Since theTransaction is between Rio Tinto and Yancoal, Yancoal has undertaken not to vote on the Resolution at theRio Tinto plc General Meeting and the Rio Tinto Limited General Meeting and to take all reasonable stepsto ensure that its associates will not vote on the Resolution at such meetings. As at 17 May 2017, being thelatest practicable date prior to the publication of this document, Rio Tinto was not aware that Yancoal heldany Rio Tinto Shares.
Separately, under the UK Listing Rules, a transaction (other than a transaction in the ordinary course ofbusiness) between a listed company and a related party requires the approval of the shareholders of thelisted company. Under the UK Listing Rules, any person who is entitled to exercise, or to control theexercise of, 10 per cent. or more of the votes able to be cast on all or substantially all matters at generalmeetings of a listed company is considered, with its associates, to be a related party of that listed company.Yancoal is considered to be an associate of Chinalco for the purposes of UK Listing Rule 11.1.7 as a resultof Chinalco and Yankuang each being owned by state-owned entities ultimately controlled by the StateCouncil of the People’s Republic of China, as described above. Accordingly, the Transaction is a relatedparty transaction requiring Rio Tinto Shareholder approval pursuant to UK Listing Rule 11.1.7. As theTransaction is classified as a Class 2 transaction under the UK Listing Rules, Rio Tinto Shareholders willnot be asked to approve the Transaction for the purposes of Chapter 10 of the UK Listing Rules.
7
For
per
sona
l use
onl
y
Accordingly, the Transaction is conditional on shareholders at the Rio Tinto plc General Meeting and theRio Tinto Limited General Meeting approving the Transaction as a joint electorate by way of ordinaryresolution. The Rio Tinto Limited General Meeting will be held at 11.00 a.m. (AEST) on 29 June 2017 andthe Rio Tinto plc General Meeting will be held at 11.00 a.m. (London time) on 27 June 2017. The Noticeconvening the Rio Tinto Limited General Meeting is set out at the end of this document.
The result of the vote to approve the Transaction under the joint electorate procedure will be determinedwhen the relevant polls are closed at the end of the Rio Tinto Limited General Meeting. The overall resultswill be announced to the relevant stock exchanges and posted on Rio Tinto’s website shortly after the end ofthat meeting.
9 Action to be taken
You will find enclosed a Proxy Form for use at the Rio Tinto Limited General Meeting. Whether or not youintend to be present at the Rio Tinto Limited General Meeting, you are requested to complete the ProxyForm and return it as soon as possible and in any case so as to be received by Rio Tinto Limited’s shareregistry at Computershare Investor Services Pty Ltd, GPO Box 242, Melbourne, Victoria, 3001, or YarraFalls, 452 Johnston Street, Abbotsford, Victoria, 3067 or at Rio Tinto Limited’s registered office or byfacsimile to 1800 783 447 (within Australia) or +61 3 9473 2555 (outside Australia), by 11.00 a.m. (AEST)on 27 June 2017.
The completion and return of a completed Proxy Form will not prevent you from attending and voting inperson at the Rio Tinto Limited General Meeting, or any adjournment thereof, if you so wish and are soentitled.
Shareholders can lodge their proxy forms online at investorvote.com.au. Further information can beobtained in the Important Notes in the Notice of General Meeting that is annexed to this document.
If you have any questions in relation to the Transaction, please contact the Rio Tinto Shareholder Helpline
• within Australia on 1800 813 292 (toll free); or
• from outside Australia on +61 3 9415 4030,
at any time between 8.30 a.m. to 5.30 p.m. (Melbourne time) Monday to Friday, or visit the Rio Tintowebsite at riotinto.com.
10 Further information
Your attention is drawn to the additional information contained in Parts I to IV of this document. You areadvised to read the whole document and not merely rely on the key or summarised information in this letterfrom the Chairman of Rio Tinto.
11 Independent Expert
Rio Tinto has engaged Ernst & Young as the Independent Expert to prepare a report opining on the fairnessand reasonableness of the Transaction to Rio Tinto Limited Shareholders. The provision of the IndependentExpert’s Report is a requirement of the ASX Listing Rules. The Independent Expert is required to beindependent from Rio Tinto in accordance with Regulatory Guide 112 issued by the Australian Securitiesand Investments Commission.
The Independent Expert has concluded that the terms of the Transaction are fair and reasonable forRio Tinto Limited Shareholders. The Independent Expert’s Report is set out in Part II (Independent Expert’sReport) of this document.
The Independent Expert, in its Independent Expert’s Report states that:
“The assessed value of Coal & Allied on a controlling basis is between $1,820 million and $2,173 million.The value of the Consideration and Royalty is between $2,296 million and $2,386 million. As the range ofthe Consideration and Royalty is greater than the range of values of Coal & Allied on a controlling basis weconsider the Transaction to be fair… as we consider the terms of the Transaction to be fair, we alsoconsider the terms to be reasonable.”
12 Recommendation
The Board of Rio Tinto Limited considers that the Transaction is fair and reasonable as far as the Rio TintoLimited Shareholders are concerned. The Board also considers that the Transaction is in the best interests ofRio Tinto Shareholders as a whole.
8
For
per
sona
l use
onl
y

Accordingly, the Board recommends that you vote in favour of the Resolution as each member of the Boardintends to do in respect of any Rio Tinto Shares over which he or she has voting control (such Rio TintoShares (in aggregate) representing approximately 0.007 per cent. of voting power in Rio Tinto on jointdecision matters).
Yours faithfully
Jan du Plessis
Chairman
9
For
per
sona
l use
onl
y
EXPECTED TIMETABLE OF PRINCIPAL EVENTS
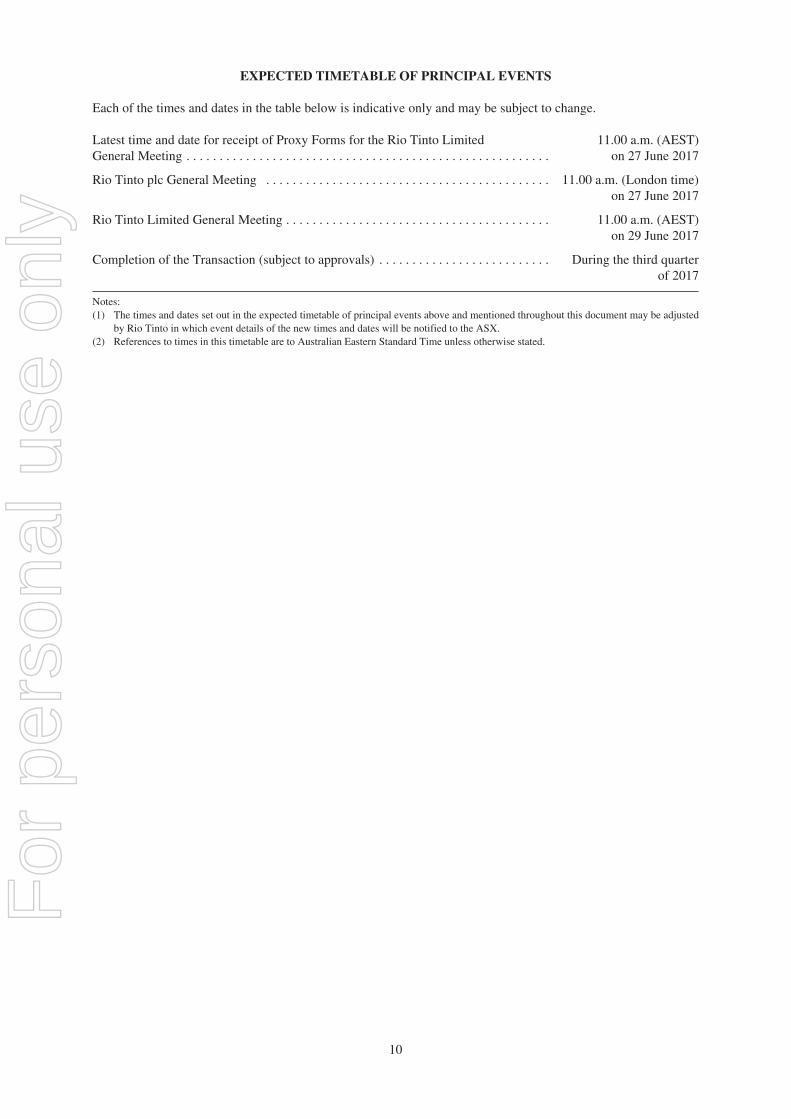
Each of the times and dates in the table below is indicative only and may be subject to change.
Latest time and date for receipt of Proxy Forms for the Rio Tinto LimitedGeneral Meeting . . . . . . . . . . . . . . . . . . . . . . . . . . . . . . . . . . . . . . . . . . . . . . . . . . . . . . .
11.00 a.m. (AEST)on 27 June 2017
Rio Tinto plc General Meeting . . . . . . . . . . . . . . . . . . . . . . . . . . . . . . . . . . . . . . . . . . . 11.00 a.m. (London time)on 27 June 2017
Rio Tinto Limited General Meeting . . . . . . . . . . . . . . . . . . . . . . . . . . . . . . . . . . . . . . . . 11.00 a.m. (AEST)on 29 June 2017
Completion of the Transaction (subject to approvals) . . . . . . . . . . . . . . . . . . . . . . . . . . During the third quarterof 2017
Notes:(1) The times and dates set out in the expected timetable of principal events above and mentioned throughout this document may be adjusted
by Rio Tinto in which event details of the new times and dates will be notified to the ASX.(2) References to times in this timetable are to Australian Eastern Standard Time unless otherwise stated.
10
For
per
sona
l use
onl
y

PART I
DETAILS OF THE TRANSACTION
1 Transaction
Yancoal has entered into the SPA with the Vendor and HVR in relation to the sale of all of the issued sharesin Coal & Allied Industries.
2 Purchase Price
The total purchase price payable by Yancoal comprises an initial payment of US$1.95 billion, payable atcompletion of the Transaction and US$500 million in aggregate deferred cash payments, payable as annualinstalments of US$100 million over the five years following completion of the Transaction.
Yancoal, through certain subsidiaries of Coal & Allied Industries, must also pay a coal price linked royalty,which is determined as US$2 per tonne (subject to an annual Australian CPI adjustment over the term of theroyalty) of attributable saleable coal production (excluding certain production) from Coal & AlliedIndustries for a period of 10 years beginning on the third anniversary of completion. This royalty is payableif the Newcastle benchmark thermal coal price exceeds US$75 per tonne (subject to an annual AustralianCPI adjustment over the term of the royalty). The aggregate amount of royalties is subject to aUS$650 million cap (see section 11 of this Part I (Details of the Transaction)).
In addition to the cash consideration payable by Yancoal upon completion of the Transaction andRio Tinto’s future royalties entitlement:
• earnings and cash flow generated by Coal & Allied Industries until completion of the Transaction willcontinue for the benefit of Rio Tinto (with the exception of sales proceeds generated from the potentialsale of the Minmi landholdings in the Lower Hunter Valley. To the extent realised, any such salesproceeds would not be material in the context of Coal & Allied Industries or the Transaction);
• Yancoal will assume an agreed base working capital value for Coal & Allied Industries of negativeA$161 million and there will be customary completion adjustments for the working capital varianceand any net debt of Coal & Allied Industries as at the effective completion time;
• there will be a reduction of US$90 million to the consideration payable by Yancoal if certainoutstanding subordinate approvals relevant to the Warkworth mine are not obtained within five years ofcompletion of the Transaction; and
• Yancoal will assume Rio Tinto’s coal supply obligations in relation to BLCP under the Coal Supplyand Transportation Agreement and Yancoal will continue to use Rio Tinto Marine’s freight services forthe sea freight component of such agreement.
3 Conditions Precedent
The completion-related obligations on the parties under the SPA do not become binding unless and untileach of the following conditions are satisfied (or waived, where applicable):
• the Transaction is approved by the NSW Minister for Resources, as required under the conditions ofcertain tenements held by Coal & Allied Industries;
• the Treasurer of Australia approves the Transaction under the foreign investment approval legislation;
• approval in respect of the Transaction is received from all required authorities of the People’s Republicof China, namely the State-owned Assets Supervision and Administration Commission, the NationalDevelopment and Reform Commission, the State Administration of Foreign Exchange and the Ministryof Commerce (MOFCOM);
• China’s Anti-Monopoly Bureau and the Korea Fair Trade Commission each clear the Transaction;
• the shareholders of Rio Tinto Limited and Rio Tinto plc approve the Transaction;
• the shareholders of Yanzhou approve the Transaction; and
• BLCP consents to the novation of the Coal Supply and Transportation Agreement from the Vendor to aYancoal Group entity, and executes a novation deed (or alternative supply arrangements have beenestablished).
11
For
per
sona
l use
onl
y
On 13 April 2017, Yancoal issued an announcement to the effect that it had received confirmation from theForeign Investment Review Board of the Treasurer of Australia’s approval of the Transaction. On 26 April2017, Yancoal received merger control clearance from the Korea Fair Trade Commission.
4 Termination
Yancoal may terminate the SPA before completion if:
• despite having used reasonable endeavours, funding is not available to it on reasonably acceptableterms to fund the purchase price, in which case Yancoal must pay Rio Tinto a termination fee ofUS$23.5 million (however, the termination fee is not payable where Yancoal has been unable to obtainfunding under its proposed rights issue due to a regulatory order which prevents completion of therights issue); or
• a material adverse change in relation to Coal & Allied Industries occurs before completion (and, ifoccurring before the estimated launch date of the Yancoal rights issue, is not cured before that launchdate). A material adverse change is defined to be an event that results in, or would be reasonably likelyto result in:
• a reduction in Coal & Allied Industries’ share of production of saleable coal to less than10 million tonnes per annum during a continuous period of 18 months following completion;
• the sterilisation of more than 7.5 per cent. of Coal & Allied Industries’ stated coal reserves; or
• a reduction in the market value of Coal & Allied Industries’ consolidated net assets by at leastUS$250 million against the value that would reasonably be expected at completion, but for thematerial adverse change.
The Vendor or Yancoal may terminate the SPA before completion if:
• the conditions precedent (other than the BLCP consent condition) are not satisfied or waived, or havebecome incapable of satisfaction, on or before 24 October 2017 (which period may be extended by theelection of either or both parties for a total of 60 days); or
• the other party fails to fulfil its obligations at completion and does not remedy that failure within fivebusiness days.
The Vendor may terminate the SPA before completion if the BLCP consent condition has not been fulfilledor waived and the Vendor considers that pursuing an alternative commercial approach with respect to theCoal Supply and Transportation Agreement of the type described in section 10 of this Part I (Details of theTransaction) would be likely to result in material adverse consequences for Rio Tinto.
The SPA will terminate automatically if any customer of or supplier to the Vendor, HVR or Coal & AlliedIndustries or any of its subsidiaries obtains an injunction preventing the Vendor or HVR from fulfilling itscompletion obligations under the SPA.
5 Exclusivity
No shop and no talk
During the period from the date of the SPA until completion or termination of the SPA, the Vendor and itsrelated bodies corporate must not (subject to certain limited customary carve-outs):
• solicit or invite any competing proposal for a control transaction in relation to Coal & Allied Industriesor the disposal of Coal & Allied Industries’ assets;
• participate in discussions relating to, or enter into, any arrangement that may lead to a competingproposal;
• provide a third party with any non-public information relating to Coal & Allied Industries inconnection with the formulation of a competing proposal; or
• communicate to anyone an intention to do any of the above.
Exceptions
The restrictions described above (other than the restriction described in the first bullet) are subject to afiduciary carve out, such that they do not apply where the Board determines that the competing proposal is a
12
For
per
sona
l use
onl
y

‘Superior Proposal’ and compliance with the restrictions would be a breach of their directors’ duties, or thatcompliance with the restrictions would otherwise be unlawful. This carve out only applies until the date onwhich the Rio Tinto Shareholders have approved the Transaction.
In summary, ‘Superior Proposal’ is defined in the SPA as a bona fide competing proposal for the acquisitionof 100 per cent. of the shares in Coal & Allied Industries for a total cash consideration having a net presentvalue that exceeds Yancoal’s proposed consideration by at least US$100 million, and which is reasonablyconsidered to be no more conditional than the Transaction (including based on relative completion timeframes), and which would be more favourable to the Rio Tinto Shareholders than the Transaction. TheBoard is to determine whether a bona fide competing proposal constitutes a Superior Proposal.
Notification of approaches and matching right
If the Vendor receives a competing proposal, it must (subject to a fiduciary carve-out) provide details of theparty making the competing proposal and the material terms of the proposal to Yancoal within five businessdays of receipt.
If the Board determines that a competing proposal is a Superior Proposal, then Rio Tinto must not enter intothat Superior Proposal until Yancoal has had the opportunity to present a counter offer within five businessdays of being notified of such Superior Proposal. If the Board determines in good faith that the counter offeris no less favourable than the Superior Proposal, then the parties must seek to enter into documentation togive effect to the counter offer as soon as reasonably practicable.
6 Mitsubishi Tag Rights
Coal & Allied Industries is a party to the HVO Joint Venture Agreement (through its subsidiary Coal &Allied Operations Pty Ltd). Under the HVO Joint Venture Agreement, a Mitsubishi Group member hastag-along rights that are triggered by the Transaction. As required by the SPA, Yancoal must make an offerto the Mitsubishi Group member to acquire its 32.4 per cent. interest in the Hunter Valley Joint Venture inaccordance with the HVO Joint Venture Agreement, subject to any contrary arrangements agreed betweenYancoal and the Mitsubishi Group. The HVO Joint Venture Agreement contains a mechanism fordetermining the price to be offered to the Mitsubishi Group for its interest in the Hunter Valley JointVenture, which involves determination of fair market value by agreement between the parties or, in defaultof such agreement, by an independent valuer. Once the fair market value has been determined and an offerhas been made, the Mitsubishi Group may elect to accept or reject that offer.
As at 17 May 2017, being the latest practicable date prior to the publication of this document, the partieshad agreed to extend the timetable for the tag-along process to allow for further discussion between theMitsubishi Group and Yancoal.
7 Warranties
Each of the parties to the SPA has given warranties that are considered customary for a transaction of thisnature.
8 Conduct of Business Restrictions
The Vendor and HVR must conduct the business of Coal & Allied Industries in the ordinary course betweensigning of the SPA and completion of the Transaction. This includes carrying on the business in accordancewith all approved budgets and business plans (including those relating to any joint ventures). The Vendorand HVR are also subject to certain specific restrictions, including in relation to incurring material capitalcommitments, relinquishing mining tenements, disposing of assets and other restrictions that may beconsidered customary for a transaction of this nature.
9 Transitional Services Agreement
The parties to the SPA have agreed that a Transitional Services Agreement will be entered into uponcompletion of the Transaction between a related body corporate of the Vendor, Rio Tinto Services Limited,and Coal & Allied Industries. The Transitional Services Agreement relates to the provision of variousservices for short specified periods (up to six months following completion of the Transaction), dependingon the nature of the services. Services to be provided under the Transitional Services Agreement include IST
13
For
per
sona
l use
onl
y

support services, orebody knowledge support, strategic mine planning support, health, safety andenvironment support, government approvals support, accounting support and payroll support. Coal & AlliedIndustries must pay a fee for the provision of these services of cost plus 7.5 per cent. The TransitionalServices Agreement has a basic term of six months (with IST services to be provided for the six-month termand shorter terms of one to three months for the remaining services). Notwithstanding these agreed serviceterms, Coal & Allied Industries must use its best endeavours to take over performance of the services itself,or procure a third party to perform them, as soon as possible after completion of the Transaction. Rio TintoServices Limited’s liability under the Transitional Services Agreement is capped at the total amount of theservice fees it receives.
10 BLCP arrangements
The Coal Supply and Transportation Agreement was entered into between the Vendor and BLCP on 13 June2003, as amended on 25 May 2009. Coal from the Warkworth, Mount Thorley and Hunter Valley coaloperations is currently delivered to BLCP by the Vendor under the Coal Supply and TransportationAgreement. Specifically, the Vendor must supply a minimum annual quantity of 2,560,000 tonnes of coaland a maximum annual quantity of 3,627,000 tonnes of coal to BLCP. The term of the Coal Supply andTransportation Agreement extends until January 2032. The Vendor has the right to exclusively supplyBLCP until BLCP purchases the maximum quantity (subject to certain limited exceptions) from the Vendor.A supply schedule is agreed between the parties each year that must provide for the supply of at least theminimum quantity to BLCP. The Coal Supply and Transportation Agreement contains a take or payobligation on BLCP to take the minimum quantity.
It is intended that the Coal Supply and Transportation Agreement will be novated from the Vendor to aYancoal Group entity on and from completion of the Transaction pursuant to a BLCP Novation Deed.However, if this does not occur and the Vendor does not terminate the SPA in such circumstances on thebasis set out in section 4 of this Part I (Details of the Transaction), then the Vendor and Yancoal Sales willenter into back-to-back arrangements contained in the BLCP Back-to-Back Agreement such that YancoalSales will make coal available to the Vendor to enable the Vendor’s ongoing compliance with the CoalSupply and Transportation Agreement.
Whether or not the Coal Supply and Transportation Agreement is novated to a Yancoal Group entity, certainother agreements will be entered into as described below:
• Bee Creek Contract and related side letter: for the purpose of supporting the obligations of theYancoal Group entity under the Coal Supply and Transportation Agreement or under the back-to-backarrangements (as applicable), the SPA provides for the novation from the Vendor to Yancoal Sales ofvarious existing coal supply and freight arrangements and entry into the Bee Creek Contract and relatedside letter by Yancoal Sales and Hail Creek Marketing Pty Limited (a member of the Rio Tinto Group)pursuant to which Yancoal Sales will purchase up to 800,000 tonnes per annum of coal from HailCreek Marketing Pty Limited until 31 December 2020 on arms-length terms;
• Freight Transfer Deed: this will be a tripartite novation deed that the Vendor, Yancoal Sales andRio Tinto Shipping (Asia) Pte Limited (a member of the Rio Tinto Group) will enter into to novatefrom the Vendor to Yancoal Sales the Agreement for the Supply of Chartering and Freight Services toPort of Map Ta Phut, Thailand dated 17 May 2005 between the Vendor and Rio Tinto Shipping (Asia)Pte Limited. This is the agreement pursuant to which the Vendor procures from Rio Tinto Shipping(Asia) Pte Limited transportation services in respect of the Coal Supply and Transportation Agreement;and
• HVO Coal Supply Transfer Deed: this will be a tripartite deed between HVO Coal Sales Pty Ltd,Yancoal Sales and the Vendor under which the Vendor novates to Yancoal Sales the existing HVOCoal Supply Agreement (back-to-back sale of coal for supply to BLCP) dated 3 February 2016between the Vendor and HVO Coal Sales Pty Ltd (an entity partly owned by the Vendor and theMitsubishi Group). Under this agreement, the Vendor sources a portion of coal for its annual supplyobligations to BLCP.
11 Royalty arrangements
As indicated in section 1 of this Part I (Details of the Transaction), the Vendor has also acquired a right tobe paid royalties in respect of Coal & Allied Industries’ share of certain coal production from theWarkworth, Mount Thorley and Hunter Valley coal operations. These royalties are set out in four separateroyalty deeds that will be entered into before completion of the Transaction in accordance with the SPA.
14
For
per
sona
l use
onl
y

The royalty period is 10 years commencing on the day after the third anniversary of completion of theTransaction and expiring on the thirteenth anniversary of completion of the Transaction, or the last day ofthe calendar quarter during which the aggregate amount of royalty payments under all Royalty Deedsreaches the cap amount of US$650 million, whichever is earlier.
The amount of the royalty payable under each Royalty Deed is US$2 per tonne (annually indexed toAustralian CPI over the term of the royalty) of attributable saleable production. The royalties are payable ona quarterly basis, and are only payable in respect of a given quarter if the Newcastle benchmark thermal coalprice for that quarter exceeds the threshold amount of US$75 per tonne (annually indexed to Australian CPIover the term of the royalty). The total amount of royalties payable under all Royalty Deeds is capped atUS$650 million. The royalties are not payable on production of amounts required for delivery to BLCPunder the Coal Supply and Transportation Agreement or coal extracted from any future undergroundmining.
If there is an adjustment in the purchase price due to certain outstanding subordinate approvals relating tothe Warkworth mining operations not being obtained (referred to in section 1 of this Part I (Details of theTransaction)), the royalties payable under the Royalty Deeds relating to the Warkworth and Mount Thorleycoal operations will, in the case of coal production from the area affected by the failure to obtain therelevant subordinate approvals, not be subject to the benchmark thermal coal price threshold referred toabove.
15
For
per
sona
l use
onl
y

PART II
INDEPENDENT EXPERT’S REPORT
16
For
per
sona
l use
onl
y

Independent Expert’s Reportand Financial Services Guide
In relation to the proposed disposal of theRio Tinto Group’s shareholding in Coal &Allied Industries Limited to YancoalAustralia Limited
19 May 2017
17
For
per
sona
l use
onl
y
÷ i
A member firm of Ernst & Young Global LimitedErnst & Young Transaction Advisory Services Limited, ABN 87 003 599 844Australian Financial Services Licence No. 240585
Part 1 – Independent Expert’s ReportThe DirectorsRio Tinto Limited120 Collins StreetMELBOURNE VIC 3000
19 May 2017
Dear Directors
Proposed disposal of Coal & Allied Industries Limited
Background
On 24 January 2017, the Rio Tinto Group (“Rio Tinto”) announced that it had reached a binding agreement forthe sale of its wholly owned subsidiary Coal & Allied Industries Limited (“Coal & Allied” or the “Company”) toYancoal Australia Limited (“Yancoal”) (the “Transaction”) for a cash consideration of $2.45 billion(“Consideration”). Rio Tinto will also be entitled to a royalty. All amounts are in United States dollars(“$” or “US$”) unless otherwise stated.
Requirement for an independent expert’s report
One of the conditions precedent to the Transaction is approval by the shareholders of Rio Tinto Limited notassociated with Yancoal (“Non-Associated Shareholders”). Rio Tinto Coal NSW Holdings Limited, a subsidiaryof Rio Tinto Limited and part of Rio Tinto, has engaged Ernst & Young Transaction Advisory Services Limited(“EY Transaction Advisory Services”) to prepare this independent expert’s report (“IER”), a copy of which is tobe provided to Rio Tinto Limited shareholders.
In accordance with Chapter 10 of the Australian Securities Exchange (“ASX”) Listing Rules, the requirement foran IER has arisen as Yancoal is considered to be a person of influence in respect of Rio Tinto for the purposesof the ASX Listing Rules. The Notice of Meeting provided to shareholders of Rio Tinto Limited in advance of themeeting whereby Rio Tinto will be seeking approval of the Transaction must include an IER.
Approach
Neither the Corporations Act 2001 nor the ASX Listing Rules define the term “fair and reasonable”. AustralianSecurities and Investment Commission Regulatory Guide 111: Content of expert reports (“RG 111”) providessome guidance as to how the term “fair and reasonable” should be interpreted in a range of circumstances. Withrespect to a related party transaction RG 111 provides:
► An offer is “fair” if the value of the “financial benefit to be provided by the entity to the related party isequal to or less than the value of the consideration being provided to the entity”.
► An offer is “reasonable” if it is fair. It might also be “reasonable” if, despite being “not fair”, the expertbelieves that there are sufficient reasons for security holders to vote for the proposal.
Accordingly, the key component of the assessment as to whether or not the Transaction is fair and reasonableis the comparison of the fair value of Coal & Allied with the fair value of the Consideration plus royalty beingoffered.
18
For
per
sona
l use
onl
y
bessma
Stamp
÷ ii
A member firm of Ernst & Young Global LimitedErnst & Young Transaction Advisory Services Limited, ABN 87 003 599 844Australian Financial Services Licence No. 240585
Summary of opinion
Fairness of the Transaction
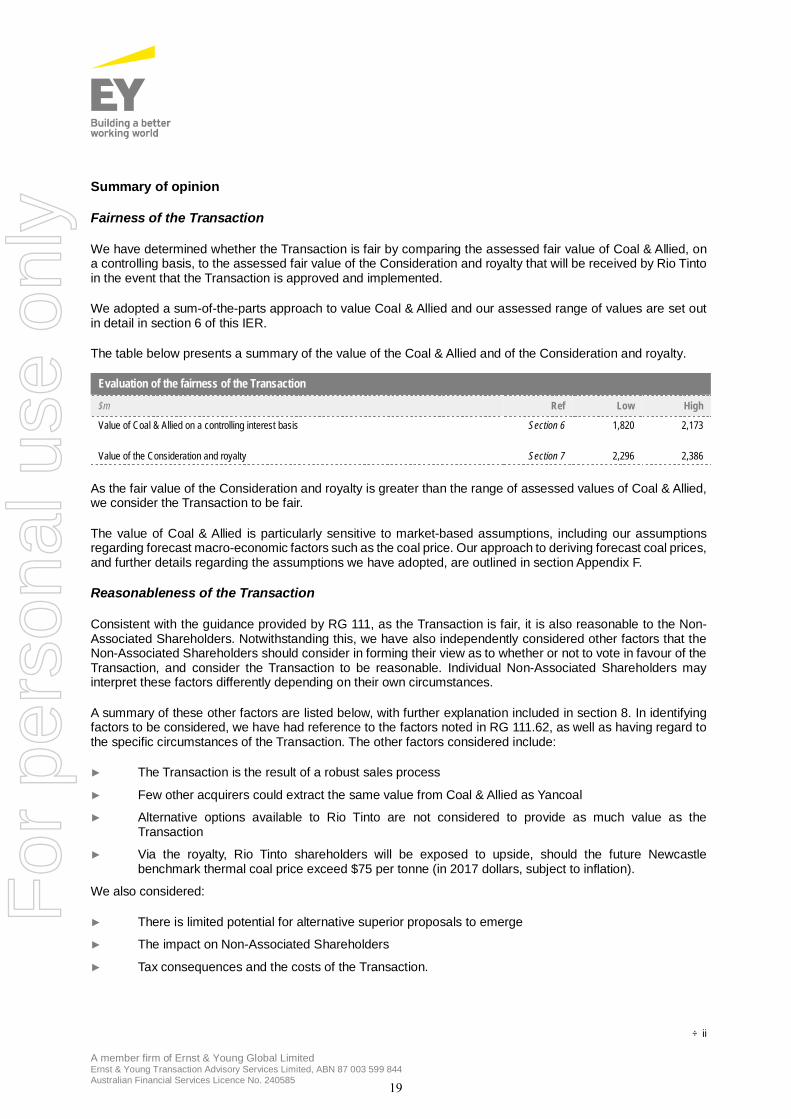
We have determined whether the Transaction is fair by comparing the assessed fair value of Coal & Allied, ona controlling basis, to the assessed fair value of the Consideration and royalty that will be received by Rio Tintoin the event that the Transaction is approved and implemented.
We adopted a sum-of-the-parts approach to value Coal & Allied and our assessed range of values are set outin detail in section 6 of this IER.
The table below presents a summary of the value of the Coal & Allied and of the Consideration and royalty.
As the fair value of the Consideration and royalty is greater than the range of assessed values of Coal & Allied,we consider the Transaction to be fair.
The value of Coal & Allied is particularly sensitive to market-based assumptions, including our assumptionsregarding forecast macro-economic factors such as the coal price. Our approach to deriving forecast coal prices,and further details regarding the assumptions we have adopted, are outlined in section Appendix F.
Reasonableness of the Transaction
Consistent with the guidance provided by RG 111, as the Transaction is fair, it is also reasonable to the Non-Associated Shareholders. Notwithstanding this, we have also independently considered other factors that theNon-Associated Shareholders should consider in forming their view as to whether or not to vote in favour of theTransaction, and consider the Transaction to be reasonable. Individual Non-Associated Shareholders mayinterpret these factors differently depending on their own circumstances.
A summary of these other factors are listed below, with further explanation included in section 8. In identifyingfactors to be considered, we have had reference to the factors noted in RG 111.62, as well as having regard tothe specific circumstances of the Transaction. The other factors considered include:
► The Transaction is the result of a robust sales process
► Few other acquirers could extract the same value from Coal & Allied as Yancoal
► Alternative options available to Rio Tinto are not considered to provide as much value as theTransaction
► Via the royalty, Rio Tinto shareholders will be exposed to upside, should the future Newcastlebenchmark thermal coal price exceed $75 per tonne (in 2017 dollars, subject to inflation).
We also considered:
► There is limited potential for alternative superior proposals to emerge
► The impact on Non-Associated Shareholders
► Tax consequences and the costs of the Transaction.
Evaluation of the fairness of the Transaction
$m Ref Low High
Value of Coal & Allied on a controlling interest basis Section 6 1,820 2,173
Value of the Consideration and royalty Section 7 2,296 2,386
19
For
per
sona
l use
onl
y
÷ iii
A member firm of Ernst & Young Global LimitedErnst & Young Transaction Advisory Services Limited, ABN 87 003 599 844Australian Financial Services Licence No. 240585
Conclusion
Taking into consideration the matters detailed in this IER, in the opinion of EY Transaction Advisory Services,the Transaction is fair and reasonable to the Non-Associated Shareholders.
Other matters
This IER has been prepared specifically for Non-Associated Shareholders. Neither EY Transaction AdvisoryServices, Ernst & Young nor any employee thereof undertakes responsibility to any person, other than the Non-Associated Shareholders in respect of this report, including any errors or omissions howsoever caused.
This IER constitutes general financial product advice only and has been prepared without taking intoconsideration the individual circumstances of the Non-Associated Shareholders. The decision as to whether toapprove or not approve the Transaction is a matter for individual Non-Associated Shareholders. Non-AssociatedShareholders should have regard to the Notice of Meeting and accompanying documents prepared by Rio Tinto.Non-Associated Shareholders who are in doubt as to the action they should take in relation to the Transactionshould consult their own professional adviser.
Our opinion is made as at the date of this report and reflects circumstances and conditions as at that date. Thisletter must be read in conjunction with the full IER as attached.
EY Transaction Advisory Services has prepared a Financial Services Guide in accordance with the CorporationsAct 2001. The Financial Services Guide is included as Part 2 of this report.
Yours faithfullyErnst & Young Transaction Advisory Services Limited
Michael FenechDirector and Representative
Ken PendergastDirector and Representative
20
For
per
sona
l use
onl
y

4
ContentsPart 1 – Independent Expert’s Report1. Introduction .......................................................................................................................................... 61.1 Overview of the Transaction .................................................................................................................................................... 61.2 Summary of Coal & Allied ........................................................................................................................................................ 61.3 Key terms of the Transaction ................................................................................................................................................... 61.4 Conditions precedent ............................................................................................................................................................... 71.5 Funding the Transaction .......................................................................................................................................................... 7
2. Scope of the independent expert’s report ......................................................................................... 82.1 Purpose of the report................................................................................................................................................................ 82.2 Basis of evaluation ................................................................................................................................................................... 82.3 Fair value .................................................................................................................................................................................. 92.4 Independence ........................................................................................................................................................................... 92.5 Limitations and reliance on information and technical experts ............................................................................................... 92.6 Shareholders’ decisions ......................................................................................................................................................... 11
3. Overview of Coal & Allied.................................................................................................................. 123.1 Company background ............................................................................................................................................................ 123.2 Coal & Allied’s assets ............................................................................................................................................................. 133.2.1 Summary ................................................................................................................................................................................ 133.2.2 HVO ........................................................................................................................................................................................ 143.2.2.1 Infrastructure........................................................................................................................................................................... 153.2.2.2 Approvals ................................................................................................................................................................................ 153.2.3 MTW ....................................................................................................................................................................................... 153.2.3.1 Infrastructure........................................................................................................................................................................... 163.2.3.2 Approvals ................................................................................................................................................................................ 163.2.4 Port and rail utilisation ............................................................................................................................................................ 163.2.5 Land holdings ......................................................................................................................................................................... 173.2.6 PWCS interest ........................................................................................................................................................................ 173.2.7 Other assets ........................................................................................................................................................................... 173.3 Rio Tinto’s divestment program ............................................................................................................................................. 173.4 Production, Reserves and Resources ................................................................................................................................... 183.4.1 Production ............................................................................................................................................................................... 183.4.2 Ore Reserves and Mineral Resources .................................................................................................................................. 193.4.3 Marketing and products .......................................................................................................................................................... 193.5 Adjusted financial information ................................................................................................................................................ 203.5.1 Adjusted financial performance ............................................................................................................................................. 203.5.2 Adjusted financial position...................................................................................................................................................... 223.5.3 Adjusted cash flow ................................................................................................................................................................. 243.6 Rio Tinto.................................................................................................................................................................................. 253.7 Broker coverage ..................................................................................................................................................................... 25
4. Overview of Yancoal .......................................................................................................................... 264.1 Company background ............................................................................................................................................................ 264.1.1 NCIG interest .......................................................................................................................................................................... 274.2 Major shareholders ................................................................................................................................................................. 27
5. Valuation approach ............................................................................................................................ 285.1 Definition of fair value ............................................................................................................................................................. 285.2 Valuation methodologies adopted ......................................................................................................................................... 285.2.1 Operating Projects .................................................................................................................................................................. 285.2.2 Other assets and liabilities ..................................................................................................................................................... 295.3 Control premium ..................................................................................................................................................................... 305.4 Valuation cross checks .......................................................................................................................................................... 30
6. Valuation of Coal & Allied ................................................................................................................. 316.1 Summary of values ................................................................................................................................................................. 316.2 Financial Model ...................................................................................................................................................................... 326.3 Operating Projects .................................................................................................................................................................. 336.3.1 Revenue.................................................................................................................................................................................. 336.3.1.1 AMC production cases ........................................................................................................................................................... 336.3.1.2 Production ............................................................................................................................................................................... 346.3.1.3 Revenue.................................................................................................................................................................................. 35
21
For
per
sona
l use
onl
y

5
6.3.2 Operating expenditure ............................................................................................................................................................ 366.3.3 Capital expenditure ................................................................................................................................................................ 376.3.4 Other cash flow items ............................................................................................................................................................. 386.3.4.1 Changes in working capital .................................................................................................................................................... 386.3.4.2 Income tax .............................................................................................................................................................................. 396.3.4.3 Provisions ............................................................................................................................................................................... 396.3.5 Discount rate........................................................................................................................................................................... 396.3.6 Valuation range ...................................................................................................................................................................... 396.4 Non-producing assets ............................................................................................................................................................ 396.5 Other assets and liabilities ..................................................................................................................................................... 406.5.1 Surplus land sales .................................................................................................................................................................. 406.5.2 Onerous contracts .................................................................................................................................................................. 406.5.3 Other assets and liabilities ..................................................................................................................................................... 416.6 Sensitivity analysis ................................................................................................................................................................. 416.7 Valuation cross check ............................................................................................................................................................ 42
7. Valuation of the Consideration and Royalty.................................................................................... 467.1 Overview of the Consideration and Royalty .......................................................................................................................... 467.2 Summary of the valuation of the Consideration and Royalty................................................................................................ 467.3 Valuation of the Consideration and Royalty .......................................................................................................................... 467.3.1 Upfront cash payment ............................................................................................................................................................ 467.3.2 Deferred payments ................................................................................................................................................................. 467.3.3 Royalty .................................................................................................................................................................................... 467.3.4 Approvals and adjustment to the Consideration ................................................................................................................... 47
8. Evaluation of the Transaction ........................................................................................................... 488.1 Overview ................................................................................................................................................................................. 488.2 Fairness .................................................................................................................................................................................. 488.3 Reasonableness ..................................................................................................................................................................... 498.3.1 The Transaction is the result of a robust sale process ......................................................................................................... 498.3.2 Few other acquirers could extract the same value as Yancoal ............................................................................................ 498.3.3 Alternative options available to Rio Tinto are not considered to provide as much value .................................................... 508.3.4 Rio Tinto shareholders will be exposed to upside, should the coal price increase in the future above certain levels ....... 508.4 Other considerations .............................................................................................................................................................. 508.4.1 There is limited potential for alternative superior proposals to emerge................................................................................ 508.4.2 Impact on Non-Associated Shareholders .............................................................................................................................. 518.4.3 Tax consequences ................................................................................................................................................................. 518.4.4 Costs associated with the Transaction .................................................................................................................................. 518.5 Conclusion .............................................................................................................................................................................. 52
AppendicesAppendix A Statement of qualifications and declarations.............................................................................................................. 53Appendix B Valuation methodologies ............................................................................................................................................. 54Appendix C Industry overview ........................................................................................................................................................ 55Appendix D Determination of discount rate .................................................................................................................................... 65Appendix E Valuation cross check ................................................................................................................................................. 71Appendix F Forecast macroeconomic assumptions ...................................................................................................................... 76Appendix G Sources of information ................................................................................................................................................ 79Appendix H Glossary ....................................................................................................................................................................... 80Appendix I The AMC Report ......................................................................................................................................................... 82Appendix J Coal & Allied General Purpose Financial Report ....................................................................................................... 83Appendix K Reconciliation of the adjusted financial information ................................................................................................... 84
Part 2 – Financial Services Guide
22
For
per
sona
l use
onl
y
6
1. Introduction1.1 Overview of the TransactionOn 24 January 2017, Rio Tinto announced that it had reached a binding agreement for the sale of Coal & Alliedto Yancoal. One of the conditions precedent to the Transaction is approval by the Non-Associated Shareholders.
Consideration for the Transaction will be $2.45 billion (cash) made up of a $1.95 billion upfront payment at thecompletion of the Transaction, followed by deferred payments of $100 million per annum over five years totalling$500 million.
Rio Tinto will also be entitled to a royalty that is based on the Newcastle benchmark thermal coal price exceeding$75 per tonne (“t”) (in 2017 dollars, subject to inflation) (“Royalty”).
1.2 Summary of Coal & AlliedCoal & Allied is a wholly owned subsidiary of Rio Tinto which operates Rio Tinto’s thermal coal and semi-softcoking coal (“SSCC”) business in the Hunter Valley. Coal & Allied holds a 67.6% interest in the Hunter ValleyOperations mine (“HVO”), an 80.0% interest in the Mount Thorley mine (“Mount Thorley”), a 55.6% interest inthe Warkworth mine (“Warkworth”) and a 36.5% interest in Port Waratah Coal Services (“PWCS”). The MountThorley and Warkworth mines (“MTW”) are operated on an integrated basis. Coal & Allied also holds interestsin a number of undeveloped coal assets as well as various landholdings.
Coal & Allied produces thermal coal and SSCC. In 2016, Coal & Allied produced a total of 17.1 million tonnes(“Mt”) of run of mine (“ROM”) coal (attributable to Rio Tinto) from its operating mines.
1.3 Key terms of the TransactionThe terms of the Transaction are set out in the Sale and Purchase Agreement (“SPA”). The key terms of theSPA are summarised below.
► An initial cash payment of $1.95 billion at completion of the Transaction which will be subject tocustomary completion adjustments for net debt and net working capital.
► A further $500 million in aggregate will be payable as annual instalments of $100 million each over fiveyears following completion.
► Following completion of the Transaction, Rio Tinto will be entitled to a quarterly coal price linked Royaltycalculated as $2/t (subject to an annual Australian Consumer Price Index (“CPI”) adjustment) ofattributable saleable production, subject to certain excluded production. The Royalty will apply for aperiod of 10 years commencing on the third anniversary of completion of the Transaction, and is subjectto an overall cap of $650 million. This Royalty will only be payable if the Newcastle benchmark thermalcoal price exceeds $75/t (in 2017 dollars, subject to inflation).
► Earnings and cash flow generated by Coal & Allied between the date of announcement of theTransaction and the date of completion will continue for the benefit of Rio Tinto.
► Yancoal will assume an agreed base working capital value denominated in Australian dollars (“A$”) forCoal & Allied of negative A$161 million (that is, a net payable position) with customary completionadjustments for variances and any net debt incurred by Coal & Allied between announcement andcompletion.
► There is a potential adjustment to the Consideration whereby Rio Tinto would be required to refund aportion of the Consideration if certain approvals were not obtained.
23
For
per
sona
l use
onl
y
7
► Yancoal will assume Rio Tinto’s coal supply obligations in relation to certain coal supply contracts andwill use Rio Tinto Marine’s freight services for the sea freight component of certain coal supplyagreements.
► As part of Coal & Allied’s joint venture agreement with Mitsubishi Development Pty Ltd (“Mitsubishi”)for HVO, Mitsubishi has tag-along rights that are triggered by the Transaction. If Mitsubishi exercisesthis right, Yancoal must make a tag-along offer to Mitsubishi to acquire its respective 32.4% interest inHVO. Yancoal is currently in discussions with Mitsubishi with regards to this.
The Rio Tinto Board of Directors has unanimously recommended that the Non-Associated Shareholders, in theabsence of a superior proposal, vote in favour of the Transaction and have stated that each member of theBoard who beneficially holds Rio Tinto shares intends to do so in regards to their own beneficial holdings.
1.4 Conditions precedentCompletion of the Transaction is subject to a number of conditions including, amongst other matters:
► Shareholder approval, including approvals by the shareholders of Yanzhou Coal Mining CompanyLimited (“Yanzhou”, the parent company of Yancoal), and shareholders of Rio Tinto Plc and Rio TintoLimited who are not associated with Yancoal.
► Receipt by Yancoal of approval from the Treasurer of Australia approving the Transaction underAustralia’s foreign investment approval legislation.
► Outbound approvals by four separate agencies within the People’s Republic of China.
► Offshore merger clearances by the Korea Fair Trade Commission and the Anti Monopoly Bureau ofMinistry of Commerce of the People’s Republic of China.
► Approval by the Minister responsible for the Mining Act 1992 (NSW).
► Consent by BLCP Power Limited (“BLCP”), a Thai power generator, to the novation of all rights andobligations of Rio Tinto under its long term coal supply agreement with Rio Tinto to Yancoal (oralternative supply arrangements having been established).
We note that a termination fee of $23.5 million will be payable by Yancoal to Rio Tinto in certain circumstances.
1.5 Funding the TransactionYancoal intends to fund the Transaction through a capital raising and pro-rata renounceable rights issue ofordinary shares.
Yanzhou has indicated that it intends to subscribe for approximately $1 billion of its entitlement in the Yancoalcapital raising1. At the time of the announcement of the Transaction, Yancoal was in discussions withunderwriters and third-party investors to underwrite the balance of the capital raising.
1 Yancoal ASX announcement dated 24 January 2017.
24
For
per
sona
l use
onl
y
8
2. Scope of the independent expert’s report2.1 Purpose of the reportOne of the conditions precedent to the Transaction is the approval by the Non-Associated Shareholders. Thisshareholder approval is subject to the ASX Listing Rules, in particular Listing Rule 10.1.
We understand that, as a result of the shareholding levels of various Chinese State-owned entities in each ofYangkuang Group Company Limited (“Yangkuang”, the parent company of Yanzhou) and Chinalco (AluminiumCorporation of China), and Chinalco being a 10.1% shareholder in Rio Tinto, Yancoal is considered to be arelated party of Rio Tinto for the purposes of the UK Listing Rules and ASX Listing Rules. As such, the Noticeof Meeting for Shareholder approval of the Transaction must include an IER.
In accordance with ASX Listing Rule 10.10.2, the IER is required to state whether the Transaction is fair andreasonable to the Non-Associated Shareholders of Rio Tinto Limited.
Rio Tinto Limited, through its subsidiary Rio Tinto Coal NSW Holdings Limited, has engaged EY TransactionAdvisory Services to prepare this IER to be provided to the Non-Associated Shareholders as part of the Noticeof Meeting.
2.2 Basis of evaluationNeither the Corporations Act 2001 nor the ASX Listing Rules define the term “fair and reasonable”. RG 111provides some guidance as to how the term “fair and reasonable” should be interpreted in a range ofcircumstances. With respect to a related party transaction this RG 111 provides:
► An offer is “fair” if the value of the “financial benefit to be provided by the entity to the related party isequal to or less than the value of the consideration being provided to the entity”.
► An offer is “reasonable” if it is fair. It might also be “reasonable” if, despite being “not fair”, the expertbelieves that there are sufficient reasons for security holders to vote for the proposal.
Accordingly, the key component of the assessment as to whether or not the Transaction is fair and reasonableis the comparison of the fair value of Coal & Allied, underpinned by the value of HVO and MTW, with the fairvalue of the Consideration and Royalty being offered.
RG 111.62 sets out certain factors which an expert might consider when deciding whether a Transaction is“reasonable”. These factors include:
► The financial situation and solvency of the entity, including the factors set out in RG 111.26, if theconsideration for the financial benefit is cash
► Opportunity costs
► The alternative options available to the entity and the likelihood of those options occurring
► The entity’s bargaining position
► Whether there is selective treatment of any security holder, particularly the related party
► Any special value of the transaction to the purchaser, such as particular technology or the potential towrite off outstanding loans from the target
► The liquidity of the market in the entity’s securities.
Our consideration of other factors has been based on those factors suggested in RG 111, as well as the specificcircumstances of the Transaction.
25
For
per
sona
l use
onl
y

9
In undertaking our assessment of the Transaction, we have had regard to a number of references includingAustralian Securities and Investment Commission regulatory guidelines, in particular, RG 111 and RG 112:Independence of experts (“RG 112”), and relevant market valuation guidelines and generally accepted practicesin the preparation of expert reports. We have also had regard to the Code for the technical assessment andvaluation of mineral and petroleum assets and securities for independent expert reports (the “VALMIN Code”).This report has also been prepared in accordance with APES 225 Valuation Services issued by the AccountingProfessional & Ethical Standards Board Limited in July 2008 (revised December 2015).
A glossary summarising the abbreviations we have used in this report is contained in Appendix H.
2.3 Fair valueWe have assessed the value of Coal & Allied on a 100% controlling interest basis and the Consideration andRoyalty on a fair value basis. Fair value in this context is considered to be:
“the price at which an asset could be exchanged between a knowledgeable and willing but not anxious sellerand a knowledgeable and willing but not anxious buyer both acting at arm’s length”.
Fair value does not incorporate any special value. Special value is the additional value that may accrue to aparticular purchaser. In a competitive bidding situation, potential purchasers may be prepared to pay part, or all,of the special value that they expect to realise from the acquisition to the seller.
2.4 IndependencePrior to accepting this engagement, we considered our independence with respect to Rio Tinto and Yancoal withreference to RG 112. In our opinion, we are independent of Rio Tinto and Yancoal.
EY Transaction Advisory Services, Ernst & Young, and global affiliations, have not provided any services to RioTinto or Yancoal in relation to the Transaction.
EY Transaction Advisory Services, Ernst & Young, and global affiliations have previously provided professionalservices to both Rio Tinto and Yancoal, and subsidiaries thereof. These services included the provision of taxand valuation advice in respect of matters not related to the Transaction. We do not consider these services tocompromise our independence.
2.5 Limitations and reliance on information and technical expertsWe have considered a number of sources of information in preparing our report and arriving at our opinion.These sources of information are detailed in Appendix G.
In particular, in considering the fair value of Coal & Allied we have relied on the independent technical reportprepared by AMC Consultants Pty Ltd (“AMC”) (the “AMC Report”), who was appointed by Rio Tinto as theindependent technical expert to, on our instruction, undertake a technical assessment of the production andexploration assets of Coal & Allied. A copy of the AMC Report is attached in full at Appendix I and should beread in conjunction with our report.
As per our letter of instruction to AMC dated 16 February 2017, AMC was instructed to consider the following:
► Relevant data and reports with respect to Coal & Allied’s underlying production assets (i.e. HVO andMTW).
► The technical geophysical, geological and engineering data, JORC resources, development and drillingplans and production profiles for each mine.
26
For
per
sona
l use
onl
y

10
► The reasonableness of the technical and operational assumptions upon which the supplied models arebased, including the reserves and contingent resources, production life, operating costs, capital costsand any other technical input viewed as necessary to conclude on the reasonableness of the operatingassumptions.
► Assess the coal quality of the operating mines and consider a combined blend.
► Prepare valuations of Coal & Allied’s other undeveloped resources and exploration interests.
In placing reliance on the AMC Report, we have satisfied ourselves as to AMC’s competence, expertise andindependence. We are also satisfied that the assumptions, methodologies and source data used by AMC arereasonable and appropriate and that the report contains sufficient information to support the conclusions drawn.
The information provided to us for the preparation of our report has been evaluated through analysis, enquiryand review for the purposes of forming an opinion as to whether the Transaction is fair and reasonable to theNon-Associated Shareholders. We also held discussions with management of both Rio Tinto and Coal & Alliedin relation to the Transaction, as well as the operations, financial position and operating results of Coal & Allied.However, we do not warrant that our enquiries have identified all of the matters that an audit, an extensiveexamination or tax investigation might disclose.
Preparation of this report, and inclusion of the Coal & Allied financial statements as an appendix to our report,does not imply that we have, in any way, audited the accounts or records of Rio Tinto, or Coal & Allied. It isunderstood that the accounting information that was provided was prepared in accordance with generallyaccepted accounting principles including the Australian equivalents to International Financial ReportingStandards and International Financial Reporting Standards, as applicable.
In forming our opinion we have also assumed that:
► Matters such as title, compliance with laws and regulations and contracts in place are in good standingand will remain so and that there are no material legal proceedings, other than as publicly disclosed
► The assessments by Rio Tinto and its advisers with regard to legal, regulatory, tax and accountingmatters relating to the transaction are complete and accurate
► The information set out in the Notice of Meeting and accompanying documents to the Non-AssociatedShareholders is complete, accurate and fairly presented in all material respects
► The publicly available information relied upon by us in our analysis was accurate and not misleading
► The Transaction will be implemented in accordance with its terms outlined in the SPA
► To the extent that there are legal issues relating to assets, properties, or business interests or issuesrelating to compliance with applicable laws, regulations and policies, we assume no responsibility andoffer no legal opinion or interpretation on any issue.
The statements and opinions given in this IER are given in good faith and in the belief that such statements andopinions are not false or misleading. This report should be read in the context of the full qualifications, limitationsand consents set out in Appendix A.
Our assessment of the Transaction is based on economic, market and other conditions prevailing as at the dateof this IER. As evidenced in recent years these conditions can change significantly over relatively short periodsof time. If they did change materially, subsequent to the date of this report, our opinion could be different.
We provided draft copies of this independent expert’s report to the Directors and management of Rio Tinto forcomments as to factual accuracy, as opposed to opinions, which are the responsibility of us alone. Amendmentsmade to this IER as a result of this review by the Directors and management of Rio Tinto have not changed theconclusions reached.
27
For
per
sona
l use
onl
y
11
2.6 Shareholders’ decisionsThis IER constitutes general financial product advice only. In forming our opinion, we have considered theinterests of the Non-Associated Shareholders as a whole, and we have not considered, nor is it practical orpossible to consider, the individual circumstances of each Non-Associated Shareholder. The decision to votefor or against the Transaction is a matter for individual shareholders. The Non-Associated Shareholders shouldconsider the advice in the context of their own circumstances, including investment objectives, liquiditypreferences, risk profiles, tax position and expectations of future market conditions. Non-AssociatedShareholders should also have regard to the Notice of Meeting prepared by the Directors and management ofRio Tinto. Non-Associated Shareholders who are in doubt as to the action they should take in relation to theTransaction should consult their own professional adviser.
Similarly, it is a matter for individual shareholders as to whether to buy, hold or sell shares in Rio Tinto or Yancoal.This is an investment decision upon which we do not offer an opinion and is independent of a decision to votefor or against the Transaction. Shareholders should consult their own professional adviser in this regard.
EY Transaction Advisory Services has prepared a Financial Services Guide in accordance with the CorporationsAct 2001. The Financial Services Guide is included as Part 2 of this report.
28
For
per
sona
l use
onl
y
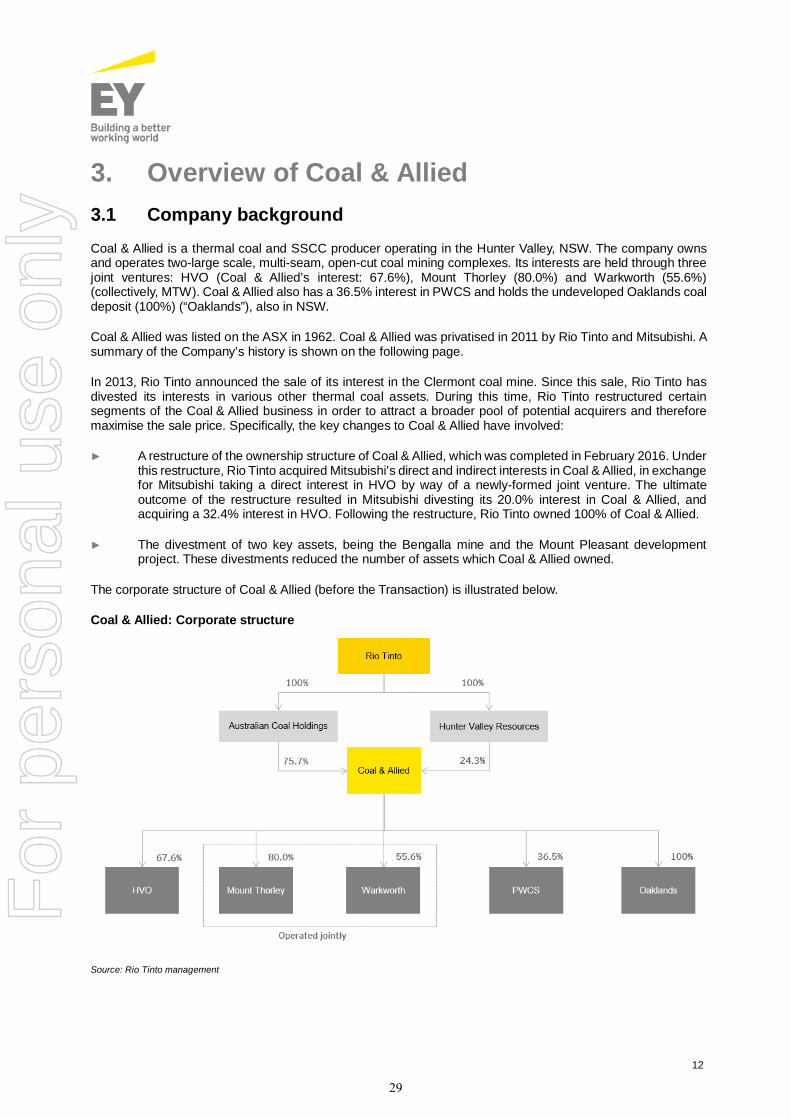
12
3. Overview of Coal & Allied3.1 Company backgroundCoal & Allied is a thermal coal and SSCC producer operating in the Hunter Valley, NSW. The company ownsand operates two-large scale, multi-seam, open-cut coal mining complexes. Its interests are held through threejoint ventures: HVO (Coal & Allied’s interest: 67.6%), Mount Thorley (80.0%) and Warkworth (55.6%)(collectively, MTW). Coal & Allied also has a 36.5% interest in PWCS and holds the undeveloped Oaklands coaldeposit (100%) (“Oaklands”), also in NSW.
Coal & Allied was listed on the ASX in 1962. Coal & Allied was privatised in 2011 by Rio Tinto and Mitsubishi. Asummary of the Company’s history is shown on the following page.
In 2013, Rio Tinto announced the sale of its interest in the Clermont coal mine. Since this sale, Rio Tinto hasdivested its interests in various other thermal coal assets. During this time, Rio Tinto restructured certainsegments of the Coal & Allied business in order to attract a broader pool of potential acquirers and thereforemaximise the sale price. Specifically, the key changes to Coal & Allied have involved:
► A restructure of the ownership structure of Coal & Allied, which was completed in February 2016. Underthis restructure, Rio Tinto acquired Mitsubishi’s direct and indirect interests in Coal & Allied, in exchangefor Mitsubishi taking a direct interest in HVO by way of a newly-formed joint venture. The ultimateoutcome of the restructure resulted in Mitsubishi divesting its 20.0% interest in Coal & Allied, andacquiring a 32.4% interest in HVO. Following the restructure, Rio Tinto owned 100% of Coal & Allied.
► The divestment of two key assets, being the Bengalla mine and the Mount Pleasant developmentproject. These divestments reduced the number of assets which Coal & Allied owned.
The corporate structure of Coal & Allied (before the Transaction) is illustrated below.
Coal & Allied: Corporate structure
Source: Rio Tinto management
29
For
per
sona
l use
onl
y
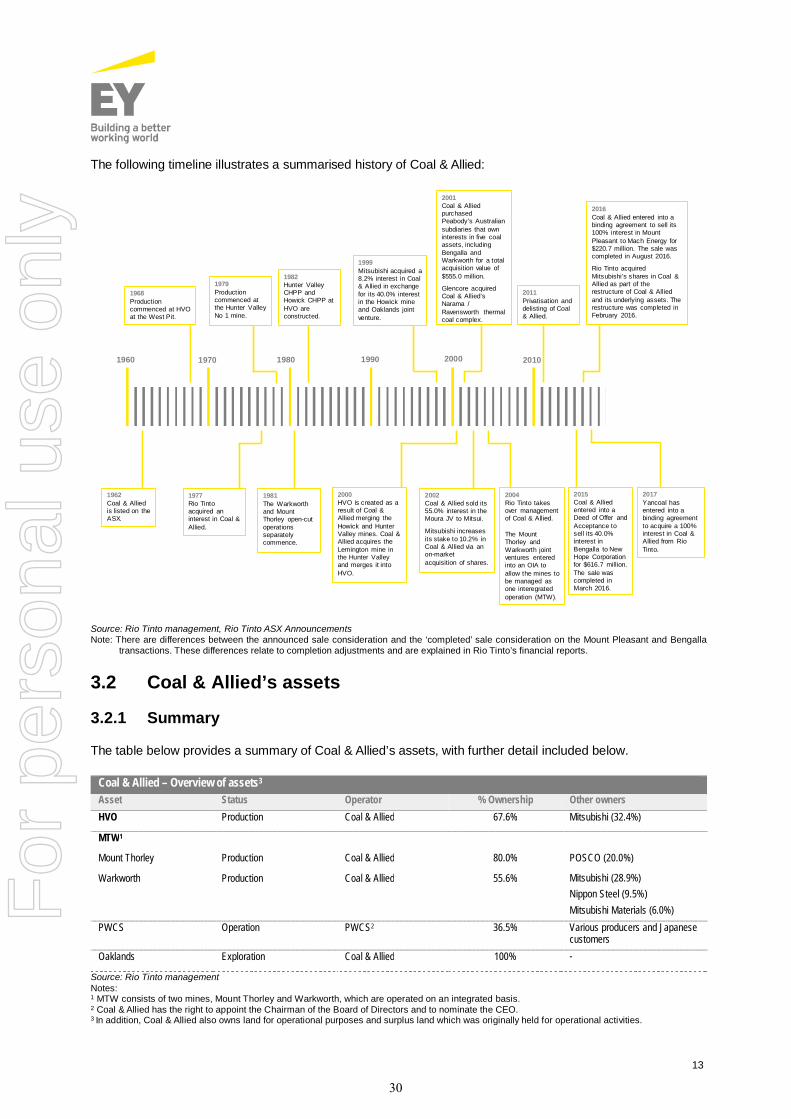
13
The following timeline illustrates a summarised history of Coal & Allied:
Source: Rio Tinto management, Rio Tinto ASX AnnouncementsNote: There are differences between the announced sale consideration and the ‘completed’ sale consideration on the Mount Pleasant and Bengalla
transactions. These differences relate to completion adjustments and are explained in Rio Tinto’s financial reports.
3.2 Coal & Allied’s assets
3.2.1 Summary
The table below provides a summary of Coal & Allied’s assets, with further detail included below.
Source: Rio Tinto managementNotes:1 MTW consists of two mines, Mount Thorley and Warkworth, which are operated on an integrated basis.2 Coal & Allied has the right to appoint the Chairman of the Board of Directors and to nominate the CEO.3 In addition, Coal & Allied also owns land for operational purposes and surplus land which was originally held for operational activities.
1960 1970 1990 2000 2010 2020
1962Coal & Alliedis listed on theASX.
1968Productioncommenced at HVOat the West Pit.
1977Rio Tintoacquired aninterest in Coal &Allied.
1979Productioncommenced atthe Hunter ValleyNo 1 mine.
1981The Warkworthand MountThorley open-cutoperationsseparatelycommence.
2001Coal & AlliedpurchasedPeabody’s Australiansubdiaries that owninterests in five coalassets, includingBengalla andWarkworth for a totalacquisition value of$555.0 million.
Glencore acquiredCoal & Allied’sNarama /Ravensworth thermalcoal complex.
2000HVO is created as aresult of Coal &Allied merging theHowick and HunterValley mines. Coal &Allied acquires theLemington mine inthe Hunter Valleyand merges it intoHVO.
1999Mitsubishi acquired a8.2% interest in Coal& Allied in exchangefor its 40.0% interestin the Howick mineand Oaklands jointventure.
2002Coal & Allied sold its55.0% interest in theMoura JV to Mitsui.
Mitsubishi increasesits stake to 10.2% inCoal & Allied via anon-marketacquisition of shares.
2004Rio Tinto takesover managementof Coal & Allied.
The MountThorley andWarkworth jointventures enteredinto an OIA toallow the mines tobe managed asone interegratedoperation (MTW).
2011Privatisation anddelisting of Coal& Allied.
2015Coal & Alliedentered into aDeed of Offer andAcceptance tosell its 40.0%interest inBengalla to NewHope Corporationfor $616.7 million.The sale wascompleted inMarch 2016.
2016Coal & Allied entered into abinding agreement to sell its100% interest in MountPleasant to Mach Energy for$220.7 million. The sale wascompleted in August 2016.
Rio Tinto acquiredMitsubishi’s shares in Coal &Allied as part of therestructure of Coal & Alliedand its underlying assets. Therestructure was completed inFebruary 2016.
1980
1982Hunter ValleyCHPP andHowick CHPP atHVO areconstructed.
2017Yancoal hasentered into abinding agreementto acquire a 100%interest in Coal &Allied from RioTinto.
Coal & Allied – Overview of assets3
Asset Status Operator % Ownership Other ownersHVO Production Coal & Allied 67.6% Mitsubishi (32.4%)
MTW1
Mount Thorley Production Coal & Allied 80.0% POSCO (20.0%)
Warkworth Production Coal & Allied 55.6% Mitsubishi (28.9%)Nippon Steel (9.5%)Mitsubishi Materials (6.0%)
PWCS Operation PWCS2 36.5% Various producers and Japanesecustomers
Oaklands Exploration Coal & Allied 100% -
30
For
per
sona
l use
onl
y
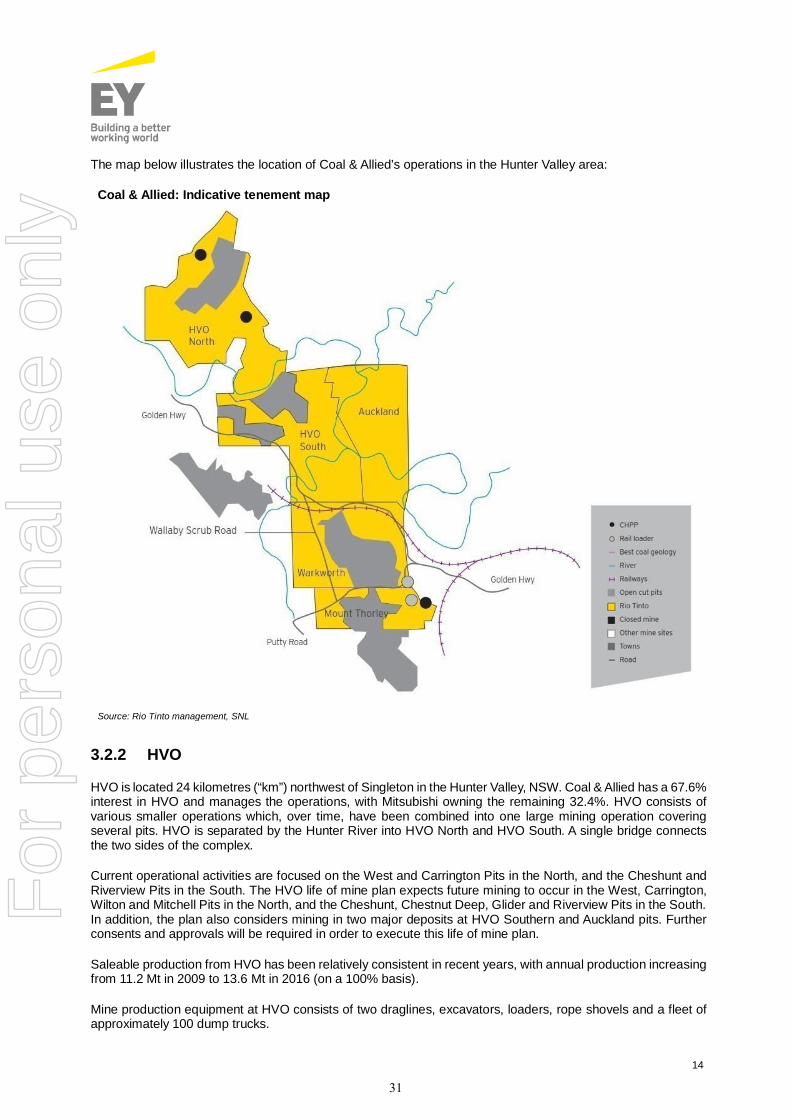
14
The map below illustrates the location of Coal & Allied’s operations in the Hunter Valley area:
Coal & Allied: Indicative tenement map
Source: Rio Tinto management, SNL
3.2.2 HVO
HVO is located 24 kilometres (“km”) northwest of Singleton in the Hunter Valley, NSW. Coal & Allied has a 67.6%interest in HVO and manages the operations, with Mitsubishi owning the remaining 32.4%. HVO consists ofvarious smaller operations which, over time, have been combined into one large mining operation coveringseveral pits. HVO is separated by the Hunter River into HVO North and HVO South. A single bridge connectsthe two sides of the complex.
Current operational activities are focused on the West and Carrington Pits in the North, and the Cheshunt andRiverview Pits in the South. The HVO life of mine plan expects future mining to occur in the West, Carrington,Wilton and Mitchell Pits in the North, and the Cheshunt, Chestnut Deep, Glider and Riverview Pits in the South.In addition, the plan also considers mining in two major deposits at HVO Southern and Auckland pits. Furtherconsents and approvals will be required in order to execute this life of mine plan.
Saleable production from HVO has been relatively consistent in recent years, with annual production increasingfrom 11.2 Mt in 2009 to 13.6 Mt in 2016 (on a 100% basis).
Mine production equipment at HVO consists of two draglines, excavators, loaders, rope shovels and a fleet ofapproximately 100 dump trucks.
31
For
per
sona
l use
onl
y

15
3.2.2.1 InfrastructureAt HVO North there are two coal handling and preparation plants (“CHPP”): the Hunter Valley CHPP and theHowick CHPP. Both plants were commissioned, separately, in 1982: the Hunter Valley CHPP has capacity toprocess 20 million tonnes per annum (“Mtpa”) ROM coal, whilst the Howick CHPP has capacity to process6 Mtpa of ROM coal. ROM coal from HVO South is trucked to HVO North in order to be processed at the HunterValley CHPP. HVO is authorised to truck 16 Mtpa from HVO South to HVO North. HVO also has approval tooperate the Newdell CHPP, however this plant is not operational and the site is solely used for coal handling.
There are two rail loading facilities which service HVO’s CHPP’s. The Hunter Valley Loading Point services theHunter Valley CHPP. The Newdell Loading Point receives export coal from the Howick CHPP and overflow fromthe Hunter Valley CHPP via conveyor, which provides additional live stockpile capacity. The Hunter ValleyLoading Point has a total stockpile capacity of 297 kt on two product stockpiles with 20 kt of additional sidecaststorage. The Newdell Loading Point has a 600 kt stockpile capacity on a single product stockpile.
There are three workshop facilities at HVO. The primary workshop is located at the former Hunter Valley No.1,which manages the majority of the truck and mobile equipment fleet.
3.2.2.2 ApprovalsHVO is subject to several approvals and licenses which provide the regulatory basis under which the mineoperates. Most of these approvals were obtained separately for HVO North and HVO South, with separateintegration approvals providing the ability to move material and equipment around the HVO complex.
Development consents at HVO were granted on 12 June 2004 (HVO North) and 24 March 2009 (HVO South),and are effective until 2025 and 2035, respectively. Both consents have been modified, separately, on fouroccasions. Coal & Allied is in the process of obtaining a fifth modification to the HVO South consent, seeking,among other things, an increase to the ROM coal extraction limit from 16 Mtpa to 20 Mtpa.
HVO operates under a single Environmental Protection Licence (“EPL”), EPL 640. Other licences and approvalsinclude licences in relation to water and tailings management. Water is mainly consumed for dust suppressionon haul roads, mining areas and coal stockpiles and coal processing plant circuit losses. HVO is not connectedto the Singleton Shire town water supply and has an active water management strategy for surface andsubsurface water. HVO has permission to use water from the Hunter River, and to discharge water back intothe river, subject to stringent requirements regarding water quality. Most of HVO’s water requirements are metthrough water harvested on site.
3.2.3 MTW
MTW is located approximately 75 km northwest of Newcastle and 14 km southwest of Singleton. Coal & Alliedhas an 80.0% interest in Mount Thorley with the remaining 20.0% owned by POSCO. Coal & Allied has a 55.6%interest in Warkworth with the other joint venture partners being Mitsubishi (28.9%), Nippon Steel (9.5%) andMitsubishi Materials (6.0%).
In 2004, the Mount Thorley and Warkworth joint ventures entered into an Operational Integration Agreement(“OIA”) to allow for the two mines to be managed as one integrated operation in order to improve efficiency.Under this agreement, export coal can be produced by either mine and is allocated between the two jointventures based on a tonnage commitment ratio set in 2004 and then subsequently agreed upon annually. Costsare also allocated in accordance with this ratio. The tonnage commitment ratio has been Warkworth (65.0%)and Mount Thorley (35.0%) since entering the OIA, and as a result Coal & Allied receives a total of 64.1% oftotal production from the combined MTW operation. The marketing and sale of the respective tonnages is theresponsibility of each of the joint venture pursuant to agreed marketing and sales arrangements.
The MTW life of mine plan consists of mining of the North Pit, West Pit, South Pit, CD Pit, Thorley Pit (LodersPit) and Abbey Green South. Mining at MTW is initially focused on West Pit, North Pit and Thorley Pit, withfuture mining at Warkworth concentrated on the North Pit and West pit areas. Since 2007, MTW has beenimplementing a growth strategy with a steady ramp up saleable production of 8.5 Mtpa in 2009 to 12.3 Mtpa by2016.
32
For
per
sona
l use
onl
y
16
Mine production equipment at MTW consists of three draglines, excavators, loaders, rope shovels and a fleetof dump trucks.
3.2.3.1 InfrastructureMTW operates two CHPP’s referred to as North CHPP and South CHPP. These CHPPs have a total combinedcapacity of 19 Mtpa ROM and produce 12 Mtpa to 14 Mtpa of saleable production. The North CHPP (atWarkworth) is a single product washing operation, whereas the South CHPP (located at Mount Thorley) iscapable of being a two-product washing operation.
The coal for export produced at the North CHPP and South CHPP is loaded at the Warkworth and Mount Thorleyrail load out facilities and railed approximately 82 km to Newcastle. The Mount Thorley rail load out facility is amulti-user facility but currently only used by MTW.
3.2.3.2 ApprovalsCurrently MTW operations are authorised under several development consents or project approvals as modifiedand issued under the Environmental Planning and Assessment Act 1979 (NSW) (“EPA Act”). Open-cut miningactivities within the mining lease east of the Wallaby Scrub Road have been authorised by the 2003Development Warkworth Consent to produce 18 Mtpa ROM until 2021.
In 2012, MTW received development consent for the extension of open-cut mining activities in the SaddlebackRidge and to the west of the Wallaby Scrub Road (which runs across the Warkworth mining tenements). The2012 development consent provided for production to be maintained at a level of 18 Mtpa ROM until 2032,which extends the production for a further 11 years from the existing 2003 development consent. The 2012development consent was later appealed by Bulga Milbrodale Progress Association Inc., which resulted in theoverturning of the NSW Government’s original decision to approve the expansion.
On 27 November 2015, MTW was granted final approval for new development consents by the NSW StateGovernment, through its delegate the Planning Assessment Commission. This approval permitted MTW tocontinue open-cut mining at the complex for a further 21 years.
In late 2016, Coal & Allied submitted its seventh application to the Singleton Council to request the approval ofthe closure of the Wallaby Scrub Road in order to progress mining at MTW in accordance with the developmentconsent. In early January 2017, the Singleton Council announced it would consider this request due to the minebeing essential to a significant number of workers and their families who rely on the employment the mineprovides. On 20 February 2017, the Singleton Council voted to commence the process of closing Wallaby ScrubRoad and the community consultation processes started in March.
In addition to the development consents, MTW operates under three EPLs and various water and tailingsmanagement approvals. MTW is licensed to discharge excess mine water in the Hunter River in accordancewith stringent local requirements. The relatively small size of the site means that water management is a keyfocus at MTW. Coal & Allied has sought to manage this by allowing sharing and trading of water from HVO.
3.2.4 Port and rail utilisation
Coal & Allied’s port capacity is underpinned by 10-year rolling take-or-pay contracts with both PWCS andNewcastle Coal Infrastructure Group (“NCIG”). Coal & Allied has a total port capacity of approximately 23 Mtpaat PWCS and of 5 Mtpa at NCIG. The total average saleable production between 2017 and 2025 from HVO andMTW that is shipped from PWCS is forecast to be 22 Mtpa and from NCIG is 2.7 Mtpa.
Coal & Allied’s above-rail capacity of 26 Mtpa is provided by Pacific National. Coal & Allied has a contract withPacific National that expires in 2021, but can be extended at Coal & Allied’s election for an additional five years.Coal & Allied’s below-rail access is underpinned by a contract with Australia Rail Track Corporation (“ARTC”),which is renewable annually and is aligned to contracted port volume. In December 2016, Coal & Allied issueda ramp-down notice to Pacific National whereby the above-rail capacity will reduce to 19.7 Mtpa from 2019. Thisalso had the effect of extending the Pacific National agreement into 2022 at a rate of 11.7 Mtpa in the final year.
33
For
per
sona
l use
onl
y
17
Coal & Allied previously held 8 Mtpa of port and below rail capacity which was allocated to the Mount Pleasantproject. 4 Mtpa of port capacity at PWCS and the 8 Mtpa below rail capacity has been subsequently assignedto Mach Energy Australia Pty Ltd (“Mach Energy”) through the divestment of the Mount Pleasant project in late2016. Through the divestment, Coal & Allied agreed to pay for this capacity until the earlier of ‘first coal’ fromthe Mount Pleasant project or 31 March 2018. The assignment of an additional 4 Mtpa of port capacity at theNCIG terminal is conditional on Mach Energy achieving ‘first coal’ shipped through this terminal. These rail andport take-or-pay capacity rights are surplus to the requirements of Coal & Allied’s remaining operations and, assuch, have been assessed to be onerous contracts until such time as the payment obligations for the capacityare assumed by Mach Energy.
3.2.5 Land holdings
Coal & Allied holds large areas of land for operational purposes at both HVO and MTW and also owns adjoiningland which are termed ‘Zone of Affectation’ lands (surrounding land which is affected by noise and dust pollutionfrom coal mines).
Coal & Allied also owns surplus land in the Lower Hunter region located in Newcastle, Lake Macquarie andNorthern Central Coast region of New South Wales. These sites were originally held for mining or operationalactivities, however are no longer required for these purposes. This land can be divested without impacting Coal& Allied’s mine plans.
3.2.6 PWCS interest
Coal & Allied’s production is exported through coal terminals at both PWCS and NCIG located at the Port ofNewcastle. Coal & Allied has a 36.5% interest in PWCS (made up of direct and indirect interests), which is oneof the largest coal handling operations in the world with total annual capacity of 145 Mtpa. PWCS is part of theHunter Valley Coal Chain (“HVCC”) which is one of the world’s largest collaborative coal supply chains in theworld.
In return for an interest in PWCS, shareholders such as Coal & Allied are entitled to the payment of a dividend.We note that dividend payments to Coal & Allied have remained consistent over the previous financial years.
Under the PWCS Constitution, Coal & Allied has the right to appoint the Chairman of the Board of Directors andto nominate two other directors. Coal & Allied is also entitled to nominate the Chief Executive Officer subject tothe approval of the PWCS Board of Directors.
PWCS reimburses Coal & Allied per quarter in arrears payable within 30 days of the end of each quarter inrecognition of the costs incurred by Coal & Allied. These costs incurred by Coal & Allied are associated with theemployment of the executives mentioned above and making them available to PWCS, and also for the provisionof any additional administrative support services.
3.2.7 Other assets
Oaklands is an undeveloped coal exploration project located in the South Riverina district of NSW. It has astated, JORC compliant resource of 1,270 Mt, comprised of 596 Mt of Measured Resources, 584 Mt of IndicatedResources, and 90 Mt of Inferred Resources.
Oaklands Coal Pty Ltd is 100% owned by Coal & Allied, and is primarily comprised of Assessment Lease 18(“AL18”) and the associated geological and mining information and records.
3.3 Rio Tinto’s divestment programIn recent years, a number of major global mining companies have embarked on portfolio rationalisationstrategies. This has included exiting non-core assets in order to focus on specific core assets. Although RioTinto has not formally announced an exit from thermal coal, since 2013 it has actively divested a number of itsAustralian and international thermal coal assets.
34
For
per
sona
l use
onl
y
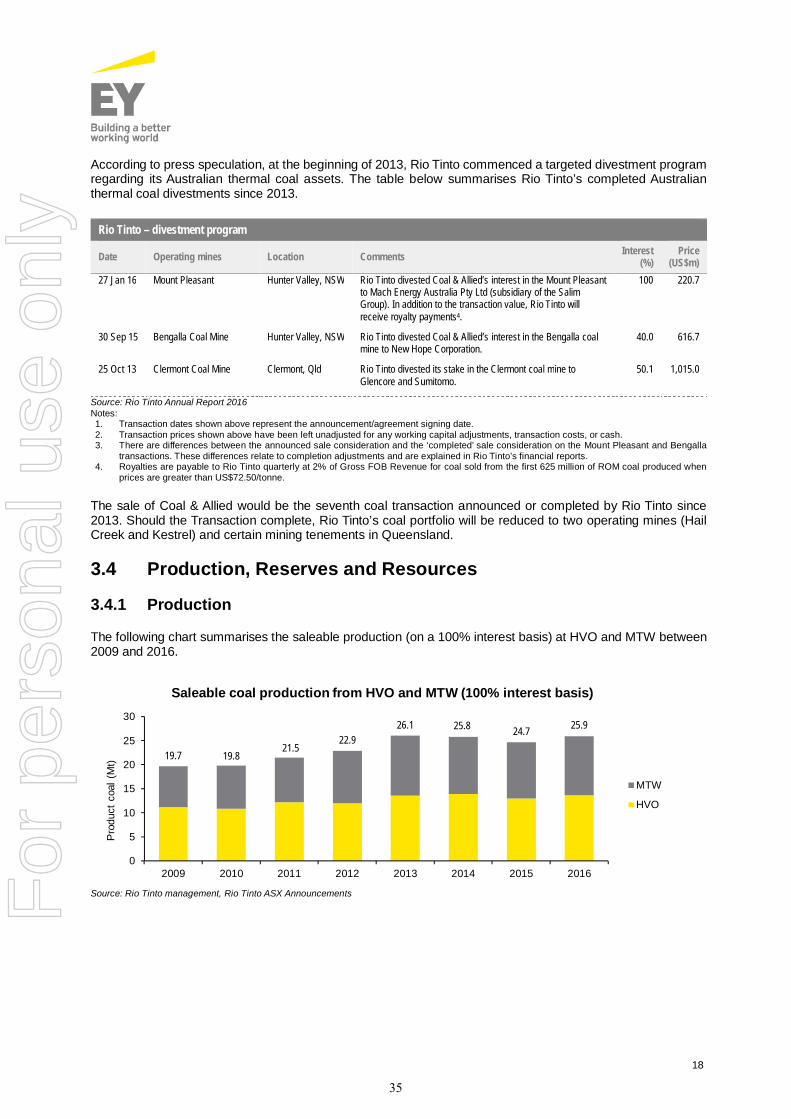
18
According to press speculation, at the beginning of 2013, Rio Tinto commenced a targeted divestment programregarding its Australian thermal coal assets. The table below summarises Rio Tinto’s completed Australianthermal coal divestments since 2013.
Source: Rio Tinto Annual Report 2016Notes:1. Transaction dates shown above represent the announcement/agreement signing date.2. Transaction prices shown above have been left unadjusted for any working capital adjustments, transaction costs, or cash.3. There are differences between the announced sale consideration and the ‘completed’ sale consideration on the Mount Pleasant and Bengalla
transactions. These differences relate to completion adjustments and are explained in Rio Tinto’s financial reports.4. Royalties are payable to Rio Tinto quarterly at 2% of Gross FOB Revenue for coal sold from the first 625 million of ROM coal produced when
prices are greater than US$72.50/tonne.
The sale of Coal & Allied would be the seventh coal transaction announced or completed by Rio Tinto since2013. Should the Transaction complete, Rio Tinto’s coal portfolio will be reduced to two operating mines (HailCreek and Kestrel) and certain mining tenements in Queensland.
3.4 Production, Reserves and Resources
3.4.1 Production
The following chart summarises the saleable production (on a 100% interest basis) at HVO and MTW between2009 and 2016.
Source: Rio Tinto management, Rio Tinto ASX Announcements
19.7 19.821.5
22.926.1 25.8 24.7 25.9
0
5
10
15
20
25
30
2009 2010 2011 2012 2013 2014 2015 2016
Prod
uctc
oal(
Mt)
Saleable coal production from HVO and MTW (100% interest basis)
MTW
HVO
Rio Tinto – divestment program
Date Operating mines Location Comments Interest(%)
Price(US$m)
27 Jan 16 Mount Pleasant Hunter Valley, NSW Rio Tinto divested Coal & Allied’s interest in the Mount Pleasantto Mach Energy Australia Pty Ltd (subsidiary of the SalimGroup). In addition to the transaction value, Rio Tinto willreceive royalty payments4.
100 220.7
30 Sep 15 Bengalla Coal Mine Hunter Valley, NSW Rio Tinto divested Coal & Allied’s interest in the Bengalla coalmine to New Hope Corporation.
40.0 616.7
25 Oct 13 Clermont Coal Mine Clermont, Qld Rio Tinto divested its stake in the Clermont coal mine toGlencore and Sumitomo.
50.1 1,015.0
35
For
per
sona
l use
onl
y
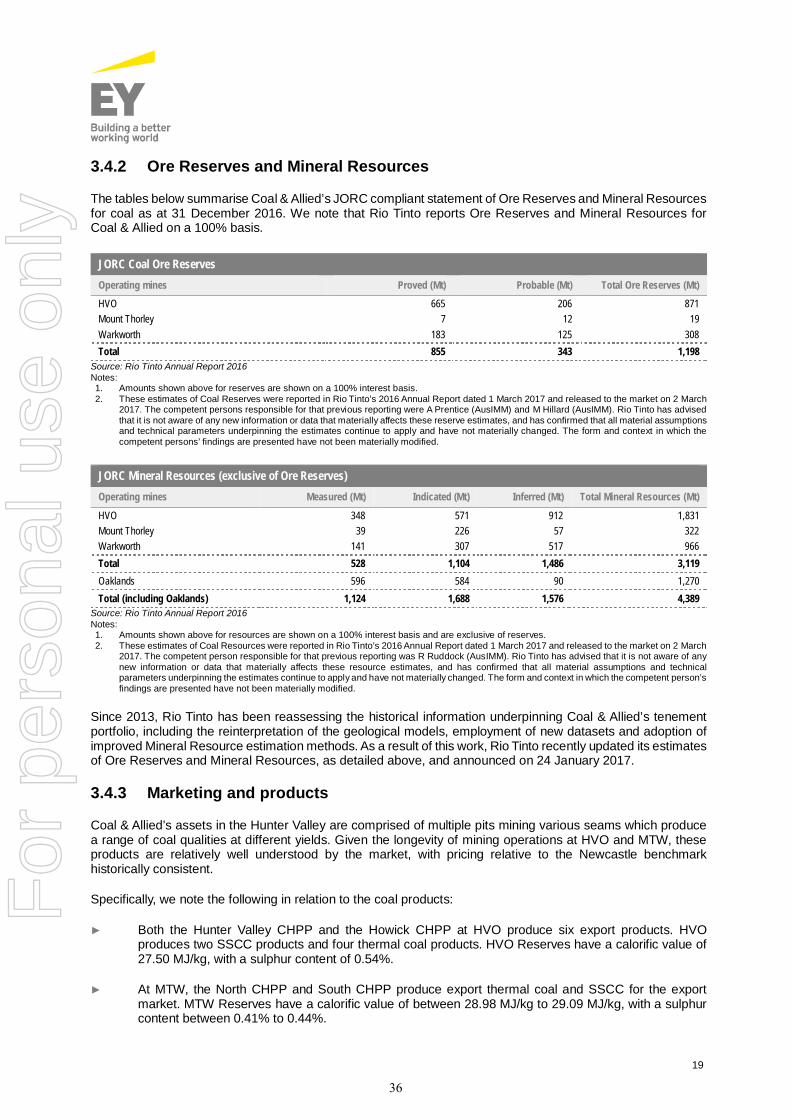
19
3.4.2 Ore Reserves and Mineral Resources
The tables below summarise Coal & Allied’s JORC compliant statement of Ore Reserves and Mineral Resourcesfor coal as at 31 December 2016. We note that Rio Tinto reports Ore Reserves and Mineral Resources forCoal & Allied on a 100% basis.
Source: Rio Tinto Annual Report 2016Notes:1. Amounts shown above for reserves are shown on a 100% interest basis.2. These estimates of Coal Reserves were reported in Rio Tinto’s 2016 Annual Report dated 1 March 2017 and released to the market on 2 March
2017. The competent persons responsible for that previous reporting were A Prentice (AusIMM) and M Hillard (AusIMM). Rio Tinto has advisedthat it is not aware of any new information or data that materially affects these reserve estimates, and has confirmed that all material assumptionsand technical parameters underpinning the estimates continue to apply and have not materially changed. The form and context in which thecompetent persons’ findings are presented have not been materially modified.
Source: Rio Tinto Annual Report 2016Notes:1. Amounts shown above for resources are shown on a 100% interest basis and are exclusive of reserves.2. These estimates of Coal Resources were reported in Rio Tinto’s 2016 Annual Report dated 1 March 2017 and released to the market on 2 March
2017. The competent person responsible for that previous reporting was R Ruddock (AusIMM). Rio Tinto has advised that it is not aware of anynew information or data that materially affects these resource estimates, and has confirmed that all material assumptions and technicalparameters underpinning the estimates continue to apply and have not materially changed. The form and context in which the competent person’sfindings are presented have not been materially modified.
Since 2013, Rio Tinto has been reassessing the historical information underpinning Coal & Allied’s tenementportfolio, including the reinterpretation of the geological models, employment of new datasets and adoption ofimproved Mineral Resource estimation methods. As a result of this work, Rio Tinto recently updated its estimatesof Ore Reserves and Mineral Resources, as detailed above, and announced on 24 January 2017.
3.4.3 Marketing and products
Coal & Allied’s assets in the Hunter Valley are comprised of multiple pits mining various seams which producea range of coal qualities at different yields. Given the longevity of mining operations at HVO and MTW, theseproducts are relatively well understood by the market, with pricing relative to the Newcastle benchmarkhistorically consistent.
Specifically, we note the following in relation to the coal products:
► Both the Hunter Valley CHPP and the Howick CHPP at HVO produce six export products. HVOproduces two SSCC products and four thermal coal products. HVO Reserves have a calorific value of27.50 MJ/kg, with a sulphur content of 0.54%.
► At MTW, the North CHPP and South CHPP produce export thermal coal and SSCC for the exportmarket. MTW Reserves have a calorific value of between 28.98 MJ/kg to 29.09 MJ/kg, with a sulphurcontent between 0.41% to 0.44%.
JORC Coal Ore ReservesOperating mines Proved (Mt) Probable (Mt) Total Ore Reserves (Mt)HVO 665 206 871Mount Thorley 7 12 19Warkworth 183 125 308Total 855 343 1,198
JORC Mineral Resources (exclusive of Ore Reserves)Operating mines Measured (Mt) Indicated (Mt) Inferred (Mt) Total Mineral Resources (Mt)
HVO 348 571 912 1,831Mount Thorley 39 226 57 322Warkworth 141 307 517 966Total 528 1,104 1,486 3,119Oaklands 596 584 90 1,270Total (including Oaklands) 1,124 1,688 1,576 4,389
36
For
per
sona
l use
onl
y

20
Different quality coals can be blended in order to achieve higher quality attributes which can be sold at higherprices. Coal & Allied’s products can be blended at port and sold as ‘Hunter Valley blend’, subject to the terms ofthe joint venture marketing agreements, which is sold at a similar price to the Newcastle benchmark.
3.5 Adjusted financial informationA summary of Coal & Allied’s financial information is presented below. The amounts represent the financialstatements of Coal & Allied, adjusted to exclude divested assets (Bengalla and Mount Pleasant) and to reflectthe restructured ownership interest (Coal & Allied’s share of HVO reduced to 67.6% from 100.0%)(“Carve-Out Adjustments”). The adjusted results are presented on a ‘like-for-like’ basis and are comparablebetween the three periods. The financial information presented below is limited to Coal & Allied and does notinclude other Rio Tinto group accounting for the coal supply agreement with BLCP.
The high level reconciliation between the General Purpose Financial Reports and the financials presented belowis summarised in Appendix K. The adjustments were prepared by Rio Tinto. EY Transaction Advisory Serviceshas relied on these amounts as presented by Rio Tinto and has not undertaken any procedures confirm theseamounts are correct. The General Purpose Financial Report for 2016 is included as Appendix J.
3.5.1 Adjusted financial performance
A summary of Coal & Allied’s financial performance for the last three years ended 31 December(“FY14”, “FY15” and “FY16”) adjusted for the Carve-Out Adjustments noted in section 3.5 is presented below.
Source: Coal & Allied audited general purpose financial statements for the year ended 31 December 2016, adjusted for the Carve-Out AdjustmentsNotes:1 Average realised coal price is calculated as the revenue for the year divided by the production for the year.2 Average total operating costs Free on Board (“FOB”) is calculated as the direct operating expense for the year divided by the production for the year.
In relation to the financial performance we note:
► Revenue increased by A$119.4 million in FY16 to A$1.6 billion as a result of a combination of higherrealised SSCC prices, higher volume at HVO and the weaker exchange rate which impacts sales madein US$ but presented in A$. In FY16, approximately 52% of revenue was attributable to the sale of coalfrom HVO, approximately 44% to the sale of coal from MTW and the remainder related to the sale ofpurchased coal, management fee income and interest revenue.
Coal & Allied – Adjusted consolidated income statement summaryA$m FY14 FY15 FY16
Revenue 1,529.2 1,521.3 1,640.7Operating expenses (1,254.5) (1,222.3) (1,149.8)Net gain / (loss) on disposal of property, plant and equipment 0.5 (1.8) 9.6Depreciation and amortisation expense (131.5) (130.8) (122.3)Exploration and evaluation (0.4) (0.5) -Sea freight and purchased coal (17.8) (28.9) (26.0)Net foreign exchange gains / (losses) 2.2 8.1 (1.5)Finance costs (28.0) (13.5) (5.9)Redbank termination fee (51.2) - -Share of profits after tax of equity accounted units 16.6 6.6 2.4Profit before income tax expense 65.0 138.2 347.1Income tax expense (48.4) (44.1) (100.3)Profit after income tax expense 16.6 94.1 246.8Profit attributable to Coal & Allied 16.0 93.1 246.2Profit attributable to non-controlling interests 0.6 1.0 0.6Annual saleable coal production (Mt) (Coal & Allied interest basis excluding Bengalla) 17.0 16.3 17.1Average realised coal price (A$/t)1 89.8 93.4 95.9Average total operating costs FOB (A$/t)2 73.7 75.0 67.2
37
For
per
sona
l use
onl
y

21
► The average realised coal price was A$95.9/t in FY16, representing an increase of approximately 2.7%from A$93.4/t in FY15.
► Operating expenses decreased by A$72.5 million in FY16 to A$1,149.8 million representing an averagetotal operating cost of A$67.2/t. Average operating expenses on a per tonne basis decreased byapproximately 10.5% from A$75.0/t in FY15 as a result of a decrease in raw materials and consumablesexpense and a reduction in employee benefits as a result of labour productivity initiatives at both mines.
► The Redbank termination fee of A$51.2 million in FY14 related to a contract with Australian power utilitywhich the Warkworth joint venture ended in 2014.
► Share of profits after tax of equity accounted units relates to Coal & Allied’s interest in PWCS. Coal &Allied’s share of profit from PWCS decreased over the period shown above as PWCS has reduced portcharges, with this reduction in port charges resulting in lower operating costs for Coal & Allied.
38
For
per
sona
l use
onl
y
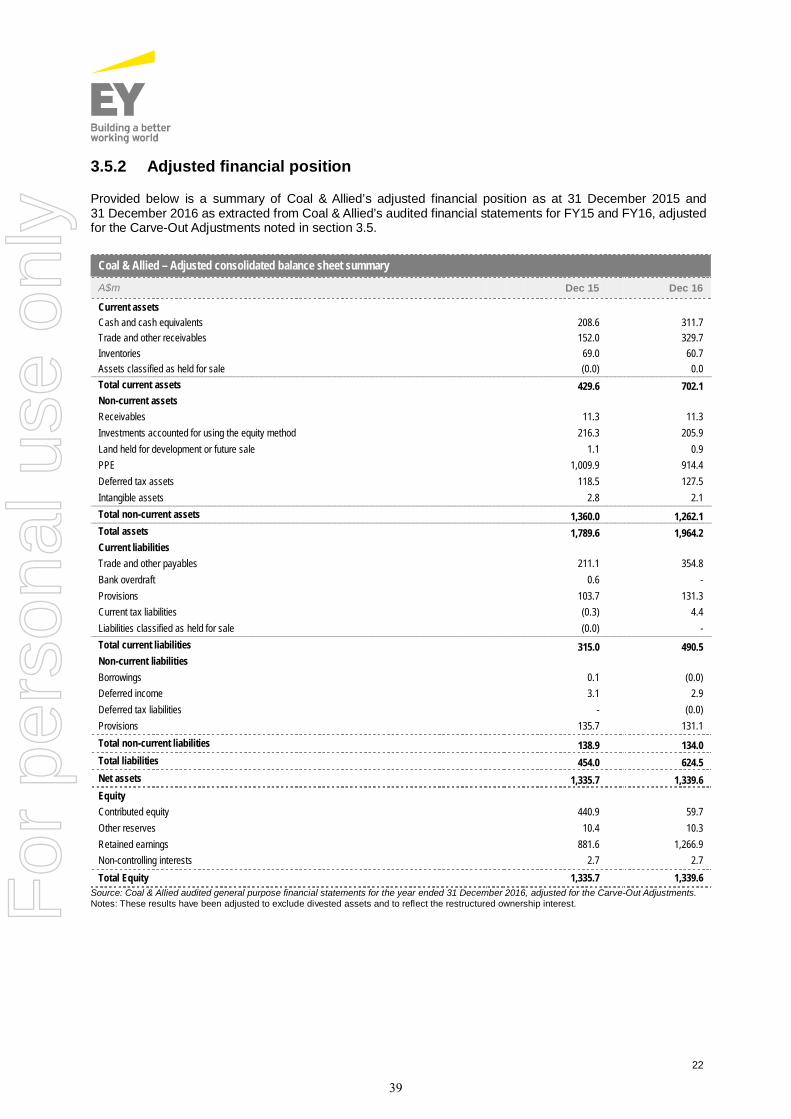
22
3.5.2 Adjusted financial position
Provided below is a summary of Coal & Allied’s adjusted financial position as at 31 December 2015 and31 December 2016 as extracted from Coal & Allied’s audited financial statements for FY15 and FY16, adjustedfor the Carve-Out Adjustments noted in section 3.5.
Source: Coal & Allied audited general purpose financial statements for the year ended 31 December 2016, adjusted for the Carve-Out Adjustments.Notes: These results have been adjusted to exclude divested assets and to reflect the restructured ownership interest.
Coal & Allied – Adjusted consolidated balance sheet summary
A$m Dec 15 Dec 16
Current assetsCash and cash equivalents 208.6 311.7Trade and other receivables 152.0 329.7Inventories 69.0 60.7Assets classified as held for sale (0.0) 0.0Total current assets 429.6 702.1Non-current assetsReceivables 11.3 11.3Investments accounted for using the equity method 216.3 205.9Land held for development or future sale 1.1 0.9PPE 1,009.9 914.4Deferred tax assets 118.5 127.5Intangible assets 2.8 2.1Total non-current assets 1,360.0 1,262.1Total assets 1,789.6 1,964.2Current liabilitiesTrade and other payables 211.1 354.8Bank overdraft 0.6 -Provisions 103.7 131.3Current tax liabilities (0.3) 4.4Liabilities classified as held for sale (0.0) -Total current liabilities 315.0 490.5Non-current liabilitiesBorrowings 0.1 (0.0)Deferred income 3.1 2.9Deferred tax liabilities - (0.0)Provisions 135.7 131.1Total non-current liabilities 138.9 134.0Total liabilities 454.0 624.5Net assets 1,335.7 1,339.6EquityContributed equity 440.9 59.7Other reserves 10.4 10.3Retained earnings 881.6 1,266.9Non-controlling interests 2.7 2.7Total Equity 1,335.7 1,339.6
39
For
per
sona
l use
onl
y
23
In relation to the financial position we note:
► Cash and equivalents balances increased by A$103.1 million to A$311.7 million in FY16. We note theConsideration will be adjusted for net debt and working capital adjustments. Yancoal will acquireCoal & Allied with a sufficient level of cash to meet minimum working capital requirements at the timeof completion. As such, it is intended that any cash balance deemed to be surplus to manage minimumworking capital requirements at the time of completion of the Transaction will be paid out as a dividendto Rio Tinto prior to completion of the Transaction.
► Trade and other receivables increased by A$177.7 million to A$329.7 million in FY16 as a result highersales prices from the previous year and the timing of receipts. Trade and other receivables also consistsof amounts due from related parties, other receivables and prepayments (related to rates, levy andmining tenements and insurance). Related party amounts represent intercompany receivable from RioTinto entities and an external portion of receivables from external joint venture partners at arm’s lengthterms.
► Inventories remained fairly stable, decreasing by A$8.3 million in FY16 to A$60.7 million. Inventoriesconsists of coal stocks (including finished goods and work in progress) of A$23.2 million and stores ofA$37.5 million in FY16. Finished goods include coal stocks at site, on transit in trains and in stockpilesat the ports. Work in progress stocks refer to ROM coal stocks which are either bypassed or which arewaiting to be processed through the CHPP.
► Property, plant and equipment (“PPE”) decreased by A$95.5 million to A$914.4 million in FY16 due toa combination of the purchase of equipment and the depreciation of existing assets used in operations.
► Coal & Allied had a deferred tax asset of A$127.5 million as at the end of FY16, representing timingdifferences between the book and tax values of various assets and liabilities. At December 2016 Coal& Allied did not have any carry forward tax losses.
► Trade and other payables increased by A$143.7 million to A$354.8 million in FY16. Trade and otherpayables is mainly attributable to the purchase of operating supplies and services used in the productionprocess. Trade and other payables also consist of amounts due to related parties, intercompanypayable in respect of income tax and other payables. Related party amounts represent intercompanypayables from Rio Tinto entities and external portion of payables from external joint venture partners atarm’s length terms.
► There are no significant borrowings in the business.
► Current provisions primarily relate to employee benefits and have increased by A$27.6 million toA$131.3 million in FY16.
► Net assets remained broadly consistent over FY15 and FY16, with a balance of A$1.3 billion at31 December 2016.
► The consolidated entity has a number of contingent liabilities. These include bank guarantees forrestoration obligations, bank guarantees for land conservation and environmental land offsets, bankguarantees for infrastructure and emergency services and bank guarantees for other miscellaneousobligations.
40
For
per
sona
l use
onl
y
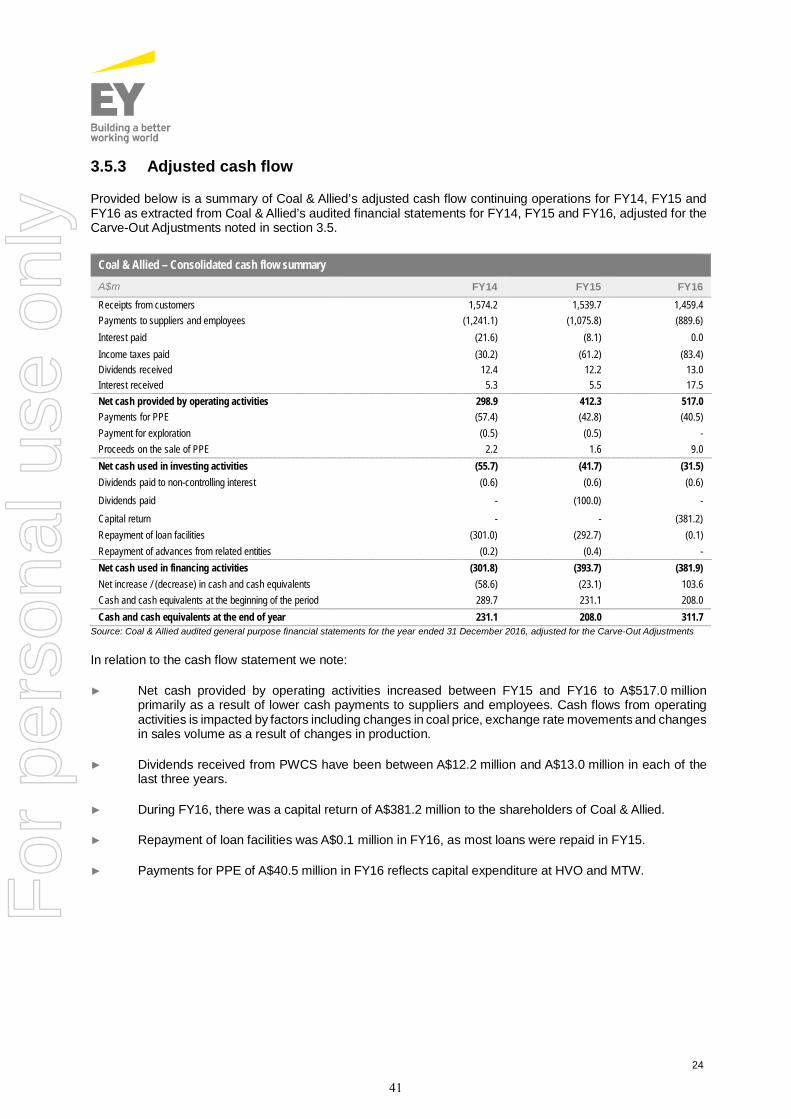
24
3.5.3 Adjusted cash flow
Provided below is a summary of Coal & Allied’s adjusted cash flow continuing operations for FY14, FY15 andFY16 as extracted from Coal & Allied’s audited financial statements for FY14, FY15 and FY16, adjusted for theCarve-Out Adjustments noted in section 3.5.
Source: Coal & Allied audited general purpose financial statements for the year ended 31 December 2016, adjusted for the Carve-Out Adjustments
In relation to the cash flow statement we note:
► Net cash provided by operating activities increased between FY15 and FY16 to A$517.0 millionprimarily as a result of lower cash payments to suppliers and employees. Cash flows from operatingactivities is impacted by factors including changes in coal price, exchange rate movements and changesin sales volume as a result of changes in production.
► Dividends received from PWCS have been between A$12.2 million and A$13.0 million in each of thelast three years.
► During FY16, there was a capital return of A$381.2 million to the shareholders of Coal & Allied.
► Repayment of loan facilities was A$0.1 million in FY16, as most loans were repaid in FY15.
► Payments for PPE of A$40.5 million in FY16 reflects capital expenditure at HVO and MTW.
Coal & Allied – Consolidated cash flow summaryA$m FY14 FY15 FY16Receipts from customers 1,574.2 1,539.7 1,459.4Payments to suppliers and employees (1,241.1) (1,075.8) (889.6)Interest paid (21.6) (8.1) 0.0Income taxes paid (30.2) (61.2) (83.4)Dividends received 12.4 12.2 13.0Interest received 5.3 5.5 17.5Net cash provided by operating activities 298.9 412.3 517.0Payments for PPE (57.4) (42.8) (40.5)Payment for exploration (0.5) (0.5) -Proceeds on the sale of PPE 2.2 1.6 9.0Net cash used in investing activities (55.7) (41.7) (31.5)Dividends paid to non-controlling interest (0.6) (0.6) (0.6)Dividends paid - (100.0) -Capital return - - (381.2)Repayment of loan facilities (301.0) (292.7) (0.1)Repayment of advances from related entities (0.2) (0.4) -Net cash used in financing activities (301.8) (393.7) (381.9)Net increase / (decrease) in cash and cash equivalents (58.6) (23.1) 103.6Cash and cash equivalents at the beginning of the period 289.7 231.1 208.0Cash and cash equivalents at the end of year 231.1 208.0 311.7
41
For
per
sona
l use
onl
y
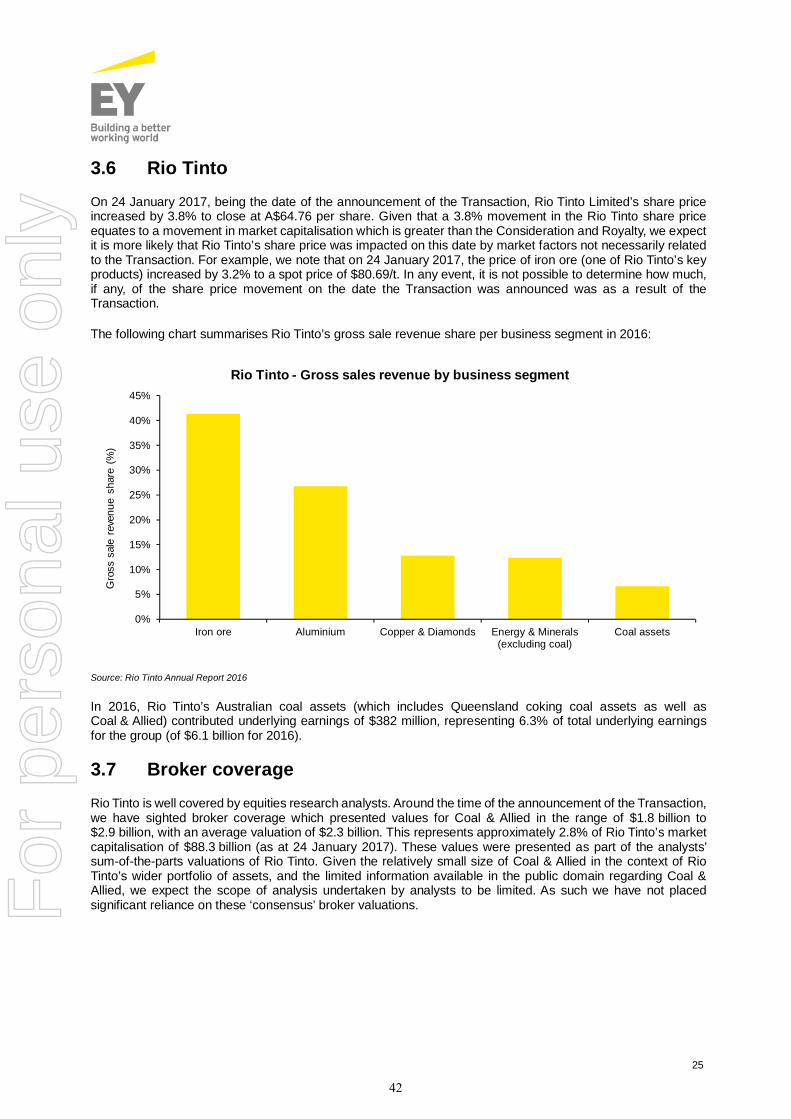
25
3.6 Rio TintoOn 24 January 2017, being the date of the announcement of the Transaction, Rio Tinto Limited’s share priceincreased by 3.8% to close at A$64.76 per share. Given that a 3.8% movement in the Rio Tinto share priceequates to a movement in market capitalisation which is greater than the Consideration and Royalty, we expectit is more likely that Rio Tinto’s share price was impacted on this date by market factors not necessarily relatedto the Transaction. For example, we note that on 24 January 2017, the price of iron ore (one of Rio Tinto’s keyproducts) increased by 3.2% to a spot price of $80.69/t. In any event, it is not possible to determine how much,if any, of the share price movement on the date the Transaction was announced was as a result of theTransaction.
The following chart summarises Rio Tinto’s gross sale revenue share per business segment in 2016:
Source: Rio Tinto Annual Report 2016
In 2016, Rio Tinto’s Australian coal assets (which includes Queensland coking coal assets as well asCoal & Allied) contributed underlying earnings of $382 million, representing 6.3% of total underlying earningsfor the group (of $6.1 billion for 2016).
3.7 Broker coverageRio Tinto is well covered by equities research analysts. Around the time of the announcement of the Transaction,we have sighted broker coverage which presented values for Coal & Allied in the range of $1.8 billion to$2.9 billion, with an average valuation of $2.3 billion. This represents approximately 2.8% of Rio Tinto’s marketcapitalisation of $88.3 billion (as at 24 January 2017). These values were presented as part of the analysts’sum-of-the-parts valuations of Rio Tinto. Given the relatively small size of Coal & Allied in the context of RioTinto’s wider portfolio of assets, and the limited information available in the public domain regarding Coal &Allied, we expect the scope of analysis undertaken by analysts to be limited. As such we have not placedsignificant reliance on these ‘consensus’ broker valuations.
0%
5%
10%
15%
20%
25%
30%
35%
40%
45%
Iron ore Aluminium Copper & Diamonds Energy & Minerals(excluding coal)
Coal assets
Gro
sssa
lere
venu
esh
are
(%)
Rio Tinto - Gross sales revenue by business segment
42
For
per
sona
l use
onl
y
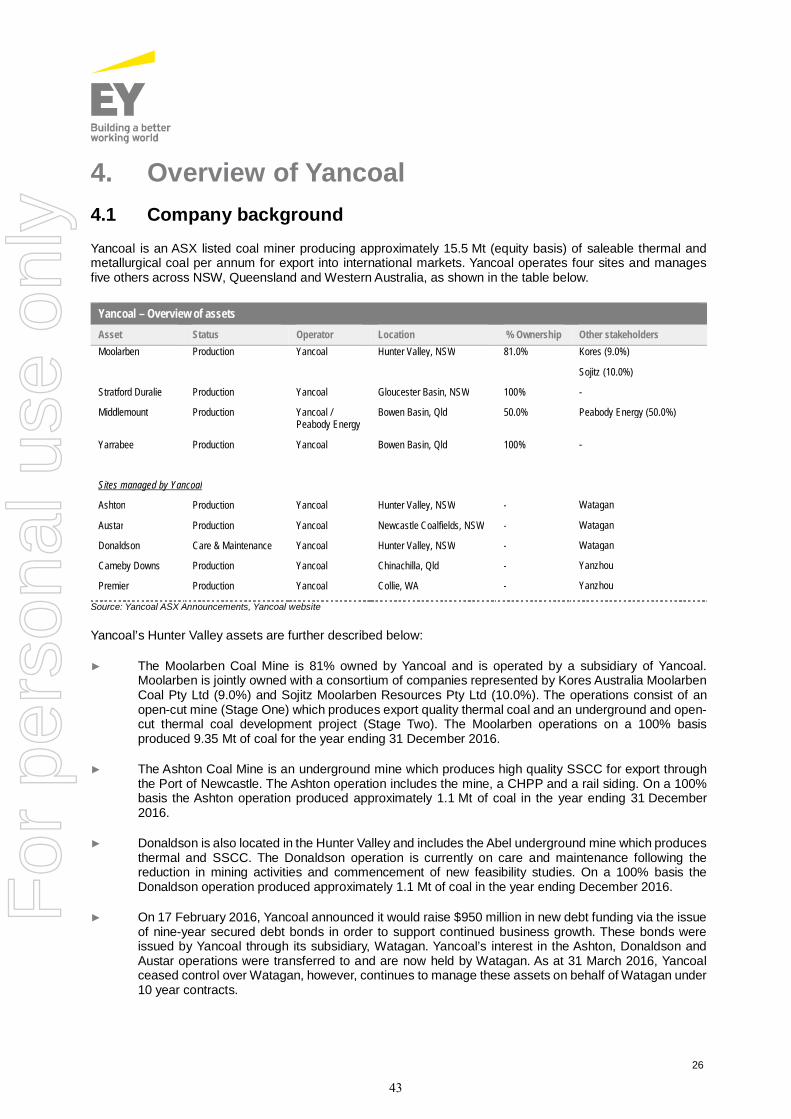
26
4. Overview of Yancoal4.1 Company backgroundYancoal is an ASX listed coal miner producing approximately 15.5 Mt (equity basis) of saleable thermal andmetallurgical coal per annum for export into international markets. Yancoal operates four sites and managesfive others across NSW, Queensland and Western Australia, as shown in the table below.
Source: Yancoal ASX Announcements, Yancoal website
Yancoal’s Hunter Valley assets are further described below:
► The Moolarben Coal Mine is 81% owned by Yancoal and is operated by a subsidiary of Yancoal.Moolarben is jointly owned with a consortium of companies represented by Kores Australia MoolarbenCoal Pty Ltd (9.0%) and Sojitz Moolarben Resources Pty Ltd (10.0%). The operations consist of anopen-cut mine (Stage One) which produces export quality thermal coal and an underground and open-cut thermal coal development project (Stage Two). The Moolarben operations on a 100% basisproduced 9.35 Mt of coal for the year ending 31 December 2016.
► The Ashton Coal Mine is an underground mine which produces high quality SSCC for export throughthe Port of Newcastle. The Ashton operation includes the mine, a CHPP and a rail siding. On a 100%basis the Ashton operation produced approximately 1.1 Mt of coal in the year ending 31 December2016.
► Donaldson is also located in the Hunter Valley and includes the Abel underground mine which producesthermal and SSCC. The Donaldson operation is currently on care and maintenance following thereduction in mining activities and commencement of new feasibility studies. On a 100% basis theDonaldson operation produced approximately 1.1 Mt of coal in the year ending December 2016.
► On 17 February 2016, Yancoal announced it would raise $950 million in new debt funding via the issueof nine-year secured debt bonds in order to support continued business growth. These bonds wereissued by Yancoal through its subsidiary, Watagan. Yancoal’s interest in the Ashton, Donaldson andAustar operations were transferred to and are now held by Watagan. As at 31 March 2016, Yancoalceased control over Watagan, however, continues to manage these assets on behalf of Watagan under10 year contracts.
Yancoal – Overview of assetsAsset Status Operator Location % Ownership Other stakeholdersMoolarben Production Yancoal Hunter Valley, NSW 81.0% Kores (9.0%)
Sojitz (10.0%)
Stratford Duralie Production Yancoal Gloucester Basin, NSW 100% -
Middlemount Production Yancoal /Peabody Energy
Bowen Basin, Qld 50.0% Peabody Energy (50.0%)
Yarrabee Production Yancoal Bowen Basin, Qld 100% -
Sites managed by Yancoal
Ashton Production Yancoal Hunter Valley, NSW - Watagan
Austar Production Yancoal Newcastle Coalfields, NSW - Watagan
Donaldson Care & Maintenance Yancoal Hunter Valley, NSW - Watagan
Cameby Downs Production Yancoal Chinachilla, Qld - Yanzhou
Premier Production Yancoal Collie, WA - Yanzhou
43
For
per
sona
l use
onl
y
27
4.1.1 NCIG interest
Yancoal has a 27.0% interest in the NCIG export coal terminal and has an allocation of approximately 14.6 Mtpaof capacity at NCIG. The Moolarben mine is the largest of Yancoal’s Hunter Valley assets which uses thisterminal.
4.2 Major shareholdersYancoal currently has 994,216,659 shares outstanding. The two largest shareholders are:
► Yanzhou, with a 78.0% interest
► Noble Group Limited (“Noble”), with a 13.2% interest.
With respect to Yancoal being listed on the ASX, we note:
► With Yanzhou and Noble owning more than 91% of the total shares on issue, the ‘free float’ is less than9% of total shares on issue.
► During the 12 month period up to 24 January 2017, the total trading volume of Yancoal shares was lessthan 3% of the total shares on issue. The average volume traded per day was approximately 0.01% oftotal shares outstanding.
► On the day after the announcement of the Transaction, the total share volume traded was less than0.1% of total shares on issue. The share price on this date did not move from the share price on thetwo previous trading days.
► Yancoal’s market capitalisation as at the day of the Transaction, was $361.8 million.
44
For
per
sona
l use
onl
y
28
5. Valuation approach5.1 Definition of fair valueAs noted in section 2.2, we have considered whether the Transaction is fair by comparing our assessed fairvalue of Coal & Allied with the fair value of the Consideration and Royalty being offered by Yancoal.
Fair value is generally defined as “the price at which an asset could be exchanged between a knowledgeableand willing but not anxious seller and a knowledgeable and willing but not anxious buyer both acting at arm’slength”. Our assessment of the fair value of Coal & Allied has been performed on a basis consistent with thisdefinition assuming 100% ownership, which implicitly includes a control premium.
Fair value does not incorporate any special value. Special value is the additional value that may accrue to aparticular purchaser rather than being available to all potential purchasers. In a competitive bidding situation,potential purchasers may be prepared to pay part, or all, of the special value that they expect to realise from theacquisition to the seller.
In a related party transaction, RG 111 considers an offer to be ‘fair’ if the value of the financial benefit to beprovided by the entity to the related party is equal to or less than the value of the consideration being providedto the entity.
In assessing the fair value of Coal & Allied, AMC was engaged to undertake a technical assessment of theCompany’s mining assets and an independent valuation of Coal & Allied’s exploration and development assets.The AMC Report is included as Appendix I of this report. Consistent with the VALMIN Code, AMC describes thevalues determined for Coal & Allied’s mining assets as representing a technical value (“Technical Value”). Underthe VALMIN Code, Technical Value excludes “any premium or discount for such factors as market and strategicconsiderations”. Given the methodologies applied and the assumptions upon which the valuation of Coal &Allied’s mining assets are based, in our opinion, the Technical Values implied by AMC are representative of thefair values of each of the assets under the abovementioned definition.
5.2 Valuation methodologies adoptedGiven the nature of Coal & Allied as a coal mining company, we have assessed the value of the Company on anet asset backing basis after considering the underlying value of its assets and liabilities on a going concernbasis. In adopting this approach, a key component of the valuation is the assessment of the value ofCoal & Allied’s operating mining assets, being its interests in HVO and MTW (“Operating Projects”).
By their nature, mineral assets are difficult to value. Key considerations in valuing mineral assets include longterm views on commodity prices, development, operational and financial risks, quality of the underlying resourcebase and expectations on the timing of any future development of the asset. While the valuation approachesand assumptions represented EY Transaction Advisory Services and AMC’s views at the time of preparing thisreport, changes to market views on these key considerations could materially impact the values of the assets.
5.2.1 Operating Projects
Coal projects in the later stages of development or in production are typically valued using a discounted cashflow (“DCF”) approach as projects of this type are generally well defined technically and supported by reliablecash flows forecasts.
Given Coal & Allied’s Operating Projects have a long production history and detailed forecast life of mine (“LOM”)models available, we have valued HVO and MTW using the DCF methodology.
45
For
per
sona
l use
onl
y

29
To assist in our DCF analysis and to be consistent with the requirements of the VALMIN Code, the technical,production and cost assumptions adopted in the LOM models have been reviewed by AMC. Based on theirreview, AMC formulated production cases for each of the Operating Projects. All other inputs, includingcommodity prices, foreign exchange rates, discount rates and taxation analysis were determined by EYTransaction Advisory Services. AMC’s comments and findings are detailed in the AMC Report, which is includedas Appendix I.
We have included Coal & Allied’s 36.5% interest in PWCS within our valuation of the Operating Projects on thebasis that the operations of PWCS are an extension of the Company’s coal operations and part of the overallsupply chain. PWCS’ shareholders consist of Hunter Valley coal producers and Japanese coal customers2 whoreceive dividends for their respective ownership in PWCS. We view the dividends received by Coal & Allied asan offset to port and shipping costs and as such lower Coal & Allied’s effective operating costs. PWCS hashistorically paid stable dividends regardless of reported earnings (as a result of having a large retained earningsbalance) and have decreased the coal handling charge to customers in recent years, indicating that the assetis run for the benefit of the users, rather than as a profit making enterprise.
We have assessed the value of Coal & Allied’s interest in PWCS adopting a DCF approach, including the presentvalue of the dividend stream within the value of the Operating Projects.
We have also included the value assessed from Coal & Allied’s coal supply agreement with BLCP within ourvaluation of the Operating Projects. This agreement represents the supply of coal to a Thai power generator,BLCP, and includes a maximum coal sale price within the agreement, which is below current market prices(i.e. an out-of-the-money contract).
We have assessed the value of Coal & Allied’s coal supply agreement adopting a DCF approach. This has beenreflected within the revenue of the Operating Projects.
The forecast cash flows for the Operating Projects were estimated on a US$ ungeared, real, post-tax basis.
5.2.2 Other assets and liabilities
We have assessed the value of Coal & Allied’s other assets and liabilities as follows:
► In relation to the Oaklands deposit, there are no current plans to develop this asset due to beinguneconomic at current coal prices and capital requirements. In the context of the regulatory environmentin NSW, the probability of the project receiving approvals is low and as such AMC considers that nomaterial value will be able to be realised for this asset. We have discussed this in more detail insection 6.4.
► Surplus land assets were valued based on the present value of the expected cash flows to be realisedfrom the completion of the sale of these assets. The surplus land assets represent land which hasalready been sold or committed to be sold through option agreements. As the forecast cash flowsassociated with land sales are on a A$ nominal basis, we have deflated the expected cash flows andconverted to US$ to be consistent with the LOM models.
► As previously discussed, the rail and port take-or-pay capacity entitlements referable to the divestmentof the Mount Pleasant project to Mach Energy, have been assessed to be onerous to Coal & Allied. Thevalue of the onerous contracts have been assessed on the present value of the future cash outflows tobe incurred by Coal & Allied. These cash outflows are not included within the cash flows of the OperatingProjects however were included separately within the Financial Model. As such the value of the onerouscontracts have been separately assessed.
► Any corporate costs not allocated to the Operating Projects LOM models have been separatelyassessed using a standalone DCF.
2 PWCS website, accessed 15 March 2017
46
For
per
sona
l use
onl
y

30
5.3 Control premiumAs noted previously, our valuation of Coal & Allied has been assessed on a 100% controlling interest basis andas such includes a premium for control. This is consistent with the requirements of RG 111.
5.4 Valuation cross checksPrior to finalising our valuation of Coal & Allied, we considered the reasonableness of our assessed valuationrange for the Operating Projects with reference to trading multiples of companies with similar, but not necessarilythe same, operations to Coal & Allied. We also considered transaction multiples as a cross check to ourassessed value of the Operating Projects.
In addition, we compared our overall valuation of Coal & Allied to the valuation ranges disclosed by equityanalysts covering Rio Tinto.
47
For
per
sona
l use
onl
y
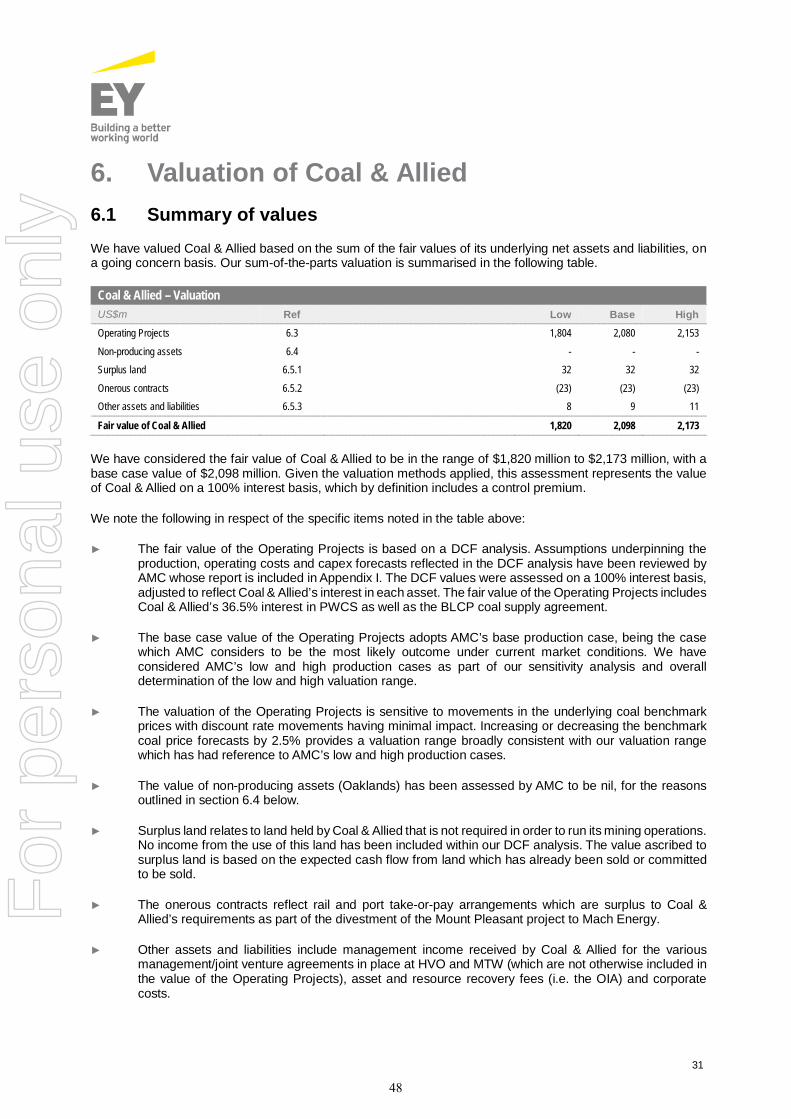
31
6. Valuation of Coal & Allied6.1 Summary of valuesWe have valued Coal & Allied based on the sum of the fair values of its underlying net assets and liabilities, ona going concern basis. Our sum-of-the-parts valuation is summarised in the following table.
Coal & Allied – ValuationUS$m Ref Low Base HighOperating Projects 6.3 1,804 2,080 2,153
Non-producing assets 6.4 - - -Surplus land 6.5.1 32 32 32
Onerous contracts 6.5.2 (23) (23) (23)Other assets and liabilities 6.5.3 8 9 11
Fair value of Coal & Allied 1,820 2,098 2,173
We have considered the fair value of Coal & Allied to be in the range of $1,820 million to $2,173 million, with abase case value of $2,098 million. Given the valuation methods applied, this assessment represents the valueof Coal & Allied on a 100% interest basis, which by definition includes a control premium.
We note the following in respect of the specific items noted in the table above:
► The fair value of the Operating Projects is based on a DCF analysis. Assumptions underpinning theproduction, operating costs and capex forecasts reflected in the DCF analysis have been reviewed byAMC whose report is included in Appendix I. The DCF values were assessed on a 100% interest basis,adjusted to reflect Coal & Allied’s interest in each asset. The fair value of the Operating Projects includesCoal & Allied’s 36.5% interest in PWCS as well as the BLCP coal supply agreement.
► The base case value of the Operating Projects adopts AMC’s base production case, being the casewhich AMC considers to be the most likely outcome under current market conditions. We haveconsidered AMC’s low and high production cases as part of our sensitivity analysis and overalldetermination of the low and high valuation range.
► The valuation of the Operating Projects is sensitive to movements in the underlying coal benchmarkprices with discount rate movements having minimal impact. Increasing or decreasing the benchmarkcoal price forecasts by 2.5% provides a valuation range broadly consistent with our valuation rangewhich has had reference to AMC’s low and high production cases.
► The value of non-producing assets (Oaklands) has been assessed by AMC to be nil, for the reasonsoutlined in section 6.4 below.
► Surplus land relates to land held by Coal & Allied that is not required in order to run its mining operations.No income from the use of this land has been included within our DCF analysis. The value ascribed tosurplus land is based on the expected cash flow from land which has already been sold or committedto be sold.
► The onerous contracts reflect rail and port take-or-pay arrangements which are surplus to Coal &Allied’s requirements as part of the divestment of the Mount Pleasant project to Mach Energy.
► Other assets and liabilities include management income received by Coal & Allied for the variousmanagement/joint venture agreements in place at HVO and MTW (which are not otherwise included inthe value of the Operating Projects), asset and resource recovery fees (i.e. the OIA) and corporatecosts.
48
For
per
sona
l use
onl
y
32
Our assessed valuation range for Coal & Allied has been considered in conjunction with various cross checks,including various benchmark analysis based on trading multiples of comparable companies and precedenttransactions as well as recent broker valuations. Refer to section 6.7 for our analysis of the cross checksconsidered.
6.2 Financial ModelWe have been provided with a financial model summarising the forecast LOM cash flows for the OperatingProjects as well as the forecast cash flows for Coal & Allied’s other assets and liabilities (“Financial Model”). TheFinancial Model was prepared by Rio Tinto management and includes forecast cash flows presented on a US$ungeared, real, post-tax basis. The forecast cash flows associated with the Operating Projects within theFinancial Model have been extracted from the LOM models underpinning the approved mine plans.
The Financial Model was prepared based on the following:
► Rio Tinto’s five year plan from 2017 to 2022, approved internally with each of the joint ventureparticipants approving the first forecast year. Subsequent to 2022, the Financial Model relies on theLOM models.
► The latest Ore Reserves and Mineral Resources statement as at 31 December 2016, reviewed by AMC.AMC has also reviewed the underlying LOM models and the Ore Reserves and Mineral Resourcesincluded within the mine plans.
► Forecast cash flows for the Operating Projects within the Financial Model and underlying LOM modelshave been prepared on a 100% project basis. As such, all cash flow items discussed below are shownon a 100% interest basis, with our valuation of Coal & Allied adjusted to reflect the Company’srespective interests in the projects.
We used the Financial Model as the basis for our assessment of the range of values for the Operating Projectsand other assets and liabilities. We adjusted various aspects of the Financial Model, including:
► The technical input from the independent technical specialist, AMC, regarding technical assumptionsfollowing their review of the Financial Model, the underlying LOM models and assumptionsunderpinning these models. AMC reviewed various aspects including resource and reserve estimation,production volumes, operating expenses, capital costs and other environmental and infrastructurerelated considerations. Full details of the work undertaken by AMC is set out the AMC Report inAppendix I.
► Our view of economic assumptions including future expected coal benchmark prices, exchange ratesand tax assumptions. Forecast assumptions denominated in A$ within the Financial Model have beenconverted to US$ cash flows adopting forecast exchange rates.
► Rehabilitation and closure costs expected to be incurred over the LOM in addition to the end of theeconomic life of each mining asset, assessed by AMC.
► Our view of the discount rates to apply to the forecast cash flows of the Operating Projects and otherassets and liabilities, reflecting their respective underlying risks.
We note that we have not undertaken a detailed review or audit of the Financial Model. We have, however,performed limited analytical procedures regarding the mathematical accuracy of the Financial Model and helddiscussions with Rio Tinto management regarding the preparation of the Financial Model and the assumptionscontained therein.
49
For
per
sona
l use
onl
y
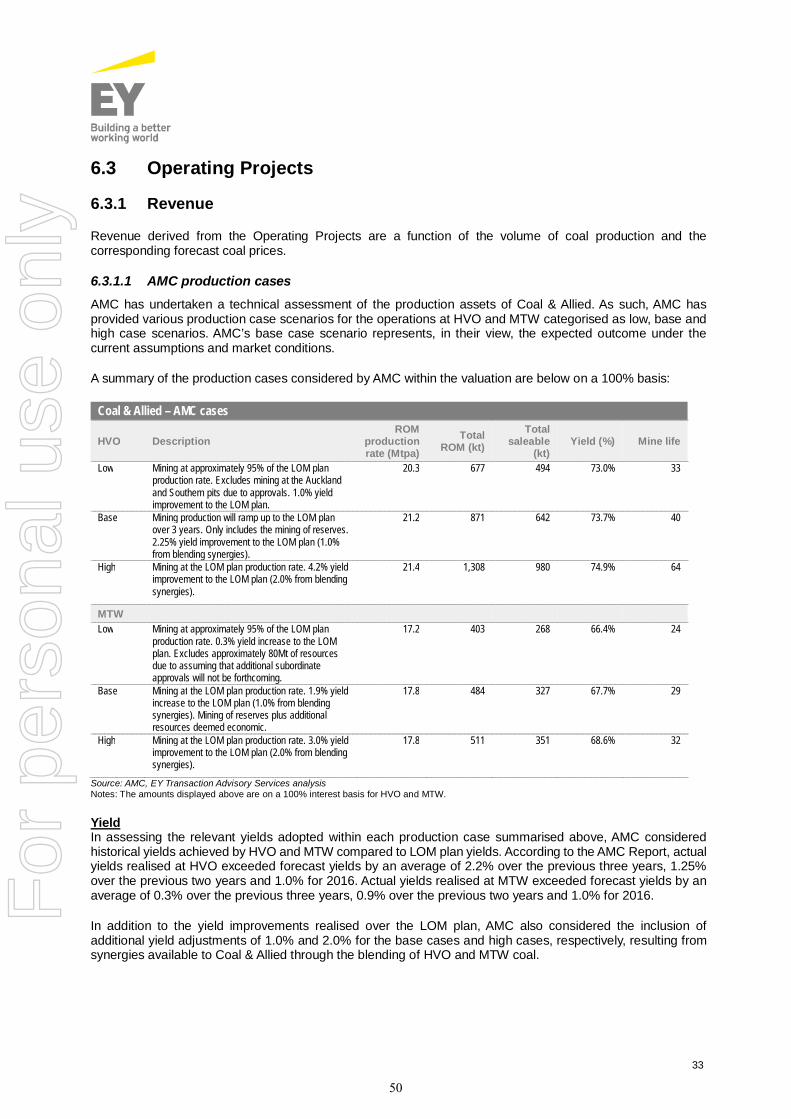
33
6.3 Operating Projects
6.3.1 Revenue
Revenue derived from the Operating Projects are a function of the volume of coal production and thecorresponding forecast coal prices.
6.3.1.1 AMC production casesAMC has undertaken a technical assessment of the production assets of Coal & Allied. As such, AMC hasprovided various production case scenarios for the operations at HVO and MTW categorised as low, base andhigh case scenarios. AMC’s base case scenario represents, in their view, the expected outcome under thecurrent assumptions and market conditions.
A summary of the production cases considered by AMC within the valuation are below on a 100% basis:
Coal & Allied – AMC cases
HVO DescriptionROM
productionrate (Mtpa)
TotalROM (kt)
Totalsaleable
(kt)Yield (%) Mine life
Low Mining at approximately 95% of the LOM planproduction rate. Excludes mining at the Aucklandand Southern pits due to approvals. 1.0% yieldimprovement to the LOM plan.
20.3 677 494 73.0% 33
Base Mining production will ramp up to the LOM planover 3 years. Only includes the mining of reserves.2.25% yield improvement to the LOM plan (1.0%from blending synergies).
21.2 871 642 73.7% 40
High Mining at the LOM plan production rate. 4.2% yieldimprovement to the LOM plan (2.0% from blendingsynergies).
21.4 1,308 980 74.9% 64
MTWLow Mining at approximately 95% of the LOM plan
production rate. 0.3% yield increase to the LOMplan. Excludes approximately 80Mt of resourcesdue to assuming that additional subordinateapprovals will not be forthcoming.
17.2 403 268 66.4% 24
Base Mining at the LOM plan production rate. 1.9% yieldincrease to the LOM plan (1.0% from blendingsynergies). Mining of reserves plus additionalresources deemed economic.
17.8 484 327 67.7% 29
High Mining at the LOM plan production rate. 3.0% yieldimprovement to the LOM plan (2.0% from blendingsynergies).
17.8 511 351 68.6% 32
Source: AMC, EY Transaction Advisory Services analysisNotes: The amounts displayed above are on a 100% interest basis for HVO and MTW.
YieldIn assessing the relevant yields adopted within each production case summarised above, AMC consideredhistorical yields achieved by HVO and MTW compared to LOM plan yields. According to the AMC Report, actualyields realised at HVO exceeded forecast yields by an average of 2.2% over the previous three years, 1.25%over the previous two years and 1.0% for 2016. Actual yields realised at MTW exceeded forecast yields by anaverage of 0.3% over the previous three years, 0.9% over the previous two years and 1.0% for 2016.
In addition to the yield improvements realised over the LOM plan, AMC also considered the inclusion ofadditional yield adjustments of 1.0% and 2.0% for the base cases and high cases, respectively, resulting fromsynergies available to Coal & Allied through the blending of HVO and MTW coal.
50
For
per
sona
l use
onl
y

34
ApprovalsHVO and MTW require various approvals to carry out mining and coal processing operations. These includeapprovals relating to allowable production levels, lease boundaries, land offsets, land disturbance, waste dumpheights, water extraction, and noise and dust limits. As discussed in the AMC Report, community and politicalfactors can effect the timeframe of receiving operational approvals and may also limit the opportunities for Coal& Allied to expand its existing mines.
In preparing the production cases, AMC has considered the existing approvals and the regulatory environmentin which the Operating Projects are located. In doing so, AMC has considered a range of possible scenarios asfollows:
► Scenario 1 (base case): Assumes continuation of operations as planned under existing approvals. Thisscenario would however require mining some coal from currently unapproved lease areas.
► Scenario 2 (high case): Assumes ongoing approvals are granted, subject to current regulatory regimesand approval policies for coal operations. This scenario assumes that the mine life is not significantlyrestricted by approval limitations.
► Scenario 3 (low case): Assumes increasing restrictions and limitations to future approvals. Assumesthat no new mining leases will be approved and that the mine life is restricted to current approvals.
The following sections outline the assumptions applied within our valuation using AMC’s ‘base case’ productionprofile, being the production profile that AMC considers is most likely based on the information available. Inassessing a range of values for the Operating Projects, we have considered AMC’s three cases in conjunctionwith sensitivity analysis presented in section 6.6.
6.3.1.2 ProductionProduction volumes are forecast based on ROM tonnes and gross yield, which underpin forecast saleabletonnes. Saleable tonnes are further allocated within the Financial Model into specific products.
The chart below summarises the forecast production profile of HVO and MTW on a saleable production basisas per the Financial Model, after adjustment by AMC. These below amounts include all contracted volumes.
Source: Financial Model
05,000
10,00015,00020,00025,000
2017 2019 2021 2023 2025 2027 2029 2031 2033 2035 2037 2039 2041 2043 2045 2047 2049 2051 2053 2055 2057 2059 2061
Tota
lpro
ducti
on(k
t)
HVO forecast production profile - 100% basis (base case)
Semi-soft coking coal Low ash export thermal coal Medium ash export thermal coal
High ash export thermal coal Bypass ROM
51
For
per
sona
l use
onl
y
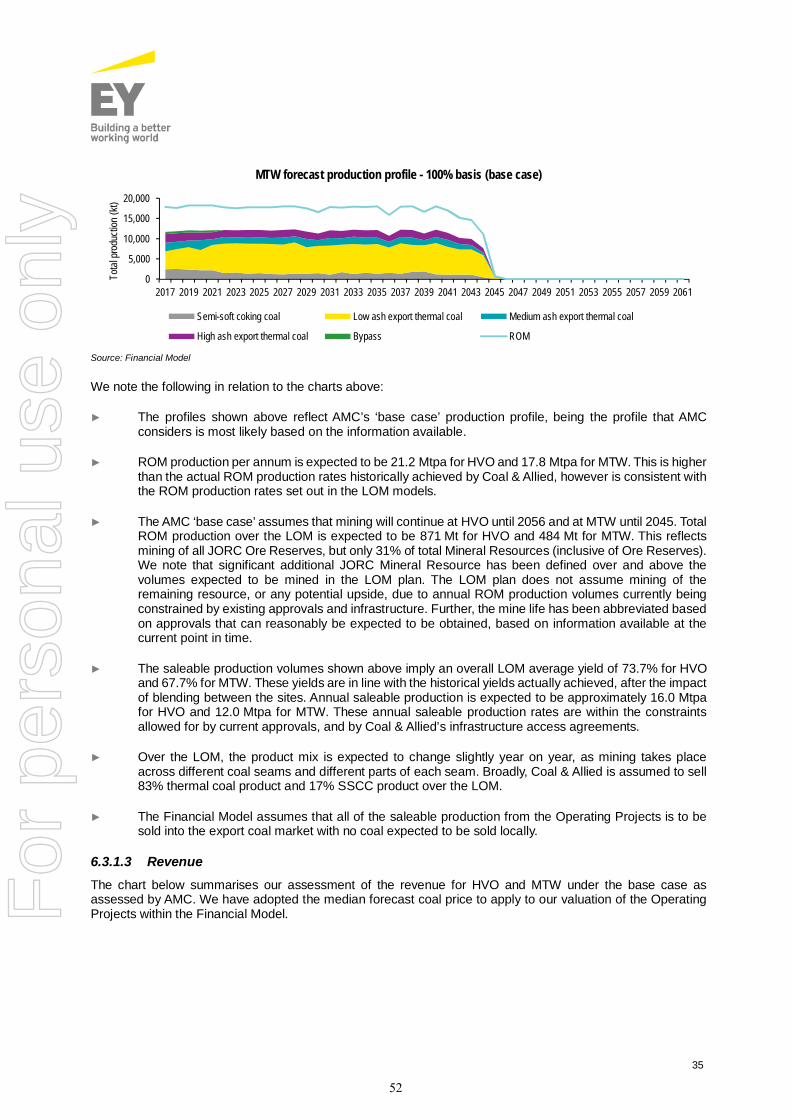
35
Source: Financial Model
We note the following in relation to the charts above:
► The profiles shown above reflect AMC’s ‘base case’ production profile, being the profile that AMCconsiders is most likely based on the information available.
► ROM production per annum is expected to be 21.2 Mtpa for HVO and 17.8 Mtpa for MTW. This is higherthan the actual ROM production rates historically achieved by Coal & Allied, however is consistent withthe ROM production rates set out in the LOM models.
► The AMC ‘base case’ assumes that mining will continue at HVO until 2056 and at MTW until 2045. TotalROM production over the LOM is expected to be 871 Mt for HVO and 484 Mt for MTW. This reflectsmining of all JORC Ore Reserves, but only 31% of total Mineral Resources (inclusive of Ore Reserves).We note that significant additional JORC Mineral Resource has been defined over and above thevolumes expected to be mined in the LOM plan. The LOM plan does not assume mining of theremaining resource, or any potential upside, due to annual ROM production volumes currently beingconstrained by existing approvals and infrastructure. Further, the mine life has been abbreviated basedon approvals that can reasonably be expected to be obtained, based on information available at thecurrent point in time.
► The saleable production volumes shown above imply an overall LOM average yield of 73.7% for HVOand 67.7% for MTW. These yields are in line with the historical yields actually achieved, after the impactof blending between the sites. Annual saleable production is expected to be approximately 16.0 Mtpafor HVO and 12.0 Mtpa for MTW. These annual saleable production rates are within the constraintsallowed for by current approvals, and by Coal & Allied’s infrastructure access agreements.
► Over the LOM, the product mix is expected to change slightly year on year, as mining takes placeacross different coal seams and different parts of each seam. Broadly, Coal & Allied is assumed to sell83% thermal coal product and 17% SSCC product over the LOM.
► The Financial Model assumes that all of the saleable production from the Operating Projects is to besold into the export coal market with no coal expected to be sold locally.
6.3.1.3 RevenueThe chart below summarises our assessment of the revenue for HVO and MTW under the base case asassessed by AMC. We have adopted the median forecast coal price to apply to our valuation of the OperatingProjects within the Financial Model.
0
5,000
10,000
15,000
20,000
2017 2019 2021 2023 2025 2027 2029 2031 2033 2035 2037 2039 2041 2043 2045 2047 2049 2051 2053 2055 2057 2059 2061
Tota
lpro
ducti
on(k
t)
MTW forecast production profile - 100% basis (base case)
Semi-soft coking coal Low ash export thermal coal Medium ash export thermal coal
High ash export thermal coal Bypass ROM
52
For
per
sona
l use
onl
y
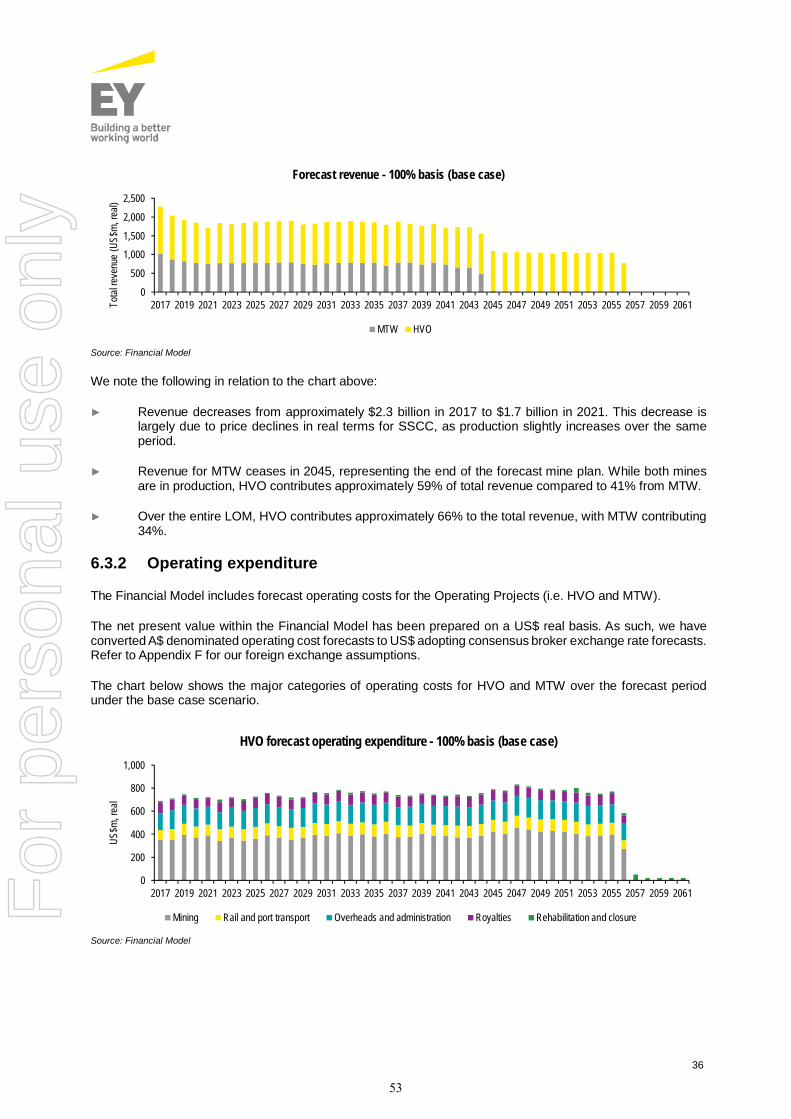
36
Source: Financial Model
We note the following in relation to the chart above:
► Revenue decreases from approximately $2.3 billion in 2017 to $1.7 billion in 2021. This decrease islargely due to price declines in real terms for SSCC, as production slightly increases over the sameperiod.
► Revenue for MTW ceases in 2045, representing the end of the forecast mine plan. While both minesare in production, HVO contributes approximately 59% of total revenue compared to 41% from MTW.
► Over the entire LOM, HVO contributes approximately 66% to the total revenue, with MTW contributing34%.
6.3.2 Operating expenditure
The Financial Model includes forecast operating costs for the Operating Projects (i.e. HVO and MTW).
The net present value within the Financial Model has been prepared on a US$ real basis. As such, we haveconverted A$ denominated operating cost forecasts to US$ adopting consensus broker exchange rate forecasts.Refer to Appendix F for our foreign exchange assumptions.
The chart below shows the major categories of operating costs for HVO and MTW over the forecast periodunder the base case scenario.
Source: Financial Model
0
500
1,000
1,500
2,000
2,500
2017 2019 2021 2023 2025 2027 2029 2031 2033 2035 2037 2039 2041 2043 2045 2047 2049 2051 2053 2055 2057 2059 2061Tota
lreve
nue
(US$
m,re
al)
Forecast revenue - 100% basis (base case)
MTW HVO
0
200
400
600
800
1,000
2017 2019 2021 2023 2025 2027 2029 2031 2033 2035 2037 2039 2041 2043 2045 2047 2049 2051 2053 2055 2057 2059 2061
US$m
,rea
l
HVO forecast operating expenditure - 100% basis (base case)
Mining Rail and port transport Overheads and administration Royalties Rehabilitation and closure
53
For
per
sona
l use
onl
y

37
Source: Financial Model
We note the following in relation to the charts above:
► Operating costs are based on Rio Tinto’s internally approved five year budget for the period 2017 to2022, with the subsequent operating expenditure relating to the HVO and MTW LOM plans.
► Mining costs include costs associated with the extraction and processing of ROM coal such as wastemovement, open-cut mining costs and processing costs. Mining costs represent approximately 50% ofthe total operating expenditure for both mines over the LOM.
► Overheads and administration costs include site administration costs and overheads associated withthe operations of HVO and MTW.
► Royalties have been assessed at a rate of 8.2% of the assessable coal revenue, which is the currentcoal royalty payable in NSW for open-cut mining.3
► Rehabilitation and closure costs include a component of ongoing site maintenance costs throughoutthe forecast period as well as closure costs at the end of the life of mine. Coal & Allied is forecast tospend approximately $10.5 million per year (on a real 2017 basis), with a total of approximately$255.6 million spent over the final 10 years at HVO relating to the final closure costs and $3.5 millionper year on an ongoing basis. At MTW, a total of $206.8 million is forecast to be incurred over the final10 years relating to final closure costs. These amounts have been reviewed by AMC.
6.3.3 Capital expenditure
Capital expenditure has been reviewed by AMC for the specific production profile and has been classified as‘growth’ capital expenditure and ‘sustaining’ capital expenditure. The charts on the next page show the growthand sustaining capital expenditure for HVO and MTW over the forecast period considered appropriate by AMC.
3 NSW Department of Industry website, accessed 9 March 2017.
0100200300400500600700
2017 2019 2021 2023 2025 2027 2029 2031 2033 2035 2037 2039 2041 2043 2045 2047 2049 2051 2053 2055 2057 2059 2061
US$m
,rea
l
MTW forecast operating expenditure - 100% basis (base case)
Mining Rail and port transport Overheads and administration Royalties Rehabilitation and closure
54
For
per
sona
l use
onl
y

38
Source: Financial Model
Source: Financial Model
We note the following in relation to the charts above:
► The forecasts are based on Rio Tinto’s five year plan for the period 2017 to 2022, followed by broaderassumptions for the remaining forecast period. These assumptions are linked to the production profileas assessed by AMC (i.e. there is an expectation that the production profiles are driven by capexspend).
► Total capital expenditure represents ongoing capital costs including equipment purchases, studyexpenditure, permitting, land purchases and maintaining all plant and equipment at appropriate workingorder over the LOM.
► Coal & Allied undertakes a comprehensive equipment replacement program every 10 years based ondetailed internal records and schedules. As such the above profiles are cyclical in nature with a largeamount of capex forecast every approximate 10 years.
6.3.4 Other cash flow items
6.3.4.1 Changes in working capitalWorking capital is calculated as the net of trade receivables, stores and spares and payables. These balancesare forecast for the duration of the Financial Model based on Coal & Allied’s expected average payment termsfor debtors and creditors. We have benchmarked these payment terms to market comparables. The change inworking capital from year to year is reflected in the cash flow forecasts over the LOM.
Cash flows resulting from changes in working capital are inherently assumed to be prepared on a nominal basis.As such, we have deflated nominal working capital cash flows to be on a real basis for inclusion within thevaluation assessment.
The opening working capital balances in our analysis reflect the agreed working capital balance in the SPA ofnegative A$161 million (i.e. net payables position).
0
50
100
150
200
2017
2018
2019
2020
2021
2022
2023
2024
2025
2026
2027
2028
2029
2030
2031
2032
2033
2034
2035
2036
2037
2038
2039
2040
2041
2042
2043
2044
2045
2046
2047
2048
2049
2050
2051
2052
2053
2054
2055
2056
2057
2058
2059
2060
2061
US$m
,rea
l
HVO forecast capital expenditure - 100% basis (base case)
020406080
100120
2017
2018
2019
2020
2021
2022
2023
2024
2025
2026
2027
2028
2029
2030
2031
2032
2033
2034
2035
2036
2037
2038
2039
2040
2041
2042
2043
2044
2045
2046
2047
2048
2049
2050
2051
2052
2053
2054
2055
2056
2057
2058
2059
2060
2061
US$m
,rea
l
MTW forecast capital expenditure - 100% basis (base case)
Growth capital Sustaining capital
55
For
per
sona
l use
onl
y
39
6.3.4.2 Income taxWe have determined post-tax, real cash flows for Coal & Allied at an asset level. As such we have adopted theAustralian corporate tax rate of 30% to assess the notional tax payment or benefit attributable to eachasset/liability. In assessing taxable income we adopted Coal & Allied’s taxable values or have assumed the taxvalues could be written up in accordance with Australian tax rules. No carried forward tax losses were includedwithin our analysis.
6.3.4.3 ProvisionsRestoration and rehabilitation provisions include the Company’s obligation to restore operating locations,rehabilitating mines, dismantling operating facilities, closure of plant and waste sites and restoration. AMC hasreviewed Coal & Allied’s restoration and rehabilitation provisions included in the Financial Model for theOperating Projects and made adjustments where necessary within the production cases. As a result, allrestoration and rehabilitation costs have been included in the Operating Projects value and therefore notseparately valued.
6.3.5 Discount rate
To value the Operating Projects using a DCF approach, we applied a US$ denominated real, post-tax discountrate range of 8.0% to 9.0% with a midpoint of 8.5% based on a weighted average cost of capital basis (“WACC”).A single point estimate of 8.5% has been chosen based on the range of scenarios that it is being applied to. Adetailed description of the discount rate determination is set out in Appendix D.
6.3.6 Valuation range
Based on our analysis and through discussions with AMC regarding the factors considered in assessing the low,base and high production cases, the value of the Operating Projects is limited by, and highly dependent on theadopted forecast ROM production rates. With the maximum achievable production at HVO and MTW limited byregulatory approvals as well as the availability of required infrastructure, we have placed a greater reliance onachievable annual production rates as opposed to the Operating Project’s total amount of Mineral Resources.In this regard, we have assessed our value range of the Operating Projects to include the AMC low and highproduction cases, reflecting AMC’s views of a range of achievable production scenarios.
The valuation range determined for the Operating Projects (adopting AMC’s production cases) considers miningless coal than reported in the JORC Mineral Resources reported by Rio Tinto. The mine lives have beenrestricted to the extent that mining of Mineral Resources would require extensions of lease approval (inunapproved areas), or conversion of indicated resources to inferred. On the basis that HVO and MTW has amine life of 40 years and 29 years, respectively under AMC’s base case, any additional mining of MineralResources beyond these years will have minimal impact on the overall value of the Operating Projects.
Based on the analysis detailed above, we have assessed the fair value of the Operating Projects in a range of$1,804 million to $2,153 million, with a base case value of $2,080 million, reflecting AMC’s base case scenario.We note that the implied Ore Reserve and Mineral Resource multiples for the Operating Projects are broadlyconsistent with the implied multiples of comparable companies as referred to in the valuation cross checkssection 6.7.
6.4 Non-producing assetsAMC reviewed Coal & Allied’s other undeveloped resources and exploration interests, being the Oaklandsdeposit.
The Oaklands deposit represents Coal & Allied’s only Mineral Resource which is not included within theOperating Projects. Oaklands has a total JORC Mineral Resource of 1,270Mt, mainly attributable to Measuredand Indicated Resources.
Based on an evaluation of Oaklands completed in 2011, the initial capital cost to develop a mine and the forecastoperating costs used in the economic assessment determined that the mine was not economic at that time.
56
For
per
sona
l use
onl
y

40
The AMC Report considers that there is no material value associated with Coal & Allied’s ownership of theOaklands deposit on the basis that:
► The coal at Oaklands is of lower quality and would not attract a premium price in the market.
► The project would require significant upfront capital to develop.
► The project would not be economically viable at current coal prices.
► Mining of the deposit has not received the relevant government approvals. AMC considers theprobability of receiving the appropriate approvals to be low.
► Transporting the coal to the market will require significant capital investment in infrastructure due to thelocation of the deposit in relation to existing infrastructure. Similarly, this would also require appropriateapprovals, which AMC considers to have a low probability.
We also note that as at the time of Coal & Allied delisting in 2011, the Company expressed a willingness to sellOaklands. Over the period of 2011 to 2017 the market for coal has substantially changed, with the approvalsand the regulatory requirements for further exploration and development of existing and potential coal projectsbecoming increasingly complicated. This adds further uncertainty when assessing the value potential ofundeveloped coal projects, and creates significant risk when assessing the potential for a new, large, greenfieldcoal project in NSW.
AMC has assessed the Oaklands deposit to have minimal value. We concluded that any value attributable tothe Oaklands deposit would be immaterial in comparison to our assessed value of Coal & Allied and as such,we have adopted the Oaklands deposit to have nil value for the purposes of our valuation.
6.5 Other assets and liabilities
6.5.1 Surplus land sales
As discussed in section 3.2.7, Coal & Allied holds large areas of land for operational purposes at HVO andMTW, some of which is classified as surplus. This surplus land has either been sold or committed to be sold asat the time of this report. Rio Tinto has provided us with estimates of the expected sale prices to be receivedfrom these sales over the years 2017 to 2019.
The total value we have included related to surplus land is $32 million.
6.5.2 Onerous contracts
Coal & Allied has an interest in certain contracts that were assessed to be onerous (i.e. a liability to theCompany) as at the date of this report and which is not otherwise represented in the LOM models presented tous. The onerous contracts relate to the below rail and port take-or-pay capacity previously retained byCoal & Allied as part of the Mount Pleasant project. As previously discussed, 4Mtpa of port capacity at PWCSand the 8Mtpa below rail capacity has been subsequently assigned to Mach Energy through the divestment ofthe Mount Pleasant project in late 2016. Through the divestment, Coal & Allied agreed to pay for this capacityuntil the earlier of ‘first coal’ from the Mount Pleasant project or 31 March 2018. The assignment of an additional4Mtpa of port capacity at the NCIG terminal is conditional on Mach Energy achieving ‘first coal’ shipped throughthis terminal.
The expiry date of the onerous contracts within the Financial Model is 31 March 2018. Our understanding is thatMach Energy is targeting ‘first coal’ by 31 March 2018. We have valued the onerous take-or-pay contractsadopting a real, post-tax discount rate of 0.4%. The total value of the onerous contract we have included withinour valuation of Coal & Allied is a liability of $23 million.
57
For
per
sona
l use
onl
y
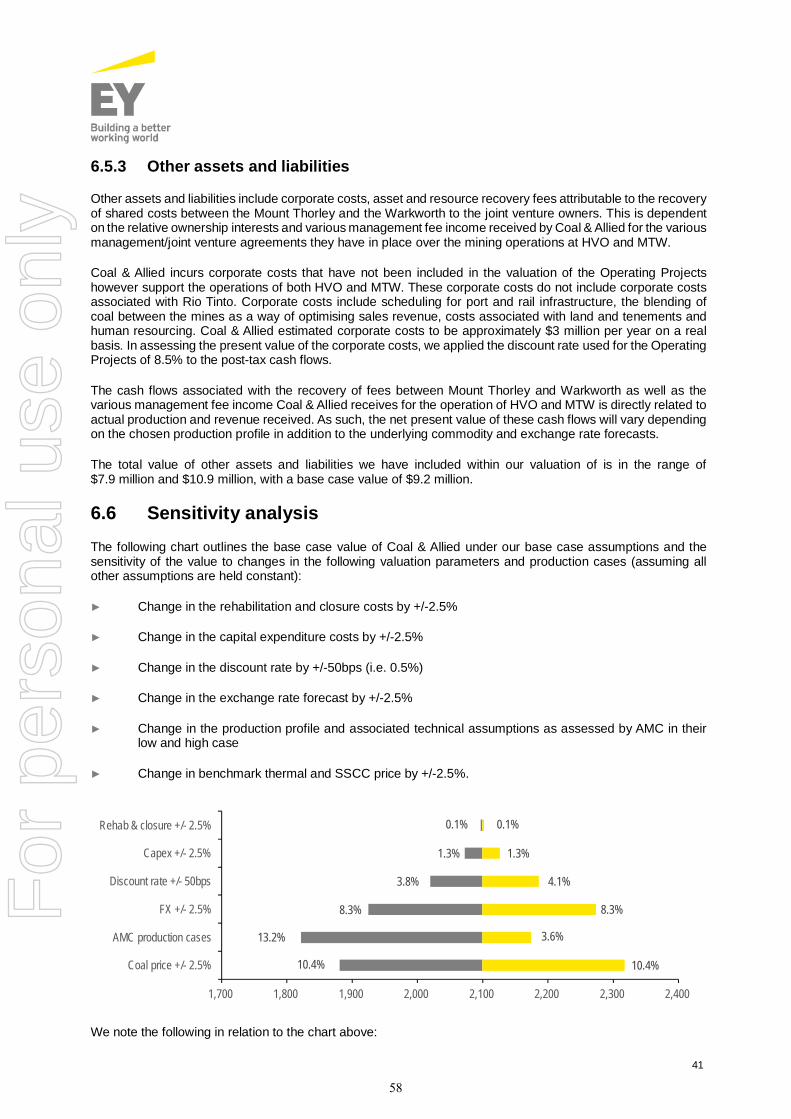
41
6.5.3 Other assets and liabilities
Other assets and liabilities include corporate costs, asset and resource recovery fees attributable to the recoveryof shared costs between the Mount Thorley and the Warkworth to the joint venture owners. This is dependenton the relative ownership interests and various management fee income received by Coal & Allied for the variousmanagement/joint venture agreements they have in place over the mining operations at HVO and MTW.
Coal & Allied incurs corporate costs that have not been included in the valuation of the Operating Projectshowever support the operations of both HVO and MTW. These corporate costs do not include corporate costsassociated with Rio Tinto. Corporate costs include scheduling for port and rail infrastructure, the blending ofcoal between the mines as a way of optimising sales revenue, costs associated with land and tenements andhuman resourcing. Coal & Allied estimated corporate costs to be approximately $3 million per year on a realbasis. In assessing the present value of the corporate costs, we applied the discount rate used for the OperatingProjects of 8.5% to the post-tax cash flows.
The cash flows associated with the recovery of fees between Mount Thorley and Warkworth as well as thevarious management fee income Coal & Allied receives for the operation of HVO and MTW is directly related toactual production and revenue received. As such, the net present value of these cash flows will vary dependingon the chosen production profile in addition to the underlying commodity and exchange rate forecasts.
The total value of other assets and liabilities we have included within our valuation of is in the range of$7.9 million and $10.9 million, with a base case value of $9.2 million.
6.6 Sensitivity analysisThe following chart outlines the base case value of Coal & Allied under our base case assumptions and thesensitivity of the value to changes in the following valuation parameters and production cases (assuming allother assumptions are held constant):
► Change in the rehabilitation and closure costs by +/-2.5%
► Change in the capital expenditure costs by +/-2.5%
► Change in the discount rate by +/-50bps (i.e. 0.5%)
► Change in the exchange rate forecast by +/-2.5%
► Change in the production profile and associated technical assumptions as assessed by AMC in theirlow and high case
► Change in benchmark thermal and SSCC price by +/-2.5%.
We note the following in relation to the chart above:
10.4%
13.2%
8.3%
3.8%
1.3%
0.1%
10.4%
3.6%
8.3%
4.1%
1.3%
0.1%
1,700 1,800 1,900 2,000 2,100 2,200 2,300 2,400
Coal price +/- 2.5%
AMC production cases
FX +/- 2.5%
Discount rate +/- 50bps
Capex +/- 2.5%
Rehab & closure +/- 2.5%
58
For
per
sona
l use
onl
y
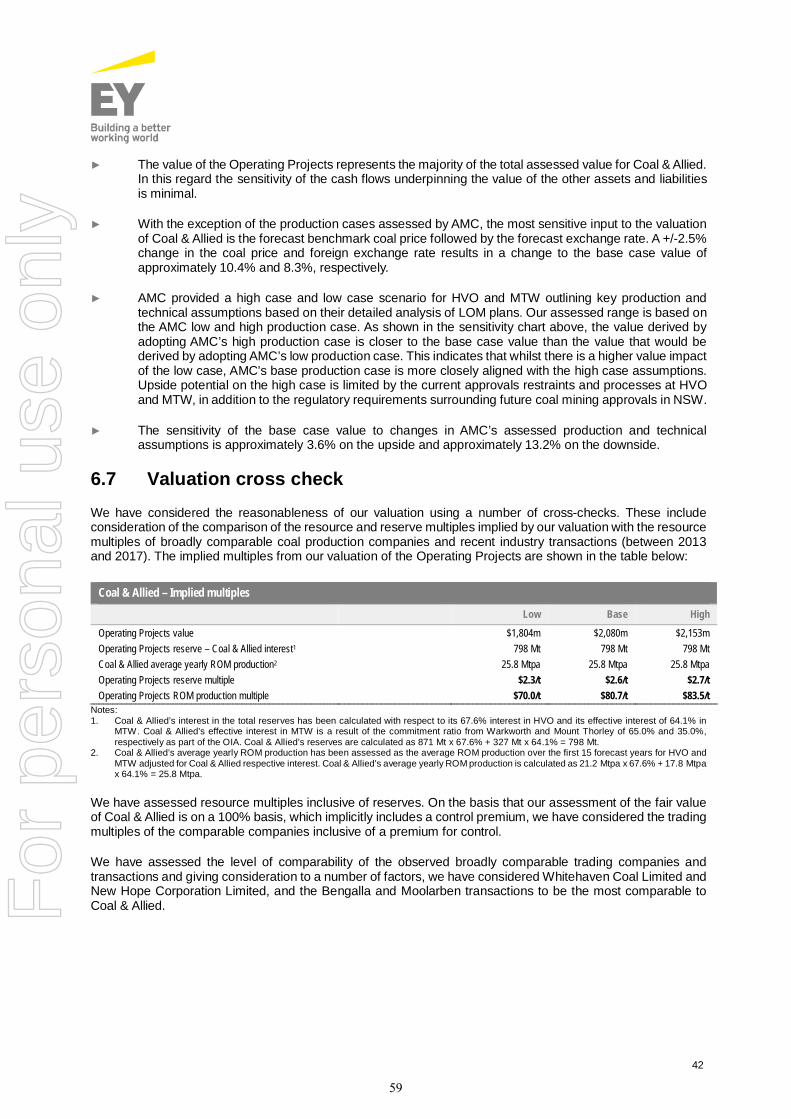
42
► The value of the Operating Projects represents the majority of the total assessed value for Coal & Allied.In this regard the sensitivity of the cash flows underpinning the value of the other assets and liabilitiesis minimal.
► With the exception of the production cases assessed by AMC, the most sensitive input to the valuationof Coal & Allied is the forecast benchmark coal price followed by the forecast exchange rate. A +/-2.5%change in the coal price and foreign exchange rate results in a change to the base case value ofapproximately 10.4% and 8.3%, respectively.
► AMC provided a high case and low case scenario for HVO and MTW outlining key production andtechnical assumptions based on their detailed analysis of LOM plans. Our assessed range is based onthe AMC low and high production case. As shown in the sensitivity chart above, the value derived byadopting AMC’s high production case is closer to the base case value than the value that would bederived by adopting AMC’s low production case. This indicates that whilst there is a higher value impactof the low case, AMC’s base production case is more closely aligned with the high case assumptions.Upside potential on the high case is limited by the current approvals restraints and processes at HVOand MTW, in addition to the regulatory requirements surrounding future coal mining approvals in NSW.
► The sensitivity of the base case value to changes in AMC’s assessed production and technicalassumptions is approximately 3.6% on the upside and approximately 13.2% on the downside.
6.7 Valuation cross checkWe have considered the reasonableness of our valuation using a number of cross-checks. These includeconsideration of the comparison of the resource and reserve multiples implied by our valuation with the resourcemultiples of broadly comparable coal production companies and recent industry transactions (between 2013and 2017). The implied multiples from our valuation of the Operating Projects are shown in the table below:
Notes:1. Coal & Allied’s interest in the total reserves has been calculated with respect to its 67.6% interest in HVO and its effective interest of 64.1% in
MTW. Coal & Allied’s effective interest in MTW is a result of the commitment ratio from Warkworth and Mount Thorley of 65.0% and 35.0%,respectively as part of the OIA. Coal & Allied’s reserves are calculated as 871 Mt x 67.6% + 327 Mt x 64.1% = 798 Mt.
2. Coal & Allied’s average yearly ROM production has been assessed as the average ROM production over the first 15 forecast years for HVO andMTW adjusted for Coal & Allied respective interest. Coal & Allied’s average yearly ROM production is calculated as 21.2 Mtpa x 67.6% + 17.8 Mtpax 64.1% = 25.8 Mtpa.
We have assessed resource multiples inclusive of reserves. On the basis that our assessment of the fair valueof Coal & Allied is on a 100% basis, which implicitly includes a control premium, we have considered the tradingmultiples of the comparable companies inclusive of a premium for control.
We have assessed the level of comparability of the observed broadly comparable trading companies andtransactions and giving consideration to a number of factors, we have considered Whitehaven Coal Limited andNew Hope Corporation Limited, and the Bengalla and Moolarben transactions to be the most comparable toCoal & Allied.
Coal & Allied – Implied multiplesLow Base High
Operating Projects value $1,804m $2,080m $2,153mOperating Projects reserve – Coal & Allied interest1 798 Mt 798 Mt 798 MtCoal & Allied average yearly ROM production2 25.8 Mtpa 25.8 Mtpa 25.8 MtpaOperating Projects reserve multiple $2.3/t $2.6/t $2.7/tOperating Projects ROM production multiple $70.0/t $80.7/t $83.5/t
59
For
per
sona
l use
onl
y

43
Implied reserve multiples
The implied EV/reserve multiples of closely comparable companies and transactions compared to our impliedOperating Projects multiples is shown in the chart below.
Source: S&P Capital IQ, comparables company announcements, EY Transaction Advisory Services analysisNotes: Operating Projects – NPV implied multiple has been assessed on Coal & Allied’s interest basis
We note the following in relation to the chart above:
► Transaction reserve multiples have been highlighted in grey, whereas trading reserve multiples havebeen highlighted in yellow.
► We have included the Moolarben transaction above as Moolarben produces thermal coal and operatesin the Hunter Valley. However we note that this transaction is less comparable than the otherbenchmarks as it involved the acquisition of a very small (1%) stake in this asset.
► We note that Whitehaven Coal Limited is comparable to Coal & Allied in terms of location of operationsand port and rail, however we would expect it to have a higher multiple due to it producing metallurgicalcoal in addition to thermal coal (with metallurgical coal having a higher price per tonne compared tothermal coal).
► New Hope Corporation Limited’s acquisition of Rio Tinto’s interest in the Bengalla coal mine representsthe most comparable transaction to Coal & Allied. We would expect Bengalla to have a higher multiplethan Coal & Allied due primarily to its higher yield and lower cost of operation.
► While broadly consistent with the closely comparable companies, Coal & Allied’s implied EV/reservemultiple is below the median of $4.5/t. This is not unexpected, for the reasons outlined above, andconsidering the production and approvals constraints noted in this report.
Please refer to Appendix E for further information on trading and transaction reserve and resource multiples ofbroadly comparable companies.
The implied reserve multiple for our assessed valuation range for Coal & Allied is broadly consistent withcomparable companies and precedent transactions. The implied resource multiple for our assessed valuationrange for Coal & Allied is also broadly consistent with comparable companies and precedent transactions.
The implied EV/ROM production multiples of closely comparable companies and transactions compared to ourimplied Operating Projects multiples is shown in the chart below.
0.0
1.0
2.0
3.0
4.0
5.0
6.0
7.0
New Hope CorporationLimited
Operating Projects - NPVimplied multiple
Moolarben Whitehaven Coal Limited Bengalla
EV/T
otal
rese
rves
mult
iple
(US$
/t)
EV / total reserve multiple (US$/t)Transaction multiples
Trading multiples
60
For
per
sona
l use
onl
y
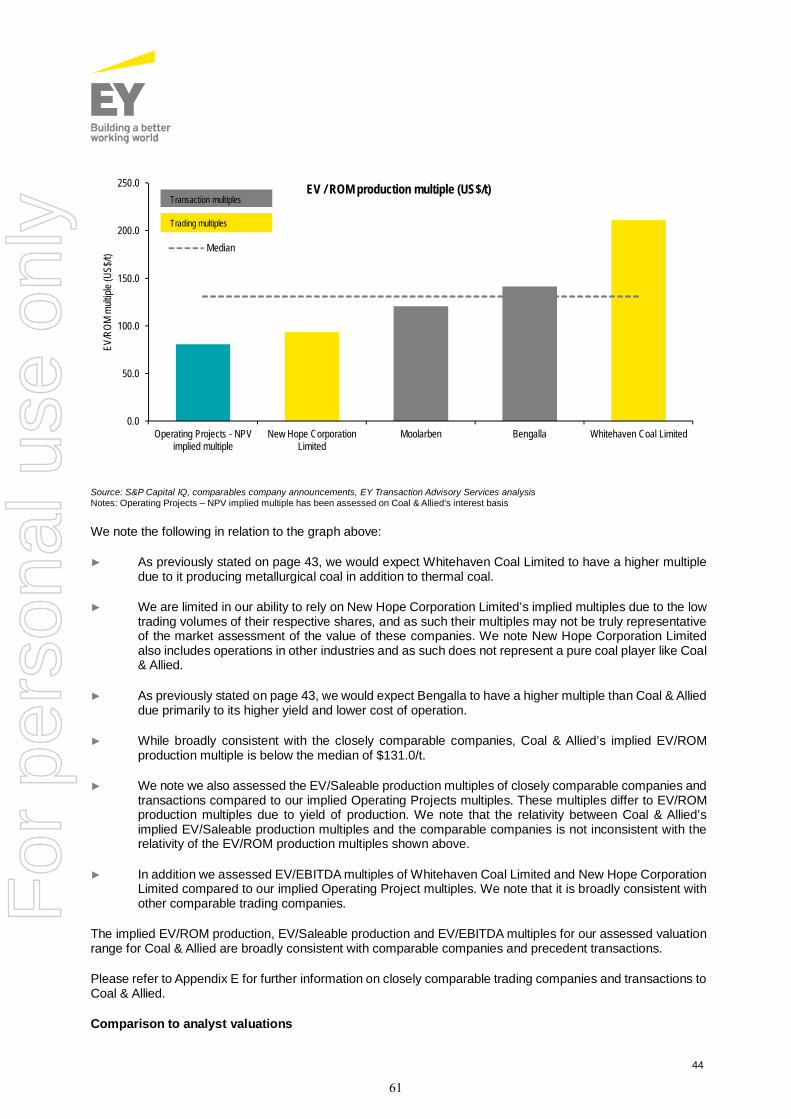
44
Source: S&P Capital IQ, comparables company announcements, EY Transaction Advisory Services analysisNotes: Operating Projects – NPV implied multiple has been assessed on Coal & Allied’s interest basis
We note the following in relation to the graph above:
► As previously stated on page 43, we would expect Whitehaven Coal Limited to have a higher multipledue to it producing metallurgical coal in addition to thermal coal.
► We are limited in our ability to rely on New Hope Corporation Limited’s implied multiples due to the lowtrading volumes of their respective shares, and as such their multiples may not be truly representativeof the market assessment of the value of these companies. We note New Hope Corporation Limitedalso includes operations in other industries and as such does not represent a pure coal player like Coal& Allied.
► As previously stated on page 43, we would expect Bengalla to have a higher multiple than Coal & Allieddue primarily to its higher yield and lower cost of operation.
► While broadly consistent with the closely comparable companies, Coal & Allied’s implied EV/ROMproduction multiple is below the median of $131.0/t.
► We note we also assessed the EV/Saleable production multiples of closely comparable companies andtransactions compared to our implied Operating Projects multiples. These multiples differ to EV/ROMproduction multiples due to yield of production. We note that the relativity between Coal & Allied’simplied EV/Saleable production multiples and the comparable companies is not inconsistent with therelativity of the EV/ROM production multiples shown above.
► In addition we assessed EV/EBITDA multiples of Whitehaven Coal Limited and New Hope CorporationLimited compared to our implied Operating Project multiples. We note that it is broadly consistent withother comparable trading companies.
The implied EV/ROM production, EV/Saleable production and EV/EBITDA multiples for our assessed valuationrange for Coal & Allied are broadly consistent with comparable companies and precedent transactions.
Please refer to Appendix E for further information on closely comparable trading companies and transactions toCoal & Allied.
Comparison to analyst valuations
0.0
50.0
100.0
150.0
200.0
250.0
Operating Projects - NPVimplied multiple
New Hope CorporationLimited
Moolarben Bengalla Whitehaven Coal Limited
EV/R
OMm
ultipl
e(U
S$/t)
EV / ROM production multiple (US$/t)
Median
Transaction multiples
Trading multiples
61
For
per
sona
l use
onl
y

45
In addition to trading and transaction multiples of comparable companies discussed above, we have comparedour valuation range for Coal & Allied to the values implied by equity analysts. The analysts reports we haveaccess to present values for Coal & Allied in the range of $1.8 billion to $2.9 billion with an average of $2.3 billion.
We conclude that our assessed valuation range for Coal & Allied is not inconsistent with values derived fromequities analysts. Refer to section 3.7 for further commentary in respect of the broker coverage.
62
For
per
sona
l use
onl
y

46
7. Valuation of the Consideration and Royalty7.1 Overview of the Consideration and RoyaltyAs previously discussed, on 24 January 2017, Rio Tinto announced that it had reached a binding agreement forthe sale of Coal & Allied to Yancoal. One of the conditions precedent to the Transaction is approval by theNon-Associated Shareholders.
Consideration for the Transaction will be $2.45 billion (cash) made up of a $1.95 billion upfront payment at thecompletion of the Transaction, followed by deferred payments of $100 million per annum over five years totalling$500 million.
Rio Tinto will also be entitled to a Royalty that is based on the Newcastle benchmark thermal coal priceexceeding $75/t (in 2017 dollars, subject to inflation).
7.2 Summary of the valuation of the Consideration and Royalty
Transaction Consideration and Royalty – ValuationUS$m Ref Low HighUpfront cash payment 7.3.1 1,950 1,950Deferred payments 7.3.2 436 436
Royalty 7.3.3 - -Approvals and conditions precedent 7.3.4 (90) -
Fair value of the Consideration and Royalty 2,296 2,386
7.3 Valuation of the Consideration and Royalty
7.3.1 Upfront cash payment
Rio Tinto will be receiving the upfront cash portion of the Consideration from Yancoal on completion of theTransaction. As such, we have valued the upfront cash payment to be $1,950 million.
7.3.2 Deferred payments
Yancoal will pay Rio Tinto five annual payments of $100 million, totalling $500 million, starting from the firstanniversary on completion of the Transaction. The delayed nature of the deferred consideration results in anopportunity cost to Rio Tinto and to a lesser extent counterparty risk.
As the deferred annual payments of $100 million are not adjusted for inflation (i.e. are not escalated each yearto include increases as a result of inflation), we have valued the net present value of the deferred considerationadopting a nominal, pre-tax discount rate of 4.7%. We applied a discount rate based on an assumed cost ofdebt, rather than the Operating Projects WACC. This rate was selected as the deferred payments are consideredto be relatively certain, do not bear project risk, and are secured by way of bank guarantees. The total value ofthe deferred consideration we have included within our valuation of the Consideration is $436 million.
7.3.3 Royalty
Following completion of the Transaction, Rio Tinto will be entitled to a quarterly coal price linked Royaltycalculated as $2/t (subject to an annual CPI adjustment) of attributable saleable production excluding certaincustomer tonnes. The Royalty will extend for a period of 10 years commencing on the third anniversary ofcompletion of the Transaction. This Royalty will be payable if the Newcastle benchmark thermal coal priceexceeds $75/t (in 2017 dollars, subject to inflation).
63
For
per
sona
l use
onl
y
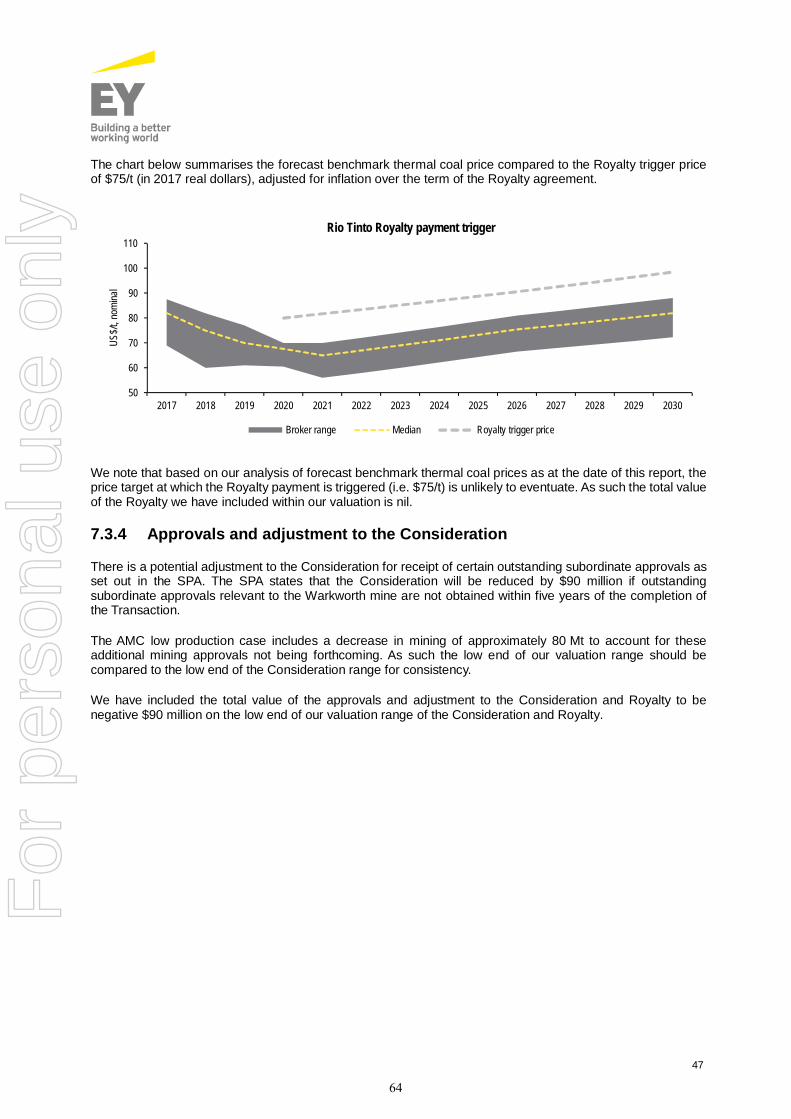
47
The chart below summarises the forecast benchmark thermal coal price compared to the Royalty trigger priceof $75/t (in 2017 real dollars), adjusted for inflation over the term of the Royalty agreement.
We note that based on our analysis of forecast benchmark thermal coal prices as at the date of this report, theprice target at which the Royalty payment is triggered (i.e. $75/t) is unlikely to eventuate. As such the total valueof the Royalty we have included within our valuation is nil.
7.3.4 Approvals and adjustment to the Consideration
There is a potential adjustment to the Consideration for receipt of certain outstanding subordinate approvals asset out in the SPA. The SPA states that the Consideration will be reduced by $90 million if outstandingsubordinate approvals relevant to the Warkworth mine are not obtained within five years of the completion ofthe Transaction.
The AMC low production case includes a decrease in mining of approximately 80 Mt to account for theseadditional mining approvals not being forthcoming. As such the low end of our valuation range should becompared to the low end of the Consideration range for consistency.
We have included the total value of the approvals and adjustment to the Consideration and Royalty to benegative $90 million on the low end of our valuation range of the Consideration and Royalty.
50
60
70
80
90
100
110
2017 2018 2019 2020 2021 2022 2023 2024 2025 2026 2027 2028 2029 2030
US$/
t,no
mina
l
Rio Tinto Royalty payment trigger
Broker range Median Royalty trigger price
64
For
per
sona
l use
onl
y
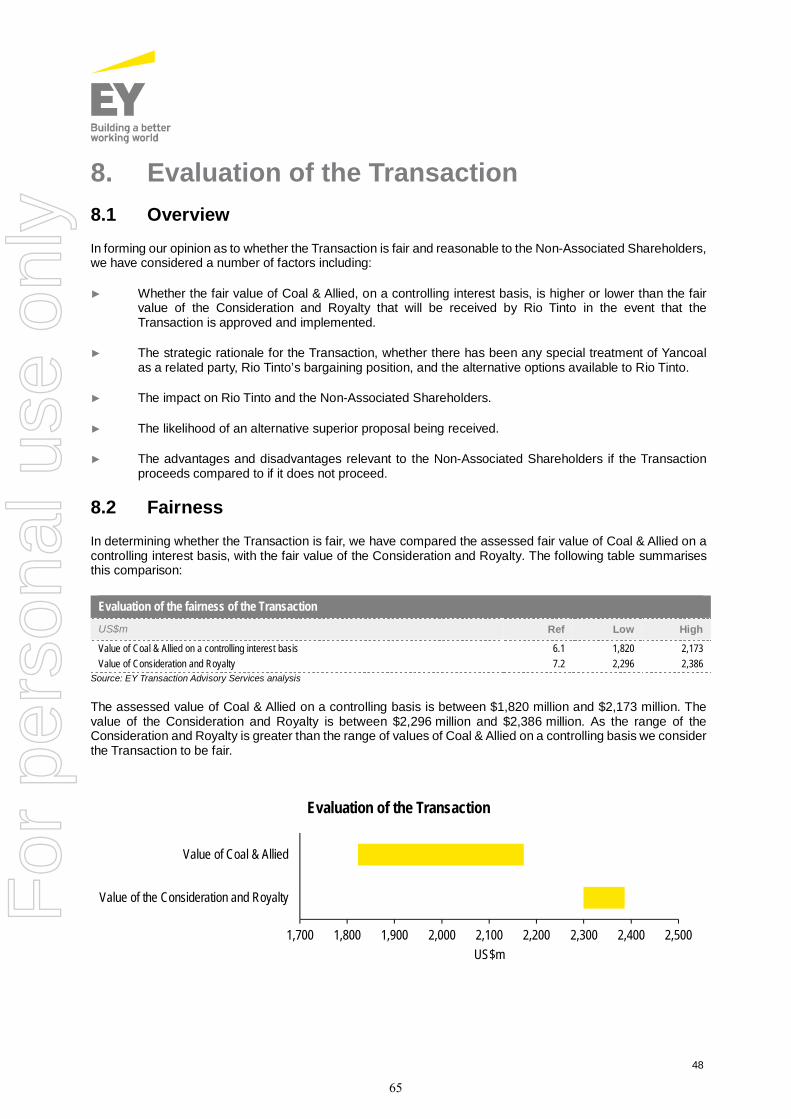
48
8. Evaluation of the Transaction8.1 OverviewIn forming our opinion as to whether the Transaction is fair and reasonable to the Non-Associated Shareholders,we have considered a number of factors including:
► Whether the fair value of Coal & Allied, on a controlling interest basis, is higher or lower than the fairvalue of the Consideration and Royalty that will be received by Rio Tinto in the event that theTransaction is approved and implemented.
► The strategic rationale for the Transaction, whether there has been any special treatment of Yancoalas a related party, Rio Tinto’s bargaining position, and the alternative options available to Rio Tinto.
► The impact on Rio Tinto and the Non-Associated Shareholders.
► The likelihood of an alternative superior proposal being received.
► The advantages and disadvantages relevant to the Non-Associated Shareholders if the Transactionproceeds compared to if it does not proceed.
8.2 FairnessIn determining whether the Transaction is fair, we have compared the assessed fair value of Coal & Allied on acontrolling interest basis, with the fair value of the Consideration and Royalty. The following table summarisesthis comparison:
Source: EY Transaction Advisory Services analysis
The assessed value of Coal & Allied on a controlling basis is between $1,820 million and $2,173 million. Thevalue of the Consideration and Royalty is between $2,296 million and $2,386 million. As the range of theConsideration and Royalty is greater than the range of values of Coal & Allied on a controlling basis we considerthe Transaction to be fair.
1,700 1,800 1,900 2,000 2,100 2,200 2,300 2,400 2,500
Value of the Consideration and Royalty
Value of Coal & Allied
US$m
Evaluation of the Transaction
Evaluation of the fairness of the TransactionUS$m Ref Low High
Value of Coal & Allied on a controlling interest basis 6.1 1,820 2,173Value of Consideration and Royalty 7.2 2,296 2,386
65
For
per
sona
l use
onl
y
49
8.3 ReasonablenessUnder the guidance provided by RG 111, as we consider the terms of the Transaction to be fair, we also considerthe terms to be reasonable. Notwithstanding this conclusion, we have also considered other factors that theNon-Associated Shareholders should consider in forming their view as to whether or not to vote in favour of theTransaction. Individual Non-Associated Shareholders may interpret these factors differently depending on theirown circumstances.
The sub sections below outlined the other factors we have considered. In identifying these factors, we have hadreference to the factors noted in RG 111.62, as well as having regard to the specific circumstances of theTransaction.
8.3.1 The Transaction is the result of a robust sale process
RG 111.62 provides a number of factors to be taken into account when assessing the reasonableness of arelated party transaction. In the context of the Transaction, these factors include considering whether there hasbeen selective treatment of Yancoal and considering the bargaining position of Rio Tinto. In our view, Rio Tintowas in a strong bargaining position, acting in the interests of all of its shareholders, and no selective treatmentwas provided to Yancoal. This is evidenced by our fairness conclusion outlined above (i.e. that the value of theConsideration and Royalty is higher than our assessed value of Coal & Allied), however as further considerationwe have also had regard to of the divestment process undertaken by Rio Tinto.
The Transaction will be Rio Tinto’s seventh divestment of a major coal asset since 2013, and leaves only twomaterial coal assets and certain mining tenements remaining in the Rio Tinto portfolio. Rio Tinto’s thermal coaldivestments have raised approximately $1.9 billion since 2014 (not including the Transaction). Divestments todate have included the Clermont coal mine in Queensland (announced October 2013), Rio Tinto’s coal assetsin Mozambique (announced July 2014), as well as Bengalla (announced September 2015) and Mount Pleasantin NSW (announced January 2016).
Based on our understanding of the process from discussions with Rio Tinto and its advisers, as well as RioTinto’s market announcements, we observe that the Transaction is the culmination of an extensive sale processfor the Coal & Allied assets. As Rio Tinto noted in its announcement dated 24 January 2017, discussions wereheld with several potential acquirers and Yancoal’s offer provided the best value for Rio Tinto shareholders.
8.3.2 Few other acquirers could extract the same value as Yancoal
In accordance with the RG 111, our fair value assessment of Coal & Allied does not include any considerationof the value associated with possible synergies specific to Yancoal. As such, we have not quantified any suchpotential synergies. We expect that there are few other potential acquirers who could extract the same valueout of the Coal & Allied assets as Yancoal. In making this statement, we note the following:
► Yancoal already owns and operates coal mines in the Hunter Valley, and could potentially realiseoperational synergies from owning Coal & Allied. Whilst we have not quantified these synergies, andwe note that structural change may be required to certain joint venture arrangements to achieve thesesynergies, we do consider there to be potential upside value for Yancoal if these synergies can beimplemented. According to Yancoal’s market announcement dated 24 January 2017, Yancoal expectsto be able to realise synergies through blending of product to realise a higher overall price, as well ascost savings from integrating certain operations and functions of Coal & Allied with its existing business.
► Yancoal has significant carried-forward tax losses, recognised as a deferred tax asset on its balancesheet, which it may be able to utilise by integrating a profit-making business into its existing portfolio.The addition of Coal & Allied within Yancoal’s portfolio of coal assets will allow it to realise its deferredtax assets in a shorter timeframe.
66
For
per
sona
l use
onl
y

50
► Yancoal is a ‘pure-play’ coal mining company, meaning that its management team is solely focused oncoal mining assets. In the hands of Yancoal, Coal & Allied’s assets will not be competing for capital withmuch larger, assets in other commodities, as they are in the hands of Rio Tinto. Given the capital costsrequired in order to achieve the life of mine plans for HVO and MTW, we consider that availability ofcapital is a key value driver for the Coal & Allied business.
8.3.3 Alternative options available to Rio Tinto are not considered to provideas much value
Rio Tinto was not an ‘anxious seller’ of Coal & Allied, and based on its most recent balance sheet, the groupdoes not have any solvency issues which would indicate that it had been forced into a divestment in order torealise cash. As stated in Rio Tinto’s announcement on 24 January 2017, Yancoal’s offer represented the bestvalue to Rio Tinto shareholders of all the options considered by Rio Tinto management.
We expect that Rio Tinto would not have agreed to divest Coal & Allied if it considered that better options wereavailable to realise from continued ownership. As noted in section 8.3.1 above, since 2013, Rio Tinto hasdivested a number of its global thermal coal assets. The result of these divestments is that, at the current pointin time, there are few coal assets remaining in the Rio Tinto portfolio, and the relative value contribution of theseassets is small compared to the other parts of Rio Tinto’s business. This means that the remaining assets(including Coal & Allied) are competing for capital, and for management time and attention, with much larger,more profitable assets in other parts of the portfolio.
We provide no comment on the validity of any strategy driving Rio Tinto’s previous actions regarding itsdivestment of global thermal coal assets. We have not observed any significant opposition to previous thermalcoal divestments from shareholders or the market in general, and we note that the exiting of non-core assets isa strategy that has been employed recently by other major global mining companies. The Transaction is notbeing undertaken due to any special treatment of a related party, but rather is consistent with previous actionsin divesting its thermal coal assets. These actions have been clear to shareholders for some time. Should theTransaction be approved and completed, Rio Tinto will receive a relatively significant cash injection which it canuse to focus on the core assets in its portfolio.
8.3.4 Rio Tinto shareholders will be exposed to upside, should the coal priceincrease in the future above certain levels
The Royalty payable to Rio Tinto after the sale is linked to the coal price and is payable on attributable saleableproduction, subject to certain excluded production. Based on the coal price forecasts applied in our valuation,this Royalty is not currently ‘in-the-money’. As such, we have not ascribed any value to this Royalty in our fairvaluation. However, in the event that the Newcastle benchmark thermal coal price exceeds $75/t (in 2017dollars, subject to inflation), Rio Tinto’s shareholders will share in some of this upside through exposure to thecoal Royalty. Further analysis of the sensitivity of the value of Coal & Allied to movements in coal prices iscontained in section 6.6.
8.4 Other considerations
8.4.1 There is limited potential for alternative superior proposals to emerge
While it is possible that an alternative proposal involving Coal & Allied may emerge, we note that since theannouncement of the Transaction, no superior proposals have been received and the Directors of Rio Tinto arenot aware of any potential superior alternative proposal likely to emerge. The Transaction is the result of anextensive divestment process for the Coal & Allied assets, conducted over a number of years. The Directors ofRio Tinto have satisfied themselves that the offer received under the Transaction was the best possible offer forCoal & Allied under this process.
The terms of the SPA prevent Rio Tinto from actively seeking any competing proposals. Further, given thesimilarities between the Coal & Allied and Yancoal businesses, there are few other potential acquirers of Coal& Allied that would be able to realise the same level of synergistic value as Yancoal.
These factors may reduce the likelihood of any superior proposals emerging.
67
For
per
sona
l use
onl
y

51
8.4.2 Impact on Non-Associated Shareholders
As noted in section 3.6, it is difficult to discern whether the price of Rio Tinto Shares reacted to theannouncement of the Transaction. Noting that the fair value of the Consideration and Royalty (presented insection 7.2) makes up approximately 2.7% of Rio Tinto’s overall market capitalisation of $88.3 billion (as at 24January 2017), we do not expect the Transaction to have a significant immediate impact on Non-AssociatedShareholders.
Assuming the Transaction goes ahead, the key impacts for Non-Associated Shareholders will be:
► Rio Tinto will have continued its previous actions of divesting its thermal coal assets, and to focus onother parts of its business. In the long term, execution of these divestments is aimed at driving greatershareholder value through focusing on the remaining parts of the portfolio.
► Rio Tinto will be able to use the cash raised from the Transaction to invest in other areas of the business,or to pay down debt. The immediate impact of the Transaction for Non-Associated Shareholders will bethat the group’s net debt position will be reduced, and its balance sheet strengthened. As reported inits 2016 Annual Report, as at 31 December 2016 Rio Tinto had consolidated net debt (gross debt lesscash) of $10.2 billion. The funds expected to be raised by the Transaction represent approximately 25%of this amount.
8.4.3 Tax consequences
There may be tax implications for Rio Tinto in connection with the Transaction if it is approved and implemented.Our analysis takes into account tax as it relates to the fair value of Coal & Allied, however we have notconsidered all of the specific tax implications for Rio Tinto of the Transaction being approved and implemented.
The Rio Tinto Limited Australian Tax Consolidated Group will recognise a capital gain from the Transaction. Thecapital gain will be taxable at the corporate tax rate of 30% subject to the utilisation of carried forward capitallosses. The quantum of tax payable will depend on the final proceeds (after taking into account working capitaladjustments) and the total of capital gains and losses realised by the Rio Tinto Limited Tax Consolidated Groupas at 31 December 2017.
There will be no specific tax consequences for individual Rio Tinto shareholders as a result of the Transaction.
8.4.4 Costs associated with the Transaction
Rio Tinto will have incurred or committed to incurring various one-off transaction costs. These transaction costswill be payable by Rio Tinto regardless of whether the Transaction is implemented.
If the Transaction is not approved, and in the absence of an alternative offer, Coal & Allied will remain part ofthe Rio Tinto portfolio. As a consequence:
► The advantages, disadvantages and risks of the proposal will not occur other than with respect to theone-off transaction costs incurred or committed prior to the Transaction.
► Rio Tinto shareholders will retain an exposure to thermal coal. Following the previous divestments ofcoal assets from the Rio Tinto portfolio, these coal assets form a much smaller part of the broader RioTinto business, meaning that projects are competing for capital with much larger assets in othercommodities. This is likely to mean that the Coal & Allied assets would remain capital constrained, andthat full value would not be realised for these assets.
68
For
per
sona
l use
onl
y

52
8.5 ConclusionIn the absence of a superior proposal, based on the matters outlined above, in our opinion, the Transaction isfair and reasonable to Non-Associated Shareholders.
This IER has been prepared to assist Non-Associated Shareholders in assessing the merits of the Transaction.In doing so, the report provides general information only and does not consider the individual situation,objectives and needs of each Non-Associated Shareholder. On this basis, Non-Associated Shareholders shouldconsider whether this report is appropriate for their circumstances, having regard to their own situation,objectives and needs before relying on or taking action based on this report. If there is any doubt, Non-Associated Shareholders should seek their own professional advice.
69
For
per
sona
l use
onl
y

53
Appendix A Statement of qualifications and declarationsEY Transaction Advisory Services, which is wholly owned by Ernst & Young, holds an Australian FinancialServices Licence under the Corporations Act 2001 and its representatives are qualified to provide this report.The directors of EY Transaction Advisory Services responsible for this report have not provided financial adviceto Rio Tinto.
Prior to accepting this engagement, EY Transaction Advisory Services considered its independence with respectto Rio Tinto and Yancoal with reference to RG112.
This report has been prepared specifically for the Non-Associated Shareholders in relation to the proposed saleof Coal & Allied to Yancoal. Neither EY Transaction Advisory Services, Ernst & Young and any employee thereofundertakes responsibility to any person, other than the Non-Associated Shareholders, in respect of this report,including any errors or omissions howsoever caused.
The statements and opinions given in this report are given in good faith and the belief that such statements andopinions are not false or misleading. In the preparation of this report EY Transaction Advisory Services hasrelied upon and considered information believed after due inquiry to be reliable and accurate. EY TransactionAdvisory Services has no reason to believe that any information supplied to it was false or that any materialinformation has been withheld from it. EY Transaction Advisory Services has evaluated the information providedto it by Rio Tinto its advisors, as well as other parties, through inquiry, analysis and review, and nothing hascome to its attention to indicate the information provided was materially mis-stated or would not affordreasonable grounds upon which to base its report. EY Transaction Advisory Services does not imply and itshould not be construed that it has audited or in any way verified any of the information provided to it, or that itsinquiries could have verified any matter which a more extensive examination might disclose.
The information relied upon in the preparation of this report is set out in Appendix G to this report.
Rio Tinto has provided an indemnity to EY Transaction Advisory Services for any claims suffered or incurred byEY Transaction Services directly arising out of any mis-statement or omission in any material or informationprovided to EY Transaction Advisory Services and used or relied upon by it in the preparation of this report.
EY Transaction Advisory Services provided draft copies of this report to Rio Tinto for comments as to factualaccuracy, as opposed to opinions, which are the responsibility of EY Transaction Advisory Services alone.Changes made to this report as a result of this review by the Directors and management of Rio Tinto have notchanged the methodology or conclusions reached by EY Transaction Advisory Services.
EY Transaction Advisory Services will receive a professional fee based on time spent in the preparation of thisreport estimated at approximately A$200,000 (exclusive of GST). EY Transaction Advisory Services will not beentitled to any other pecuniary or other benefit whether direct or indirect, in connection with the making of thisreport.
Mr Michael Fenech a director and representative of EY Transaction Advisory Services and a partner ofErnst & Young and Mr Ken Pendergast, a director and representative of EY Transaction Advisory Services anda partner of Ernst & Young have assumed overall responsibility for this report. Both have the necessaryexperience and professional qualifications appropriate to the advice being offered. Other staff have beenconsulted in the preparation of this report where appropriate.
It is not intended that the report should be used for any other purpose other than to be included in the Notice ofMeeting to be sent to the Non-Associated Shareholders be used for any other purpose other than as anexpression of its opinion as to whether or not the proposed sale of Coal & Allied by Yancoal is fair and reasonableto the Non-Associated Shareholders.
EY Transaction Advisory Services consents to the issue of this report in the form and context in which it isincluded in the Notice of Meeting.
70
For
per
sona
l use
onl
y
54
Appendix B Valuation methodologiesRG 111 provides guidance on the valuation methods that an independent expert should consider when valuinga company. These methods include the:
► DCF method and the estimated realisable value of any surplus assets.
► Application of earnings multiples (appropriate to the business or industry in which the entity operates)to the estimated future maintainable earnings or cash flows of the entity, added to the estimatedrealisable value of any surplus assets.
► Amount that would be available for distribution to security holders on an orderly realisation of assets.
► Quoted price for listed securities, when there is a liquid and active market and allowing for the fact thatthe quoted price may not reflect their value, should 100% of the securities be available for sale.
► Recent genuine offers, if any, received by the target for any business units or assets as a basis forvaluation of those business units or assets, and
► Amount that any alternative acquirer might be willing to offer if all the securities in the target wereavailable for purchase.
Each methodology is appropriate in certain circumstances. The decision as to which methodology to applygenerally depends on the nature of the asset being valued, the methodology most commonly adopted in valuingsuch an asset and the availability of appropriate information.
The DCF methodology involves calculating the net present value of cash flows that are expected to be derivedfrom future activities. The forecast cash flows are discounted by a discount rate that reflects the time value ofmoney and the risk inherent in the cash flows. This methodology is particularly appropriate in valuing projects,businesses and companies that are in a start-up phase and are expecting considerable volatility and/or growthin earnings during the growth phase, as well as businesses with a finite life (such as oil and gas projects). Theutilisation of this methodology generally requires that the asset be sufficiently advanced to enable managementto provide long term cash flows with some degree of robustness.
The capitalisation of earnings methodology involves capitalising the earnings of a project, a business or acompany at an appropriate multiple, which reflects the risks underlying the earnings together with growthprospects. This methodology is theoretically most appropriate where a company or business is expected togenerate a relatively stable level of earnings but in practice, is also frequently used in a range of othercircumstances.
The net asset backing methodology involves consideration of the net realisable value of the assets of a businessor company on a going concern basis, assuming an orderly realisation of those assets. This value includes adiscount to allow for the time value of money and for reasonable costs of undertaking the realisation. It is not avaluation on the basis of a forced sale, where assets may be sold at values materially different to their fair value.
Market based assessments relate to the valuation of companies, the shares of which are traded on a stockexchange. While the relevant share price would, prima facie, constitute the market value of the shares, suchmarket prices usually reflect the prices paid for small parcels of shares and as such do not include a controlpremium relevant to a significant parcel of shares.
71
For
per
sona
l use
onl
y
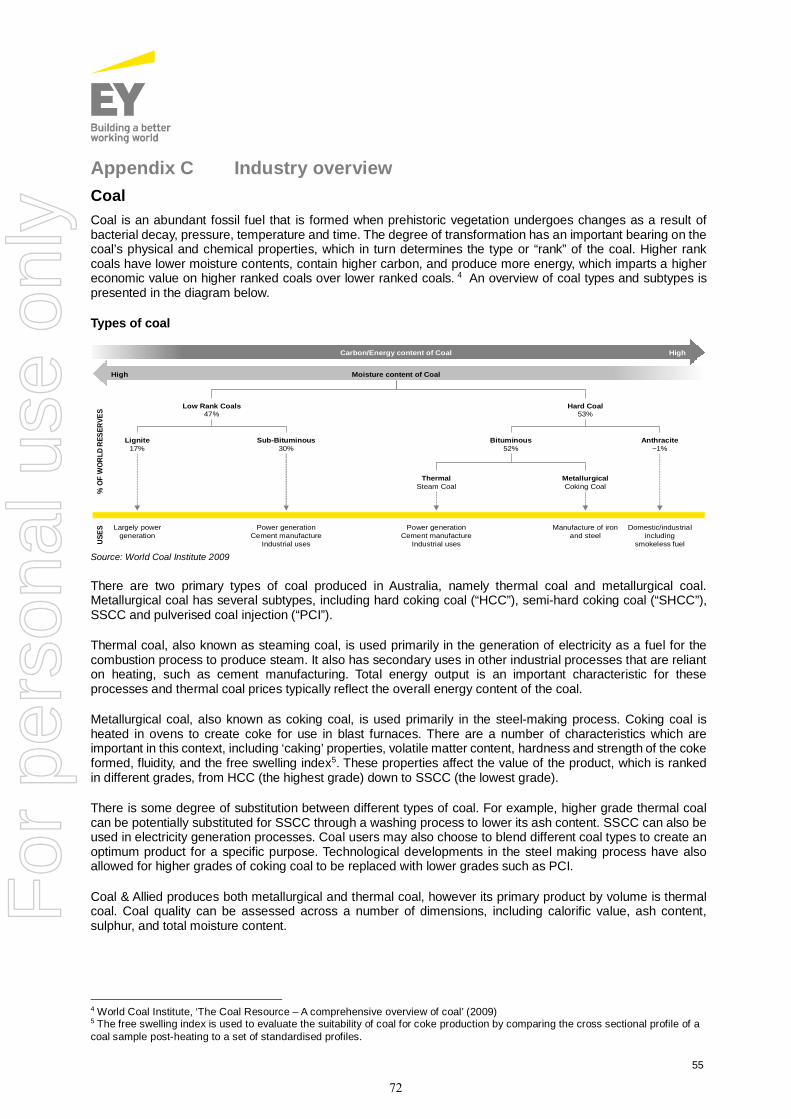
55
Appendix C Industry overviewCoalCoal is an abundant fossil fuel that is formed when prehistoric vegetation undergoes changes as a result ofbacterial decay, pressure, temperature and time. The degree of transformation has an important bearing on thecoal’s physical and chemical properties, which in turn determines the type or “rank” of the coal. Higher rankcoals have lower moisture contents, contain higher carbon, and produce more energy, which imparts a highereconomic value on higher ranked coals over lower ranked coals. 4 An overview of coal types and subtypes ispresented in the diagram below.
Types of coal
Source: World Coal Institute 2009
There are two primary types of coal produced in Australia, namely thermal coal and metallurgical coal.Metallurgical coal has several subtypes, including hard coking coal (“HCC”), semi-hard coking coal (“SHCC”),SSCC and pulverised coal injection (“PCI”).
Thermal coal, also known as steaming coal, is used primarily in the generation of electricity as a fuel for thecombustion process to produce steam. It also has secondary uses in other industrial processes that are relianton heating, such as cement manufacturing. Total energy output is an important characteristic for theseprocesses and thermal coal prices typically reflect the overall energy content of the coal.
Metallurgical coal, also known as coking coal, is used primarily in the steel-making process. Coking coal isheated in ovens to create coke for use in blast furnaces. There are a number of characteristics which areimportant in this context, including ‘caking’ properties, volatile matter content, hardness and strength of the cokeformed, fluidity, and the free swelling index5. These properties affect the value of the product, which is rankedin different grades, from HCC (the highest grade) down to SSCC (the lowest grade).
There is some degree of substitution between different types of coal. For example, higher grade thermal coalcan be potentially substituted for SSCC through a washing process to lower its ash content. SSCC can also beused in electricity generation processes. Coal users may also choose to blend different coal types to create anoptimum product for a specific purpose. Technological developments in the steel making process have alsoallowed for higher grades of coking coal to be replaced with lower grades such as PCI.
Coal & Allied produces both metallurgical and thermal coal, however its primary product by volume is thermalcoal. Coal quality can be assessed across a number of dimensions, including calorific value, ash content,sulphur, and total moisture content.
4 World Coal Institute, ‘The Coal Resource – A comprehensive overview of coal’ (2009)5 The free swelling index is used to evaluate the suitability of coal for coke production by comparing the cross sectional profile of acoal sample post-heating to a set of standardised profiles.
Low Rank Coals47%
Lignite17%
Sub-Bituminous30%
Hard Coal53%
Bituminous52%
Anthracite~1%
ThermalSteam Coal
MetallurgicalCoking Coal
Largely powergeneration
Power generationCement manufacture
Industrial uses
Domestic/industrialincluding
smokeless fuel
Power generationCement manufacture
Industrial uses
Manufacture of ironand steel
Moisture content of Coal
USES
High
HighCarbon/Energy content of Coal
%OF
WOR
LDRE
SERV
ES
72
For
per
sona
l use
onl
y

56
The following figure displays a summary of the quality for thermal coal across geographic regions, as well asthe specific characteristics of Coal & Allied’s product. On most measures, Coal & Allied’s product is higher qualitythan most thermal coals produced around the world.
Thermal coal quality comparisons by key producing regions
Source: Rio Tinto, Platts
Coal miningCoal is mined by two methods: open-cut (or surface mining) or underground (or deep mining). The choice ofmethod mainly depends on the geological characteristics of the coal deposit.
Open-cut mining is only economical when the coal deposit is near the surface. This method involves removal ofthe coal from an open pit. This is achieved by first using a dragline, excavator and/or truck/shovel fleet to removethe overlaying waste material (overburden). The uncovered coal is subsequently extracted using trucks,excavators and/or draglines. More than 90% of the coal deposit can typically be recovered using this method.6
Underground mining is undertaken using two main methods: longwall or bord and pillar (or room and pillar). Thelongwall method involves cutting underground roads into the coal seam to expose blocks of coal up to severalhundreds of metres in width and several kilometres in length. Hydraulic chocks act as roof supports and allowan automated shearer to remove coal, which is then removed from the mine using a conveyor. When coal hasbeen extracted from the area, the roof is allowed to collapse. Over 75% of the coal can be recovered using thismethod. With the bord and pillar method, the coal deposit is mined by cutting a network of rooms into the coalseam leaving behind pillars of coal to support the roof. These pillars can be up to 40% of the coal in the seam.7
Global coal supply, demand and price determinantsDemand
Thermal coal is used primarily as an input for electricity generation, thus the demand for thermal coal is drivenby both the global production of electricity and the relative appeal of coal as an input to the process. In additionto market dynamics, political, legislative and trade policies influence the use of coal within regional energy mixes.
6 World Coal Institute, ‘The Coal Resource – A comprehensive overview of coal’ (2009)7 World Coal Institute, ‘The Coal Resource – A comprehensive overview of coal’ (2009)
HighQuality of coalLow
3,000 7,0005,0004,000 6,000
20.0 0.010.015.0 5.0
1.00 0.500.75 0.25
40.0 20.030.0 10.0
0.00
0.0
Calorific value(kcal/kg GAR)
Ash content(% adb)
Sulphur(% adb)
Total moisture(% arb)
South Africa
Australia Indonesia low rank
Colombia USA - PRB
Coal & Allied
73
For
per
sona
l use
onl
y
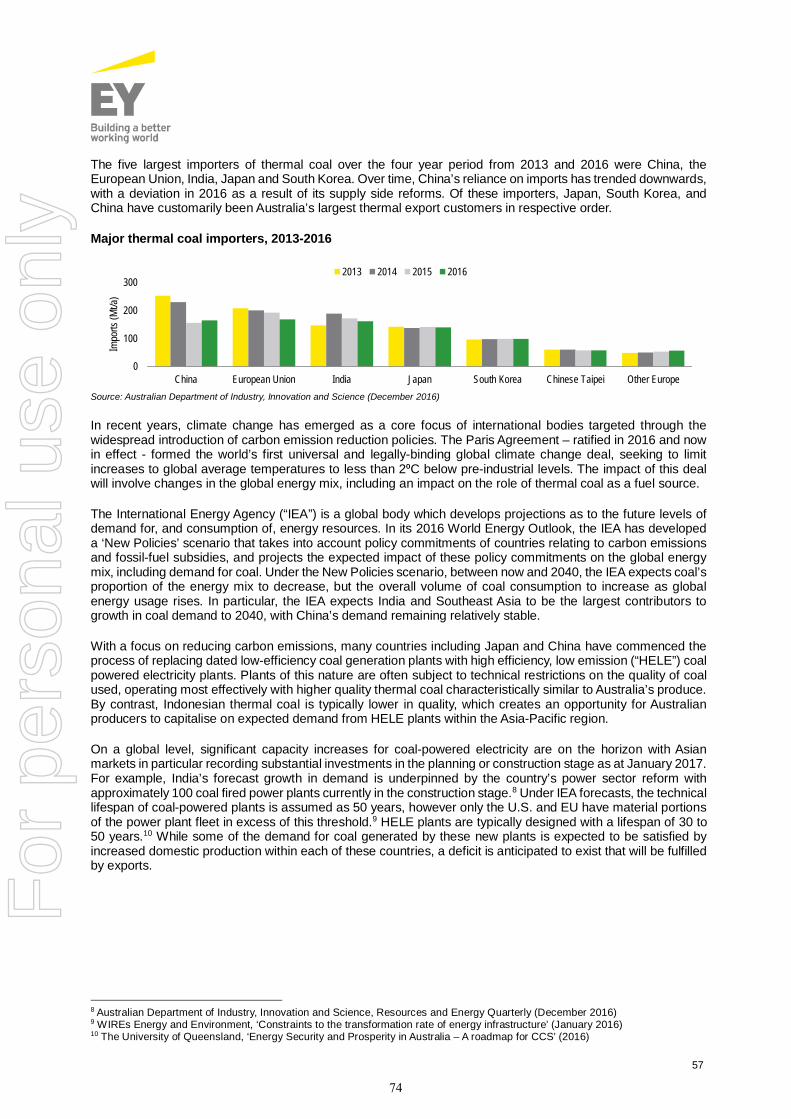
57
The five largest importers of thermal coal over the four year period from 2013 and 2016 were China, theEuropean Union, India, Japan and South Korea. Over time, China’s reliance on imports has trended downwards,with a deviation in 2016 as a result of its supply side reforms. Of these importers, Japan, South Korea, andChina have customarily been Australia’s largest thermal export customers in respective order.
Major thermal coal importers, 2013-2016
Source: Australian Department of Industry, Innovation and Science (December 2016)
In recent years, climate change has emerged as a core focus of international bodies targeted through thewidespread introduction of carbon emission reduction policies. The Paris Agreement – ratified in 2016 and nowin effect - formed the world’s first universal and legally-binding global climate change deal, seeking to limitincreases to global average temperatures to less than 2⁰C below pre-industrial levels. The impact of this dealwill involve changes in the global energy mix, including an impact on the role of thermal coal as a fuel source.
The International Energy Agency (“IEA”) is a global body which develops projections as to the future levels ofdemand for, and consumption of, energy resources. In its 2016 World Energy Outlook, the IEA has developeda ‘New Policies’ scenario that takes into account policy commitments of countries relating to carbon emissionsand fossil-fuel subsidies, and projects the expected impact of these policy commitments on the global energymix, including demand for coal. Under the New Policies scenario, between now and 2040, the IEA expects coal’sproportion of the energy mix to decrease, but the overall volume of coal consumption to increase as globalenergy usage rises. In particular, the IEA expects India and Southeast Asia to be the largest contributors togrowth in coal demand to 2040, with China’s demand remaining relatively stable.
With a focus on reducing carbon emissions, many countries including Japan and China have commenced theprocess of replacing dated low-efficiency coal generation plants with high efficiency, low emission (“HELE”) coalpowered electricity plants. Plants of this nature are often subject to technical restrictions on the quality of coalused, operating most effectively with higher quality thermal coal characteristically similar to Australia’s produce.By contrast, Indonesian thermal coal is typically lower in quality, which creates an opportunity for Australianproducers to capitalise on expected demand from HELE plants within the Asia-Pacific region.
On a global level, significant capacity increases for coal-powered electricity are on the horizon with Asianmarkets in particular recording substantial investments in the planning or construction stage as at January 2017.For example, India’s forecast growth in demand is underpinned by the country’s power sector reform withapproximately 100 coal fired power plants currently in the construction stage.8 Under IEA forecasts, the technicallifespan of coal-powered plants is assumed as 50 years, however only the U.S. and EU have material portionsof the power plant fleet in excess of this threshold.9 HELE plants are typically designed with a lifespan of 30 to50 years.10 While some of the demand for coal generated by these new plants is expected to be satisfied byincreased domestic production within each of these countries, a deficit is anticipated to exist that will be fulfilledby exports.
8 Australian Department of Industry, Innovation and Science, Resources and Energy Quarterly (December 2016)9 WIREs Energy and Environment, ‘Constraints to the transformation rate of energy infrastructure’ (January 2016)10 The University of Queensland, ‘Energy Security and Prosperity in Australia – A roadmap for CCS’ (2016)
0
100
200
300
China European Union India Japan South Korea Chinese Taipei Other Europe
Impo
rts(M
t/a)
2013 2014 2015 2016
74
For
per
sona
l use
onl
y
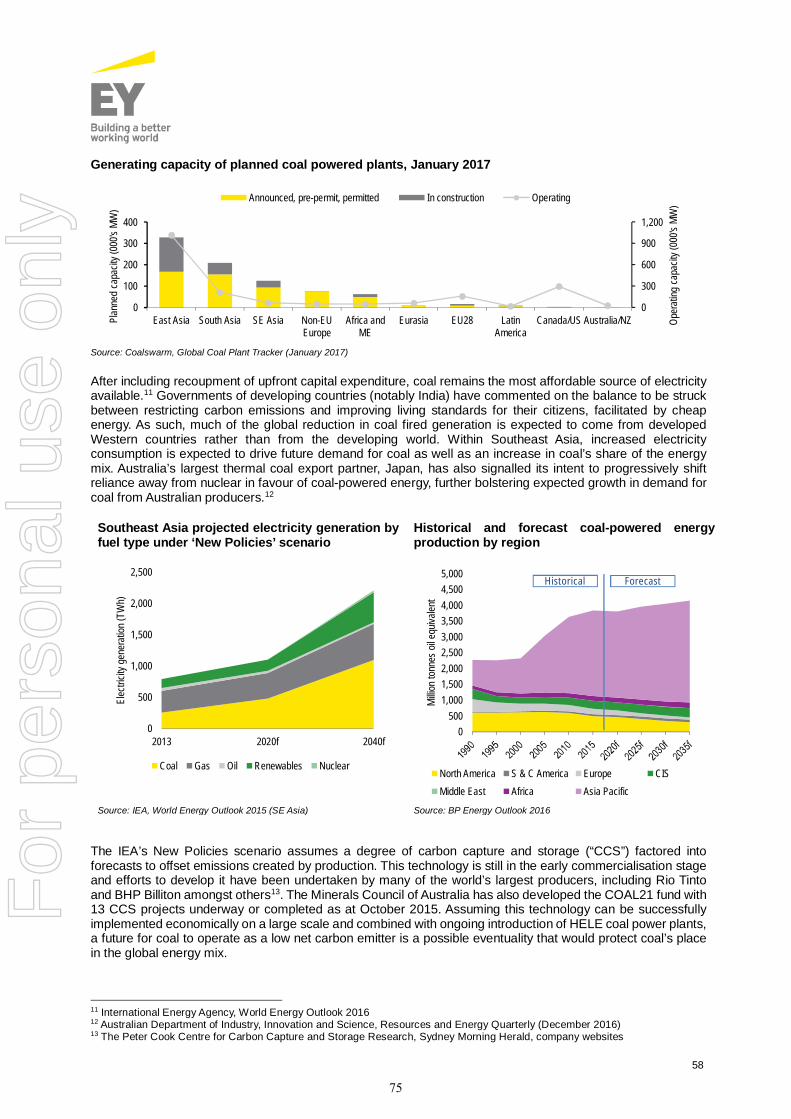
58
Generating capacity of planned coal powered plants, January 2017
Source: Coalswarm, Global Coal Plant Tracker (January 2017)
After including recoupment of upfront capital expenditure, coal remains the most affordable source of electricityavailable.11 Governments of developing countries (notably India) have commented on the balance to be struckbetween restricting carbon emissions and improving living standards for their citizens, facilitated by cheapenergy. As such, much of the global reduction in coal fired generation is expected to come from developedWestern countries rather than from the developing world. Within Southeast Asia, increased electricityconsumption is expected to drive future demand for coal as well as an increase in coal’s share of the energymix. Australia’s largest thermal coal export partner, Japan, has also signalled its intent to progressively shiftreliance away from nuclear in favour of coal-powered energy, further bolstering expected growth in demand forcoal from Australian producers.12
Southeast Asia projected electricity generation byfuel type under ‘New Policies’ scenario
Historical and forecast coal-powered energyproduction by region
Source: IEA, World Energy Outlook 2015 (SE Asia) Source: BP Energy Outlook 2016
The IEA’s New Policies scenario assumes a degree of carbon capture and storage (“CCS”) factored intoforecasts to offset emissions created by production. This technology is still in the early commercialisation stageand efforts to develop it have been undertaken by many of the world’s largest producers, including Rio Tintoand BHP Billiton amongst others13. The Minerals Council of Australia has also developed the COAL21 fund with13 CCS projects underway or completed as at October 2015. Assuming this technology can be successfullyimplemented economically on a large scale and combined with ongoing introduction of HELE coal power plants,a future for coal to operate as a low net carbon emitter is a possible eventuality that would protect coal’s placein the global energy mix.
11 International Energy Agency, World Energy Outlook 201612 Australian Department of Industry, Innovation and Science, Resources and Energy Quarterly (December 2016)13 The Peter Cook Centre for Carbon Capture and Storage Research, Sydney Morning Herald, company websites
0
300
600
900
1,200
0
100
200
300
400
East Asia South Asia SE Asia Non-EUEurope
Africa andME
Eurasia EU28 LatinAmerica
Canada/US Australia/NZ Oper
ating
capa
city(
000's
MW)
Plan
ned
capa
city(
000's
MW
)
Announced, pre-permit, permitted In construction Operating
0
500
1,000
1,500
2,000
2,500
2013 2020f 2040f
Elec
tricity
gene
ratio
n(T
Wh)
Coal Gas Oil Renewables Nuclear
0500
1,0001,5002,0002,5003,0003,5004,0004,5005,000
Milli
onto
nnes
oileq
uivale
nt
North America S & C America Europe CISMiddle East Africa Asia Pacific
Historical Forecast
75
For
per
sona
l use
onl
y
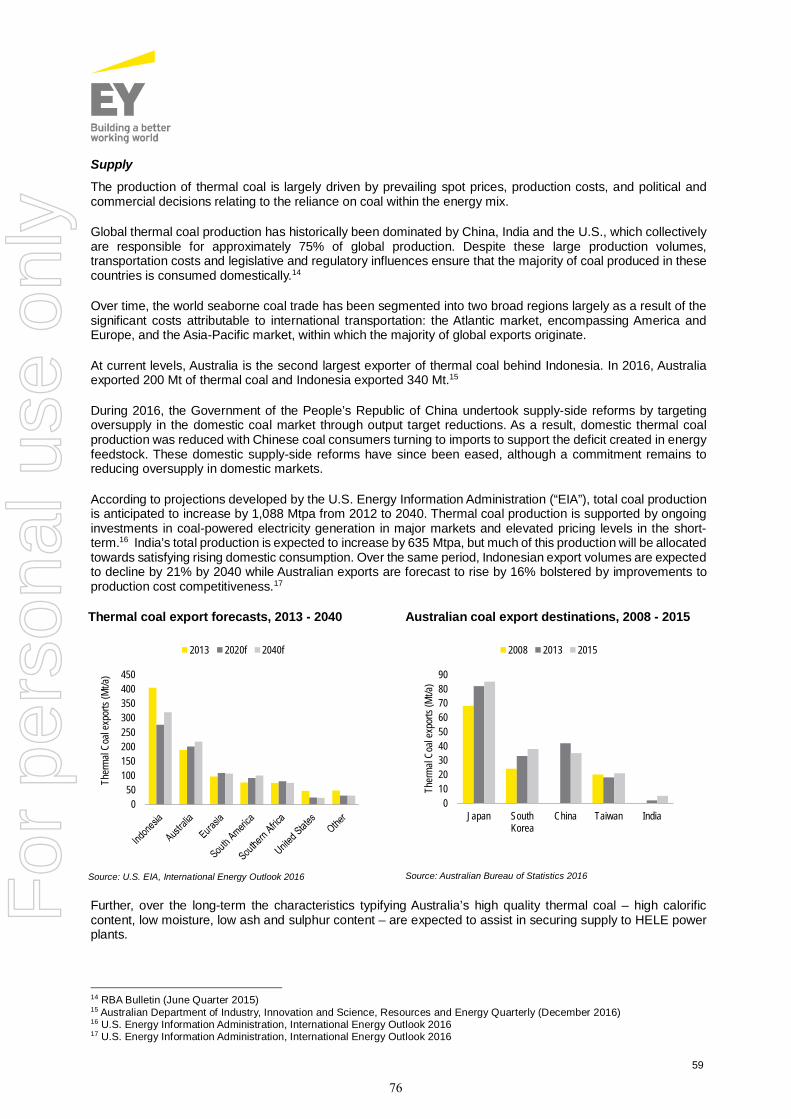
59
Supply
The production of thermal coal is largely driven by prevailing spot prices, production costs, and political andcommercial decisions relating to the reliance on coal within the energy mix.
Global thermal coal production has historically been dominated by China, India and the U.S., which collectivelyare responsible for approximately 75% of global production. Despite these large production volumes,transportation costs and legislative and regulatory influences ensure that the majority of coal produced in thesecountries is consumed domestically.14
Over time, the world seaborne coal trade has been segmented into two broad regions largely as a result of thesignificant costs attributable to international transportation: the Atlantic market, encompassing America andEurope, and the Asia-Pacific market, within which the majority of global exports originate.
At current levels, Australia is the second largest exporter of thermal coal behind Indonesia. In 2016, Australiaexported 200 Mt of thermal coal and Indonesia exported 340 Mt.15
During 2016, the Government of the People’s Republic of China undertook supply-side reforms by targetingoversupply in the domestic coal market through output target reductions. As a result, domestic thermal coalproduction was reduced with Chinese coal consumers turning to imports to support the deficit created in energyfeedstock. These domestic supply-side reforms have since been eased, although a commitment remains toreducing oversupply in domestic markets.
According to projections developed by the U.S. Energy Information Administration (“EIA”), total coal productionis anticipated to increase by 1,088 Mtpa from 2012 to 2040. Thermal coal production is supported by ongoinginvestments in coal-powered electricity generation in major markets and elevated pricing levels in the short-term.16 India’s total production is expected to increase by 635 Mtpa, but much of this production will be allocatedtowards satisfying rising domestic consumption. Over the same period, Indonesian export volumes are expectedto decline by 21% by 2040 while Australian exports are forecast to rise by 16% bolstered by improvements toproduction cost competitiveness.17
Thermal coal export forecasts, 2013 - 2040 Australian coal export destinations, 2008 - 2015
Source: U.S. EIA, International Energy Outlook 2016 Source: Australian Bureau of Statistics 2016
Further, over the long-term the characteristics typifying Australia’s high quality thermal coal – high calorificcontent, low moisture, low ash and sulphur content – are expected to assist in securing supply to HELE powerplants.
14 RBA Bulletin (June Quarter 2015)15 Australian Department of Industry, Innovation and Science, Resources and Energy Quarterly (December 2016)16 U.S. Energy Information Administration, International Energy Outlook 201617 U.S. Energy Information Administration, International Energy Outlook 2016
050
100150200250300350400450
Ther
mal
Coal
expo
rts(M
t/a)
2013 2020f 2040f
0102030405060708090
Japan SouthKorea
China Taiwan India
Ther
mal
Coal
expo
rts(M
t/a)
2008 2013 2015
76
For
per
sona
l use
onl
y
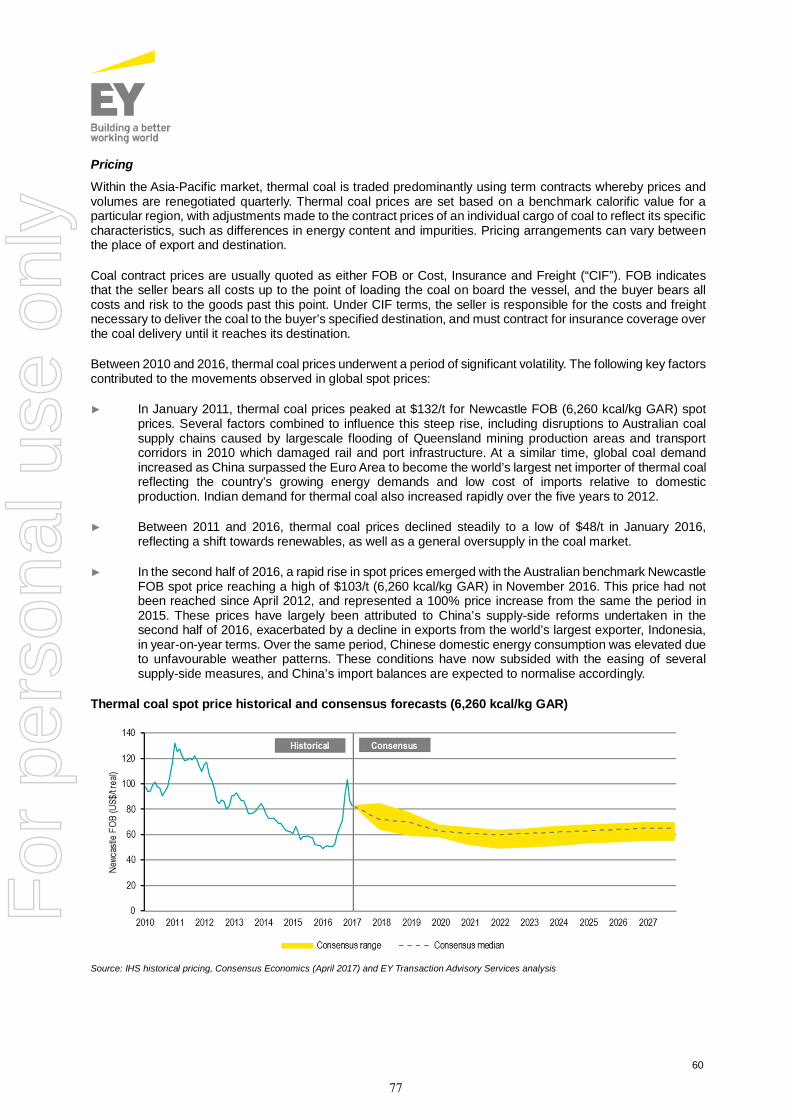
60
Pricing
Within the Asia-Pacific market, thermal coal is traded predominantly using term contracts whereby prices andvolumes are renegotiated quarterly. Thermal coal prices are set based on a benchmark calorific value for aparticular region, with adjustments made to the contract prices of an individual cargo of coal to reflect its specificcharacteristics, such as differences in energy content and impurities. Pricing arrangements can vary betweenthe place of export and destination.
Coal contract prices are usually quoted as either FOB or Cost, Insurance and Freight (“CIF”). FOB indicatesthat the seller bears all costs up to the point of loading the coal on board the vessel, and the buyer bears allcosts and risk to the goods past this point. Under CIF terms, the seller is responsible for the costs and freightnecessary to deliver the coal to the buyer’s specified destination, and must contract for insurance coverage overthe coal delivery until it reaches its destination.
Between 2010 and 2016, thermal coal prices underwent a period of significant volatility. The following key factorscontributed to the movements observed in global spot prices:
► In January 2011, thermal coal prices peaked at $132/t for Newcastle FOB (6,260 kcal/kg GAR) spotprices. Several factors combined to influence this steep rise, including disruptions to Australian coalsupply chains caused by largescale flooding of Queensland mining production areas and transportcorridors in 2010 which damaged rail and port infrastructure. At a similar time, global coal demandincreased as China surpassed the Euro Area to become the world’s largest net importer of thermal coalreflecting the country’s growing energy demands and low cost of imports relative to domesticproduction. Indian demand for thermal coal also increased rapidly over the five years to 2012.
► Between 2011 and 2016, thermal coal prices declined steadily to a low of $48/t in January 2016,reflecting a shift towards renewables, as well as a general oversupply in the coal market.
► In the second half of 2016, a rapid rise in spot prices emerged with the Australian benchmark NewcastleFOB spot price reaching a high of $103/t (6,260 kcal/kg GAR) in November 2016. This price had notbeen reached since April 2012, and represented a 100% price increase from the same the period in2015. These prices have largely been attributed to China’s supply-side reforms undertaken in thesecond half of 2016, exacerbated by a decline in exports from the world’s largest exporter, Indonesia,in year-on-year terms. Over the same period, Chinese domestic energy consumption was elevated dueto unfavourable weather patterns. These conditions have now subsided with the easing of severalsupply-side measures, and China’s import balances are expected to normalise accordingly.
Thermal coal spot price historical and consensus forecasts (6,260 kcal/kg GAR)
Source: IHS historical pricing, Consensus Economics (April 2017) and EY Transaction Advisory Services analysis
77
For
per
sona
l use
onl
y

61
The price movement in 2016 is an indication of the influence that China has on global coal markets. China isexpected to continue to be a key driver behind global thermal coal prices into the future. With large thermal coalimport balances and sizeable planned investments in HELE coal-powered energy generation, India also exertssignificant influence over current and future spot price movements.
China’s reliance on imports is expected to return to ‘normal’ levels in 2017, thereby prompting spot prices tomove towards 2014-2015 levels which occurred under similar conditions.18 Spot prices trended sharplydownwards towards the end of 2016, which suggests this movement may be underway.
Hunter ValleyOverview of the Hunter Valley coal industry
The NSW coal industry is an important component of theNSW economy, with significant contribution to Staterevenue, employment and power generation. The NSWcoalfields are spread across the Sydney, Gunnedah,Gloucester and Oaklands basins and produced a combined195 Mt of saleable coal in 2016.19 The Hunter Valleycoalfield is located on the North Eastern boundary of theSydney Basin, which forms a part of the five majorcoalfields in NSW. Occupying an area of 2,100 squarekilometres, there are currently 16 operating mines withinthe area. Collectively these mines contribute to over 50%of NSW’s annual saleable coal production.
Coal resources in this region are characterised by theirrelatively shallow seam depth, allowing for the applicationof large-scale, open cut mining operations. Supplementingthis is a highly accessible transportation network, which hasallowed Hunter Valley coal producers to be highlycompetitive in international markets.
There are over 60 coal seams in this area distributedthroughout the Greta, Wittingham and Newcastle CoalMeasures. The vast majority of reserves in the region areexport quality low-ash, high energy thermal coal and low-ash soft coking coal20.
Major producers in the Hunter Coalfield include Glencore,Rio Tinto (Coal & Allied), Peabody Energy, Yancoal, and BHP Billiton. The largest producer is Glencore,operating eight mines in the region. BHP Billiton operates Mount Arthur, which is the largest single coal mine.
18 Australian Department of Industry, Innovation and Science, Resources and Energy Quarterly (December 2016)19 Factiva 201720 NSW Trade and Investment, NSW Coal Industry Profile 2014
NSW Coalfields
Source: Resources and Energy, 2017, NSW Coalfields
78
For
per
sona
l use
onl
y
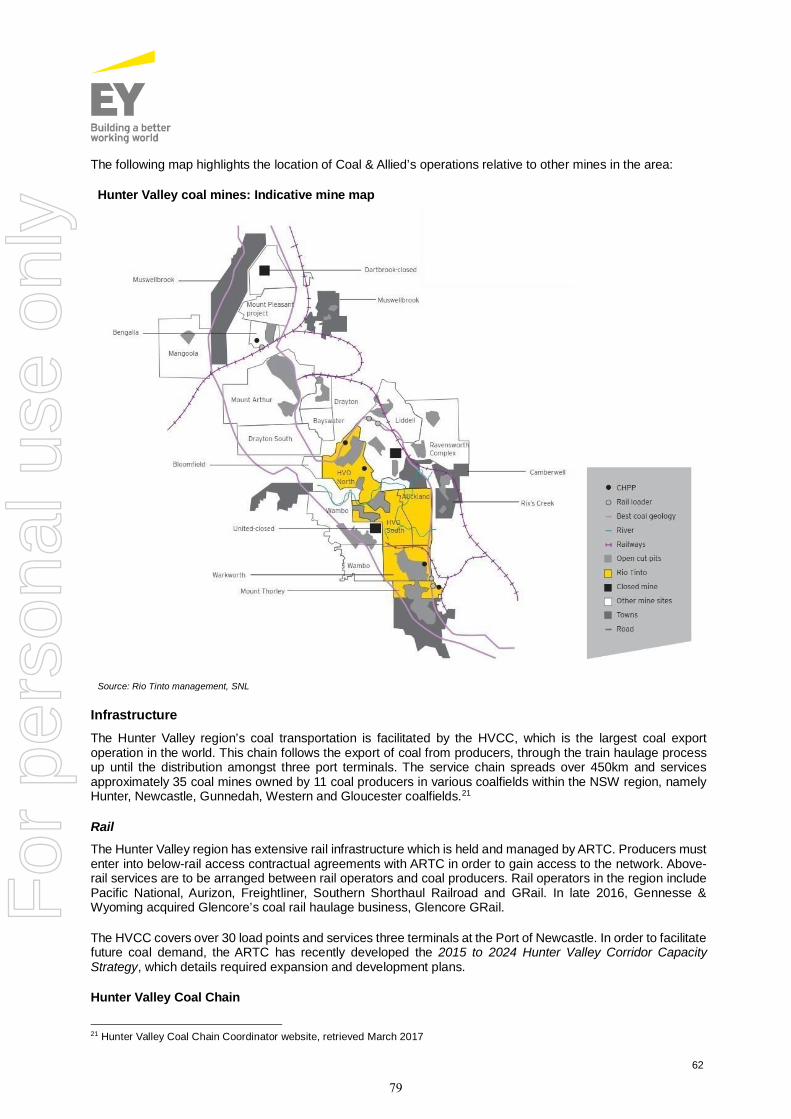
62
The following map highlights the location of Coal & Allied’s operations relative to other mines in the area:
Hunter Valley coal mines: Indicative mine map
Source: Rio Tinto management, SNL
InfrastructureThe Hunter Valley region’s coal transportation is facilitated by the HVCC, which is the largest coal exportoperation in the world. This chain follows the export of coal from producers, through the train haulage processup until the distribution amongst three port terminals. The service chain spreads over 450km and servicesapproximately 35 coal mines owned by 11 coal producers in various coalfields within the NSW region, namelyHunter, Newcastle, Gunnedah, Western and Gloucester coalfields.21
Rail
The Hunter Valley region has extensive rail infrastructure which is held and managed by ARTC. Producers mustenter into below-rail access contractual agreements with ARTC in order to gain access to the network. Above-rail services are to be arranged between rail operators and coal producers. Rail operators in the region includePacific National, Aurizon, Freightliner, Southern Shorthaul Railroad and GRail. In late 2016, Gennesse &Wyoming acquired Glencore’s coal rail haulage business, Glencore GRail.
The HVCC covers over 30 load points and services three terminals at the Port of Newcastle. In order to facilitatefuture coal demand, the ARTC has recently developed the 2015 to 2024 Hunter Valley Corridor CapacityStrategy, which details required expansion and development plans.
Hunter Valley Coal Chain
21 Hunter Valley Coal Chain Coordinator website, retrieved March 2017
79
For
per
sona
l use
onl
y
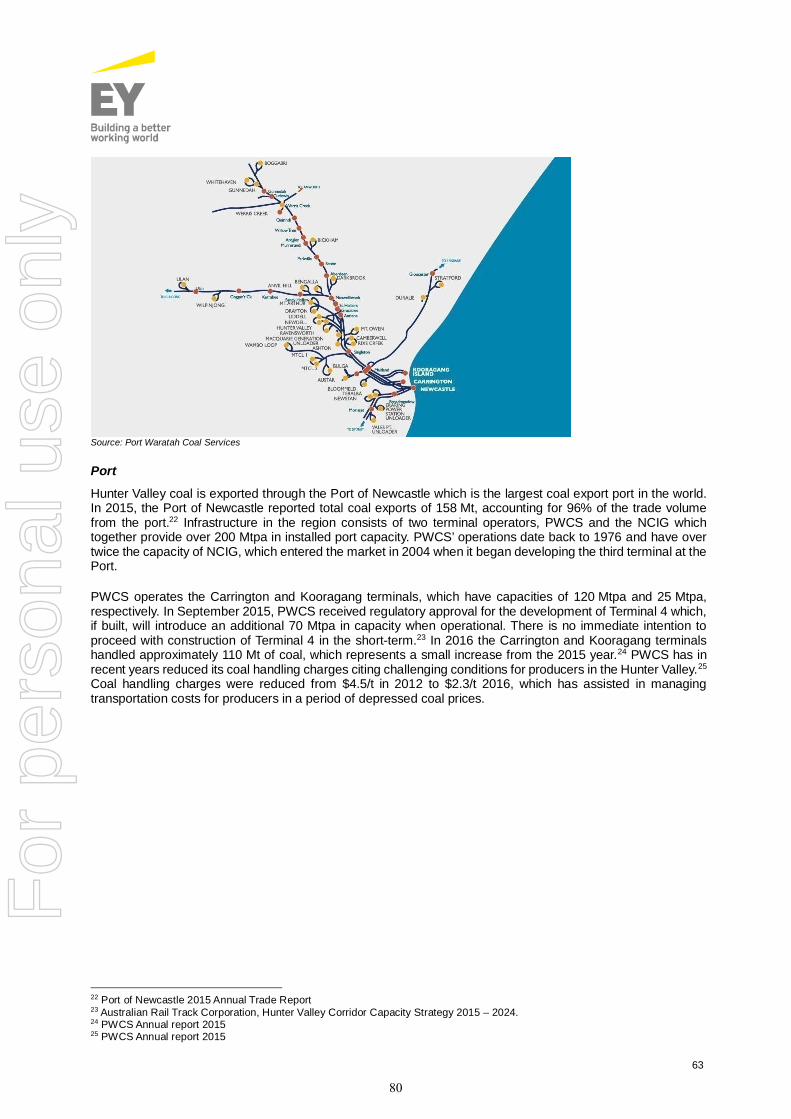
63
Source: Port Waratah Coal Services
Port
Hunter Valley coal is exported through the Port of Newcastle which is the largest coal export port in the world.In 2015, the Port of Newcastle reported total coal exports of 158 Mt, accounting for 96% of the trade volumefrom the port.22 Infrastructure in the region consists of two terminal operators, PWCS and the NCIG whichtogether provide over 200 Mtpa in installed port capacity. PWCS’ operations date back to 1976 and have overtwice the capacity of NCIG, which entered the market in 2004 when it began developing the third terminal at thePort.
PWCS operates the Carrington and Kooragang terminals, which have capacities of 120 Mtpa and 25 Mtpa,respectively. In September 2015, PWCS received regulatory approval for the development of Terminal 4 which,if built, will introduce an additional 70 Mtpa in capacity when operational. There is no immediate intention toproceed with construction of Terminal 4 in the short-term.23 In 2016 the Carrington and Kooragang terminalshandled approximately 110 Mt of coal, which represents a small increase from the 2015 year.24 PWCS has inrecent years reduced its coal handling charges citing challenging conditions for producers in the Hunter Valley.25
Coal handling charges were reduced from $4.5/t in 2012 to $2.3/t 2016, which has assisted in managingtransportation costs for producers in a period of depressed coal prices.
22 Port of Newcastle 2015 Annual Trade Report23 Australian Rail Track Corporation, Hunter Valley Corridor Capacity Strategy 2015 – 2024.24 PWCS Annual report 201525 PWCS Annual report 2015
80
For
per
sona
l use
onl
y

64
Port Waratah Coal Services operational metrics, 2012-2016
Source: Port Waratah Coal Services operating statistics 2016
NCIG operates a single export facility on Kooragang Island, which in 2014 after expansion reached a maximumdesign capacity of 66 Mtpa. Although NCIG does not publically report company data, Platts Coal Trader’ssuggest that 51 Mt of coal was exported from their facilities in 2016.26
Regulatory environmentThe coal mining industry is regulated by both State and Federal governments in relation to development,operations, and royalties, taxes and levies payable arising from operations.
At a state level, the conduct of mining and exploration activities within NSW requires an authority acquiredpursuant to the Mining Act 1992 (NSW), which takes the form of an exploration license, assessment lease, or amining lease. The Titles Recommendation Committee informs relevant decision-maker for titles approvals, andgives consideration to various principles and policies in determining the outcome of an application. Dependingon the type of activity considered, other legislative approvals may also be triggered.
Running parallel with this process is a requirement for major mining projects to undertake the MineralExploration and Development Assessment Process according to the provisions of the EPA Act. An applicationunder the EPA Act undertakes submissions of a mine plan, environmental impact statement (“EIS”), andcommunity consultation.
In addition, coal mining operations must be granted an environment protection license under the provisions ofthe Protection of the Environment Operations Act 1997 (NSW). For many large-scale mining developments,approval must also be sought from the Commonwealth under the Environment Protection and Biodiversity Act1999 (Cth) through the submission of a separate Environmental Impact Statement.
Coal mines in NSW are often challenged by rival industry groups, communities and environmental associations.Notable recent opposition to mine development and expansion in the Hunter region includes Anglo American’sDrayton South mine. In February 2017, the mine’s expansion was rejected for the fourth time under significantopposition from the neighbouring horse breeding industry.
As in other states, royalties are levied on the right to extract coal and applied to all coal recovered within NSW.Two types of royalties apply, depending on the nature of the coal produced: Ad Valorem Royalty, which is appliedas a percentage of the value of production and is currently set at 8.2% for open cut mines; and Coal RejectRoyalty, which applies to by-products created in the mining or processing of coal, and which are below set ashand energy thresholds. The royalty rate for Coal Reject is no more than half of the applicable Ad Valorem Royalty.In 2016, the NSW Office of State Revenue received A$1,081 billion in coal royalties.
Industry-based associations also play an important role in regulating and developing the coal industry. Forexample, the Australian Coal Industry Research Program (“ACIRP”) receives 5 cents per saleable tonne as alevy from industry members. ACIRP directs this funding towards research and development programs toimprove the efficiency of mining operations, and explore innovative technologies.
26 Factiva, 2017 ‘Australia’s Newcastle port sets record for monthly coal exports in Dec’
15 17 13 12 15
91 92 99 97 94
4.5 4.5 4.5
2.9 2.8 2.6 2.5 2.3 2.3
0
1
2
3
4
5
020406080
100120
2012 2013 2014 2015 2016
Coal
hand
ling
char
ge(A
U$)
Expo
rts(m
tonn
es)
Coking coal Thermal coal Coal handling charge
81
For
per
sona
l use
onl
y
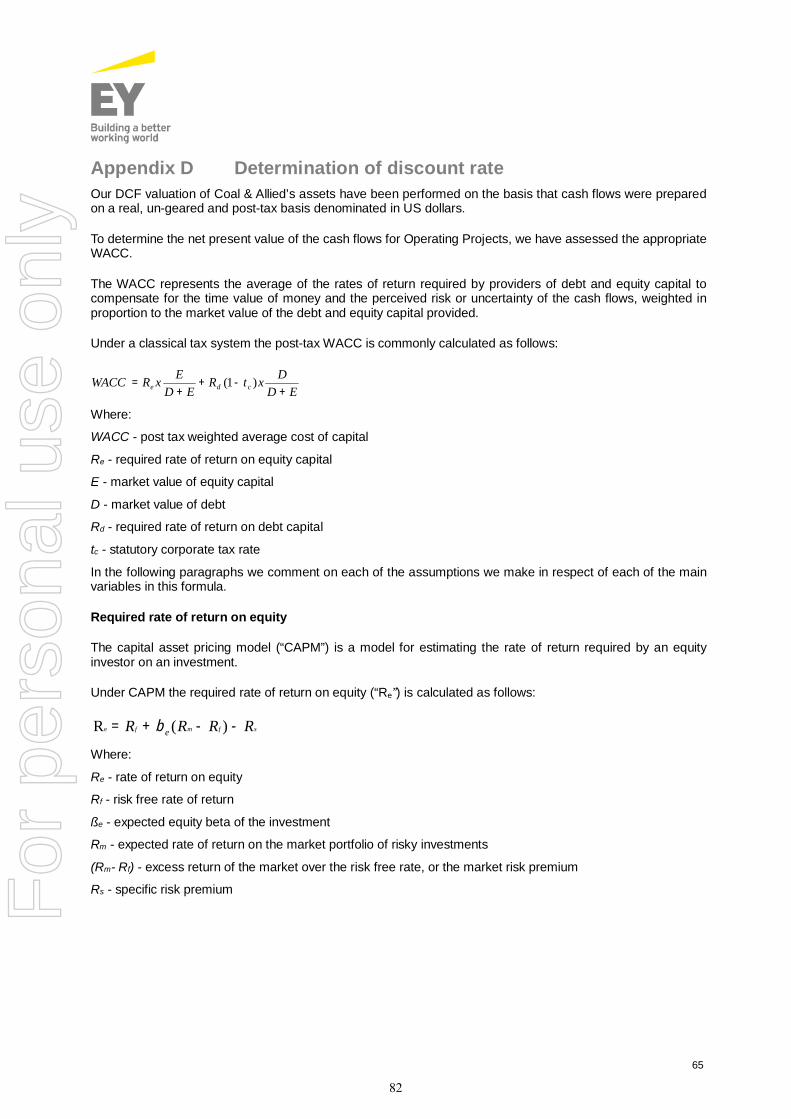
65
Appendix D Determination of discount rateOur DCF valuation of Coal & Allied’s assets have been performed on the basis that cash flows were preparedon a real, un-geared and post-tax basis denominated in US dollars.
To determine the net present value of the cash flows for Operating Projects, we have assessed the appropriateWACC.
The WACC represents the average of the rates of return required by providers of debt and equity capital tocompensate for the time value of money and the perceived risk or uncertainty of the cash flows, weighted inproportion to the market value of the debt and equity capital provided.
Under a classical tax system the post-tax WACC is commonly calculated as follows:
EDDxtR
EDExRWACC cde +
-++
= )1(
Where:
WACC - post tax weighted average cost of capital
Re - required rate of return on equity capital
E - market value of equity capital
D - market value of debt
Rd - required rate of return on debt capital
tc - statutory corporate tax rate
In the following paragraphs we comment on each of the assumptions we make in respect of each of the mainvariables in this formula.
Required rate of return on equity
The capital asset pricing model (“CAPM”) is a model for estimating the rate of return required by an equityinvestor on an investment.
Under CAPM the required rate of return on equity (“Re”) is calculated as follows:
sfmf RRRR e --+= )(Re b
Where:
Re - rate of return on equity
Rf - risk free rate of return
ße - expected equity beta of the investment
Rm - expected rate of return on the market portfolio of risky investments
(Rm- Rf) - excess return of the market over the risk free rate, or the market risk premium
Rs - specific risk premium
82
For
per
sona
l use
onl
y

66
Risk free rate
The 20 year government bond market is a widely adopted proxy for the risk free rate. The risk free rate for theUS denominated WACC was based on the 20 year US Treasury bond yield as at 7 April 2017 of 2.74%.
Market risk premium
► The market risk premium (Rm – Rf) represents the additional return an investor expects to receive tocompensate for additional risk associated with investing in equities as opposed to assets on which arisk free rate of return is earned. Generally, most estimates fall within a range of approximately 4.0% to8.0%. However, investors’ expectations of the premium can change as the market fluctuates andperceptions of the riskiness of equities change.
► We have adopted a market risk premium of 6.0% in calculating our US denominated WACC.
Beta
The beta measures the expected relative risk of the equity in a company. The choice of the beta requiresjudgement and necessarily involves subjective assessment as it is exposed to deviations in measurementapproaches and a high degree of variation. In order to determine an appropriate beta to use for the valuation ofCoal and Allied’s operations, we have considered the observed betas of comparable companies and appliedour professional judgement.
Beta can be expressed as an equity beta, which includes the effect of gearing on equity returns, or as an assetbeta, which removes the impact of gearing. The asset beta will be lower than the equity beta for any giveninvestment, with the extent of the difference dependent on the level of debt in the capital structure. The greaterthe level of gearing, the greater is the risk faced by equity holders (as debt holders have a contractual right ofreturn and so first claim on the operating income). Accordingly, for a given asset beta, the equity beta willincrease as the level of gearing increases.
We used the following formula to undertake the de-gearing and re-gearing exercise:
( )÷øö
çèæ -+= cae t
ED 11bb
Where:
βe – the equity or geared beta
βa – the ungeared beta
tc – the statutory corporate tax rate
D/E - equals the market value of debt divided by the market value of equity capital
In assessing a range of betas, we selected a group of companies deemed broadly comparable to Coal & Allied.We selected those companies with producing coal projects within Australia, as well as diversified miners withcoal projects in Australia and internationally. Our data set included both companies with small scale operationslimited to a single country and those with more diversified operations.
We note that for many of the comparable companies, the data sourced for calculating the betas resulted in non-meaningful data. We have excluded any betas where the R-squared value was less than 0.04 as these betasare not meaningful.
The table on the next page summarises the beta information of broadly comparable companies to Coal & Allied.
83
For
per
sona
l use
onl
y
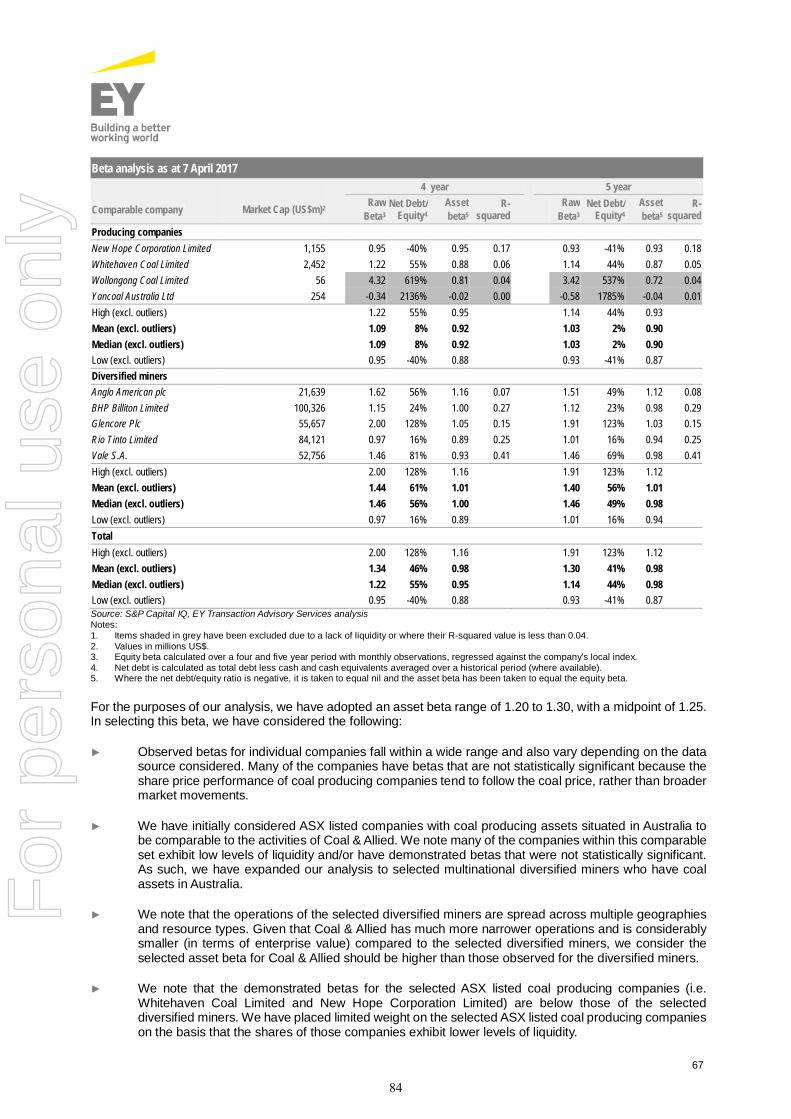
67
Beta analysis as at 7 April 20174 year 5 year
Comparable company1 Market Cap (US$m)2 RawBeta3
Net Debt/Equity4
Assetbeta5
R-squared
RawBeta3
Net Debt/Equity4
Assetbeta5
R-squared
Producing companiesNew Hope Corporation Limited 1,155 0.95 -40% 0.95 0.17 0.93 -41% 0.93 0.18Whitehaven Coal Limited 2,452 1.22 55% 0.88 0.06 1.14 44% 0.87 0.05Wollongong Coal Limited 56 4.32 619% 0.81 0.04 3.42 537% 0.72 0.04Yancoal Australia Ltd 254 -0.34 2136% -0.02 0.00 -0.58 1785% -0.04 0.01High (excl. outliers) 1.22 55% 0.95 1.14 44% 0.93Mean (excl. outliers) 1.09 8% 0.92 1.03 2% 0.90Median (excl. outliers) 1.09 8% 0.92 1.03 2% 0.90Low (excl. outliers) 0.95 -40% 0.88 0.93 -41% 0.87Diversified minersAnglo American plc 21,639 1.62 56% 1.16 0.07 1.51 49% 1.12 0.08BHP Billiton Limited 100,326 1.15 24% 1.00 0.27 1.12 23% 0.98 0.29Glencore Plc 55,657 2.00 128% 1.05 0.15 1.91 123% 1.03 0.15Rio Tinto Limited 84,121 0.97 16% 0.89 0.25 1.01 16% 0.94 0.25Vale S.A. 52,756 1.46 81% 0.93 0.41 1.46 69% 0.98 0.41High (excl. outliers) 2.00 128% 1.16 1.91 123% 1.12Mean (excl. outliers) 1.44 61% 1.01 1.40 56% 1.01Median (excl. outliers) 1.46 56% 1.00 1.46 49% 0.98Low (excl. outliers) 0.97 16% 0.89 1.01 16% 0.94TotalHigh (excl. outliers) 2.00 128% 1.16 1.91 123% 1.12Mean (excl. outliers) 1.34 46% 0.98 1.30 41% 0.98Median (excl. outliers) 1.22 55% 0.95 1.14 44% 0.98Low (excl. outliers) 0.95 -40% 0.88 0.93 -41% 0.87Source: S&P Capital IQ, EY Transaction Advisory Services analysisNotes:1. Items shaded in grey have been excluded due to a lack of liquidity or where their R-squared value is less than 0.04.2. Values in millions US$.3. Equity beta calculated over a four and five year period with monthly observations, regressed against the company’s local index.4. Net debt is calculated as total debt less cash and cash equivalents averaged over a historical period (where available).5. Where the net debt/equity ratio is negative, it is taken to equal nil and the asset beta has been taken to equal the equity beta.
For the purposes of our analysis, we have adopted an asset beta range of 1.20 to 1.30, with a midpoint of 1.25.In selecting this beta, we have considered the following:
► Observed betas for individual companies fall within a wide range and also vary depending on the datasource considered. Many of the companies have betas that are not statistically significant because theshare price performance of coal producing companies tend to follow the coal price, rather than broadermarket movements.
► We have initially considered ASX listed companies with coal producing assets situated in Australia tobe comparable to the activities of Coal & Allied. We note many of the companies within this comparableset exhibit low levels of liquidity and/or have demonstrated betas that were not statistically significant.As such, we have expanded our analysis to selected multinational diversified miners who have coalassets in Australia.
► We note that the operations of the selected diversified miners are spread across multiple geographiesand resource types. Given that Coal & Allied has much more narrower operations and is considerablysmaller (in terms of enterprise value) compared to the selected diversified miners, we consider theselected asset beta for Coal & Allied should be higher than those observed for the diversified miners.
► We note that the demonstrated betas for the selected ASX listed coal producing companies (i.e.Whitehaven Coal Limited and New Hope Corporation Limited) are below those of the selecteddiversified miners. We have placed limited weight on the selected ASX listed coal producing companieson the basis that the shares of those companies exhibit lower levels of liquidity.
84
For
per
sona
l use
onl
y

68
Capital structure
In calculating the WACC, we need to make an assumption regarding an optimal capital structure at which to re-gear the asset beta, and with which to weight the cost of equity and cost of debt. Generally, the gearing leveladopted should reflect the level of debt that can reasonably be sustained by any company operating in anindustry, rather than actual gearing maintained by the current business owners.
In order to determine an appropriate capital structure, we have had regard to both the capital structures of Coal& Allied, and the capital structure of other companies in the industry. In relation to the capital structure, we note:
► Coal & Allied’s debt to equity ratio was approximately 0.1% in December 2015, and nil in December2016.
► The steep decline in global coal prices over the preceding five years has influenced the profitability andequity values of producing firms, and to a lesser extent diversified miners. As such, prevailing debt toequity levels are considered higher than long-term optimal capital structures.
► The funding structure of coal production projects typically shifts over time as the asset becomesoperational and matures. In the initial stages debt is often incorporated within the funding structure, yetas projects mature funding is generally sourced from equity. We note that Coal & Allied has beenestablished since 1960 with production commencing at the HVO in 1968 and MTW in 1981. Thus, weconsider Coal & Allied’s operations to be relatively mature and should reflect a lower level of gearingwhen compared to companies with less established operations.
Accordingly, we have assumed a debt to equity ratio range of nil to 20% to be appropriate as a proxy for theoptimal gearing ratio for Coal & Allied.
Cost of debt
The estimated cost of debt for the US denominated WACC is based on the margin over the yield on 20 year USTreasury bonds.
The debt premium over the risk free rate reflects debt related risks specific to the business being valued (i.e.the risk that the business will default on payments). The cost of debt represents the cost of funding over the lifeof the cash flow model, which is ultimately a proxy for the rate of return that providers of debt would require forcompensating the time-value of money and the risk associated with the particular business. In arriving at anappropriate debt premium we have had regard to a number of factors including:
► The margin implicit in corporate bond yields over US Treasury bond yields. Implied yields reflect themarket’s view of risk as at a point in time and care should be exercised before incorporating these intoany assessment of an entity’s cost of debt.
► The debt ratings of comparable companies. We note that Standard & Poor’s BBB credit ratings aretypical for medium to large scale mining companies who lack of geographical and commoditydiversification, such as Coal & Allied. We thus we consider this rating appropriate for Coal & Allied.
► Long-term average historical monthly BBB corporate bond yields, published by S&P Capital IQ. Withreference to historical yields observed, we have chosen to adopt a spread of 2.0% over the long-termrisk free rate. The following table details historical US BBB-rated bond yields and spread over 20 yearUS Treasury bond rates between 2012 and 2017.
85
For
per
sona
l use
onl
y
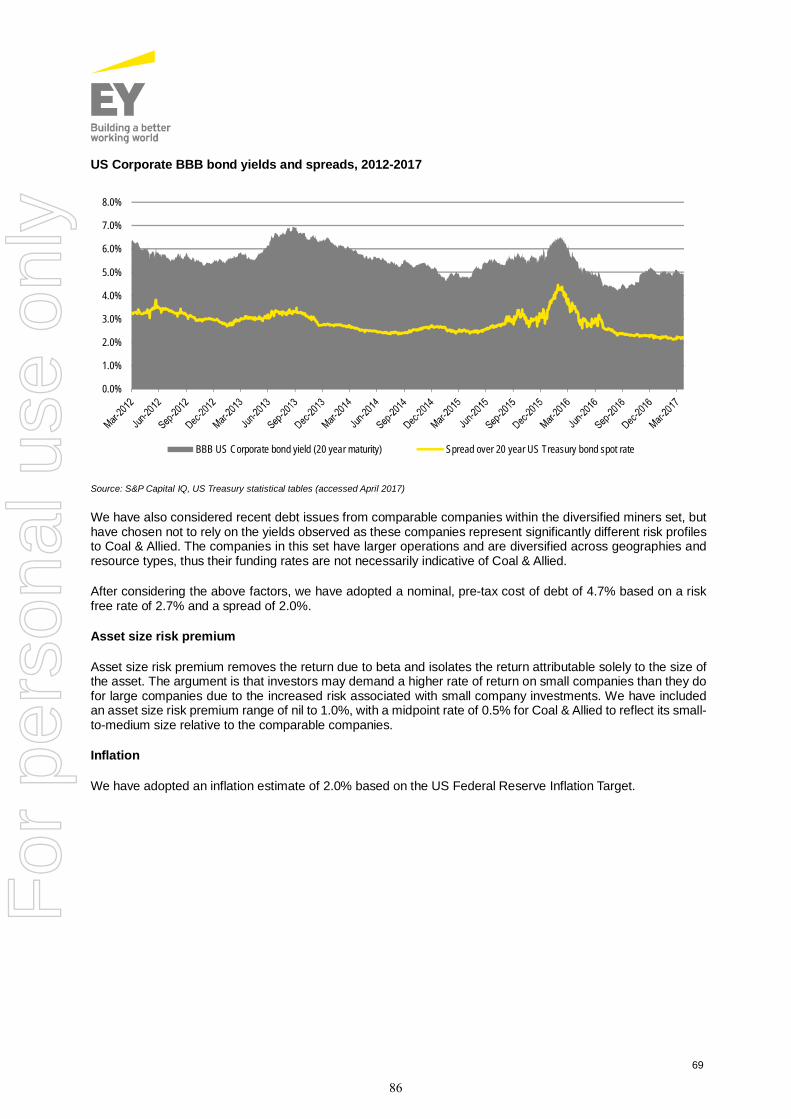
69
US Corporate BBB bond yields and spreads, 2012-2017
Source: S&P Capital IQ, US Treasury statistical tables (accessed April 2017)
We have also considered recent debt issues from comparable companies within the diversified miners set, buthave chosen not to rely on the yields observed as these companies represent significantly different risk profilesto Coal & Allied. The companies in this set have larger operations and are diversified across geographies andresource types, thus their funding rates are not necessarily indicative of Coal & Allied.
After considering the above factors, we have adopted a nominal, pre-tax cost of debt of 4.7% based on a riskfree rate of 2.7% and a spread of 2.0%.
Asset size risk premium
Asset size risk premium removes the return due to beta and isolates the return attributable solely to the size ofthe asset. The argument is that investors may demand a higher rate of return on small companies than they dofor large companies due to the increased risk associated with small company investments. We have includedan asset size risk premium range of nil to 1.0%, with a midpoint rate of 0.5% for Coal & Allied to reflect its small-to-medium size relative to the comparable companies.
Inflation
We have adopted an inflation estimate of 2.0% based on the US Federal Reserve Inflation Target.
0.0%
1.0%
2.0%
3.0%
4.0%
5.0%
6.0%
7.0%
8.0%
BBB US Corporate bond yield (20 year maturity) Spread over 20 year US Treasury bond spot rate
86
For
per
sona
l use
onl
y

70
WACC
On the basis of the above, we have adopted the following inputs in our calculation of the nominal and real post-tax WACCs as shown in the table below.
Weighted Average Cost of Capital
Parameters Low Base High
Cost of equity calculationLong term risk free rate (US Govt. 20 yr bond - spot rate) 2.7% 2.7% 2.7%Selected asset beta 1.20 1.25 1.30Debt to equity market value 0.0% 10.0% 20.0%Income tax rate 30.0% 30.0% 30.0%Relevered beta 1.20 1.34 1.48Equity market risk premium 6.0% 6.0% 6.0%Asset size risk premium 0.0% 0.5% 1.0%Cost of equity capital 9.9% 11.3% 12.6%Cost of debt calculationLong term risk free rate (US Govt. 20 yr bond - spot rate) 2.7% 2.7% 2.7%Company-specific adjustment 2.0% 2.0% 2.0%Income tax rate 30.0% 30.0% 30.0%After-tax cost of debt 3.3% 3.3% 3.3%Capital structureDebt to Enterprise value 0.0% 9.1% 16.7%Equity to Enterprise value 100.0% 90.9% 83.3%Adopted:WACC (post-tax, nominal) 10.0% 10.5% 11.0%WACC (post-tax, real) 8.0% 8.5% 9.0%Source: EY Transaction Advisory Services analysis
87
For
per
sona
l use
onl
y

71
Appendix E Valuation cross checkTrading multiples of comparable companiesTo assess the reasonableness of the values assessed for Coal & Allied, we have compared the resource andreserve multiples implied by our valuation range with resources and reserves multiples calculated for broadlycomparable listed companies with producing coal projects in Australia. These are shown in the tables below.
Implied multiples (US$/t)
Company
Enterprisevalue
(US$m)
M + Iresource
(Mt)
Totalresource
(Mt)
Totalreserve
(Mt)M + I
resourceTotal
resourceTotal
reservePrimary coaltype Location of operations
Yancoal 3,773 2,225 2,879 555 1.70 1.31 6.80 Metallurgical Basins in NSW, QLD &WA
Whitehaven 3,644 2,191 3,608 778 1.66 1.01 4.68 Metallurgical /Thermal Basins in NSW & QLD
New Hope 1,398 1,527 2,271 668 0.92 0.62 2.09 Thermal Basins in NSW & QLDWollongong 637 230 652 94 2.77 0.98 6.80 Metallurgical Sydney BasinBathurst 59 61 108 21 0.97 0.54 2.83 Metallurgical New Zealand
High 1.70 1.31 6.80 Mean 1.42 0.98 4.52 Median 1.66 1.01 4.68 Low 0.92 0.62 2.09
Source: S&P Capital IQ, comparable companies announcements, Ernst & Young Transaction Advisory Services analysisNotes:1. Amounts presented in US dollars2. M + I refers to the aggregated Measured and Indicated resource3. Enterprise value calculated based on the market capitalisation of the comparable companies as at 7 April 2017.4. Enterprise value includes an assumed notional control premium of 30%.5. Wollongong has been excluded from the analysis on the basis that the company is currently under financial distress.6. Stanmore has been excluded from the analysis on the basis that the majority of their resources relate to exploration assets as opposed to
producing assets.
On the basis that our assessment of the fair value of Coal & Allied is on a 100% basis, which implicitly includesa control premium, we have considered the trading multiples inclusive of a control premium. In our assessmentof the appropriate control premium we have considered the following:
► The median bid premium paid on global transactions for publically listed companies across all industriesin the 12 months to December 2016 was 32% based on 534 transactions.27
► The median bid premium paid on global transactions publically listed companies within the miningindustry in the 12 months to December 2016 was 62% based on 31 transactions. 28
► The range of control premiums consistently referred to in Australia is generally between 20% and 40%29,which recognises that such premium will vary from circumstance to circumstance.
Based on the above, we consider it appropriate to adopt a control premium of 30%.
Industry transaction multiplesWe have also considered the prices achieved from transactions from 2013 involving the sale of coal producingcompanies or assets in Australia. The implied multiples of the observed comparable transactions are presentedin the tables in the following pages.
27 Factset Mergerstat – Control Premium Study 4th Quarter 201628 Factset Mergerstat – Control Premium Study 4th Quarter 201629 Lonergan, W, The Valuation of Businesses, Shares and Other Equity 4th Edition, 2003
88
For
per
sona
l use
onl
y

72
EV/resource ($/t) Additional information
Date Target Acquirer
Enterprisevalue
($ million)
Percentageacquired
(%)M + I resource
(Mt)
Totalresource
(Mt)
Totalreserve
(Mt)M + I
resourceTotal
resourceTotal
reservePrimary coaltype Location of operations
Acquisitions > 50%2-Nov-16 Metropolitan South32 200 100% na na 25 na na 8.00 Metallurgical Helensburgh, NSW4-Jul-16 Blair Athol Orion Mining n/a 100% 7 7 na na na na Thermal Bowen Basin, QLD4-Apr-16 Foxleigh Realm Resources 33 100% 15 38 13 2.23 0.88 2.55 Metallurgical Bowen Basin, QLD20-Jan-16 Callide Batchfire Resources n/a 100% 457 534 195 na na na Thermal Callide Basin, QLD30-Jul-15 Isaac Plains Stanmore 23 100% 19 30 5 1.19 0.76 4.55 Metallurgical Bowen Basin, QLD8-Jul-15 Wilkie Creek Sekitan Resources 75 100% na na na na na na Thermal Surat Basin, QLD11-Jul-14 Baralaba JV Cockatoo Coal 46 100% 28 75 18 1.67 0.61 2.56 Metallurgical Bowen and Surat Basins,
QLDAcquisitions ≤ 50%5-Dec-16 NCA JV Glencore n/a 45% 361 819 84 na na na Thermal Bowen Basin, QLD30-Sep-15 Bengalla New Hope 1,542 40% 375 455 269 4.11 3.39 5.73 Thermal Hunter Valley, NSW28-Aug-15 Moolarben Yancoal 1,471 1% 1,076 1,326 334 1.37 1.11 4.40 Thermal Western Coalfields, NSW11-Nov-14 Ashton Yancoal 185 10% 222 268 57 0.84 0.69 3.28 Metallurgical Hunter Valley, NSW26-Aug-14 Whitehaven AMCI 2,174 6% 2,101 3,430 709 1.03 0.63 3.07 Thermal Gunnedah Basin, NSW11-Dec-13 Integra Vale 560 4% na na 34 na na 16.40 Metallurgical Hunter Valley, NSW25-Oct-13 Clermont Sumitomo; Glencore 2,026 50% 172 176 161 11.78 11.53 12.61 Thermal Bowen Basin, QLD19-Jun-13 Whitehaven Farallon Capital 3,310 10% 2,220 3,308 709 1.49 1.00 4.67 Thermal Gunnedah Basin, NSW28-Jan-13 Coppabella and Moorvale JV CITIC 1,686 7% 400 516 163 4.22 3.27 10.35 Metallurgical Bowen Basin, QLD
High 11.78 11.53 12.61 Mean 3.19 2.57 5.47 Median 1.67 1.00 4.40 Low 0.84 0.61 2.55
Source: S&P Capital IQ, company announcements, EY Transaction Advisory Services analysisNotes:1. Amounts presented in US dollars2. Reserve and resource based on information as contemporaneous as possible to the transaction announcement date3. M + I refers to the aggregated Measured and Indicated resource4. Total resource for Coal & Allied, Bengalla and Clermont were initially reported exclusive of reserve. The numbers above assume proven and probable reserve to be part of M + I resource and have been added to the M + I
resource and total resource5. Transactions highlighted in light grey have been excluded from the analysis as they are considered outliers6. The table includes multiples for transactions which have been announced as well as for those that have been completed7. Some of the transactions involve acquisitions of non-controlling interests and therefore the implied multiples may not reflect a control value8. The table excludes transactions for which there was not sufficient data to calculate the implied multiples (i.e. Metropolitan, Blair Athol, Callide, Wilkie Creek, NCA JV, and Integra).9. Isaac Plains has been excluded on the basis that the mine was in ‘care and maintenance’ at the time of the transaction.
89
For
per
sona
l use
onl
y

73
Analysis of comparabilityWe have assessed the level of comparability of the observed broadly comparable trading companies andtransactions giving consideration to a number of factors, including: operational stage, size of definedresources, location of operations, primary product type and access to infrastructure, among other factors.Based on this analysis, we consider the following trading companies and transactions to be most comparableto Coal & Allied.
Selected comparable trading companies and transactionsTrading companies TransactionsWhitehaven BengallaNew Hope Moolarben
In regards to the selected comparable transactions, we acknowledge the fact that these transactions reflectacquisitions of minority stakes, and therefore may not be fully comparable to the Transaction (which is on acontrolling interest basis). Notwithstanding the above, we have specifically selected these transactions on thebasis that they share similarities to Coal & Allied in terms of the factors listed above.
Although not directly comparable to Coal & Allied, analysis of these transactions does provide a broadindication of the level of multiple that the market places on thermal producing coal assets in NSW miningregions.
Implied historical and forecast EBITDA and production multiples of selected comparable companiesEnterprise value Implied yield EV/EBITDA EV/ROM (US$/t) EV/Saleable (US$/t) Reserve life
Company ($ million) LFY NFY LFY NFY LFY NFY LFY NFY Years
Yancoal 3,773 75% na 238.2 n/a 178 n/a 236 n/a 26
Whitehaven 3,644 96% 95% 8.8 6.3 231 211 241 221 45
New Hope 1,398 53% 58% 28.2 5.9 112 94 212 160 45Source: S&P Capital IQ, comparable companies announcements, EY Transaction Advisory Services analysisNotes:3. Amounts presented in US dollars4. Enterprise value calculated based on the market capitalisation of the comparable companies as at 7 April 2017.5. Enterprise value includes an assumed notional control premium of 30%.6. Implied yield calculated based on ROM production and saleable production7. Reserve life calculated based on total reserve and NFY ROM production (with the exception of Yancoal, which is calculated based on LFY
ROM production)
Implied production multiples of selected comparable transactions
DateImplied
Enterprise Value Implied yield EV/ROM (US$/t)EV/Saleable
(US$/t) Reserves lifeAnnounced US$m LFY LFY NFY LFY NFY LFY NFY Years30-Sep-15 Bengalla 1,542 2015 78% 81% 144 141 185 174 2528-Aug-15 Moolarben 1,471 2015 77% 76% 163 121 213 158 27
Source: S&P Capital IQ, comparables companies announcements, EY Transaction Advisory Services analysisNotes:1. Amounts presented in US dollars2. LFY represents the financial year ended closer to the announcement date3. Implied yield calculated based on ROM production and saleable production4. Reserves life calculated based on total reserves at the time of the acquisition and NFY ROM production
90
For
per
sona
l use
onl
y

74
Implied production multiples of selected comparable transactionsNewcastle FOB
price ($/t) QualityDateAnnounced
Impliedyield Spot
Long-term
Miningmethod Port
CV (kcal/kgGAR)
Ash(% adb)
Sulphur(% adb)
Moisture(% arb)
30-Sep-15 Bengalla 78% 56.70 76.67 OC PWCS 6,543 13.5% 0.57% 10%28-Aug-15 Moolarben 77% 56.65 78.44 OC/UG NCIG/ PWCS 6,567 17.0% 0.60% 10%Source: EY Transaction Advisory Services analysis, S&P Capital IQ, company announcements, annual reports, IHS McCloskey, ConsensusEconomics, NSW Department of IndustryNotes:1. Implied yield calculated based on ROM production and saleable production as at the announcement date2. Spot prices represent the weekly average price closest to the transaction announcement date3. Long-term prices represent the mean if long-term forecast contract prices as reported by Consensus Economics as contemporaneous as
possible to the transaction announcement date.4. Long-term prices are expressed in real dollars
Although is it difficult to determine which factors are likely to influence the implied multiples of trading companiesand transactions and to quantify their impact, when analysed individually, some factors are likely to contributeto a particular operation attracting higher multiples than others. A number of key factors we have consider in ouranalysis and their potential impact on multiples are listed below.
► Product type and quality: Metallurgical coals attract a higher price per tonne compared to thermalcoal. In addition, higher quality products within a specific rank attract a higher price per tonne comparedto lower quality ones. Higher prices generally translate in higher multiples.
► Mining method: underground mines are generally riskier than open-cut mines. Therefore open-cutoperations may attract higher multiples.
► Production costs: high cost operations generally have lower profit potential and higher risk to adownturn in coal prices. Therefore they would be expected to trade at a lower multiple.
► Proximity to port infrastructure: Operations with are located closer to port infrastructure generallyincur lower railing costs.
► Long-term price expectations: Expectations around long-term prices may influence the price paid fora particular asset/company in a market transaction at a given point in time. Transactions that occurduring periods of relatively higher long-term price expectations are likely to attract a higher multiple.
We have considered the above mentioned factors and whether they are likely to attract a higher, similar or lowermultiples for each of the selected comparable companies and transactions compared to Coal & Allied. Ouranalysis is presented in the table below.
91
For
per
sona
l use
onl
y
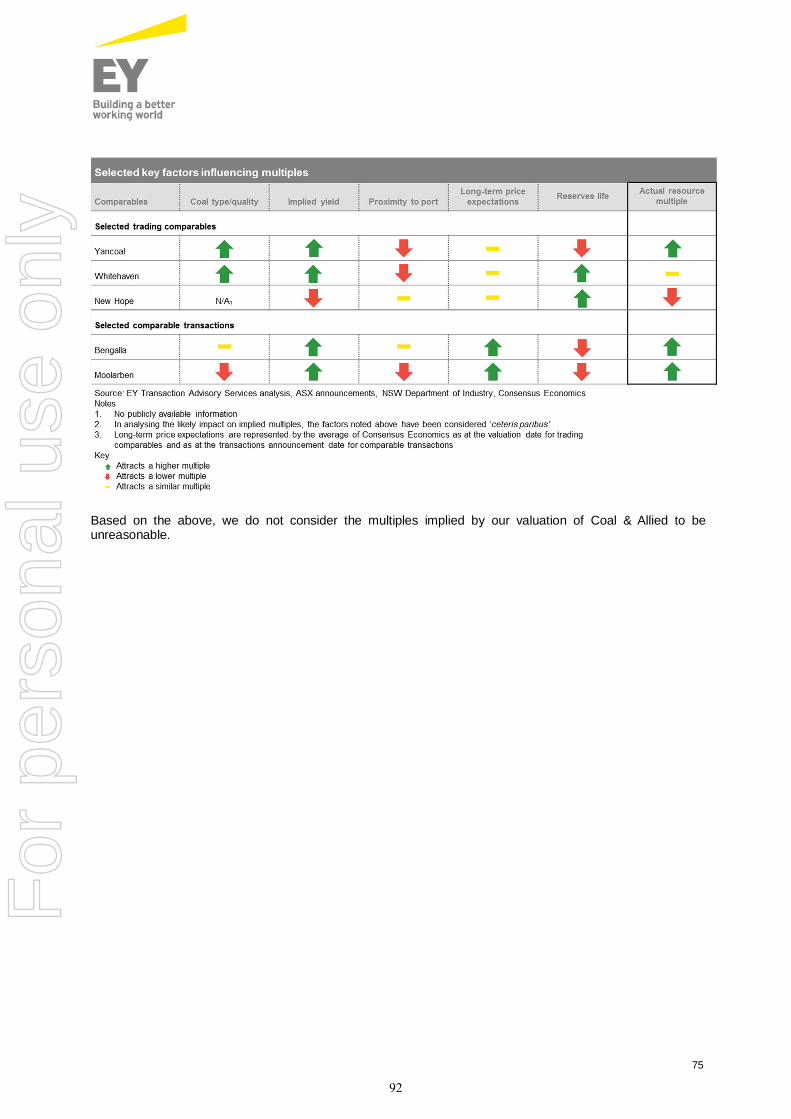
75
Based on the above, we do not consider the multiples implied by our valuation of Coal & Allied to beunreasonable.
92
For
per
sona
l use
onl
y

÷ 76
Appendix F Forecast macroeconomic assumptionsForecast coal pricesOur adopted forecast coal prices are based on broker consensus estimates, forward prices and recent spotprices and rates. Our forecast coal prices have been assessed as at a date up to and including 7 April 2017.These prices represent our view of the forecast prices that a market participant would apply when consideringa transaction. It is important to note that the value of the mining assets will be materially impacted by anysignificant change in forecast coal prices.
In assessing forecast coal prices for each of producing coal products, we have relied on broker consensusforecasts for thermal coal and SSCC. Adjustments have been made to the realised prices to allow for the variousqualities of HVO and MTW’s coal. For thermal coal, these adjustments have based on the energy content(measured as kcal/kg gross as received (“GAR”) compared to the export thermal coal benchmark quality). ForSSCC, we have assumed that SSCC produced at HVO and MTW can be sold at prices in line with the NewcastleSSCC benchmark. The energy content, quality, and relative pricing of HVO and MTW’s coal products have beenreviewed by AMC.
A summary of the data observed and our adopted forecast coal prices used in the valuation of the OperatingProjects are outlined below. These have been presented and are adopted on a real (2017) basis consistent withthe Financial Model (that is, the prices are shown before any impact of inflation). Price forecasts have beenadjusted to reflect an average price over the calendar year ended 31 December.
Source: Consensus broker reports, EY Transaction Advisory Services analysis
Source: Consensus broker reports, EY Transaction Advisory Services analysis
40
50
60
70
80
90
2017 2018 2019 2020 2021 2022 2023 2024 2025 2026
Ther
mal
coal
(US$
/tre
al)
Thermal coal consensus forecasts (6,260 kcal/kg GAR)
Broker range Median
5060708090
100110120130140150
2017 2018 2019 2020 2021 2022 2023 2024 2025 2026
SSCC
coal
(US$
/tre
al)
Semi soft coking coal consensus forecasts (6,260 kcal/kg GAR)
Broker range Median
93
For
per
sona
l use
onl
y

÷ 77
Coal & Allied - Coal price forecast (6,260kcal/kg GAR)US$/t, real 2017 2018 2019 2020 2021 2022 2023 2024 2025 2026+Thermal coal priceadopted
82 73 67 63 60 60 61 61 62 62
Number of observations 11 11 11 11 8 - - - - 6Semi-soft coking coalprice adopted
124 87 81 83 81 81 81 80 80 80
Number of observations 5 5 5 4 2 - - - - 5Source: Consensus broker reports, EY Transaction Advisory Services analysis
We have adopted the median forecast coal price to apply to our valuation of the Operating Projects within theFinancial Model.
Foreign exchange rateIn determining the forecast AUD:USD exchange rate, we have considered the following:
► Consensus estimates from recent analysts’ reports
► Foreign exchange forward rates sourced from Bloomberg and Reuters
► Other publicly available exchange rate estimates
Our preferred exchange rate assumption is based on forward exchange rates, converted to a real basis, in orderto be applied to real cash flow forecasts. We note that the nominal forward exchange rate has been deflatedadopting the purchase price parity (“PPP”) formula, adopting forecast US inflation estimates and Australianinflation estimates, sourced from consensus broker reports. Exchange rate forecasts have been adjusted toreflect an average price over the calendar year ending 31 December. The tables below summarise our US andAustralian inflation forecasts as well as the resulting PPP.
Coal & Allied – Inflation forecast2017 2018 2019 2020 2021 2022 2023 2024 2025 2026+
Australian CPI 100 102 105 107 109 111 114 116 118 121
US CPI 100 102 105 107 110 113 116 119 122 125
PPP factor 1.00 1.00 1.00 1.01 1.01 1.01 1.02 1.02 1.03 1.03Source: Consensus broker reports, EY Transaction Advisory Services analysis
94
For
per
sona
l use
onl
y
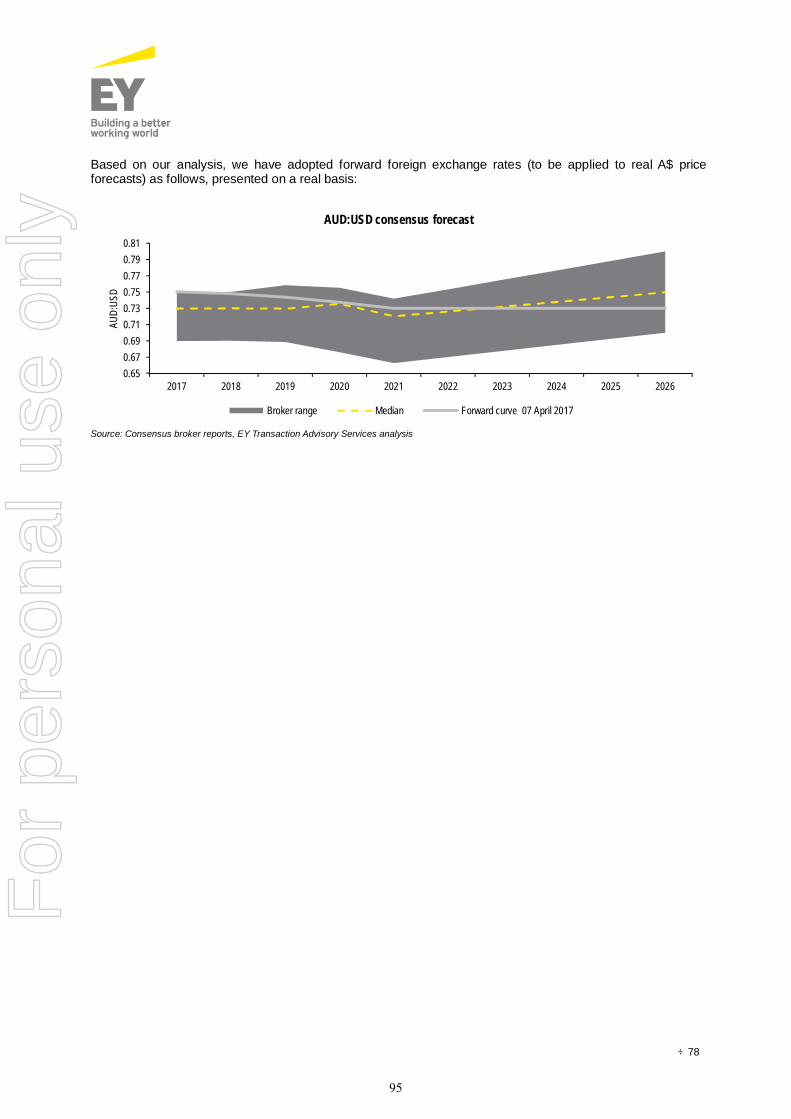
÷ 78
Based on our analysis, we have adopted forward foreign exchange rates (to be applied to real A$ priceforecasts) as follows, presented on a real basis:
Source: Consensus broker reports, EY Transaction Advisory Services analysis
0.650.670.690.710.730.750.770.790.81
2017 2018 2019 2020 2021 2022 2023 2024 2025 2026
AUD:
USD
AUD:USD consensus forecast
Broker range Median Forward curve 07 April 2017
95
For
per
sona
l use
onl
y

÷ 79
Appendix G Sources of informationIn arriving at our views, we have had regard to the following sources of information:
► audited financial statements of Coal & Allied for the financial years ended 31 December 2014, 2015and 2016
► the AMC Report, included in Appendix I of this report
► the SPA
► the draft Notice of Extraordinary Meeting
► the Financial Model prepared by Rio Tinto management, with operational and technical assumptionsupdated by AMC
► ASX announcements for Rio Tinto and Yancoal
► company websites for Rio Tinto, Yancoal and comparable companies
► market data obtained from sources including ThomsonOne, S&P Capital IQ, mergermarket andDatAnalysis
In addition we held discussions with various members of senior management of Rio Tinto.
96
For
per
sona
l use
onl
y
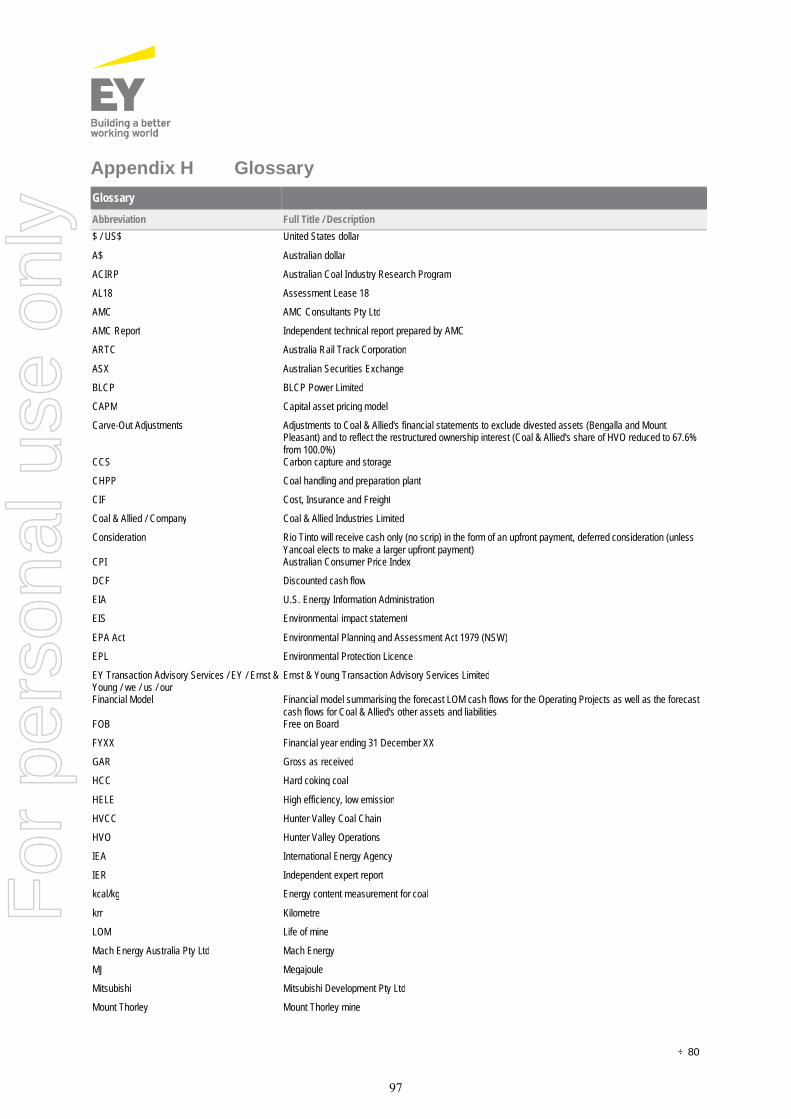
÷ 80
Appendix H GlossaryGlossaryAbbreviation Full Title / Description$ / US$ United States dollar
A$ Australian dollar
ACIRP Australian Coal Industry Research Program
AL18 Assessment Lease 18
AMC AMC Consultants Pty Ltd
AMC Report Independent technical report prepared by AMC
ARTC Australia Rail Track Corporation
ASX Australian Securities Exchange
BLCP BLCP Power Limited
CAPM Capital asset pricing model
Carve-Out Adjustments Adjustments to Coal & Allied's financial statements to exclude divested assets (Bengalla and MountPleasant) and to reflect the restructured ownership interest (Coal & Allied's share of HVO reduced to 67.6%from 100.0%)
CCS Carbon capture and storage
CHPP Coal handling and preparation plant
CIF Cost, Insurance and Freight
Coal & Allied / Company Coal & Allied Industries Limited
Consideration Rio Tinto will receive cash only (no scrip) in the form of an upfront payment, deferred consideration (unlessYancoal elects to make a larger upfront payment)
CPI Australian Consumer Price Index
DCF Discounted cash flow
EIA U.S. Energy Information Administration
EIS Environmental impact statement
EPA Act Environmental Planning and Assessment Act 1979 (NSW)
EPL Environmental Protection Licence
EY Transaction Advisory Services / EY / Ernst &Young / we / us / our
Ernst & Young Transaction Advisory Services Limited
Financial Model Financial model summarising the forecast LOM cash flows for the Operating Projects as well as the forecastcash flows for Coal & Allied's other assets and liabilities
FOB Free on Board
FYXX Financial year ending 31 December XX
GAR Gross as received
HCC Hard coking coal
HELE High efficiency, low emission
HVCC Hunter Valley Coal Chain
HVO Hunter Valley Operations
IEA International Energy Agency
IER Independent expert report
kcal/kg Energy content measurement for coal
km Kilometre
LOM Life of mine
Mach Energy Australia Pty Ltd Mach Energy
MJ Megajoule
Mitsubishi Mitsubishi Development Pty Ltd
Mount Thorley Mount Thorley mine
97
For
per
sona
l use
onl
y

÷ 81
GlossaryAbbreviation Full Title / DescriptionMt Million tonnes
Mtpa Million tonnes per annum
MTW The Mount Thorley mine and Warkworth mine integrated operation
NCIG Newcastle Coal Infrastructure Group
Noble Noble Group Limited
Non-Associated Shareholders Rio Tinto shareholders not associated with Yancoal
Oaklands Oaklands coal deposit
OIA Operational Integration Agreement
Operating Projects Coal & Allied's mining assets, being its operating projects at HVO and MTW
PCI Pulverised coal injection
PPE Plant, property and equipment
PPP Purchase price parity
PWCS Port Waratah Coal Services
Re Return on equity
RG 111 Regulatory Guide 111: Content of expert reports
RG 112 Regulatory Guide 112: Independence of experts
Rio Tinto Rio Tinto Group
ROM Run of mine
Royalty Rio Tinto will also be entitled to a royalty that is based on the Newcastle benchmark thermal coal priceexceeding $75/t (in 2017 dollars, subject to inflation)
SHCC Semi-hard coking coal
SPA Sale and Purchase Agreement
SSCC Semi-soft coking coal
Technical Value Values determined for Coal & Allied mining assets as representing a technical value
t Tonne
Transaction Rio Tinto reached a binding agreement for the sale of its 100% interest in Coal & Allied to Yancoal
VALMIN Code Code for the technical assessment and valuation of mineral and petroleum assets and securities forindependent expert reports
WACC Weighted average cost of capital basis
Warkworth Warkworth mine
Yancoal Yancoal Australia Limited
Yangkuang Yangkuang Group Company Limited
Yanzhou Yanzhou Coal Mining Company Limited
98
For
per
sona
l use
onl
y

÷ 82
Appendix I The AMC Report
99
For
per
sona
l use
onl
y

AMC Consultants Pty LtdABN 58 008 129 164
Level 1, 1100 Hay StreetWEST PERTH WA 6005AUSTRALIA
T +61 8 6330 1100F +61 8 6330 1199E [email protected] amcconsultants.com
ReportCoal &Ernst & Young Transaction Advisory Services LimitedAMC Project 21701619 May 2017
100
For
per
sona
l use
onl
y
Ernst & Young Transaction Advisory Services Limited 217016
amcconsultants.com i
19 May 2017
The DirectorsErnst & Young Transaction Advisory Services Limited111 Eagle StreetBRISBANE QLD 4000
Dear Sirs
Independent Technical Specialist's ReportRio Tinto Coal NSW Holdings Limited
Rio Tinto (comprising Rio Tinto Limited and Rio Tinto plc) announced on 24 January 2017, that:Rio Tinto and Yancoal Australia Ltd (Yancoal) had reached a binding agreement for the sale of Rio
-owned Australian subsidiary Coal & Allied Industries Limited (C&A) to Yancoal(Proposed Transaction).Because of the shareholding levels of various Chinese state-owned entities in the Rio Tinto Group,Yancoal is considered to be a related party of Rio Tinto for the purposes of the UK Listing Rules andthe ASX Listing Rules, and the Proposed Transaction requires approval from a majority ofindependent Rio Tinto shareholders.
C&A business in the Hunter Valley of New South Wales (NSW). C&A holdsa 67.6% interest in the Hunter Valley Operations mine (HVO), an 80.0% interest in the Mount Thorley mine,a 55.6% interest in the Warkworth mine, and a 36.5% interest in Port Waratah Coal Services Limited(PWCS), which operates port facilities at Newcastle. The Mount Thorley and Warkworth mines (MTW) areoperated on an integrated basis. HVO adjoins the northern lease boundary of MTW. The two mines producea mix of thermal and semi-soft coking coal (SSCC) for the export market, which is railed from on-site coalhandling and preparation plants to the coal export facilities near Newcastle. C&A has contracts in place forbelow rail access to the Hunter Valley rail network, above rail haulage services, and port capacity at exportfacilities near Newcastle to transport product coal from their mines to market.
Rio Tinto has informed AMC that Rio Tinto Coal NSW Holdings Limited (Rio Tinto Coal), a wholly-ownedsubsidiary of Rio Tinto Limited, has appointed Ernst & Young Transaction Advisory Services Limited
relation to theProposed Transaction.
Rio Tinto Coal appointed AMC Consultants Pty Ltd (AMC) to act as an independent technical specialist toassist the Expert by providing the necessary technical support (a description of mineral assets, andproduc
are presented in this ITSR), addressedto the Expert.
This ITSR will be attached in full as an appendix to the IER, which will be provided to the shareholders of RioTinto. In the preparation of this ITSR, AMC took instruction from, and reported to, the Expert.
EYTAS instructed AMC to review estimates of Coal Resources and Coal Reserves, life-of-mine (LOM) plans,production schedules, and estimates of capital and operating costs for mineral assets, and adviseEYTAS as to whether these estimates are reasonable for valuation purposes. EYTAS advised that AMC wasto consider production/development scenarios for , and these scenarios may be basedon LOM plans that extend beyond Coal Reserves and/or have the potential for variations in future productionrates.
In addition, EYTAS required AMC to prepare valuations of other undeveloped resources andexploration interests.
EYTAS directed AMC to prepare an ITSR setting out:The scope of engagement.The nature of the work performed.A description of C&A mineral assets and their planned development.
101
For
per
sona
l use
onl
y

Ernst & Young Transaction Advisory Services Limited 217016
amcconsultants.com ii
production profiles, and operating costs for each of the production/development scenarios, which AMCrefers to in this report as its Production Cases.
ions of C&A
The Production Cases provided by AMC to EYTAS include mining and processing schedules, and capitaland operating cost estimates, and are based on information provided by Rio Tinto Coal Australia. AMCconsiders that the Production Cases cover a range of reasonable operating strategies and are based onreasonable grounds and assumptions. AMC considers that the information it has in relation to the valuationof the undeveloped resources and exploration interests, is sufficient.
The Production Cases developed by AMC do not include off-site costs such as head office or corporatecosts, which are considered by EYTAS, rail and port costs, or a valuation of the assets of PWCS.
AMC has undertaken its commission to prepare this ITSR as a Specialist in accordance with the VALMINCode1 to the extent that the code is relevant to AMC's engagement.
AMC's use, in this ITSR, of the terms Coal Resources and Coal Reserves is in accordance with the JORCCode2. The totals of Coal Resources and Coal Reserves estimates presented in this ITSR have beenrounded.
For the purposes of preparing this ITSR, AMC visited (in March 2017) C&A's Hunter Valley Operations andMt Thorley Warkworth mines, reviewed material technical reports and management information, andcommunicated with management staff at the mine sites and in the Brisbane office of Rio Tinto Coal. AMChas not visited the exploration projects or the port and rail operations of Port Waratah Coal Services. AMC issatisfied that Rio Tinto Coalwithout such site visits.
AMC has not audited the information provided to it, but has aimed to satisfy itself that all the information hasbeen prepared in accordance with proper industry standards and is based on data that AMC considers to beof acceptable quality and reliability. Where AMC has not been so satisfied, AMC has included comment inthis ITSR and made modifications in the Production Cases provided to EYTAS.
This ITSR can be summarized as follows:
Production CasesThe Production Cases, with their respective life-of-mine (LOM) product, run-of-mine (ROM) coal, and costattributes, are summarized in Table I. AMC considers that the Production Cases are based on reasonablegrounds and assumptions, but are exposed to technical risks and opportunities.
The Production Cases do not include off-site costs such as head office or corporate costs, which areconsidered by EYTAS.
1 Code for the Technical Assessment and Valuation of Mineral and Petroleum Assets and Securities for Independent Expert Reports,The VALMIN Code 2005 Edition, Prepared by The VALMIN Committee, a joint committee of the Australasian Institute of Mining andMetallurgy, the Australian Institute of Geoscientists and the Mineral industry Consultants Association with the participation of theAustralian Securities and Investment Commission, the Australian Stock Exchange Limited, the Minerals Council of Australia, thePetroleum Exploration Society of Australia, the Securities Association of Australia and representatives from the Australian financesector.
2 Australasian Code for Reporting of Exploration Results, Mineral Resources and Ore Reserves, The JORC Code 2012 Edition,Effective 20 December 2012, Mandatory from 1 December 2013. Prepared by the Joint Ore Reserves Committee of theAustralasian Institute of Mining and Metallurgy, Australian Institute of Geoscientists and Minerals Council of Australia (JORC).
102
For
per
sona
l use
onl
y
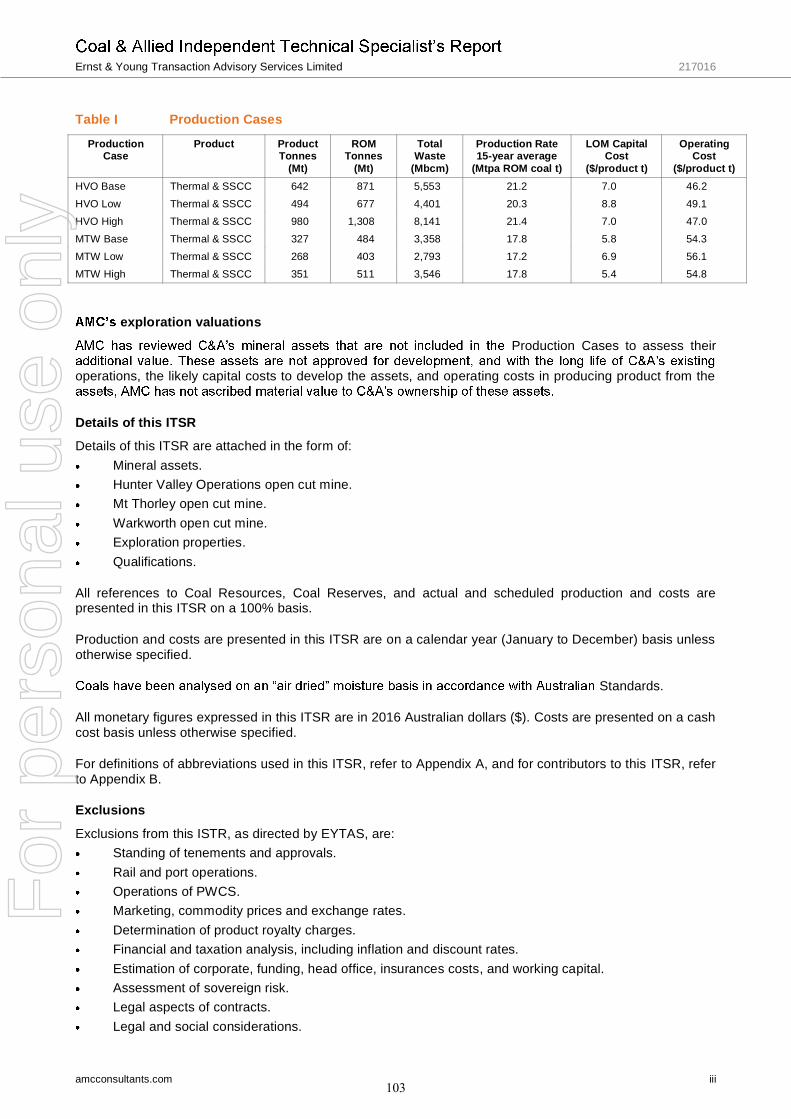
Ernst & Young Transaction Advisory Services Limited 217016
amcconsultants.com iii
Table I Production Cases
ProductionCase
Product ProductTonnes
(Mt)
ROMTonnes
(Mt)
TotalWaste
(Mbcm)
Production Rate15-year average
(Mtpa ROM coal t)
LOM CapitalCost
($/product t)
OperatingCost
($/product t)HVO Base Thermal & SSCC 642 871 5,553 21.2 7.0 46.2HVO Low Thermal & SSCC 494 677 4,401 20.3 8.8 49.1HVO High Thermal & SSCC 980 1,308 8,141 21.4 7.0 47.0MTW Base Thermal & SSCC 327 484 3,358 17.8 5.8 54.3MTW Low Thermal & SSCC 268 403 2,793 17.2 6.9 56.1MTW High Thermal & SSCC 351 511 3,546 17.8 5.4 54.8
exploration valuations
Production Cases to assess their
operations, the likely capital costs to develop the assets, and operating costs in producing product from the
Details of this ITSRDetails of this ITSR are attached in the form of:
Mineral assets.Hunter Valley Operations open cut mine.Mt Thorley open cut mine.Warkworth open cut mine.Exploration properties.Qualifications.
All references to Coal Resources, Coal Reserves, and actual and scheduled production and costs arepresented in this ITSR on a 100% basis.
Production and costs are presented in this ITSR are on a calendar year (January to December) basis unlessotherwise specified.
Standards.
All monetary figures expressed in this ITSR are in 2016 Australian dollars ($). Costs are presented on a cashcost basis unless otherwise specified.
For definitions of abbreviations used in this ITSR, refer to Appendix A, and for contributors to this ITSR, referto Appendix B.
Exclusions
Exclusions from this ISTR, as directed by EYTAS, are:Standing of tenements and approvals.Rail and port operations.Operations of PWCS.Marketing, commodity prices and exchange rates.Determination of product royalty charges.Financial and taxation analysis, including inflation and discount rates.Estimation of corporate, funding, head office, insurances costs, and working capital.Assessment of sovereign risk.Legal aspects of contracts.Legal and social considerations.
103
For
per
sona
l use
onl
y
Ernst & Young Transaction Advisory Services Limited 217016
amcconsultants.com iv
non-mineral assets.
AMC understands that these are addressed by others to the extent necessary.
Yours faithfully
G Williamson M ThomasFAusIMM (CP) FAusIMM (CP)Principal Mining Engineer Principal Consultant
104
For
per
sona
l use
onl
y
Ernst & Young Transaction Advisory Services Limited 217016
amcconsultants.com v
Contents1 Mineral assets .......................................................................................................................................... 1
Location of assets .......................................................................................................................... 11.1Historical performance ................................................................................................................... 21.2Tenements and approvals .............................................................................................................. 31.3Health and safety ........................................................................................................................... 31.4Community ..................................................................................................................................... 41.5Environment ................................................................................................................................... 41.6
1.6.2 Environmental security bonds in NSW ...................................................................... 51.6.3 Risks with potentially material effects on closure costs............................................. 5
Production Cases ........................................................................................................................... 61.7
2 Hunter Valley Operations open cut mine ................................................................................................. 7Location .......................................................................................................................................... 72.1Geology and mineralization ............................................................................................................ 92.2
2.2.1 Regional and local geology ....................................................................................... 9Coal Resources .............................................................................................................................. 92.3Coal Reserves .............................................................................................................................. 112.4Mining operations ......................................................................................................................... 122.5
2.5.1 Mine design and LOM planning process ................................................................. 122.5.2 ...................................................................................................... 13
Quality .......................................................................................................................................... 152.62.6.1 Raw coal quality....................................................................................................... 152.6.2 Product coal quality ................................................................................................. 152.6.3 Yield ......................................................................................................................... 172.6.4 Summary ................................................................................................................. 17
Coal preparation ........................................................................................................................... 172.72.7.1 CHPP arrangement ................................................................................................. 172.7.2 Historical performance ............................................................................................. 20
Infrastructure and services ........................................................................................................... 212.82.8.1 Overland conveyors, stockpiles, train loadouts ....................................................... 212.8.2 Tailings storage ....................................................................................................... 212.8.3 Power supply ........................................................................................................... 212.8.4 Water supply ............................................................................................................ 222.8.5 Logistics ................................................................................................................... 22
Operating costs ............................................................................................................................ 222.9Environmental and mine closure costs ........................................................................................ 232.11
2.11.1 Annual health, safety, environmental and community costs ................................... 232.11.2 Progressive rehabilitation costs ............................................................................... 232.11.3 Environmental bonds ............................................................................................... 242.11.4 Mine closure costs ................................................................................................... 24
HVO Production Cases ................................................................................................................ 242.122.12.1 HVO Base Production Case .................................................................................... 262.12.2 HVO Low Production Case ...................................................................................... 272.12.3 HVO High Production Case ..................................................................................... 28
Risks and opportunities ................................................................................................................ 282.13
3 Mt Thorley Warkworth open cut mine ..................................................................................................... 29Location ........................................................................................................................................ 293.1Geology and mineralization .......................................................................................................... 313.2
3.2.1 Regional and local geology ..................................................................................... 31Coal Resources ............................................................................................................................ 313.3Coal Reserves .............................................................................................................................. 323.4Mining operations ......................................................................................................................... 333.5
3.5.1 Mine design and LOM plan ...................................................................................... 343.5.2 ...................................................................................................... 34
Quality .......................................................................................................................................... 373.63.6.1 Raw coal quality....................................................................................................... 373.6.2 Product coal qualities .............................................................................................. 373.6.3 Yield ......................................................................................................................... 383.6.4 Summary ................................................................................................................. 39
105
For
per
sona
l use
onl
y
Ernst & Young Transaction Advisory Services Limited 217016
amcconsultants.com vi
Coal preparation ........................................................................................................................... 393.73.7.1 CHPP arrangement ................................................................................................. 393.7.2 Historical performance ............................................................................................. 41
Infrastructure and services ........................................................................................................... 423.83.8.1 Overland conveyors, stockpiles, train loadouts ....................................................... 423.8.2 Tailings storage ....................................................................................................... 423.8.3 Power supply ........................................................................................................... 433.8.4 Water supply ............................................................................................................ 433.8.5 Logistics ................................................................................................................... 43
Operating costs ............................................................................................................................ 433.9Environmental and community issues ......................................................................................... 443.11
3.11.1 Annual health, safety, environmental and community costs ................................... 443.11.2 Progressive rehabilitation costs ............................................................................... 443.11.3 Environmental bonds ............................................................................................... 443.11.4 Mine closure costs ................................................................................................... 44
AMC Production Cases ................................................................................................................ 443.123.12.1 MTW Base Production Case ................................................................................... 463.12.2 MTW Low Production Case ..................................................................................... 473.12.3 MTW High Production Case .................................................................................... 48
Risks and opportunities ................................................................................................................ 483.13
4 Rail and port access ............................................................................................................................... 49
5 Expansion or development projects contemplated, including future underground miningoperations ............................................................................................................................................... 51
Oaklands deposit ......................................................................................................................... 515.15.1.1 Project location ........................................................................................................ 515.1.2 Geology ................................................................................................................... 515.1.3 Coal Resources ....................................................................................................... 515.1.4 Project evaluation .................................................................................................... 52
HVO underground ........................................................................................................................ 525.2MTW underground ....................................................................................................................... 535.3
6 Qualifications .......................................................................................................................................... 54TablesTable 1.1 C&A historical production (100% basis) ................................................................................... 3Table 2.1 HVO Coal Resources as at December 2016 ............................................................................ 9Table 2.2 HVO average seam qualities (air dried basis) ........................................................................ 10Table 2.3 HVO Coal Reserves as at December 2016 ............................................................................ 11Table 2.4 CHPP ROM coal processing capacities ................................................................................. 18Table 2.5 HVO historical performance (100% basis) .............................................................................. 21Table 2.6 HVO Base Production Case ................................................................................................... 27Table 2.7 HVO Low Production Case ..................................................................................................... 27Table 2.8 HVO High Production Case .................................................................................................... 28Table 3.1 MTW Coal Resources as at December 2016 ......................................................................... 31Table 3.2 MTW average seam qualities (air dried basis) ....................................................................... 32Table 3.3 MTW Coal Reserve as at December 2016 ............................................................................. 33Table 3.4 MTW historical performance (100% basis) ............................................................................. 42Table 3.5 MTW Base Production Case ................................................................................................... 47Table 3.6 MTW Low Production Case .................................................................................................... 48Table 3.7 MTW High Production Case ................................................................................................... 48Table 5.1 Oakland Coal Resources ........................................................................................................ 52
FiguresFigure 1.1 .................................................................................................. 1Figure 1.2 Hunter Valley weather graphs ................................................................................................... 2
106
For
per
sona
l use
onl
y
Ernst & Young Transaction Advisory Services Limited 217016
amcconsultants.com vii
Figure 1.3 C&A safety performance 2008 2015 ...................................................................................... 4Figure 1.4 C&A community complaints 2008 to 2015 ................................................................................ 4Figure 1.5 C&A environmental incidents 2008 to 2015 .............................................................................. 5Figure 2.1 HVO mine layout ....................................................................................................................... 7Figure 2.2 HVO mining tenements ............................................................................................................. 8Figure 2.3 HVO mining method ................................................................................................................ 12Figure 2.4 HVO forecast product tonnes (16Q3 LOM Plan) .................................................................... 13Figure 2.5 Planned HVO excavator loading rates compared to historical and AMC benchmark rates ... 14Figure 2.6 16Q3 LOM Plan waste mined ................................................................................................. 15Figure 2.7 HVO seam F1.60 ash and CSN for total dataset and 10-year plan ........................................ 16Figure 2.8 HVO TS and N F1.60 v shipping results ................................................................................. 16Figure 2.9 HVO, MTW, and combined actual and modelled yield ........................................................... 17Figure 2.10 General flow diagram for ROM and product coal streams ..................................................... 19Figure 2.11 HVCPP block flow diagram ..................................................................................................... 20Figure 2.12 HCPP block flow diagram ....................................................................................................... 20Figure 2.13 HVO Production Cases ROM coal tonnes mined ................................................................ 25Figure 2.14 HVO Production Cases product tonnes railed ..................................................................... 26Figure 2.15 HVO Production Cases total waste movement .................................................................... 26Figure 3.1 MTW mine layout .................................................................................................................... 29Figure 3.2 MTW mining tenements .......................................................................................................... 30Figure 3.3 MTW Mining Schematic .......................................................................................................... 34Figure 3.4 MTW forecast coal products (16Q3 LOM Plan) ...................................................................... 35Figure 3.5 MTW operating pit areas ......................................................................................................... 36Figure 3.6 Planned MTW excavator loading rates compared to historical and AMC benchmark rates .. 36Figure 3.7 MTW seam F1.60 ash and yield for the entire dataset and 10-year plan ............................... 37Figure 3.8 MTW TS F1.60 v shipping results ........................................................................................... 38Figure 3.9 MTW, HVO, and combined actual and modelled yield ........................................................... 38Figure 3.10 MTW general flow diagram for ROM and product coal streams .......................................... 40Figure 3.11 North CHPP block flow diagram ............................................................................................. 41Figure 3.12 South CHPP block flow diagram ............................................................................................. 41Figure 3.13 MTW Production Cases ROM coal tonnes mined ............................................................... 45Figure 3.14 MTW Production Cases product coal tonnes railed............................................................. 46Figure 3.15 MTW Production Cases total waste volumes moved .......................................................... 46Figure 4.1 Hunter Valley rail and port infrastructure used by C&A .......................................................... 49
AppendicesAppendix A List of abbreviationsAppendix B Report contributorsAppendix C Sources of information
Distribution list1 e-copy to Jamie Stewart, Ernst & Young Transaction Advisory Services Limited1 e-copy to AMC Perth office
107
For
per
sona
l use
onl
y

CoalErnst & Young Transaction Advisory Services Limited 217016
amcconsultants.com 1
1 Mineral assets Location of assets1.1
Coal & Allied Industries Limited (C&A)New South Wales (NSW). C&A holds a 67.6% interest in the Hunter Valley Operations mine (HVO), an80.0% interest in the Mount Thorley mine, a 55.6% interest in the Warkworth mine and a 36.5% interest inPort Waratah Coal Services Limited (PWCS), which operates port facilities at Newcastle. The Mount Thorleyand Warkworth mines (MTW) are operated on an integrated basis. The MTW and HVO mines are located tothe west of the major regional centre of Singleton and north-west of Newcastle. HVO adjoins the northernlease boundary of MTW.
The locations of and MTW and mines in the Hunter Valley in relation to major regional towns,surrounding projects, local infrastructure, and the port at Newcastle are shown in Figure 1.1.
Figure 1.1 operations
Source: Coal & Allied Information Memorandum, February 2016
108
For
per
sona
l use
onl
y
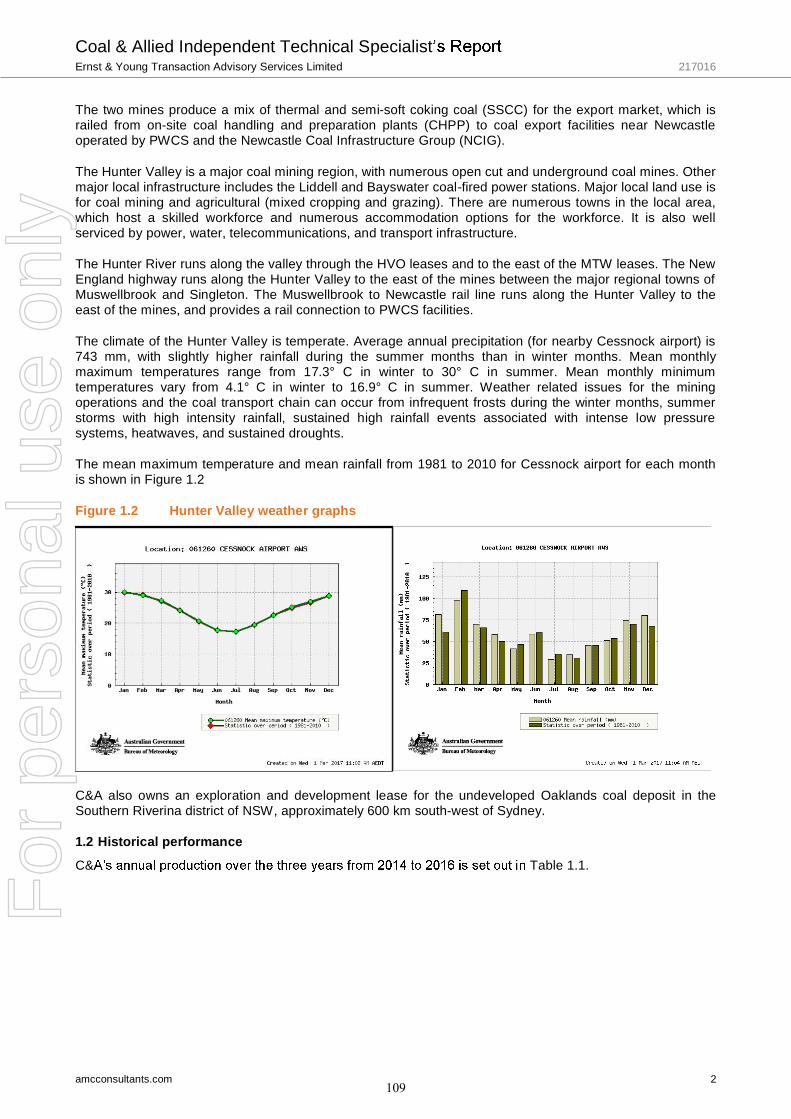
Coal & Allied Independent Technical SpecialistErnst & Young Transaction Advisory Services Limited 217016
amcconsultants.com 2
The two mines produce a mix of thermal and semi-soft coking coal (SSCC) for the export market, which israiled from on-site coal handling and preparation plants (CHPP) to coal export facilities near Newcastleoperated by PWCS and the Newcastle Coal Infrastructure Group (NCIG).
The Hunter Valley is a major coal mining region, with numerous open cut and underground coal mines. Othermajor local infrastructure includes the Liddell and Bayswater coal-fired power stations. Major local land use isfor coal mining and agricultural (mixed cropping and grazing). There are numerous towns in the local area,which host a skilled workforce and numerous accommodation options for the workforce. It is also wellserviced by power, water, telecommunications, and transport infrastructure.
The Hunter River runs along the valley through the HVO leases and to the east of the MTW leases. The NewEngland highway runs along the Hunter Valley to the east of the mines between the major regional towns ofMuswellbrook and Singleton. The Muswellbrook to Newcastle rail line runs along the Hunter Valley to theeast of the mines, and provides a rail connection to PWCS facilities.
The climate of the Hunter Valley is temperate. Average annual precipitation (for nearby Cessnock airport) is743 mm, with slightly higher rainfall during the summer months than in winter months. Mean monthlymaximum temperatures range from 17.3° C in winter to 30° C in summer. Mean monthly minimumtemperatures vary from 4.1° C in winter to 16.9° C in summer. Weather related issues for the miningoperations and the coal transport chain can occur from infrequent frosts during the winter months, summerstorms with high intensity rainfall, sustained high rainfall events associated with intense low pressuresystems, heatwaves, and sustained droughts.
The mean maximum temperature and mean rainfall from 1981 to 2010 for Cessnock airport for each monthis shown in Figure 1.2
Figure 1.2 Hunter Valley weather graphs
C&A also owns an exploration and development lease for the undeveloped Oaklands coal deposit in theSouthern Riverina district of NSW, approximately 600 km south-west of Sydney.
Historical performance1.2
C& Table 1.1.
109
For
per
sona
l use
onl
y
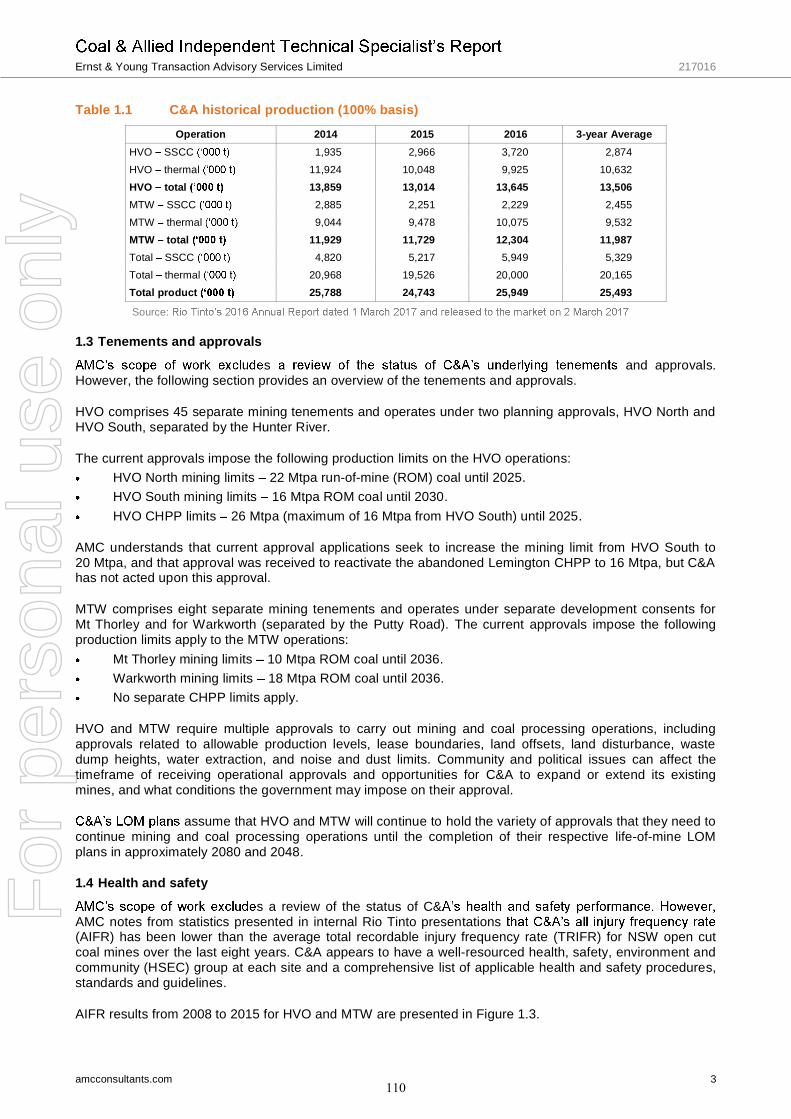
Ernst & Young Transaction Advisory Services Limited 217016
amcconsultants.com 3
Table 1.1 C&A historical production (100% basis)
Operation 2014 2015 2016 3-year AverageHVO SSCC 1,935 2,966 3,720 2,874HVO thermal 11,924 10,048 9,925 10,632HVO total 13,859 13,014 13,645 13,506MTW SSCC 2,885 2,251 2,229 2,455MTW thermal 9,044 9,478 10,075 9,532MTW total 11,929 11,729 12,304 11,987Total SSCC 4,820 5,217 5,949 5,329Total thermal 20,968 19,526 20,000 20,165Total product 25,788 24,743 25,949 25,493
Source:
Tenements and approvals1.3
s and approvals.However, the following section provides an overview of the tenements and approvals.
HVO comprises 45 separate mining tenements and operates under two planning approvals, HVO North andHVO South, separated by the Hunter River.
The current approvals impose the following production limits on the HVO operations:HVO North mining limits 22 Mtpa run-of-mine (ROM) coal until 2025.HVO South mining limits 16 Mtpa ROM coal until 2030.HVO CHPP limits 26 Mtpa (maximum of 16 Mtpa from HVO South) until 2025.
AMC understands that current approval applications seek to increase the mining limit from HVO South to20 Mtpa, and that approval was received to reactivate the abandoned Lemington CHPP to 16 Mtpa, but C&Ahas not acted upon this approval.
MTW comprises eight separate mining tenements and operates under separate development consents forMt Thorley and for Warkworth (separated by the Putty Road). The current approvals impose the followingproduction limits apply to the MTW operations:
Mt Thorley mining limits 10 Mtpa ROM coal until 2036.Warkworth mining limits 18 Mtpa ROM coal until 2036.No separate CHPP limits apply.
HVO and MTW require multiple approvals to carry out mining and coal processing operations, includingapprovals related to allowable production levels, lease boundaries, land offsets, land disturbance, wastedump heights, water extraction, and noise and dust limits. Community and political issues can affect thetimeframe of receiving operational approvals and opportunities for C&A to expand or extend its existingmines, and what conditions the government may impose on their approval.
assume that HVO and MTW will continue to hold the variety of approvals that they need tocontinue mining and coal processing operations until the completion of their respective life-of-mine LOMplans in approximately 2080 and 2048.
Health and safety1.4
s a review of the status of C&AMC notes from statistics presented in internal Rio Tinto presentations(AIFR) has been lower than the average total recordable injury frequency rate (TRIFR) for NSW open cutcoal mines over the last eight years. C&A appears to have a well-resourced health, safety, environment andcommunity (HSEC) group at each site and a comprehensive list of applicable health and safety procedures,standards and guidelines.
AIFR results from 2008 to 2015 for HVO and MTW are presented in Figure 1.3.
110
For
per
sona
l use
onl
y

Ernst & Young Transaction Advisory Services Limited 217016
amcconsultants.com 4
Figure 1.3 C&A safety performance 2008 2015
Source: Rio Tinto HVO 2008 to 2015 AIFR MTW 2008 to 2015 AIFR
Community1.5s a review of community consultation and social performance relating to the
However, AMC notes that the Hunter Valley has a long history of coalmining from open cut and underground mines, and several companies operate coal mines in the area,including large multinational companies.
Both HVO and MTW operate less than 5 km from residential land. Thus, they face typical operationalconstraints relating to dust, noise, blast overpressures and fume, and surface water runoff. These issues aremanaged on an ongoing basis. Approximately 86% of complaints regarding MTW over the four years from2012 to 2015 were complaints about noise.
Extensions to mining operations at HVO and MTW will take mining activities closer to the local communitiesof Mason Dieu (Auckland deposit at HVO) and Bulga (East and North pits at MTW), and these extensionsmay face community opposition.
C&A community complaints from 2008 to 2015 are shown in Figure 1.4.
Figure 1.4 C&A community complaints 2008 to 2015
Source: Rio Tinto HVO 2008 to 2015 MTW 2008 to 2015
Environment1.6excludes and
environmental performance. However, AMC notes that HVO and MTW have developed mine closure plans,an ongoing programme of progressive rehabilitation for mined out areas and waste dumps, a well-resourcedHSEC group, and a comprehensive list of applicable environmental management plans, procedures,standards and guidelines.
Community and political issues influence expectations in environmental performance standards andcompliance costs for all mines. They can also affect the timeframe of C&A receiving approvals for continuedoperation and opportunities to expand or extend their existing mines, and the conditions that the governmentmay impose on their approval.
111
For
per
sona
l use
onl
y
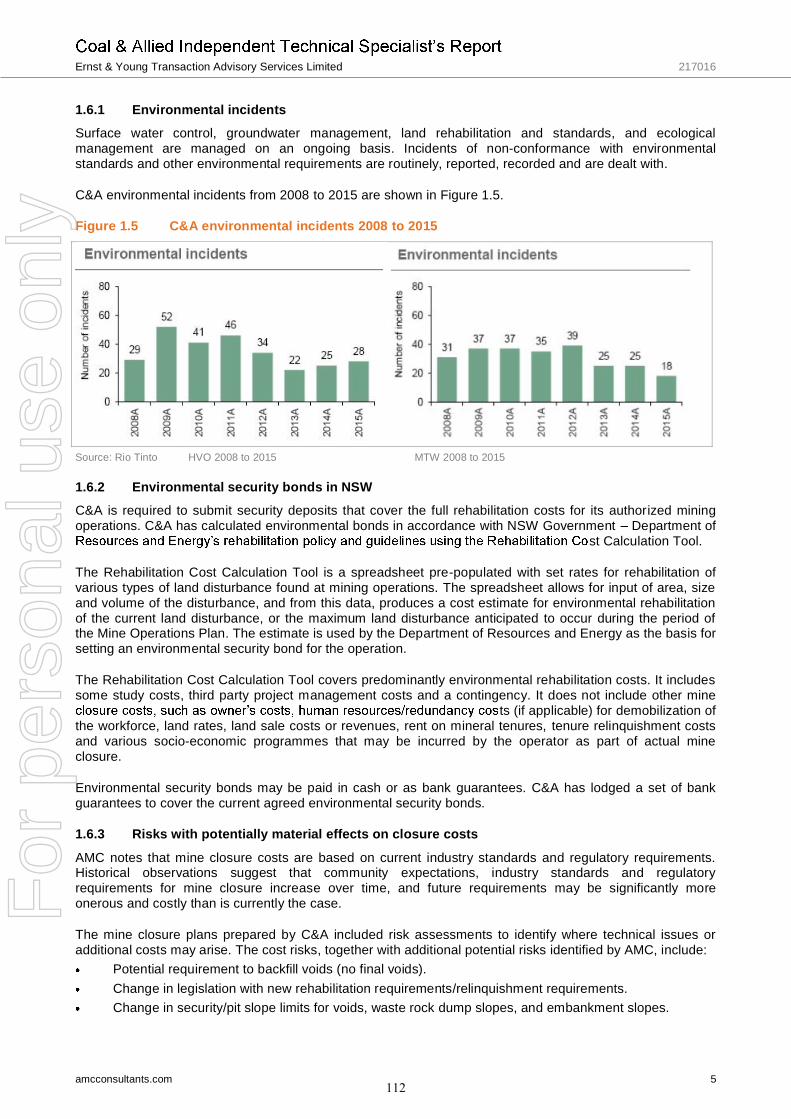
Ernst & Young Transaction Advisory Services Limited 217016
amcconsultants.com 5
1.6.1 Environmental incidentsSurface water control, groundwater management, land rehabilitation and standards, and ecologicalmanagement are managed on an ongoing basis. Incidents of non-conformance with environmentalstandards and other environmental requirements are routinely, reported, recorded and are dealt with.
C&A environmental incidents from 2008 to 2015 are shown in Figure 1.5.
Figure 1.5 C&A environmental incidents 2008 to 2015
Source: Rio Tinto HVO 2008 to 2015 MTW 2008 to 2015
1.6.2 Environmental security bonds in NSWC&A is required to submit security deposits that cover the full rehabilitation costs for its authorized miningoperations. C&A has calculated environmental bonds in accordance with NSW Government Department of
st Calculation Tool.
The Rehabilitation Cost Calculation Tool is a spreadsheet pre-populated with set rates for rehabilitation ofvarious types of land disturbance found at mining operations. The spreadsheet allows for input of area, sizeand volume of the disturbance, and from this data, produces a cost estimate for environmental rehabilitationof the current land disturbance, or the maximum land disturbance anticipated to occur during the period ofthe Mine Operations Plan. The estimate is used by the Department of Resources and Energy as the basis forsetting an environmental security bond for the operation.
The Rehabilitation Cost Calculation Tool covers predominantly environmental rehabilitation costs. It includessome study costs, third party project management costs and a contingency. It does not include other mine
ts (if applicable) for demobilization ofthe workforce, land rates, land sale costs or revenues, rent on mineral tenures, tenure relinquishment costsand various socio-economic programmes that may be incurred by the operator as part of actual mineclosure.
Environmental security bonds may be paid in cash or as bank guarantees. C&A has lodged a set of bankguarantees to cover the current agreed environmental security bonds.
1.6.3 Risks with potentially material effects on closure costs
AMC notes that mine closure costs are based on current industry standards and regulatory requirements.Historical observations suggest that community expectations, industry standards and regulatoryrequirements for mine closure increase over time, and future requirements may be significantly moreonerous and costly than is currently the case.
The mine closure plans prepared by C&A included risk assessments to identify where technical issues oradditional costs may arise. The cost risks, together with additional potential risks identified by AMC, include:
Potential requirement to backfill voids (no final voids).Change in legislation with new rehabilitation requirements/relinquishment requirements.Change in security/pit slope limits for voids, waste rock dump slopes, and embankment slopes.
112
For
per
sona
l use
onl
y
Ernst & Young Transaction Advisory Services Limited 217016
amcconsultants.com 6
Timing of mine closure brought forward, resulting in an impact to net present value (NPV) and closurefinancial provisions.Future community expectations exceed current estimates/allowances.Delays to progressive rehabilitation.Change in community and regulatory requirements regarding management of saline water in finalvoids.
AMC notes that potentially the most significant risk is the requirement to backfill final voids. Such arequirement would materially increase closure costs. Management of saline drainage from disturbed rockprofiles and an increased focus on demonstrating a return to full land capabilities could also present materialincreases in closure costs.
These potential risks have not been included in mine closure cost allowances.
While AMC has not tried to predict how environmental standards and approvals requirements will change infuture years, AMC considers it likely that mine closure costs will increase over time. AMC considers that acontingency for increased mine closure costs related to higher mine closure standards should be included ineconomic evaluations.
Any requirement to substantially bring forward mine closure has the potential to materially affect the NPV ofboth HVO and MTO.
Production Cases1.7Production Cases are described in detail under each of the operations. In preparing these cases,
AMC has not tried to predict how approval requirements may change in future years, however the ProductionCases cover the following possible approvals scenarios:
Approvals Scenario 1 (Base Production Case) Mining of the existing development consent,plus some additional mining from unapproved lease areas.The Base Production Case mine life is consistent with current approvals and development consent,however also includes a mining extension for MTW in mining lease areas for which furtherdevelopment consent would be required.Approvals Scenario 2 (High Production Case) Ongoing approvals.The High Production Case mine life is consistent with Rio Tinto mine plans and mine life is notsignificantly affected by approvals limitations.Approvals Scenario 3 (Low Production Case) Mining of most of the existing developmentconsent, plus some additional mining from unapproved lease areasThe Low Production Case mine life is affected by approvals limitations, however also includes amining extension for MTW in mining lease areas for which further development consent would berequired.
113
For
per
sona
l use
onl
y

Ernst & Young Transaction Advisory Services Limited 217016
amcconsultants.com 7
2 Hunter Valley Operations open cut mine Location2.1
is approximately 24 km north-west of Singleton and 75 km north-west of Newcastle. Therail distance from HVO to the PWCS facilities is 108 km.
Open cut coal mining commenced in the area in 1949, when the operating arm of the Joint Coal Board, theNew South Wales Mining Company, started the Foybrook Open Cut. The Howick open cut mine commencedshortly afterwards in 1952, followed by the Lemington open cut and underground mine in 1971, and theHunter Valley No.1 open cut mine in 1979. Through acquisition and expansion, HVO now consists of allthese mines, which were amalgamated into a single combined coal mining operation.
The HVO mine layout showing open cut, CHPP, and rail loadout infrastructure locations with respect to thelease boundary, neighbouring coal mining operations, major watercourses, major roads, and the rail line areshown in Figure 2.1.
HVO comprises 45 separate mining tenements, shown in Figure 2.2.
Figure 2.1 HVO mine layout
114
For
per
sona
l use
onl
y
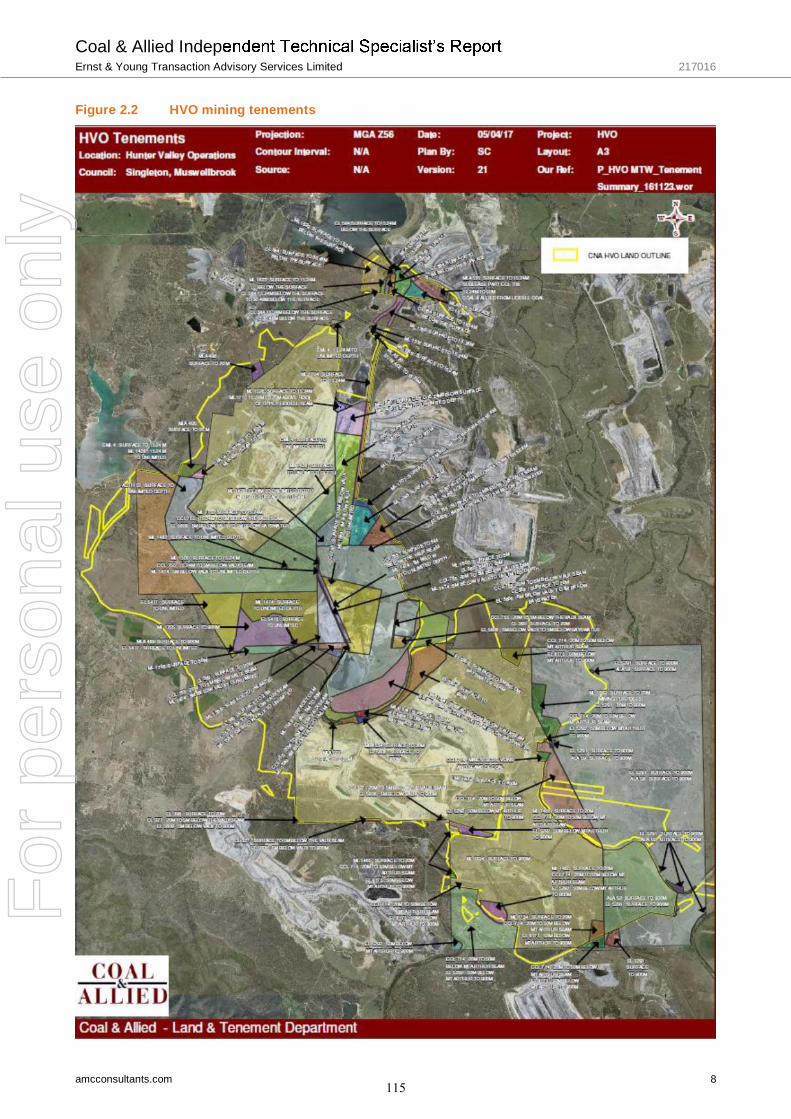
Coal & Allied IndepErnst & Young Transaction Advisory Services Limited 217016
amcconsultants.com 8
Figure 2.2 HVO mining tenements
115
For
per
sona
l use
onl
y
Ernst & Young Transaction Advisory Services Limited 217016
amcconsultants.com 9
Open cuts, coal processing infrastructure, and supporting infrastructure are separated by the Hunter Riverinto HVO South and HVO North areas. While HVO South and HVO North each have separate approvals,HVO is managed as an integrated operation, with coal, coarse and fine reject, overburden, topsoil, mobileequipment, materials, and personnel moved between the two areas.
HVO North comprises West, Carrington, Wilton, and Mitchell pits and the mined-out Alluvial Lands. Twooperating coal preparation plants are in HVO North; Hunter Valley Coal Preparation Plant (HVCPP), HowickCoal Preparation Plant (HCPP). A third plant, the Newdell Coal Preparation Plant, is no longer used for coalpreparation, with much of the infrastructure demolished, but it is still used for coal handling and rail loadoutactivities. There are two train load out areas; Hunter Valley Load Point (HVLP) and Newdell Load Point(NLP).
HVO South comprises the Cheshunt, Cheshunt Deep, Glider, Riverview, Auckland, and Southern pits. TheLemington Coal Preparation Plant (LCPP) is in this area, but is not used and has been largely demolished.Approvals to recommission this plant have been obtained by C&A, but have not been actioned becauseconstraints in the logistics chain will not allow the additional coal product to be transported to market.
ROM coal mined from both HVO North and HVO South is processed through the two coal preparation plantsin HVO North, to produce SSCC and low, medium, and high ash thermal coal for the export market. Productcoal is railed 107 km through the Hunter Valley rail network to the PWCS and NCIG coal loading terminals.
Geology and mineralization2.22.2.1 Regional and local geologyC&is a geographical division comprising the traditional coal mining leases around the towns of Muswellbrook,Singleton, and Cessnock. The main coal sequences in this area are the Greta, Wittingham, and NewcastleCoal Measures. Commercial coal mining in the Hunter Valley has been from the Greta and Wittingham Coalmeasures.
The coal seams located at both HVO and MTW are within the Wittingham Coal Measures. The main rocktypes within the area are sandstones, siltstones, conglomerates, coal and tuffaceous claystone. These samecoal seams are mined across the Hunter Valley.
The HVO deposit extends approximately 20 km north-west, 10 km in width and down to a depth of 515 m.
Coal Resources2.3
Published total HVO Coal Resources, exclusive of Coal Reserves, at 31 December 2016 (HVO CoalResources), classified and reported in accordance with the guidelines of the JORC Code are shown inTable 2.1. C&A reports Coal Resources on a 100% basis, exclusive of Coal Reserves, and on an in situmoisture basis.
Table 2.1 HVO Coal Resources as at December 2016
Type Measured(Mt)
Indicated(Mt)
Inferred(Mt)
Total(Mt)
Open-cut and underground (export thermal and semi-soft coking coal) 348 571 912 1,831Note: Annual Report dated 1 March 2017 and released on2 March 2017. The Competent Person responsible for that previous reporting was R Ruddock (MAusIMM). Rio Tinto has advised that itis not aware of any new information or data that materially affects these Coal Resource estimates, and has confirmed that all materialassumptions and technical parameters underpinning the estimates continue to apply and have not materially changed. The form andcontext in which the Competent P findings are presented have not been materially modified.
The processes used by C&A to estimate the HVO Coal Resources are summarized as follows.
Coal seams were modelled using Minescape software, finite element modelling of the seam location andthickness, and coal quality estimation using an inverse distance squared method at a 1,000 m searchdistance. This method is consistent with the general industry practice.
A total of 19 coal seams are modelled for long-term planning at the Rio Tinto Brisbane office. Updating of thelong-term model is carried out by site personnel on a 50 m grid at HVO and a 25 m grid for short term
116
For
per
sona
l use
onl
y
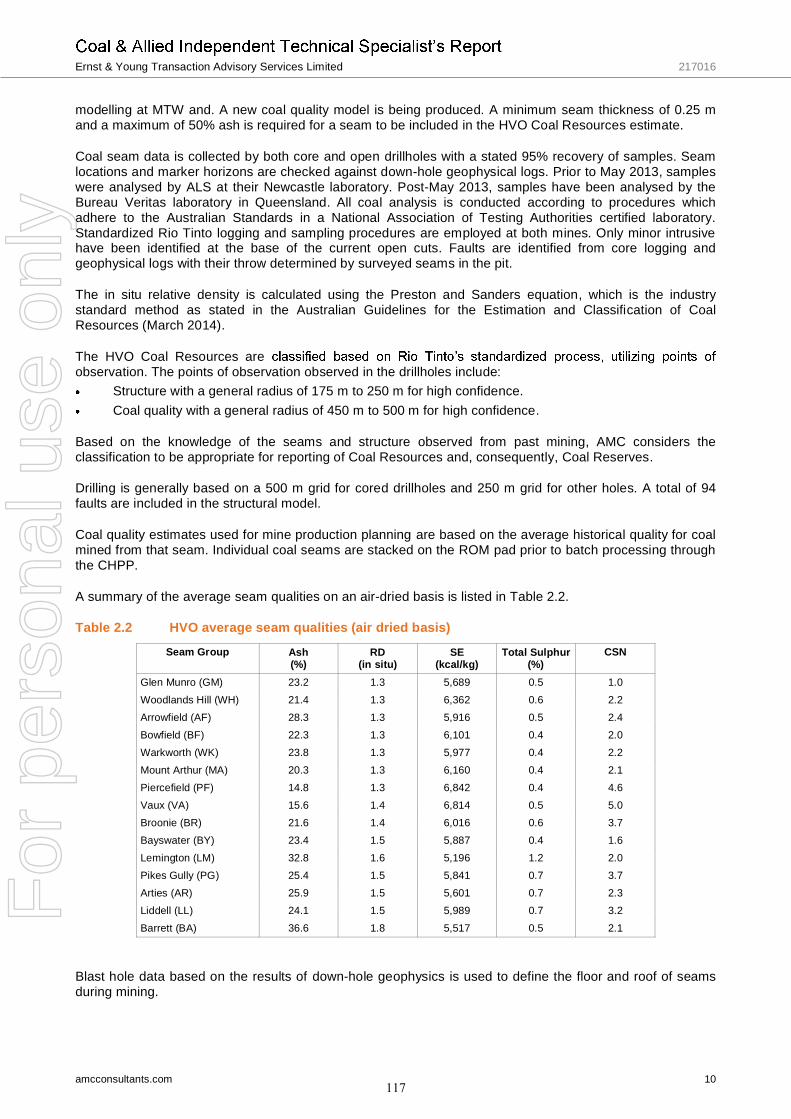
Ernst & Young Transaction Advisory Services Limited 217016
amcconsultants.com 10
modelling at MTW and. A new coal quality model is being produced. A minimum seam thickness of 0.25 mand a maximum of 50% ash is required for a seam to be included in the HVO Coal Resources estimate.
Coal seam data is collected by both core and open drillholes with a stated 95% recovery of samples. Seamlocations and marker horizons are checked against down-hole geophysical logs. Prior to May 2013, sampleswere analysed by ALS at their Newcastle laboratory. Post-May 2013, samples have been analysed by theBureau Veritas laboratory in Queensland. All coal analysis is conducted according to procedures whichadhere to the Australian Standards in a National Association of Testing Authorities certified laboratory.Standardized Rio Tinto logging and sampling procedures are employed at both mines. Only minor intrusivehave been identified at the base of the current open cuts. Faults are identified from core logging andgeophysical logs with their throw determined by surveyed seams in the pit.
The in situ relative density is calculated using the Preston and Sanders equation, which is the industrystandard method as stated in the Australian Guidelines for the Estimation and Classification of CoalResources (March 2014).
The HVO Coal Resources areobservation. The points of observation observed in the drillholes include:
Structure with a general radius of 175 m to 250 m for high confidence.Coal quality with a general radius of 450 m to 500 m for high confidence.
Based on the knowledge of the seams and structure observed from past mining, AMC considers theclassification to be appropriate for reporting of Coal Resources and, consequently, Coal Reserves.
Drilling is generally based on a 500 m grid for cored drillholes and 250 m grid for other holes. A total of 94faults are included in the structural model.
Coal quality estimates used for mine production planning are based on the average historical quality for coalmined from that seam. Individual coal seams are stacked on the ROM pad prior to batch processing throughthe CHPP.
A summary of the average seam qualities on an air-dried basis is listed in Table 2.2.
Table 2.2 HVO average seam qualities (air dried basis)
Seam Group Ash(%)
RD(in situ)
SE(kcal/kg)
Total Sulphur(%)
CSN
Glen Munro (GM) 23.2 1.3 5,689 0.5 1.0Woodlands Hill (WH) 21.4 1.3 6,362 0.6 2.2Arrowfield (AF) 28.3 1.3 5,916 0.5 2.4Bowfield (BF) 22.3 1.3 6,101 0.4 2.0Warkworth (WK) 23.8 1.3 5,977 0.4 2.2Mount Arthur (MA) 20.3 1.3 6,160 0.4 2.1Piercefield (PF) 14.8 1.3 6,842 0.4 4.6Vaux (VA) 15.6 1.4 6,814 0.5 5.0Broonie (BR) 21.6 1.4 6,016 0.6 3.7Bayswater (BY) 23.4 1.5 5,887 0.4 1.6Lemington (LM) 32.8 1.6 5,196 1.2 2.0Pikes Gully (PG) 25.4 1.5 5,841 0.7 3.7Arties (AR) 25.9 1.5 5,601 0.7 2.3Liddell (LL) 24.1 1.5 5,989 0.7 3.2Barrett (BA) 36.6 1.8 5,517 0.5 2.1
Blast hole data based on the results of down-hole geophysics is used to define the floor and roof of seamsduring mining.
117
For
per
sona
l use
onl
y
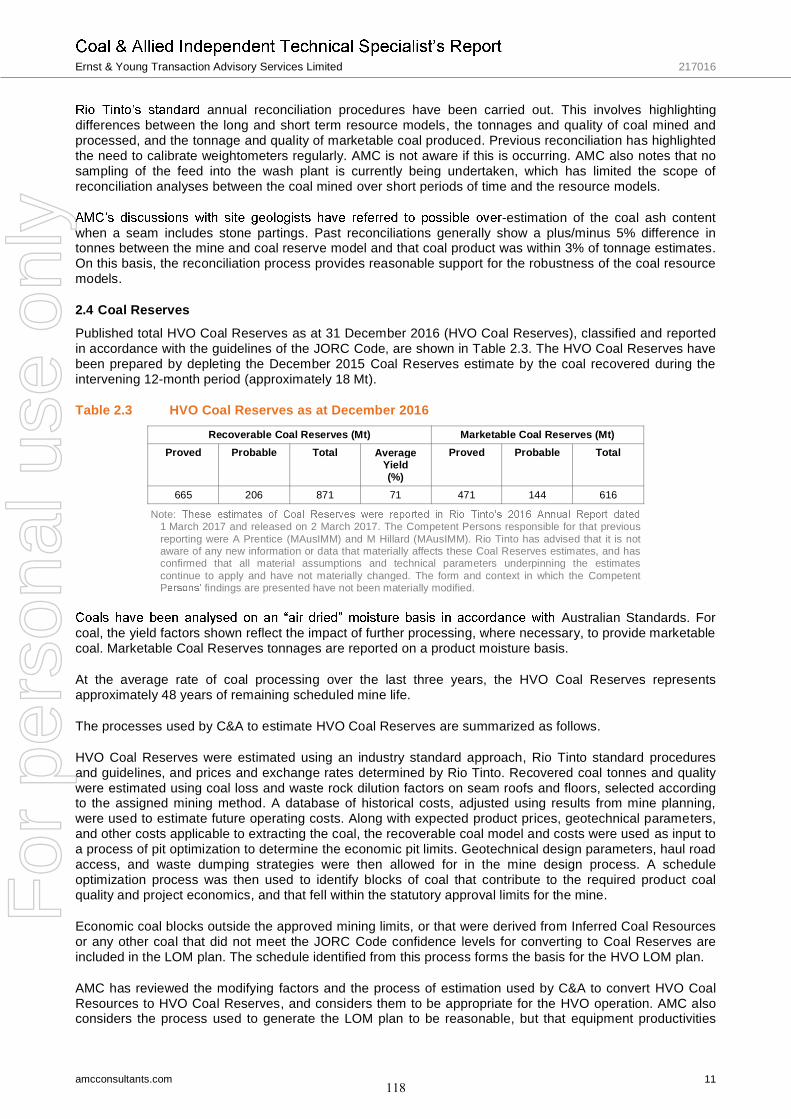
Ernst & Young Transaction Advisory Services Limited 217016
amcconsultants.com 11
annual reconciliation procedures have been carried out. This involves highlightingdifferences between the long and short term resource models, the tonnages and quality of coal mined andprocessed, and the tonnage and quality of marketable coal produced. Previous reconciliation has highlightedthe need to calibrate weightometers regularly. AMC is not aware if this is occurring. AMC also notes that nosampling of the feed into the wash plant is currently being undertaken, which has limited the scope ofreconciliation analyses between the coal mined over short periods of time and the resource models.
-estimation of the coal ash contentwhen a seam includes stone partings. Past reconciliations generally show a plus/minus 5% difference intonnes between the mine and coal reserve model and that coal product was within 3% of tonnage estimates.On this basis, the reconciliation process provides reasonable support for the robustness of the coal resourcemodels.
Coal Reserves2.4Published total HVO Coal Reserves as at 31 December 2016 (HVO Coal Reserves), classified and reportedin accordance with the guidelines of the JORC Code, are shown in Table 2.3. The HVO Coal Reserves havebeen prepared by depleting the December 2015 Coal Reserves estimate by the coal recovered during theintervening 12-month period (approximately 18 Mt).
Table 2.3 HVO Coal Reserves as at December 2016
Recoverable Coal Reserves (Mt) Marketable Coal Reserves (Mt)Proved Probable Total Average
Yield(%)
Proved Probable Total
665 206 871 71 471 144 616
Note:1 March 2017 and released on 2 March 2017. The Competent Persons responsible for that previousreporting were A Prentice (MAusIMM) and M Hillard (MAusIMM). Rio Tinto has advised that it is notaware of any new information or data that materially affects these Coal Reserves estimates, and hasconfirmed that all material assumptions and technical parameters underpinning the estimatescontinue to apply and have not materially changed. The form and context in which the CompetentP findings are presented have not been materially modified.
Australian Standards. Forcoal, the yield factors shown reflect the impact of further processing, where necessary, to provide marketablecoal. Marketable Coal Reserves tonnages are reported on a product moisture basis.
At the average rate of coal processing over the last three years, the HVO Coal Reserves representsapproximately 48 years of remaining scheduled mine life.
The processes used by C&A to estimate HVO Coal Reserves are summarized as follows.
HVO Coal Reserves were estimated using an industry standard approach, Rio Tinto standard proceduresand guidelines, and prices and exchange rates determined by Rio Tinto. Recovered coal tonnes and qualitywere estimated using coal loss and waste rock dilution factors on seam roofs and floors, selected accordingto the assigned mining method. A database of historical costs, adjusted using results from mine planning,were used to estimate future operating costs. Along with expected product prices, geotechnical parameters,and other costs applicable to extracting the coal, the recoverable coal model and costs were used as input toa process of pit optimization to determine the economic pit limits. Geotechnical design parameters, haul roadaccess, and waste dumping strategies were then allowed for in the mine design process. A scheduleoptimization process was then used to identify blocks of coal that contribute to the required product coalquality and project economics, and that fell within the statutory approval limits for the mine.
Economic coal blocks outside the approved mining limits, or that were derived from Inferred Coal Resourcesor any other coal that did not meet the JORC Code confidence levels for converting to Coal Reserves areincluded in the LOM plan. The schedule identified from this process forms the basis for the HVO LOM plan.
AMC has reviewed the modifying factors and the process of estimation used by C&A to convert HVO CoalResources to HVO Coal Reserves, and considers them to be appropriate for the HVO operation. AMC alsoconsiders the process used to generate the LOM plan to be reasonable, but that equipment productivities
118
For
per
sona
l use
onl
y
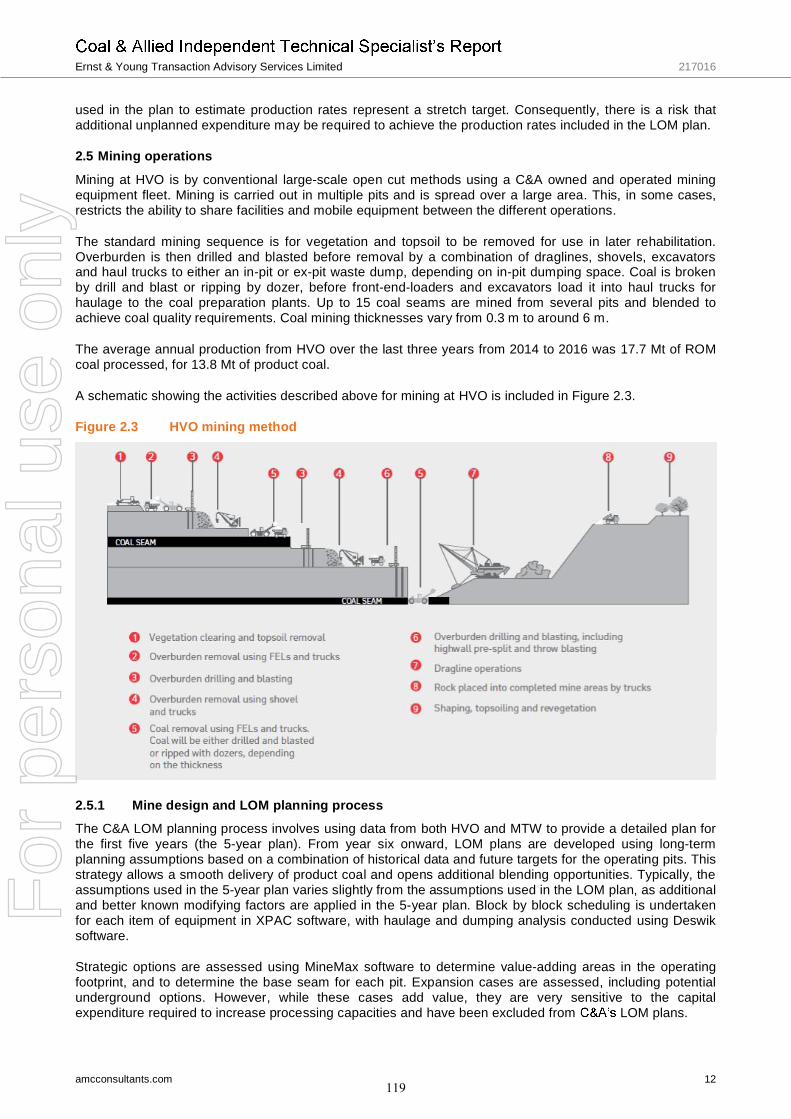
Ernst & Young Transaction Advisory Services Limited 217016
amcconsultants.com 12
used in the plan to estimate production rates represent a stretch target. Consequently, there is a risk thatadditional unplanned expenditure may be required to achieve the production rates included in the LOM plan.
Mining operations2.5
Mining at HVO is by conventional large-scale open cut methods using a C&A owned and operated miningequipment fleet. Mining is carried out in multiple pits and is spread over a large area. This, in some cases,restricts the ability to share facilities and mobile equipment between the different operations.
The standard mining sequence is for vegetation and topsoil to be removed for use in later rehabilitation.Overburden is then drilled and blasted before removal by a combination of draglines, shovels, excavatorsand haul trucks to either an in-pit or ex-pit waste dump, depending on in-pit dumping space. Coal is brokenby drill and blast or ripping by dozer, before front-end-loaders and excavators load it into haul trucks forhaulage to the coal preparation plants. Up to 15 coal seams are mined from several pits and blended toachieve coal quality requirements. Coal mining thicknesses vary from 0.3 m to around 6 m.
The average annual production from HVO over the last three years from 2014 to 2016 was 17.7 Mt of ROMcoal processed, for 13.8 Mt of product coal.
A schematic showing the activities described above for mining at HVO is included in Figure 2.3.
Figure 2.3 HVO mining method
2.5.1 Mine design and LOM planning processThe C&A LOM planning process involves using data from both HVO and MTW to provide a detailed plan forthe first five years (the 5-year plan). From year six onward, LOM plans are developed using long-termplanning assumptions based on a combination of historical data and future targets for the operating pits. Thisstrategy allows a smooth delivery of product coal and opens additional blending opportunities. Typically, theassumptions used in the 5-year plan varies slightly from the assumptions used in the LOM plan, as additionaland better known modifying factors are applied in the 5-year plan. Block by block scheduling is undertakenfor each item of equipment in XPAC software, with haulage and dumping analysis conducted using Deswiksoftware.
Strategic options are assessed using MineMax software to determine value-adding areas in the operatingfootprint, and to determine the base seam for each pit. Expansion cases are assessed, including potentialunderground options. However, while these cases add value, they are very sensitive to the capitalexpenditure required to increase processing capacities and have been excluded from LOM plans.
119
For
per
sona
l use
onl
y
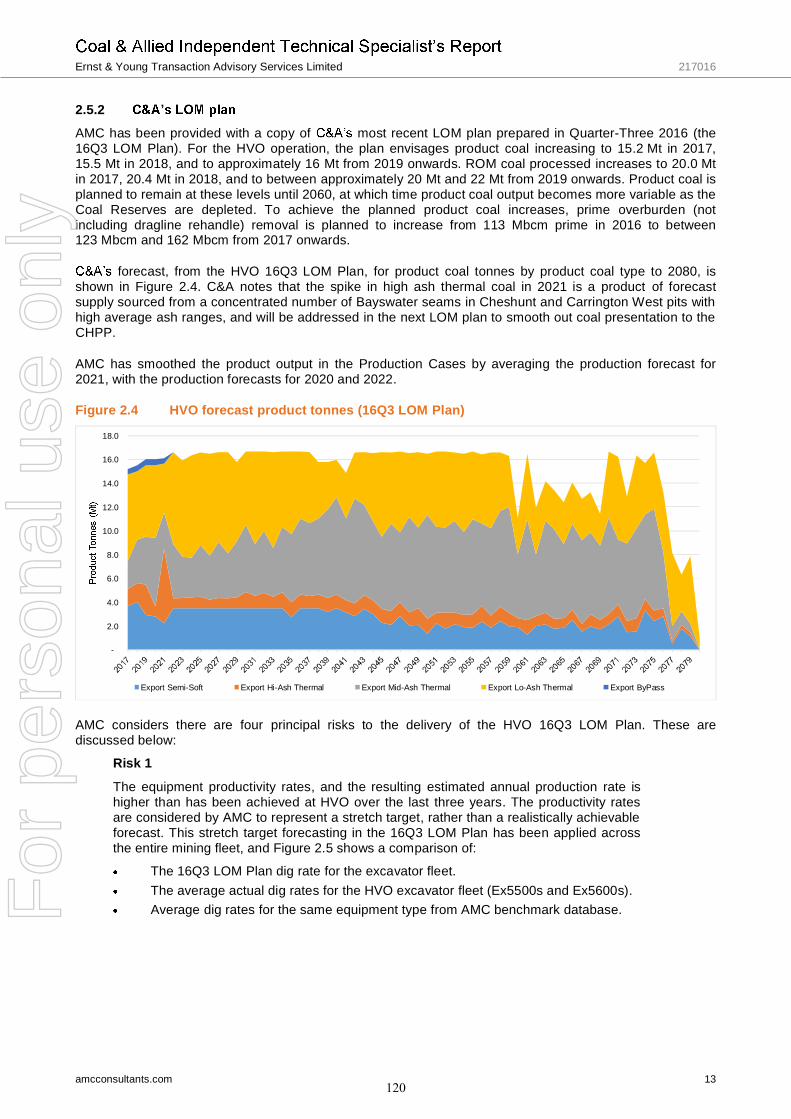
Ernst & Young Transaction Advisory Services Limited 217016
amcconsultants.com 13
2.5.2AMC has been provided with a copy of most recent LOM plan prepared in Quarter-Three 2016 (the16Q3 LOM Plan). For the HVO operation, the plan envisages product coal increasing to 15.2 Mt in 2017,15.5 Mt in 2018, and to approximately 16 Mt from 2019 onwards. ROM coal processed increases to 20.0 Mtin 2017, 20.4 Mt in 2018, and to between approximately 20 Mt and 22 Mt from 2019 onwards. Product coal isplanned to remain at these levels until 2060, at which time product coal output becomes more variable as theCoal Reserves are depleted. To achieve the planned product coal increases, prime overburden (notincluding dragline rehandle) removal is planned to increase from 113 Mbcm prime in 2016 to between123 Mbcm and 162 Mbcm from 2017 onwards.
forecast, from the HVO 16Q3 LOM Plan, for product coal tonnes by product coal type to 2080, isshown in Figure 2.4. C&A notes that the spike in high ash thermal coal in 2021 is a product of forecastsupply sourced from a concentrated number of Bayswater seams in Cheshunt and Carrington West pits withhigh average ash ranges, and will be addressed in the next LOM plan to smooth out coal presentation to theCHPP.
AMC has smoothed the product output in the Production Cases by averaging the production forecast for2021, with the production forecasts for 2020 and 2022.
Figure 2.4 HVO forecast product tonnes (16Q3 LOM Plan)
AMC considers there are four principal risks to the delivery of the HVO 16Q3 LOM Plan. These arediscussed below:
Risk 1
The equipment productivity rates, and the resulting estimated annual production rate ishigher than has been achieved at HVO over the last three years. The productivity ratesare considered by AMC to represent a stretch target, rather than a realistically achievableforecast. This stretch target forecasting in the 16Q3 LOM Plan has been applied acrossthe entire mining fleet, and Figure 2.5 shows a comparison of:
The 16Q3 LOM Plan dig rate for the excavator fleet.The average actual dig rates for the HVO excavator fleet (Ex5500s and Ex5600s).Average dig rates for the same equipment type from AMC benchmark database.
-
2.0
4.0
6.0
8.0
10.0
12.0
14.0
16.0
18.0
Export Semi-Soft Export Hi-Ash Thermal Export Mid-Ash Thermal Export Lo-Ash Thermal Export ByPass
120
For
per
sona
l use
onl
y
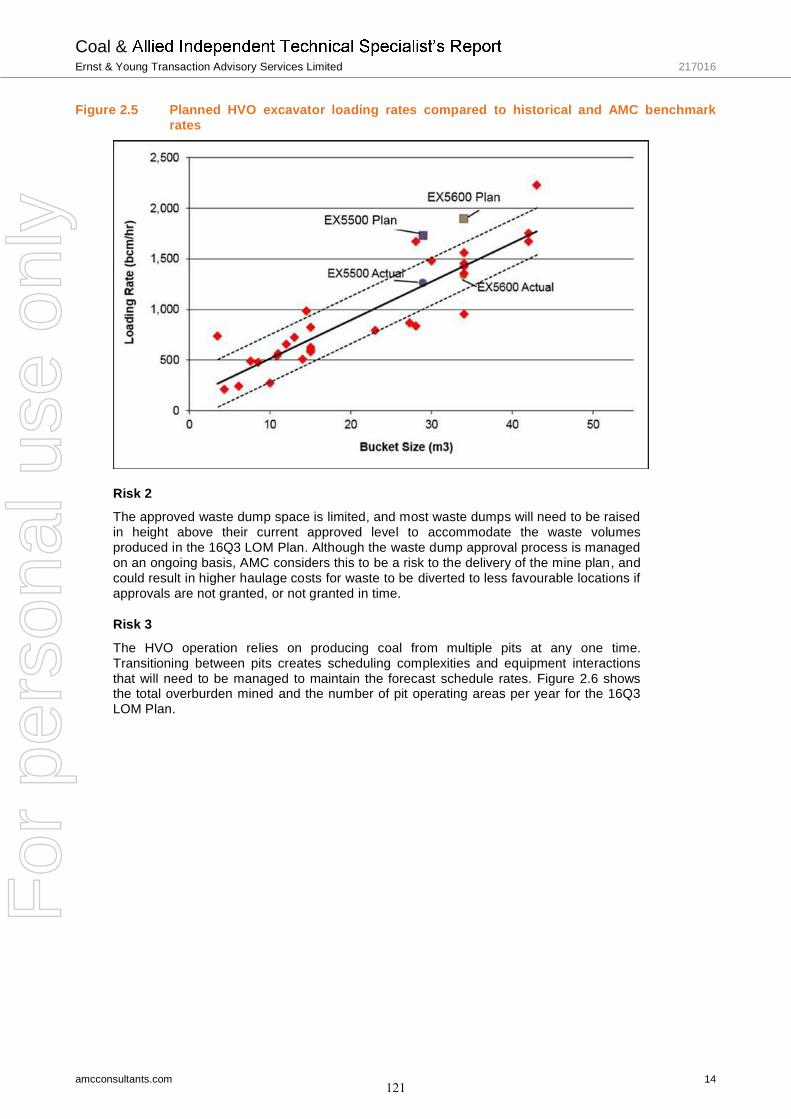
Coal &Ernst & Young Transaction Advisory Services Limited 217016
amcconsultants.com 14
Figure 2.5 Planned HVO excavator loading rates compared to historical and AMC benchmarkrates
Risk 2The approved waste dump space is limited, and most waste dumps will need to be raisedin height above their current approved level to accommodate the waste volumesproduced in the 16Q3 LOM Plan. Although the waste dump approval process is managedon an ongoing basis, AMC considers this to be a risk to the delivery of the mine plan, andcould result in higher haulage costs for waste to be diverted to less favourable locations ifapprovals are not granted, or not granted in time.
Risk 3
The HVO operation relies on producing coal from multiple pits at any one time.Transitioning between pits creates scheduling complexities and equipment interactionsthat will need to be managed to maintain the forecast schedule rates. Figure 2.6 showsthe total overburden mined and the number of pit operating areas per year for the 16Q3LOM Plan.
121
For
per
sona
l use
onl
y

Coal & Allied Independent Technical SpecialistErnst & Young Transaction Advisory Services Limited 217016
amcconsultants.com 15
Figure 2.6 16Q3 LOM Plan waste mined
Notes: 1. Auckland Pit is included in 16Q3 LOM plan, but not included in the 2016 Coal Reserve estimate.2. Southern and Auckland South do not currently have full mining approvals.
Risk 4
The 16Q3 LOM Plan includes; mining the Coal Reserves, plus coal not currentlyclassified as such because of uncertainty associated with geological and/or miningmodifying factors, which includes the granting of approvals. Ongoing approvals arerequired for the delivery of most the 16Q3 LOM Plan. Coal Reserves are considered tohave a reasonable expectation of receiving approvals. Whereas, a lesser expectationapplies to material that is not currently approved and is not currently classified as a CoalReserve.
Quality2.62.6.1 Raw coal qualityThe raw coal ash for individual seams varies from approximately 15 to 33%, while the averages for all seamsare above 20%. Therefore, opportunities to produce a bypass component that will meet productspecifications without blending with processed coal is limited. The average total sulphur (TS) is lowcompared to similar coals.
2.6.2 Product coal quality
Coal products from HVO include thermal coal and SSCC, which are processed in a selective mining,washing, and stockpiling operation.
The thermal product is presently produced and sold in three grades based on ash content Low ash, Midash and High ash. The product calorific value is directly linked to the ash content.
The SSCC conforms to the established Newcastle SSCC. Crucible Swelling Number (CSN) is the initialindicator used to delineate SSCC.
There are some coal quality differences between product coal derived from different seams, but withinindividual seams there is broad consistency. To demonstrate the deposit patterns, a comparison betweentwo datasets is shown in Figure 2.7. The two datasets are derived from; all drillhole samples for the entiredeposit, and samples from the area selected for mining in the next 10 years.
122
For
per
sona
l use
onl
y
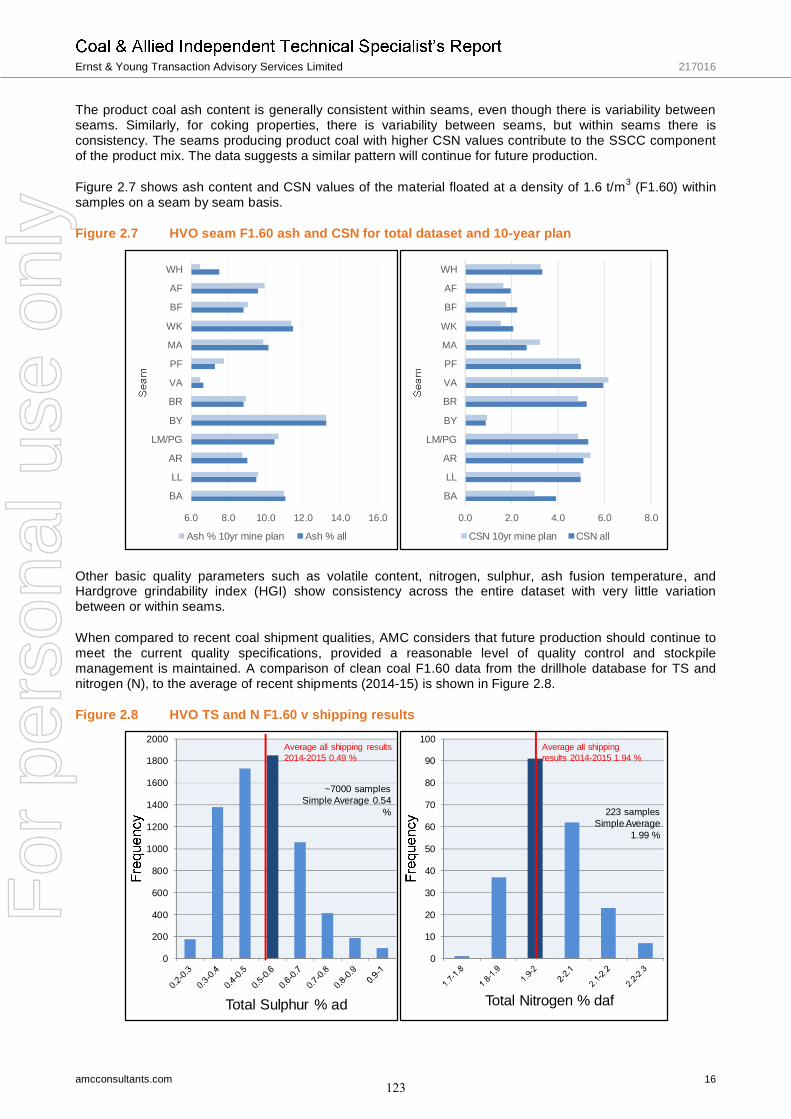
Ernst & Young Transaction Advisory Services Limited 217016
amcconsultants.com 16
The product coal ash content is generally consistent within seams, even though there is variability betweenseams. Similarly, for coking properties, there is variability between seams, but within seams there isconsistency. The seams producing product coal with higher CSN values contribute to the SSCC componentof the product mix. The data suggests a similar pattern will continue for future production.
Figure 2.7 shows ash content and CSN values of the material floated at a density of 1.6 t/m3 (F1.60) withinsamples on a seam by seam basis.
Figure 2.7 HVO seam F1.60 ash and CSN for total dataset and 10-year plan
Other basic quality parameters such as volatile content, nitrogen, sulphur, ash fusion temperature, andHardgrove grindability index (HGI) show consistency across the entire dataset with very little variationbetween or within seams.
When compared to recent coal shipment qualities, AMC considers that future production should continue tomeet the current quality specifications, provided a reasonable level of quality control and stockpilemanagement is maintained. A comparison of clean coal F1.60 data from the drillhole database for TS andnitrogen (N), to the average of recent shipments (2014-15) is shown in Figure 2.8.
Figure 2.8 HVO TS and N F1.60 v shipping results
6.0 8.0 10.0 12.0 14.0 16.0
BA
LL
AR
LM/PG
BY
BR
VA
PF
MA
WK
BF
AF
WH
Ash % 10yr mine plan Ash % all
0.0 2.0 4.0 6.0 8.0
BA
LL
AR
LM/PG
BY
BR
VA
PF
MA
WK
BF
AF
WH
CSN 10yr mine plan CSN all
0
200
400
600
800
1000
1200
1400
1600
1800
2000
Total Sulphur % ad
~7000 samplesSimple Average 0.54
%
Average all shipping results2014-2015 0.49 %
0
10
20
30
40
50
60
70
80
90
100
Total Nitrogen % daf
223 samplesSimple Average
1.99 %
Average all shippingresults 2014-2015 1.94 %
123
For
per
sona
l use
onl
y
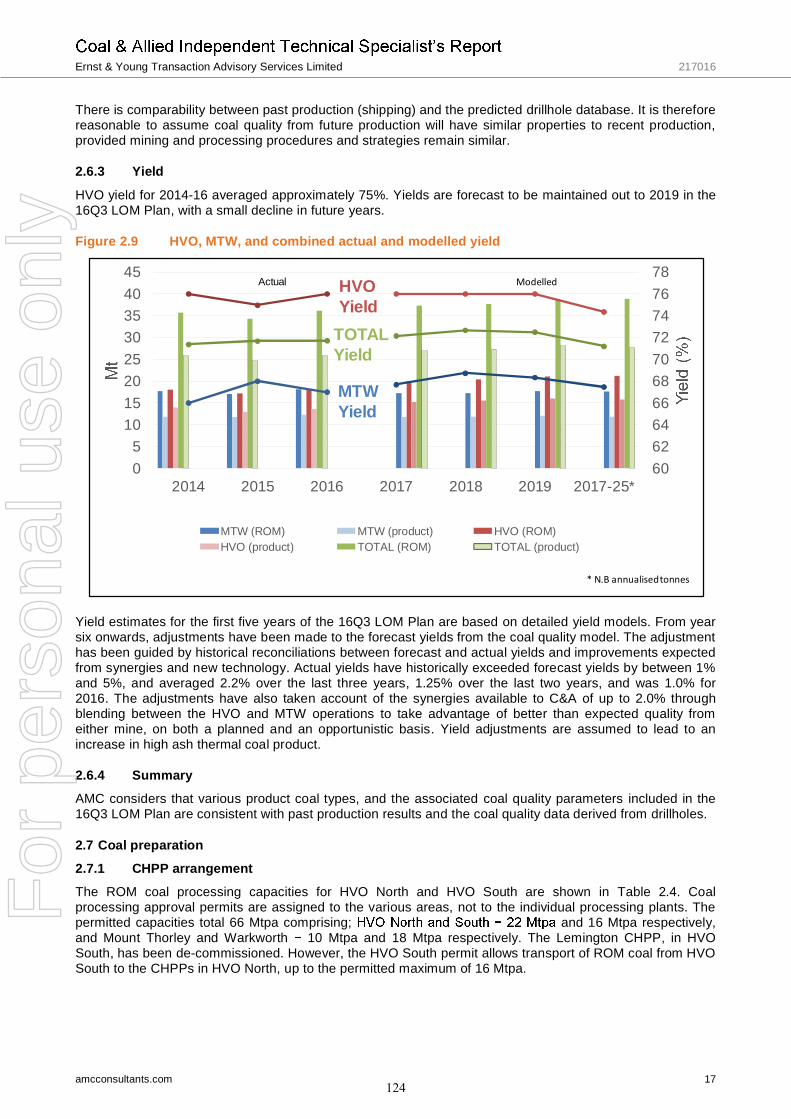
Ernst & Young Transaction Advisory Services Limited 217016
amcconsultants.com 17
There is comparability between past production (shipping) and the predicted drillhole database. It is thereforereasonable to assume coal quality from future production will have similar properties to recent production,provided mining and processing procedures and strategies remain similar.
2.6.3 Yield
HVO yield for 2014-16 averaged approximately 75%. Yields are forecast to be maintained out to 2019 in the16Q3 LOM Plan, with a small decline in future years.
Figure 2.9 HVO, MTW, and combined actual and modelled yield
Yield estimates for the first five years of the 16Q3 LOM Plan are based on detailed yield models. From yearsix onwards, adjustments have been made to the forecast yields from the coal quality model. The adjustmenthas been guided by historical reconciliations between forecast and actual yields and improvements expectedfrom synergies and new technology. Actual yields have historically exceeded forecast yields by between 1%and 5%, and averaged 2.2% over the last three years, 1.25% over the last two years, and was 1.0% for2016. The adjustments have also taken account of the synergies available to C&A of up to 2.0% throughblending between the HVO and MTW operations to take advantage of better than expected quality fromeither mine, on both a planned and an opportunistic basis. Yield adjustments are assumed to lead to anincrease in high ash thermal coal product.
2.6.4 SummaryAMC considers that various product coal types, and the associated coal quality parameters included in the16Q3 LOM Plan are consistent with past production results and the coal quality data derived from drillholes.
Coal preparation2.72.7.1 CHPP arrangementThe ROM coal processing capacities for HVO North and HVO South are shown in Table 2.4. Coalprocessing approval permits are assigned to the various areas, not to the individual processing plants. Thepermitted capacities total 66 Mtpa comprising; and 16 Mtpa respectively,and Mount Thorley and Warkworth 10 Mtpa and 18 Mtpa respectively. The Lemington CHPP, in HVOSouth, has been de-commissioned. However, the HVO South permit allows transport of ROM coal from HVOSouth to the CHPPs in HVO North, up to the permitted maximum of 16 Mtpa.
60626466687072747678
05
1015202530354045
2014 2015 2016 2017 2018 2019 2017-25*
MTW (ROM) MTW (product) HVO (ROM)HVO (product) TOTAL (ROM) TOTAL (product)
Actual Modelled
* N.B annualised tonnes
HVOYield
TOTALYield
MTWYield
124
For
per
sona
l use
onl
y
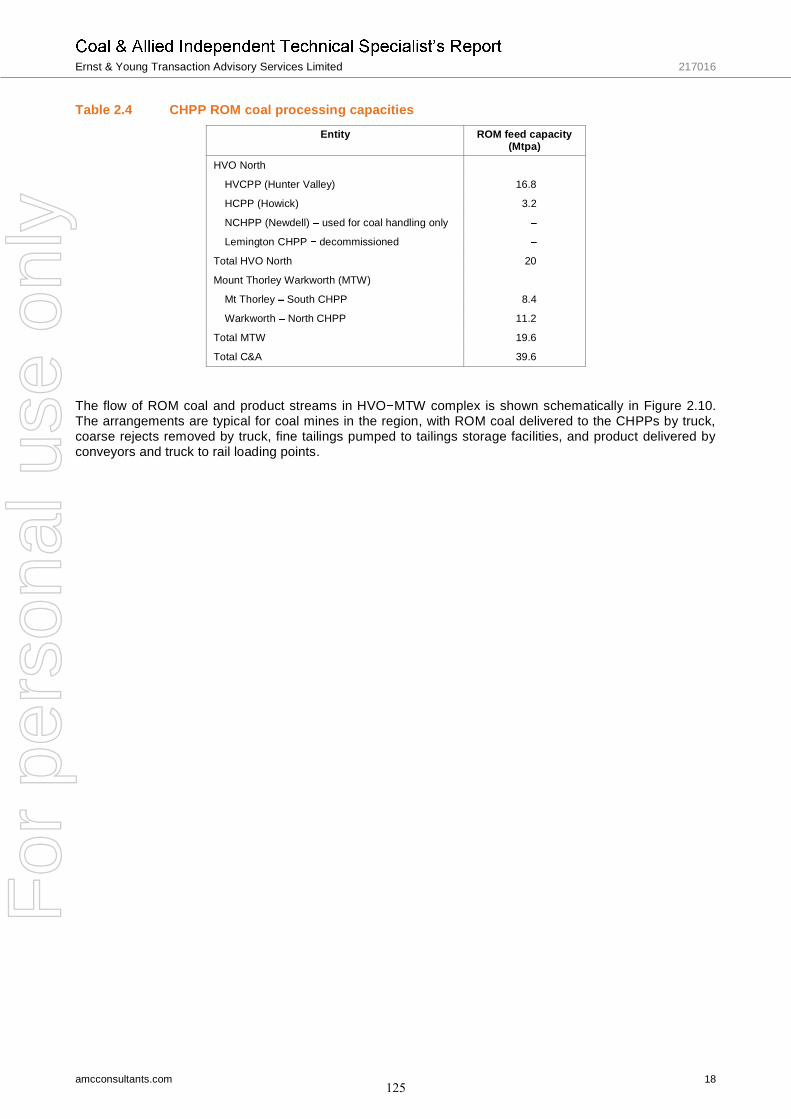
Ernst & Young Transaction Advisory Services Limited 217016
amcconsultants.com 18
Table 2.4 CHPP ROM coal processing capacities
Entity ROM feed capacity(Mtpa)
HVO North
HVCPP (Hunter Valley) 16.8
HCPP (Howick) 3.2
NCHPP (Newdell) used for coal handling only
Lemington CHPP decommissioned
Total HVO North 20
Mount Thorley Warkworth (MTW)
Mt Thorley South CHPP 8.4
Warkworth North CHPP 11.2
Total MTW 19.6
Total C&A 39.6
The flow of ROM coal and product streams in HVO MTW complex is shown schematically in Figure 2.10.The arrangements are typical for coal mines in the region, with ROM coal delivered to the CHPPs by truck,coarse rejects removed by truck, fine tailings pumped to tailings storage facilities, and product delivered byconveyors and truck to rail loading points.
125
For
per
sona
l use
onl
y

Ernst & Young Transaction Advisory Services Limited 217016
amcconsultants.com 19
Figure 2.10 General flow diagram for ROM and product coal streams
The general arrangement of the HVCPP is shown in Figure 2.11. The plant was commissioned in 1982, andis typical for plants of that era. ROM coal is reduced in size to minus 50 mm. Material finer than 0.125 mm isdiscarded to tailings. A size split at 2 mm is made, with the -50 mm to +2 mm fraction treated in densemedium cyclones (DMC), and the -2mm to +0.125 mm fraction treated using spirals. Product coal isdewatered to specification using cyclones and centrifuges.
The nominal feed rate of the plant is 2,400 tph (set by six modules of DMC and spirals at 400 tph each). Thequoted capacity of the plant assumes annual run-time of 7,000 hours (full plant equivalent). The DMC circuitoperates in a high-density range (1.60 t/m3 to 1.65 t/m3) and can produce thermal and semi-soft coking coalproducts.
126
For
per
sona
l use
onl
y
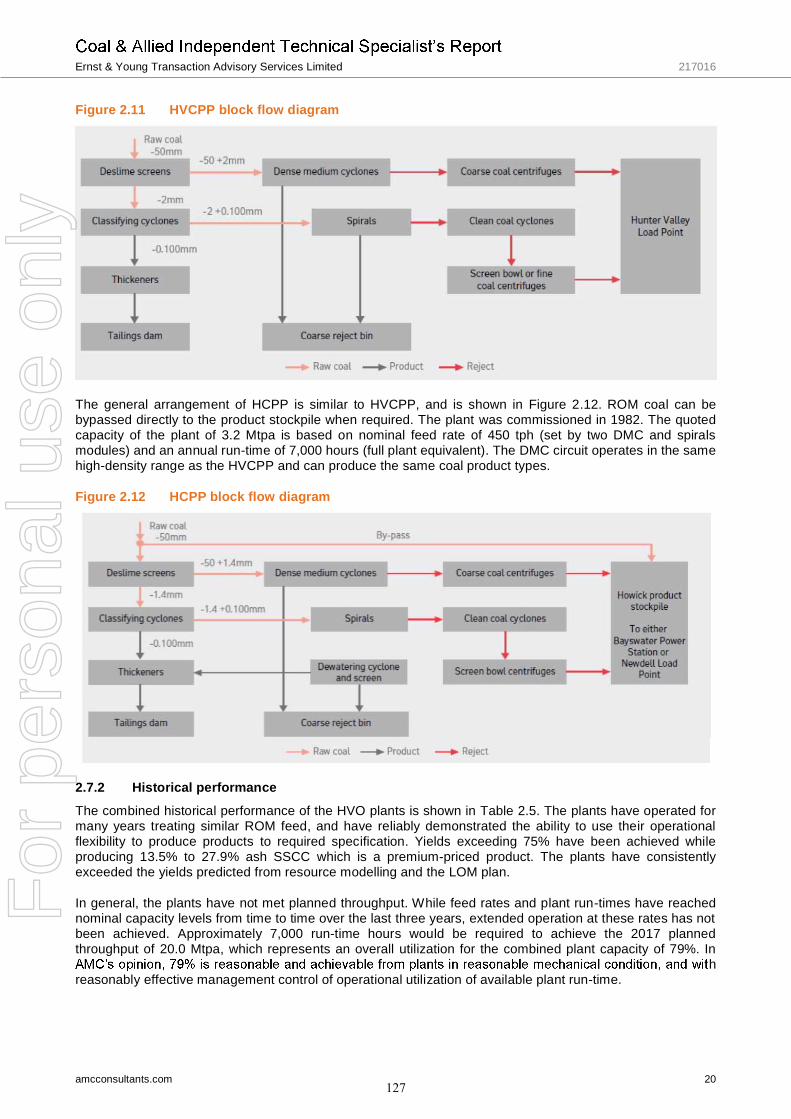
Ernst & Young Transaction Advisory Services Limited 217016
amcconsultants.com 20
Figure 2.11 HVCPP block flow diagram
The general arrangement of HCPP is similar to HVCPP, and is shown in Figure 2.12. ROM coal can bebypassed directly to the product stockpile when required. The plant was commissioned in 1982. The quotedcapacity of the plant of 3.2 Mtpa is based on nominal feed rate of 450 tph (set by two DMC and spiralsmodules) and an annual run-time of 7,000 hours (full plant equivalent). The DMC circuit operates in the samehigh-density range as the HVCPP and can produce the same coal product types.
Figure 2.12 HCPP block flow diagram
2.7.2 Historical performanceThe combined historical performance of the HVO plants is shown in Table 2.5. The plants have operated formany years treating similar ROM feed, and have reliably demonstrated the ability to use their operationalflexibility to produce products to required specification. Yields exceeding 75% have been achieved whileproducing 13.5% to 27.9% ash SSCC which is a premium-priced product. The plants have consistentlyexceeded the yields predicted from resource modelling and the LOM plan.
In general, the plants have not met planned throughput. While feed rates and plant run-times have reachednominal capacity levels from time to time over the last three years, extended operation at these rates has notbeen achieved. Approximately 7,000 run-time hours would be required to achieve the 2017 plannedthroughput of 20.0 Mtpa, which represents an overall utilization for the combined plant capacity of 79%. In
hreasonably effective management control of operational utilization of available plant run-time.
127
For
per
sona
l use
onl
y
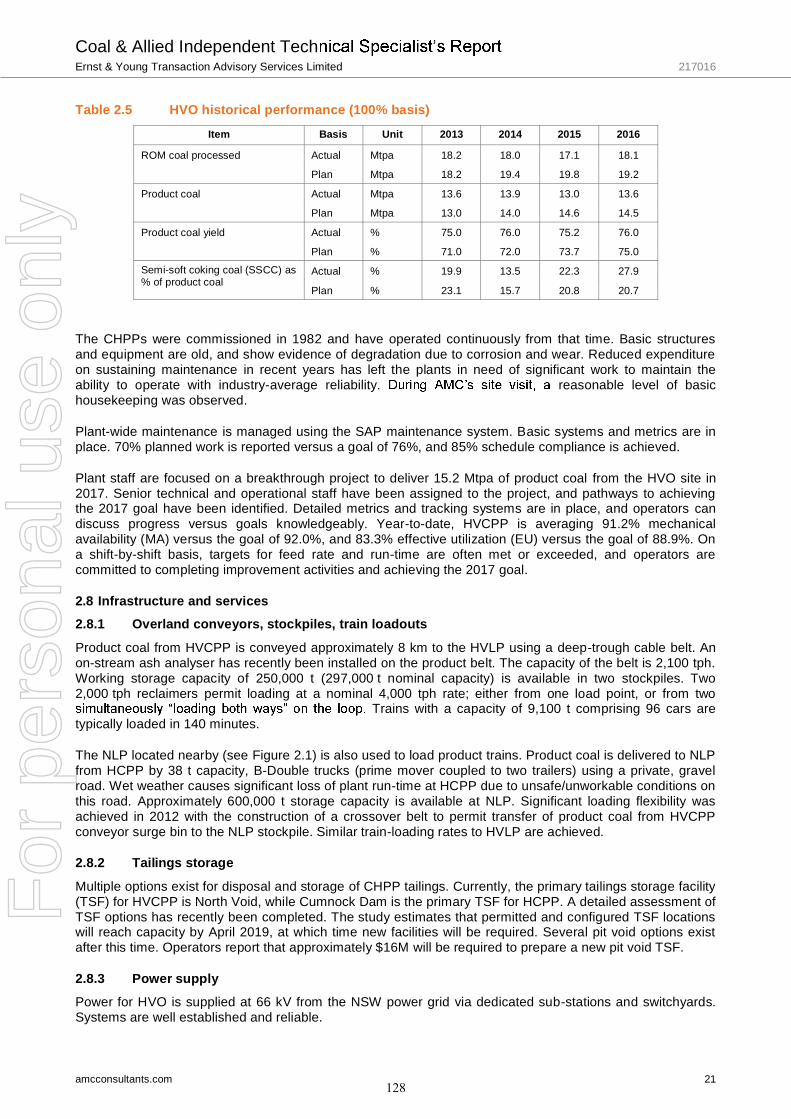
Coal & Allied Independent TechErnst & Young Transaction Advisory Services Limited 217016
amcconsultants.com 21
Table 2.5 HVO historical performance (100% basis)
Item Basis Unit 2013 2014 2015 2016
ROM coal processed Actual Mtpa 18.2 18.0 17.1 18.1
Plan Mtpa 18.2 19.4 19.8 19.2
Product coal Actual Mtpa 13.6 13.9 13.0 13.6
Plan Mtpa 13.0 14.0 14.6 14.5
Product coal yield Actual % 75.0 76.0 75.2 76.0
Plan % 71.0 72.0 73.7 75.0
Semi-soft coking coal (SSCC) as% of product coal
Actual % 19.9 13.5 22.3 27.9
Plan % 23.1 15.7 20.8 20.7
The CHPPs were commissioned in 1982 and have operated continuously from that time. Basic structuresand equipment are old, and show evidence of degradation due to corrosion and wear. Reduced expenditureon sustaining maintenance in recent years has left the plants in need of significant work to maintain theability to operate with industry-average reliability. reasonable level of basichousekeeping was observed.
Plant-wide maintenance is managed using the SAP maintenance system. Basic systems and metrics are inplace. 70% planned work is reported versus a goal of 76%, and 85% schedule compliance is achieved.
Plant staff are focused on a breakthrough project to deliver 15.2 Mtpa of product coal from the HVO site in2017. Senior technical and operational staff have been assigned to the project, and pathways to achievingthe 2017 goal have been identified. Detailed metrics and tracking systems are in place, and operators candiscuss progress versus goals knowledgeably. Year-to-date, HVCPP is averaging 91.2% mechanicalavailability (MA) versus the goal of 92.0%, and 83.3% effective utilization (EU) versus the goal of 88.9%. Ona shift-by-shift basis, targets for feed rate and run-time are often met or exceeded, and operators arecommitted to completing improvement activities and achieving the 2017 goal.
Infrastructure and services2.82.8.1 Overland conveyors, stockpiles, train loadouts
Product coal from HVCPP is conveyed approximately 8 km to the HVLP using a deep-trough cable belt. Anon-stream ash analyser has recently been installed on the product belt. The capacity of the belt is 2,100 tph.Working storage capacity of 250,000 t (297,000 t nominal capacity) is available in two stockpiles. Two2,000 tph reclaimers permit loading at a nominal 4,000 tph rate; either from one load point, or from two
Trains with a capacity of 9,100 t comprising 96 cars aretypically loaded in 140 minutes.
The NLP located nearby (see Figure 2.1) is also used to load product trains. Product coal is delivered to NLPfrom HCPP by 38 t capacity, B-Double trucks (prime mover coupled to two trailers) using a private, gravelroad. Wet weather causes significant loss of plant run-time at HCPP due to unsafe/unworkable conditions onthis road. Approximately 600,000 t storage capacity is available at NLP. Significant loading flexibility wasachieved in 2012 with the construction of a crossover belt to permit transfer of product coal from HVCPPconveyor surge bin to the NLP stockpile. Similar train-loading rates to HVLP are achieved.
2.8.2 Tailings storage
Multiple options exist for disposal and storage of CHPP tailings. Currently, the primary tailings storage facility(TSF) for HVCPP is North Void, while Cumnock Dam is the primary TSF for HCPP. A detailed assessment ofTSF options has recently been completed. The study estimates that permitted and configured TSF locationswill reach capacity by April 2019, at which time new facilities will be required. Several pit void options existafter this time. Operators report that approximately $16M will be required to prepare a new pit void TSF.
2.8.3 Power supplyPower for HVO is supplied at 66 kV from the NSW power grid via dedicated sub-stations and switchyards.Systems are well established and reliable.
128
For
per
sona
l use
onl
y
Ernst & Young Transaction Advisory Services Limited 217016
amcconsultants.com 22
2.8.4 Water supplyWater can be supplied to the HVO site from three sources; surplus mine water collected in mining pits,surface catchment, and permitted pumping from the Hunter River. In general, HVO operates as a zero-discharge facility, although water can be discharged to the Hunter River system under high-rainfall conditionswhen sufficient diluting flow is running in the river. Sufficient water is available under most conditions,primarily due to the large available catchment area, and the availability of multiple locations to dam and holdwater during periods of high rainfall.
Systems have recently been installed to pump water to MTW where the water supply is less abundant.
HVO operates standard mine-site water systems; with potable, clean, and plant water systems segregated.Potable water is supplied to the site by truck. Fresh irrigation water for rehabilitated lands is supplied usingan agricultural licence issued by NSW Office of Water.
2.8.5 LogisticsSupplies are brought to the HVO site by road. All logistic services are well developed and reliable. HVO isless than 100 km from Newcastle (a major coastal port and reliable source of international supply) using theNew England Highway, and is approximately 25 km from the significant regional centres of Singleton andMuswellbrook. In addition, major vendors of mine-related equipment maintain workshops and service centresin the Mount Thorley Warkworth Industrial Estate located at the MTW mine entrance on the Golden Highway.All interconnections feature good quality sealed roads.
Product coal is sold for export, and is delivered by rail to Newcastle.
Operating costs2.9C&A provided operating and capital cost estimates for its HVO operations aligned to the HVO 16Q3 LOMPlan (C&A cost model). AMC reviewed the operating cost estimates in the 16Q3 LOM Plan and the costmodel, and observationsfrom its site visit. Detailed operating estimates are made on site for 2017-2021 for the 5-year plan, whichforms the first five years of the 16Q3 LOM Plan, and long term planning estimates are used for the remainderof the plan. C&A has estimated operating costs for mining, coal processing, site administration, andcorporate overheads. In general, AMC considers that operating costs are appropriate for an operation of thissize and complexity.
However, AMC notes that C&A has had a programme of cost reductions over the last three years, which
with similar cost reduction programmes is that not all cost reductions are sustainable, and may lead toproduction reduction or inefficiency that is not always obvious at the time. Thus, some costs may need to bereintroduced to maintain operational efficiency and production levels.
No change to operating cost estimates provided by C&A was made to the Base and High Production Cases,with the following change made to the Low Production Cases:
$0.25/ROM coal tonne is added to the variable site administration cost for the Low Production Cases.
Capital costs2.10AMC reviewed the capital expenditure estimates provided by C&A for its operations in the 16Q3 LOM Planand C&A cost models, and has compared capital estimates with AMC benchmarks and experience with othersites. Detailed capital expenditure estimates are made on site for 2017-2021 for the 5-year plan, which formsthe first five years of the 16Q3 LOM Plan, and long term planning estimates are used for the remainder of theplan. C&A has allowed capital for environmental infrastructure, health and safety initiatives, mobileequipment additions and replacements, shovel and dragline rebuilds and shutdowns, mining sustainingcapital, CHPP sustaining capital, and land purchases and offsets.
AMC notes from discussions with C&A staff that capital has been constrained over the last few years andthat the 15Q3 LOM Plan (not the most recent LOM plan, but the most detailed LOM documentation availableat the time of the review) notes that major capital items were pushed out beyond the initial five-year period.Although in general, AMC considers that capital costs are appropriate for an operation of this size andcomplexity, AMC considers that some capital allocations may need to be brought forward.
129
For
per
sona
l use
onl
y
Ernst & Young Transaction Advisory Services Limited 217016
amcconsultants.com 23
Fixed infrastructure sustaining capitalAMC considers that sustaining capital for fixed infrastructure should be in the range of 0.5% to 1.0% of theinstalled cost of the infrastructure. For ageing infrastructure, such as HVO, AMC expects that that thesustaining capital spend would be at the upper end of the range. Sustaining capital for fixed infrastructure
considered that the capital included by C&A in the 16Q3 LOM Plan is adequate.
Mobile equipment replacementAMC considers sustaining capital for mobile equipment replacement should be 5% to 8% of the initial capitalcost of the mobile equipment fleet. For an older mobile equipment fleet, such as HVO, AMC expects that thesustaining capital expenditure would be at the upper end of the range. AMC reviewed the capital in the firstfive years of the 16Q3 LOM Planexpected range, but weighted heavily towards the final year of the 5-year plan.
AMC considers digger productivity used to forecast annual production in 16Q3 LOM Plan is optimistic andwill tend to overestimate the amount each digger can contribute to production, and therefore underestimatethe capital expenditure required to achieve the 16Q3 LOM Plan production targets.
For all cases, AMC considers that $10M per annum of replacement capital should be brought forward from2022 to maintain fleet capability. For HVO Base Production Case and HVO High Production Case,which assume that production levels will ramp up to the levels of the 16Q3 LOM Plan, AMC considers that$15M over two years should be included to increase mobile equipment output. For HVO LowProduction Case, which assumes lower production levels, AMC considers that $10M over two years shouldbe included to achieve the scheduled mobile equipment output.
LandC&A has allowed significant capital for land purchases, levees, and associated infrastructure for thecommencement of Southern pit, Auckland South pit (both within the Coal Reserve), and Auckland pit. For theHVO Base Production Case, AMC has excluded capital for Auckland pit. For the HVO Low Production Case,AMC has excluded capital for Southern, Auckland South, and Auckland pits.
Environmental and mine closure costs2.112.11.1 Annual health, safety, environmental and community costs
Annual HSEC costs are rolled up in the general and administrative cost lines of the economic modelsprovided to AMC. C&A advised that environmental expenditure at each site varied from year to year,depending on expenditure on special projects or unforeseen actions and activities. C&A advised thatrecurrent environmental expenditure (excluding progressive rehabilitation) for HVO and MTW combined wasapproximately $3M to $5M per annum.
2.11.2 Progressive rehabilitation costsThe 2015 Hunter Valley Operations Annual Environmental Monitoring Report indicates that 129.6 ha of landrehabilitation was completed in 2015. LOM plans indicate planned land disturbances of approximately 100ha per annum, varying from year to year. AMC anticipates that total land disturbance will generally reach a
Actual rehabilitation costs were not provided to AMC. Published costs (from various Australian stategovernments) for rehabilitation of mined land vary from approximately $30,000/ha to $136,000/ha. The largerange accounts for the condition of the land at the start of rehabilitation and the requirement for specialtreatments, such as engineered multi-layered capping for potential acid generating materials. For the
his equates to a rehabilitation cost range of $3.9M to $17.6M for 2015. Annualprogressive rehabilitation costs are shown in the C&A cost model as ranging from $1M to $17M, andaveraging approximately $13M. AMC considers the progressive rehabilitation cost allowances in the C&Acost model to be reasonable.
130
For
per
sona
l use
onl
y

Ernst & Young Transaction Advisory Services Limited 217016
amcconsultants.com 24
2.11.3 Environmental bondsCopies of the rehabilitation cost calculation tool spreadsheets for Rio Tinto Coal were provided to AMC. Theestimates for Hunter Valley Operations were:
HVO North 2016 rehabilitation cost calculation = $93M.HVO South 2016 rehabilitation cost calculation = $49M.HVO Total 2016 rehabilitation cost calculation = $142M.
Total bank guarantees for HVO summed to $143M.
The 2015 Hunter Valley Operations Annual Environmental Monitoring Report indicates that the total area of
2.11.4 Mine closure costs
Rio Tinto Coal prepared a mine closure plan for the Hunter Valley Operations, dated 22 May 2015. Theclosure plan identifies that the total projected cost of closure as at 2014 was $168M.
The closure cost estimates include:Infrastructure decommissioning and demolition.Environmental rehabilitation.Human resources and employee costs.Post closure monitoring.Closure support facilities.Closure management (contractor) services.Owner s costs such as property rates and land costs.A contingency based on residual risks for key line items in the estimate.Offset requirements are already fully met or self-funded.
AMC reviewed the closure cost estimates in comparison to the rehabilitation cost estimates prepared for theenvironmental bonds and noted the following:
Some estimates were slightly higher in the rehabilitation cost estimates.Some items that were includedemployee costs) were not included in the rehabilitation cost estimates.
In preparing the HVO Production Cases,human resources costs and corrected an error in the rehabilitation cost estimate.
mine closure cost estimate for HVO is $224M.
HVO Production Cases2.12AMC has developed the three HVO Production Cases, to assist EYTAS in the preparation of its IER inrelation to the Proposed Transaction. Each HVO Production Case has been prepared by adjusting the 16Q3LOM Plan. The 16Q3 LOM Plan extends for 64 years at the current production rates and is based on CoalReserves plus the expectation other coal, not yet in Coal Reserves, will be mined.
AMC notes that detailed knowledge of the HVO coal deposits exists, based on an extensive drilling databasecontaining more than 4,700 drillholes, and historical operations dating back to 1949. The HVO footprintcontains a reported Coal Reserve of 871 Mt, plus substantial quantities of coal not currently classified asCoal Reserve.
AMC considers the key risk to the continuation of operations, as planned, is the need to mine some coal fromcurrently unapproved lease areas. To reflect this risk, AMC adjusted the total quantity of material mined overthe mine life, the annual production rates, and the capital and operating cost estimates.
131
For
per
sona
l use
onl
y
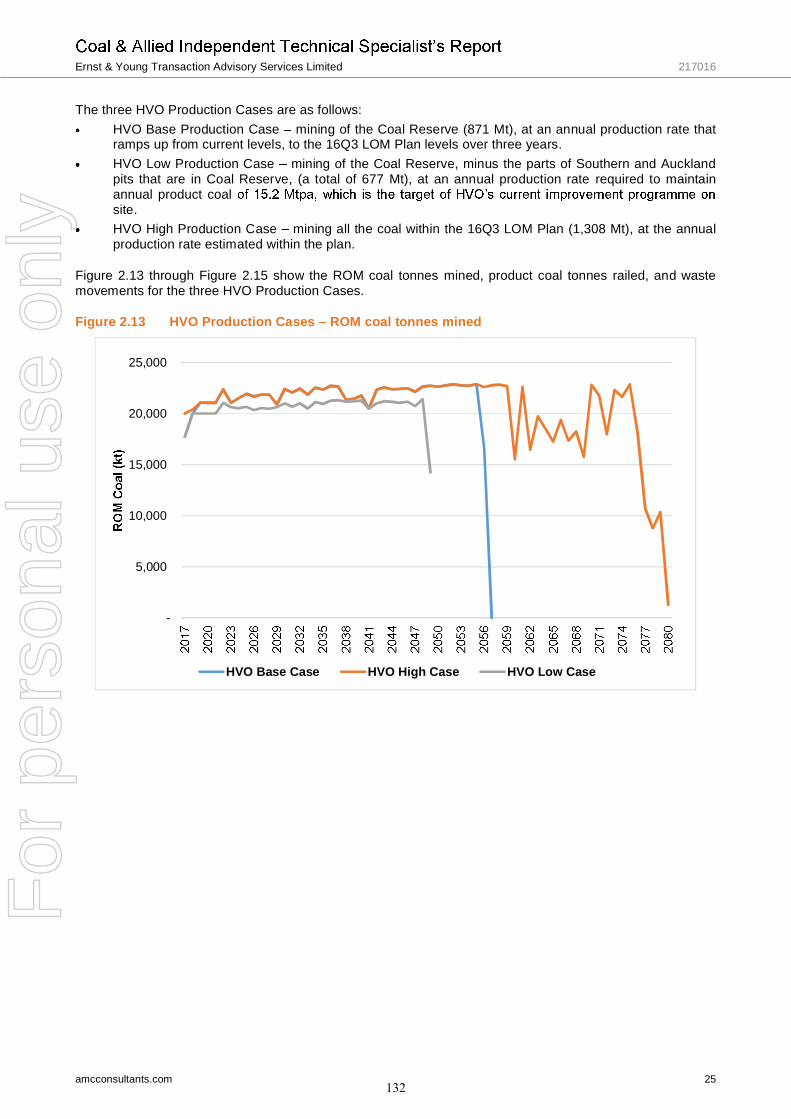
Ernst & Young Transaction Advisory Services Limited 217016
amcconsultants.com 25
The three HVO Production Cases are as follows:HVO Base Production Case mining of the Coal Reserve (871 Mt), at an annual production rate thatramps up from current levels, to the 16Q3 LOM Plan levels over three years.HVO Low Production Case mining of the Coal Reserve, minus the parts of Southern and Aucklandpits that are in Coal Reserve, (a total of 677 Mt), at an annual production rate required to maintainannual product coalsite.HVO High Production Case mining all the coal within the 16Q3 LOM Plan (1,308 Mt), at the annualproduction rate estimated within the plan.
Figure 2.13 through Figure 2.15 show the ROM coal tonnes mined, product coal tonnes railed, and wastemovements for the three HVO Production Cases.
Figure 2.13 HVO Production Cases ROM coal tonnes mined
-
5,000
10,000
15,000
20,000
25,000
HVO Base Case HVO High Case HVO Low Case
132
For
per
sona
l use
onl
y
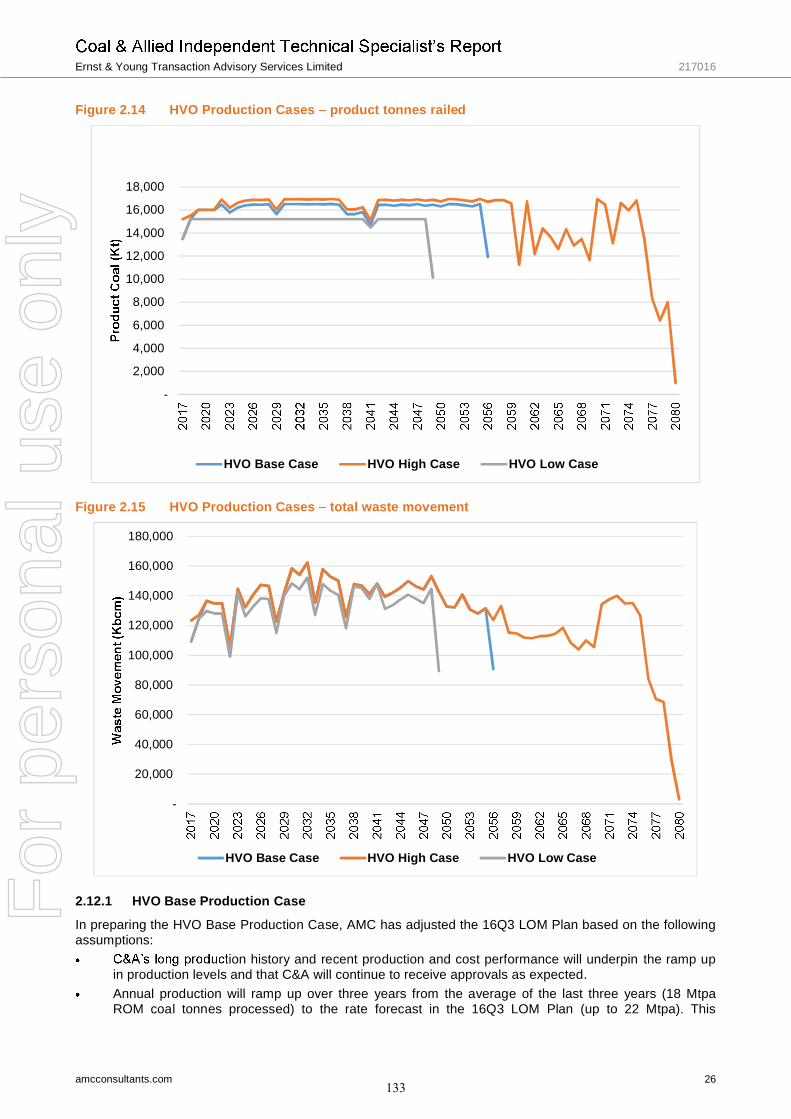
Ernst & Young Transaction Advisory Services Limited 217016
amcconsultants.com 26
Figure 2.14 HVO Production Cases product tonnes railed
Figure 2.15 HVO Production Cases total waste movement
2.12.1 HVO Base Production Case
In preparing the HVO Base Production Case, AMC has adjusted the 16Q3 LOM Plan based on the followingassumptions:
ion history and recent production and cost performance will underpin the ramp upin production levels and that C&A will continue to receive approvals as expected.Annual production will ramp up over three years from the average of the last three years (18 MtpaROM coal tonnes processed) to the rate forecast in the 16Q3 LOM Plan (up to 22 Mtpa). This
-
2,000
4,000
6,000
8,000
10,000
12,000
14,000
16,000
18,000
HVO Base Case HVO High Case HVO Low Case
-
20,000
40,000
60,000
80,000
100,000
120,000
140,000
160,000
180,000
HVO Base Case HVO High Case HVO Low Case
133
For
per
sona
l use
onl
y
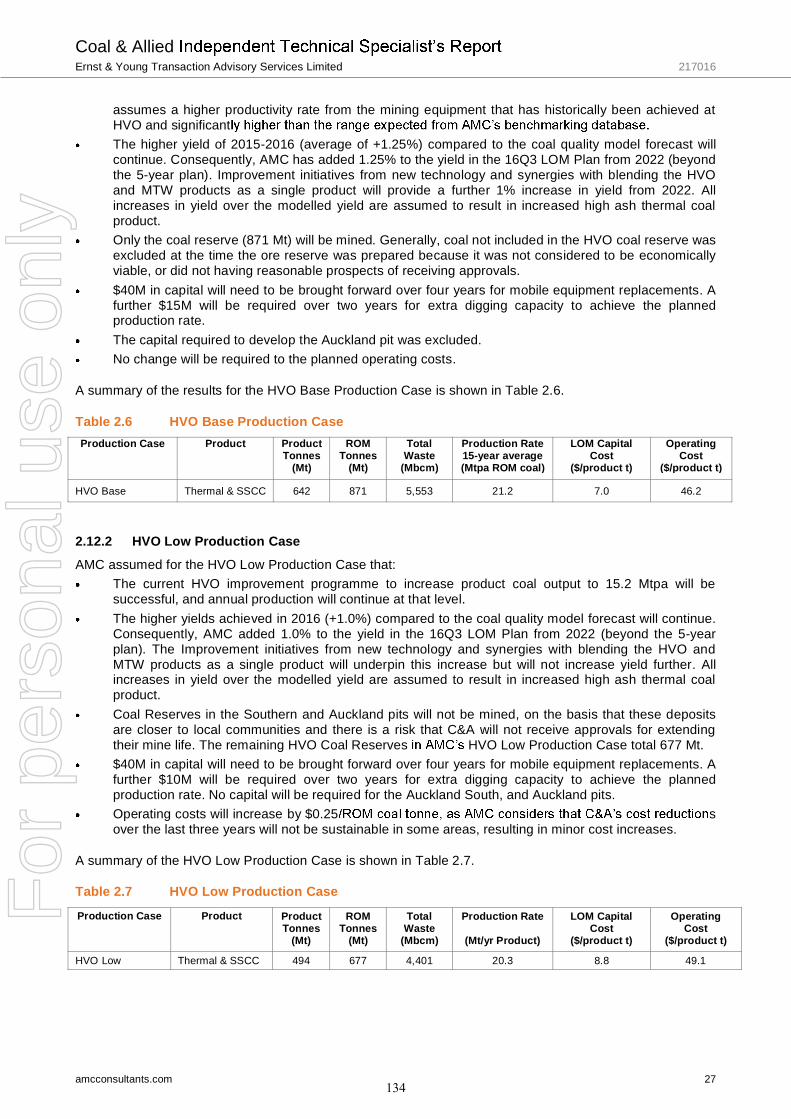
Coal & AlliedErnst & Young Transaction Advisory Services Limited 217016
amcconsultants.com 27
assumes a higher productivity rate from the mining equipment that has historically been achieved atHVO and significantThe higher yield of 2015-2016 (average of +1.25%) compared to the coal quality model forecast willcontinue. Consequently, AMC has added 1.25% to the yield in the 16Q3 LOM Plan from 2022 (beyondthe 5-year plan). Improvement initiatives from new technology and synergies with blending the HVOand MTW products as a single product will provide a further 1% increase in yield from 2022. Allincreases in yield over the modelled yield are assumed to result in increased high ash thermal coalproduct.Only the coal reserve (871 Mt) will be mined. Generally, coal not included in the HVO coal reserve wasexcluded at the time the ore reserve was prepared because it was not considered to be economicallyviable, or did not having reasonable prospects of receiving approvals.$40M in capital will need to be brought forward over four years for mobile equipment replacements. Afurther $15M will be required over two years for extra digging capacity to achieve the plannedproduction rate.The capital required to develop the Auckland pit was excluded.No change will be required to the planned operating costs.
A summary of the results for the HVO Base Production Case is shown in Table 2.6.
Table 2.6 HVO Base Production CaseProduction Case Product Product
Tonnes(Mt)
ROMTonnes
(Mt)
TotalWaste
(Mbcm)
Production Rate15-year average(Mtpa ROM coal)
LOM CapitalCost
($/product t)
OperatingCost
($/product t)
HVO Base Thermal & SSCC 642 871 5,553 21.2 7.0 46.2
2.12.2 HVO Low Production CaseAMC assumed for the HVO Low Production Case that:
The current HVO improvement programme to increase product coal output to 15.2 Mtpa will besuccessful, and annual production will continue at that level.The higher yields achieved in 2016 (+1.0%) compared to the coal quality model forecast will continue.Consequently, AMC added 1.0% to the yield in the 16Q3 LOM Plan from 2022 (beyond the 5-yearplan). The Improvement initiatives from new technology and synergies with blending the HVO andMTW products as a single product will underpin this increase but will not increase yield further. Allincreases in yield over the modelled yield are assumed to result in increased high ash thermal coalproduct.Coal Reserves in the Southern and Auckland pits will not be mined, on the basis that these depositsare closer to local communities and there is a risk that C&A will not receive approvals for extendingtheir mine life. The remaining HVO Coal Reserves HVO Low Production Case total 677 Mt.$40M in capital will need to be brought forward over four years for mobile equipment replacements. Afurther $10M will be required over two years for extra digging capacity to achieve the plannedproduction rate. No capital will be required for the Auckland South, and Auckland pits.Operating costs will increase by $0.25 sover the last three years will not be sustainable in some areas, resulting in minor cost increases.
A summary of the HVO Low Production Case is shown in Table 2.7.
Table 2.7 HVO Low Production Case
Production Case Product ProductTonnes
(Mt)
ROMTonnes
(Mt)
TotalWaste
(Mbcm)
Production Rate
(Mt/yr Product)
LOM CapitalCost
($/product t)
OperatingCost
($/product t)
HVO Low Thermal & SSCC 494 677 4,401 20.3 8.8 49.1
134
For
per
sona
l use
onl
y
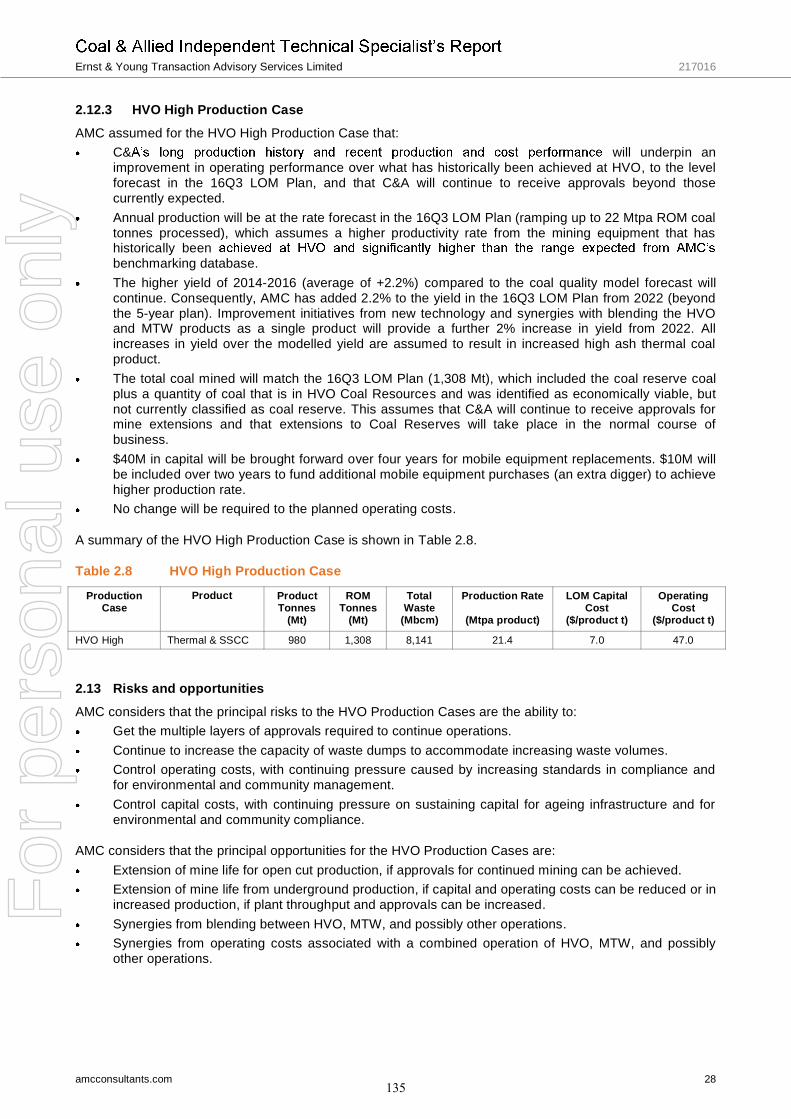
Ernst & Young Transaction Advisory Services Limited 217016
amcconsultants.com 28
2.12.3 HVO High Production CaseAMC assumed for the HVO High Production Case that:
C& will underpin animprovement in operating performance over what has historically been achieved at HVO, to the levelforecast in the 16Q3 LOM Plan, and that C&A will continue to receive approvals beyond thosecurrently expected.Annual production will be at the rate forecast in the 16Q3 LOM Plan (ramping up to 22 Mtpa ROM coaltonnes processed), which assumes a higher productivity rate from the mining equipment that hashistorically beenbenchmarking database.The higher yield of 2014-2016 (average of +2.2%) compared to the coal quality model forecast willcontinue. Consequently, AMC has added 2.2% to the yield in the 16Q3 LOM Plan from 2022 (beyondthe 5-year plan). Improvement initiatives from new technology and synergies with blending the HVOand MTW products as a single product will provide a further 2% increase in yield from 2022. Allincreases in yield over the modelled yield are assumed to result in increased high ash thermal coalproduct.The total coal mined will match the 16Q3 LOM Plan (1,308 Mt), which included the coal reserve coalplus a quantity of coal that is in HVO Coal Resources and was identified as economically viable, butnot currently classified as coal reserve. This assumes that C&A will continue to receive approvals formine extensions and that extensions to Coal Reserves will take place in the normal course ofbusiness.$40M in capital will be brought forward over four years for mobile equipment replacements. $10M willbe included over two years to fund additional mobile equipment purchases (an extra digger) to achievehigher production rate.No change will be required to the planned operating costs.
A summary of the HVO High Production Case is shown in Table 2.8.
Table 2.8 HVO High Production Case
ProductionCase
Product ProductTonnes
(Mt)
ROMTonnes
(Mt)
TotalWaste
(Mbcm)
Production Rate
(Mtpa product)
LOM CapitalCost
($/product t)
OperatingCost
($/product t)
HVO High Thermal & SSCC 980 1,308 8,141 21.4 7.0 47.0
Risks and opportunities2.13AMC considers that the principal risks to the HVO Production Cases are the ability to:
Get the multiple layers of approvals required to continue operations.Continue to increase the capacity of waste dumps to accommodate increasing waste volumes.Control operating costs, with continuing pressure caused by increasing standards in compliance andfor environmental and community management.Control capital costs, with continuing pressure on sustaining capital for ageing infrastructure and forenvironmental and community compliance.
AMC considers that the principal opportunities for the HVO Production Cases are:Extension of mine life for open cut production, if approvals for continued mining can be achieved.Extension of mine life from underground production, if capital and operating costs can be reduced or inincreased production, if plant throughput and approvals can be increased.Synergies from blending between HVO, MTW, and possibly other operations.Synergies from operating costs associated with a combined operation of HVO, MTW, and possiblyother operations.
135
For
per
sona
l use
onl
y
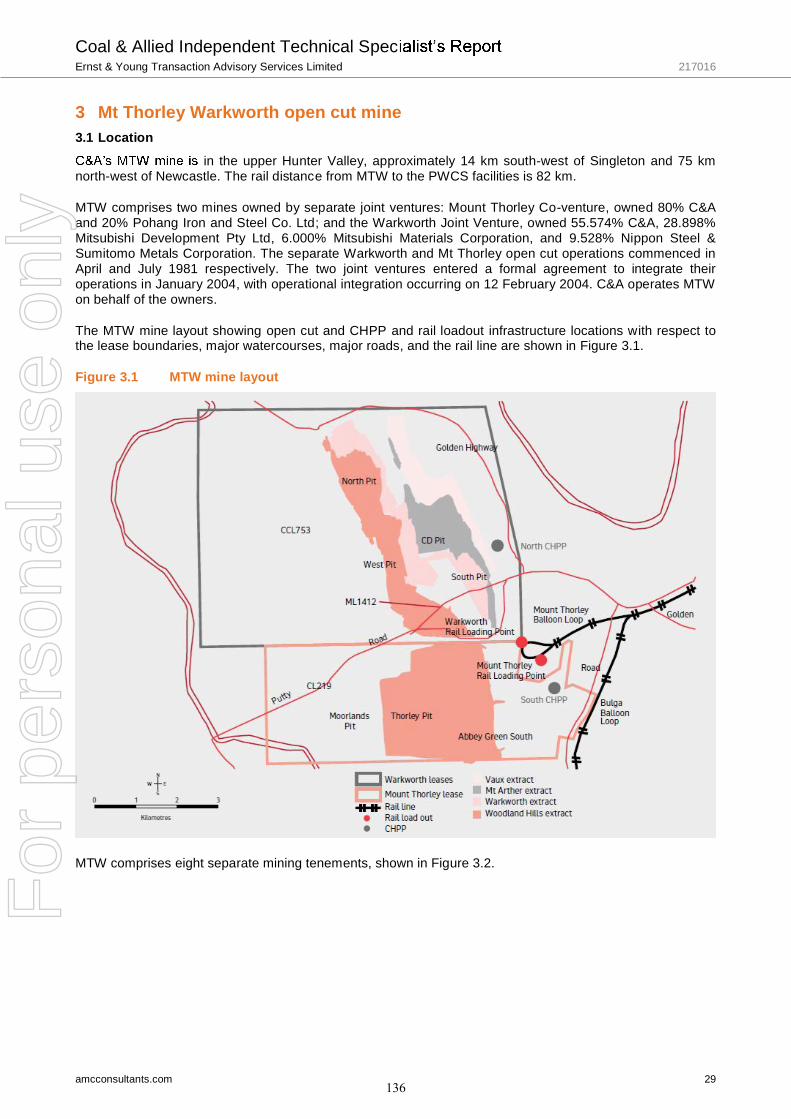
Coal & Allied Independent Technical SpecErnst & Young Transaction Advisory Services Limited 217016
amcconsultants.com 29
3 Mt Thorley Warkworth open cut mine Location3.1
in the upper Hunter Valley, approximately 14 km south-west of Singleton and 75 kmnorth-west of Newcastle. The rail distance from MTW to the PWCS facilities is 82 km.
MTW comprises two mines owned by separate joint ventures: Mount Thorley Co-venture, owned 80% C&Aand 20% Pohang Iron and Steel Co. Ltd; and the Warkworth Joint Venture, owned 55.574% C&A, 28.898%Mitsubishi Development Pty Ltd, 6.000% Mitsubishi Materials Corporation, and 9.528% Nippon Steel &Sumitomo Metals Corporation. The separate Warkworth and Mt Thorley open cut operations commenced inApril and July 1981 respectively. The two joint ventures entered a formal agreement to integrate theiroperations in January 2004, with operational integration occurring on 12 February 2004. C&A operates MTWon behalf of the owners.
The MTW mine layout showing open cut and CHPP and rail loadout infrastructure locations with respect tothe lease boundaries, major watercourses, major roads, and the rail line are shown in Figure 3.1.
Figure 3.1 MTW mine layout
MTW comprises eight separate mining tenements, shown in Figure 3.2.
136
For
per
sona
l use
onl
y
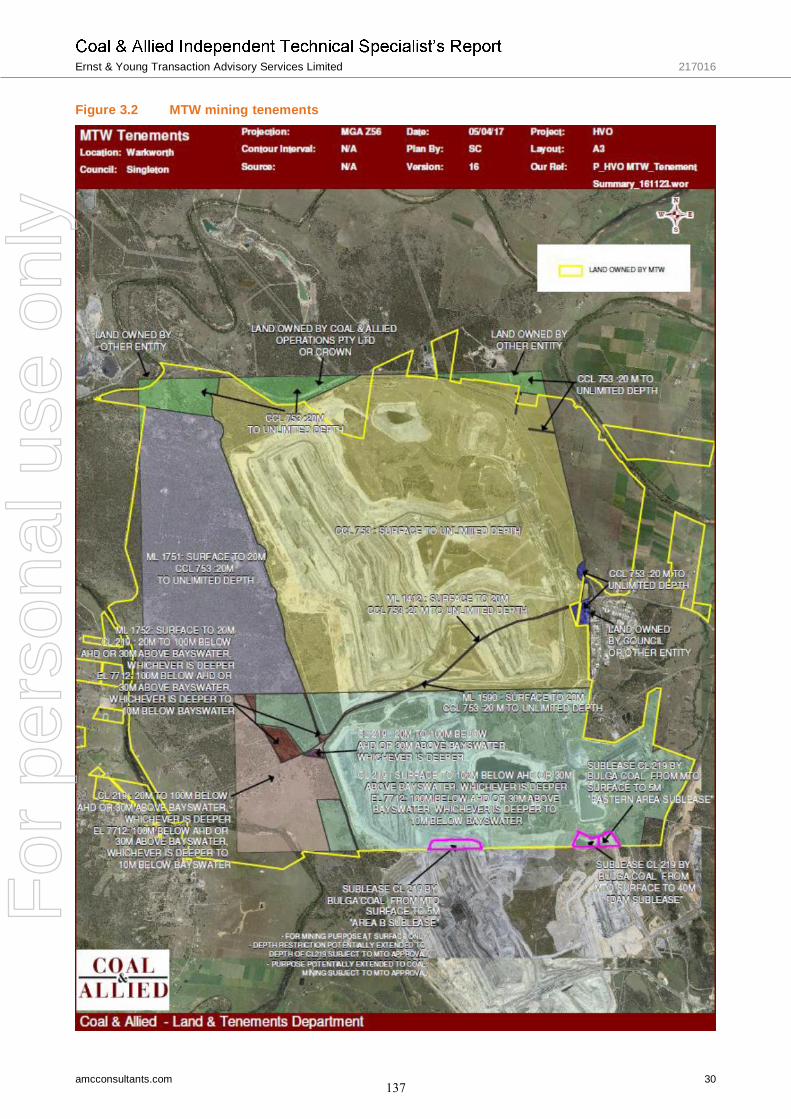
Ernst & Young Transaction Advisory Services Limited 217016
amcconsultants.com 30
Figure 3.2 MTW mining tenements
137
For
per
sona
l use
onl
y
Ernst & Young Transaction Advisory Services Limited 217016
amcconsultants.com 31
While Mt Thorley (in the south) and Warkworth (in the north) each have separate approvals, MTW ismanaged as an integrated operation, with coal, coarse and fine reject, overburden, topsoil, mobileequipment, materials, and personnel moved between the two areas. The Putty Road, the main link betweenSingleton and Windsor/Richmond, separates the two mining areas.
MTW mining operations comprises the Thorley pit, the West pit and the North pit. There are two separateCHPPs: one within the Mt Thorley leases (the South Plant) and one within the Warkworth leases (the NorthPlant). All coal is railed from the Mt Thorley rail loop.
ROM coal mined from both leases is processed through the CHPPs to produce SSCC and low, medium andhigh ash thermal coal for the export market. Product coal is railed through the Hunter Valley rail network tothe PWCS and NCIG coal loading terminals.
Geology and mineralization3.23.2.1 Regional and local geologyMTW adjoins the southern boundary of the HVO leases and the mines share a common geological setting. Adiscussion on regional and local geology is provided in Section 2.2.
The MTW deposit extends 8 km north-west, 8.5 km in width, and to a depth of 460 m. Only minor faultingoccurs with minor intrusions at depth. Geologists in the pit check the areas being mined and material beingsent to the ROM or waste as a means of grade control.
Coal Resources3.3
On the 24 January 2017, Rio Tinto announced an increase of 208 Mt in the MTW Coal Resources (exclusiveof Coal Reserves), as at 31 December 2016 (MTW Coal Resources) as shown in Table 3.1 are classifiedand reported in accordance with the guidelines of the JORC Code. Rio Tinto reports Coal Resources on a100% basis, exclusive of Coal Reserves, and on an in situ moisture basis.
Table 3.1 MTW Coal Resources as at December 2016
Type Measured(Mt)
Indicated(Mt)
Inferred(Mt)
Total(Mt)
MTO (open cut) 39 226 57 322Warkworth (open cut and underground) 141 307 517 966Open-cut and underground (thermal and SSCC) 180 533 574 1,288
Note:released on 2 March 2017. The Competent Person responsible for that previous reporting was R Ruddock(MAusIMM). Rio Tinto has advised that it is not aware of any new information or data that materially affects theseCoal Resource estimates, and has confirmed that all material assumptions and technical parameters underpinningthe estimates continue to apply and have not materially changed. The form and context in which the CompetentP findings are presented have not been materially modified.
AMC notes that the MTW Coal Resources are based on recently updated geological models, a new modelfor the Van sub-group coal seams, and reclassification using 2,670 drillholes. No additional drilling has beencarried out since the previous resource statement in 2015. All underground Coal Resources on the MtThorley lease have now been classified as open cut resources.
Coal seams were modelled using Minescape software, finite element modelling of the seam location andthickness, and coal quality estimation using an inverse distance squared method at a 1,000 m searchdistance. This is standard practice within the industry.
There are 20 coal seams that are modelled for long-term planning at the Rio Tinto Brisbane office. Updatingof the long-term model is carried out by site personnel on a 25 m grid for short term modelling at MTW. Anew coal quality model is currently being produced with updated information. A minimum of 0.25 m thickseam and a maximum of 50% ash is required for a seam to be included in the MTW Coal Resources.
Coal seam data is collected by both core and open holes with a stated 95% recovery of samples. Seamlocations and marker horizons are checked against down-hole geophysical logs. All coal assaying isconducted in accordance with the Australian Standards. Standardized Rio Tinto logging and samplingprocedures are employed at both mines.
138
For
per
sona
l use
onl
y
Ernst & Young Transaction Advisory Services Limited 217016
amcconsultants.com 32
The in situ relative density is calculated using the Preston and Sanders equation.
The MTW Coal Resources areobservation. The points of observation include structure and quality observed in the drillholes. AMCconsiders the classification to be appropriate for reporting of Coal Resources and, consequently, CoalReserves.
Drilling is generally based on a 250 m grid for core holes and 125 m grid for open holes and includes holesdrilled from 2004. MTW has permits to mine to 10 m below the Bayswater seam on the Mt Thorley leasesand to the Warkworth seam on the Warkworth leases.
Coal quality estimates used for mine production planning, are based on the average quality for coal minedfrom that seam. Individual coal seams are stacked on the ROM pad prior to batch processing through theCHPP.
A summary of the average seam qualities on an air-dried basis is listed in Table 3.2.
Table 3.2 MTW average seam qualities (air dried basis)
Seam Group(from top to bottom)
Ash(%)
RD(in situ)
SE(Mj/kg)
Total Sulphur(%)
CSN
Whybrow (WY) 29.9 1.5 23.0 0.5 0.8Redbank Creek (RC) 28.3 1.5 23.2 0.4 2.5Wambo (WB) 17.8 1.4 26.7 0.5 2.4Whynot (WN) 17.6 1.4 25.9 0.3 2.8Blakefield (BL) 26.3 1.5 24.1 0.3 3.1Glen Munro (GM) 20.2 1.4 26.7 0.3 2.9Woodlands Hill (WH) 22.4 1.4 25.5 0.3 3.0Arrowfield (AF) 23.8 1.4 26.0 0.3 3.0Bowfield (BF) 22.2 1.4 26.7 0.3 3.9Warkworth (WW) 27.0 1.5 24.8 0.3 3.0Mount Arthur (MA) 26.3 1.5 24.4 0.2 3.6Piecefield (PF) 15.6 1.4 28.9 0.3 7.4Vaux (VA) 19.7 1.4 27.2 0.4 4.9Broonie (BN) 21.3 1.4 27.0 0.4 4.2Bayswater (BW) 24.4 1.5 26.0 0.5 1.5
Discussions with site geologists indicated that recent reconciliation with the wash plant production has shownthat the existing coal quality model tends to over-estimate the amount of non-coal material. This model isbeing updated. Currently, coal quality selected during mining is based on the results of previous coal qualitydrilling results and not the coal quality model.
Based on the discussions with C&A geologists and results and data collected over many years of mining,AMC considers the process for estimating MTW Coal Resources as the basis for assessment of open cutmining are appropriate.
Coal Reserves3.4
Published total MTW Coal Reserves as at 31 December 2016 (MTW Coal Reserves), classified and reportedin accordance with the guidelines of the JORC Code are shown in Table 3.2. The MTW Coal Reserves havebeen prepared by depleting the December 2015 Coal Reserves estimate by the coal recovered during theintervening 12-month period (approximately 18 Mt).
139
For
per
sona
l use
onl
y
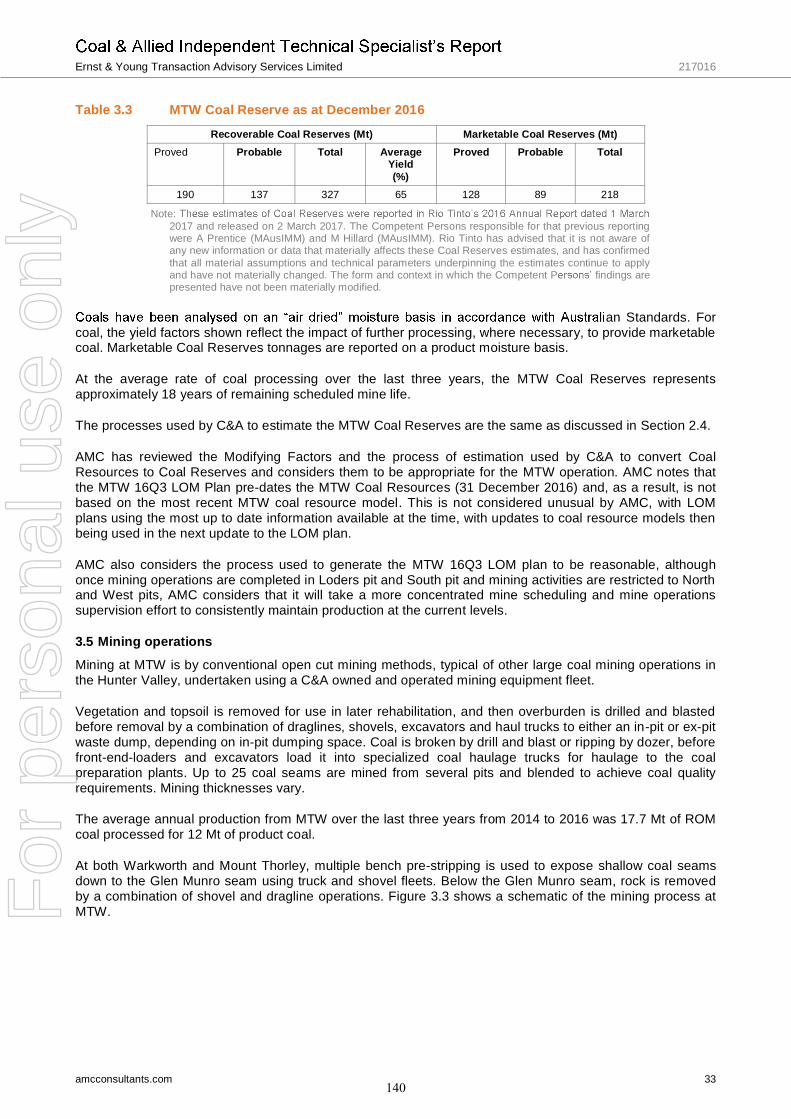
Ernst & Young Transaction Advisory Services Limited 217016
amcconsultants.com 33
Table 3.3 MTW Coal Reserve as at December 2016
Recoverable Coal Reserves (Mt) Marketable Coal Reserves (Mt)Proved Probable Total Average
Yield(%)
Proved Probable Total
190 137 327 65 128 89 218
Note:2017 and released on 2 March 2017. The Competent Persons responsible for that previous reportingwere A Prentice (MAusIMM) and M Hillard (MAusIMM). Rio Tinto has advised that it is not aware ofany new information or data that materially affects these Coal Reserves estimates, and has confirmedthat all material assumptions and technical parameters underpinning the estimates continue to applyand have not materially changed. The form and context in which the Competent P findings arepresented have not been materially modified.
an Standards. Forcoal, the yield factors shown reflect the impact of further processing, where necessary, to provide marketablecoal. Marketable Coal Reserves tonnages are reported on a product moisture basis.
At the average rate of coal processing over the last three years, the MTW Coal Reserves representsapproximately 18 years of remaining scheduled mine life.
The processes used by C&A to estimate the MTW Coal Reserves are the same as discussed in Section 2.4.
AMC has reviewed the Modifying Factors and the process of estimation used by C&A to convert CoalResources to Coal Reserves and considers them to be appropriate for the MTW operation. AMC notes thatthe MTW 16Q3 LOM Plan pre-dates the MTW Coal Resources (31 December 2016) and, as a result, is notbased on the most recent MTW coal resource model. This is not considered unusual by AMC, with LOMplans using the most up to date information available at the time, with updates to coal resource models thenbeing used in the next update to the LOM plan.
AMC also considers the process used to generate the MTW 16Q3 LOM plan to be reasonable, althoughonce mining operations are completed in Loders pit and South pit and mining activities are restricted to Northand West pits, AMC considers that it will take a more concentrated mine scheduling and mine operationssupervision effort to consistently maintain production at the current levels.
Mining operations3.5Mining at MTW is by conventional open cut mining methods, typical of other large coal mining operations inthe Hunter Valley, undertaken using a C&A owned and operated mining equipment fleet.
Vegetation and topsoil is removed for use in later rehabilitation, and then overburden is drilled and blastedbefore removal by a combination of draglines, shovels, excavators and haul trucks to either an in-pit or ex-pitwaste dump, depending on in-pit dumping space. Coal is broken by drill and blast or ripping by dozer, beforefront-end-loaders and excavators load it into specialized coal haulage trucks for haulage to the coalpreparation plants. Up to 25 coal seams are mined from several pits and blended to achieve coal qualityrequirements. Mining thicknesses vary.
The average annual production from MTW over the last three years from 2014 to 2016 was 17.7 Mt of ROMcoal processed for 12 Mt of product coal.
At both Warkworth and Mount Thorley, multiple bench pre-stripping is used to expose shallow coal seamsdown to the Glen Munro seam using truck and shovel fleets. Below the Glen Munro seam, rock is removedby a combination of shovel and dragline operations. Figure 3.3 shows a schematic of the mining process atMTW.
140
For
per
sona
l use
onl
y
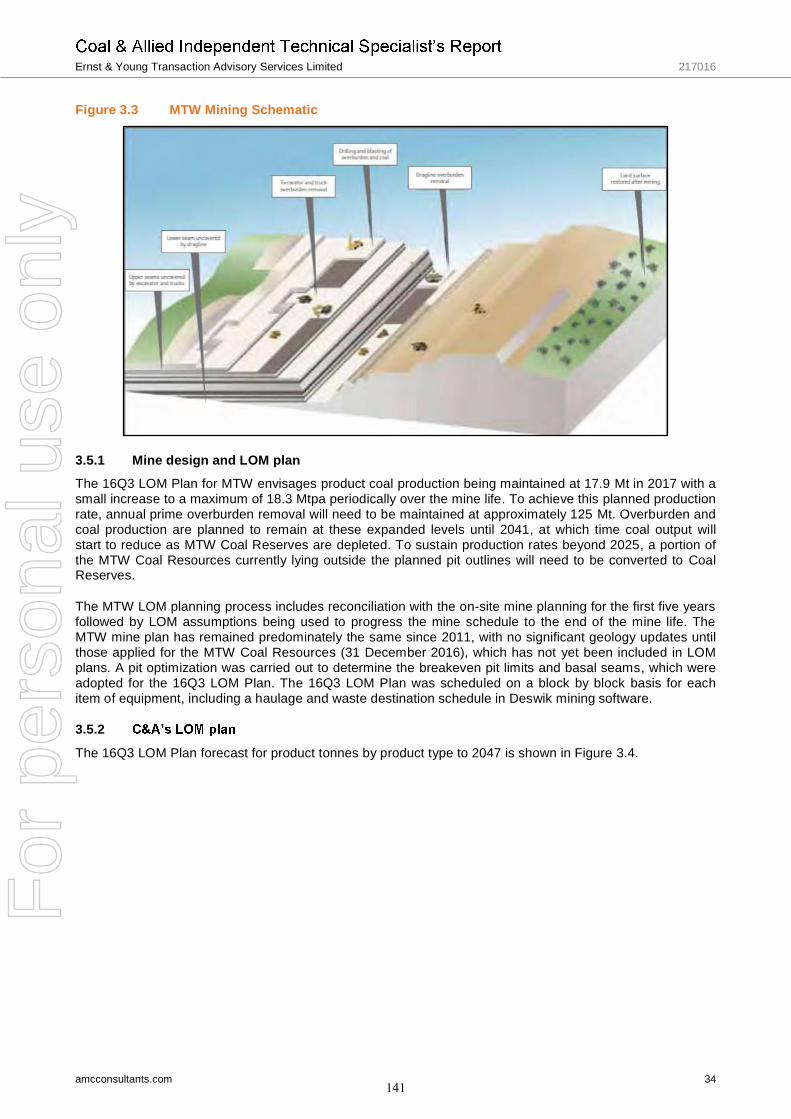
Ernst & Young Transaction Advisory Services Limited 217016
amcconsultants.com 34
Figure 3.3 MTW Mining Schematic
3.5.1 Mine design and LOM planThe 16Q3 LOM Plan for MTW envisages product coal production being maintained at 17.9 Mt in 2017 with asmall increase to a maximum of 18.3 Mtpa periodically over the mine life. To achieve this planned productionrate, annual prime overburden removal will need to be maintained at approximately 125 Mt. Overburden andcoal production are planned to remain at these expanded levels until 2041, at which time coal output willstart to reduce as MTW Coal Reserves are depleted. To sustain production rates beyond 2025, a portion ofthe MTW Coal Resources currently lying outside the planned pit outlines will need to be converted to CoalReserves.
The MTW LOM planning process includes reconciliation with the on-site mine planning for the first five yearsfollowed by LOM assumptions being used to progress the mine schedule to the end of the mine life. TheMTW mine plan has remained predominately the same since 2011, with no significant geology updates untilthose applied for the MTW Coal Resources (31 December 2016), which has not yet been included in LOMplans. A pit optimization was carried out to determine the breakeven pit limits and basal seams, which wereadopted for the 16Q3 LOM Plan. The 16Q3 LOM Plan was scheduled on a block by block basis for eachitem of equipment, including a haulage and waste destination schedule in Deswik mining software.
3.5.2
The 16Q3 LOM Plan forecast for product tonnes by product type to 2047 is shown in Figure 3.4.
141
For
per
sona
l use
onl
y
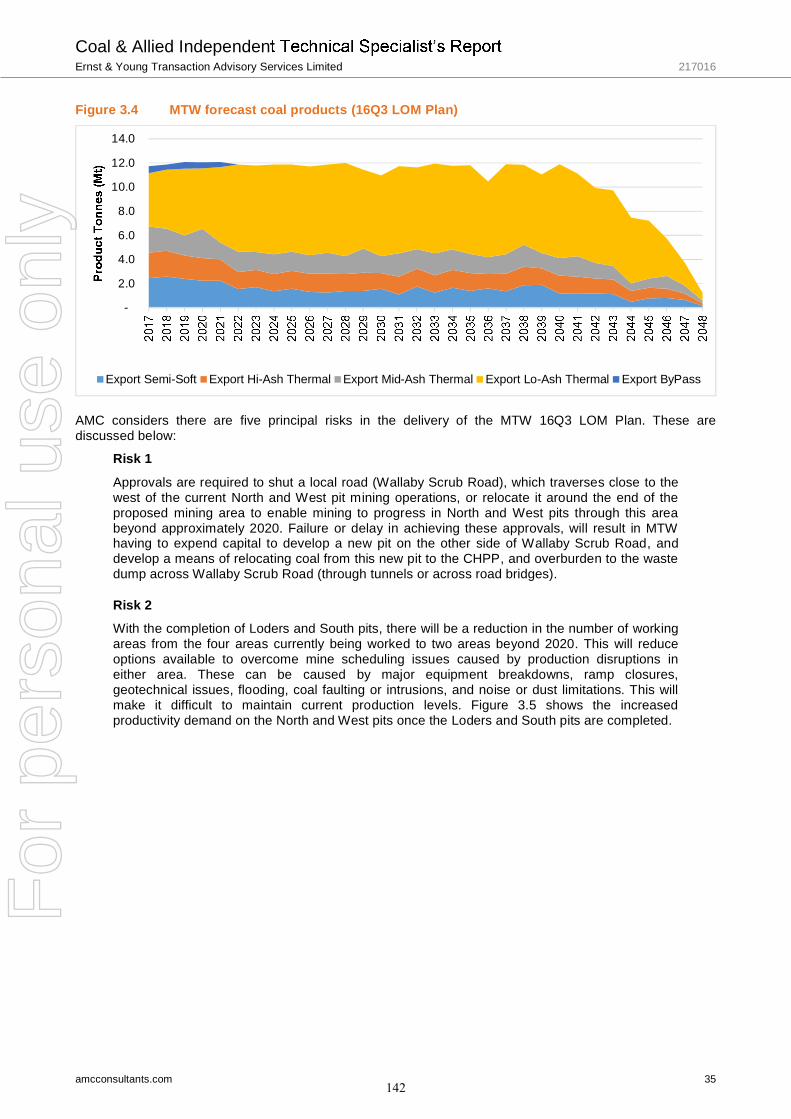
Coal & Allied IndependenErnst & Young Transaction Advisory Services Limited 217016
amcconsultants.com 35
Figure 3.4 MTW forecast coal products (16Q3 LOM Plan)
AMC considers there are five principal risks in the delivery of the MTW 16Q3 LOM Plan. These arediscussed below:
Risk 1
Approvals are required to shut a local road (Wallaby Scrub Road), which traverses close to thewest of the current North and West pit mining operations, or relocate it around the end of theproposed mining area to enable mining to progress in North and West pits through this areabeyond approximately 2020. Failure or delay in achieving these approvals, will result in MTWhaving to expend capital to develop a new pit on the other side of Wallaby Scrub Road, anddevelop a means of relocating coal from this new pit to the CHPP, and overburden to the wastedump across Wallaby Scrub Road (through tunnels or across road bridges).
Risk 2With the completion of Loders and South pits, there will be a reduction in the number of workingareas from the four areas currently being worked to two areas beyond 2020. This will reduceoptions available to overcome mine scheduling issues caused by production disruptions ineither area. These can be caused by major equipment breakdowns, ramp closures,geotechnical issues, flooding, coal faulting or intrusions, and noise or dust limitations. This willmake it difficult to maintain current production levels. Figure 3.5 shows the increasedproductivity demand on the North and West pits once the Loders and South pits are completed.
-
2.0
4.0
6.0
8.0
10.0
12.0
14.0
Export Semi-Soft Export Hi-Ash Thermal Export Mid-Ash Thermal Export Lo-Ash Thermal Export ByPass
142
For
per
sona
l use
onl
y

Ernst & Young Transaction Advisory Services Limited 217016
amcconsultants.com 36
Figure 3.5 MTW operating pit areas
Risk 3The 16Q3 LOM Plan assumes overburden equipment productivity rates will be higher than hasbeen achieved at MTW over the last three years. However, overall waste production has beenachieved. Figure 3.6 shows a comparison of the MTW excavator fleet average actual dig rateand the 16Q3 LOM Plan dig rate against AMC benchmark database. This stretch targetforecasting is consistent across all scheduled fleet in the 16Q3 LOM Plan. AMC considers thisforecast will be more difficult to achieve when the operation is reduced to two operating pits in2021.
Figure 3.6 Planned MTW excavator loading rates compared to historical and AMC benchmarkrates
143
For
per
sona
l use
onl
y
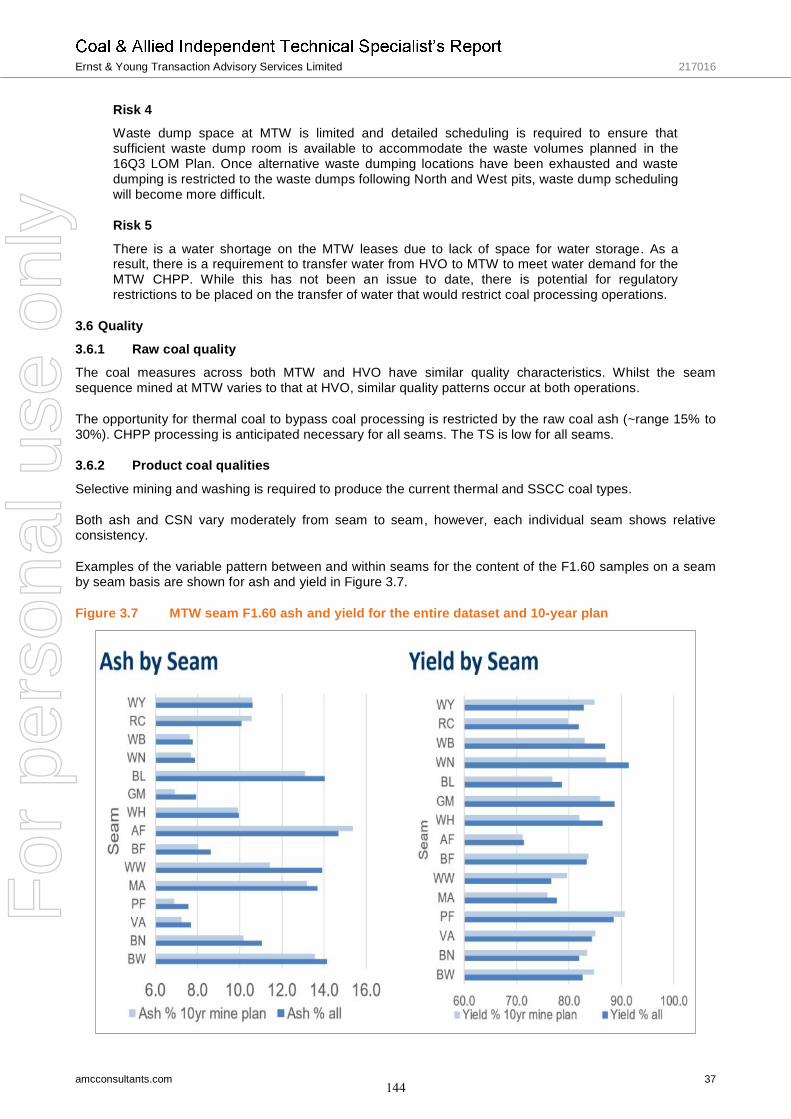
Ernst & Young Transaction Advisory Services Limited 217016
amcconsultants.com 37
Risk 4Waste dump space at MTW is limited and detailed scheduling is required to ensure thatsufficient waste dump room is available to accommodate the waste volumes planned in the16Q3 LOM Plan. Once alternative waste dumping locations have been exhausted and wastedumping is restricted to the waste dumps following North and West pits, waste dump schedulingwill become more difficult.
Risk 5
There is a water shortage on the MTW leases due to lack of space for water storage. As aresult, there is a requirement to transfer water from HVO to MTW to meet water demand for theMTW CHPP. While this has not been an issue to date, there is potential for regulatoryrestrictions to be placed on the transfer of water that would restrict coal processing operations.
Quality3.63.6.1 Raw coal qualityThe coal measures across both MTW and HVO have similar quality characteristics. Whilst the seamsequence mined at MTW varies to that at HVO, similar quality patterns occur at both operations.
The opportunity for thermal coal to bypass coal processing is restricted by the raw coal ash (~range 15% to30%). CHPP processing is anticipated necessary for all seams. The TS is low for all seams.
3.6.2 Product coal qualities
Selective mining and washing is required to produce the current thermal and SSCC coal types.
Both ash and CSN vary moderately from seam to seam, however, each individual seam shows relativeconsistency.
Examples of the variable pattern between and within seams for the content of the F1.60 samples on a seamby seam basis are shown for ash and yield in Figure 3.7.
Figure 3.7 MTW seam F1.60 ash and yield for the entire dataset and 10-year plan
144
For
per
sona
l use
onl
y
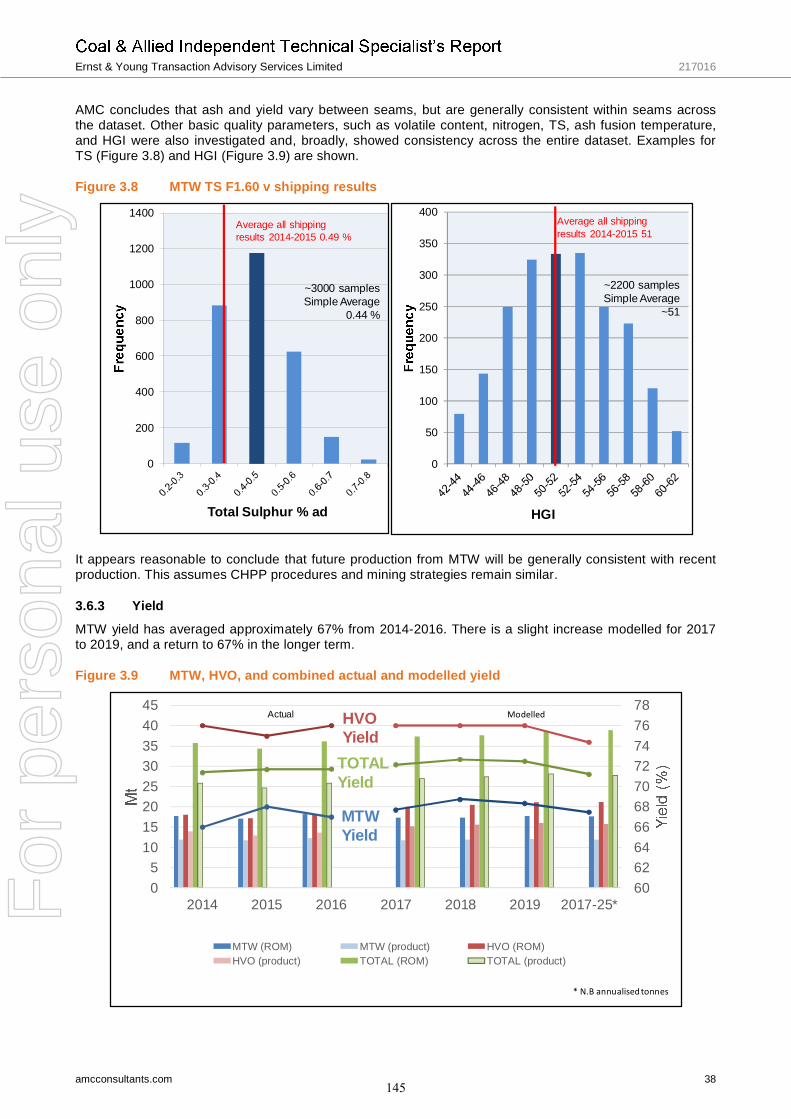
Ernst & Young Transaction Advisory Services Limited 217016
amcconsultants.com 38
AMC concludes that ash and yield vary between seams, but are generally consistent within seams acrossthe dataset. Other basic quality parameters, such as volatile content, nitrogen, TS, ash fusion temperature,and HGI were also investigated and, broadly, showed consistency across the entire dataset. Examples forTS (Figure 3.8) and HGI (Figure 3.9) are shown.
Figure 3.8 MTW TS F1.60 v shipping results
It appears reasonable to conclude that future production from MTW will be generally consistent with recentproduction. This assumes CHPP procedures and mining strategies remain similar.
3.6.3 YieldMTW yield has averaged approximately 67% from 2014-2016. There is a slight increase modelled for 2017to 2019, and a return to 67% in the longer term.
Figure 3.9 MTW, HVO, and combined actual and modelled yield
0
200
400
600
800
1000
1200
1400
Total Sulphur % ad
~3000 samplesSimple Average
0.44 %
Average all shippingresults 2014-2015 0.49 %
0
50
100
150
200
250
300
350
400
HGI
~2200 samplesSimple Average
~51
Average all shippingresults 2014-2015 51
60626466687072747678
05
1015202530354045
2014 2015 2016 2017 2018 2019 2017-25*
MTW (ROM) MTW (product) HVO (ROM)HVO (product) TOTAL (ROM) TOTAL (product)
Actual Modelled
* N.B annualised tonnes
HVOYield
TOTALYield
MTWYield
145
For
per
sona
l use
onl
y
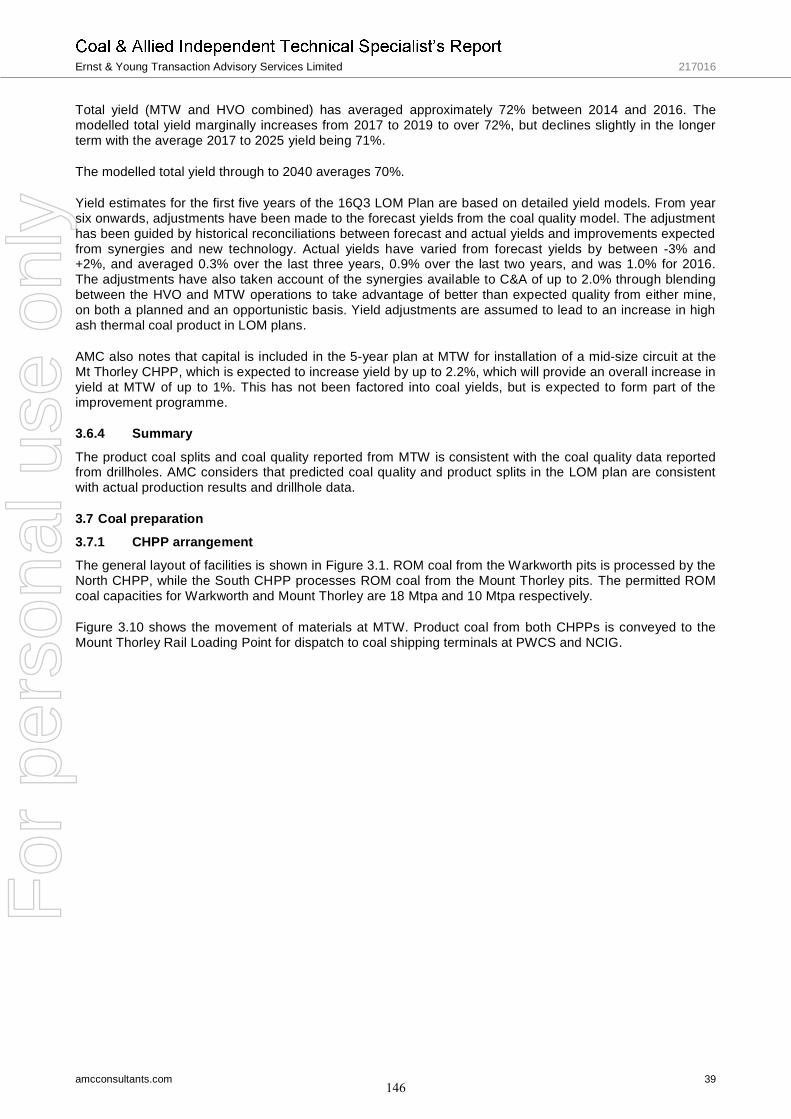
Ernst & Young Transaction Advisory Services Limited 217016
amcconsultants.com 39
Total yield (MTW and HVO combined) has averaged approximately 72% between 2014 and 2016. Themodelled total yield marginally increases from 2017 to 2019 to over 72%, but declines slightly in the longerterm with the average 2017 to 2025 yield being 71%.
The modelled total yield through to 2040 averages 70%.
Yield estimates for the first five years of the 16Q3 LOM Plan are based on detailed yield models. From yearsix onwards, adjustments have been made to the forecast yields from the coal quality model. The adjustmenthas been guided by historical reconciliations between forecast and actual yields and improvements expectedfrom synergies and new technology. Actual yields have varied from forecast yields by between -3% and+2%, and averaged 0.3% over the last three years, 0.9% over the last two years, and was 1.0% for 2016.The adjustments have also taken account of the synergies available to C&A of up to 2.0% through blendingbetween the HVO and MTW operations to take advantage of better than expected quality from either mine,on both a planned and an opportunistic basis. Yield adjustments are assumed to lead to an increase in highash thermal coal product in LOM plans.
AMC also notes that capital is included in the 5-year plan at MTW for installation of a mid-size circuit at theMt Thorley CHPP, which is expected to increase yield by up to 2.2%, which will provide an overall increase inyield at MTW of up to 1%. This has not been factored into coal yields, but is expected to form part of theimprovement programme.
3.6.4 Summary
The product coal splits and coal quality reported from MTW is consistent with the coal quality data reportedfrom drillholes. AMC considers that predicted coal quality and product splits in the LOM plan are consistentwith actual production results and drillhole data.
Coal preparation3.73.7.1 CHPP arrangementThe general layout of facilities is shown in Figure 3.1. ROM coal from the Warkworth pits is processed by theNorth CHPP, while the South CHPP processes ROM coal from the Mount Thorley pits. The permitted ROMcoal capacities for Warkworth and Mount Thorley are 18 Mtpa and 10 Mtpa respectively.
Figure 3.10 shows the movement of materials at MTW. Product coal from both CHPPs is conveyed to theMount Thorley Rail Loading Point for dispatch to coal shipping terminals at PWCS and NCIG.
146
For
per
sona
l use
onl
y
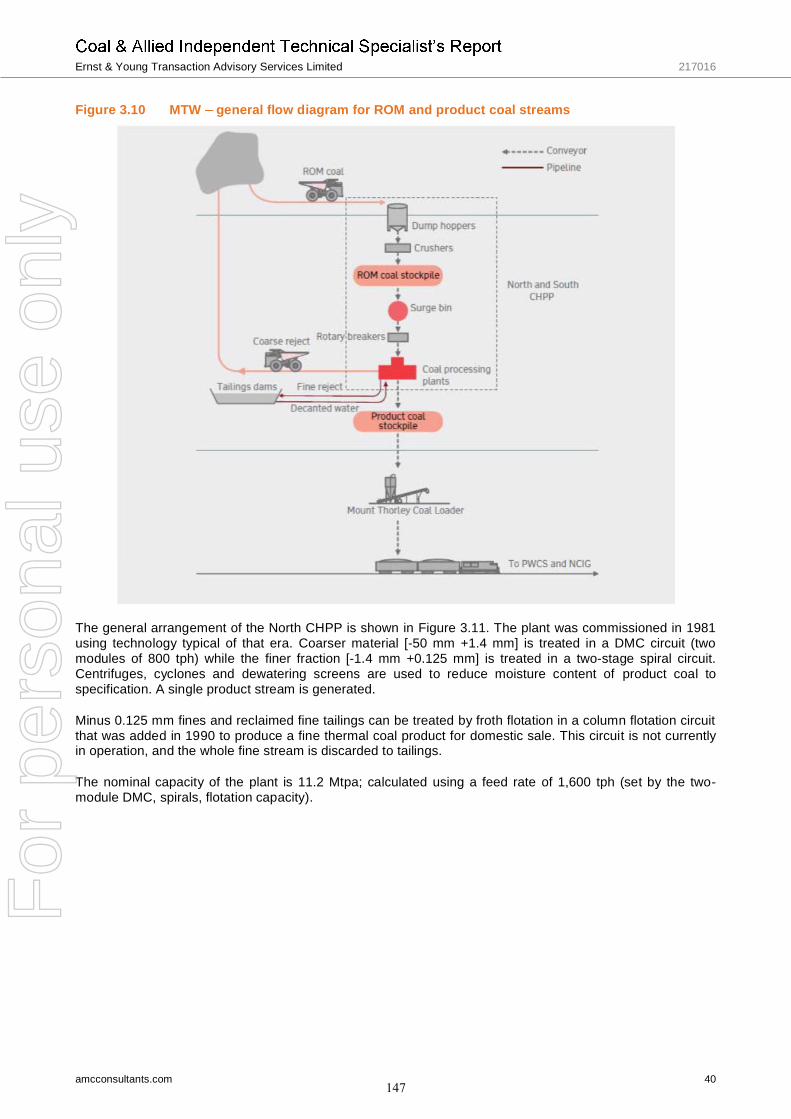
Ernst & Young Transaction Advisory Services Limited 217016
amcconsultants.com 40
Figure 3.10 MTW general flow diagram for ROM and product coal streams
The general arrangement of the North CHPP is shown in Figure 3.11. The plant was commissioned in 1981using technology typical of that era. Coarser material [-50 mm +1.4 mm] is treated in a DMC circuit (twomodules of 800 tph) while the finer fraction [-1.4 mm +0.125 mm] is treated in a two-stage spiral circuit.Centrifuges, cyclones and dewatering screens are used to reduce moisture content of product coal tospecification. A single product stream is generated.
Minus 0.125 mm fines and reclaimed fine tailings can be treated by froth flotation in a column flotation circuitthat was added in 1990 to produce a fine thermal coal product for domestic sale. This circuit is not currentlyin operation, and the whole fine stream is discarded to tailings.
The nominal capacity of the plant is 11.2 Mtpa; calculated using a feed rate of 1,600 tph (set by the two-module DMC, spirals, flotation capacity).
147
For
per
sona
l use
onl
y
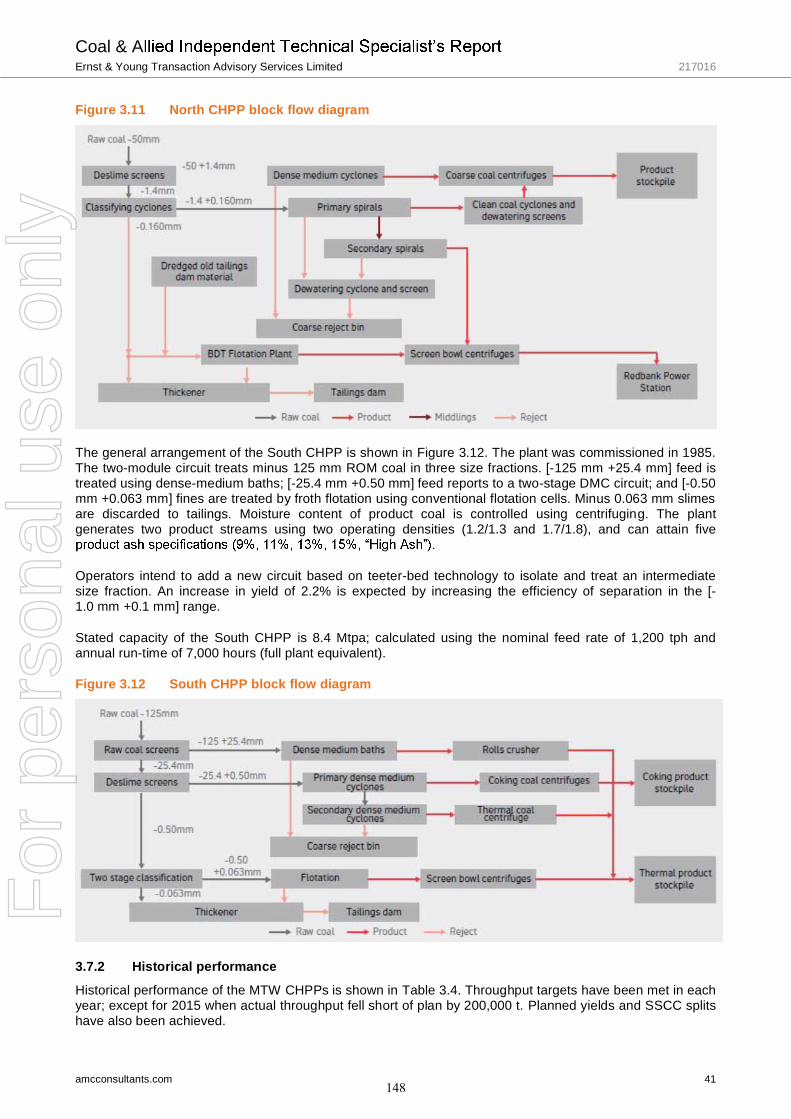
Coal & AErnst & Young Transaction Advisory Services Limited 217016
amcconsultants.com 41
Figure 3.11 North CHPP block flow diagram
The general arrangement of the South CHPP is shown in Figure 3.12. The plant was commissioned in 1985.The two-module circuit treats minus 125 mm ROM coal in three size fractions. [-125 mm +25.4 mm] feed istreated using dense-medium baths; [-25.4 mm +0.50 mm] feed reports to a two-stage DMC circuit; and [-0.50mm +0.063 mm] fines are treated by froth flotation using conventional flotation cells. Minus 0.063 mm slimesare discarded to tailings. Moisture content of product coal is controlled using centrifuging. The plantgenerates two product streams using two operating densities (1.2/1.3 and 1.7/1.8), and can attain five
Operators intend to add a new circuit based on teeter-bed technology to isolate and treat an intermediatesize fraction. An increase in yield of 2.2% is expected by increasing the efficiency of separation in the [-1.0 mm +0.1 mm] range.
Stated capacity of the South CHPP is 8.4 Mtpa; calculated using the nominal feed rate of 1,200 tph andannual run-time of 7,000 hours (full plant equivalent).
Figure 3.12 South CHPP block flow diagram
3.7.2 Historical performance
Historical performance of the MTW CHPPs is shown in Table 3.4. Throughput targets have been met in eachyear; except for 2015 when actual throughput fell short of plan by 200,000 t. Planned yields and SSCC splitshave also been achieved.
148
For
per
sona
l use
onl
y
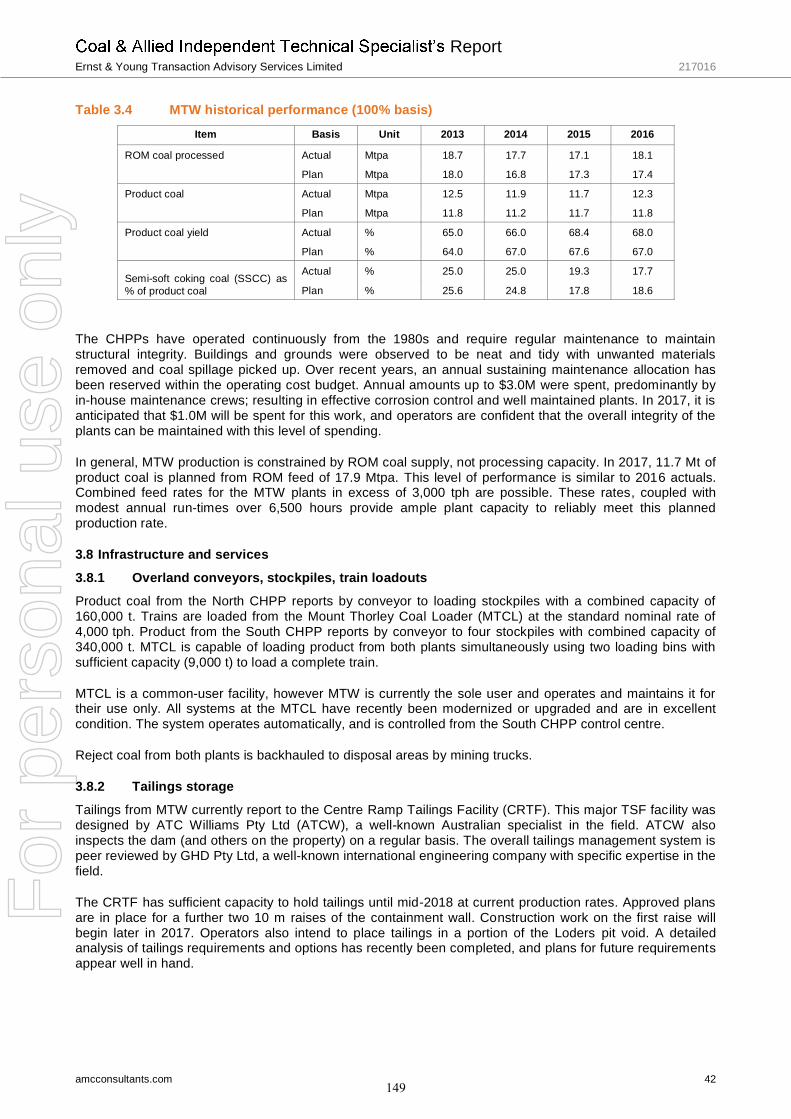
ReportErnst & Young Transaction Advisory Services Limited 217016
amcconsultants.com 42
Table 3.4 MTW historical performance (100% basis)
Item Basis Unit 2013 2014 2015 2016
ROM coal processed Actual Mtpa 18.7 17.7 17.1 18.1
Plan Mtpa 18.0 16.8 17.3 17.4
Product coal Actual Mtpa 12.5 11.9 11.7 12.3
Plan Mtpa 11.8 11.2 11.7 11.8
Product coal yield Actual % 65.0 66.0 68.4 68.0
Plan % 64.0 67.0 67.6 67.0
Semi-soft coking coal (SSCC) as% of product coal
Actual % 25.0 25.0 19.3 17.7
Plan % 25.6 24.8 17.8 18.6
The CHPPs have operated continuously from the 1980s and require regular maintenance to maintainstructural integrity. Buildings and grounds were observed to be neat and tidy with unwanted materialsremoved and coal spillage picked up. Over recent years, an annual sustaining maintenance allocation hasbeen reserved within the operating cost budget. Annual amounts up to $3.0M were spent, predominantly byin-house maintenance crews; resulting in effective corrosion control and well maintained plants. In 2017, it isanticipated that $1.0M will be spent for this work, and operators are confident that the overall integrity of theplants can be maintained with this level of spending.
In general, MTW production is constrained by ROM coal supply, not processing capacity. In 2017, 11.7 Mt ofproduct coal is planned from ROM feed of 17.9 Mtpa. This level of performance is similar to 2016 actuals.Combined feed rates for the MTW plants in excess of 3,000 tph are possible. These rates, coupled withmodest annual run-times over 6,500 hours provide ample plant capacity to reliably meet this plannedproduction rate.
Infrastructure and services3.83.8.1 Overland conveyors, stockpiles, train loadoutsProduct coal from the North CHPP reports by conveyor to loading stockpiles with a combined capacity of160,000 t. Trains are loaded from the Mount Thorley Coal Loader (MTCL) at the standard nominal rate of4,000 tph. Product from the South CHPP reports by conveyor to four stockpiles with combined capacity of340,000 t. MTCL is capable of loading product from both plants simultaneously using two loading bins withsufficient capacity (9,000 t) to load a complete train.
MTCL is a common-user facility, however MTW is currently the sole user and operates and maintains it fortheir use only. All systems at the MTCL have recently been modernized or upgraded and are in excellentcondition. The system operates automatically, and is controlled from the South CHPP control centre.
Reject coal from both plants is backhauled to disposal areas by mining trucks.
3.8.2 Tailings storageTailings from MTW currently report to the Centre Ramp Tailings Facility (CRTF). This major TSF facility wasdesigned by ATC Williams Pty Ltd (ATCW), a well-known Australian specialist in the field. ATCW alsoinspects the dam (and others on the property) on a regular basis. The overall tailings management system ispeer reviewed by GHD Pty Ltd, a well-known international engineering company with specific expertise in thefield.
The CRTF has sufficient capacity to hold tailings until mid-2018 at current production rates. Approved plansare in place for a further two 10 m raises of the containment wall. Construction work on the first raise willbegin later in 2017. Operators also intend to place tailings in a portion of the Loders pit void. A detailedanalysis of tailings requirements and options has recently been completed, and plans for future requirementsappear well in hand.
149
For
per
sona
l use
onl
y

Ernst & Young Transaction Advisory Services Limited 217016
amcconsultants.com 43
3.8.3 Power supplyPower for MTW is supplied at 66 kV from the Ausgrid switchyard via two dedicated feeders and sub-stations,and a ring main arrangement. Systems are well established and reliable. Operators will spend approximately$1M in 2017 to upgrade switching equipment in the Mount Thorley sub-station.
3.8.4 Water supply
Procurement of sufficient water to maintain operations at MTW during the dry season has been problematicin the past. In contrast to HVO where sufficient land area exists to catch and harvest water for year-roundoperation, MTW has had trouble reliably procuring the required volume of approximately 30 ML/d. Significantattention has been given to the issue and operators are now confident that the risk of production curtailment,due to insufficient water, has largely been mitigated. The South out-of-pit dam (SOOP), with a capacity of2.5 GL has been constructed, and a dual pumping system to transfer water from HVO has been installed. Acurrent project in the southern rehabilitated areas of the site will permit harvesting of clean water for the site,or discharge excess clean water to the Hunter River system. Metrics for water storage and usage rates havebeen established, and the overall water management system appears sound.
MTW operates standard mine-site water systems; with potable, clean, and plant water systems segregated.Potable water is supplied to the site by truck.
3.8.5 Logistics
Supplies are brought to site by road. All logistic services are well developed and reliable. MTW is located75 km north-west of Newcastle using the New England Highway, and is approximately 14 km from Singleton.In addition, major vendors of mine-related equipment maintain workshops and service centres in the MountThorley Warkworth Industrial Estate.
Product coal is predominantly sold for export, and is delivered by rail to Newcastle.
Operating costs3.9AMC reviewed the operating costs provided by C&A for their MTW operations in the 16Q3 LOM Plan andC&A cost models and has compared operating cost and
. AMC found the MTW site to be well run and well planned, andconsiders that operating costs are appropriate for an operation of this size and complexity.
Similar to HVO, AMC notes that C&A has had a programme of cost reductions over the last three years.
The change made by AMC to the operating cost estimates provided by C&A for AMC Production Cases is$0.25/ROM coal tonne was added to the variable site administration cost for the Low Production Cases only.
Capital costs3.10AMC reviewed the capital costs provided by C&A for their MTW operations in the 16Q3 LOM Plan and C&Acost models and has compared capital estimates with AMC benchmarks and experience with other sites.
AMC notes that major capital items for MTW were pushed out beyond the period of the 5-year plan. Althoughin general, AMC considers that capital costs are appropriate for an operation of this size and complexity,AMC considers that some capital allocations may need to be brought forward.
Fixed infrastructure sustaining capital
AMC reviewed fixed infrastructure capital allocations for MTW and considers that sustaining capital wasappropriate. MTW to inspect infrastructure and discuss maintenance issues with site staffdemonstrated to AMC that infrastructure was in good condition and AMC considered that additional capital isnot required.
Mobile equipment replacementAMC reviewed mobile equipment capital allocations for MTW and considers that sustaining capital wasappropriate, but heavily weighted towards the end of the 5-year planning period. MTW tomining operations and discuss maintenance issues with site staff demonstrated to AMC that miningequipment was in reasonable condition and AMC considered that additional capital is not required.
150
For
per
sona
l use
onl
y
Ernst & Young Transaction Advisory Services Limited 217016
amcconsultants.com 44
However, AMC considered that some capital allocated outside the 5-year plan should be brought forward to2017-2018, and understands from discussions on site that this is already planned.
$13M of replacement capital should be brought forward from 2022 to2017 for replacement of a Hitachi EX5500 and $9M brought forward to 2018 for replacement of an EX3600excavator.
Environmental and community issues3.113.11.1 Annual health, safety, environmental and community costs
Annual HSEC costs are discussed in section 2.11.
3.11.2 Progressive rehabilitation costsThe 2015 Mount Thorley Warkworth Annual Environmental Monitoring Report indicates that 75.7 ha of landrehabilitation was completed in 2015. Actual rehabilitation costs were not provided to AMC. However, basedon published rates, AMC estimates that 2015 rehabilitation costs could have ranged from $2.3M to $10.3Mfor year 2015, depending on the site-specific conditions. Annual progressive rehabilitation costs are shown inthe financial model as ranging from $1M to $17M, and averaging approximately $6M. AMC considers theprogressive rehabilitation cost allowances in the financial model to be reasonable.
3.11.3 Environmental bonds
Copies of the rehabilitation cost calculation tool spreadsheets for Rio Tinto Coal were provided to AMC.Estimates for MTW were:
Mt Thorley 2016 rehabilitation cost calculation = $46M.Warkworth 2016 rehabilitation cost calculation = $69M.MTW Total 2016 rehabilitation cost calculation = $115M.
Total bank guarantees for MTW summed to $127M (including Warkworth Sands regeneration).
The 2015 Mount Thorley Warkworth Annual Environmental Monitoring Report indicates that the total area of
3.11.4 Mine closure costsRio Tinto Coal prepared a mine closure plan for the MTW, dated 22 May 2015. The closure plan identifiesthe total projected cost of closure (as at 2014) at $150M. The closure costs were calculated using the sameinclusions as for HVO.
AMC reviewed the closure cost estimates in comparison to the rehabilitation cost estimates prepared for theenvironmental bonds and noted the following:
Some estimates were slightly higher in the rehabilitation cost estimates.Some items that were iemployee costs) were not included in the rehabilitation cost estimates.
In preparing the Production Cases, AMC hashuman resources costs, and corrected an error in the rehabilitation cost estimate for MTW.
consolidated closure cost estimate for MTW is $169M.
AMC Production Cases3.12AMC has developed the three Production Cases for MTW, to assist EYTAS in the preparation of its IER inrelation to the Proposed Transaction. Each Production Case has been prepared by adjusting the 16Q3 LOMPlan. The 16Q3 LOM Plan extends for 32 years at the current production rates and is based on CoalReserves plus the expectation other coal in the Coal Resource, but not yet in Coal Reserves, will be mined.
151
For
per
sona
l use
onl
y

Ernst & Young Transaction Advisory Services Limited 217016
amcconsultants.com 45
AMC notes that knowledge of the MTW coal deposits exists, but is not as detailed as at HVO. The MTWfootprint contains a reported MTW Coal Reserve of 330 Mt, plus substantial quantities of coal not currentlyclassified as Coal Reserves.
AMC considers the key risk to the continuation of operations, as planned, is the need to mine some coal fromcurrently unapproved lease areas and to convert Coal Resources (particularly Inferred Coal Resources) toCoal Reserves. To reflect this risk, AMC adjusted the total quantity of material mined over the mine life, theannual production rates, and the capital and operating cost estimates.
The three MTW Production Cases are as follows:MTW Base Production Case mining of the MTW Coal Reserves plus Measured, Indicated, and 50%of Inferred MTW Coal Resources (total of 484 Mt) at the LOM plan rate.MTW Low Production Case mining of the MTW Coal Reserves plus Measured, Indicated, and 50%of Inferred MTW Coal Resources minus 80 Mt of coal that would not receive approval for mining (totalof 403 Mt) at LOM plan rate for four years and then 95% of planned rate (when down to two pits).MTW High Production Case mining all the coal within the 16Q3 LOM Plan (511 Mt), at the annualproduction rate estimated within the plan.
Figure 3.13 through Figure 3.15 show a comparison of the ROM coal tonnes mined, product coal tonnesrailed, and waste movements for the three MTW Production Cases.
Figure 3.13 MTW Production Cases ROM coal tonnes mined
-
2,000
4,000
6,000
8,000
10,000
12,000
14,000
16,000
18,000
20,000
MTW Base Case MTW High Case MTW Low Case
152
For
per
sona
l use
onl
y
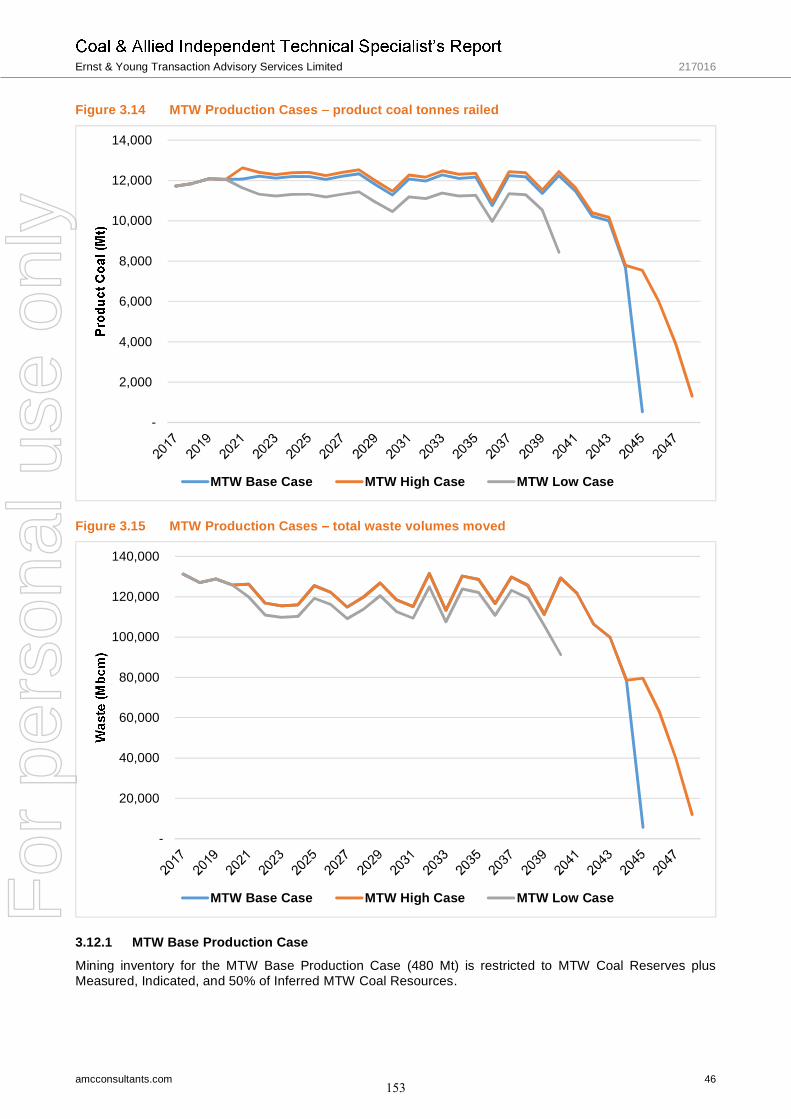
Ernst & Young Transaction Advisory Services Limited 217016
amcconsultants.com 46
Figure 3.14 MTW Production Cases product coal tonnes railed
Figure 3.15 MTW Production Cases total waste volumes moved
3.12.1 MTW Base Production CaseMining inventory for the MTW Base Production Case (480 Mt) is restricted to MTW Coal Reserves plusMeasured, Indicated, and 50% of Inferred MTW Coal Resources.
-
2,000
4,000
6,000
8,000
10,000
12,000
14,000
MTW Base Case MTW High Case MTW Low Case
-
20,000
40,000
60,000
80,000
100,000
120,000
140,000
MTW Base Case MTW High Case MTW Low Case
153
For
per
sona
l use
onl
y

Ernst & Young Transaction Advisory Services Limited 217016
amcconsultants.com 47
In preparing its MTW Base Production Case, AMC has adjusted the 16Q3 LOM Plan based on the followingassumptions:
MTWmaintaining production at planned levels, C&A will continue to receive approvals as expected, and aproportion of Inferred MTW Coal Resources will not be converted to MTW Coal Reserves.Annual production will continue at the rate forecast in the 16Q3 LOM Plan (up to 18 Mtpa). MTW hasgenerally achieved planned production levels and AMC considers the operation is well run and wellplanned from observations on their site visit.The higher yield of 2015-2016 (average of +0.9%) compared to the coal quality model forecast willcontinue. Consequently, AMC has added 0.9% to the yield in the 16Q3 LOM Plan from 2022.Improvement initiatives from new technology and synergies with blending the HVO and MTW productsas a single product will provide a further 1% increase in yield from 2022. All increases in yield over themodelled yield are assumed to result in increased high ash thermal coal product.The coal reserve plus Measured, Indicated, and 50% of Inferred MTW Coal Resources within the16Q3 LOM Plan (484 Mt) will be mined. This case assumes that 50% of the Inferred MTW CoalResources will not be converted to MTW Coal Reserves due to seam splitting/narrowing or approvalsissues.$22M in capital will need to be brought forward over two years for mobile equipment replacements.No change will be required to the planned operating costs.
A summary of the MTW Base Production Case is shown in Table 3.5.
Table 3.5 MTW Base Production Case
Production Case Product ProductTonnes
(Mt)
ROMTonnes
(Mt)
TotalWaste
(Mbcm)
ProductionRate
(Mtpa ROM)
LOM CapitalCost
($/product t)
OperatingCost
($/product t)
MTW Base Thermal & SSCC 327 484 3,358 17.8 5.8 54.3
3.12.2 MTW Low Production Case
Operating costs were adjusted by $0.25/ROM coal tonne, asreduction over the last three years will not be sustainable in some areas, resulting in minor cost increases.
MTW Low Production Case assumes that:Annual production is assumed to continue at the rate forecast in the 16Q3 LOM Plan until Loders andSouth pits are completed, and then reduce production to 95% of the LOM plan rate to account for theincreased congestion that comes from operations being restricted to two pits. A reduction in miningrate can result from congestion as well as interactions caused by noise and dust issue for the localcommunity.The higher yields achieved from 2014-2016 (+0.3%) compared to the coal quality model forecast willcontinue. Consequently, AMC has added 0.3% to the yield in the 16Q3 LOM Plan from 2022. TheImprovement initiatives from new technology and synergies with blending the HVO and MTW productsas a single product will underpin this increase but will not increase yield further. All increases in yieldover the modelled yield are assumed to result in increased high ash thermal coal product.Approvals will not be achieved for mining 80 Mt of coal, either from not being able to close WallabyScrub Road, or elsewhere on the lease as mining gets closer to local communities, on the basis thatas mining progresses closer to local communities, there is a risk that C&A will not receive approvalsfor extending their mine life. This case assumes that 50% of the Inferred MTW Coal Resources will notbe converted to MTW Coal Reserves due to seam splitting/narrowing or approvals issues. Theremaining MTW Coal Reserves MTW Low Production Case total 403 Mt.$22M in capital will need to be brought forward over two years for mobile equipment replacements.
A summary of the AMC MTW Low Production Case is shown in Table 3.6.
154
For
per
sona
l use
onl
y
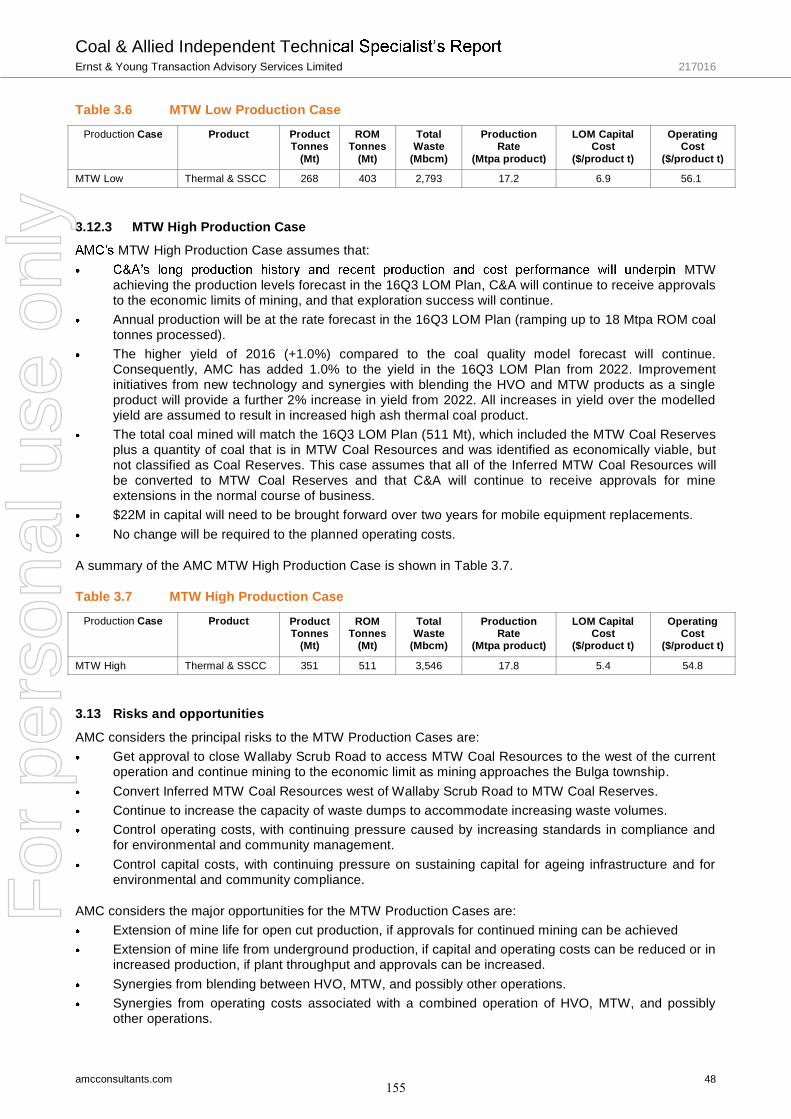
Coal & Allied Independent TechniErnst & Young Transaction Advisory Services Limited 217016
amcconsultants.com 48
Table 3.6 MTW Low Production Case
Production Case Product ProductTonnes
(Mt)
ROMTonnes
(Mt)
TotalWaste
(Mbcm)
ProductionRate
(Mtpa product)
LOM CapitalCost
($/product t)
OperatingCost
($/product t)
MTW Low Thermal & SSCC 268 403 2,793 17.2 6.9 56.1
3.12.3 MTW High Production CaseMTW High Production Case assumes that:
MTWachieving the production levels forecast in the 16Q3 LOM Plan, C&A will continue to receive approvalsto the economic limits of mining, and that exploration success will continue.Annual production will be at the rate forecast in the 16Q3 LOM Plan (ramping up to 18 Mtpa ROM coaltonnes processed).The higher yield of 2016 (+1.0%) compared to the coal quality model forecast will continue.Consequently, AMC has added 1.0% to the yield in the 16Q3 LOM Plan from 2022. Improvementinitiatives from new technology and synergies with blending the HVO and MTW products as a singleproduct will provide a further 2% increase in yield from 2022. All increases in yield over the modelledyield are assumed to result in increased high ash thermal coal product.The total coal mined will match the 16Q3 LOM Plan (511 Mt), which included the MTW Coal Reservesplus a quantity of coal that is in MTW Coal Resources and was identified as economically viable, butnot classified as Coal Reserves. This case assumes that all of the Inferred MTW Coal Resources willbe converted to MTW Coal Reserves and that C&A will continue to receive approvals for mineextensions in the normal course of business.$22M in capital will need to be brought forward over two years for mobile equipment replacements.No change will be required to the planned operating costs.
A summary of the AMC MTW High Production Case is shown in Table 3.7.
Table 3.7 MTW High Production Case
Production Case Product ProductTonnes
(Mt)
ROMTonnes
(Mt)
TotalWaste
(Mbcm)
ProductionRate
(Mtpa product)
LOM CapitalCost
($/product t)
OperatingCost
($/product t)
MTW High Thermal & SSCC 351 511 3,546 17.8 5.4 54.8
Risks and opportunities3.13
AMC considers the principal risks to the MTW Production Cases are:Get approval to close Wallaby Scrub Road to access MTW Coal Resources to the west of the currentoperation and continue mining to the economic limit as mining approaches the Bulga township.Convert Inferred MTW Coal Resources west of Wallaby Scrub Road to MTW Coal Reserves.Continue to increase the capacity of waste dumps to accommodate increasing waste volumes.Control operating costs, with continuing pressure caused by increasing standards in compliance andfor environmental and community management.Control capital costs, with continuing pressure on sustaining capital for ageing infrastructure and forenvironmental and community compliance.
AMC considers the major opportunities for the MTW Production Cases are:Extension of mine life for open cut production, if approvals for continued mining can be achievedExtension of mine life from underground production, if capital and operating costs can be reduced or inincreased production, if plant throughput and approvals can be increased.Synergies from blending between HVO, MTW, and possibly other operations.Synergies from operating costs associated with a combined operation of HVO, MTW, and possiblyother operations.
155
For
per
sona
l use
onl
y
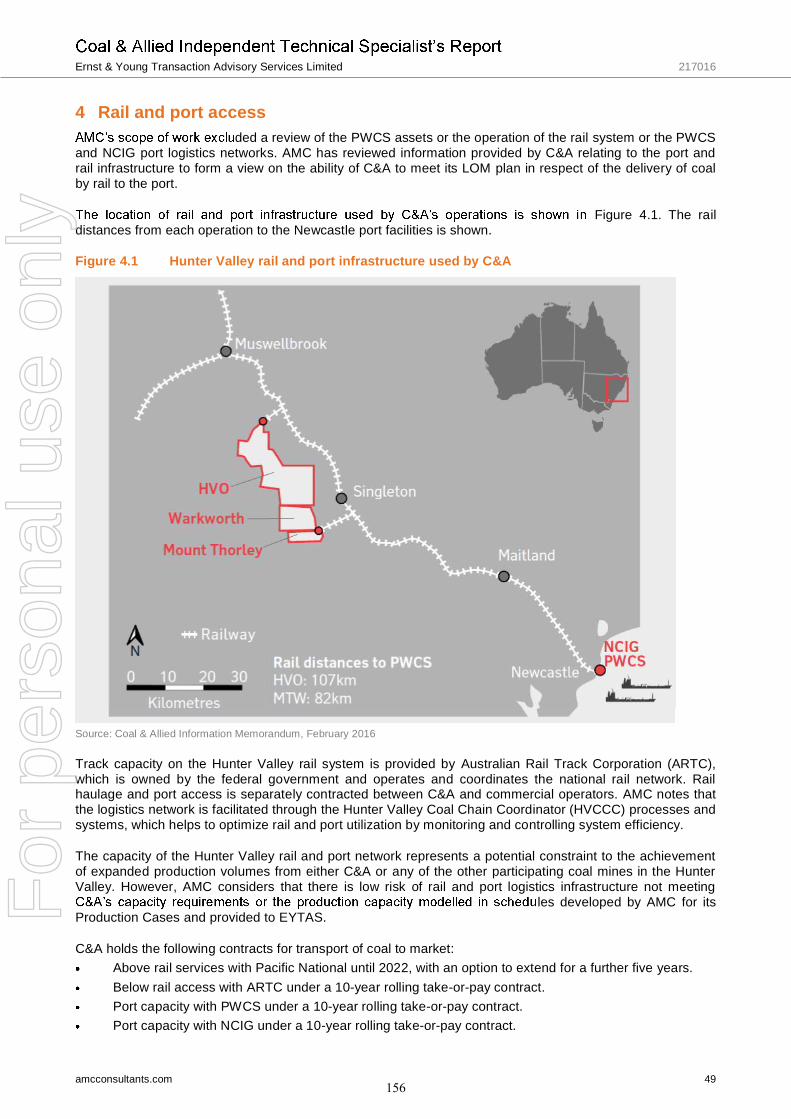
Ernst & Young Transaction Advisory Services Limited 217016
amcconsultants.com 49
4 Rail and port accessded a review of the PWCS assets or the operation of the rail system or the PWCS
and NCIG port logistics networks. AMC has reviewed information provided by C&A relating to the port andrail infrastructure to form a view on the ability of C&A to meet its LOM plan in respect of the delivery of coalby rail to the port.
Figure 4.1. The raildistances from each operation to the Newcastle port facilities is shown.
Figure 4.1 Hunter Valley rail and port infrastructure used by C&A
Source: Coal & Allied Information Memorandum, February 2016
Track capacity on the Hunter Valley rail system is provided by Australian Rail Track Corporation (ARTC),which is owned by the federal government and operates and coordinates the national rail network. Railhaulage and port access is separately contracted between C&A and commercial operators. AMC notes thatthe logistics network is facilitated through the Hunter Valley Coal Chain Coordinator (HVCCC) processes andsystems, which helps to optimize rail and port utilization by monitoring and controlling system efficiency.
The capacity of the Hunter Valley rail and port network represents a potential constraint to the achievementof expanded production volumes from either C&A or any of the other participating coal mines in the HunterValley. However, AMC considers that there is low risk of rail and port logistics infrastructure not meeting
les developed by AMC for itsProduction Cases and provided to EYTAS.
C&A holds the following contracts for transport of coal to market:Above rail services with Pacific National until 2022, with an option to extend for a further five years.Below rail access with ARTC under a 10-year rolling take-or-pay contract.Port capacity with PWCS under a 10-year rolling take-or-pay contract.Port capacity with NCIG under a 10-year rolling take-or-pay contract.
156
For
per
sona
l use
onl
y
Ernst & Young Transaction Advisory Services Limited 217016
amcconsultants.com 50
C&A has total port capacity of approximately 23 Mtpa at PWCS and 5 Mtpa at NCIG -railcapacity is 26.0 Mtpa, which will reduce to 19.7 Mtpa from 2019 unless additional capacity is negotiated withPacific National. -rail access is renewable annually and is aligned to contracted port volume.
C&A previously held 8 Mtpa of port and below-rail capacity, which was allocated to the Mount PleasantProject (MTP). 4 Mtpa of port capacity at PWCS and the 8 Mtpa below-rail capacity has been subsequentlyassigned to Mach Energy Australia Pty Ltd through the divestment of MTP in late 2016. Through thedivestment, C&A agreed to pay for this c MTP or 31 March 2018.The assignment of an additional 4 Mtpa of port capacity at the NCIG terminal is conditional on MACH
Maximum total production from HVO plus Production Cases is estimated to be25.5 Mtpa which is below the contracted rail capacity of 26 Mtpa. The highest annual total production in
High Production Cases is scheduled to be 28 Mtpa in years from 2019 to 2028. Additional haulagecapacity will be required from Pacific National from 2019 in all cases examined. Operators anticipate thatoccasional requirements for rail capacity beyond contracted levels will be able to be met by purchasingcapacity from other users of the line.
157
For
per
sona
l use
onl
y
Ernst & Young Transaction Advisory Services Limited 217016
amcconsultants.com 51
5 Expansion or development projects contemplated, including futureunderground mining operations
Oaklands deposit5.15.1.1 Project location
C&A also owns the Oaklands coal project, classified as a domestic thermal coal prospect. The project haspublished Coal Resources, but not Coal Reserves.
The Oaklands project lies at the southern end of the Oaklands Basin, near the town of Oaklands, and isapproximately 600 km south-west of Sydney and 300 km north of Melbourne. The nearest ports for coalexport are Geelong, which has limited vessel size capability, and Port Kembla, which can accommodatelarger vessels than Geelong, but is further away from the project site.
The Oaklands project holds an Assessment Lease, which is an intermediate step between exploration andproduction tenure. Further work will be required to develop the project to a point where a mining leaseapplication may be made. C&A expects the Oaklands product coal to be broadly comparable with a numberof low-rank Indonesian thermal coals traded on the international export market.
A three-year Assessment Lease (AL18) was granted on 25 June 2009.
5.1.2 GeologyThe coal is located within the Oaklands Basin, which is considered an asymmetrical, plunging syncline. Twocoal seams are found in the basin:
Coorabin Coal Measures, which is sub-divided into three formations: Narrow plain Formation. Loughmore Formation. Nowranie Creek Formation.
Lanes Shaft Coal Measure.
Due to the Corrabin Coal Measures being thin and high in ash, coal from these measures have not beenincluded in any Coal Resource estimate.
The Lanes Shaft Coal Member consists of:Low rank, sub-bituminous coal.Generally dull, with rare bright bands.Typically 4 m thick over most of the basin but reaches >20 m in parts.Contains a stone band ranging in thickness up to 3 m.
Within AL18, the minimum depth to the top of the coal is approximately 42 m with an average of 80 m. Theaverage seam thickness is 14 m with a maximum thickness of 23 m.
In 2010, Rio Tinto carried out a study into the potential of the Oaklands project. The drillhole database wasupdated and corrected, and seam and quality models were prepared.
A total of 359 drillholes contained geological descriptions, and 145 drilholes contained coal qualityinformation. Micromine software was used to model the Lanes Shaft Coal Member, based on 50 m x 50 mcells and using an inverse distance squared estimator to define the floor and thickness. Coal quality was alsoestimated based on a full seam composite, excluding high-ash material at the floor and roof.
5.1.3 Coal ResourcesThe Coal Resources estimate prepared in 2010 is shown in Table 5.1. Coal is located within an optimizedopen cut. No updated Coal Resources estimate has been reported.
158
For
per
sona
l use
onl
y
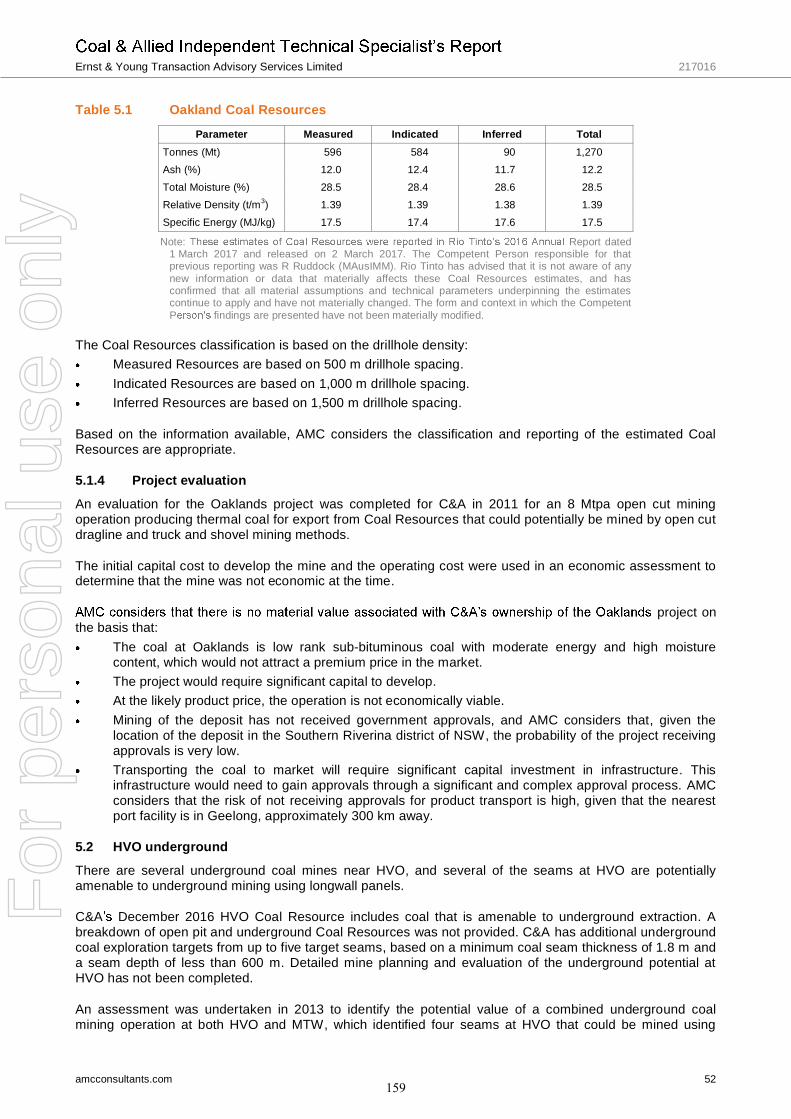
Ernst & Young Transaction Advisory Services Limited 217016
amcconsultants.com 52
Table 5.1 Oakland Coal Resources
Parameter Measured Indicated Inferred TotalTonnes (Mt) 596 584 90 1,270Ash (%) 12.0 12.4 11.7 12.2Total Moisture (%) 28.5 28.4 28.6 28.5Relative Density (t/m3) 1.39 1.39 1.38 1.39Specific Energy (MJ/kg) 17.5 17.4 17.6 17.5
Note: Report dated1 March 2017 and released on 2 March 2017. The Competent Person responsible for thatprevious reporting was R Ruddock (MAusIMM). Rio Tinto has advised that it is not aware of anynew information or data that materially affects these Coal Resources estimates, and hasconfirmed that all material assumptions and technical parameters underpinning the estimatescontinue to apply and have not materially changed. The form and context in which the CompetentP findings are presented have not been materially modified.
The Coal Resources classification is based on the drillhole density:Measured Resources are based on 500 m drillhole spacing.Indicated Resources are based on 1,000 m drillhole spacing.Inferred Resources are based on 1,500 m drillhole spacing.
Based on the information available, AMC considers the classification and reporting of the estimated CoalResources are appropriate.
5.1.4 Project evaluation
An evaluation for the Oaklands project was completed for C&A in 2011 for an 8 Mtpa open cut miningoperation producing thermal coal for export from Coal Resources that could potentially be mined by open cutdragline and truck and shovel mining methods.
The initial capital cost to develop the mine and the operating cost were used in an economic assessment todetermine that the mine was not economic at the time.
project onthe basis that:
The coal at Oaklands is low rank sub-bituminous coal with moderate energy and high moisturecontent, which would not attract a premium price in the market.The project would require significant capital to develop.At the likely product price, the operation is not economically viable.Mining of the deposit has not received government approvals, and AMC considers that, given thelocation of the deposit in the Southern Riverina district of NSW, the probability of the project receivingapprovals is very low.Transporting the coal to market will require significant capital investment in infrastructure. Thisinfrastructure would need to gain approvals through a significant and complex approval process. AMCconsiders that the risk of not receiving approvals for product transport is high, given that the nearestport facility is in Geelong, approximately 300 km away.
HVO underground5.2
There are several underground coal mines near HVO, and several of the seams at HVO are potentiallyamenable to underground mining using longwall panels.
C&A December 2016 HVO Coal Resource includes coal that is amenable to underground extraction. Abreakdown of open pit and underground Coal Resources was not provided. C&A has additional undergroundcoal exploration targets from up to five target seams, based on a minimum coal seam thickness of 1.8 m anda seam depth of less than 600 m. Detailed mine planning and evaluation of the underground potential atHVO has not been completed.
An assessment was undertaken in 2013 to identify the potential value of a combined underground coalmining operation at both HVO and MTW, which identified four seams at HVO that could be mined using
159
For
per
sona
l use
onl
y
Ernst & Young Transaction Advisory Services Limited 217016
amcconsultants.com 53
longwall techniques. A capital cost and operating cost were estimated and used in an economic assessmentto determine that underground mining was not economically viable at that time.
Additional data on seam thickness, seam splits, and offsets from potential constraints, such as alluvial sands,and proposed infrastructure for the open cut operations is required before more detailed planning can becompleted.
Key risks for underground development were considered to be inadequate knowledge of the Foybrook coalseams at depth, potential for sterilization of significant areas due to geological structures, and potentialissues involved with maintaining consistent longwall production from multi-seam mining.
Key opportunities for underground development were considered to be flexibility in production scheduling,reduction in community concerns around open cut mining, operational continuity when open cut CoalReserves are depleted, and potentially higher CHPP yields from reduced dilution.
AMC considers that there is no material value associated with underground mining at HVO on the basis that:HVO production is constrained by CHPP throughput, and therefore, underground coal production isunlikely to commence until cheaper open cut sources of coal are depleted.Development of underground production will require significant capital cost, which is unlikely to beoffset by a reduction in cost or increase in revenue.Mining by underground methods has not received government approvals, and AMC considers that therisk of the project not receiving approvals is moderate to high.
However, AMC considers that the flexibility provided by the underground mining options at HVO provides arisk mitigation strategy against not receiving approvals for future open cut operations to enable production tocontinue at HVO.
MTW underground5.3
There are also several seams at MTW that are potentially amenable to underground mining using longwallpanels or a combination of longwall and bord and pillar mining.
C&A Underground CoalResources at Mt Thorley were written off in the December 2015 Coal Resource estimate, however,underground Coal Resources were included for Warkworth. A breakdown of open pit and underground CoalResources was not provided with the 2016 Coal Resource estimate. Underground MTW Coal Resources arebased on a minimum coal seam thickness of 1.8 m and a seam depth of less than 600 m.
Detailed mine planning and evaluation of the underground potential at MTW has not been completed,although C&A completed a MTW Underground Order of Magnitude Study (OoM) in 2012. The OoMestimated capital costs to develop a longwall operation and an operating cost, which were used in aneconomic assessment to determine that underground mining was not economically viable at that time.
AMC considers that there is not material value associated with underground mining at MTW on the basisthat:
MTW production is constrained by CHPP throughput, and therefore, underground coal production isunlikely to commence until cheaper open cut sources of coal are depleted.Development of underground production will require significant capital cost ($475M) which is unlikelyto be offset by a reduction in cost or increase in revenue.Mining by underground methods has not received government approvals, and AMC considers that therisk of the project not receiving approvals is moderate to high.
However, AMC considers that the flexibility provided by the underground mining options at MTW provides arisk mitigation strategy against not receiving approvals for future open cut operations to enable production tocontinue at MTW, particularly as open cut operations progress closer towards the town of Bulga.
160
For
per
sona
l use
onl
y
Ernst & Young Transaction Advisory Services Limited 217016
amcconsultants.com 54
6 QualificationsAMC is a firm of mineral industry consultants whose activities include the preparation of independent
for purposes related to equity and debt funding, and public reports. In these assignments, AMC and its sub-consultants act as an independent party.
Based on our who have contributedto the preparation this ITSR, we advise that we do not have a conflict of interest in preparing this ITSR.
AMC has carried out numerous technical consulting assignments for Rio Tinto and related companies in theperiod 2014 to 2016.coal mine life-of-mine plan and, in 2015, we completed a labour productivity benchmark report for Yancoal.
In carrying out these consulting assignments, AMC and its sub-consultants have acted as independentparties and have no business relationship with either Rio Tinto or Yancoal, other than the carrying out ofindividual consulting assignments, as engaged.
While some employees of AMC and its subconsultants may have direct or beneficial shareholdings in RioTinto, neither AMC nor the contributors to this report nor members of their immediate families have anyinterests in Rio Tinto that could be reasonably construed to affect their independence. AMC has nopecuniary interest, association or employment relationship with Rio Tinto.
Rio Tinto will pay AMC a professional fee of approximately $170,000rates for the preparation of this ITSR, plus reimbursement of out-of-pocket expenses. The fee is notcontingent upon the outcome of announcement by Rio Tinto on 24 January 2017 that Rio Tinto and Yancoalhad reached a binding agreement for the sale of C&A to Yancoal, and AMC will receive no other benefit forthe preparation of this ITSR.
In a letter relating to our engagement, Rio Tinto agreed to comply with those obligations of thecommissioning entity under the VALMIN Code including that to the best of its knowledge and understanding,complete, accurate and true disclosure of all relevant material information will be made.
Rio Tinto represented in writing that, to the best of its knowledge, it has provided AMC with all materialinformation relevant to its mineral assets described in this ITSR.
AMC has not audited the Coal Resources and Coal Reserves, mining and processing schedules, costestimates or other information provided by Rio Tinto. AMC has reviewed that information to the extentnecessary to satisfy itself that the Production Cases presented in this report are based on reasonablegrounds and assumptions, and that the information AMC has in relation to valuation of the explorationproperties, is sufficient.
Rio Tinto has been provided with drafts of this ITSR to enable correction of any factual errors and notation ofany material omissions.
This ITSR and the conclusions in it are effective at 31 March 2017. Those conclusions may change in thefuture with changes in relevant coal prices, exploration and other technical developments in regard to theoperation, underground resource and exploration tenements and the market for mineral properties.
Rio Tinto has provided AMC with indemnities regarding damages, losses and liabilities related to or arisingout of its engagement other than those arising from illegal acts, bad faith or negligence on its part or itsreliance on unauthorized statements from third parties.
This ITSR has been provided to EYTAS for the purposes of it forming its opinion and preparing its IER inrelation to the Proposed Transaction. AMC has given its consent for its report to be appended to the IER andfor it to be provided to shareholders and has not withdrawn that consent before their lodgement with theAustralian Securities & Investments Commission. Neither this ITSR nor any part of it may be used for anyother purpose without written consent.
161
For
per
sona
l use
onl
y

Coal & Allied Independent TErnst & Young Transaction Advisory Services Limited 217016
amcconsultants.com 55
The signatories to this report are corporate members of the AusIMM and bound by its Code of Ethics.
Yours faithfully
G Williamson M ThomasFAusIMM (CP) FAusIMM (CP)Principal Mining Engineer Principal Consultant
162
For
per
sona
l use
onl
y
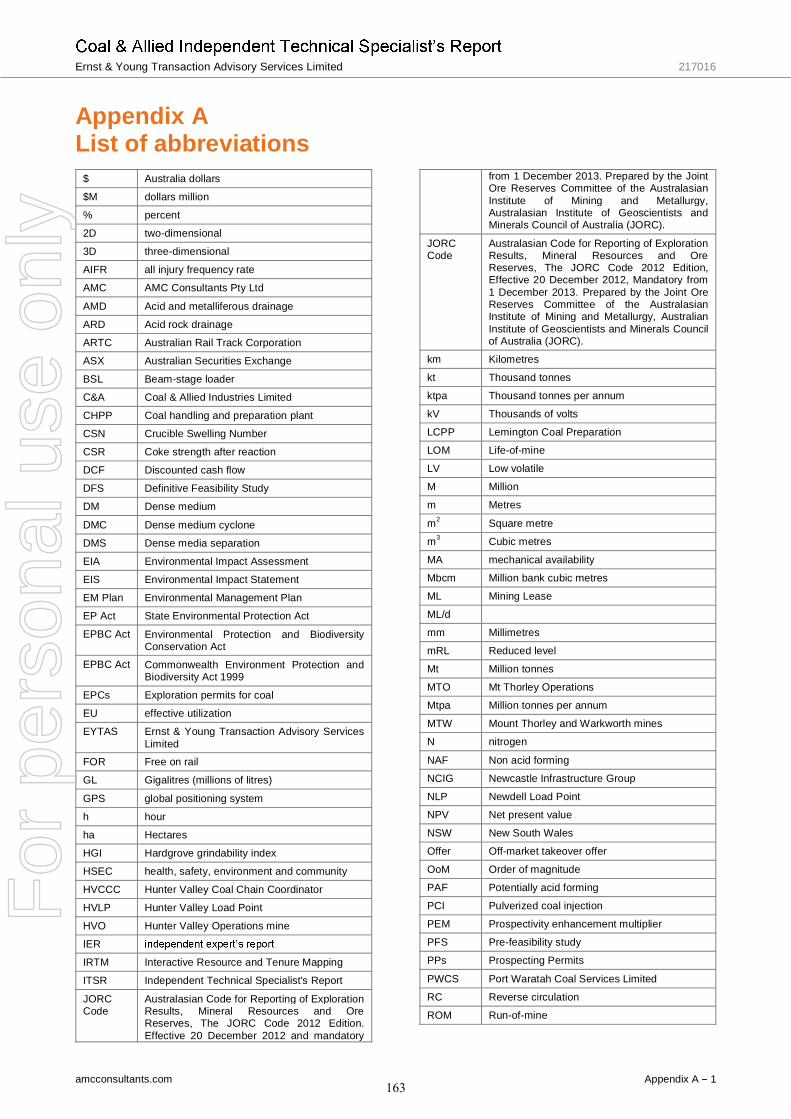
Ernst & Young Transaction Advisory Services Limited 217016
amcconsultants.com Appendix A 1
Appendix AList of abbreviations
$ Australia dollars
$M dollars million
% percent
2D two-dimensional
3D three-dimensional
AIFR all injury frequency rate
AMC AMC Consultants Pty Ltd
AMD Acid and metalliferous drainage
ARD Acid rock drainage
ARTC Australian Rail Track Corporation
ASX Australian Securities Exchange
BSL Beam-stage loader
C&A Coal & Allied Industries Limited
CHPP Coal handling and preparation plant
CSN Crucible Swelling Number
CSR Coke strength after reaction
DCF Discounted cash flow
DFS Definitive Feasibility Study
DM Dense medium
DMC Dense medium cyclone
DMS Dense media separation
EIA Environmental Impact Assessment
EIS Environmental Impact Statement
EM Plan Environmental Management Plan
EP Act State Environmental Protection Act
EPBC Act Environmental Protection and BiodiversityConservation Act
EPBC Act Commonwealth Environment Protection andBiodiversity Act 1999
EPCs Exploration permits for coal
EU effective utilization
EYTAS Ernst & Young Transaction Advisory ServicesLimited
FOR Free on rail
GL Gigalitres (millions of litres)
GPS global positioning system
h hour
ha Hectares
HGI Hardgrove grindability index
HSEC health, safety, environment and community
HVCCC Hunter Valley Coal Chain Coordinator
HVLP Hunter Valley Load Point
HVO Hunter Valley Operations mine
IER
IRTM Interactive Resource and Tenure Mapping
ITSR Independent Technical Specialist's Report
JORCCode
Australasian Code for Reporting of ExplorationResults, Mineral Resources and OreReserves, The JORC Code 2012 Edition.Effective 20 December 2012 and mandatory
from 1 December 2013. Prepared by the JointOre Reserves Committee of the AustralasianInstitute of Mining and Metallurgy,Australasian Institute of Geoscientists andMinerals Council of Australia (JORC).
JORCCode
Australasian Code for Reporting of ExplorationResults, Mineral Resources and OreReserves, The JORC Code 2012 Edition,Effective 20 December 2012, Mandatory from1 December 2013. Prepared by the Joint OreReserves Committee of the AustralasianInstitute of Mining and Metallurgy, AustralianInstitute of Geoscientists and Minerals Councilof Australia (JORC).
km Kilometres
kt Thousand tonnes
ktpa Thousand tonnes per annum
kV Thousands of volts
LCPP Lemington Coal Preparation
LOM Life-of-mine
LV Low volatile
M Million
m Metres
m2 Square metre
m3 Cubic metres
MA mechanical availability
Mbcm Million bank cubic metres
ML Mining Lease
ML/d
mm Millimetres
mRL Reduced level
Mt Million tonnes
MTO Mt Thorley Operations
Mtpa Million tonnes per annum
MTW Mount Thorley and Warkworth mines
N nitrogen
NAF Non acid forming
NCIG Newcastle Infrastructure Group
NLP Newdell Load Point
NPV Net present value
NSW New South Wales
Offer Off-market takeover offer
OoM Order of magnitude
PAF Potentially acid forming
PCI Pulverized coal injection
PEM Prospectivity enhancement multiplier
PFS Pre-feasibility study
PPs Prospecting Permits
PWCS Port Waratah Coal Services Limited
RC Reverse circulation
ROM Run-of-mine
163
For
per
sona
l use
onl
y

Ernst & Young Transaction Advisory Services Limited 217016
amcconsultants.com Appendix A 2
RPI Regional planning interest
SCA Strategic cropping land
SOOP South out-of-pit dam
SSCC Semi-soft coking coal
t Tonnes
t/m3 Tonnes per cubic metres
TECs Threatened Ecological Communities
TMM Total material movement
tpa Tonnes per annum
tph Tonnes per hour
TRIFR total recordable injury frequency rate
TS total sulphur
TSF Tailings storage facility
UCS unconfined compressive strength
US$ United States dollars
VALMINCode
Code for the Technical Assessment andValuation of Mineral and Petroleum Assetsand Securities for Independent ExpertReports. The VALMIN Code 2005 Edition,Prepared by the VALMIN Committee, a jointcommittee of the Australasian Institute ofMining and Metallurgy, the Australian Instituteof Geoscientists and the Mineral IndustryConsultants Association with the participationof the Australian Securities and InvestmentCommission, the Australian Stock ExchangeLimited, the Minerals Council of Australia, thePetroleum Exploration Society of Australia, theSecurities Association of Australia andrepresentatives from the Australian financesector.
Yancoal Yancoal Australia Ltd
164
For
per
sona
l use
onl
y

Ernst & Young Transaction Advisory Services Limited 217016
amcconsultants.com Appendix B 1
Appendix BReport contributorsThe contributors to this report include:
Name Qualifications Affiliations InvolvementDaniel Ross BEng (Mining) AMC Senior Mining Engineer Mine designs, production
schedules, and develop productioncases.
Glen Williamson BEng (Mining) (Hons) AMC Principal Mining Engineer Project manager, Ore Reserve andthe mining aspects.
Ian Lipton BSc (Geological Sciences) (Hons) AMC Corporate ConsultingManager/Principal Geologist
Lawrie Gillett BEng (Mining) (Hons)DipGeosc (Mineral Economics)
AMC Practice Leader CorporateConsultancy Australia
Project director.
Mike Thomas Higher National Diploma of MiningEngineering
AMC Principal Mining Consultant Peer review.
Paul Keleher BSc (Geology) AMC Subconsultant Coal quality aspect.Peter Allen BEng (Environmental) AMC Principal Environmental
EngineerRehabilitation, environmental bond,and closure costs.
Rob Chesher BSc Metallurgy (Hons) AMC General Manager BrisbanePrincipal Consultant
Coal processing and other siteinfrastructure.
Rod Webster Bachelor of Applied Science in AppliedGeology (with Distinction)
AMC Principal Consultant Geology and Mineral Resource andvaluations of the coal explorationassets.
Ross Stainley BEng (Mining) (Hons) AMC Subconsultant Coal quality aspect.
165
For
per
sona
l use
onl
y

CoaErnst & Young Transaction Advisory Services Limited 217016
amcconsultants.com Appendix C 1
Appendix CSources of informationRio Tinto has provided AMC with information to prepare this report. The information was sourced from anelectronic data room and consisted of numerous spreadsheets, reports, data room notes, design files, andanimations. AMC also relied on information obtained from site visits, conversations with Rio Tinto personnel,and email correspondence.
AMC has not audited the information provided by Rio Tinto. AMC has, however, reviewed the information tothe extent necessary to satisfy itself that the Production Cases presented in this report are based onreasonable grounds and assumptions.
The principal sources of information used by AMC in the preparation of the report and for cross-checking ofdata are listed below. This list is not exhaustive.
Publicly available information
Australian Government, Bureau of Meteorology, Hunter Valley weather graphs.
spreadsheet.Rio Tinto ASX Release, Rio Tinto Agrees Sale of Coal & Allied, January 2017.Yancoal ASX Release, Acquisition of Coal & Allied from Rio Tinto, January 2017.Rio Tinto 2016 Annual Report dated 1 March 2017 and released on 2 March 2017.Rio Tinto press releases, public announcements, and other public filings by Rio Tinto available on Rio
website.
Non-public information provided by Rio TintoCombined operations
Coal & Allied Information Memorandum, February 2016.Rio Tinto Coal & Allied Management Presentation, June 2016.Coal & Allied Financial Model spreadsheet, February 2017.HVO MTW 16Q3 Annual Operating Plan Capital Expenditure Plan spreadsheet, April 2017.Coal & Allied 2016 Annual Operating Plan Presentation, October 2015.HVO MTW Forecast Rehabilitation and Closure Costs, April 2016.Data room note LOM Reports and Bidder Model Variance Analysis, March 2016.Data room note Hunter Valley Infrastructure Arrangements, March 2016.Data room note Consented Mining Rates at HVO & MTW, May 2016.HVO MTW Historical to Forecast Cost spreadsheet, April 2016.HVO and MTW Production by pit, undated.NSW shipping 2014-2015 spreadsheet, May 2016.Various spreadsheets and documents related to the 15Q3 LOM Plan, 16Q3 LOM plan, and 2014-2016historical costs and production.
HVORTCA HVO 2015 Competent Persons Report, February 2016.RTCA HVO 16Q3_LOM spreadsheet, April 2017.HVO 15Q3 LOM Report Final, February 2016.HVO 15Q3 LOM Final Xeras Inputs, undated.Reconciliation of HVO 15Q3 LOM and Bidder Model spreadsheet, March 2016.HVO Forecast 5 Year Capital Summary spreadsheet, April 2016.HVO Forecast Equipment Numbers, Age, purchases, April 2016.HVO 2016 ROM Breakdown spreadsheet, undated.
166
For
per
sona
l use
onl
y

Ernst & Young Transaction Advisory Services Limited 217016
amcconsultants.com Appendix C 2
HVO Closure Management Plan 2014, May 2015.HVO Annual Reconciliation Return, September 2015.HVON_database and HVOS_database spreadsheets, May 2013.HVO North and South resource model, survey, pit design, and Xeras model files.Coal & Allied Site Management Reports 2013-2016.Hunter Valley Loading Point Conveyors and equipment general layout, 24/06/03.Hunter Valley Operations Process Flow Diagrams, 05/12/2012.Hunter Valley Coal Preparation Plant Coal Handling and Preparation Plant General Layout,01/04/2003.CNA HVO Newdell CHP Conveyors.C&A Hunter Valley Operations Concept Phase Study Proposal, Recovery of Coal Ultra-Fines inHunter Valley CHPP, 14 October 2011.HVO 16Q3 Capital Expenditure.
MTWRTCA MTW 2015 Competent Persons Report, February 2016.RTCA MTW 16Q3_LOM spreadsheet, April 2017.MTW 15Q3 LOM Report, February 2016.MTW 15Q3 LOM Final Xeras Inputs, undated.Data room note MTW 15Q3 LOM Equipment Parameters and 2014 & 2015 Actuals, March 2016.MTW Forecast 5 Year Capital Summary spreadsheet, April 2016.MTW Forecast Equipment Numbers, Age, purchases, April 2016.MTW 2016 ROM Breakdown spreadsheet, undated.MTW Closure Management Plan 2014, May 2015.MTW Annual Reconciliation Return, September 2015.MTW_database spreadsheet, January 2013.MTW resource model, survey, pit design, and Xeras model files.MTW_LD_Cores (WT)-All_new spreadsheet, undated.Coal & Allied Site Management Reports 2013-2016.MTW Structural Integrity Inspection Report, 30 May 2016.Warkworth 16Q3 Capital Expenditure.Mount Thorley 16Q3 Capital Expenditure.
OaklandsRTCA The Coal Resources of the Oaklands Project, March 2013.Coal & Allied Information Memorandum Oakland Coal project, September 2011.Oaklands Coal Project Independent Technical Report, Xstract Mining Consultants Pty Ltd, July 2011.
UndergroundReport of Lower Hunter Underground Independent Technical Review, Palaris Mining Pty Ltd, June2013.Rio Tinto Underground Growth Projects Order of Magnitude Study, December 2010.MTW Underground Quickstart Order of Magnitude Study Report, December 2013.
167
For
per
sona
l use
onl
y
Coal & Allied Independent Technical SpecialisErnst & Young Transaction Advisory Services Limited 217016
amcconsultants.com
Our officesAustraliaAdelaideLevel 1, 4 Greenhill RoadWayville SA 5034 AustraliaT +61 8 8201 1800E [email protected]
BrisbaneLevel 21, 179 Turbot StreetBrisbane Qld 4000 AustraliaT +61 7 3230 9000E [email protected]
MelbourneLevel 19, 114 William StreetMelbourne Vic 3000 AustraliaT +61 3 8601 3300E [email protected]
PerthLevel 1, 1100 Hay StreetWest Perth WA 6005 AustraliaT +61 8 6330 1100E [email protected]
CanadaTorontoSuite 300, 90 Adelaide Street WestToronto, Ontario M5H 3V9 CanadaT +1 416 640 1212E [email protected]
VancouverSuite 202, 200 Granville StreetVancouver BC V6C 1S4 CanadaT +1 604 669 0044E [email protected]
Singapore United KingdomSingaporeRegistered Office16 Raffles Quay, #33-03 Hong Leong BuildingSingapore 048581T +65 8620 9268E [email protected]
MaidenheadRegistered in England and WalesCompany No. 3688365Level 7, Nicholsons HouseNicholsons Walk, MaidenheadBerkshire SL6 1LD United KingdomT +44 1628 778 256E [email protected] Office: Monument House,1st Floor, 215 Marsh Road, Pinner,Greater London, HA5 5NE, United Kingdom
168
For
per
sona
l use
onl
y

÷
Appendix J Coal & Allied General Purpose Financial Report
169
For
per
sona
l use
onl
y

Coal & Allied Industries Limited ABN 67 008 416 760
General purpose financial report 31 December 2016
170
For
per
sona
l use
onl
y
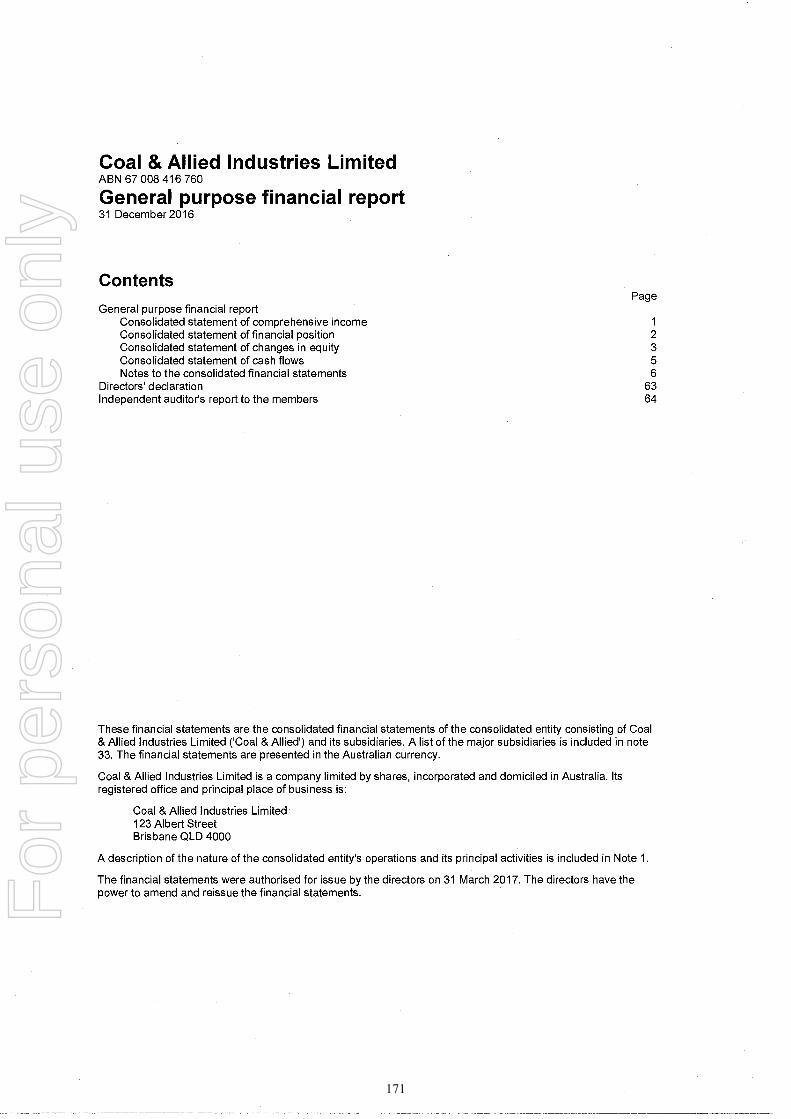
Coal & Allied Industries Limited ABN 67 008 416 760
General purpose financial report 31 December 2016
Contents Page
General purpose financial report Consolidated statement of comprehensive income 1 Consolidated statement of financial position 2 Consolidated statement of changes in equity 3 Consolidated statement of cash flows 5 Notes to the consolidated financial statements 6
Directors declaration 63 Independent auditor's report to the members 64
These financial statements are the consolidated financial statements of the consolidated entity consisting of Coal & Allied Industries Limited ('Coal & Allied') and its subsidiaries. A list of the major subsidiaries is included in note 33. The financial statements are presented in the Australian currency.
Coal & Allied Industries Limited is a company limited by shares, incorporated and domiciled in Australia. Its registered office and principal place of business is:
Coal & Allied Industries Limited 123 Albert Street Brisbane QLD 4000
A description of the nature of the consolidated entity's operations and its principal activities is included in Note 1.
The financial statements were authorised for issue by the directors on 31 March 2017. The directors have the power to amend and reissue the financial statements.
171
For
per
sona
l use
onl
y
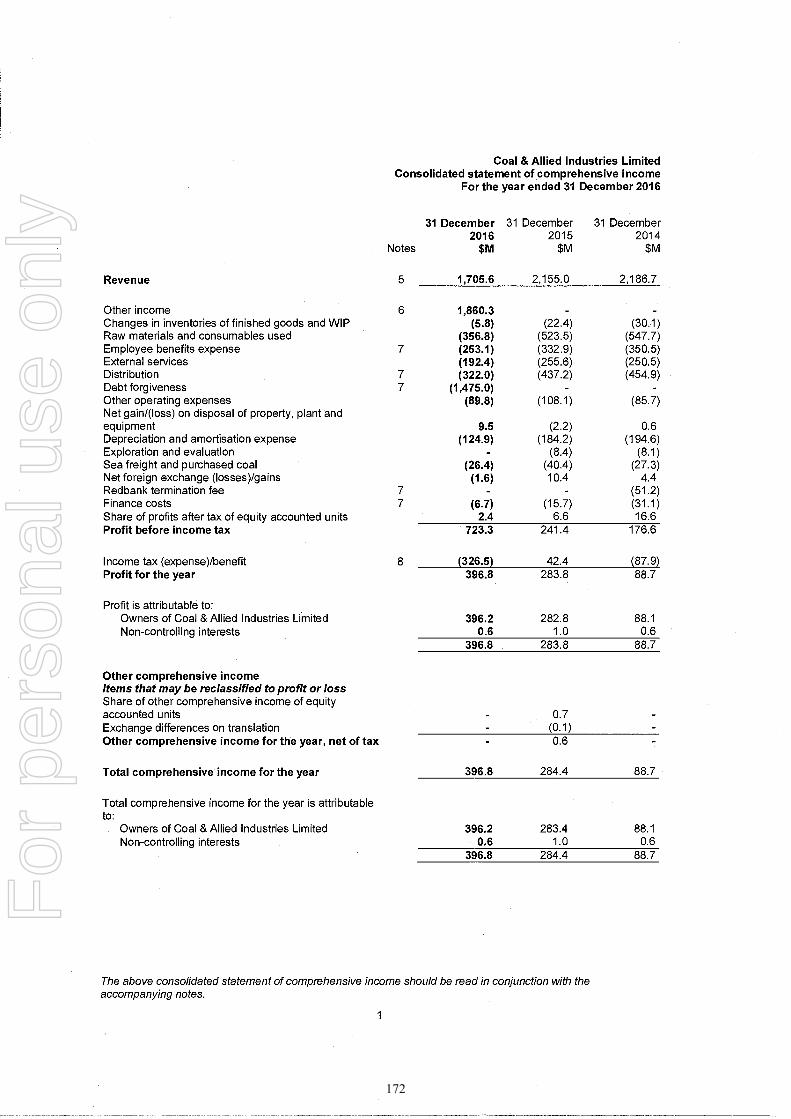
Coal & Allied Industries Limited Consolidated statement of comprehensive income
For the year ended 31 December 2016
Notes
31 December 2016
$M
31 December 2015
$M
31 December 2014
$M
Revenue 5 1,705.6 2,155.0 2,186.7
Other income 6 1,860.3 Changes in inventories of finished goods and WIP (5.8) (22.4) (30.1) Raw materials and consumables used (356.8) (523.5) (547.7) Employee benefits expense 7 (253.1) (332.9) (350.5) External services (192.4) (255.6) (250.5) Distribution 7 (322.0) (437.2) (454.9) Debt forgiveness 7 (1,475.0) - Other operating expenses (89.8) (108.1) (85.7) Net gain/(loss) on disposal of property, plant and equipment 9.5 (2.2) 0.6 Depreciation and amortisation expense (124.9) (184.2) (194.6) Exploration and evaluation - (8.4) (8.1) Sea freight and purchased coal (26.4) (40.4) (27.3) Net foreign exchange (losses)/gains (1.6) 10.4 4.4 Redbank termination fee 7 - _ (51.2) Finance costs 7 (6.7) (15.7) (31.1) Share of profits after tax of equity accounted units 2.4 6.6 16.6 Profit before income tax 723.3 241.4 176.6
Income tax (expense)/benefit 8 (326.5) 42.4 (87.9) Profit for the year 396.8 283.8 88.7
Profit is attributable to: Owners of Coal & Allied Industries Limited 396.2 282.8 88.1 Non-controlling interests 0.6 1.0 0.6
396.8 283.8 88.7
Other comprehensive income Items that may be reclassified to profit or loss Share of other comprehensive income of equity accounted units 0.7 Exchange differences on translation (0.1) Other comprehensive income for the year, net of tax 0.6
Total comprehensive income for the year 396.8 284.4 88.7
Total comprehensive income for the year is attributable to:
Owners of Coal & Allied Industries Limited 396.2 283.4 88.1 Non-controlling interests 0.6 1.0 0.6
396.8 284.4 88.7
The above consolidated statement of comprehensive income should be read in conjunction with the accompanying notes.
1
172
For
per
sona
l use
onl
y
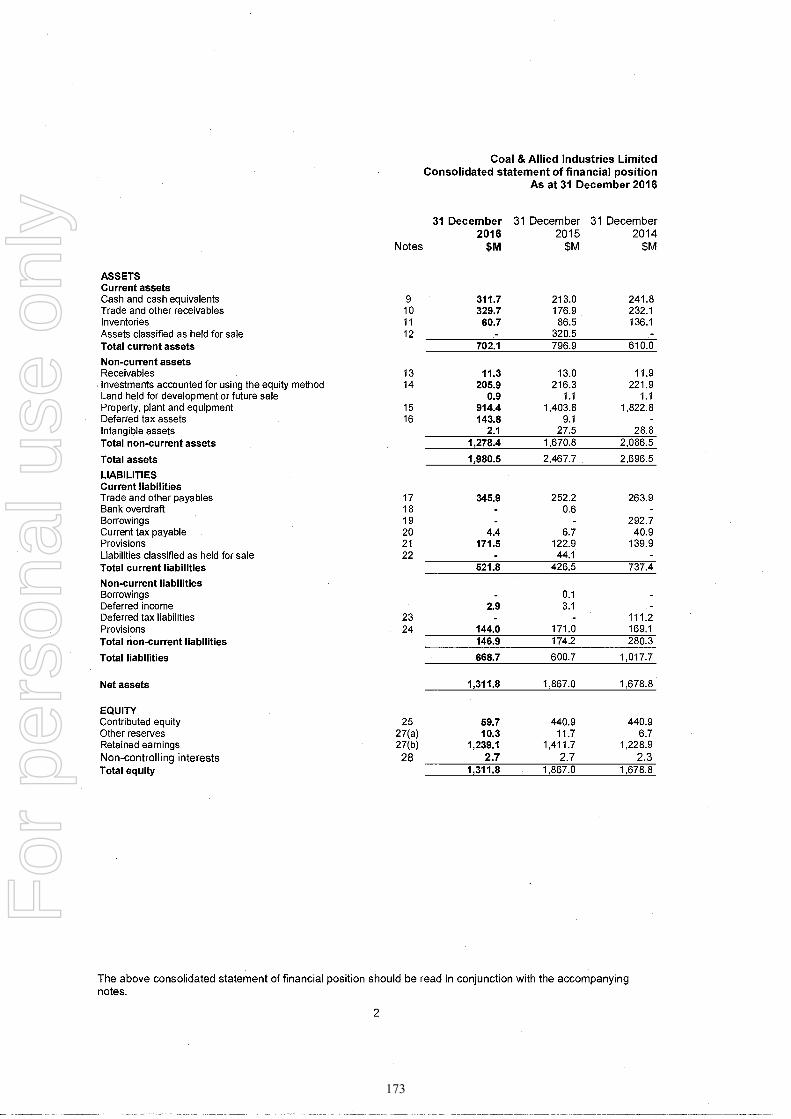
Coal & Allied Industries Limited Consolidated statement of financial position
As at 31 December 2016
ASSETS Current assets
Notes
31 December 2016
31 December 2015
$M
31 December 2014
$M
Cash and cash equivalents 9 311.7 213,0 241.8 Trade and other receivables 10 329.7 176.9 232.1 Inventories 11 60.7 86.5 136.1 Assets classified as held for sale 12 320.5 Total current assets 702.1 796.9 610.0
Non-current assets Receivables 13 11.3 13.0 11.9
. Investments accounted for using the equity method 14 205.9 216.3 221.9 Land held for development or future sale 0.9 1.1 1.1 Property, plant and equipment 15 914.4 1,403.8 1,822.8 Deferred tax assets 16 143.8 9.1 Intangible assets 2.1 27.5 28.8 Total non-current assets 1,278.4 1,670.8 2,086.5
Total assets 1,980.5 2,467.7 2,696.5
LIABILITIES Current liabilities Trade and other payables 17 345.9 252.2 263.9 Bank overdraft 18 - 0.6 - Borrowings 19 - 292.7 Current tax payable 20 4.4 6.7 40.9 Provisions 21 171.5 122.9 139.9 Liabilities classified as held for sale 22 - 44.1 - Total current liabilities 521.8 426.5 737.4
Non-current liabilities Borrowings - 0.1 - Deferred income 2.9 3.1 - Deferred tax liabilities 23 _ 111.2 Provisions 24 144.0 171.0 169.1 Total non-current liabilities 146.9 174.2 280.3
Total liabilities 668.7 600.7 1,017.7
Net assets 1,311.8 1,867.0 1,678.8
EQUITY Contributed equity 25 59.7 440.9 440.9 Other reserves 27(a) 10.3 11.7 6.7 Retained earnings 27(b) 1,239.1 1,411.7 1,228.9 Non-controlling interests 28 2.7 2.7 2.3 Total equity 1,311.8 1,867.0 1,678.8
The above consolidated statement of financial position should be read in conjunction with the accompanying notes.
2
173
For
per
sona
l use
onl
y

Coal & Allied Industries Limited Consolidated statement of changes in equity
For the year ended 31 December 2016
Attributable to owners of Coal & Allied Industries Limited
Notes
Contributed Other Retained
equity reserves earnings
$M $M $M Total
$M
Non-controlling
interests $M
Total equity
$M
Balance at 1 January 2014 440.9 3.7 1,140.8 1,585.4 2.3 1,587.7
Profit for the year 88.1 88.1 0.6 88.7 Other comprehensive income - - - Total comprehensive income for the year 88.1 88.1 0.6 88.7
Transactions with owners in their capacity as owners: Dividends paid 26 (0.6) (0.6) Employee share schemes 3.0 3.0 3.0
3.0 3.0 (0.6) 2.4
Balance at 31 December 2014 440.9 6.7 1,228.9 1,676.5 2.3 1,678.8
Attributable to owners of Coal & Allied Industries Limited
Contributed Other Retained Non-
controlling Total equity reserves earnings Total interests equity
Notes $M $M $M $M $M $M
Balance at 1 January 2015 440.9 6.7 1,228.9 1,676.5 2.3 1,678.8
Profit for the year 282.8 282.8 1.0 283.8 Other comprehensive income 0.6 0.6 0.6 Total comprehensive income for the year 0.6 282.8 283.4 1.0 284.4
Transactions with owners in their capacity as owners: Dividends paid 26 (100.0) (100.0) (0.6) (100.6) Employee share schemes 4.4 4.4 4.4
4.4 (100.0) (95.6) (0.6) (96.2)
Balance at 31 December 2015 440.9 11.7 1,411.7 1,864.3 2.7 1,867.0
The above consolidated statement of changes in equity should be read in conjunction with the accompanying notes.
3
174
For
per
sona
l use
onl
y
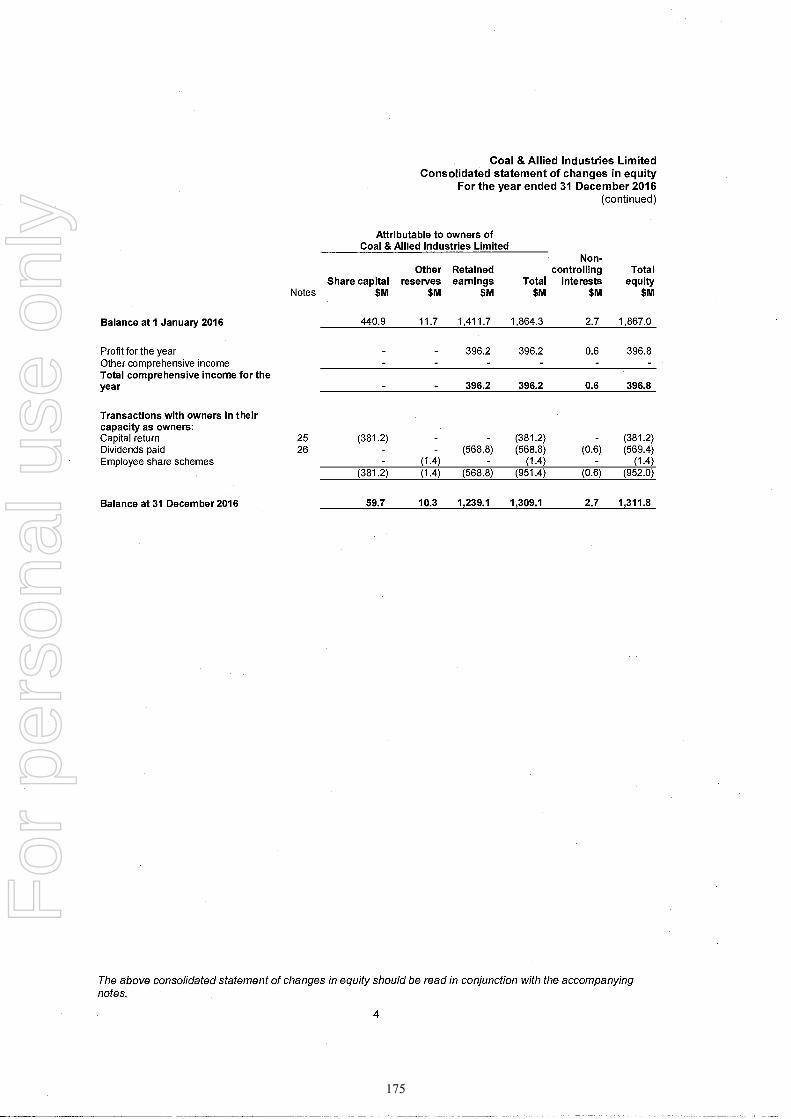
Coal & Allied Industries Limited Consolidated statement of changes in equity
For the year ended 31 December 2016 (continued)
Attributable to owners of Coal & Allied Industries Limited
Notes Share capital
$M
Other reserves
$M
Retained earnings
$M Total
$M
Non-controlling
interests $M
Total equity
$M
Balance at 1 January 2016 440.9 11.7 1,411.7 1,864.3 2.7 1,867.0
Profit for the year 396.2 396.2 0.6 396.8 Other comprehensive income - - Total comprehensive income for the year 396.2 396.2 0.6 396.8
Transactions with owners in their capacity as owners: Capital return 25 (381.2) - (381.2) - (381.2) Dividends paid 26 - - (568.8) (568.8) (0.6) (569.4) Employee share schemes - (1.4) - (1.4) - (1.4)
(381.2) (1.4) (568.8) (951.4) (0.6) (952.0)
Balance at 31 December 2016 59.7 10.3 1,239.1 1,309.1 2.7 1,311.8
The above consolidated statement of changes in equity should be read in conjunction with the accompanying notes.
4
175
For
per
sona
l use
onl
y

Coal & Allied Industries Limited Consolidated statement of cash flows For the year ended 31 December 2016
Cash flows from operating activities
Notes
31 December 2016
$M
31 December 2015
$M
31 December 2014
$M
Receipts from customers 1,555.2 2,175.0 2,239.3 Payments to suppliers and employees (1,121.8) (1,642.4) (1,837.4)
433.4 532.6 401.9 Interest paid - (7.9) (21.1) Income taxes paid (11.7) (110.2) (63.4) Tax paid to tax consolidated group head entity (439.5) - - Dividends received 13.0 12.2 12.4 Interest received 17.5 5.5 5.3 Net cash inflow from operating activities 34 12.7 432.2 335.1
Cash flows from investing activities Payments for property, plant and equipment 15 (40.7) (63.6) (79.2) Payments for exploration (8.4) (8.1) Proceeds from sale of property, plant and equipment 9.0 4.1 2.0 Proceeds from divestments, net of cash divested 6 1,069.0 - - Net cash inflow/(outflow) from investing activities 1,037.3 (67.9) (85.3)
Cash flows from financing activities Dividends paid to non-controlling interest (0.6) (0.6) (0.6) Dividends paid (568.8) (100.0) Capital return (381.2) - - Repayment of loan facilities (0.1) (292.7) (301.0) Repayment of advances from related entities (0.4) (0.2) Net cash outflow from financing activities (950.7) (393.7) (301.8)
Net increase/(decrease) in cash and cash equivalents 99.3 (29.4) (52.0) Cash and cash equivalents at the beginning of the year 212.4 241.8 293.8 Cash and cash equivalents at end of year 9 311.7 212.4 241.8
The above consolidated statement of cash flows should be read in conjunction with the accompanying notes.
5
176
For
per
sona
l use
onl
y
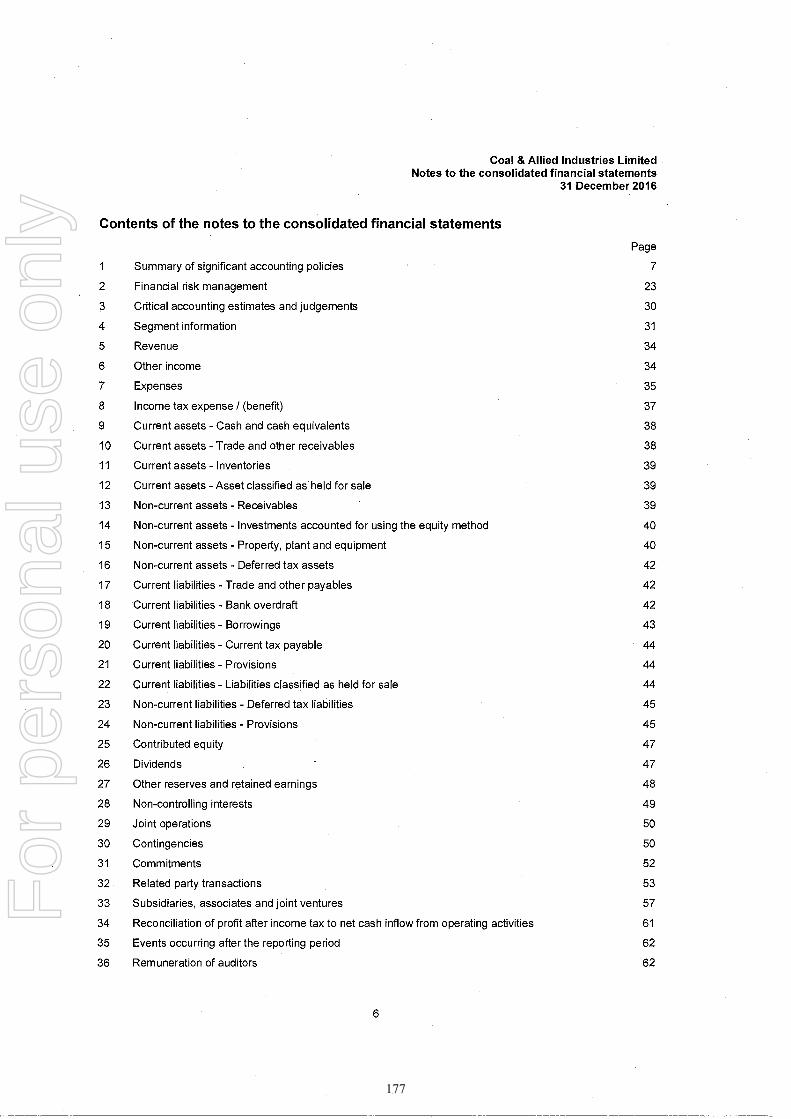
Coal & Allied Industries Limited Notes to the consolidated financial statements
Contents of the notes to the consolidated financial statements
31 December 2016
Page
1 Summary of significant accounting policies 7
2 Financial risk management 23
3 Critical accounting estimates and judgements 30
4 Segment information 31
5 Revenue 34
6 Other income 34
7 Expenses 35
8 Income tax expense / (benefit) 37
9 Current assets - Cash and cash equivalents 38
10 Current assets - Trade and other receivables 38
11 Current assets - Inventories 39
12 Current assets - Asset classified as held for sale 39
13 Non-current assets - Receivables 39
14 Non-current assets - Investments accounted for using the equity method 40
15 Non-current assets - Property, plant and equipment 40
16 Non-current assets - Deferred tax assets 42
17 Current liabilities - Trade and other payables 42
18 Current liabilities - Bank overdraft 42
19 Current liabilities - Borrowings 43
20 Current liabilities - Current tax payable 44
21 Current liabilities - Provisions 44
22 Current liabilities - Liabilities classified as held for sale 44
23 Non-current liabilities - Deferred tax liabilities 45
24 Non-current liabilities - Provisions 45
25 Contributed equity 47
26 Dividends 47
27 Other reserves and retained earnings 48
28 Non-controlling interests 49
29 Joint operations 50
30 Contingencies 50
31 Commitments 52
32 Related party transactions 53
33 Subsidiaries, associates and joint ventures 57
34 Reconciliation of profit after income tax to net cash inflow from operating activities 61
35 Events occurring after the reporting period 62
36 Remuneration of auditors 62
6
177
For
per
sona
l use
onl
y
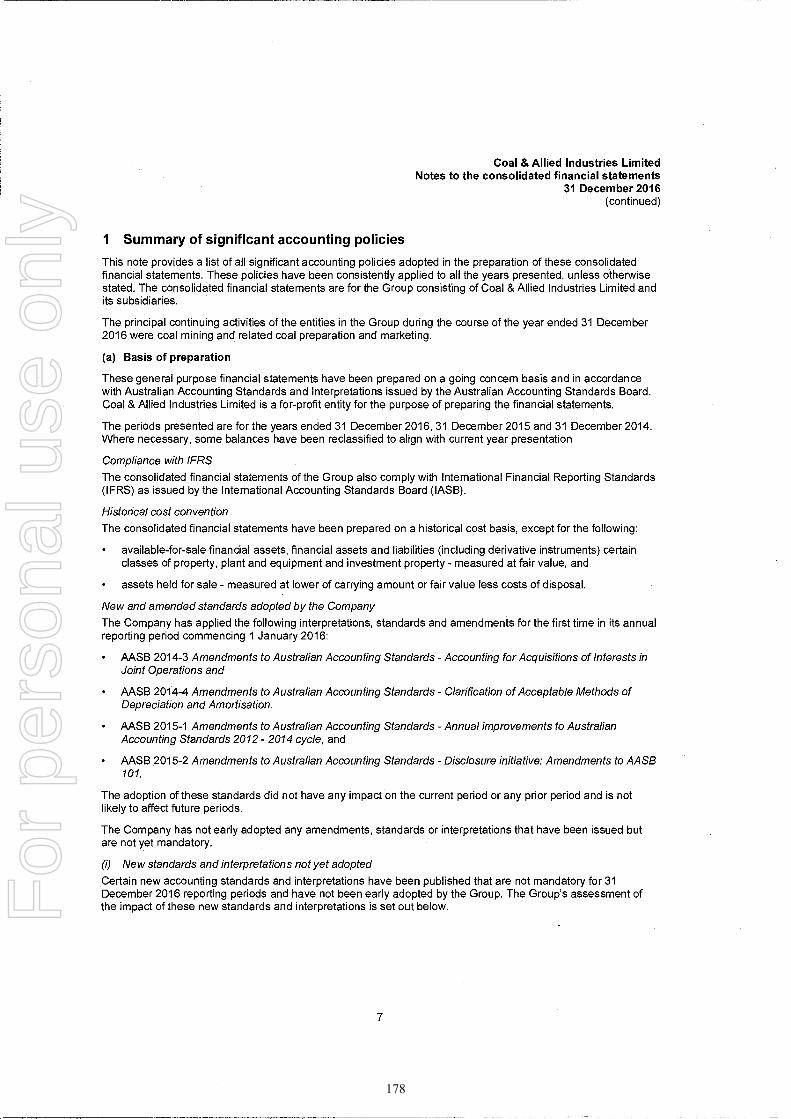
Coal & Allied Industries Limited Notes to the consolidated financial statements
31 December 2016 (continued)
1 Summary of significant accounting policies
This note provides a list of all significant accounting policies adopted in the preparation of these consolidated financial statements. These policies have been consistently applied to all the years presented, unless otherwise stated. The consolidated financial statements are for the Group consisting of Coal & Allied Industries Limited and its subsidiaries.
The principal continuing activities of the entities in the Group during the course of the year ended 31 December 2016 were coal mining and related coal preparation and marketing.
(a) Basis of preparation
These general purpose financial statements have been prepared on a going concern basis and in accordance with Australian Accounting Standards and Interpretations issued by the Australian Accounting Standards Board. Coal & Allied Industries Limited is a for-profit entity for the purpose of preparing the financial statements.
The periods presented are for the years ended 31 December 2016, 31 December 2015 and 31 December 2014. Where necessary, some balances have been reclassified to align with current year presentation
Compliance with IFRS
The consolidated financial statements of the Group also comply with International Financial Reporting Standards (IFRS) as issued by the International Accounting Standards Board (IASB).
Historical cost convention
The consolidated financial statements have been prepared on a historical cost basis, except for the following:
• available-for-sale financial assets, financial assets and liabilities (including derivative instruments) certain classes of property, plant and equipment and investment property - measured at fair value, and
• assets held for sale - measured at lower of carrying amount or fair value less costs of disposal.
New and amended standards adopted by the Company
The Company has applied the following interpretations, standards and amendments for the first time in its annual reporting period commencing 1 January 2016:
• AASB 2014-3 Amendments to Australian Accounting Standards - Accounting for Acquisitions of Interests in Joint Operations and
• AASB 2014-4 Amendments to Australian Accounting Standards - Clarification of Acceptable Methods of Depreciation and Amortisation.
• AASB 2015-1 Amendments to Australian Accounting Standards - Annual improvements to Australian Accounting Standards 2012 - 2014 cycle, and
• AASB 2015-2 Amendments to Australian Accounting Standards - Disclosure initiative: Amendments to AASB 101.
The adoption of these standards did not have any impact on the current period or any prior period and is not likely to affect future periods.
The Company has not early adopted any amendments, standards or interpretations that have been issued but are not yet mandatory.
(i) New standards and interpretations not yet adopted
Certain new accounting standards and interpretations have been published that are not mandatory for 31 December 2016 reporting periods and have not been early adopted by the Group. The Group's assessment of the impact of these new standards and interpretations is set out below.
7
178
For
per
sona
l use
onl
y
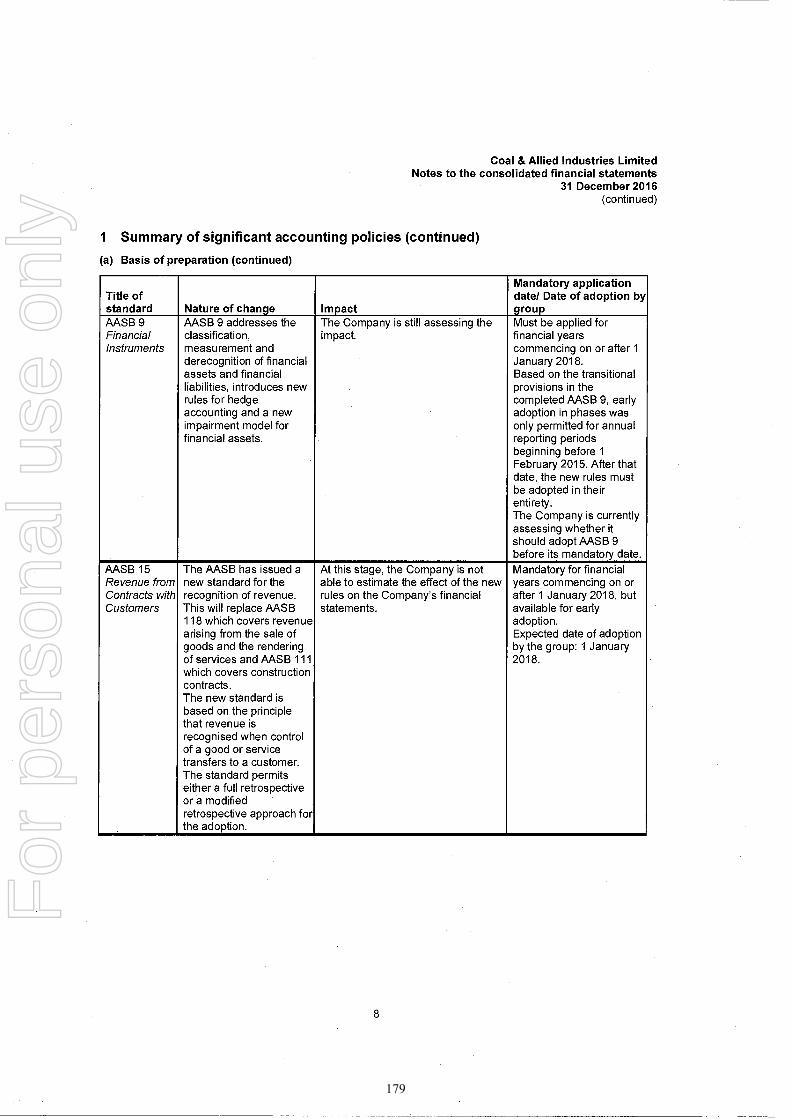
Coal & Allied Industries Limited Notes to the consolidated financial statements
31 December 2016 (continued)
1 Summary of significant accounting policies (continued)
(a) Basis of preparation (continued)
Title of standard Nature of change Impact
Mandatory application date/ Date of adoption by group
AASB 9 AASB 9 addresses the The Company is still assessing the Must be applied for Financial Instruments
classification, measurement and derecognition of financial assets and financial liabilities, introduces new rules for hedge accounting and a new impairment model for financial assets.
impact. financial years commencing on or after 1 January 2018. Based on the transitional provisions in the completed AASB 9, early adoption in phases was only permitted for annual reporting periods beginning before 1 February 2015. After that date, the new rules must be adopted in their entirety. The Company is currently assessing whether it should adopt AASB 9 before its mandatory date.
AASB 15 The AASB has issued a At this stage, the Company is not Mandatory for financial Revenue from new standard for the able to estimate the effect of the new years commencing on or Contracts with recognition of revenue, rules on the Company's financial after 1 January 2018, but Customers This will replace AASB
118 which covers revenue arising from the sale of goods and the rendering of services and AASB 111 which covers construction contracts.
statements. available for early adoption. Expected date of adoption by the group: 1 January 2018.
The new standard is based on the principle that revenue is recognised when control of a good or service transfers to a customer. The standard permits either a full retrospective or a modified retrospective approach for the adoption.
8
179
For
per
sona
l use
onl
y
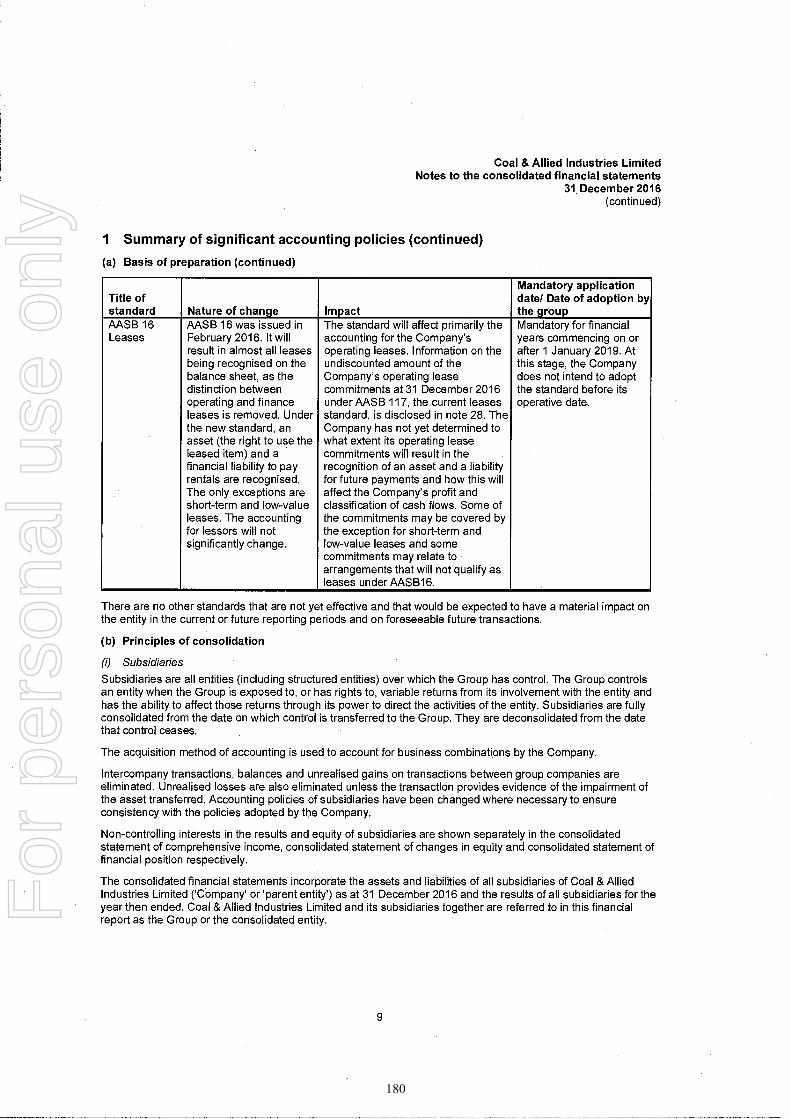
Coal & Allied Industries Limited Notes to the consolidated financial statements
31 December 2016 (continued)
1 Summary of significant accounting policies (continued)
(a) Basis of preparation (continued)
Title of standard Nature of change Impact
Mandatory application date/ Date of adoption by the group
AASB 16 AASB 16 was issued in The standard will affect primarily the Mandatory for financial Leases February 2016. It will accounting for the Company's years commencing on or
result in almost all leases operating leases. Information on the after 1 January 2019. At being recognised on the undiscounted amount of the this stage, the Company balance sheet, as the Company's operating lease does not intend to adopt distinction between commitments at 31 December 2016 the standard before its operating and finance leases is removed. Under the new standard, an asset (the right to use the leased item) and a financial liability to pay rentals are recognised, The only exceptions are short-term and low-value leases. The accounting for lessors will not significantly change.
under AASB 117, the current leases standard, is disclosed in note 28. The Company has not yet determined to what extent its operating lease commitments will result in the recognition of an asset and a liability for future payments and how this will affect the Company's profit and classification of cash flows. Some of the commitments may be covered by the exception for short-term and low-value leases and some commitments may relate to arrangements that will not qualify as leases under AASB16.
operative date.
There are no other standards that are not yet effective and that would be expected to have a material impact on the entity in the current or future reporting periods and on foreseeable future transactions.
(b) Principles of consolidation
(i) Subsidiaries
Subsidiaries are all entities (including structured entities) over which the Group has control. The Group controls an entity when the Group is exposed to, or has rights to, variable returns from its involvement with the entity and has the ability to affect those returns through its power to direct the activities of the entity. Subsidiaries are fully consolidated from the date on which control is transferred to the Group. They are deconsolidated from the date that control ceases.
The acquisition method of accounting is used to account for business combinations by the Company.
Intercompany transactions, balances and unrealised gains on transactions between group companies are eliminated. Unrealised losses are also eliminated unless the transaction provides evidence of the impairment of the asset transferred. Accounting policies of subsidiaries have been changed where necessary to ensure consistency with the policies adopted by the Company.
Non-controlling interests in the results and equity of subsidiaries are shown separately in the consolidated statement of comprehensive income, consolidated statement of changes in equity and consolidated statement of financial position respectively.
The consolidated financial statements incorporate the assets and liabilities of all subsidiaries of Coal & Allied Industries Limited ('Company' or 'parent entity') as at 31 December 2016 and the results of all subsidiaries for the year then ended. Coal & Allied Industries Limited and its subsidiaries together are referred to in this financial report as the Group or the consolidated entity.
9
180
For
per
sona
l use
onl
y

Coal & Allied Industries Limited Notes to the consolidated financial statements
31 December 2016 (continued)
1 Summary of significant accounting policies (continued)
(b) Principles of consolidation (continued)
(ii) Joint arrangements
Under AASB 11 Joint Arrangements investments in joint arrangements are classified as either joint operations or joint ventures. The classification depends on the contractual rights and obligations of each investor, rather than the legal structure of the joint arrangement. Coal & Allied Industries Limited has both joint operations and joint ventures.
Joint operations Coal & Allied Industries Limited has recognised its direct right to, and its share of jointly held assets, liabilities, revenues and expenses of joint operations. These have been incorporated in the financial statements under the appropriate headings. Details of the joint operation are set out in Note 29.
Joint ventures
Interests in joint ventures are accounted for using the equity method, after initially being recognised at cost in the consolidated statement of financial position.
When the Group's share of losses in a joint venture equals or exceeds its interests in the joint ventures (which includes any long-term interests that, in substance, form part of the Group's net investment in the joint ventures), the Group does not recognise further losses, unless it has incurred obligations or made payments on behalf of the joint ventures.
Unrealised gains on transactions between the Group and its joint ventures are eliminated to the extent of the Group's interest in the joint ventures. Unrealised losses are also eliminated unless the transaction provides evidence of an impairment of the asset transferred. Accounting policies of the joint ventures have been changed where necessary, to ensure consistency with the policies adopted by the Group.
(c) Foreign currency translation
Functional and presentation currency
Items included in the financial statements of the Company are measured using the currency of the primary economic environment in which the Company operates ('the functional currency'). The consolidated financial statements are presented in Australian dollars, which is Coal & Allied Industries Limited's functional and presentation currency.
Transactions and balances
Foreign currency transactions are translated into the functional currency using the exchange rates prevailing at the dates of the transactions. Foreign exchange gains and losses resulting from the settlement of such transactions and from the translation at year end exchange rates of monetary assets and liabilities denominated in foreign currencies are recognised in the consolidated statement of comprehensive income. They are deferred in equity if they relate to qualifying cash flow hedges and qualifying net investment hedges or are attributable to part of the investment in a foreign operation.
Foreign exchange gains and losses that relate to borrowings are presented in the consolidated statement of comprehensive income, within finance costs. All other foreign exchange gains and losses are presented in the consolidated statement of comprehensive income on a net basis within other income or other expenses.
Non-monetary items that are measured at fair value in a foreign currency are translated using the exchange rates at the date when the fair value was determined. Translation differences on assets and liabilities carried at fair value are reported as part of the fair value gain or loss. For example, translation differences on non-monetary assets and liabilities such as equities held at fair value through profit or loss are recognised in the consolidated statement of comprehensive income as part of the fair value gain or loss and translation differences on non-monetary assets such as equities classified as available-for-sale financial assets are recognised in other comprehensive income.
10
181
For
per
sona
l use
onl
y
Coal & Allied Industries Limited Notes to the consolidated financial statements
31 December 2016 (continued)
1 Summary of significant accounting policies (continued)
(d) Revenue recognition
Revenue is measured at the fair value of the consideration received or receivable. Amounts disclosed as revenue are net of returns, trade allowances, rebates and amounts collected on behalf of third parties.
The Company recognises revenue when the amount of revenue can be reliably measured, it is probable that future economic benefits will flow to the entity and specific criteria have been met for each of the Company's activities as described below. The Company bases its estimates on historical results, taking into consideration the type of customer, the type of transaction and the specifics of each arrangement.
Interest income
Interest income is recognised on a time proportionate basis using the effective interest method.
Dividend Income Dividends are recognised as revenue when the right to receive payment is established.
Management Fees and other recoveries
Management fees are charges to related parties for corporate services, global business services, people and organisational support, and technology and innovation. Recoveries comprise charges to related and external parties for the rendering of administration and general services.
Coal sales
Revenue comprises sales to third parties at invoiced amounts, with most sales being priced ex works, free on board (f.o.b.) or cartage, insurance and freight (c.i.f.). Amounts billed to customers in respect of shipping and handling are classed as revenue where the Company is responsible for carriage, insurance and freight. All shipping and handling costs incurred by the Company are recognised as operating costs. Revenue from continuing operations shown in the consolidated statement of comprehensive income includes the Company's share of revenue of joint operations.
Revenue is recognised on individual sales when persuasive evidence exists indicating that all the following criteria are met:
• the significant risks and rewards of ownership of the product have been transferred to the buyer; • neither continuing managerial involvement to the degree usually associated with ownership nor effective
control over the goods sold has been retained; • the amount of revenue can be measured reliably; • it is probable that the economic benefits associated with the sale will flow to the Company; and • the costs incurred or to be incurred in respect of the sale can be measured reliably.
These conditions are generally satisfied when title passes to the customer. In most instances revenue is recognised when the product is delivered to the destination specified by the customer, which is typically the vessel on which it will be shipped, the destination port or the customer's premises.
In some circumstances the terms of executed sales agreements allow for an adjustment to the sales price based on the global COAL index. These adjustments are settled quarterly in arrears. Revenue on such provisionally priced sales is initially recognised at estimated fair value of the total consideration to be received. The fair value of the final sales price adjustment is continually re-estimated and measured with reference to the global COAL index. The associated fair value movement is recognised as an adjustment to sales revenue.
(e) Borrowings
Borrowings are initially recognised at fair value, net of transaction costs incurred. Borrowings are subsequently measured at amortised cost. Any difference between the proceeds (net of transaction costs) and the redemption amount is recognised in profit or loss over the period of the borrowings using the effective interest method.
11
182
For
per
sona
l use
onl
y
Coal & Allied Industries Limited Notes to the consolidated financial statements
31 December 2016 (continued)
I Summary of significant accounting policies (continued)
(e) Borrowings (continued)
Fees paid on the establishment of loan facilities, which are not an incremental cost relating to the actual draw-down of the facility, are recognised as prepayments and amortised on a straight line basis over the term of the facility.
Borrowings are removed from the balance sheet when the obligation specified in the contract is discharged, cancelled or expired. The difference between the carrying amount of a financial liability that has been extinguished or transferred to another party and the consideration paid, including any non-cash assets transferred or liabilities assumed, is recognised in profit or loss as other income or finance costs.
Borrowings are classified as current liabilities unless the Company has an unconditional right to defer settlement of the liability for at least 12 months after the reporting period.
(f) Borrowing costs
Borrowing costs incurred for the construction of any qualifying assets are classified during the period of time that is required to complete and prepare the assets for its intended use or sale. Other borrowing costs are expensed.
Borrowing costs (or "finance costs") are recognised as expenses in the period in which they are incurred, except where they are included in the cost of qualifying assets. Borrowing costs include interest on bank overdrafts and short term and long term borrowings, and certain exchange differences arising from foreign currency borrowings.
(g) Exploration and evaluation expenditure
Exploration and evaluation expenditure comprises costs which are directly attributable to:
• researching and analysing existing exploration data; • conducting geological studies, exploratory drilling and sampling; • examining and testing extraction and treatment methods; and • compiling pre-feasibility and feasibility studies.
Exploration and evaluation expenditure also includes the costs incurred in acquiring mineral rights, the entry premiums paid to gain access to areas of interest and amounts payable to third parties to acquire interests in existing projects.
Capitalisation of exploration expenditure commences when there is a high degree of confidence in the project's viability and hence it is probable that future economic benefits associated with that area of interest will flow to the Company.
Capitalised exploration and evaluation expenditure is reviewed for impairment at each reporting date. Subsequent recovery of the resulting carrying value depends on successful development of the area of interest or sale of the project. If a project does not prove viable, all irrecoverable costs associated with the project and any related impairment provisions are written off. If the project proceeds to development, the amounts included within intangible assets are transferred to property, plant and equipment.
(h) Cash and cash equivalents
Cash and cash equivalents includes cash on hand, deposits held at call with financial institutions and with Rio Tinto Finance Limited, other short-term, highly liquid investments that are readily convertible to known amounts of cash and which are subject to an insignificant risk of changes in value, bank overdrafts and amounts payable to Rio Tinto Finance Limited. Bank overdrafts and amounts owing to Rio Tinto Finance Limited are disclosed within current liabilities on the consolidated statement of financial position.
For the purposes of the consolidated statement of cash flows, movements in the Rio Tinto Finance Limited payable or receivable balance have been accounted for as cash movements.
(i) Assets and liabilities held for sale
Individual non-current assets or "disposal groups" (i.e. groups of assets and liabilities) to be disposed of, by sale or otherwise in a single transaction, are classified as "held for sale" if the following criteria are met at period end:
12
183
For
per
sona
l use
onl
y
Coal & Allied Industries Limited Notes to the consolidated financial statements
31 December 2016 (continued)
1 Summary of significant accounting policies (continued)
(i) Assets and liabilities held for sale (continued)
• the carrying amount will be recovered principally through a sale transaction rather than through continuing use; and
• the disposal group is available for immediate sale in its present condition subject only to terms that are usual and customary for such sales; and
• the sale is highly probable.
Disposal groups held for sale are carried at the lower of their carrying amount and fair value less costs to sell. The comparative balance sheet is not restated.
Disposal groups acquired with a view to resale are held at the fair value determined at the acquisition date. For these assets acquired for resale no profits or losses are recognised between the acquisition date and the disposal date, unless there is a subsequent impairment.
On classification as held for sale, the assets are no longer depreciated.
If control is lost, any interest in the entity retained by the Group is remeasured to its fair value and the change in carrying amount is recognised in the consolidated statement of comprehensive income. The retained interest may be subsequently accounted for as a joint venture, joint operation, associate or financial asset depending on the facts. Any amounts previously recognised in other comprehensive income in respect of the entity disposed of, or for which control, joint control or significant influence has ceased, may be recycled to the consolidated statement of comprehensive income in proportion to the interest disposed of. The cash proceeds of disposals are included within "Investing activities" in the consolidated cash flow statement.
Gains or losses on disposals to non-controlling interests where control is retained are recorded in equity. The cash proceeds of such disposals are included within "Financing activities" in the consolidated cash flow statement.
(j) Contributed equity
Ordinary shares are classified as equity.
Incremental costs directly attributable to the issue of new shares or options are shown in equity as a deduction, net of tax, from the proceeds.
(k) Dividends
Provision is made for the amount of any dividend declared, being appropriately authorised and no longer at the discretion of the entity, on or before the end of the financial year but not distributed at the end of the reporting period.
(I) Goods and Services Tax (GST)
Revenue, expenses and assets are recognised net of the amount of GST, except:
• where the amount of GST incurred is not recoverable from the taxation authority, it is recognised as part of the cost of acquisition of an asset or as part of an item of expense; or
• for receivables and payables which are recognised inclusive of GST.
The net amount of GST recoverable from, or payable to, the taxation authority is included as part of receivables or payables.
Cash flows are presented on a gross basis. The GST components of cash flows arising from investing or financing activities which are recoverable from, or payable to the taxation authority, are presented as operating cash flows.
13
184
For
per
sona
l use
onl
y
Coal & Allied Industries Limited Notes to the consolidated financial statements
31 December 2016 (continued)
1 Summary of significant accounting policies (continued)
(m) Income tax
The income tax expense or benefit for the period is the tax payable or receivable on the current period's taxable income based on the applicable income tax rate for each jurisdiction adjusted by changes in deferred tax assets and liabilities attributable to temporary differences and to unused tax losses.
The current income tax charge is calculated on the basis of the tax laws enacted or substantively enacted at the end of the reporting period. Management periodically evaluates positions taken in tax returns with respect to situations in which applicable tax regulation is subject to interpretation. It establishes provisions where appropriate on the basis of amounts expected to be paid to the tax authorities.
Deferred income tax is provided in full, using the liability method, on temporary differences arising between the tax bases of assets and liabilities and their carrying amounts in the financial statements. However, deferred tax liabilities are not recognised if they arise from the initial recognition of goodwill. Deferred income tax is also not accounted if it arises from initial recognition of an asset or liability in a transaction other than a business combination that at the time of the transaction affects neither accounting nor taxable profit or loss. Deferred income tax is determined using tax rates (and laws) that have been enacted or substantially enacted by the end of the reporting date and are expected to apply when the related deferred income tax asset is realised or the deferred income tax liability is settled.
Deferred tax assets are recognised for deductible temporary differences and unused tax losses only if it is probable that future taxable amounts will be available to utilise those temporary differences and losses.
Deferred tax liabilities and assets are not recognised for temporary differences between the carrying amount and tax bases of investments in foreign operations where the Company is able to control the timing of the reversal of the temporary differences and it is probable that the differences will not reverse in the foreseeable future.
Deferred tax assets and liabilities are offset where there is a legally enforceable right to offset current tax assets and liabilities and when the deferred tax balances relate to the same taxation authority. Current tax assets and liabilities are offset where the entity has a legally enforceable right to offset and intends to settle on a net basis, or to realise the asset and settle the liability simultaneously.
Current and deferred tax is recognised in profit or loss, except to the extent that it relates to items recognised in other comprehensive income or directly in equity. In this case, the tax is also recognised in other comprehensive income or directly in equity, respectively.
(n) Tax consolidation
The Company became a member of the tax consolidated group on 2 February 2016, of which Rio Tinto Limited is the head entity.
Prior to joining the Rio Tinto Limited tax consolidated group in 2016, Coal & Allied and its wholly owned Australian controlled entities formed a separate group. Coal & Allied was the head entity and implemented the same structure as below.
The head entity, Rio Tinto Limited, and the controlled entities in the tax consolidated group account for their own current and deferred tax amounts. These tax amounts are measured as if each entity in the tax consolidated group continues to be a stand alone taxpayer in its own right.
The Company has entered into a tax sharing and funding agreement with the head entity of the tax consolidated group, Rio Tinto Limited, in relation to their participation in the tax consolidation regime. Under the terms of this agreement, the subsidiary entities in the tax consolidated group have agreed to pay a tax equivalent payment to or from the head entity, based on the current tax liability or current tax asset of the entity. The reimbursements are payable at the same time as the associated income tax liability falls due and have therefore been recognised as a "current intercompany payable/receivable in respect of tax" by the Company.
(o) Investments and other financial assets
Classification
14
185
For
per
sona
l use
onl
y

Coal & Allied Industries Limited Notes to the consolidated financial statements
31 December 2016 (continued)
1 Summary of significant accounting policies (continued)
(o) Investments and other financial assets (continued)
The Company classifies its financial assets in the following categories:
• financial assets at fair value through profit or loss,
• loans and receivables,
• held-to-maturity investments, and
• available-for-sale financial assets.
The classification depends on the purpose for which the investments were acquired. Management determines the classification of its investments at initial recognition and, in the case of assets classified as held-to-maturity, re-evaluates this designation at the end of each reporting period.
Financial assets at fair value through profit or loss The Company classifies financial assets at fair value through profit or loss if they are acquired principally for the purpose of selling in the short term, ie are held for trading. They are presented as current assets if they are expected to be sold within 12 months after the end of the reporting period; otherwise they are classified as non-current assets. The Company has not elected to designate any financial assets at fair value through profit or loss.
Loans and receivables
Trade receivables are amounts due from customers for goods sold or services performed in the ordinary course of business. Loans and receivables are non-derivative financial assets with fixed or determinable payments that are not quoted in an active market. If collection of the amounts is expected in one year or less they are classified as current assets. If not, they are presented as non-current assets. Trade receivables are generally due for settlement within 30 days and therefore are all classified as current.
Held-to-maturity investments
The Company classifies investments as held-to-maturity if:
• they are non-derivative financial assets,
• they are quoted in an active market,
• they have fixed or determinable payments and fixed maturities, and
• the Company intends to, and is able to, hold them to maturity.
Held-to-maturity financial assets are included in non-current assets, except for those with maturities less than 12 months from the end of the reporting period, which would be classified as current assets.
Available-for-sale financial assets
Investments are designated as available-for-sale financial assets if they do not have fixed maturities and fixed or determinable payments and management intends to hold them for the medium to long-term. Financial assets that are not classified into any of the other categories (at FVTPL, loans and receivables or held-to-maturity investments) are also included in the available-for-sale category.
The financial assets are presented as non-current assets unless they mature, or management intends to dispose of them within 12 months of the end of the reporting period.
Reclassification
15
186
For
per
sona
l use
onl
y
Coal & Allied Industries Limited Notes to the consolidated financial statements
31 December 2016 (continued)
1 Summary of significant accounting policies (continued)
(o) Investments and other financial assets (continued)
The Company may choose to reclassify a non-derivative trading financial asset out of the held for trading category if the financial asset is no longer held for the purpose of selling it in the near term. Financial assets other than loans and receivables are permitted to be reclassified out of the held-for-trading category only in rare circumstances arising from a single event that is unusual and highly unlikely to recur in the near term. In addition, the Company may choose to reclassify financial assets that would meet the definition of loans and receivables out of the held-for-trading or available-for-sale categories if the Company has the intention and ability to hold these financial assets for the foreseeable future or until maturity at the date of reclassification.
Reclassifications are made at fair value as of the reclassification date. Fair value becomes the new cost or amortised cost as applicable, and no reversals of fair value gains or losses recorded before reclassification date are subsequently made. Effective interest rates for financial assets reclassified to loans and receivables and held-to-maturity categories are determined at the reclassification date. Further increases in estimates of cash flows adjust effective interest rates prospectively.
Recognition and derecognition Regular way purchases and sales of financial assets are recognised on trade-date - the date on which the Company commits to purchase or sell the asset. Financial assets are derecognised when the rights to receive cash flows from the financial assets have expired or have been transferred and the Company has transferred substantially all the risks and rewards of ownership.
When securities classified as available-for-sale are sold, the accumulated fair value adjustments recognised in other comprehensive income are reclassified to profit or loss as gains and losses from investment securities.
Measurement At initial recognition, the Company measures a financial asset at its fair value plus, in the case of a financial asset not at fair value through profit or loss, transaction costs that are directly attributable to the acquisition of the financial asset. Transaction costs of financial assets carried at fair value through profit or loss are expensed in profit or loss.
Loans and receivables and held-to-maturity investments are subsequently carried at amortised cost using the effective interest method.
Available-for-sale financial assets and financial assets at fair value through profit or loss are subsequently carried at fair value. Gains or losses arising from changes in the fair value of the 'financial assets at fair value through profit or loss category are presented in profit or loss within other income or other expenses in the period in which they arise. Dividend income from financial assets at fair value through profit or loss is recognised in profit or loss as part of revenue from continuing operations when the Company's right to receive payments is established. Interest income from these financial assets is included in the net gains/(losses).
Changes in the fair value of monetary securities denominated in a foreign currency and classified as available-for-sale are analysed between translation differences resulting from changes in amortised cost of the security and other changes in carrying amount of the security. The translation differences related to changes in the amortised cost are recognised in profit or loss, and other changes in carrying amount are recognised in other comprehensive income. Changes in the fair value of other monetary and non monetary securities classified as available-for-sale are recognised in other comprehensive income.
Impairment The Company assesses at the end of each reporting period whether there is objective evidence that a financial asset or a group of financial assets is impaired. A financial asset or a group of financial assets is impaired and impairment losses are incurred only if there is objective evidence of impairment as a result of one or more events that occurred after the initial recognition of the asset (a 'loss event') and that loss event (or events) has an impact on the estimated future cash flows of the financial asset or group of financial assets that can be reliably estimated. In the case of equity investments classified as available-for-sale, a significant or prolonged decline in the fair value of the security below its cost is considered an indicator that the assets are impaired.
16
187
For
per
sona
l use
onl
y
Coal & Allied Industries Limited Notes to the consolidated financial statements
31 December 2016 (continued)
1 Summary of significant accounting policies (continued)
(o) Investments and other financial assets (continued)
Assets carried at amortised cost
For loans and receivables, the amount of the loss is measured as the difference between the asset's carrying amount and the present value of estimated future cash flows (excluding future credit losses that have not been incurred) discounted at the financial asset's original effective interest rate. The carrying amount of the asset is reduced and the amount of the loss is recognised in profit or loss. If a loan or held-to-maturity investment has a variable interest rate, the discount rate for measuring any impairment loss is the current effective interest rate determined under the contract. As a practical expedient, the Company may measure impairment on the basis of an instrument's fair value using an observable market price.
If, in a subsequent period, the amount of the impairment loss decreases and the decrease can be related objectively to an event occurring after the impairment was recognised (such as an improvement in the debtor's credit rating), the reversal of the previously recognised impairment loss is recognised in the consolidated statement of comprehensive income.
Assets classified as available-for-sale
If there is objective evidence of impairment for available-for-sale financial assets, the cumulative loss - measured as the difference between the acquisition cost and the current fair value, less any impairment loss on that financial asset previously recognised in the consolidated statement of comprehensive income - is removed from equity and recognised in the consolidated statement of comprehensive income.
Impairment losses on equity instruments that were recognised in the consolidated statement of comprehensive income are not reversed through the consolidated statement of comprehensive income in a subsequent period.
If the fair value of a debt instrument classified as available-for-sale increases in a subsequent period and the increase can be objectively related to an event occurring after the impairment loss was recognised in the consolidated statement of comprehensive income, the impairment loss is reversed through the consolidated statement of comprehensive income.
(p) Impairment of assets
Intangible assets that have an indefinite useful life are not subject to amortisation and are tested annually for impairment, or more frequently if events or changes in circumstances indicate that they might be impaired. Other assets are tested for impairment whenever events or changes in circumstances indicate that the carrying amount may not be recoverable. An impairment loss is recognised for the amount by which the asset's carrying amount exceeds its recoverable amount. The recoverable amount is the higher of an asset's fair value less costs to sell and value-in-use. For the purposes of assessing impairment, assets are grouped at the lowest levels for which there are separately identifiable cash inflows which are largely independent of the cash inflows from other assets or groups of assets (cash-generating units). Non-financial assets other than goodwill that suffered an impairment are reviewed for possible reversal of the impairment at the end of each reporting period.
(q) Inventories
Raw materials and stores and coal stocks
Inventories of coal are physically measured or estimated and valued at the lower of cost and net realisable value.
Cost is determined as follows:
• Coal stocks - cost comprises average mining cost under normal mining conditions or actual purchase price and, where applicable, overburden removal, coal preparation expenditure, fixed and variable overhead costs and transportation costs.
• Raw materials and stores - cost comprises average cost or purchase price and associated charges. As regular and ongoing review is undertaken to establish the extent of surplus items, and a provision is made for any potential loss on their disposal.
Net realisable value is the amount estimated to be obtained from sale of the inventory in the normal course of business less the estimated costs of completion and the estimated costs necessary to make the sale.
17
188
For
per
sona
l use
onl
y

Coal & Allied Industries Limited Notes to the consolidated financial statements
31 December 2016 (continued)
1 Summary of significant accounting policies (continued)
(r) Land held for development
Land held for development is stated at the lower of cost and fair value less cost of disposal. Cost is assigned by specific identification and includes the cost of acquisition, and development and borrowing costs during development. When development is completed any subsequent borrowing costs and other holding charges are expensed as incurred.
Borrowing costs included in the cost of land held for resale are those costs that would have been avoided if the expenditure on the acquisition and development of the land had not been made. Borrowing costs incurred while active development is interrupted for extended periods are recognised as expenses.
(s) Leases
Leases of property, plant and equipment where the Company, as lessee, has substantially all the risks and rewards of ownership are classified as finance leases. Finance leases are capitalised at the lease's inception at the lower of the fair value of the leased property and the present value of the minimum lease payments. The corresponding rental obligations, net of finance charges, are included in other short term and long term payables. Each lease payment is allocated between the liability and finance cost. The finance cost is charged to the profit or loss over the lease period so as to produce a constant periodic rate of interest on the remaining balance of the liability for each period. The property, plant and equipment acquired under finance leases is depreciated over the shorter of the asset's useful life and the lease term if there is no reasonable certainty that the Company will obtain ownership at the end of the lease term.
Leases in which a significant portion of the risks and rewards of ownership are retained by the lessor are classified as operating leases. Payments made under operating leases. (net of any incentives received from the lessor) are charged to the profit or loss on a straight line basis over the period of the lease.
(t) Property, plant and equipment
Property, plant and equipment is stated at historical cost less depreciation. The cost of a tangible fixed asset comprises its purchase price and any costs directly attributable to the acquisition of the item and of bringing it into working condition for its intended use. Cost may also include transfers from equity of any gains or losses on qualifying cash flow hedges of foreign currency purchases of property, plant and equipment.
Subsequent costs are included in the asset's carrying amount or recognised as a separate asset, as appropriate, only when it is probable that future economic benefits associated with the item will flow to the Company and cost of the item can be measured reliably. The carrying amount of the replaced part is derecognised. All other repairs and maintenance are charged to the consolidated statement of comprehensive income during the reporting period in which they are incurred.
Once a mining project has been established as commercially viable, expenditure other than that on land, buildings, plant and equipment is capitalised under "Operational mining properties" together with any amount transferred from "Exploration and evaluation". This includes costs incurred in preparing the site for mining operations. Development costs incurred after the commencement of production are capitalised to the extent they give rise to a future economic benefit. Interest on borrowings related to construction or development projects is capitalised until the point when substantially all the activities that are necessary to make the asset ready for its intended use are complete.
Costs associated with a start up period are capitalised where the asset is available for use but incapable of operating at normal levels without a commissioning period.
Interest payable on borrowings related to qualifying construction or development projects is capitalised up to the point when substantially all the activities that are necessary to make the asset ready for use are complete.
An asset's carrying amount is written down immediately to its recoverable amount if the asset's carrying amount is greater than its estimated recoverable amount.
18
189
For
per
sona
l use
onl
y
Coal & Allied Industries Limited Notes to the consolidated financial statements
31 December 2016 (continued)
1 Summary of significant accounting policies (continued)
(t) Property, plant and equipment (continued)
Gains and losses on disposals are determined by comparing proceeds with carrying amount. These are included in the consolidated statement of comprehensive income.
Assets are fully depreciated over their economic lives, or over the remaining life of the mine if shorter. For certain assets, the economic benefits from the asset are consumed in a pattern than is linked to the level of production. In such cases, depreciation is generally charged on a unit of production basis. The straight line method is used for some operations where this provides a suitable alternative because production is not expected to fluctuate significantly from one year to another. Assets for which consumption of economic benefits is linked to passage of time are depreciated on a straight line basis.
Land is not depreciated unless acquired for mining purposes in which case it is included in mining properties.
Property, plant and equipment is depreciated over its useful life. The major categories of property, plant and equipment are depreciated on a straight line basis as appropriate.
Assets within operations for which production is not expected to fluctuate significantly from one year to another are depreciated on a straight line basis as follows:
Buildings 10 - 40 years Plant and equipment 2- 10 years
remaining marketable reserves utilised on a unit of Mining properties production basis
the shorter of applicable mine life and 5 - 15 years Machinery and equipment depending on the nature of the asset Buildings not being part of mining properties 40 years
Residual values and useful lives are reviewed, and adjusted if appropriate, at the end balance sheet date. Changes to the estimated residual values or useful lives are accounted for prospectively.
(u) Provisions
Provisions are recognised when the Company has a present legal or constructive obligation as a result of past events, it is probable that an outflow of resources will be required to settle the obligation and the amount has been reliably estimated. Provisions are not recognised for future operating losses.
Where there are a number of similar obligations, the likelihood that an outflow will be required in settlement is determined by considering the class of obligations as a whole. A provision is recognised even if the likelihood of an outflow with respect to any one item included in the same class of obligations may be small.
Provisions are measured at the present value of management's best estimate of the expenditure required to settle the present obligation at the end of the reporting period. The discount rate used to determine the present value is a pre-tax rate that reflects current market assessments of the time value of money and the risks specific to the liability. The increase in the provision due to the passage of time is recognised as finance costs.
(v) Onerous contracts
Provision for an onerous contract is made only when the related assets, which may be part of the wider cash-generating unit of which the business unit forms part, are fully impaired or the contract becomes stranded as a result of a business decision. Judgement is required as to when it is appropriate to look to the wider cash-generating unit.
In some cases, product to be supplied under a sales contract can become onerous when the cost of production exceeds the revenues or it is purchased externally and sold at a loss. The decision on sourcing will be dependent on the Group's future marketing plans and changes in those plans may impact the amount of any provision.
Onerous contracts are shown within Other provisions.
19
190
For
per
sona
l use
onl
y

Coal & Allied Industries Limited Notes to the consolidated financial statements
31 December 2016 (continued)
1 Summary of significant accounting policies (continued)
(w) Provisions for close down restoration and environmental clean-up costs
Close down and restoration costs Close down and restoration costs include the dismantling and demolition of infrastructure, the removal of residual materials and remediation of disturbed areas. Estimated close down and restoration costs are provided for in the accounting period when the obligation arising from the related disturbance occurs, whether this occurs during the site development or during the production phase, based on the net present value of estimated future costs. Provisions for close down and restoration costs do not include any additional obligations which are expected to arise from future disturbance. The costs are estimated on the basis of a closure plan. The cost estimates are calculated annually during the life of the operation to reflect known developments and are subject to formal review at regular intervals.
Close down and restoration costs are a normal consequence of operations and the majority of close down and restoration expenditures are incurred at the end of the life of the operation. Although the ultimate cost to be incurred is uncertain, the Company estimates its costs based on feasibility and engineering studies using current restoration standards and techniques.
The amortisation or 'unwinding' of the discount applied in establishing the net present value of provisions is charged to the consolidated statement of comprehensive income in each accounting period. The amortisation of the discount is shown as a financing cost, rather than as an operating cost.
The initial closure provision together with other movements in the provisions for close down and restoration costs, including those resulting from new disturbance, updated cost estimates, changes to the lives of operations and revisions to discount rates are capitalised within property, plant and equipment. These costs are then depreciated over the lives of the assets to which they relate.
Where rehabilitation is conducted systematically over the life of the operation, rather than at the time of closure, provision is made for the outstanding continuous rehabilitation work at each balance date and the cost is charged to the consolidated statement of comprehensive income.
Environmental clean-up costs Provision is made for the estimated present value of the costs of environmental clean-up obligations outstanding at the balance date. These costs are charged to the consolidated statement of comprehensive income. Movements in the environmental clean-up provisions are presented as an operating cost, except for the unwind of the discount which is shown as a financing cost.
(x) Employee benefits
Short term obligations
Liabilities for wages and salaries, including non-monetary benefits, annual leave and accumulating sick leave expected to be settled within 12 months after the end of the period in which the employees render the related service are recognised in respect of employees' services up to the end of the reporting period and are measured at the amounts expected to be paid when the liabilities are settled. The liability for accumulating sick leave is recognised in the provision for employee benefits. All other short-term employee benefit obligations are presented as payables.
Liabilities for non-accumulating sick leave are recognised when the leave is taken and measured at the rates paid or payable.
20
191
For
per
sona
l use
onl
y
Coal & Allied Industries Limited Notes to the consolidated financial statements
31 December 2016 (continued)
1 Summary of significant accounting policies (continued)
(x) Employee benefits (continued)
Other long-term employee benefit obligations
The liabilities for long service leave and annual leave are not expected to be settled wholly within 12 months after the end of the period in which the employees render the related service. They are therefore measured as the present value of expected future payments to be made in respect of services provided by employees up to the end of the reporting period using the projected unit credit method. Consideration is given to expected future wage and salary levels, experience of employee departures and periods of service. Expected future payments are discounted using market yields at the end of the reporting period of corporate bonds with terms and currencies that match, as closely as possible, the estimated future cash outflows. Remeasurements as a result of experience adjustments and changes in actuarial assumptions are recognised in profit or loss.
The obligations are presented as current liabilities in the consolidated balance sheet if the entity does not have an unconditional right to defer settlement for at least 12 months after the reporting period, regardless of when the actual settlement is expected to occur.
Additional Long Service Leave payments are made monthly to the Coal Mining Industry (Long Service Leave Funding) Corporation based on the eligible monthly payroll of employees involved in the mining of black coal. Reimbursement is sought from the fund when long service leave is paid to employees involved in the mining of black coal. An asset for the amount recoverable from the Coal Mining Industry (Long Service Leave Funding) Corporation is recognised in trade and other receivables.
Retirement benefit obligations
Many employees of the Company are entitled to benefits on retirement, disability or death from their membership of the Rio Tinto Staff Superannuation Fund ("The Fund").
The Fund has both a defined benefit and a defined contribution section. Contributions to the defined contribution superannuation plans are expensed in the consolidated statement of comprehensive income when incurred.
For the defined benefit plans, as there is no agreement in place for charging the net defined benefit cost for the plan as a whole to individual group entities, the Company will recognise a cost in the consolidated statement of comprehensive income equal to the contribution payable for the year. The cash contributions to the Fund are made through reference to a percentage of base salary contribution per defined benefit employee as determined by the fund actuary, advised by the fund trustee and applied to those defined benefit employees of the Fund.
There are a minimal number of employees in the defined benefit section of the scheme. Therefore the Company's exposure to this part of the Fund is not material.
Share-based payments
The executives and employees of the Company are eligible to participate in various share based payment plans as part of the Company's membership of the Rio Tinto Group. Generally, these are to be classified as equity settled share based payments with the guidance contained in Interpretation 11, AASB 2 Share-based Payment - Group and Treasury Share Transactions.
Short term incentive plans The Company recognises a liability and an expense for bonuses based on a formula that takes into consideration key performance indicators including, but not necessarily limited to safety performance and financial performance. The Company recognises a provision where contractually obliged or where there is a past practice that has created a constructive obligation.
21
192
For
per
sona
l use
onl
y
Coal & Allied Industries Limited Notes to the consolidated financial statements
31 December 2016 (continued)
1 Summary of significant accounting policies (continued)
(x) Employee benefits (continued)
Termination benefits
Termination benefits are payable when employment is terminated before the normal retirement date, or when an employee accepts voluntary redundancy in exchange for these benefits. The Company recognises termination benefits at the earlier of the following dates: (a) when the group can no longer withdraw the offer of those benefits; and (b) when the entity recognises costs for a restructuring that is within the scope of AASB 137 "Provision, Contingent Liabilities and Contingent Assets" and involves the payment of termination benefits. In the case of an offer made to encourage voluntary redundancy, the termination benefits are measured based on the number of employees expected to accept the offer. Benefits falling due more than 12 months after the end of the reporting period are discounted to present value.
(y) Trade and other payables
These amounts represent liabilities for goods and services provided to the Company prior to the end of financial year which are unpaid. The amounts are unsecured and are usually paid within 45 days of recognition. Trade and other payables are presented as current liabilities unless payment is not due within 12 months from the reporting date. They are recognised initially at their fair value and subsequently measured at amortised cost using the effective interest method.
(z) Trade receivables
Trade receivables are recognised initially at fair value and subsequently measured at amortised cost using the effective interest method, less provision for impairment.
Trade receivables are amounts due from customers for goods sold or services performed in the ordinary course of business. Loans and other receivables are non-derivative financial assets with fixed or determinable payments that are not quoted in an active market. If collection of the amounts is expected in one year or less they are classified as current assets. If not, they are presented as non-current assets. Trade receivables are generally due for settlement within 30 days and therefore are all classified as current.
Individual receivables which are known to be uncollectible are written off by reducing the carrying amount directly. The other receivables are assessed collectively to determine whether there is objective evidence that an impairment has been incurred but not yet been identified. For these receivables the estimated impairment losses are recognised in a separate provision for impairment. The Company considers that there is evidence of impairment if any of the following indicators are present:
• significant financial difficulties of the debtor,
• probability that the debtor will enter bankruptcy or financial reorganisation, and
• default or delinquency in payments (more than 30 days overdue).
Receivables for which an impairment provision was recognised are written off against the provision when there is no expectation of recovering additional cash.
Impairment losses are recognised in profit or loss within other expenses. Subsequent recoveries of amounts previously written off are credited against other expenses.
(aa)Determination of ore reserves
The Company estimates its ore reserves and mineral resources based on information compiled by Competent Persons as defined in accordance with the Australasian Code for Reporting of Mineral Resources and Ore Reserves of December 2012 (the JORC code).
Reserves, and for certain mines, resources, determined in this way are used in the calculation of depreciation, amortisation and impairment charges, the assessment of life of mine stripping ratios and for forecasting the timing of the payment of close down and restoration costs. In assessing the life of a mine for accounting purposes, mineral resources are only taken into account where there is a high degree of confidence of economic extraction.
22
193
For
per
sona
l use
onl
y
Coal & Allied Industries Limited Notes to the consolidated financial statements
31 December 2016 (continued)
1 Summary of significant accounting policies (continued)
(ab)Rounding of amounts
The Company is of a kind referred to in ASIC Legislative Instrument 2016/191, relating to the 'rounding off of amounts in the financial statements. Amounts in the financial statements have been rounded off in accordance with that Instrument to the nearest hundred thousand dollars, or in certain cases, to the nearest dollar.
(ac)Segment reporting
Operating segments are reported in a manner consistent with the internal reporting provided to the senior management team (being the chief operating decision maker), comprising the Managing Director of Coal and the Coal Executive Committee in assessing performance and determining strategy.
Segment information is presented on the same basis as that used for internal reporting purposes. The Group's chief operating decision maker does not regularly review assets or liabilities on a segmented basis and therefore this information is not disclosed.
2 Financial risk management
The Group carries out risk management under policies approved by the directors and in line with Rio Tinto Group policy. The Group provides principles for overall risk management, as well as written policies covering specific areas, such as mitigating interest rate and other risks, and the use of derivative and non-derivative financial instruments.
The Group's business is coal mining and not trading. Accordingly, the Group only contracts to sell coal that it plans to produce, however purchasing coal for resale may be required in circumstances where actual production falls short of contractual sales volumes. The Group operates entirely in Australia and is exposed primarily to Australian dollar denominated costs. Sales are primarily denominated in US dollars. Cash deposits are denominated in both Australian and US dollars.
(a) Market risk
(i) Foreign exchange risk
The Group markets its products internationally and is exposed to foreign exchange risk arising from various currency exposures, primarily with respect to export coal sales being denominated in US dollars and recognised financial assets and liabilities that are denominated in a currency that is not the Group's functional currency. The Group has a number of US dollar denominated cash, trade receivables and payables balances. The exposures to foreign currency risk at the reporting dates were as follows:
23
194
For
per
sona
l use
onl
y

Coal & Allied Industries Limited Notes to the consolidated financial statements
31 December 2016 (continued)
2 Financial risk management (continued)
(a) Market risk (continued)
Exposure
31 December 31 December 31 December
2016 2015 2014
USD USD USD
$M $M $M
Cash 5.0 6.2 7.4 Trade receivables 126.4 59.7 101.0 Trade payables 101.1 39.9 21.4
Sensitivity
The sensitivity of profit or loss to changes in exchange rates arises mainly from US dollar denominated financial instruments. Profit is more sensitive to movements in the Australian dollar/US dollar exchange rates in 2016 and 2014 than 2015 because of the increased net amount of USD denominated trade receivables and trade payables.
The tables below summarise the impact on the Group's post-tax profit of a 10% movement of the Australian dollar against the US dollar with all other variables held constant. Other components of equity would have been unaffected.
Impact on post-tax profit Sensitivity 10% increase in FX*
2016 2015 2014 Index $M $M $M
Cash (0.4) (0.5) (0.6) Trade receivables (11.1) (5.2) (7.8) Trade payables 8.7 3.5 1.6
Impact of post-tax profit Sensitivity 10% decrease in FX*
2016 2015 2014 $M $M $M
Cash 0.5 0.7 0.7 Trade receivables 13.6 6.4 9.6 Trade payables (10.6) (4.3) (2.0)
"All other variables held constant. Figures include trade receivables and trade payables classified as held for sale.
24
195
For
per
sona
l use
onl
y
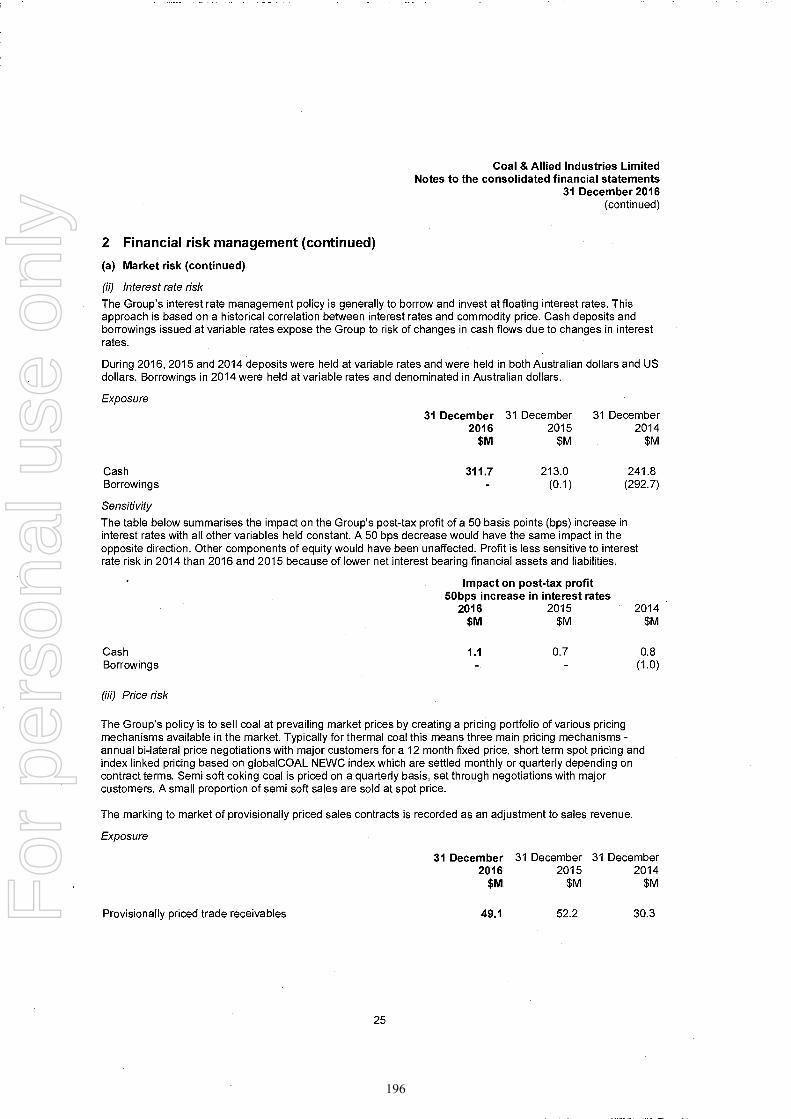
Coal & Allied Industries Limited Notes to the consolidated financial statements
31 December 2016 (continued)
2 Financial risk management (continued)
(a) Market risk (continued)
(il) Interest rate risk
The Group's interest rate management policy is generally to borrow and invest at floating interest rates. This approach is based on a historical correlation between interest rates and commodity price. Cash deposits and borrowings issued at variable rates expose the Group to risk of changes in cash flows due to changes in interest rates.
During 2016, 2015 and 2014 deposits were held at variable rates and were held in both Australian dollars and US dollars. Borrowings in 2014 were held at variable rates and denominated in Australian dollars.
Exposure
31 December 31 December 31 December
2016 2015 2014
$M $M $M
Cash 311.7 213.0 241.8 Borrowings (0.1) (292.7)
Sensitivity
The table below summarises the impact on the Group's post-tax profit of a 50 basis points (bps) increase in interest rates with all other variables held constant. A 50 bps decrease would have the same impact in the opposite direction. Other components of equity would have been unaffected. Profit is less sensitive to interest rate risk in 2014 than 2016 and 2015 because of lower net interest bearing financial assets and liabilities.
Impact on post-tax profit 50bps increase in interest rates
2016 2015 2014 $M $M $M
Cash 1.1 0.7 0.8 Borrowings
(iii) Price risk
(1.0)
The Group's policy is to sell coal at prevailing market prices by creating a pricing portfolio of various pricing mechanisms available in the market. Typically for thermal coal this means three main pricing mechanisms - annual bi-lateral price negotiations with major customers for a 12 month fixed price, short term spot pricing and index linked pricing based on globalCOAL NEWC index which are settled monthly or quarterly depending on contract terms. Semi soft coking coal is priced on a quarterly basis, set through negotiations with major customers. A small proportion of semi soft sales are sold at spot price.
The marking to market of provisionally priced sales contracts is recorded as an adjustment to sales revenue.
Exposure
31 December 31 December 31 December
2016 2015 2014
$M SM $M
Provisionally priced trade receivables 49.1
52.2 30.3
25
196
For
per
sona
l use
onl
y
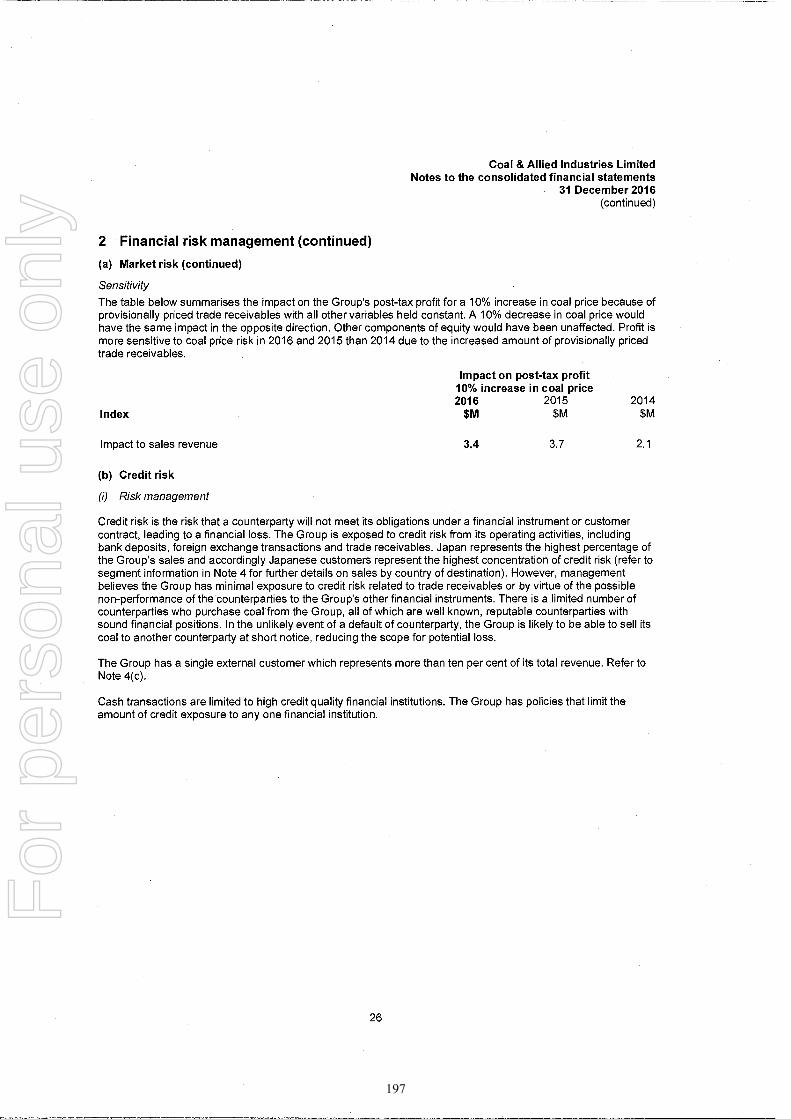
Coal & Allied Industries Limited Notes to the consolidated financial statements
31 December 2016 (continued)
2 Financial risk management (continued)
(a) Market risk (continued)
Sensitivity The table below summarises the impact on the Group's post-tax profit for a 10% increase in coal price because of provisionally priced trade receivables with all other variables held constant. A 10% decrease in coal price would have the same impact in the opposite direction. Other components of equity would have been unaffected. Profit is more sensitive to coal price risk in 2016 and 2015 than 2014 due to the increased amount of provisionally priced trade receivables.
Impact on post-tax profit 10% increase in coal price
2016 2015
2014 Index
$M $M
$m
Impact to sales revenue 3.4
3.7 2.1
(b) Credit risk
(i) Risk management
Credit risk is the risk that a counterparty will not meet its obligations under a financial instrument or customer contract, leading to a financial loss. The Group is exposed to credit risk from its operating activities, including bank deposits, foreign exchange transactions and trade receivables. Japan represents the highest percentage of the Group's sales and accordingly Japanese customers represent the highest concentration of credit risk (refer to segment information in Note 4 for further details on sales by country of destination). However, management believes the Group has minimal exposure to credit risk related to trade receivables or by virtue of the possible non-performance of the counterparties to the Group's other financial instruments. There is a limited number of counterparties who purchase coal from the Group, all of which are well known, reputable counterparties with sound financial positions. In the unlikely event of a default of counterparty, the Group is likely to be able to sell its coal to another counterparty at short notice, reducing the scope for potential loss.
The Group has a single external customer which represents more than ten per cent of its total revenue. Refer to Note 4(c).
Cash transactions are limited to high credit quality financial institutions. The Group has policies that limit the amount of credit exposure to any one financial institution.
26
197
For
per
sona
l use
onl
y

Coal & Allied Industries Limited Notes to the consolidated financial statements
31 December 2016 (continued)
2 Financial risk management (continued)
(b) Credit risk (continued)
The maximum credit risk exposure to the Group's financial assets at balance sheet date is as follows:
Cash and cash equivalents Counterparties with external credit rating
31 December 2016
$M
31 December 2015
$M
31 December 2014
$M
Deposits with Rio Tinto Finance (Baal credit rating - Moody's) 231.4 159.2 172.5 Deposits with banking institutions with a minimum Baal credit rating - Moody's 80.3 53.8 69.3 Total cash and cash equivalents (Note 9) 311.7 213.0 241.8
Trade and other receivables (Note 10) Trade and other receivables 329.7 176.9 232.1
Impaired trade receivables
Individual receivables which are known to be uncollectable are written off by reducing the carrying amount directly. The other receivables are assessed collectively to determine whether there is objective evidence that an impairment has been incurred but not yet identified. For these receivables the estimated impairment losses are recognised in a separate provision for impairment.
The Group considers that there is evidence of impairment if any of the following indicators are present:
• significant financial difficulties of the debtor;
• probability that the debtor will enter bankruptcy.
At 31 December 2016, 31 December 2015 or 31 December 2014 there were no impaired trade receivables.
Past due but not impaired
At 31 December 2016, 31 December 2015 or 31 December 2014 there were no trade receivables that were past due.
The other classes within trade and other receivables do not contain impaired assets and are not past due.
27
198
For
per
sona
l use
onl
y

Coal & Allied Industries Limited Notes to the consolidated financial statements
31 December 2016 (continued)
2 Financial risk management (continued)
(b) Credit risk (continued)
Credit risk in relation to financial guarantees
The Group only issues financial guarantees in exceptional circumstances or where required in order to secure access to mining leases. Guarantees are usually required by government bodies in order to guarantee the restoration of disturbed sites under mining leases granted to the Group. Refer to Note 30 on contingent liabilities for further disclosure of the amount under risk and the counterparty involved.
(c) Liquidity risk
The Group's liquidity and risk management strategies are principally driven by Rio Tinto. Liquidity needs and surpluses of the Group are primarily managed through equity funding from and loans to Rio Tinto. Credit facilities have also previously been used to ensure sufficient funds are available to meet contractual obligations arising in the ordinary course of business.
(i) Maturities of financial liabilities The amounts disclosed in the table below analyse the Group's financial liabilities into relevant maturity groupings based on their contractual maturities. The amounts disclosed are the contractual undiscounted cash flows.
Contractual maturities of financial liabilities
Total
Between Between contractual Carrying
Less than 6 - 12 1 and 2 2 and 5 Over 5 cash amount
6 months months years years years flows liabilities
$M $M $m $m $M $M $m
345.9 345.9 345.9
345.9 345.9 345.9
31 December 2016
Non-derivatives Trade and other payables
31 December 2015
Non-derivatives Trade and other payables 252.2 252.2 252.2 Borrowings 0.1 0.1 0.1
252.3 252.3 252.3
Contractual maturities of financial liabilities
31 December 2014
Total
Between Between contractual Carrying
Less than 6 -12 1 and 2 2 and 5 Over 5 cash amount
6 months months years years years flows liabilities
$M $M $M $M $M $M $M
Non-derivatives Trade and other payables Borrowings
263.9 263.9 292.7 556.6
263.9 292.7 556.6
292.7
263.9 292.7
28
199
For
per
sona
l use
onl
y
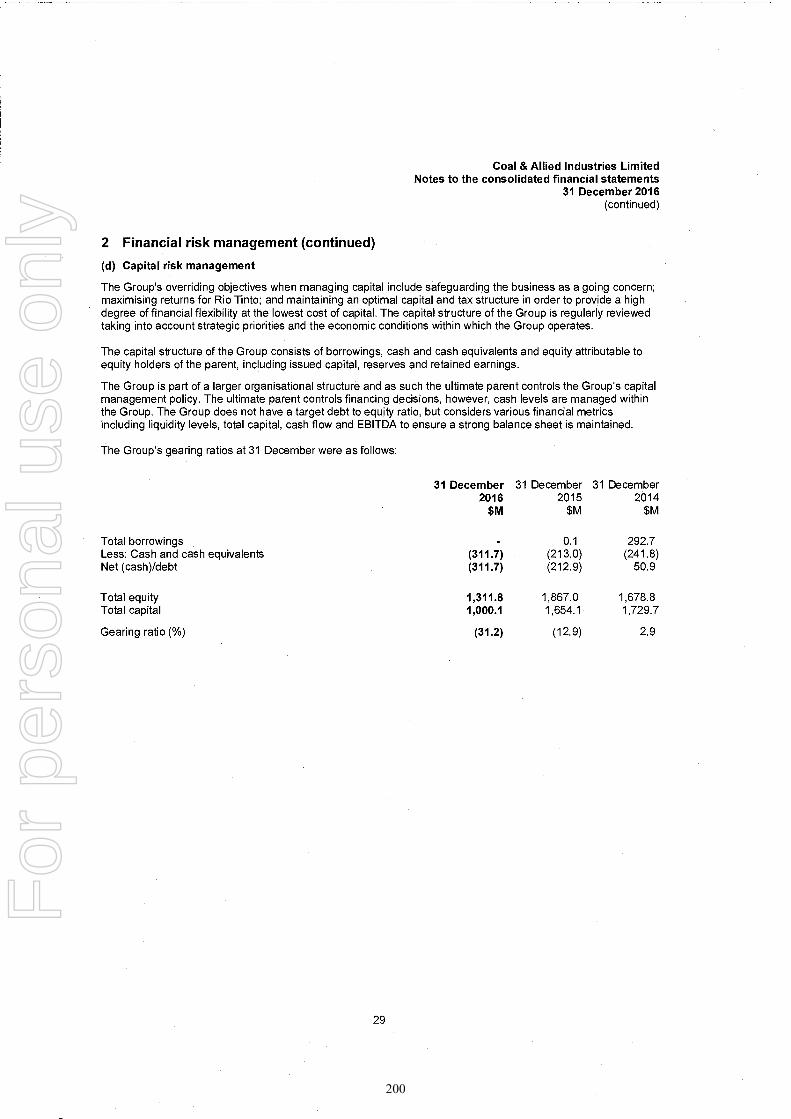
Coal & Allied Industries Limited Notes to the consolidated financial statements
31 December 2016 (continued)
2 Financial risk management (continued)
(d) Capital risk management
The Group's overriding objectives when managing capital include safeguarding the business as a going concern; maximising returns for Rio Tinto; and maintaining an optimal capital and tax structure in order to provide a high degree of financial flexibility at the lowest cost of capital. The capital structure of the Group is regularly reviewed taking into account strategic priorities and the economic conditions within which the Group operates.
The capital structure of the Group consists of borrowings, cash and cash equivalents and equity attributable to equity holders of the parent, including issued capital, reserves and retained earnings.
The Group is part of a larger organisational structure and as such the ultimate parent controls the Group's capital management policy. The ultimate parent controls financing decisions, however, cash levels are managed within the Group. The Group does not have a target debt to equity ratio, but considers various financial metrics including liquidity levels, total capital, cash flow and EBITDA to ensure a strong balance sheet is maintained.
The Group's gearing ratios at 31 December were as follows:
Total borrowings
31 December 2016
SIVI
-
31 December 2015
$M
0.1
31 December 2014
$M
292.7 Less: Cash and cash equivalents (311.7) (213.0) (241.8) Net (cash)/debt (311.7) (212.9) 50.9
Total equity 1,311.8 1,867.0 1,678.8 Total capital 1,000.1 1,654.1 1,729.7
Gearing ratio (%) (31.2) (12.9) 2.9
29
200
For
per
sona
l use
onl
y

Coal & Allied Industries Limited Notes to the consolidated financial statements
31 December 2016 (continued)
3 Critical accounting estimates and judgements
The preparation of financial statements requires the use of accounting estimates which, by definition, will seldom equal the actual results. Management also needs to exercise judgement in applying the group's accounting policies.
This note provides an overview of the areas that involved a higher degree of judgement or complexity, and of items which are more likely to be materially adjusted due to estimates and assumptions turning out to be wrong. Detailed information about each of these estimates and judgements is outlined below.
Mine closure and rehabilitation provisions estimates
The calculation of rehabilitation and closure provisions (and corresponding capitalised closure cost assets where necessary) rely on estimates of costs required to rehabilitate and restore disturbed areas of land to their original condition. The costs are estimated on the basis of a closure plan. Significant judgement is required in determining the provision as there are many transactions and other factors that will affect the ultimate liability payable. Factors that will affect this liability include future disturbances caused by further development, changes in technology and restoration techniques, changes in the timing of rehabilitation expenditure due, for example, to changes in ore reserves or production rates, changes in regulations, price increases and changes in discount rates. These estimates are regularly reviewed and adjusted in order to ensure the most up to date data is used to calculate these balances. When these factors change in the future, such differences will impact the provision in the period in which they change or become known.
Determination of coal reserves and resources
The Company estimates its coal reserves and coal resources based on information compiled by Competent Persons as defined in accordance with the Australasian Code for Reporting of Mineral Resources and Ore Reserves of December 2012 (the "JORC code"). Reserves determined in this way are used in the calculation of depreciation, amortisation and impairment charges, and the assessment of mine lives and for forecasting the timing of the payment of closure and rehabilitation costs.
30
201
For
per
sona
l use
onl
y
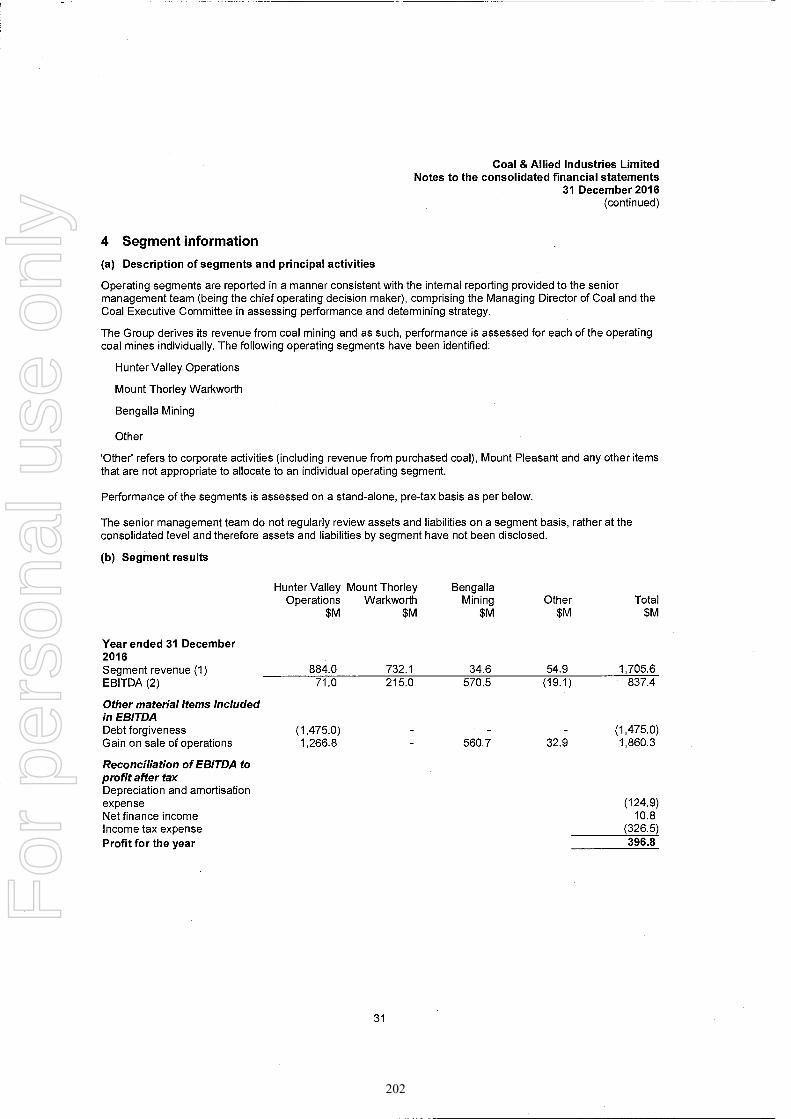
Coal & Allied Industries Limited Notes to the consolidated financial statements
31 December 2016 (continued)
4 Segment information
(a) Description of segments and principal activities
Operating segments are reported in a manner consistent with the internal reporting provided to the senior management team (being the chief operating decision maker), comprising the Managing Director of Coal and the Coal Executive Committee in assessing performance and determining strategy.
The Group derives its revenue from coal mining and as such, performance is assessed for each of the operating coal mines individually. The following operating segments have been identified:
Hunter Valley Operations
Mount Thorley Warkworth
Bengalla Mining
Other
'Other' refers to corporate activities (including revenue from purchased coal), Mount Pleasant and any other items that are not appropriate to allocate to an individual operating segment.
Performance of the segments is assessed on a stand-alone, pre-tax basis as per below.
The senior management team do not regularly review assets and liabilities on a segment basis, rather at the consolidated level and therefore assets and liabilities by segment have not been disclosed.
(b) Segment results
Year ended 31 December 2016 Segment revenue (1)
Hunter Valley Mount Thorley
Operations Warkworth
$M $M
884.0 732.1
Bengalla Mining
$M
34.6
Other $M
54.9
Total $N1
1,705.6 EBITDA (2) 71.0 215.0 570.5 (19.1) 837.4
Other material items included in EBITDA Debt forgiveness (1,475.0) - - (1,475.0) Gain on sale of operations 1,266.8 560.7 32.9 1,860.3
Reconciliation of EBITDA to profit after tax Depreciation and amortisation expense (124.9) Net finance income 10.8 Income tax expense (326.5) Profit for the year 396.8
31
202
For
per
sona
l use
onl
y
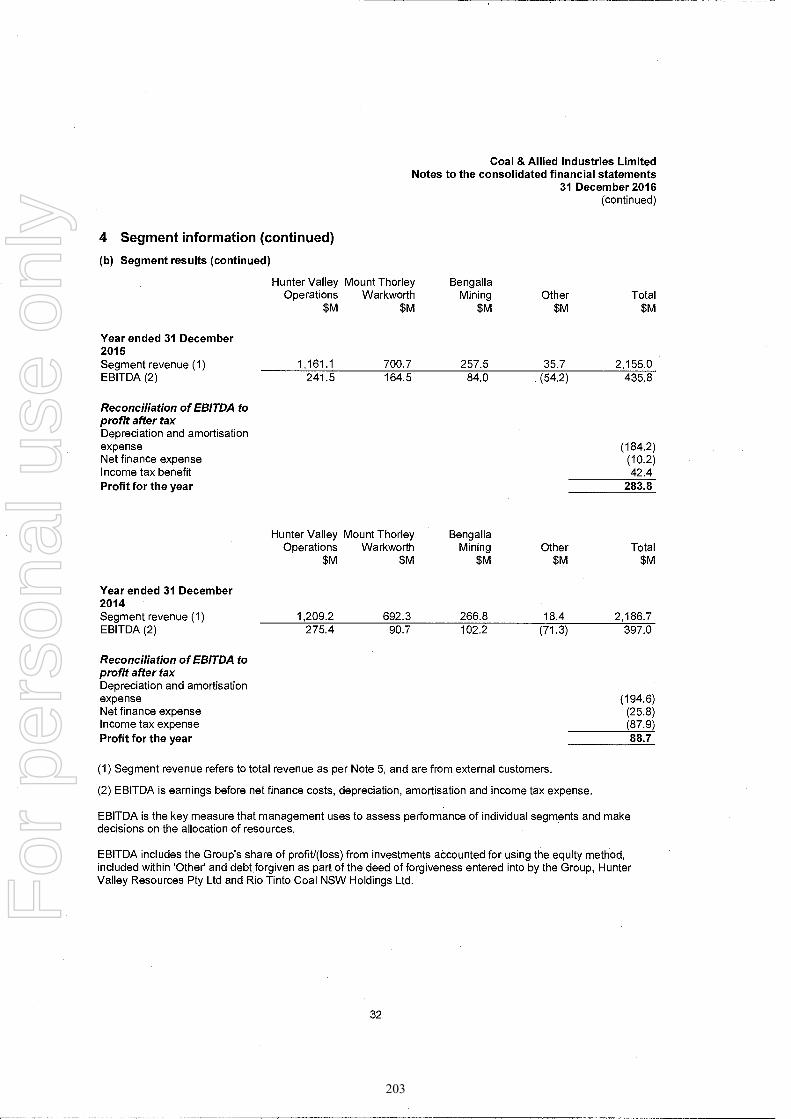
Coal & Allied Industries Limited Notes to the consolidated financial statements
31 December 2016 (continued)
4 Segment information (continued)
(b) Segment results (continued)
Hunter Valley Mount Thorley Bengalla
Operations Warkworth Mining Other Total
$M $M $M $M
Year ended 31 December 2015 Segment revenue (1) EBITDA (2)
700.7 257.5
164.5 84.0 35.7 2,155.0
241.5 (54.2) 435.8
Reconciliation of EBITDA to profit after tax Depreciation and amortisation expense (184.2) Net finance expense (10.2) Income tax benefit 42.4 Profit for the year 283.8
Hunter Valley Mount Thorley Bengalla Operations Warkworth Mining Other Total
$M $M $M $M $M
Year ended 31 December 2014 Segment revenue (1) EBITDA (2)
1,209.2 692.3 266.8 18.4
275.4 90.7 102.2 (71.3) 2,186.7
397.0
Reconciliation of EBITDA to profit after tax Depreciation and amortisation expense (194.6) Net finance expense (25.8) Income tax expense (87.9) Profit for the year 88.7
(1) Segment revenue refers to total revenue as per Note 5, and are from external customers.
(2) EBITDA is earnings before net finance costs, depreciation, amortisation and income tax expense.
EBITDA is the key measure that management uses to assess performance of individual segments and make decisions on the allocation of resources.
EBITDA includes the Group's share of profit/(loss) from investments accounted for using the equity method, included within 'Other' and debt forgiven as part of the deed of forgiveness entered into by the Group, Hunter Valley Resources Pty Ltd and Rio Tinto Coal NSW Holdings Ltd.
32
203
For
per
sona
l use
onl
y
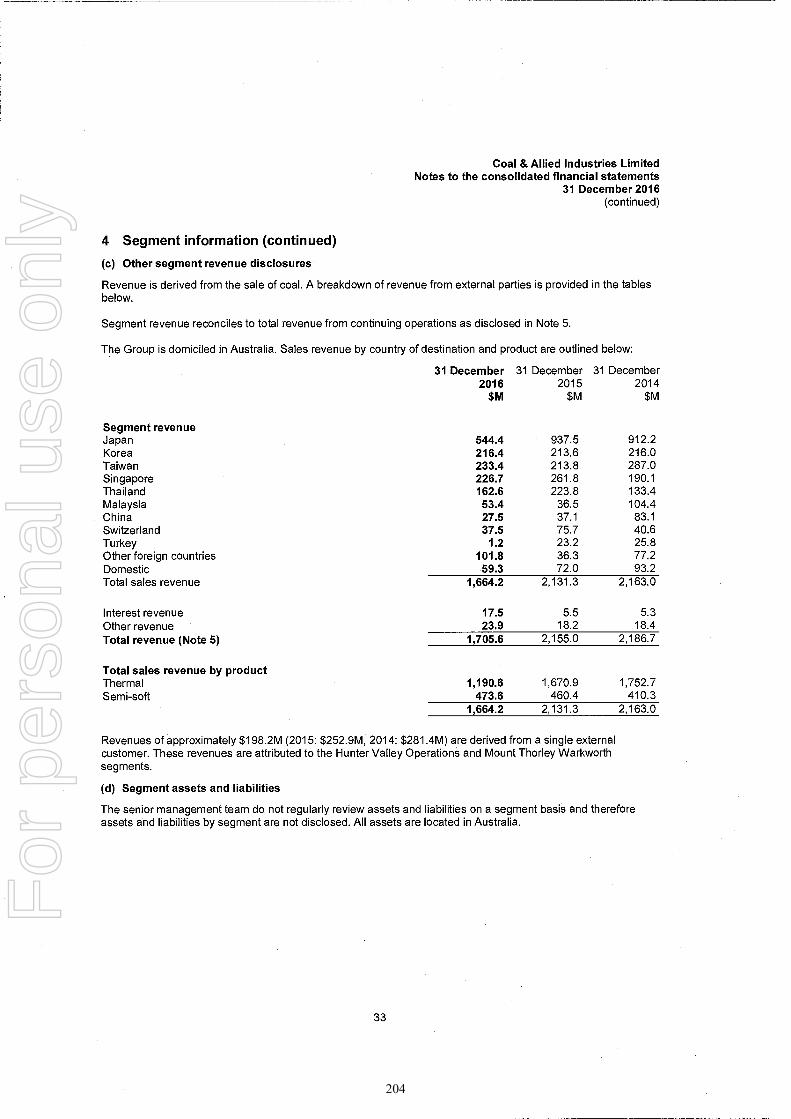
Coal & Allied Industries Limited Notes to the consolidated financial statements
31 December 2016 (continued)
4 Segment information (continued)
(c) Other segment revenue disclosures
Revenue is derived from the sale of coal. A breakdown of revenue from external parties is provided in the tables below.
Segment revenue reconciles to total revenue from continuing operations as disclosed in Note 5.
The Group is domiciled in Australia. Sales revenue by country of destination and product are outlined below:
Segment revenue
31 December 31 December 31 December
2016 2015 2014
$M $M $M
Japan 544.4 937.5 912.2 Korea 216.4 213.6 216.0 Taiwan 233.4 213.8 287.0 Singapore 226.7 261.8 190.1 Thailand 162.6 223.8 133.4 Malaysia 53.4 36.5 104.4 China 27.5 37.1 83.1 Switzerland 37.5 75.7 40.6 Turkey 1.2 23.2 25.8 Other foreign countries 101.8 36.3 77.2 Domestic 59.3 72.0 93.2 Total sales revenue 1,664.2 2,131.3 2,163.0
Interest revenue 17.5 5.5 5.3 Other revenue 23.9 18.2 18.4 Total revenue (Note 5) 1,705.6 2,155.0 2,186.7
Total sales revenue by product Thermal 1,190.6 1,670.9 1,752.7 Semi-soft 473.6 460.4 410.3
1,664.2 2,131.3 2,163.0
Revenues of approximately $198.2M (2015: $252.9M, 2014: $281.4M) are derived from a single external customer. These revenues are attributed to the Hunter Valley Operations and Mount Thorley Warkworth segments.
(d) Segment assets and liabilities
The senior management team do not regularly review assets and liabilities on a segment basis and therefore assets and liabilities by segment are not disclosed. All assets are located in Australia.
33
204
For
per
sona
l use
onl
y
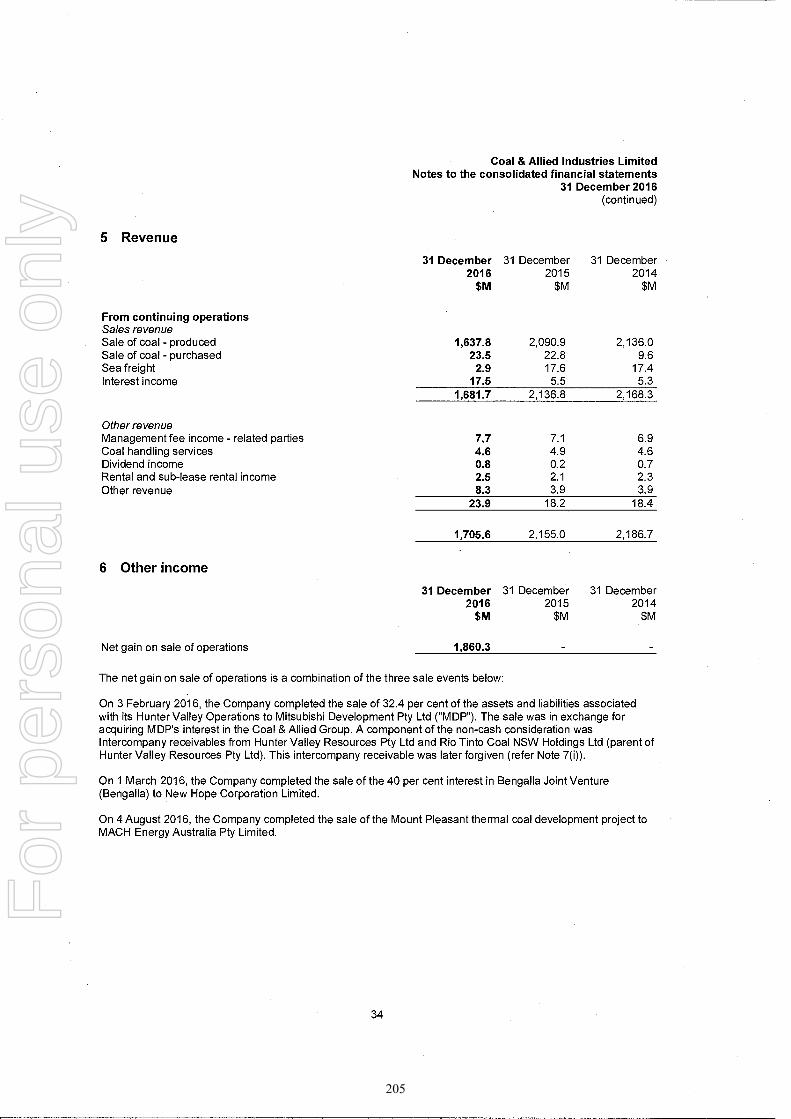
Coal & Allied Industries Limited Notes to the consolidated financial statements
31 December 2016 (continued)
5 Revenue
From continuing operations Sales revenue
31 December 2016
$M
31 December 2015
$M
31 December 2014
$M
Sale of coal - produced 1,637.8 2,090.9 2,136.0 Sale of coal - purchased 23.5 22.8 9.6 Sea freight 2.9 17.6 17.4 Interest income 17.5 5.5 5.3
1,681.7 2,136.8 2,168.3
Other revenue Management fee income - related parties 7.7 7.1 6.9 Coal handling services 4.6 4.9 4.6 Dividend income 0.8 0.2 0.7 Rental and sub-lease rental income 2.5 2.1 2.3 Other revenue 8.3 3.9 3.9
23.9 18.2 18.4
1,705.6 2,155.0 2,186.7
6 Other income
31 December 31 December 31 December 2016 2015 2014
$M $M $M
Net gain on sale of operations 1,860.3
The net gain on sale of operations is a combination of the three sale events below:
On 3 February 2016, the Company completed the sale of 32.4 per cent of the assets and liabilities associated with its Hunter Valley Operations to Mitsubishi Development Pty Ltd ("MDP"). The sale was in exchange for acquiring MDP's interest in the Coal & Allied Group. A component of the non-cash consideration was Intercompany receivables from Hunter Valley Resources Pty Ltd and Rio Tinto Coal NSW Holdings Ltd (parent of Hunter Valley Resources Pty Ltd). This intercompany receivable was later forgiven (refer Note 7(i)).
On 1 March 2016, the Company completed the sale of the 40 per cent interest in Bengalla Joint Venture (Bengalla) to New Hope Corporation Limited.
On 4 August 2016, the Company completed the sale of the Mount Pleasant thermal coal development project to MACH Energy Australia Pty Limited.
34
205
For
per
sona
l use
onl
y
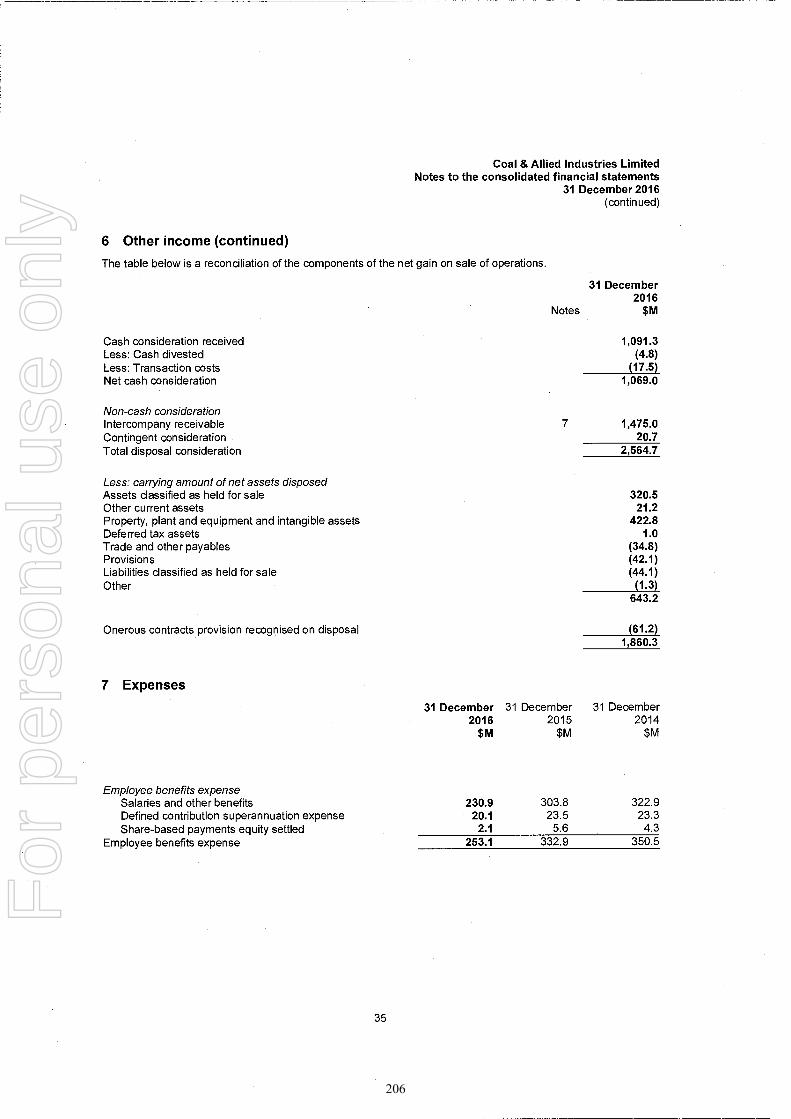
Coal & Allied Industries Limited Notes to the consolidated financial statements
31 December 2016 (continued)
6 Other income (continued)
The table below is a reconciliation of the components of the net gain on sale of operations.
Cash consideration received Less: Cash divested Less: Transaction costs Net cash consideration
Non-cash consideration
Notes
31 December 2016
$N1
1,091.3 (4.8)
(17.5) 1,069.0
Intercompany receivable 7 1,475.0 Contingent consideration 20.7 Total disposal consideration 2,564.7
Less: carrying amount of net assets disposed Assets classified as held for sale 320.5 Other current assets 21.2 Property, plant and equipment and intangible assets 422.8 Deferred tax assets 1.0 Trade and other payables (34.8) Provisions (42.1) Liabilities classified as held for sale (44.1) Other (1.3)
643.2
Onerous contracts provision recognised on disposal (61.2) 1,860.3
7 Expenses
31 December 31 December 31 December 2016 2015 2014
$M $M $M
Employee benefits expense Salaries and other benefits 230.9 303.8 322.9 Defined contribution superannuation expense 20.1 23.5 23.3 Share-based payments equity settled 2.1 5.6 4.3
Employee benefits expense 253.1 332.9 350.5
35
206
For
per
sona
l use
onl
y

Coal & Allied Industries Limited Notes to the consolidated financial statements
31 December 2016 (continued)
7 Expenses (continued)
Selling and distribution
31 December 2016
$M
31 December 2015
$M
31 December 2014
$M
Royalties 129.5 162.0 167.7 Rail freight 100.6 138.8 147.3 Port charges 76.4 112.6 129.4 Net demurrage 15.5 23.8 10.5
322.0 437.2 454.9
Debt forgiveness (i) 1,475.0
Redbank contract termination fee (ii) 51.2
Finance costs Interest expenses 0.5 7.9 20.9 Unwinding of discount on provisions 6.2 7.8 10.2
(i) Debt forgiveness
6.7 15.7 31.1
During 2016, the Company and its wholly owned subsidiaries entered into a deed of forgiveness with Hunter Valley Resources Pty Ltd and Rio Tinto Coal NSW Holdings Ltd (parent of Hunter Valley Resources Pty Ltd), whereby each party agreed to settle all intercompany balances in existence at 31 August 2016.
Redbank termination fee
During 2014, Warkworth Mining Limited (as manager of Warkworth Associates Joint Venture) successfully terminated the Redbank fuel supply agreements.
36
207
For
per
sona
l use
onl
y
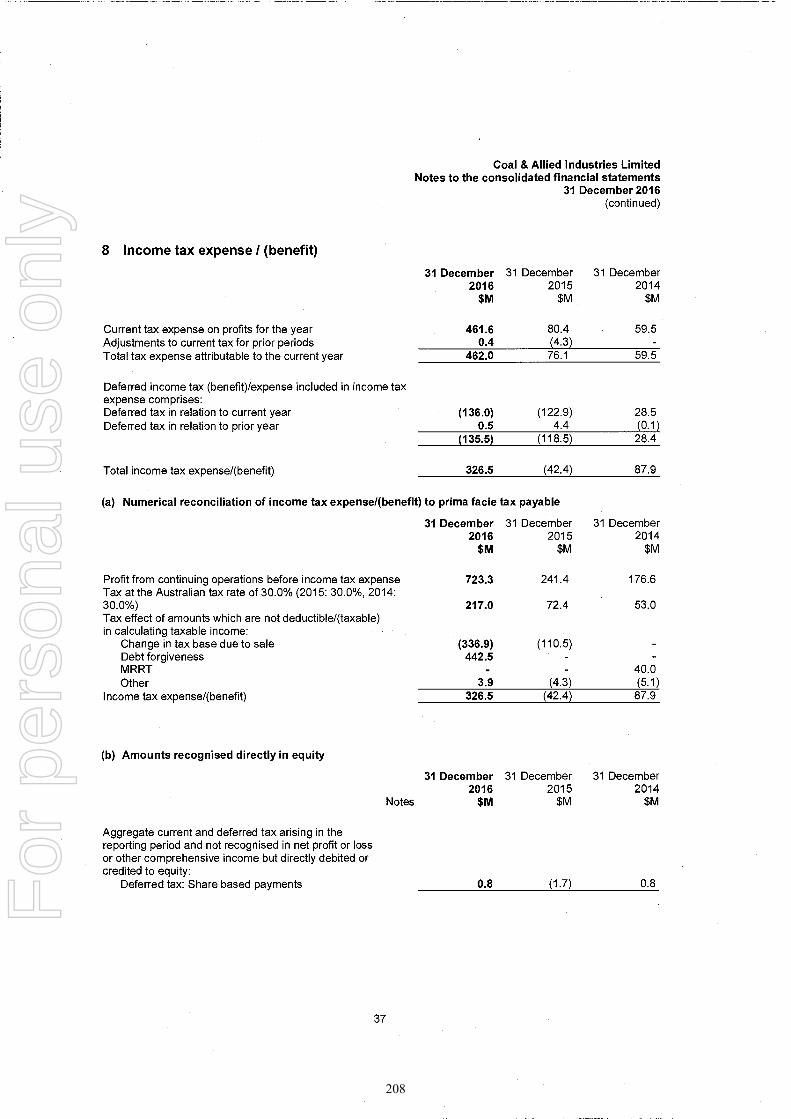
Coal & Allied Industries Limited Notes to the consolidated financial statements
31 December 2016 (continued)
8 Income tax expense / (benefit)
31 December 2016
$M
31 December 2015
$M
31 December 2014
$M
Current tax expense on profits for the year 461.6 80.4 59.5 Adjustments to current tax for prior periods 0.4 (4.3) Total tax expense attributable to the current year 462.0 76.1 59.5
Deferred income tax (benefit)/expense included in income tax expense comprises: Deferred tax in relation to current year (136.0) (122.9) 28.5 Deferred tax in relation to prior year 0.5 4.4 (0.1)
(135.5) (118.5) 28.4
Total income tax expense/(benefit) 326.5 (42.4) 87.9
(a) Numerical reconciliation of income tax expense/(benefit) to prima facie tax payable
Profit from continuing operations before income tax expense Tax at the Australian tax rate of 30.0% (2015: 30.0%, 2014: 30.0%) Tax effect of amounts which are not deductible/(taxable) in calculating taxable income:
Change in tax base due to sale Debt forgiveness MRRT Other
Income tax expense/(benefit)
(b) Amounts recognised directly in equity
31 December 2016
$M
31 December 2015
$M
31 December 2014
$M
723.3 241.4 176.6
217.0 72.4 53.0
(336.9) (110.5) 442.5
40.0 3.9 (4.3) (5.1)
326.5 (42.4) 87.9
31 December 31 December 31 December 2016 2015 2014
$M SM $M
0.8 (1.7) 0.8
Notes
Aggregate current and deferred tax arising in the reporting period and not recognised in net profit or loss or other comprehensive income but directly debited or credited to equity:
Deferred tax: Share based payments
37
208
For
per
sona
l use
onl
y
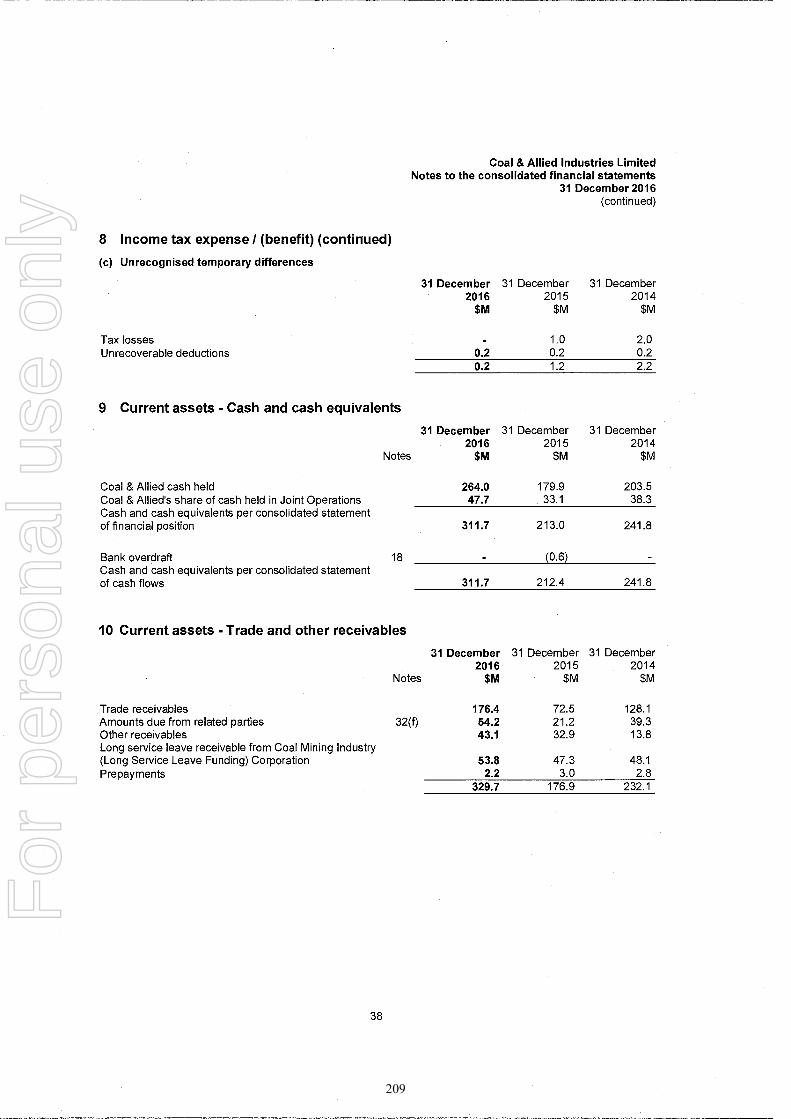
Coal & Allied Industries Limited Notes to the consolidated financial statements
31 December 2016 (continued)
8 Income tax expense / (benefit) (continued)
(c) Unrecognised temporary differences
31 December 31 December 31 December
2016 2015 2014
$M $M $M
Tax losses Unrecoverable deductions 0.2
1.0 0.2 1.2
0.2
9 Current assets - Cash and cash equivalents
31 December 31 December 31 December
2016 2015 2014 Notes
$M $M $M
Coal & Allied cash held Coal & Allied's share of cash held in Joint Operations
264.0 47.7
179.9 33.1
203.5 38.3
Cash and cash equivalents per consolidated statement of financial position 311.7 213.0 241.8
Bank overdraft 18 (0.6) Cash and cash equivalents per consolidated statement of cash flows 311.7 212.4 241.8
10 Current assets - Trade and other receivables
Notes
31 December 2016
$M
31 December 2015
$M
31 December 2014
$M
Trade receivables 176.4 72.5 128.1 Amounts due from related parties 32(f) 54.2 21.2 39.3 Other receivables 43.1 32.9 13.8 Long service leave receivable from Coal Mining Industry (Long Service Leave Funding) Corporation 53.8 47.3 48.1 Prepayments 2.2 3.0 2.8
329.7 176.9 232.1
2.0 0.2 2.2
38
209
For
per
sona
l use
onl
y
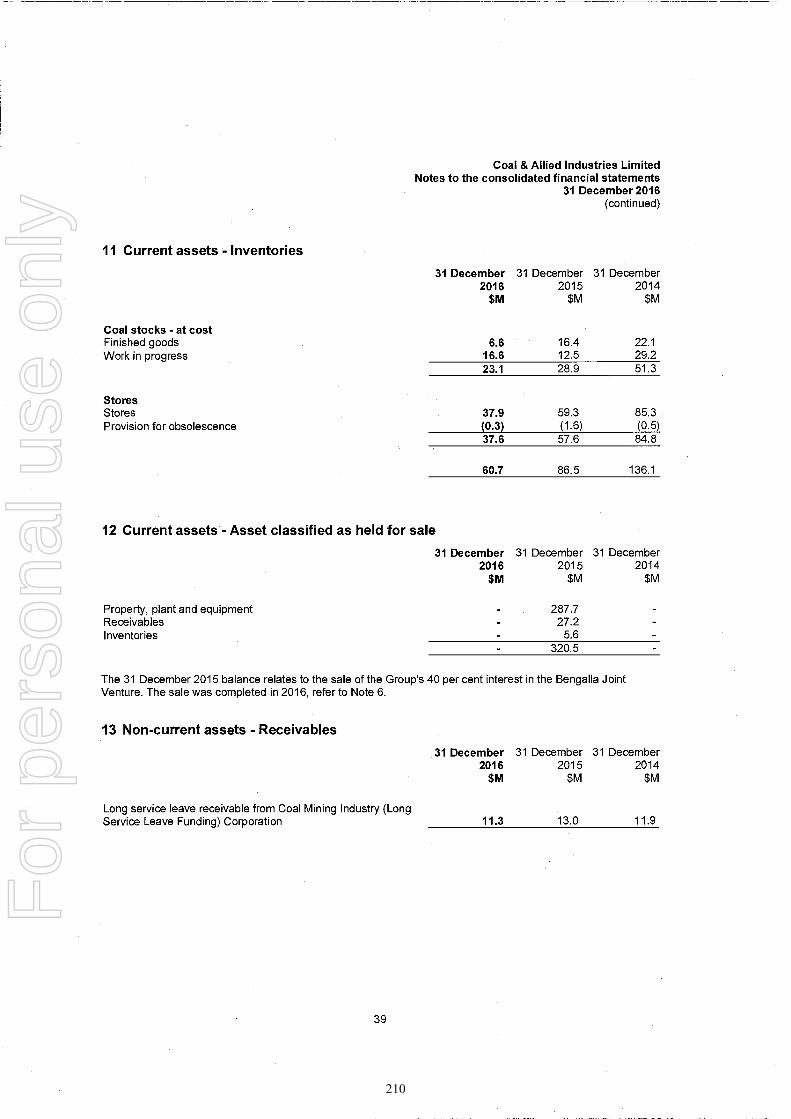
Coal & Allied Industries Limited Notes to the consolidated financial statements
31 December 2016 (continued)
11 Current assets - Inventories
Coal stocks - at cost
31 December 2016
$M
31 December 2015
$M
31 December 2014
$M
Finished goods 6.6 16.4 22.1 Work in progress 16.6 12.5 29.2
23.1 28.9 51.3
Stores Stores 37.9 59.3 85.3 Provision for obsolescence (0.3) (1.6) (0.5)
37.6 57.6 84.8
60.7 86.5 136.1
12 Current assets - Asset classified as held for sale
31 December 31 December 31 December
2016 2015 2014
$M $M $M
Property, plant and equipment 287.7 Receivables 27.2 Inventories 5.6
320.5
The 31 December 2015 balance relates to the sale of the Group's 40 per cent interest in the Bengalla Joint Venture. The sale was completed in 2016, refer to Note 6.
13 Non-current assets - Receivables
31 December 31 December 31 December
2016 2015 2014
$M $M $M
Long service leave receivable from Coal Mining Industry (Long Service Leave Funding) Corporation 11.3 13.0 11.9
39
210
For
per
sona
l use
onl
y
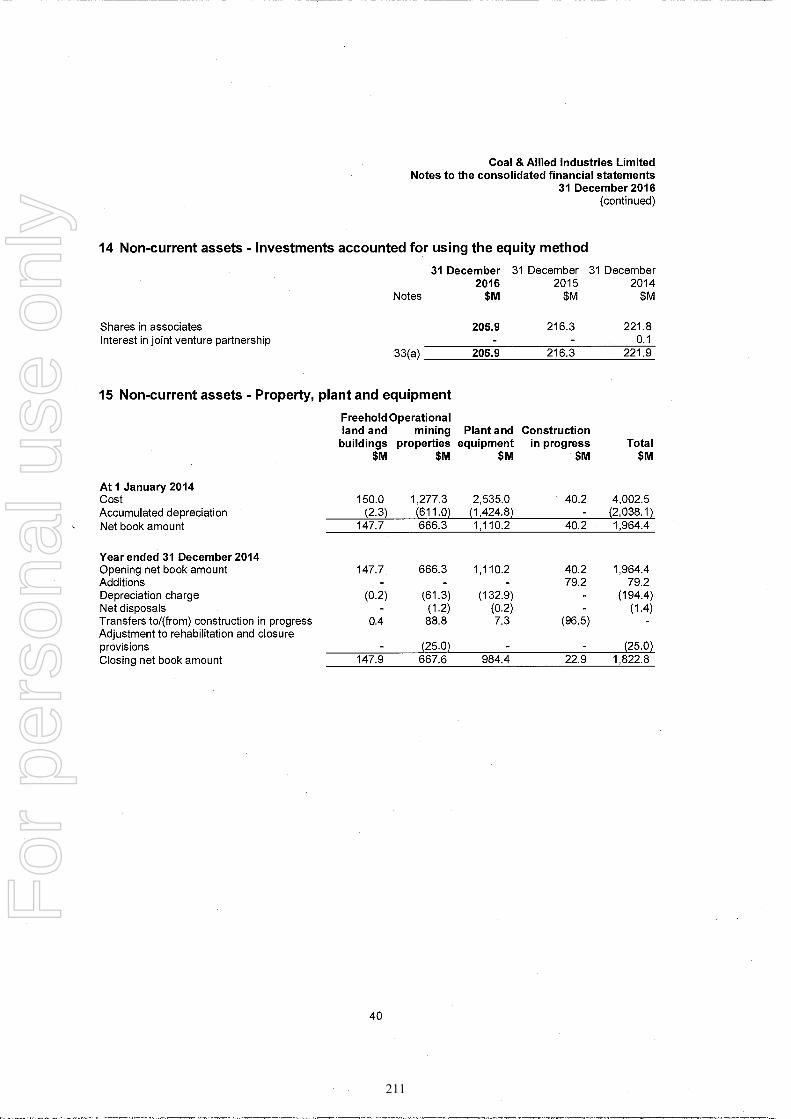
Coal & Allied Industries Limited Notes to the consolidated financial statements
31 December 2016 (continued)
14 Non-current assets - Investments accounted for using the equity method
31 December 31 December 31 December
2016 2015 2014 Notes
$M $M $M
Shares in associates 205.9
216.3 221.8 Interest in joint venture partnership 0.1
33(a) 205.9 216.3 221.9
15 Non-current assets - Property, plant and equipment
Freehold Operational
At 1 January 2014
land and buildings
$M
mining Plant and properties equipment
$M $M
Construction in progress
$M Total
$M
Cost 150.0 1,277.3 2,535.0 40.2 4,002.5 Accumulated depreciation (2.3) (611.0) (1,424.8) - (2,038.1) Net book amount 147.7 666.3 1,110.2 40.2 1,964.4
Year ended 31 December 2014 Opening net book amount 147.7 666.3 1,110.2 40.2 1,964.4 Additions 79.2 79.2 Depreciation charge (0.2) (61.3) (132.9) (194.4) Net disposals - (1.2) (0.2) - (1.4) Transfers to/(from) construction in progress 0.4 88.8 7.3 (96.5) Adjustment to rehabilitation and closure provisions - (25.0) (25.0) Closing net book amount 147.9 667.6 984.4 22.9 1,822.8
40
211
For
per
sona
l use
onl
y

Coal & Allied Industries Limited Notes to the consolidated financial statements
31 December 2016 (continued)
15 Non-current assets - Property, plant and equipment (continued)
Freehold Operational
At 1 January 2015
land and buildings
$M
mining Plant and properties equipment
$M $M
Construction in progress
$M Total
$M
Cost 150.4 1,339.9 2,525.9 22.9 4,039.1 Accumulated depreciation (2.5) (672.3) (1,541.5) - (2,216.3) Net book amount 147.9 667.6 984.4 22.9 1,822.8
Year ended 31 December 2015 Opening net book amount 147.9 667.6 984.4 22.9 1,822.8 Additions - 0.1 63.5 63.6 Depreciation charge (0.2) (33.9) (148.8) (182.9) Net disposals (0.6) (5.7) - (6.3) Assets classified as held for sale (159.5) (122.7) (5.5) (287.7) Transfers to/(from) construction in progress 2.1 4.6 48.9 (55.6) - Adjustment to rehabilitation and closure provisions - (5.7) (5.7) Closing net book amount 149.8 472.6 756.1 25.3 1,403.8
At 1 January 2016 Cost 152.5 1,018.2 2,267.1 25.3 3,463.1 Accumulated depreciation (2.7) (545.6) (1,511.0) - (2,059.3) Net book amount 149.8 472.6 756.1 25.3 1,403.8
Year ended 31 December 2016 Opening net book amount 149.8 472.6 756.1 25.3 1,403.8 Additions - - - 40.7 40.7 Depreciation charge (0.9) (17.8) (105.5) (124.2) Net disposals (0.6) 1.6 (0.3) 0.7 Net assets included in divested operations (210.4) (38.5) (144.6) (4.6) (398.1) Reclassifications 166.2 (166.2) - Transfers to/(from) construction in progress 15.8 8.5 17.2 (41.5) Adjustment to rehabilitation and closure provisions (8.5) - (8.5) Closing net book amount 119.9 251.7 522.9 19.9 914.4
At 31 December 2016 Cost 166.3 636.2 1,696.9 19.9 2,519.3 Accumulated depreciation (46.4) (384.5) (1,174.0) - (1,604.9) Net book amount 119.9 251.7 522.9 19.9 914.4
41
212
For
per
sona
l use
onl
y
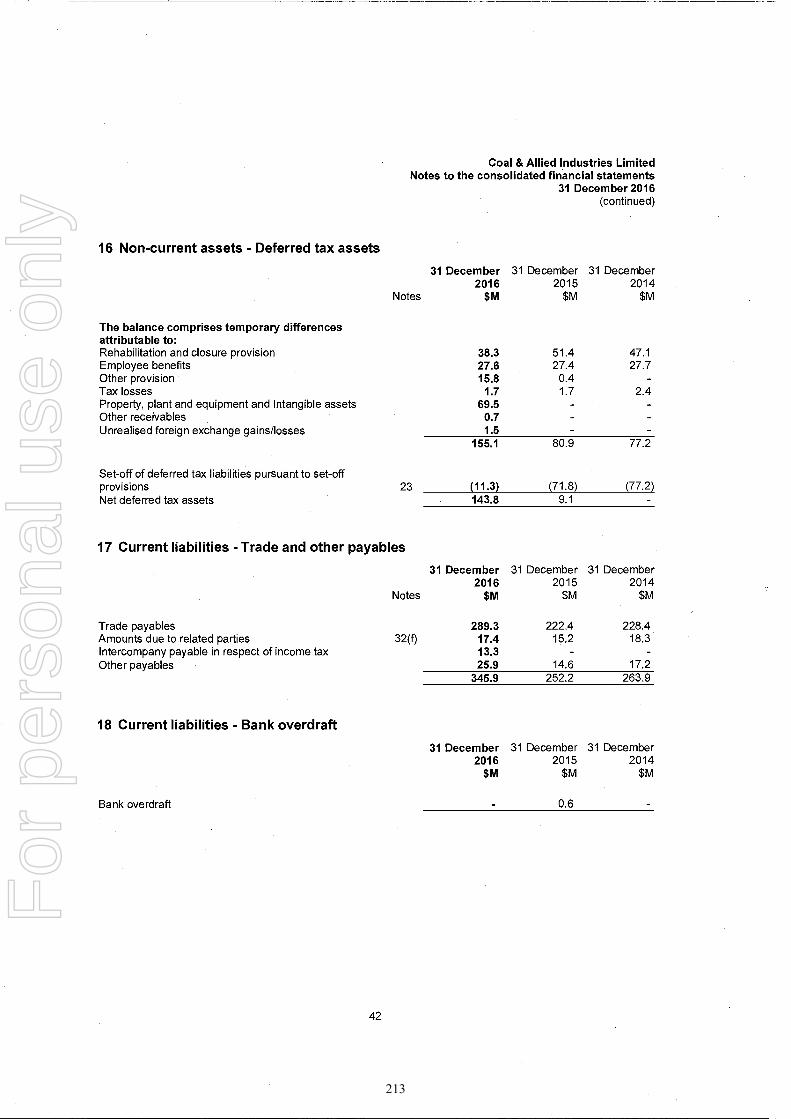
Coal & Allied Industries Limited Notes to the consolidated financial statements
31 December 2016 (continued)
16 Non-current assets - Deferred tax assets
Notes
The balance comprises temporary differences attributable to:
31 December 2016
$M
31 December 2015
$M
31 December 2014
$M
Rehabilitation and closure provision 38.3 51.4 47.1 Employee benefits 27.6 27.4 27.7 Other provision 15.8 0.4 - Tax losses 1.7 1.7 2.4 Property, plant and equipment and Intangible assets 69.5 - - Other receivables 0.7 Unrealised foreign exchange gains/losses 1.5
155.1 80.9 77.2
Set-off of deferred tax liabilities pursuant to set-off provisions 23 (11.3) (71.8) (77.2) Net deferred tax assets 143.8 9.1
17 Current liabilities - Trade and other payables
31 December 31 December 31 December 2016 2015 2014
Notes $M $M $M
Trade payables 289.3 222.4 228.4 Amounts due to related parties 32(f) 17.4 15.2 18.3 Intercompany payable in respect of income tax 13.3 - - Other payables 25.9 14.6 17.2
345.9 252.2 263.9
18 Current liabilities - Bank overdraft
31 December 31 December 31 December
2016 2015 2014
$M $M $M
Bank overdraft 0.6
42
213
For
per
sona
l use
onl
y
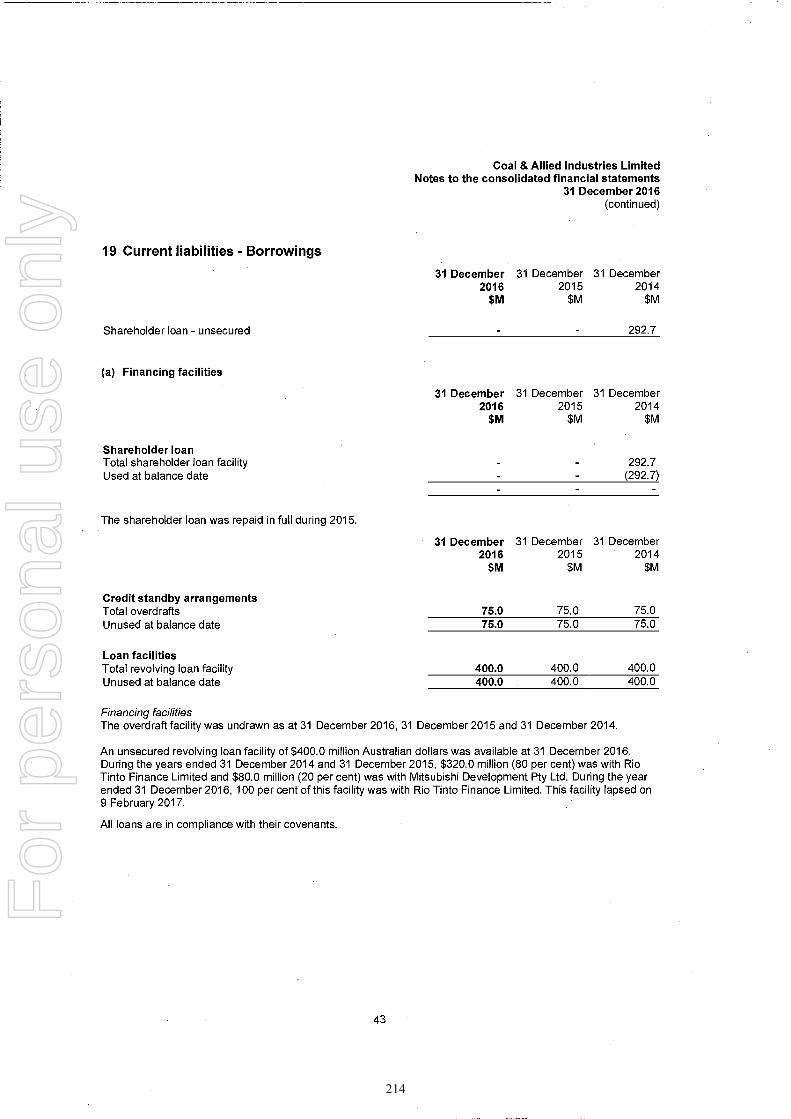
Coal & Allied Industries Limited Notes to the consolidated financial statements
31 December 2016 (continued)
19 Current liabilities - Borrowings
31 December 31 December 31 December
2016 2015 2014
$M $M $M
Shareholder loan - unsecured
(a) Financing facilities
Shareholder loan Total shareholder loan facility Used at balance date
The shareholder loan was repaid in full during 2015.
292.7
31 December 31 December 31 December
2016 2015 2014
$M $M $M
292.7 (292.7)
Credit standby arrangements
31 December 2016
$M
31 December 2015
$M
31 December 2014
$M
Total overdrafts 75.0 75.0 75.0 Unused at balance date 75.0 75.0 75.0
Loan facilities Total revolving loan facility 400.0 400.0 400.0 Unused at balance date 400.0 400.0 400.0
Financing facilities The overdraft facility was undrawn as at 31 December 2016, 31 December 2015 and 31 December 2014.
An unsecured revolving loan facility of $400.0 million Australian dollars was available at 31 December 2016. During the years ended 31 December 2014 and 31 December 2015, $320.0 million (80 per cent) was with Rio Tinto Finance Limited and $80.0 million (20 per cent) was with Mitsubishi Development Pty Ltd. During the year ended 31 December 2016, 100 per cent of this facility was with Rio Tinto Finance Limited. This facility lapsed on 9 February 2017.
All loans are in compliance with their covenants.
43
214
For
per
sona
l use
onl
y
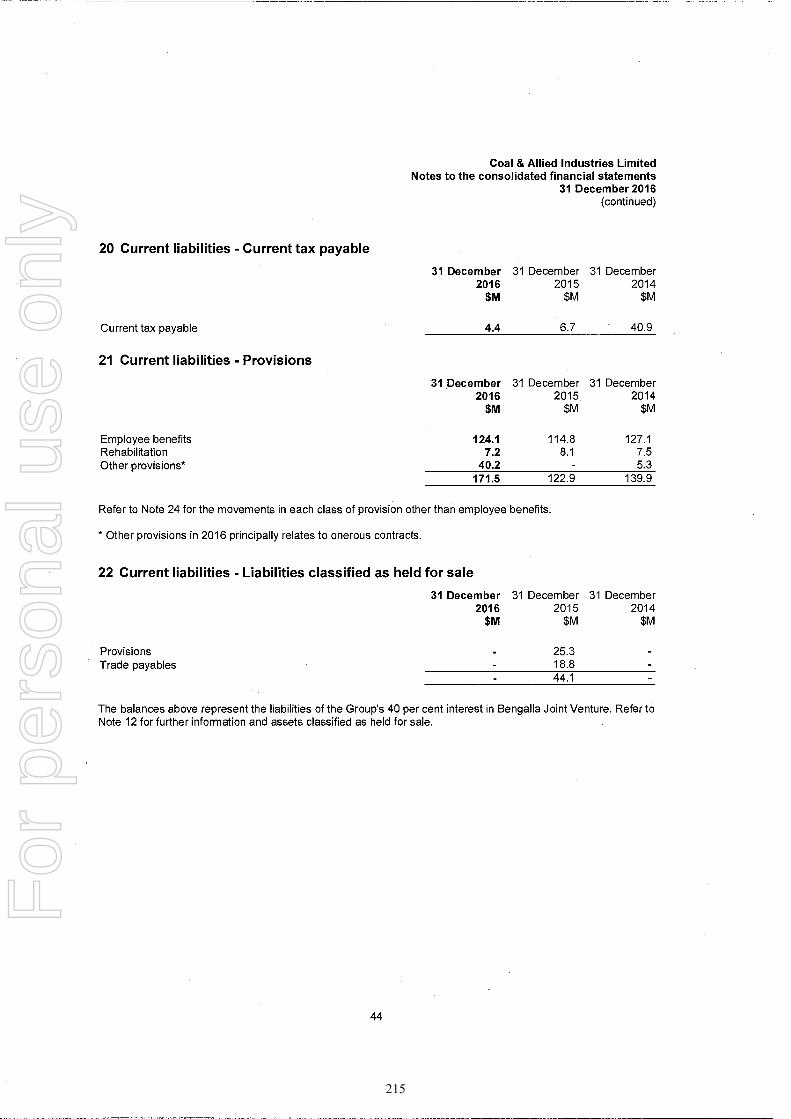
Coal & Allied Industries Limited Notes to the consolidated financial statements
31 December 2016 (continued)
20 Current liabilities - Current tax payable
31 December 31 December 31 December
2016 2015 2014
$M $M $M
Current tax payable 4.4
6.7 40.9
21 Current liabilities - Provisions
31 December 31 December 31 December
2016 2015 2014
$M $M $M
Employee benefits 124.1 114.8 127.1 Rehabilitation 7.2 8.1 7.5 Other provisions" 40.2 5.3
171.5 122.9 139.9
Refer to Note 24 for the movements in each class of provision other than employee benefits.
* Other provisions in 2016 principally relates to onerous contracts.
22 Current liabilities - Liabilities classified as held for sale
31 December 31 December 31 December
2016 2015 2014
$M $M $M
Provisions 25.3 Trade payables 18.8
44.1
The balances above represent the liabilities of the Group's 40 per cent interest in Bengalla Joint Venture. Refer to Note 12 for further information and assets classified as held for sale.
44
215
For
per
sona
l use
onl
y
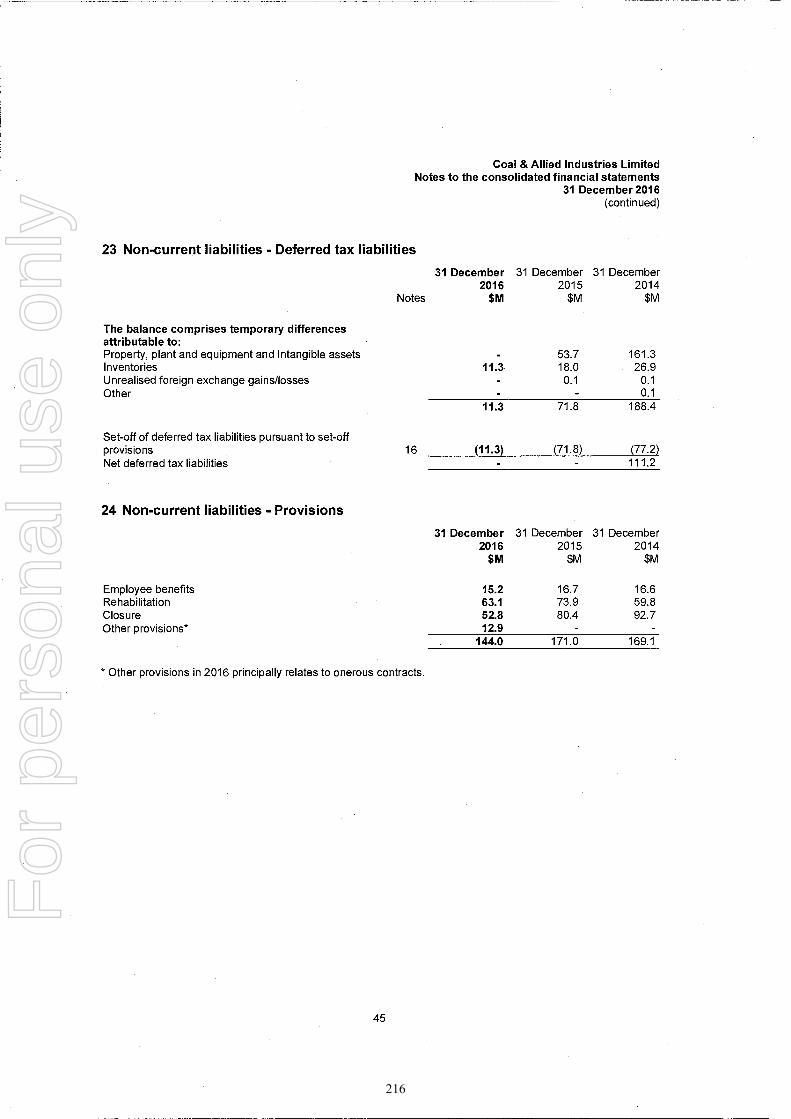
Coal & Allied Industries Limited Notes to the consolidated financial statements
31 December 2016 (continued)
23 Non-current liabilities - Deferred tax liabilities
The balance comprises temporary differences attributable to: •
Notes
31 December 2016
$M
31 December 2015
$M
31 December 2014
$M
Property, plant and equipment and Intangible assets 53.7 161.3 Inventories 11.3 18.0 26.9 Unrealised foreign exchange gains/losses 0.1 0.1 Other 0.1
11.3 71.8 188.4
Set-off of deferred tax liabilities pursuant to set-off provisions 16 (11.3) (71.8) (77.2) Net deferred tax liabilities 111.2
24 Non-current liabilities - Provisions
31 December 31 December 31 December 2016 2015 2014
$M $M $M
Employee benefits 15.2 16.7 16.6 Rehabilitation 63.1 73.9 59.8 Closure 52.8 80.4 92.7 Other provisions* 12.9 -
144.0 171.0 169.1
* Other provisions in 2016 principally relates to onerous contracts.
45
216
For
per
sona
l use
onl
y
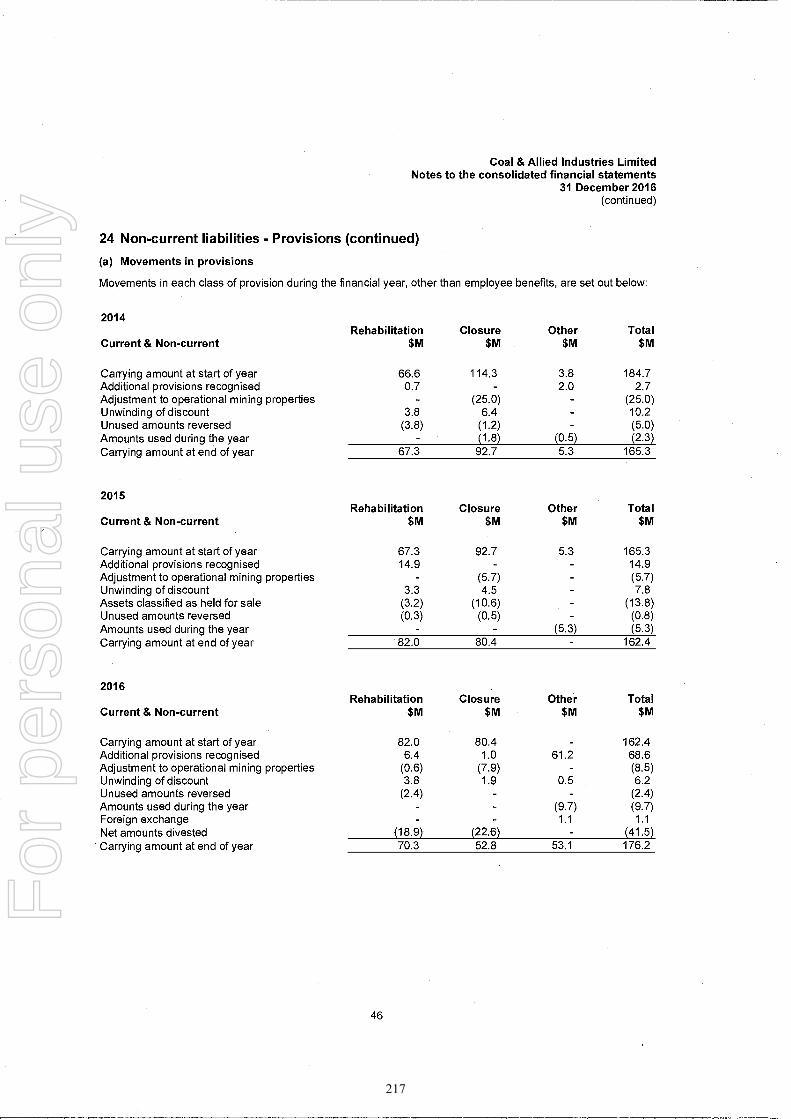
Coal & Allied Industries Limited Notes to the consolidated financial statements
31 December 2016 (continued)
24 Non-current liabilities - Provisions (continued)
(a) Movements in provisions
Movements in each class of provision during the financial year, other than employee benefits, are set out below:
2014
Rehabilitation Closure Other Total Current & Non-current $M $M $M $M
Carrying amount at start of year 66.6 114.3 3.8 184.7 Additional provisions recognised 0.7 - 2.0 2.7 Adjustment to operational mining properties - (25.0) - (25.0) Unwinding of discount 3.8 6.4 10.2 Unused amounts reversed (3.8) (1.2) (5.0) Amounts used during the year - (1.8) (0.5) (2.3) Carrying amount at end of year 67.3 92.7 5.3 165.3
2015
Current & Non-current
Carrying amount at start of year Additional provisions recognised Adjustment to operational mining properties Unwinding of discount Assets classified as held for sale Unused amounts reversed Amounts used during the year Carrying amount at end of year
2016
Current & Non-current
Rehabilitation Closure Other Total
$M $M $M $M
67.3
92.7 5.3 14.9
(5.7)
3.3 4.5
(3.2) (10.6)
(0.3) (0.5) (5.3)
82.0 80.4
Rehabilitation Closure Other Total
$M $M $M $M
165.3 14.9 (5.7) 7.8
(13.8) (0.8) (5.3)
162.4
Carrying amount at start of year 82.0 80.4 - 162.4 Additional provisions recognised 6.4 1.0 61.2 68.6 Adjustment to operational mining properties (0.6) (7.9) - (8.5) Unwinding of discount 3.8 1.9 0.5 6.2 Unused amounts reversed (2.4) - - (2.4) Amounts used during the year - (9.7) (9.7) Foreign exchange 1.1 1.1 Net amounts divested (18.9) (22.6) - (41.5) Carrying amount at end of year 70.3 52.8 53.1 176.2
46
217
For
per
sona
l use
onl
y
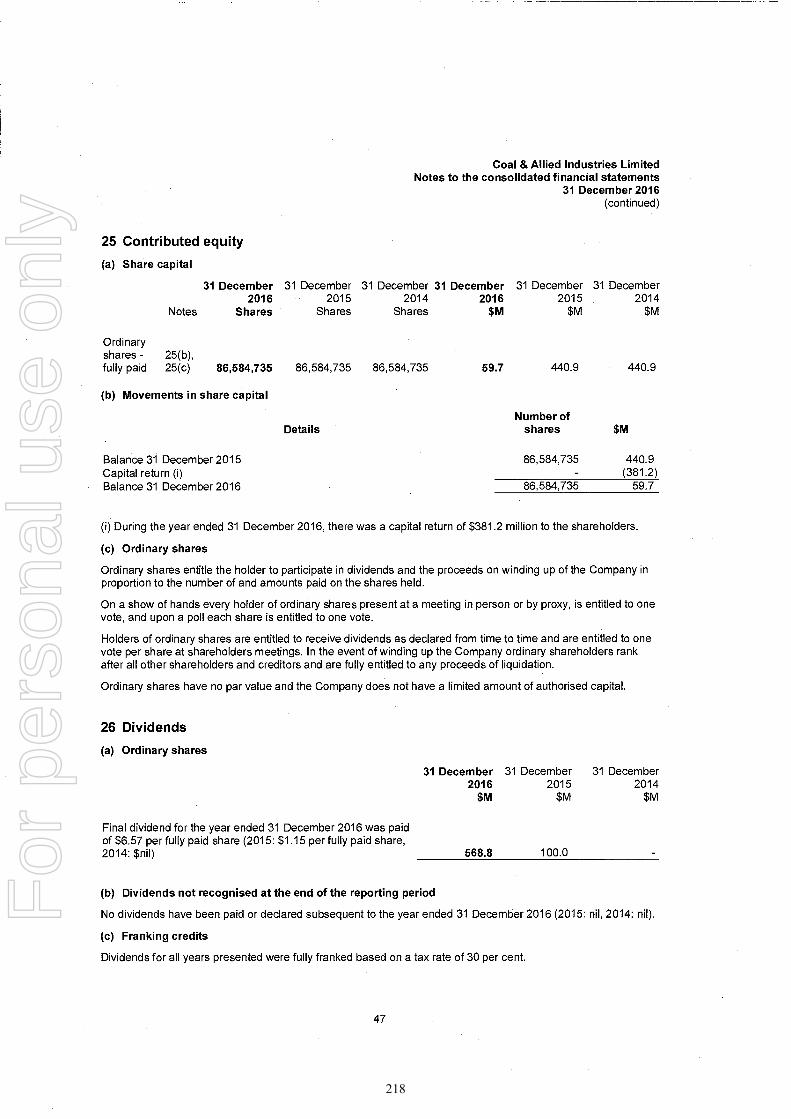
Coal & Allied Industries Limited Notes to the consolidated financial statements
31 December 2016 (continued)
25 Contributed equity
(a) Share capital
31 December 31 December 31 December 31 December 31 December 31 December 2016 2015 2014 2016 2015 2014
Notes Shares Shares Shares $M $M $M
Ordinary shares - fully paid
25(b), 25(c) 86,584,735 86,584,735 86,584,735 59.7 440.9 440.9
(b) Movements in share capital
Number of Details shares $M
Balance 31 December 2015 86,584,735 440.9 Capital return (i) (381.2) Balance 31 December 2016 86,584,735 59.7
(i) During the year ended 31 December 2016, there was a capital return of $381.2 million to the shareholders.
(c) Ordinary shares
Ordinary shares entitle the holder to participate in dividends and the proceeds on winding up of the Company in proportion to the number of and amounts paid on the shares held.
On a show of hands every holder of ordinary shares present at a meeting in person or by proxy, is entitled to one vote, and upon a poll each share is entitled to one vote.
Holders of ordinary shares are entitled to receive dividends as declared from time to time and are entitled to one vote per share at shareholders meetings. In the event of winding up the Company ordinary shareholders rank after all other shareholders and creditors and are fully entitled to any proceeds of liquidation.
Ordinary shares have no par value and the Company does not have a limited amount of authorised capital.
26 Dividends
(a) Ordinary shares
31 December 31 December 31 December 2016 2015 2014
$M $M $M
Final dividend for the year ended 31 December 2016 was paid of $6.57 per fully paid share (2015: $1.15 per fully paid share, 2014: $nil) 568.8 100.0
(b) Dividends not recognised at the end of the reporting period
No dividends have been paid or declared subsequent to the year ended 31 December 2016 (2015: nil, 2014: nil).
(c) Franking credits
Dividends for all years presented were fully franked based on a tax rate of 30 per cent.
47
218
For
per
sona
l use
onl
y
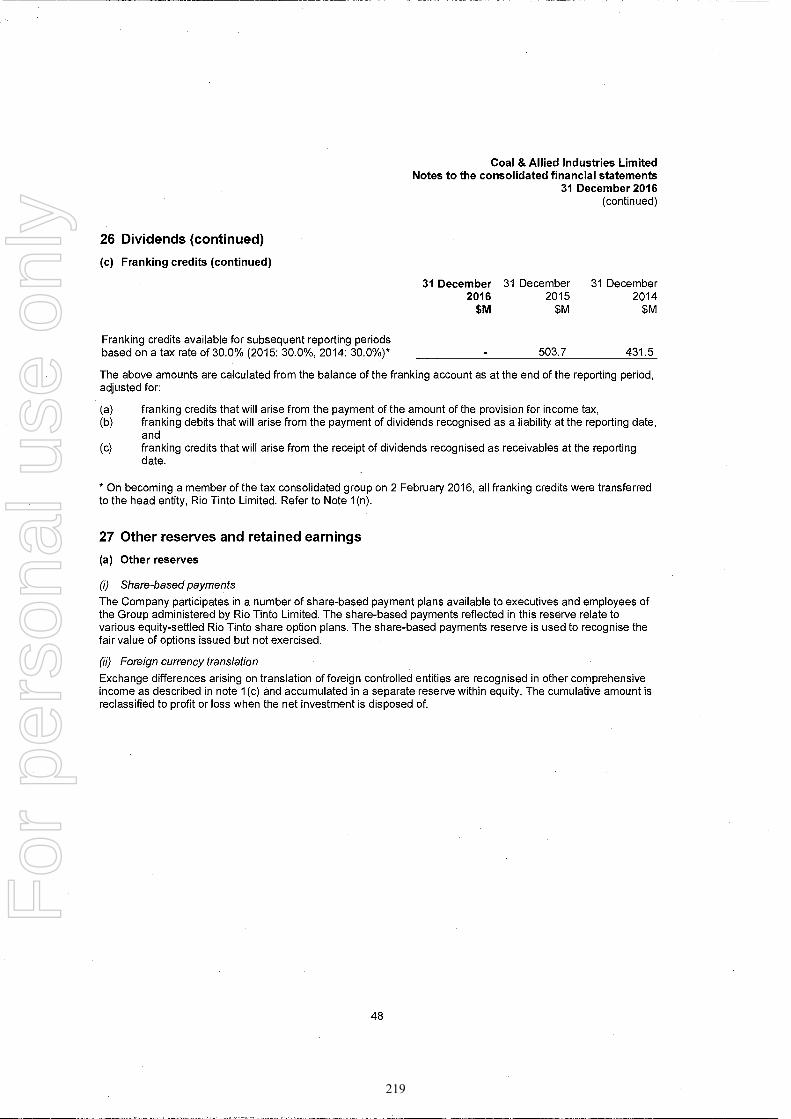
Coal & Allied Industries Limited Notes to the consolidated financial statements
31 December 2016 (continued)
26 Dividends (continued)
(c) Franking credits (continued)
31 December 31 December 31 December 2016 2015 2014
$M $M $M
Franking credits available for subsequent reporting periods based on a tax rate of 30.0% (2015: 30.0%, 2014: 30.0%)" 503.7 431.5
The above amounts are calculated from the balance of the franking account as at the end of the reporting period, adjusted for:
(a) franking credits that will arise from the payment of the amount of the provision for income tax, (b) franking debits that will arise from the payment of dividends recognised as a liability at the reporting date,
and (c) franking credits that will arise from the receipt of dividends recognised as receivables at the reporting
date.
" On becoming a member of the tax consolidated group on 2 February 2016, all franking credits were transferred to the head entity, Rio Tinto Limited. Refer to Note 1(n).
27 Other reserves and retained earnings
(a) Other reserves
(i) Share-based payments
The Company participates in a number of share-based payment plans available to executives and employees of the Group administered by Rio Tinto Limited. The share-based payments reflected in this reserve relate to various equity-settled Rio Tinto share option plans. The share-based payments reserve is used to recognise the fair value of options issued but not exercised.
(ii) Foreign currency translation
Exchange differences arising on translation of foreign controlled entities are recognised in other comprehensive income as described in note 1(c) and accumulated in a separate reserve within equity. The cumulative amount is reclassified to profit or loss when the net investment is disposed of.
48
219
For
per
sona
l use
onl
y

Coal & Allied Industries Limited Notes to the consolidated financial statements
31 December 2016 (continued)
27 Other reserves and retained earnings (continued)
(a) Other reserves (continued)
(iii) Other reserves
Other reserves relates to the equity instruments reserve of Port Waratah Coal Services Ltd, an equity accounted associate of Coal & Allied Industries Limited.
31 December 31 December 31 December
2016 2015 2014
$M $M $M
Share-based payments 9.6 11.0 6.6 Foreign currency translation - 0.1 Other reserves 0.7 0.7
10.3 11.7 6.7
(b) Retained earnings
Movements in retained earnings were as follows:
31 December 31 December 31 December
2016 2015 2014
$M $M $M
Balance 1 January
1,411.7
1,228.9
1,140.8 Net profit for the year
396.2
282.8
88.1 Dividends paid
(568.8)
(100.0) Balance 31 December
1,239.1
1,411.7 1,228.9
28 Non-controlling interests
31 December 31 December 31 December
2016 2015 2014
$M $M $M
Interest in: Retained earnings 2.7
2.7 2.3
49
220
For
per
sona
l use
onl
y
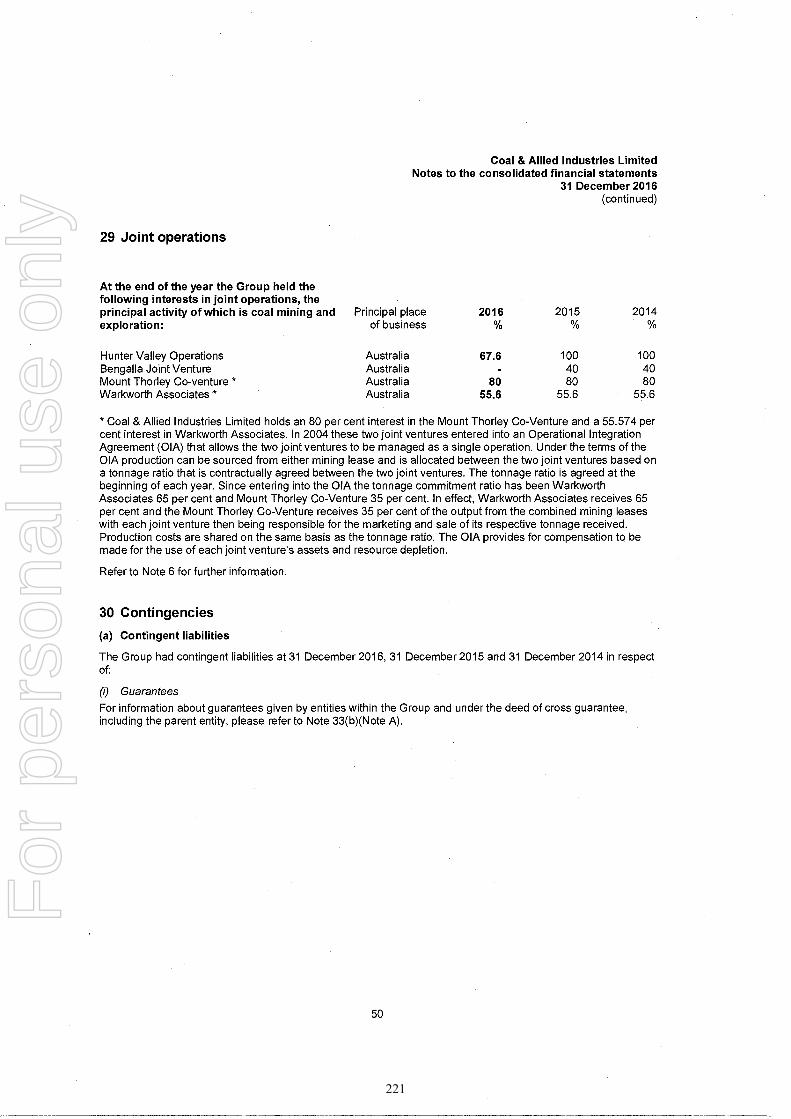
Coal & Allied Industries Limited Notes to the consolidated financial statements
31 December 2016 (continued)
29 Joint operations
At the end of the year the Group held the following interests in joint operations, the principal activity of which is coal mining and exploration:
Principal place of business
2016 2015 2014
Hunter Valley Operations Australia 67.6 100 100 Bengalla Joint Venture Australia - 40 40 Mount Thorley Co-venture " Australia 80 80 80 Warkworth Associates " Australia 55.6 55.6 55.6
* Coal & Allied Industries Limited holds an 80 per cent interest in the Mount Thorley Co-Venture and a 55.574 per cent interest in Warkworth Associates. In 2004 these two joint ventures entered into an Operational Integration Agreement (01A) that allows the two joint ventures to be managed as a single operation. Under the terms of the OIA production can be sourced from either mining lease and is allocated between the two joint ventures based on a tonnage ratio that is contractually agreed between the two joint ventures. The tonnage ratio is agreed at the beginning of each year. Since entering into the 01A the tonnage commitment ratio has been Warkworth Associates 65 per cent and Mount Thorley Co-Venture 35 per cent. In effect, Warkworth Associates receives 65 per cent and the Mount Thorley Co-Venture receives 35 per cent of the output from the combined mining leases with each joint venture then being responsible for the marketing and sale of its respective tonnage received. Production costs are shared on the same basis as the tonnage ratio. The OIA provides for compensation to be made for the use of each joint venture's assets and resource depletion.
Refer to Note 6 for further information.
30 Contingencies
(a) Contingent liabilities
The Group had contingent liabilities at 31 December 2016, 31 December 2015 and 31 December 2014 in respect of:
(i) Guarantees
For information about guarantees given by entities within the Group and under the deed of cross guarantee, including the parent entity, please refer to Note 33(b)(Note A).
50
221
For
per
sona
l use
onl
y

Coal & Allied Industries Limited Notes to the consolidated financial statements
31 December 2016 (continued)
30 Contingencies (continued)
(a) Contingent liabilities (continued)
Bank guarantees for restoration obligations The consolidated entity has a programme of on-going restoration as part of its mining operations. Guarantees have been provided to the NSW government in respect of the cost of restoration of certain leasehold properties, representing guarantees required by statute. A provision for mine site restoration of $123.1 million (2015: $162.4 million, 2014: $160.0 million) has been raised with regard to this obligation.
Bank guarantee for port allocation The consolidated entity has entered into various agreements with Port Waratah Coal Services Limited to secure port allocation arrangements and coal handling services. The consolidated entity has entered into various agreements with Newcastle Coal Infrastructure Group Pty Ltd as a condition of participating in the port nomination process.
Bank guarantees for rail network access The consolidated entity has entered into an access holder agreement with Australian Rail Track Corporation Limited relating to rail access to the Hunter Valley Network.
Bank guarantees for land conservation and environmental land offsets The consolidated entity has entered into various agreements with the Commonwealth Office of the Environment and Heritage, trading as National Parks and Wildlife with respect to land development in the Lower Hunter region.
Bank guarantees for infrastructure and emergency services The consolidated entity has entered into agreements with the NSW Department of Planning And Infrastructure for infrastructure and emergency services relating to land development applications in the Lower Hunter Valley.
Bank guarantee for other miscellaneous obligations The consolidated entity has entered into various agreements with State and local government authorities and other entities
31 December 31 December 31 December
2016 2015 2014
SM $M $M
175.2 227.5 208.9
91.4 97.8 103.1
22.5 14.2 15.1
18.9 18.9 18.9
5.2 5.2 5.2
6.3 1.2 1.2
51
222
For
per
sona
l use
onl
y
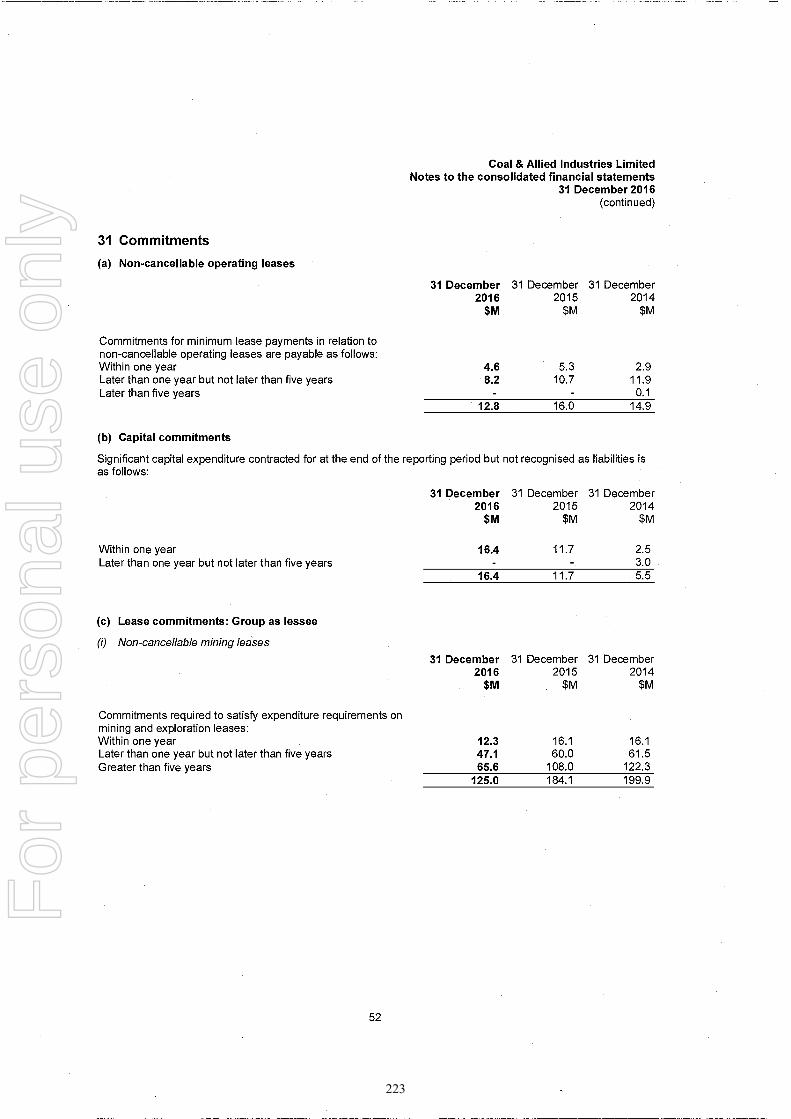
Coal & Allied Industries Limited Notes to the consolidated financial statements
31 December 2016 (continued)
31 Commitments
(a) Non-cancellable operating leases
31 December 31 December 31 December
2016 2015 2014
$M $M $M
Commitments for minimum lease payments in relation to non-cancellable operating leases are payable as follows: Within one year 4.6 5.3 2.9 Later than one year but not later than five years 8.2 10.7 11.9 Later than five years 0.1
12.8 16.0 14.9
(b) Capital commitments
Significant capital expenditure contracted for at the end of the reporting period but not recognised as liabilities is as follows:
31 December 31 December 31 December
2016 2015 2014
$M $M $M
Within one year 16.4 11.7 2.5 Later than one year but not later than five years - 3.0
16.4 11.7 5.5
(c) Lease commitments: Group as lessee
(i) Non-cancellable mining leases
31 December 31 December 31 December
2016 2015 2014
$M $M $M
Commitments required to satisfy expenditure requirements on mining and exploration leases: Within one year Later than one year but not later than five years Greater than five years
12.3
16.1
16.1
47.1
60.0
61.5
65.6
108.0
122.3
125.0
184.1
199.9
52
223
For
per
sona
l use
onl
y
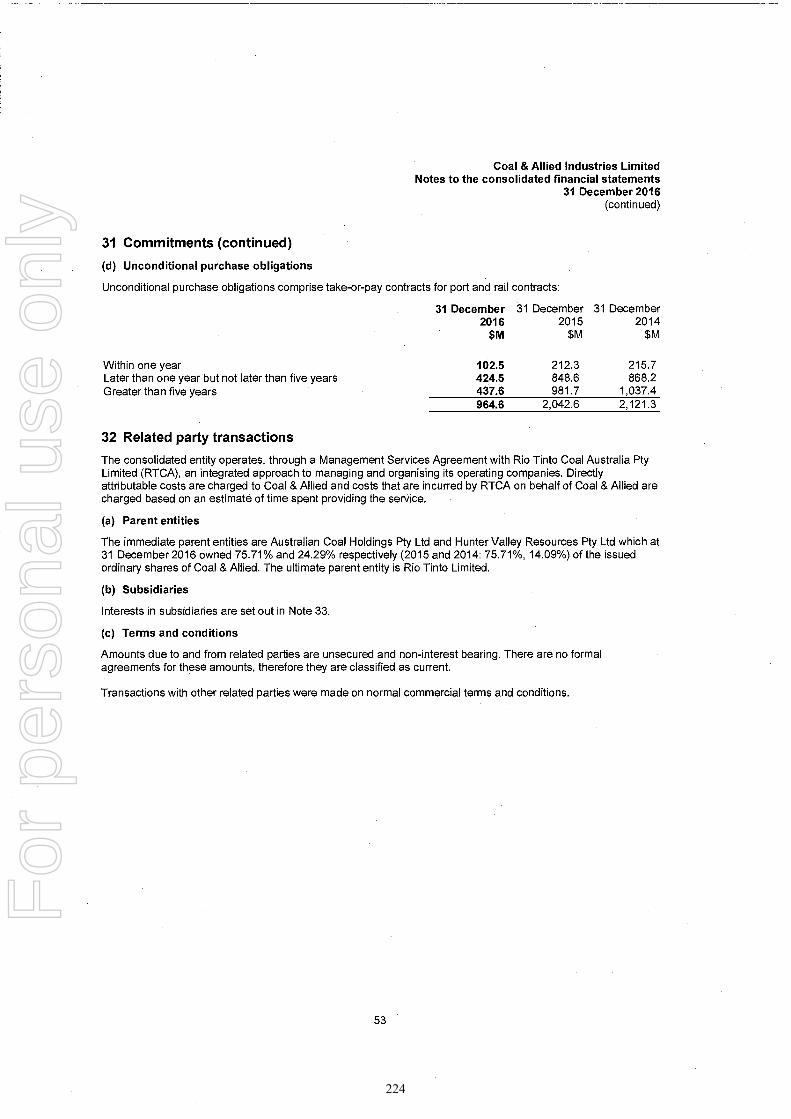
Coal & Allied Industries Limited Notes to the consolidated financial statements
31 December 2016 (continued)
31 Commitments (continued)
(d) Unconditional purchase obligations
Unconditional purchase obligations comprise take-or-pay contracts for port and rail contracts:
31 December 31 December 31 December
2016 2015 2014
SRI $M $M
Within one year 102.5 212.3 215.7 Later than one year but not later than five years 424.5 848.6 868.2 Greater than five years 437.6 981.7 1,037.4
964.6 2,042.6 2,121.3
32 Related party transactions
The consolidated entity operates, through a Management Services Agreement with Rio Tinto Coal Australia Pty Limited (RICA), an integrated approach to managing and organising its operating companies. Directly attributable costs are charged to Coal & Allied and costs that are incurred by RICA on behalf of Coal & Allied are charged based on an estimate of time spent providing the service.
(a) Parent entities
The immediate parent entities are Australian Coal Holdings Pty Ltd and Hunter Valley Resources Pty Ltd which at 31 December 2016 owned 75.71% and 24.29% respectively (2015 and 2014: 75.71%, 14.09%) of the issued ordinary shares of Coal & Allied. The ultimate parent entity is Rio Tinto Limited.
(b) Subsidiaries
Interests in subsidiaries are set out in Note 33.
(c) Terms and conditions
Amounts due to and from related parties are unsecured and non-interest bearing. There are no formal agreements for these amounts, therefore they are classified as current.
Transactions with other related parties were made on normal commercial terms and conditions.
53
224
For
per
sona
l use
onl
y

Coal & Allied Industries Limited Notes to the consolidated financial statements
31 December 2016 (continued)
32 Related party transactions (continued)
(d) Key management personnel compensation
Australian Accounting Standard (AASB 124) requires disclosures for key management personnel (KMP). KMPs are persons (including executive and non-executive directors of Coal & Allied) having the authority and responsibility for planning, directing and controlling the Company's and Group's activities, directly or indirectly.
Compensation has been disclosed for the directors providing services to the Company even though employed by other Rio Tinto entities. Compensation for these KMP includes 100% of their compensation and has not been apportioned according to their actual services provided to the Company. No compensation information has been provided for any Mitsubishi Corporation directors as these directors did not receive fees for their services provided. The following directors have been included in total compensation relating to KMP.
Key management personnel covered in this report
Director S Ellinor R Francis R Hassell S Kaufman B White R Albones C Salisbury I Vella S Watson M Halliday P Keenan B Long R Payne
Period covered 1 January 2014 to 31 December 2016 10 October 2016 to 31 December 2016 10 October 2016 to 31 December 2016 3 August 2016 to 31 December 2016 20 April 2015 to 31 December 2016 1 April 2015 to 4 April 2016 1 January 2014 to 3 August 2016 1 March 2016 to 3 August 2016 3 August 2016 to 10 October 2016 1 January 2014 to 28 October 2015 1 January 2014 to 1 April 2015 1 January 2014 to 24 March 2015 1 January 2014 to 16 March 2015
In addition to the directors, the following other key management personnel have been identified due to their positions held within the Company.
Other KMP M Eaglesham T Lukeman D Janney J Scarini C Halfpenny M Rodgers M Roberts
Position Chief Operating Officer General Manager, Hunter Valley Operations General Manager, Bengalla General Manager, Bengalla General Manager, Mount Thorley Warkworth General Manager, Mount Thorley Warkworth General Manager, Sales & Marketing
Period covered 1 January 2014 to 28 February 2016 1 January 2014 to 31 December 2016 1 January 2014 to 31 August 2014 1 September 2014 to 1 March 2016 1 January 2014 to 31 May 2014 1 June 2014 to 31 December 2016 1 January 2014 to 31 December 2016
54
225
For
per
sona
l use
onl
y

Coal & Allied Industries Limited Notes to the consolidated financial statements
31 December 2016 (continued)
32 Related party transactions (continued)
(d) Key management personnel compensation (continued)
Key management personnel compensation
31 December 2016 $000
31 December 2015 $000
31 December 2014 $000
Short-term employee benefits 5,144.7 5,605.2 5,791.9 Post-employment benefits 289.7 332.8 326.3 Long-term benefits 114.2 323.8 120.4 Termination benefits 664.4 Share-based payments 1,460.0 1,992.0 2,657.0
(e) Ownership interests in related parties
7,673.0 8,253.8 8,895.6
Interests held in the following classes of related parties are set out in the following notes: Joint operations - Note 29 Associates and Joint Ventures - Note 33(a)
(f) Amounts due to and from related parties as at 31 December
31 December 31 December 31 December 2016 2015 2014
Notes $000 $000 $000
Cash deposited with Rio Tinto Finance Limited 231,360.6 159,173.5 172,532.0 Amounts due from related parties 10 54,248.9 21,230.5 39,253.1 Amounts due to related parties 17 (17,436.8) (15,184.4) (18,291.7)
55
226
For
per
sona
l use
onl
y

Coal & Allied Industries Limited Notes to the consolidated financial statements
31 December 2016 (continued)
32 Related party transactions (continued)
(g) Transactions with other related parties
The following transactions occurred with other related parties:
Rio Tinto Group companies Expenditure
31 December 2016 $000
31 December 2015 $000
31 December 2014 $000
Insurance services (4,232.3) (4,375.9) (5,902.4) Management services (53,213.0) (62,129.0) (32,414.0) Interest paid (5,964.7) (15,782.9) Shipping services (2,888.3) (17,554.2) (17,662.7) Consulting services (1,804.3) (1,419.0) Debt forgiveness (1,474,987.8)
Revenue Interest received 16,491.2 4,586.8 4,218.9 Coal sales 206,429.8 247,009.8 202,791.8
Other related companies Port Waratah Coal Services Limited Coal handling charges (36,403.9) (65,103.1) (82,027.5) Management fee 1,598.3 574.1 1,545.3 Employee related recharges 1,065.9 444.8 1,108.7 Dividend revenue-associates 12,742.6 11,982.7 11,690.6
Mitsubishi Development Pty Limited Commissions paid (1,344.1) (780.0) (2,302.6) Interest paid (1,575.5) (2,130.8)
56
227
For
per
sona
l use
onl
y
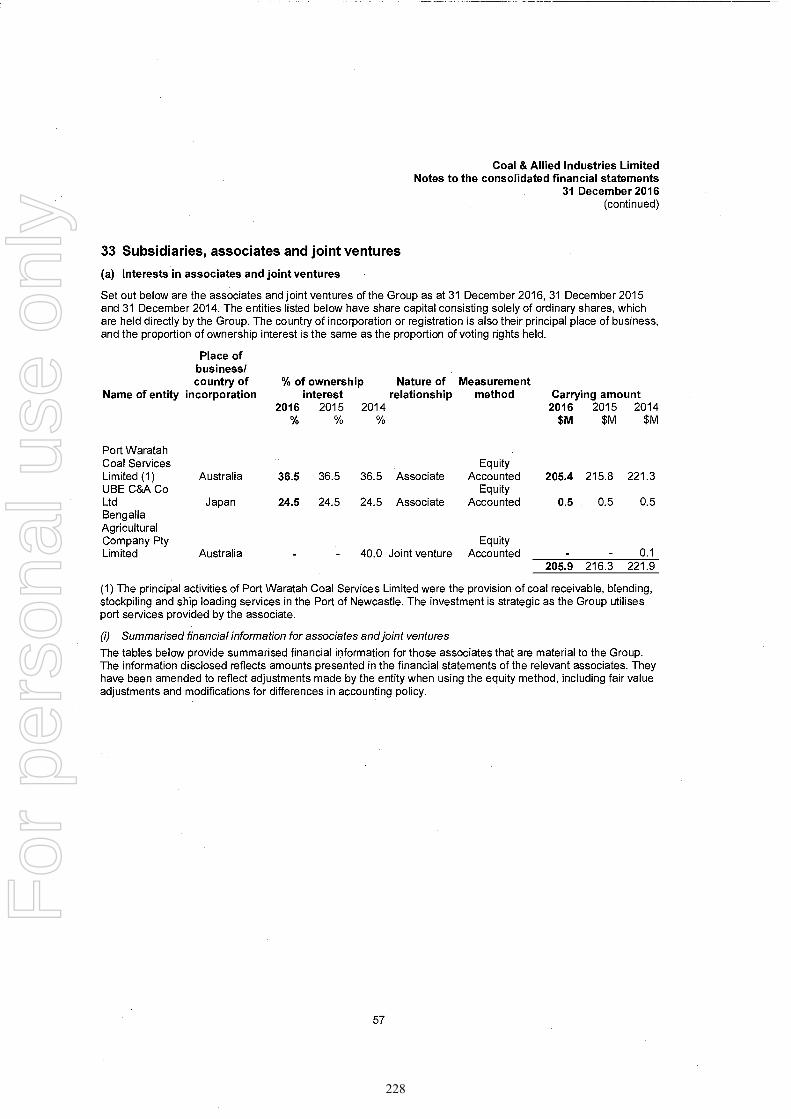
Coal & Allied Industries Limited Notes to the consolidated financial statements
31 December 2016 (continued)
33 Subsidiaries, associates and joint ventures
(a) Interests in associates and joint ventures
Set out below are the associates and joint ventures of the Group as at 31 December 2016, 31 December 2015 and 31 December 2014. The entities listed below have share capital consisting solely of ordinary shares, which are held directly by the Group. The country of incorporation or registration is also their principal place of business, and the proportion of ownership interest is the same as the proportion of voting rights held.
Place of business/ country of
Name of entity incorporation % of ownership Nature of Measurement
interest relationship method 2016 2015 2014
Carrying amount
2016 2015 2014
$M $M $M
Port Waratah Coal Services Equity Limited (1) Australia 36.5 36.5 36.5 Associate Accounted 205.4 215.8 221.3 UBE C&A Co Equity Ltd Japan 24.5 24.5 24.5 Associate Accounted 0.5 0.5 0.5 Bengalla Agricultural Company Pty Equity Limited Australia - 40.0 Joint venture Accounted - 0.1
205.9 216.3 221.9
(1) The principal activities of Port Waratah Coal Services Limited were the provision of coal receivable, blending, stockpiling and ship loading services in the Port of Newcastle. The investment is strategic as the Group utilises port services provided by the associate.
(i) Summarised financial information for associates and joint ventures
The tables below provide summarised financial information for those associates that are material to the Group. The information disclosed reflects amounts presented in the financial statements of the relevant associates. They have been amended to reflect adjustments made by the entity when using the equity method, including fair value adjustments and modifications for differences in accounting policy.
57
228
For
per
sona
l use
onl
y
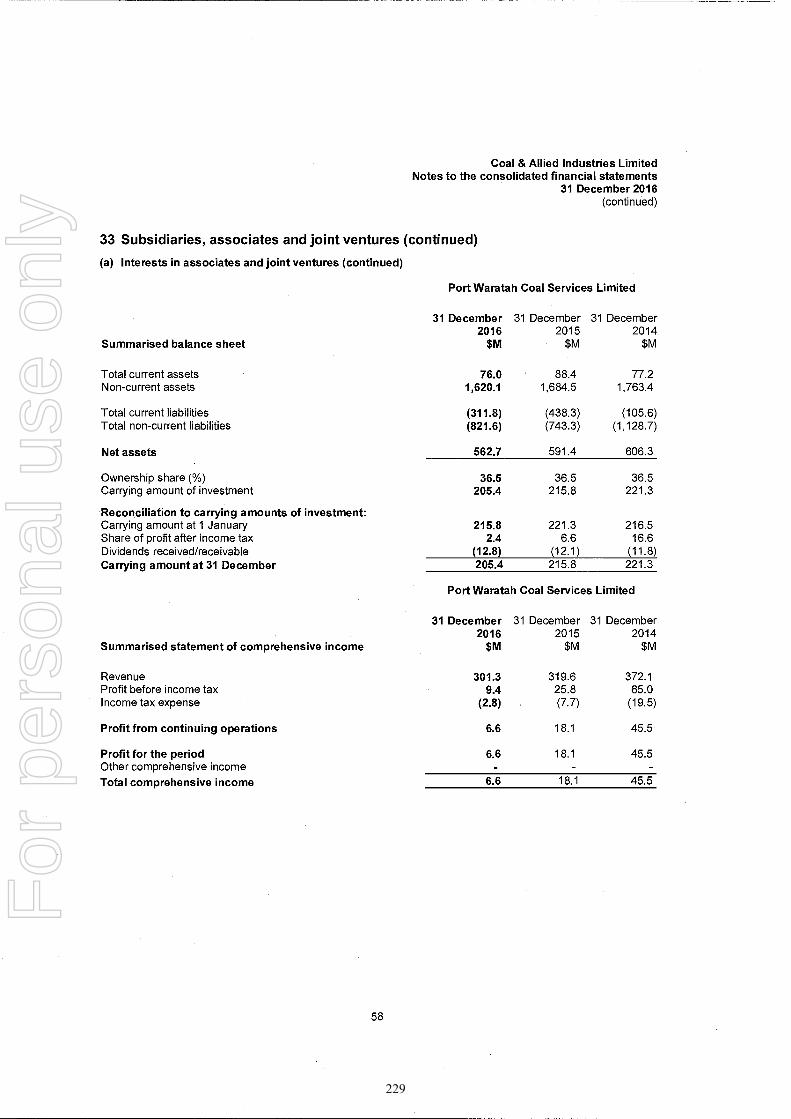
Coal & Allied Industries Limited Notes to the consolidated financial statements
31 December 2016 (continued)
33 Subsidiaries, associates and joint ventures (continued)
(a) Interests in associates and joint ventures (continued)
Port Waratah Coal Services Limited
31 December 31 December 31 December
2016 2015 2014 Summarised balance sheet $M $M $M
Total current assets 76.0 88.4 77.2 Non-current assets 1,620.1 1,684.5 1,763.4
Total current liabilities (311.8) (438.3) (105.6) Total non-current liabilities (821.6) (743.3) (1,128.7)
Net assets 562.7 591.4 606.3
Ownership share (%) 36.5 36.5 36.5 Carrying amount of investment 205.4 215.8 221.3
Reconciliation to carrying amounts of investment: Carrying amount at 1 January 215.8 221.3 216.5 Share of profit after income tax 2.4 6.6 16.6 Dividends received/receivable (12.8) (12.1) (11.8) Carrying amount at 31 December 205.4 215.8 221.3
Port Waratah Coal Services Limited
31 December 31 December 31 December
2016 2015 2014 Summarised statement of comprehensive income $M $M $M
Revenue 301.3 319.6 372.1 Profit before income tax 9.4 25.8 65.0 Income tax expense (2.8) (7.7) (19.5)
Profit from continuing operations 6.6 18.1 45.5
Profit for the period 6.6 18.1 45.5 Other comprehensive income - Total comprehensive income 6.6 18.1 45.5
58
229
For
per
sona
l use
onl
y

Coal & Allied Industries Limited Notes to the consolidated financial statements
31 December 2016 (continued)
33 Subsidiaries, associates and joint ventures (continued)
(a) Interests in associates and joint ventures (continued)
(i) Share of associates expenditure commitment
31 December 2016
$M
31 December 2015
$M
31 December 2014
$M
Capital commitments 14.5 23.8 38.4 Lease commitments 42.9 47.5 53.7 Other commitments 14.4 19.2 25.9
(b) Significant investments in subsidiaries
71.8 90.5 118.0
The consolidated financial statements incorporate the assets, liabilities and results of the following principal subsidiaries in accordance with the accounting policy described in Note 1(b). The proportion of ownership interest is the same proportion of voting rights held.
Notes 31 December
2016 %
31 December 2015
%
31 December 2014
cyo
Australian Coal Resources Limited A 100 100 100 Black Hill Land Pty Ltd 100 100 100 Catherine Hill Bay Land Pty Ltd 100 100 100 CNA Bengalla Pty Limited - 100 100 CNA Bengalla Investments Pty Limited A 100 100 100 CNA Investments (UK) Pty Limited 100 100 100 CNA Resources Holdings Pty Limited 100 100 100 CNA Resources Limited A 100 100 100 CNA Sub Holdings Pty Limited 100 100 100 CNA Warkworth Australasia Pty Limited A 100 100 100 CNA UK Limited 100 100 Coal & Allied Mining Services Pty Limited A 100 100 100 Coal & Allied Operations Pty Limited A 100 100 100 Darex Capital Inc (UK) - 100 100 Dolphin Properties Pty Limited C 100 100 100 Gwandalan Land Pty Ltd 100 100 100 HV Operations Pty Ltd A 100 100 - HVO Coal Sales Pty Ltd B 67 67 - Kalamah Pty Ltd A 100 100 100 Lower Hunter Land Holdings Pty Ltd 100 100 100 Miller Pohang Coal Company Pty limited B 80 80 80 Minmi Land Pty Ltd 100 100 100 Mount Thorley Coal Loading Pty Limited B 57 57 57 Mount Thorley Operations Pty Limited A 100 100 100 Namoi Valley Coal Pty Limited A 100 100 100 Nords Wharf Land Pty Ltd 100 100 100 Northern (Rhondda) Collieries Pty Limited A 100 100 100 Novacoal Australia Pty Limited A 100 100 100 Oaklands Coal Pty limited 100 100 100 Rio Tinto Coal (NSW) Pty Limited A 100 100 100
59
230
For
per
sona
l use
onl
y
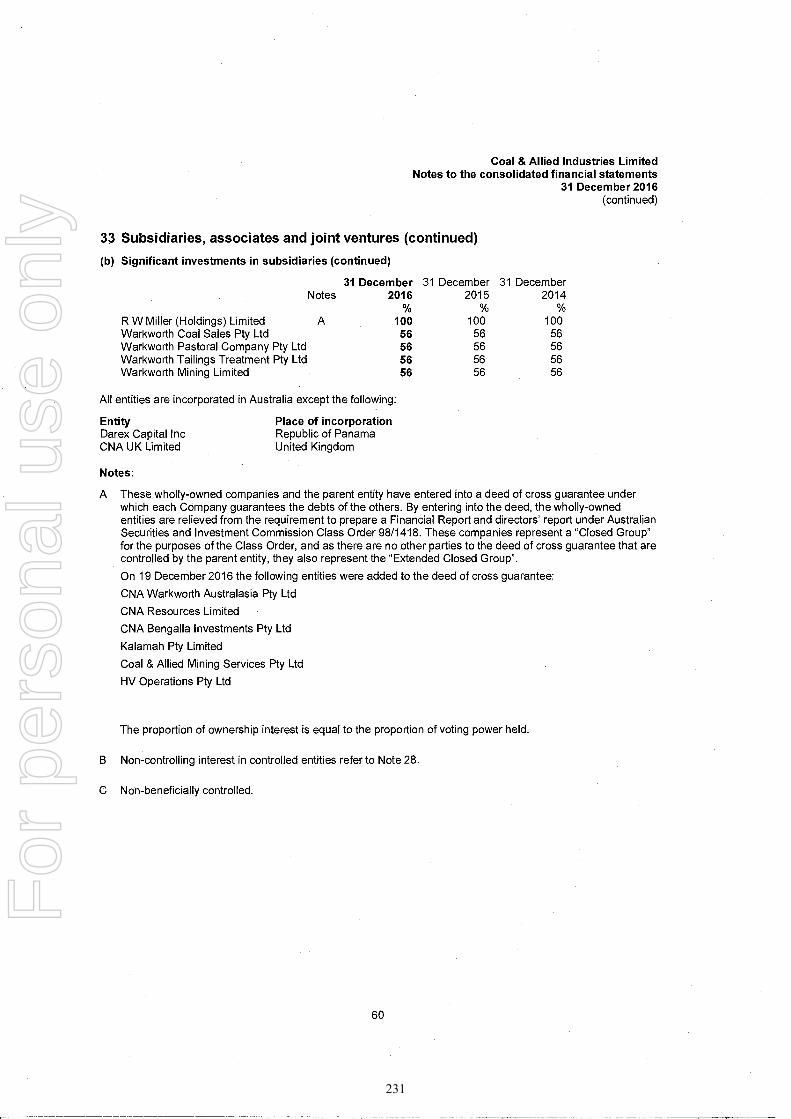
Coal & Allied Industries Limited Notes to the consolidated financial statements
31 December 2016 (continued)
33 Subsidiaries, associates and joint ventures (continued)
(b) Significant investments in subsidiaries (continued)
31 December Notes 2016
31 December 2015
31 December 2014
R W Miller (Holdings) Limited A 100 100 100 Warkworth Coal Sales Pty Ltd 56 56 56 Warkworth Pastoral Company Pty Ltd 56 56 56 Warkworth Tailings Treatment Pty Ltd 56 56 56 Warkworth Mining Limited 56 56 56
All entities are incorporated in Australia except the following:
Entity
Place of incorporation Darex Capital Inc
Republic of Panama CNA UK Limited
United Kingdom
Notes:
A These wholly-owned companies and the parent entity have entered into a deed of cross guarantee under which each Company guarantees the debts of the others. By entering into the deed, the wholly-owned entities are relieved from the requirement to prepare a Financial Report and directors' report under Australian Securities and Investment Commission Class Order 98/1418. These companies represent a "Closed Group" for the purposes of the Class Order, and as there are no other parties to the deed of cross guarantee that are controlled by the parent entity, they also represent the "Extended Closed Group".
On 19 December 2016 the following entities were added to the deed of cross guarantee:
CNA Warkworth Australasia Pty Ltd
CNA Resources Limited
CNA Bengalla Investments Pty Ltd
Kalamah Pty Limited
Coal & Allied Mining Services Pty Ltd
HV Operations Pty Ltd
The proportion of ownership interest is equal to the proportion of voting power held.
B Non-controlling interest in controlled entities refer to Note 28.
C Non-beneficially controlled.
60
231
For
per
sona
l use
onl
y
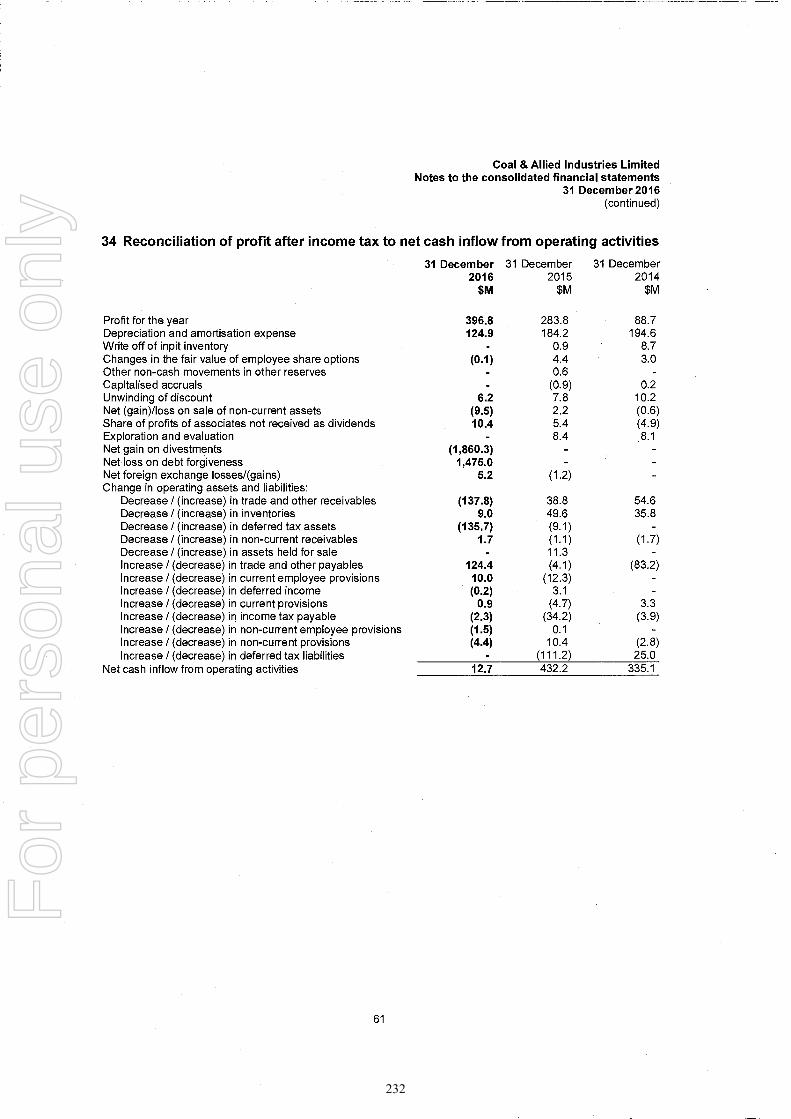
Coal & Allied Industries Limited Notes to the consolidated financial statements
31 December 2016 (continued)
34 Reconciliation of profit after income tax to net cash inflow from operating activities
31 December 2016
$M
31 December 2015
$M
31 December 2014
$M
Profit for the year 396.8 283.8 88.7 Depreciation and amortisation expense 124.9 184.2 194.6 Write off of inpit inventory 0.9 8.7 Changes in the fair value of employee share options (0.1) 4.4 3.0 Other non-cash movements in other reserves 0.6 Capitalised accruals (0.9) 0.2 Unwinding of discount 6.2 7.8 10.2 Net (gain)/loss on sale of non-current assets (9.5) 2.2 (0.6) Share of profits of associates not received as dividends 10.4 5.4 (4.9) Exploration and evaluation - 8.4 8.1 Net gain on divestments (1,860.3) - - Net loss on debt forgiveness 1,475.0 Net foreign exchange losses/(gains) 5.2 (1.2) Change in operating assets and liabilities:
Decrease / (increase) in trade and other receivables (137.8) 38.8 54.6 Decrease / (increase) in inventories 9.0 49.6 35.8 Decrease / (increase) in deferred tax assets (135.7) (9.1) - Decrease / (increase) in non-current receivables 1.7 (1.1) (1.7) Decrease / (increase) in assets held for sale - 11.3 - Increase / (decrease) in trade and other payables 124.4 (4.1) (83.2) Increase / (decrease) in current employee provisions 10.0 (12.3) Increase / (decrease) in deferred income (0.2) 3.1 - Increase / (decrease) in current provisions 0.9 (4.7) 3.3 Increase / (decrease) in income tax payable (2.3) (34.2) (3.9) Increase / (decrease) in non-current employee provisions (1.5) 0.1 - Increase / (decrease) in non-current provisions (4.4) 10.4 (2.8) Increase / (decrease) in deferred tax liabilities (111.2) 25.0
Net cash inflow from operating activities 12.7 432.2 335.1
61
232
For
per
sona
l use
onl
y
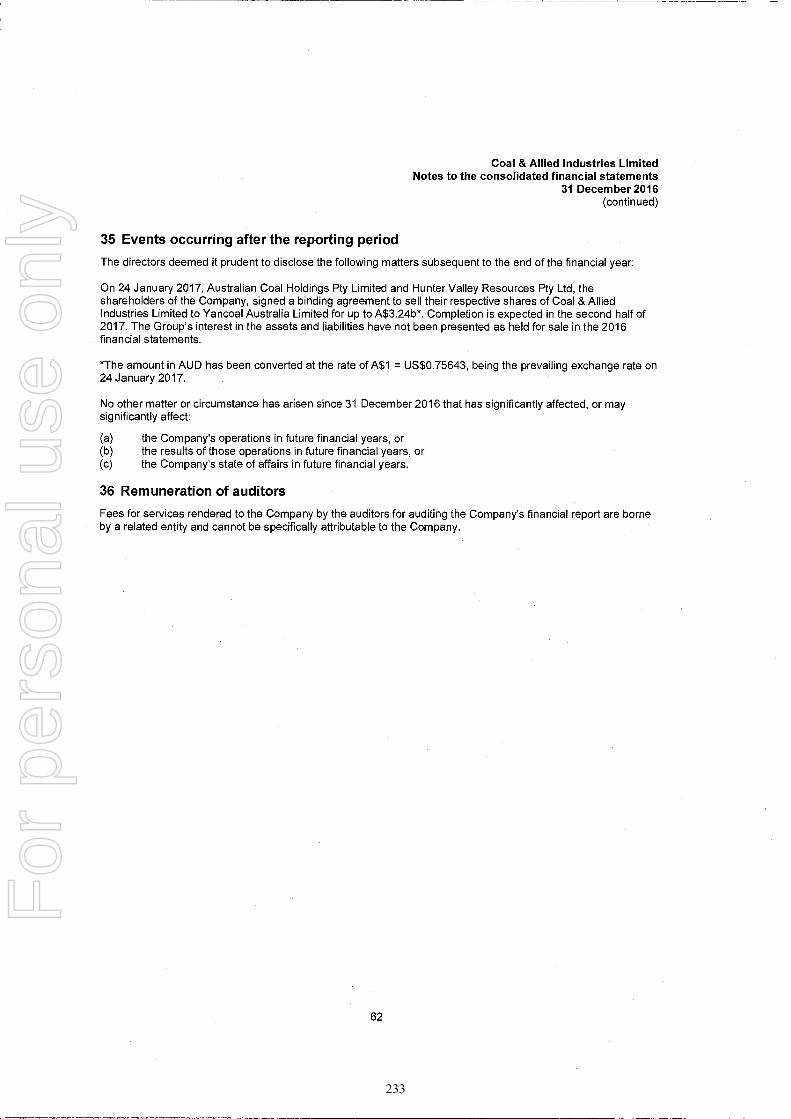
Coal & Allied Industries Limited Notes to the consolidated financial statements
31 December 2016 (continued)
35 Events occurring after the reporting period
The directors deemed it prudent to disclose the following matters subsequent to the end of the financial year:
On 24 January 2017, Australian Coal Holdings Pty Limited and Hunter Valley Resources Pty Ltd, the shareholders of the Company, signed a binding agreement to sell their respective shares of Coal & Allied Industries Limited to Yancoal Australia Limited for up to A$3.24b*. Completion is expected in the second half of 2017. The Group's interest in the assets and liabilities have not been presented as held for sale in the 2016 financial statements.
*The amount in AUD has been converted at the rate of A$1 = US$0.75643, being the prevailing exchange rate on 24 January 2017.
No other matter or circumstance has arisen since 31 December 2016 that has significantly affected, or may significantly affect:
(a) the Company's operations in future financial years, or (b) the results of those operations in future financial years, or (c) the Company's state of affairs in future financial years.
36 Remuneration of auditors
Fees for services rendered to the Company by the auditors for auditing the Company's financial report are borne by a related entity and cannot be specifically attributable to the Company.
62
233
For
per
sona
l use
onl
y

Coal & Allied Industries Limited Directors declaration
31 December 2016
In the directors' opinion:
(a) the financial statements and notes set out on pages 1 to 62:
(i) comply with Australian Accounting Standards and Interpretations issued by the Australian Accounting Standards Board and other mandatory professional reporting requirements; and
i) present fairly the consolidated entity's financial position as at 31 December 2016, 31 December 2015 and 31 December 2014 and its performance for the financial years ended on those dates; and
(b) there are reasonable grounds to believe that the Group will be able to pay its debts as and when they become due and payable.
Note 1(a) confirms that the financial statements also comply with International Financial Reporting Standards as issued by the International Accounting Standards Board.
The financial statements and notes set out on pages 1 to 62 have been approved and adopted.
The directors are solely responsible for the information contained in the report and have determined that the accounting policies used are appropriate for internal purposes. This declaration is made in accordance with a resolution of the directors.
S J linor Director
Brisbane 31 March 2017
63
234
For
per
sona
l use
onl
y

Independent auditor’s report To the shareholders of Coal & Allied Industries Limited
Our opinion In our opinion the accompanying financial report presents fairly, in all material respects, the financial position of Coal & Allied Industries Limited (the Company) and its controlled entities (together the Group) as at 31 December 2016, 31 December 2015 and 31 December 2014 and its financial performance and its cash flows for the years then ended in accordance with Australian Accounting Standards.
What we have audited The financial report comprises:
• the consolidated statement of financial position as at 31 December 2016, 31 December 2015 and 31 December 2014
• the consolidated statement of changes in equity for the years then ended
• the consolidated statement of cash flows for the years then ended
• the consolidated statement of profit or loss and other comprehensive income for the years then ended
• the notes to the consolidated financial statements, which include a summary of significant accounting policies
• the directors’ declaration.
Basis for opinion We conducted our audit in accordance with Australian Auditing Standards. Our responsibilities under those standards are further described in the Auditor’s responsibilities for the audit of the financial report section of our report.
We believe that the audit evidence we have obtained is sufficient and appropriate to provide a basis for our opinion.
Independence We are independent of the Group in accordance with the ethical requirements of the Accounting Professional and Ethical Standards Board’s APES 110 Code of Ethics for Professional Accountants (the Code) that are relevant to our audit of the financial report in Australia. We have also fulfilled our other ethical responsibilities in accordance with the Code.
Responsibilities of the directors for the financial report The directors of the Company are responsible for the preparation and fair presentation of the financial report in accordance with Australian Accounting Standards, and for such internal control as the directors determine is necessary to enable the preparation of the financial report that is free from material misstatement, whether due to fraud or error.
235
For
per
sona
l use
onl
y
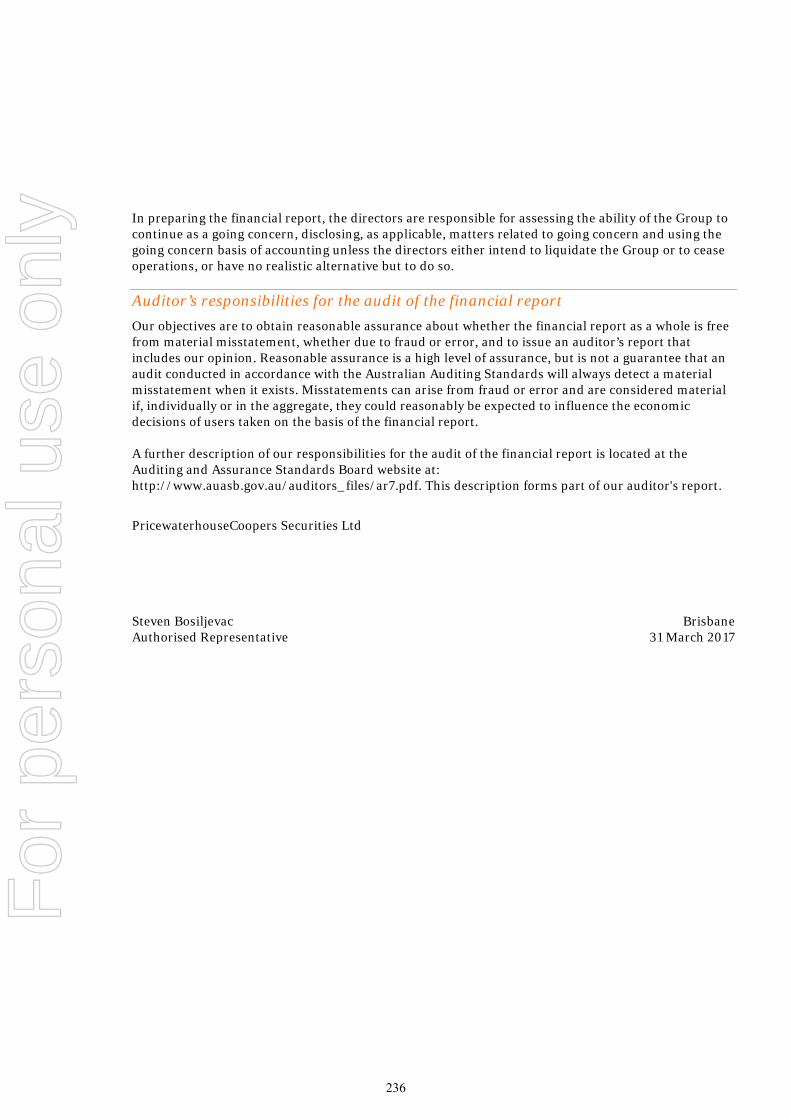
In preparing the financial report, the directors are responsible for assessing the ability of the Group to continue as a going concern, disclosing, as applicable, matters related to going concern and using the going concern basis of accounting unless the directors either intend to liquidate the Group or to cease operations, or have no realistic alternative but to do so.
Auditor’s responsibilities for the audit of the financial report Our objectives are to obtain reasonable assurance about whether the financial report as a whole is free from material misstatement, whether due to fraud or error, and to issue an auditor’s report that includes our opinion. Reasonable assurance is a high level of assurance, but is not a guarantee that an audit conducted in accordance with the Australian Auditing Standards will always detect a material misstatement when it exists. Misstatements can arise from fraud or error and are considered material if, individually or in the aggregate, they could reasonably be expected to influence the economic decisions of users taken on the basis of the financial report.
A further description of our responsibilities for the audit of the financial report is located at the Auditing and Assurance Standards Board website at: http://www.auasb.gov.au/auditors_files/ar7.pdf. This description forms part of our auditor's report.
PricewaterhouseCoopers Securities Ltd
Steven Bosiljevac Brisbane Authorised Representative 31 March 2017
236
For
per
sona
l use
onl
y

÷
Appendix K Reconciliation of the adjusted financial informationA summary of the Carve-Out Adjustments to the audited adjusted financial statements by Rio Tinto managementare presented below:
RevenueA$m 2014 2015 2016
Coal & Allied General Purpose Financial Report, 31December 2016 2,187 2,155 1,706
Adjustment to remove Mt Pleasant (1) (1) (10)Adjustment to remove Bengalla (265) (257) (34)Adjustment to reflect HVO interest at 67.6% (392) (376) (22)Adjusted reported amount 1,529 1,521 1,641
Source: Rio Tinto management analysis
Profit before income taxA$m 2014 2015 2016
Coal & Allied General Purpose Financial Report, 31December 2016 177 241 723
Adjustment to remove Mt Pleasant 15 11 (14)Adjustment to remove Bengalla (72) (60) (569)Adjustment to reflect HVO interest at 67.6% (55) (55) 207Adjusted reported amount 65 138 347
Source: Rio Tinto management analysis
Total assetsA$m 2015 2016
Coal & Allied General Purpose Financial Report, 31December 2016 2,468 1,981
Adjustment to remove Mt Pleasant (184) (16)Adjustment to remove Bengalla (325) (0)Adjustment to reflect HVO interest at 67.6% (115) -Adjustment for DTL/TA reclassification (54) -Adjusted reported amount 1,790 1,964
Source: Rio Tinto management analysis
Net assetsA$m 2015 2016
Coal & Allied General Purpose Financial Report, 31December 2016 1,867 1,312
Adjustment to remove Mt Pleasant (175) 30Adjustment to remove Bengalla (300) (2)Adjustment to reflect HVO interest at 67.6% (56) -Adjusted reported amount 1,336 1,340
Source: Rio Tinto management analysis
237
For
per
sona
l use
onl
y
÷
PART 2 - FINANCIAL SERVICES GUIDE
THIS FINANCIAL SERVICES GUIDE FORMS PART OF THEINDEPENDENT EXPERT’S REPORT
19 May 2017
1. Ernst & Young Transaction Advisory Services
Ernst & Young Transaction Advisory Services Limited (“EY Transaction Advisory Services” or “we,” or “us” or“our”) has been engaged to provide general financial product advice in the form of an Independent Expert’sReport (“IER”) in connection with a financial product of another person. The IER is set out in Part 1.
2. Financial Services Guide
This Financial Services Guide (“FSG”) provides important information to help retail clients make a decision asto their use of the general financial product advice in a Report, information about us, the financial services weoffer, our dispute resolution process and how we are remunerated.
3. Financial services we offer
We hold an Australian Financial Services Licence which authorises us to provide the following services:
► financial product advice in relation to securities, derivatives, general insurance, life insurance, managedinvestments, superannuation, and government debentures, stocks and bonds; and
► arranging to deal in securities.
4. General financial product advice
In our Report we provide general financial product advice. The advice in a Report does not take into accountyour personal objectives, financial situation or needs.
You should consider the appropriateness of a Report having regard to your own objectives, financial situationand needs before you act on the advice in a Report. Where the advice relates to the acquisition or possibleacquisition of a financial product, you should also obtain an offer document relating to the financial product andconsider that document before making any decision about whether to acquire the financial product.
We have been engaged to issue a Report in connection with a financial product of another person. Our Reportwill include a description of the circumstances of our engagement and identify the person who has engaged us.Although you have not engaged us directly, a copy of the Report will be provided to you as a retail client becauseof your connection to the matters on which we have been engaged to report.
5. Remuneration for our services
We charge fees for providing Reports. These fees have been agreed with, and will be paid by, the person whoengaged us to provide a Report. Our fees for Reports are based on a time cost or fixed fee basis. Our directorsand employees providing financial services receive an annual salary, a performance bonus or profit sharedepending on their level of seniority. The estimated fee for this Report is $200,000 (exclusive of GST).
Ernst & Young Transaction Advisory Services is ultimately owned by Ernst & Young, which is a professionaladvisory and accounting practice. Ernst & Young may provide professional services, including audit, tax andfinancial advisory services, to the person who engaged us and receive fees for those services.
238
For
per
sona
l use
onl
y

÷
Except for the fees and benefits referred to above, Ernst & Young Transaction Advisory Services, including anyof its directors, employees or associated entities should not receive any fees or other benefits, directly orindirectly, for or in connection with the provision of a Report.
6. Associations with product issuers
Ernst & Young Transaction Advisory Services and any of its associated entities may at any time provideprofessional services to financial product issuers in the ordinary course of business.
7. Responsibility
The liability of Ernst & Young Transaction Advisory Services, if any, is limited to the contents of this FinancialServices Guide and the Report.
8. Complaints process
As the holder of an Australian Financial Services Licence, we are required to have a system for handlingcomplaints from persons to whom we provide financial services. All complaints must be in writing and addressedto the AFS Compliance Manager or Chief Complaints Officer and sent to the address below. We will make everyeffort to resolve a complaint within 30 days of receiving the complaint. If the complaint has not been satisfactorilydealt with, the complaint can be referred to the Financial Ombudsman Service Limited.
9. Compensation Arrangements
The Company and its related entities hold Professional Indemnity insurance for the purpose of compensationshould this become relevant. Representatives who have left the Company’s employment are covered by ourinsurances in respect of events occurring during their employment. These arrangements and the level of coverheld by the Company satisfy the requirements of section 912B of the Corporations Act 2001.
Contacting Ernst & YoungTransaction Advisory ServicesAFS Compliance ManagerErnst & Young200 George StreetSydney NSW 2000
Telephone: (02) 9248 5555
Contacting the Independent Dispute Resolution Scheme:Financial Ombudsman Service LimitedPO Box 3Melbourne VIC 3001 Telephone: 1300 78 08 08
This Financial Services Guide has been issued in accordance with ASIC Class Order CO 04/1572.
239
For
per
sona
l use
onl
y
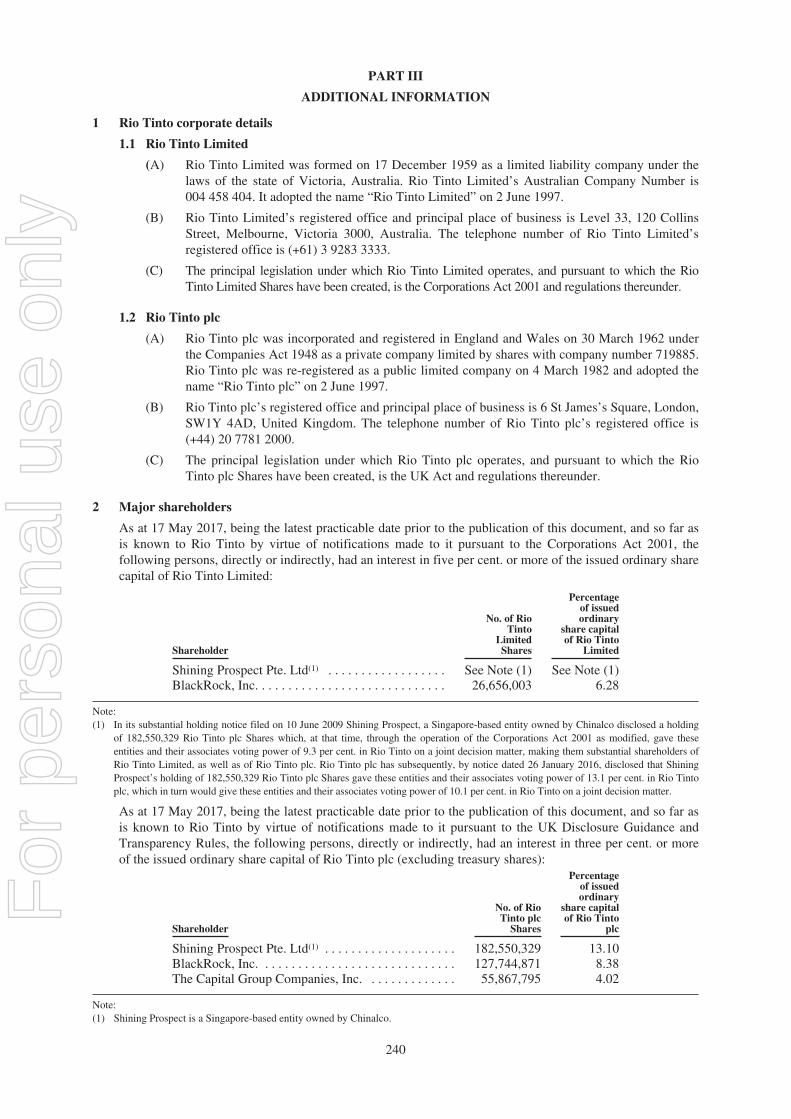
PART III
ADDITIONAL INFORMATION
1 Rio Tinto corporate details
1.1 Rio Tinto Limited
(A) Rio Tinto Limited was formed on 17 December 1959 as a limited liability company under thelaws of the state of Victoria, Australia. Rio Tinto Limited’s Australian Company Number is004 458 404. It adopted the name “Rio Tinto Limited” on 2 June 1997.
(B) Rio Tinto Limited’s registered office and principal place of business is Level 33, 120 CollinsStreet, Melbourne, Victoria 3000, Australia. The telephone number of Rio Tinto Limited’sregistered office is (+61) 3 9283 3333.
(C) The principal legislation under which Rio Tinto Limited operates, and pursuant to which the RioTinto Limited Shares have been created, is the Corporations Act 2001 and regulations thereunder.
1.2 Rio Tinto plc
(A) Rio Tinto plc was incorporated and registered in England and Wales on 30 March 1962 underthe Companies Act 1948 as a private company limited by shares with company number 719885.Rio Tinto plc was re-registered as a public limited company on 4 March 1982 and adopted thename “Rio Tinto plc” on 2 June 1997.
(B) Rio Tinto plc’s registered office and principal place of business is 6 St James’s Square, London,SW1Y 4AD, United Kingdom. The telephone number of Rio Tinto plc’s registered office is(+44) 20 7781 2000.
(C) The principal legislation under which Rio Tinto plc operates, and pursuant to which the RioTinto plc Shares have been created, is the UK Act and regulations thereunder.
2 Major shareholders
As at 17 May 2017, being the latest practicable date prior to the publication of this document, and so far asis known to Rio Tinto by virtue of notifications made to it pursuant to the Corporations Act 2001, thefollowing persons, directly or indirectly, had an interest in five per cent. or more of the issued ordinary sharecapital of Rio Tinto Limited:
Shareholder
No. of RioTinto
LimitedShares
Percentageof issuedordinary
share capitalof Rio Tinto
Limited
Shining Prospect Pte. Ltd(1) . . . . . . . . . . . . . . . . . . See Note (1) See Note (1)BlackRock, Inc. . . . . . . . . . . . . . . . . . . . . . . . . . . . . 26,656,003 6.28
Note:(1) In its substantial holding notice filed on 10 June 2009 Shining Prospect, a Singapore-based entity owned by Chinalco disclosed a holding
of 182,550,329 Rio Tinto plc Shares which, at that time, through the operation of the Corporations Act 2001 as modified, gave theseentities and their associates voting power of 9.3 per cent. in Rio Tinto on a joint decision matter, making them substantial shareholders ofRio Tinto Limited, as well as of Rio Tinto plc. Rio Tinto plc has subsequently, by notice dated 26 January 2016, disclosed that ShiningProspect’s holding of 182,550,329 Rio Tinto plc Shares gave these entities and their associates voting power of 13.1 per cent. in Rio Tintoplc, which in turn would give these entities and their associates voting power of 10.1 per cent. in Rio Tinto on a joint decision matter.
As at 17 May 2017, being the latest practicable date prior to the publication of this document, and so far asis known to Rio Tinto by virtue of notifications made to it pursuant to the UK Disclosure Guidance andTransparency Rules, the following persons, directly or indirectly, had an interest in three per cent. or moreof the issued ordinary share capital of Rio Tinto plc (excluding treasury shares):
Shareholder
No. of RioTinto plc
Shares
Percentageof issuedordinary
share capitalof Rio Tinto
plc
Shining Prospect Pte. Ltd(1) . . . . . . . . . . . . . . . . . . . . 182,550,329 13.10BlackRock, Inc. . . . . . . . . . . . . . . . . . . . . . . . . . . . . . 127,744,871 8.38The Capital Group Companies, Inc. . . . . . . . . . . . . . 55,867,795 4.02
Note:(1) Shining Prospect is a Singapore-based entity owned by Chinalco.
240
For
per
sona
l use
onl
y
3 Material contracts
Other than the Transaction Documents, there are no other contracts (not being contracts entered into in theordinary course of business) which:
(A) Rio Tinto Shareholders would reasonably require disclosure of in making a properly informedassessment of how to vote on the Resolution; and
(B) have been entered into:
(a) by Rio Tinto within the two years immediately preceding the date of this document, and are, ormay be material; or
(b) at any time by Rio Tinto and contain provisions under which Rio Tinto has an obligation orentitlement which is, or may be, material to Rio Tinto as at the date of this document.
4 Significant change
There has been no significant change in the financial or trading position of Rio Tinto since 31 December2016, the date to which the last audited financial statements of Rio Tinto were prepared.
5 ASX Listing Rule 10.1 and Independent Expert
ASX Listing Rule 10.1 provides that an entity or a subsidiary of it must not, without shareholder approval,acquire or dispose of a substantial asset from or to certain persons in a position of influence, including:
(A) a substantial shareholder who, together with their associates, has a relevant interest (or had a relevantinterest at any time in the six months before the transaction) in at least 10 per cent. of the total votesattached to voting securities in the entity;
(B) an associate of such a substantial shareholder; and
(C) any other person whose relationship to the entity is such that, in ASX’s opinion, the transaction shouldbe approved by shareholders.
For this purpose, an asset is a “substantial asset” if its value, or the value of consideration for it, is (or inASX’s opinion is) five per cent. or more of the equity interests of the entity as set out in the latest accountsgiven to ASX under the ASX Listing Rules. The agreed purchase price for Coal & Allied Industries underthe SPA exceeds that threshold and, as such, Coal & Allied Industries is considered a substantial asset ofRio Tinto.
As a result of Chinalco and Yankuang each being owned by Chinese state-owned entities as described inmore detail in section 8 of the letter from the Chairman of Rio Tinto, Yancoal is considered to be anassociate of Chinalco for the purposes of ASX Listing Rule 10.1. Accordingly, the Transaction requiresRio Tinto Shareholder approval pursuant to ASX Listing Rule 10.1.
In relation to the seeking of that approval, ASX Listing Rule 10.10.2 requires that an independent expert’sreport opining on the fairness and reasonableness of the Transaction be prepared. Rio Tinto has engagedErnst & Young for these purposes, and the Independent Expert’s Report is set out in Part II (IndependentExpert’s Report). The Independent Expert is required to be independent from Rio Tinto in accordance withRegulatory Guide 112 issued by the Australian Securities and Investments Commission. Accordingly, theIndependent Expert’s Report has been prepared by the Independent Expert and not by Rio Tinto.
6 Consents
Ernst & Young, which has been appointed as the Independent Expert, has given and not withdrawn itsconsent to the Independent Expert’s Report being included in this document, and also to references to theIndependent Expert and the Independent Expert’s Report in this document in the form and context in whichthey appear.
241
For
per
sona
l use
onl
y
AMC Consultants Pty Ltd (ABN 58 008 129 164) has given and not withdrawn its consent to its reportbeing included in this document, and also to references to its name and report in this document in the formand context in which they appear.
7 Documents available for inspection
Copies of the following documents will be available for inspection during normal business hours on anyweekday (Saturdays, Sundays and public holidays excepted) at the Rio Tinto Limited registered office atLevel 33, 120 Collins Street, Melbourne, Victoria 3000, Australia, at the offices of Allens, Deutsche BankPlace, Corner Hunter & Phillip Streets, Sydney, New South Wales, 2000 Australia, at the Rio Tinto plcregistered office at 6 St James’s Square, London, SW1Y 4AD, United Kingdom and at the offices ofLinklaters LLP, One Silk Street, London, EC2Y 8HQ, United Kingdom up to and including the date of theRio Tinto Limited General Meeting. These documents are also available on Rio Tinto’s website atriotinto.com:
(a) a copy of Rio Tinto plc’s existing articles of association;
(b) a copy of Rio Tinto Limited’s existing constitution;
(c) Rio Tinto’s annual reports and accounts for the two financial years ended 31 December 2015 and31 December 2016;
(d) a copy of the Rio Tinto plc Circular;
(e) the written consents referred to in section 6 of this Part III (Additional Information); and
(f) this document and Proxy Form.
The above documentation will also be available for inspection for at least 15 minutes prior to and during theRio Tinto Limited General Meeting.
242
For
per
sona
l use
onl
y
PART IV
DEFINITIONS
The following definitions apply throughout this document, unless stated otherwise:
$, US$ or cents the lawful currency of the United States of America.
A$ the lawful currency of the Commonwealth of Australia.
ASX or Australian SecuritiesExchange ASX Limited (ACN 008624 691) or the financial market operated by
that entity (as applicable).
ASX Listing Rules the official listing rules of the ASX, as amended from time to time.
Australia the Commonwealth of Australia.
Bee Creek Contract the agreement and related side letter to be entered into by YancoalSales and Hail Creek Marketing Pty Limited on completion of theTransaction.
BLCP BLCP Power Limited.
BLCP Back-to-Back Agreement the agreement to be entered into by the Vendor and Yancoal Sales oncompletion of the Transaction in the event that the Coal Supply andTransportation Agreement is not novated from the Vendor to aYancoal Group entity on completion pursuant to a BLCP NovationDeed.
BLCP Novation Deed the deed of novation in respect of the Coal Supply and TransportationAgreement to be entered into by the Vendor, a Yancoal Group entityand BLCP on completion of the Transaction.
Board or Directors the common boards of directors of Rio Tinto, or, as the contextrequires, the board of directors of Rio Tinto plc or Rio Tinto Limited.
Business Day means a day that is not a Saturday, Sunday, bank holiday or publicholiday in London or Sydney.
Chinalco Aluminum Corporation of China, being a Chinese state-ownedenterprise established on 23 February 2001.
Coal Supply and TransportationAgreement the Coal Supply and Transportation Agreement between the Vendor
and BLCP dated 13 June 2003, as amended.
Coal & Allied Industries Coal & Allied Industries Limited (ABN 67 008 416 760).
Corporations Act 2001 the Corporations Act 2001 (Cth).
CPI consumer price index.
DLC Sharing Agreement the DLC Merger Sharing Agreement, as amended from time to time,between Rio Tinto plc and Rio Tinto Limited dated 21 December1995, that regulates the relationship between Rio Tinto plc and RioTinto Limited.
Ernst & Young Ernst & Young Transaction Advisory Services Limited(ABN 87 003 599 844).
Financial Conduct Authority or FCA the UK Financial Conduct Authority.
243
For
per
sona
l use
onl
y

Freight Transfer Deed the deed of novation in respect of the Agreement for the Supply ofChartering and Freight Services to Port of Map Ta Phut, Thailand tobe entered into by the Vendor, Yancoal Sales and Rio Tinto Shipping(Asia) Pte Limited on completion of the Transaction.
FSMA the UK Financial Services and Markets Act 2000, as amended.
Hunter Valley Joint Venture the unincorporated joint venture known as the ‘Hunter ValleyOperations Joint Venture’ established pursuant to the HVO JointVenture Agreement.
HVO Coal Supply Transfer Deed the deed to be entered into by the Vendor, Yancoal Sales and HVOCoal Sales Pty Ltd on completion of the Transaction.
HVO Joint Venture Agreement the Joint Venture Agreement – Hunter Valley Operations dated3 February 2016 between Coal & Allied Operations Pty Ltd, HVOResources Pty Ltd and HV Operations Pty Ltd.
HVR Hunter Valley Resources Pty Ltd (ABN 69 151 471 242).
Independent Expert Ernst & Young.
Independent Expert’s Report the report produced by the Independent Expert opining on the fairnessand reasonableness of the Transaction dated 19 May 2017.
Mitsubishi Mitsubishi Development Pty Ltd (ACN 009 779 873).
Mitsubishi Group Mitsubishi and each of its subsidiary companies.
Notice the notice convening the Rio Tinto Limited General Meeting at theend of this document.
NSW the Australian state of New South Wales.
Proxy Form the form of proxy accompanying this document for use by Rio TintoLimited Shareholders in relation to the Rio Tinto Limited GeneralMeeting.
Resolution the resolution to be proposed at the Rio Tinto Limited GeneralMeeting and the Rio Tinto plc General Meeting in connection withthe Transaction.
Rio Tinto Rio Tinto Limited and Rio Tinto plc or, where the context requires,the Rio Tinto Group.
Rio Tinto Group Rio Tinto Limited, Rio Tinto plc and their respective subsidiaries andsubsidiary undertakings and, where the context requires, theirrespective associated undertakings.
Rio Tinto Limited or Company Rio Tinto Limited (ABN 96 004 458 404), a company incorporated inVictoria, Australia whose registered office is at Level 33, 120 CollinsStreet, Melbourne, 3000, Victoria, Australia.
Rio Tinto Limited General Meeting the general meeting of Rio Tinto Limited to be held at the GrandBallroom, The Westin Sydney, 1 Martin Place, Sydney, New SouthWales at 11.00 a.m. (AEST) on 29 June 2017, notice of which is setout at the end of this document.
Rio Tinto Limited Shareholders holders of Rio Tinto Limited Shares.
244
For
per
sona
l use
onl
y
Rio Tinto Limited Shares the ordinary shares in the capital of Rio Tinto Limited.
Rio Tinto plc Rio Tinto plc, a company incorporated in England and Wales withcompany number 719885 whose registered office is at 6 St James’sSquare, London, SW1Y 4AD, United Kingdom.
Rio Tinto plc Circular the circular to Rio Tinto plc Shareholders published on or about thedate hereof containing details of the Transaction.
Rio Tinto plc General Meeting the general meeting of Rio Tinto plc to be held at 11.00 a.m. (Londontime) on 27 June 2017, notice of which is set out at the end of the RioTinto plc Circular.
Rio Tinto plc Shareholders holders of Rio Tinto plc Shares.
Rio Tinto plc Shares the ordinary shares of 10 pence each in the capital of Rio Tinto plc.
Rio Tinto Shareholders Rio Tinto plc Shareholders and Rio Tinto Limited Shareholders.
Rio Tinto Shares Rio Tinto plc Shares and Rio Tinto Limited Shares.
Royalty Deeds the four royalty deeds to be entered into by the Vendor and Coal &Allied Industries prior to completion of the Transaction.
Shining Prospect Shining Prospect Pte. Ltd, being a Singapore-based entity owned byChinalco.
SPA the sale and purchase agreement between the Vendor, HVR andYancoal dated 24 January 2017.
Transaction the proposed disposal by the Vendor and HVR of Coal & AlliedIndustries to Yancoal pursuant to the SPA.
Transaction Documents the SPA, the Royalty Deeds, the Transitional Services Agreement, theBLCP Novation Deed, the BLCP Back-to-Back Agreement, the BeeCreek Contract and related side letter, the Freight Transfer Deed andHVO Coal Supply Transfer Deed.
Transitional Services Agreement the agreement to be entered into between Rio Tinto Services Limitedand Coal & Allied Industries on completion of the Transaction.
UK Act the Companies Act 2006 of England and Wales, as amended.
UK Disclosure Guidance andTransparency Rules
the disclosure guidance and transparency rules made by the FCA forthe purposes of Part VI of the FSMA.
UK Listing Rules the listing rules made by the FCA for the purposes of Part VI of theFSMA.
United Kingdom or UK the United Kingdom of Great Britain and Northern Ireland.
Vendor Australian Coal Holdings Pty. Limited (ABN 79 000 066 491).
Yancoal Yancoal Australia Limited (ABN 82 111 859 119).
Yancoal Group Yancoal, the subsidiaries and holding companies of Yancoal and eachof the subsidiaries of any such holding company from time to time.
Yancoal Sales Yancoal Australia Sales Pty Ltd (ABN 88 167 884 460).
Yankuang Yankuang Group Company Limited.
Yanzhou Yanzhou Coal Mining Company Limited.
245
For
per
sona
l use
onl
y

NOTICE OF GENERAL MEETING
OF
RIO TINTO LIMITED (ABN 96 004 458 404)
NOTICE IS HEREBY GIVEN that a GENERAL MEETING of Rio Tinto Limited (the “Company”) will beheld at the Grand Ballroom, The Westin Sydney, 1 Martin Place, Sydney, New South Wales at 11.00 a.m.(AEST) on 29 June 2017 for the purpose of considering and, if thought fit, passing the following resolution (the“Resolution”) which will be proposed as an ordinary resolution.
In accordance with Rio Tinto’s dual listed companies’ structure, the Resolution will be voted on by Rio TintoLimited Shareholders and Rio Tinto plc Shareholders as a joint electorate.
ORDINARY RESOLUTION
THAT the Transaction, on the terms and subject to the conditions set out in the SPA and the other TransactionDocuments (as each term is defined in the explanatory memorandum to Rio Tinto Limited Shareholders dated19 May 2017), be and is hereby approved and the Directors (or a duly authorised committee of the Directors) beand are hereby authorised to waive, amend, vary or extend any of the terms and conditions of the TransactionDocuments, provided that any such waivers, amendments, variations or extensions are not of a material nature,and to do all things as they may consider to be necessary or desirable to complete, implement and give effect to,or otherwise in connection with, the Transaction and any matters incidental to the Transaction.
Dated: 19 May 2017
By order of the Board
Tim Paine Steve AllenJoint Company Secretary Joint Company Secretary
Registered office: Level 33, 120 Collins Street, Melbourne, Victoria 3000, Australia
Important Notes
For the purposes of the Corporations Act, Rio Tinto Limited has determined that securities of Rio Tinto Limitedthat are quoted securities at 7.00 p.m. (AEST) on Tuesday, 27 June 2017 will be taken, for the purposes of themeeting, to be held by the persons who held them at that time.
A Proxy Form accompanies this notice of meeting. A member entitled to attend and vote at the meeting isentitled to appoint up to two proxies. A proxy need not be a member of Rio Tinto Limited. Where a memberwishes to appoint two proxies, an additional proxy form may be obtained by contacting Rio Tinto Limited’sshare registry or you may copy the enclosed form.
A proxy other than the chairman of the meeting is not required by law to vote on the resolution. However, if theproxy’s appointment directs the proxy how to vote on the resolution and the proxy decides to vote as proxy onthe resolution, the proxy must vote the way specified (subject to the other provisions of this notice, including thevoting exclusions noted below).
If an appointed proxy does not attend the meeting, the chairman of the meeting will be taken to have beenappointed as the proxy. If a proxy appointment specifies the way to vote on the resolution and the appointedproxy does not attend the meeting or attends the meeting, but does not vote on the resolution, a directed proxywill default to the chairman of the meeting who must vote the proxy as directed. If the chairman of the meeting isappointed, or taken to be appointed, as a proxy, but the appointment does not specify the way to vote on theresolution, the chairman intends to exercise the relevant shareholder’s votes in favour of the resolution (subject tothe other provisions of this notice, including the voting exclusions noted below).
If a shareholder appoints two proxies they may specify the proportion or number of votes each proxy is appointedto exercise. If a shareholder appoints two proxies and does not specify each proxy’s percentage of voting rights,each proxy may exercise half the shareholder’s votes. Fractions of votes will be disregarded. The Proxy Formcontains instructions for appointing two proxies.
246
For
per
sona
l use
onl
y
Proxy lodgement
Shareholders can lodge their Proxy Forms online at investorvote.com.au and follow the prompts. To use thisfacility you will need your Shareholder Reference Number (SRN) or Holder Identification Number (HIN),postcode and control number as shown on the Proxy Form. You will be taken to have signed the Proxy Form ifyou complete the instructions on the website by 11.00 a.m. (AEST) on Tuesday, 27 June 2017.
If using the Proxy Form accompanying this notice of meeting, the Proxy Form, together with any power ofattorney or authority under which it is signed, must be received by Rio Tinto Limited’s share registry atComputershare Investor Services Pty Ltd, GPO Box 242, Melbourne, Victoria, 3001, or Yarra Falls,452 Johnston Street, Abbotsford, Victoria, 3067 or at Rio Tinto Limited’s registered office or by facsimile to1800 783 447 (within Australia) or +61 3 9473 2555 (outside Australia), by 11.00 a.m. (AEST) on Tuesday,27 June 2017.
For intermediary online subscribers only (custodians) please visit intermediaryonline.com to submit your proxyform.
Voting arrangements under the dual listed companies structure
The voting arrangements for shareholders under Rio Tinto’s dual listed companies structure are summarisedbelow and a more detailed explanation of the voting arrangements is set out in the ‘Shareholder Information’section of the 2016 Annual report and financial statements.
Additional Notes: Summary of voting arrangements for Rio Tinto Shareholders
The DLC Sharing Agreement (the agreement relating to the regulation of the relationship between Rio TintoLimited and Rio Tinto plc following the dual listed companies merger) provides for the public shareholders ofRio Tinto Limited and Rio Tinto plc to vote as a joint electorate on all matters which affect shareholders of bothcompanies in similar ways. These are referred to as “Joint Decisions”. Joint Decisions are voted on a poll.
To facilitate the joint voting arrangements, each company has entered into shareholder voting agreements. Eachcompany has issued a special voting share to a special purpose company held in trust by a common trustee.
Rio Tinto Limited has issued its special voting share (“Rio Tinto Limited Special Voting Share”) to RTPShareholder SVC and Rio Tinto plc has issued its special voting share (“Rio Tinto plc Special Voting Share”)to RTL Shareholder SVC. The total number of votes cast on Joint Decisions by the public shareholders of onecompany are voted at the parallel meeting of the other company. The role of these special purpose companies inachieving this is described below.
Rio Tinto Limited
At a Rio Tinto Limited Shareholders’ meeting at which a Joint Decision will be considered, each Rio TintoLimited Share will carry one vote and the holder of the Rio Tinto plc Special Voting Share will have one vote foreach vote cast by the public shareholders of Rio Tinto Limited. The holder of the Rio Tinto plc Special VotingShare is required to vote strictly, and only, in accordance with the votes cast by public shareholders for andagainst the equivalent resolution at the parallel Rio Tinto Limited Shareholders’ meeting.
The holders of Rio Tinto Limited ordinary shares do not actually hold any voting shares in Rio Tinto plc byvirtue of their holding in Rio Tinto Limited and cannot enforce the voting arrangements relating to the Rio Tintoplc Special Voting Share.
Rio Tinto plc
At a Rio Tinto plc Shareholders’ meeting at which a Joint Decision will be considered, each Rio Tinto plc Sharewill carry one vote and the holder of the Rio Tinto Limited Special Voting Share will carry one vote for eachvote cast by the public shareholders of Rio Tinto plc in their parallel meeting. The holder of the Rio Tinto plcSpecial Voting Share is required to vote strictly, and only, in accordance with the votes cast for and against theequivalent resolution at the parallel Rio Tinto plc Shareholders’ meeting.
The holders of Rio Tinto plc ordinary shares do not actually hold any voting shares in Rio Tinto Limited byvirtue of their holding in Rio Tinto plc and cannot enforce the voting arrangements relating to the Rio TintoLimited Special Voting Share.
247
For
per
sona
l use
onl
y
Voting exclusion statement
Rio Tinto Limited will disregard any votes cast on the resolution by Yancoal Australia Limited and any of itsassociates. However, Rio Tinto Limited need not disregard a vote that is cast by a person as proxy for a personwho is entitled to vote in accordance with the directions on the proxy form or by the Chairman of the meeting asproxy for a person who is entitled to vote in accordance with a direction on the proxy form to vote as the proxydecides.
Webcast and photography
The live webcast may include the question and answer sessions with shareholders as well as background footageof those in attendance. Photographs may also be taken at the meeting and published in the media or used in futureRio Tinto publications. If you attend the annual general meeting in person you may be included in the webcastrecording and photographs.
Definitions
Unless specified otherwise, words and expressions used in this notice of meeting have the meanings set out inPart IV (Definitions) of this document.
248
For
per
sona
l use
onl
y

[Page deliberately left blank]
For
per
sona
l use
onl
y

Printed by Donnelley Financial Solutions 374653
For
per
sona
l use
onl
y