For personal use only Tech Mpire · FY17 Full Year Results Presentation SECTOR GROWTH Strong growth...
19
Tech Mpire Lee Hunter Managing Director & Chief Executive Officer ASX:TMP e [email protected] p +61 8 9473 2500 w www.techmpire.com FY17 FULL YEAR RESULTS PRESENTATION Strong foundations for future success For personal use only
Transcript of For personal use only Tech Mpire · FY17 Full Year Results Presentation SECTOR GROWTH Strong growth...

Tech Mpire
Lee Hunter Managing Director & Chief Executive Officer
ASX:TMP e [email protected] p +61 8 9473 2500 w www.techmpire.com
FY17 FULL YEAR RESULTS PRESENTATION Strong foundations for future success
For
per
sona
l use
onl
y
Tech Mpire
FY17 Full Year Results Presentation
TABLE OF CONTENTS
2
Financial Summary 3
Key Investment Considerations 4
Operational Highlights 5
Financial Overview 6
Strategy Highlights 7
Sector Growth 8
Multiple Growth Strategies for FY18 9
Strong Revenue Growth Predicted 13
Outlook for FY18 14
Appendices 15
Disclaimer 19
For
per
sona
l use
onl
y
Tech Mpire
FY17 Full Year Results Presentation
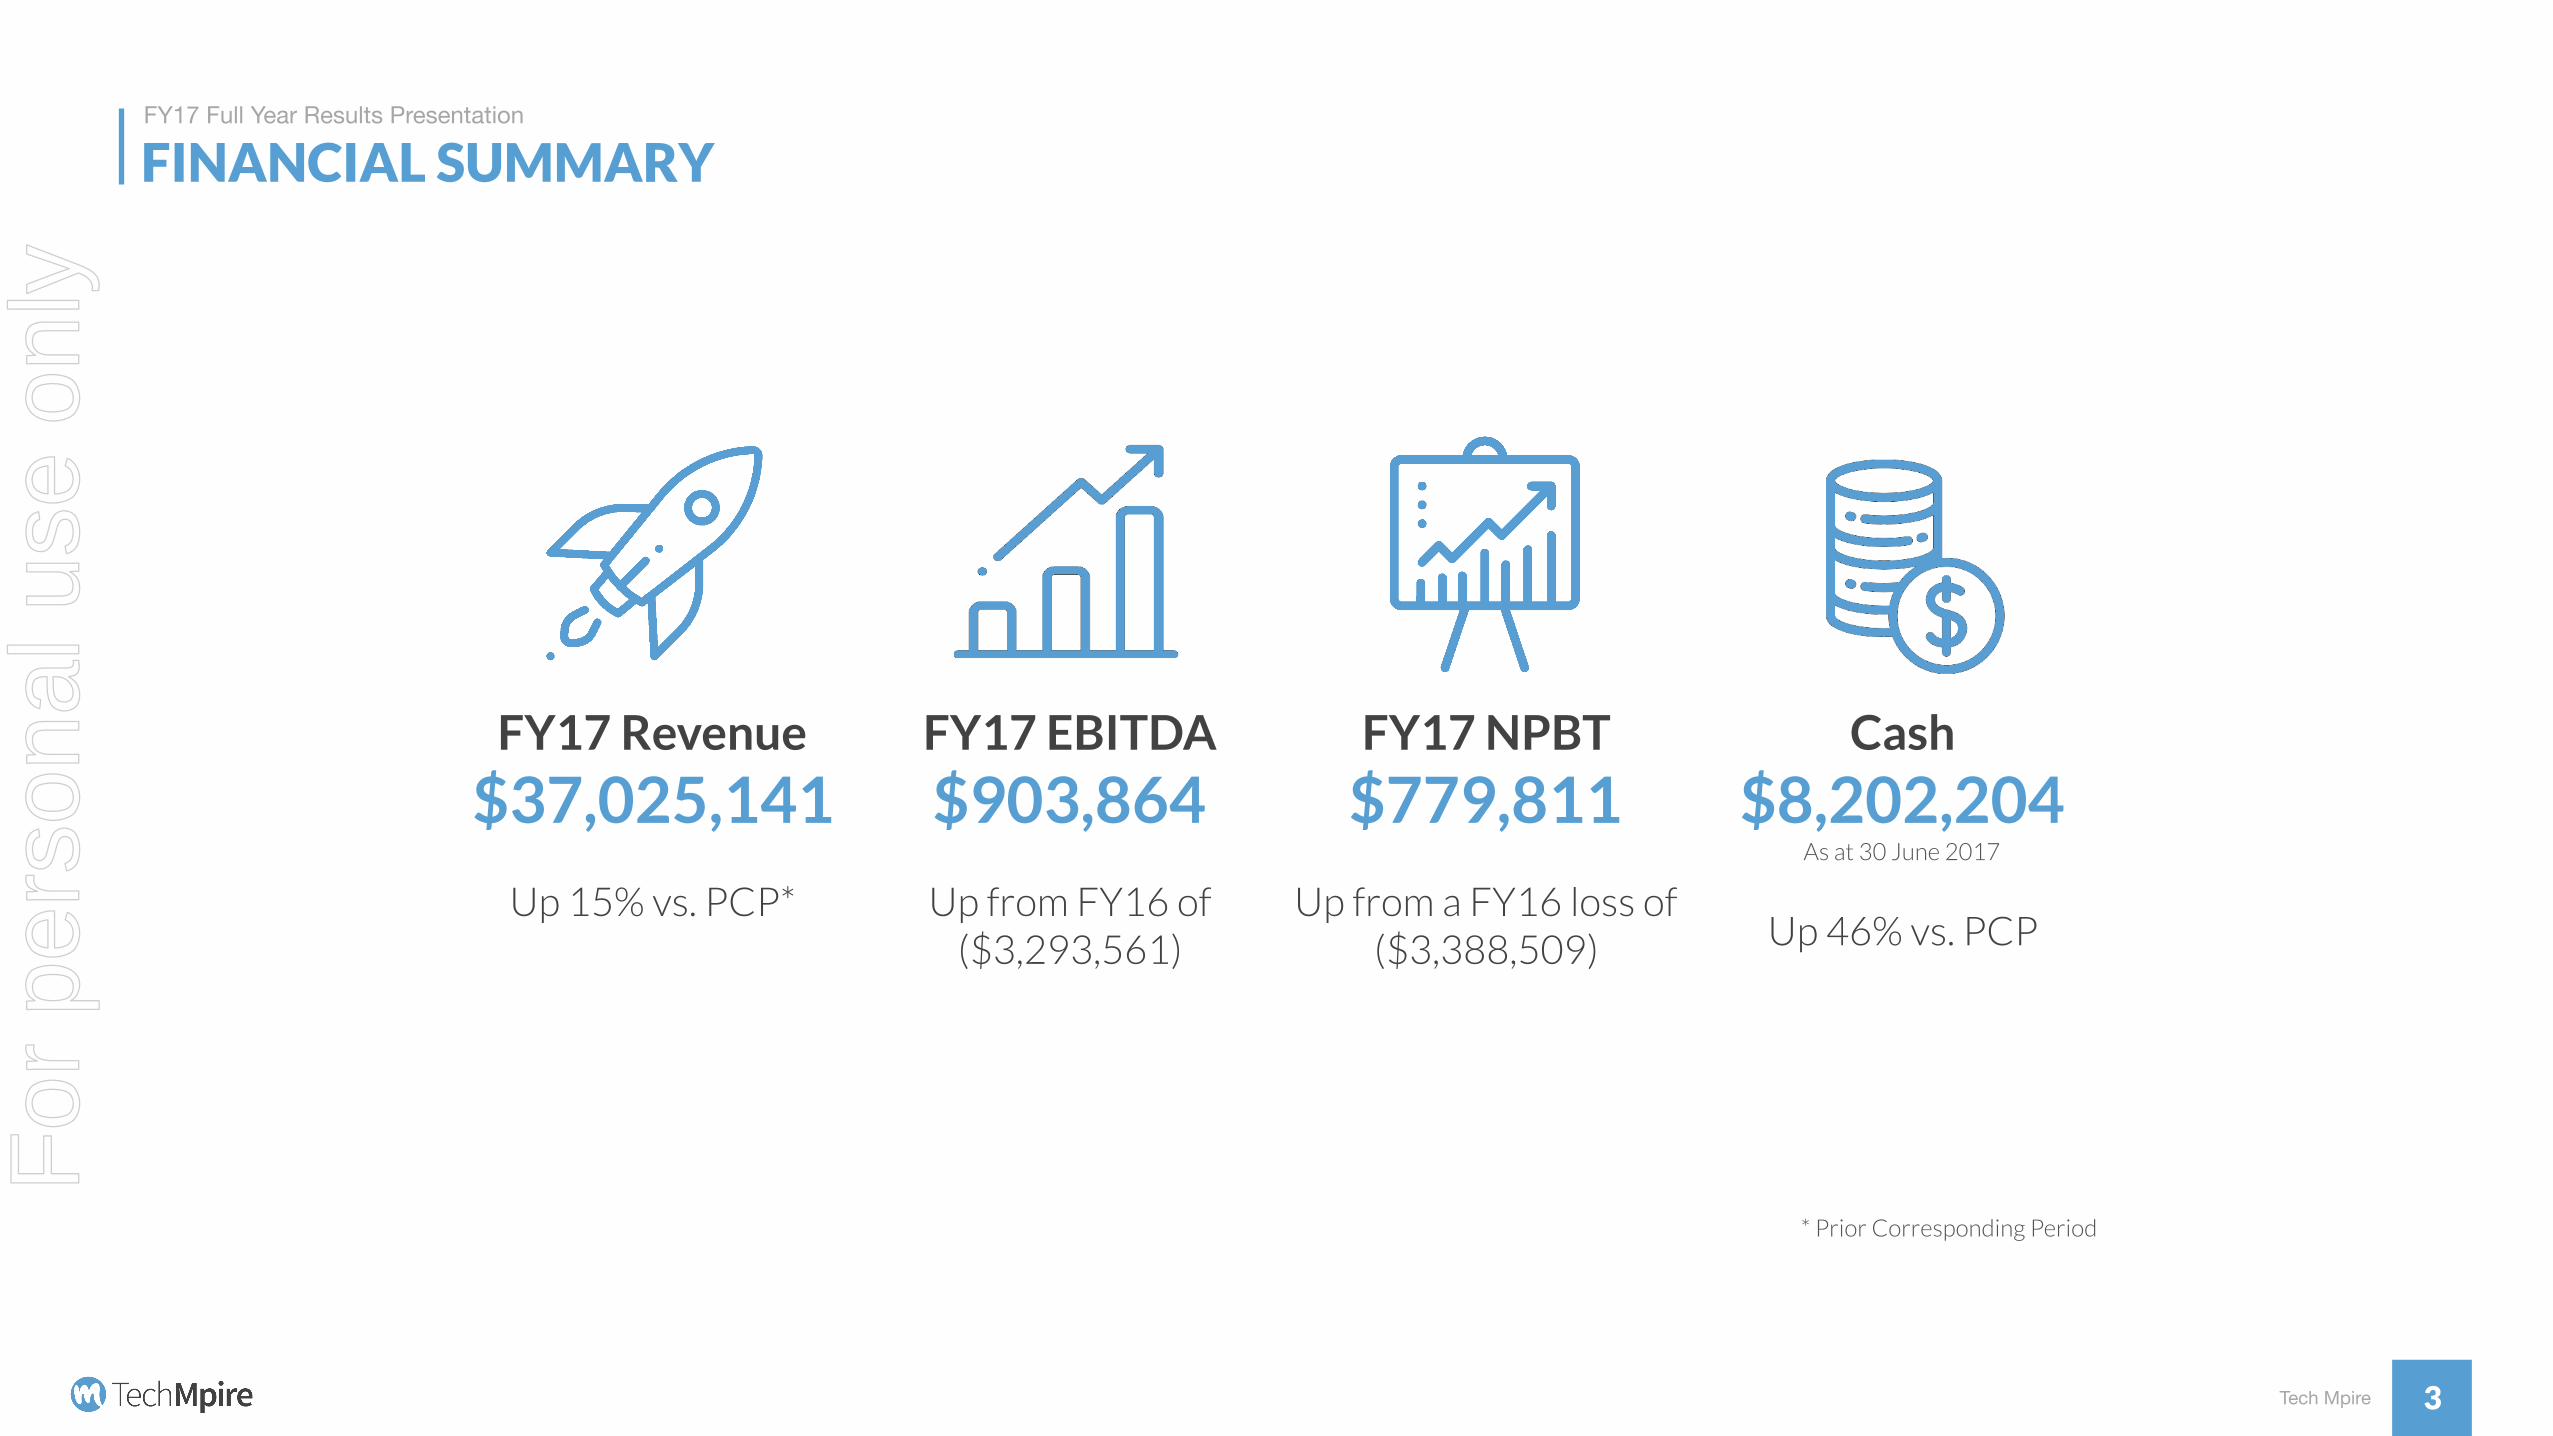
FINANCIAL SUMMARY
3
FY17 Revenue
$37,025,141
Up 15% vs. PCP*
FY17 EBITDA
$903,864
Up from FY16 of ($3,293,561)
FY17 NPBT
$779,811
Up from a FY16 loss of ($3,388,509)
Cash
$8,202,204 As at 30 June 2017
Up 46% vs. PCP
* Prior Corresponding Period
For
per
sona
l use
onl
y
Tech Mpire
FY17 Full Year Results Presentation
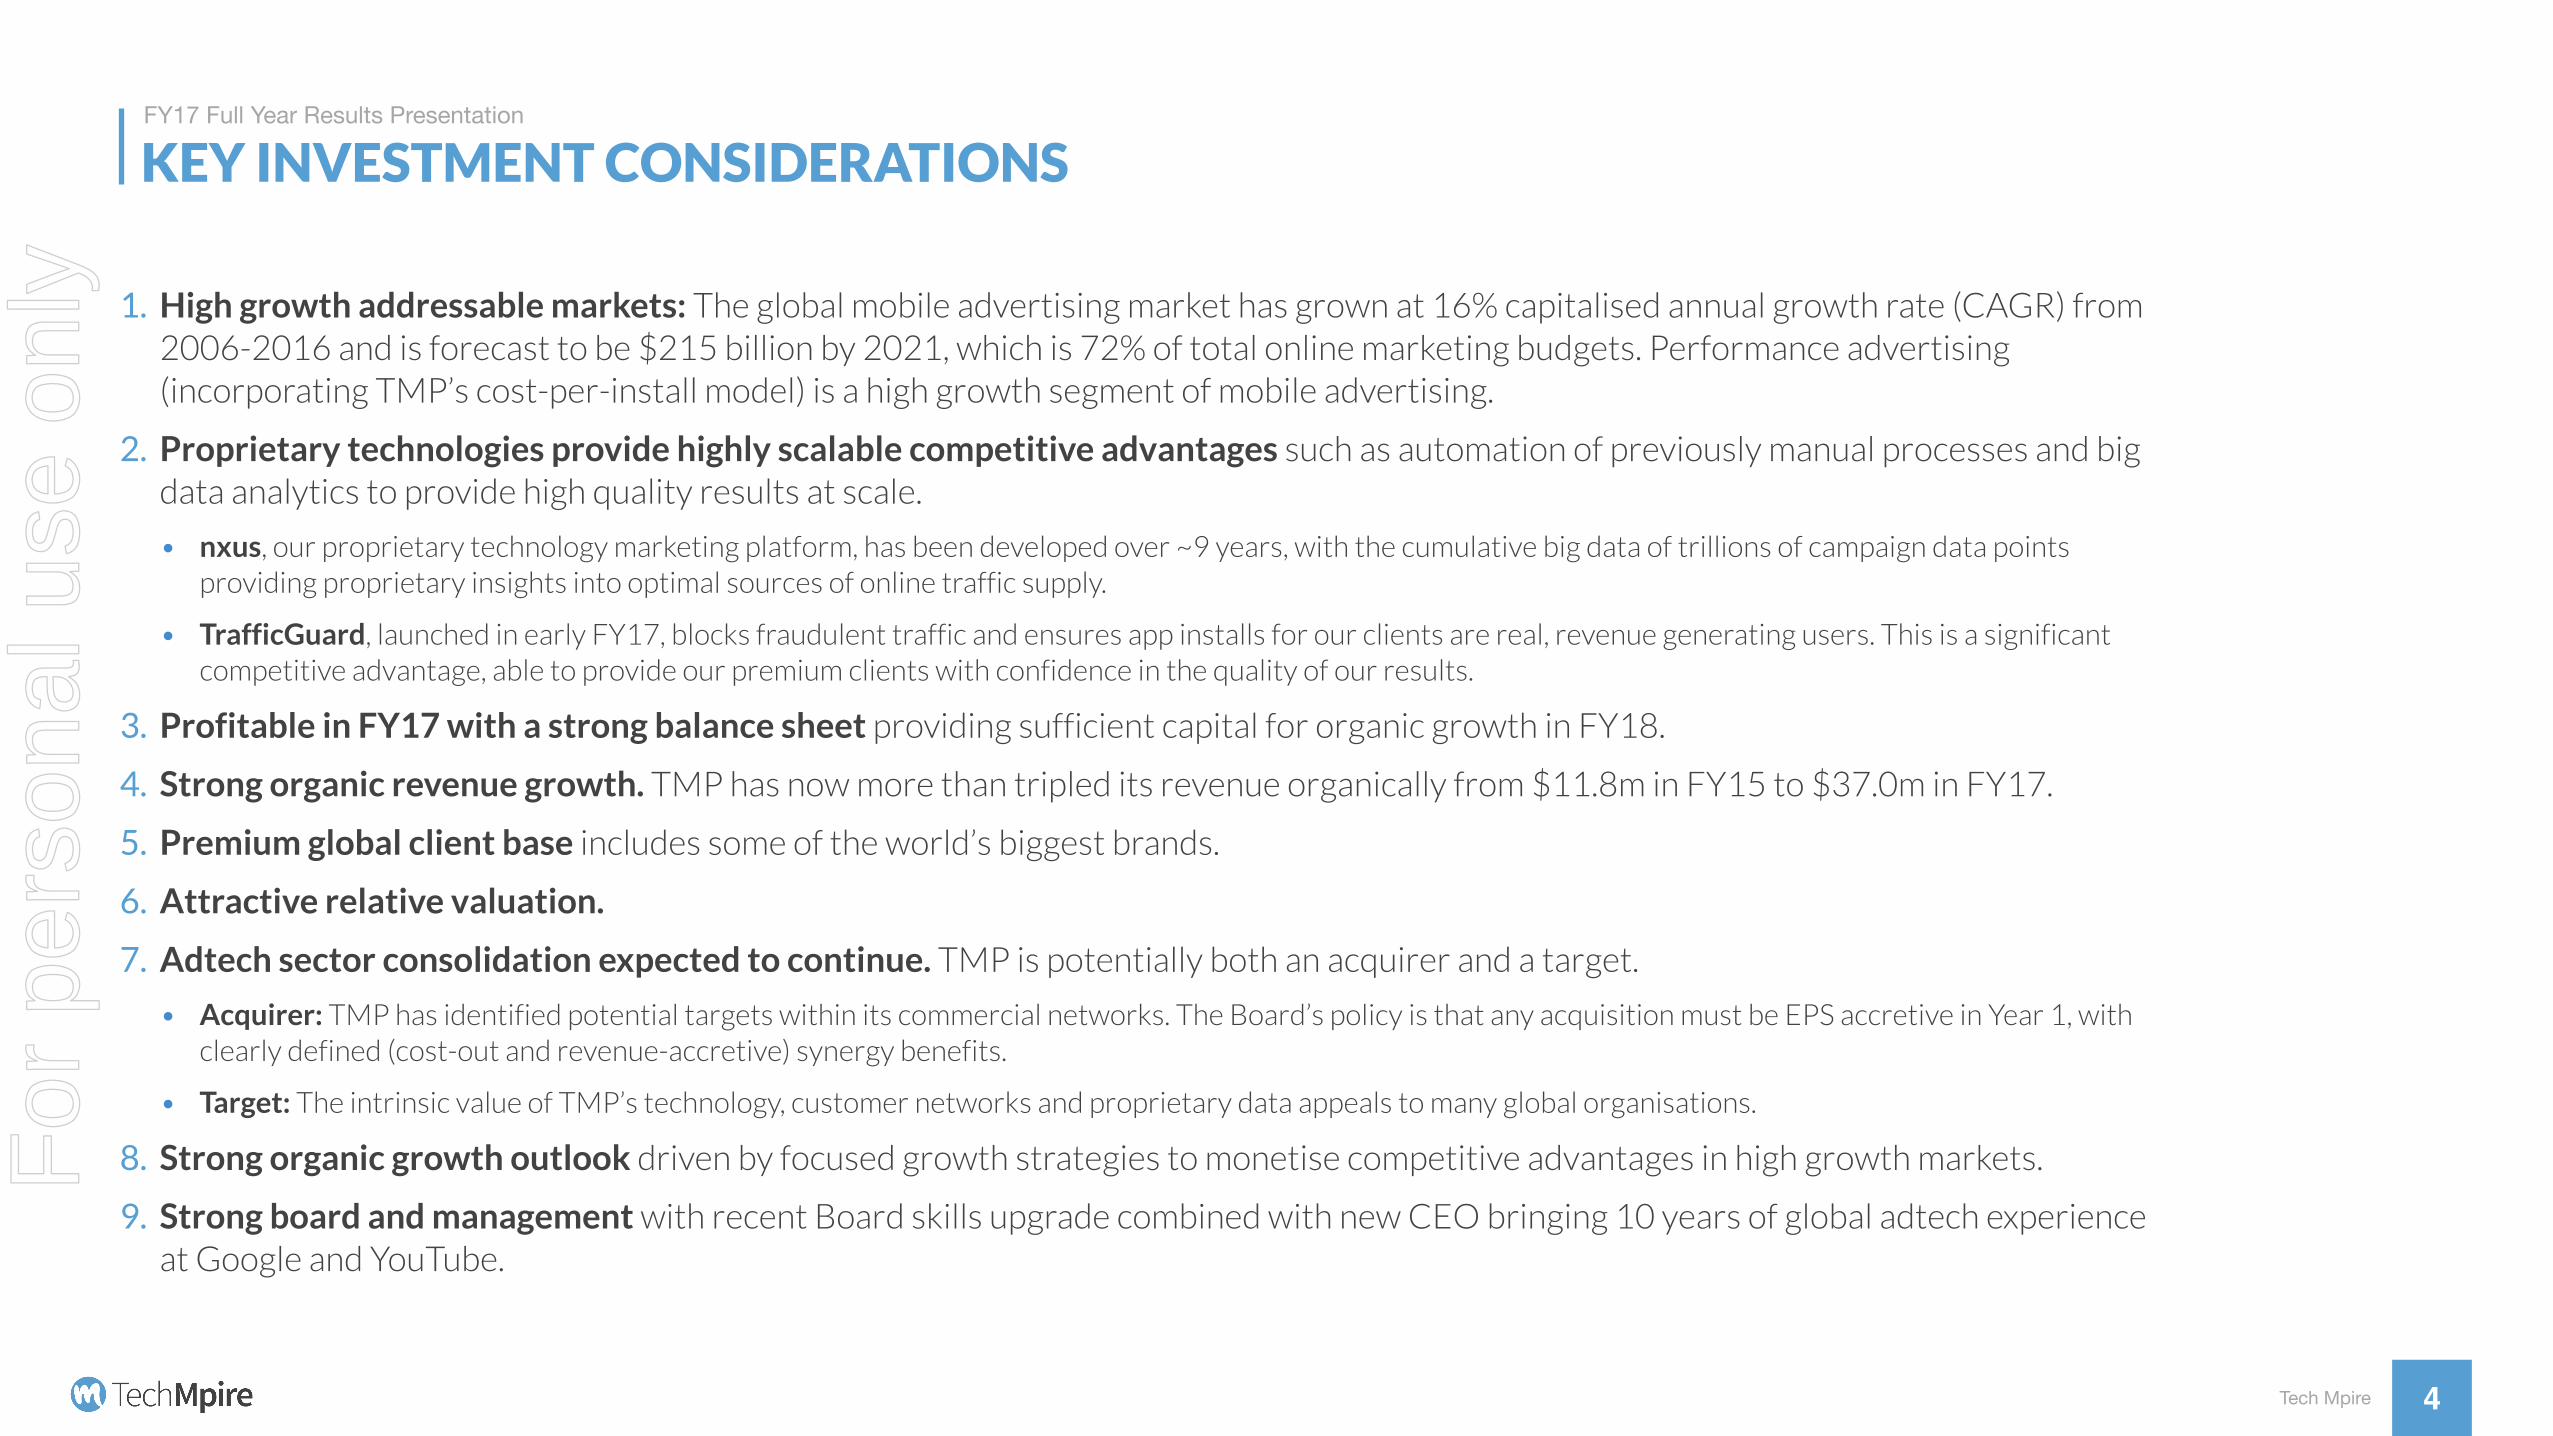
KEY INVESTMENT CONSIDERATIONS
4
1. High growth addressable markets: The global mobile advertising market has grown at 16% capitalised annual growth rate (CAGR) from 2006-2016 and is forecast to be $215 billion by 2021, which is 72% of total online marketing budgets. Performance advertising (incorporating TMP’s cost-per-install model) is a high growth segment of mobile advertising.
2. Proprietary technologies provide highly scalable competitive advantages such as automation of previously manual processes and big data analytics to provide high quality results at scale.
• nxus, our proprietary technology marketing platform, has been developed over ~9 years, with the cumulative big data of trillions of campaign data points providing proprietary insights into optimal sources of online traffic supply.
• TrafficGuard, launched in early FY17, blocks fraudulent traffic and ensures app installs for our clients are real, revenue generating users. This is a significant competitive advantage, able to provide our premium clients with confidence in the quality of our results.
3. Profitable in FY17 with a strong balance sheet providing sufficient capital for organic growth in FY18.
4. Strong organic revenue growth. TMP has now more than tripled its revenue organically from $11.8m in FY15 to $37.0m in FY17.
5. Premium global client base includes some of the world’s biggest brands.
6. Attractive relative valuation.
7. Adtech sector consolidation expected to continue. TMP is potentially both an acquirer and a target.
• Acquirer: TMP has identified potential targets within its commercial networks. The Board’s policy is that any acquisition must be EPS accretive in Year 1, with clearly defined (cost-out and revenue-accretive) synergy benefits.
• Target: The intrinsic value of TMP’s technology, customer networks and proprietary data appeals to many global organisations.
8. Strong organic growth outlook driven by focused growth strategies to monetise competitive advantages in high growth markets.
9. Strong board and management with recent Board skills upgrade combined with new CEO bringing 10 years of global adtech experience at Google and YouTube.
For
per
sona
l use
onl
y

Tech Mpire
FY17 Full Year Results Presentation
OPERATIONAL HIGHLIGHTS
5
26,496,608 App installs in FY17
With our sole focus now on the growing market for mobile app installs, we’ve delivered 48% more installs for our clients, up from 17.8m in FY16.
27% Increase in revenue per client
Technology and servicing improvements have seen greater performance and ROI for our clients, resulting in increasing budgets for Tech Mpire. A sign of our competitive advantage.
2,500,000+ Fraudulent installs blocked
With the launch of TrafficGuard in October 2016, we now prevent a significant amount of invalid traffic and fraud from reaching our clients. With competitors lacking a tool like TrafficGuard, they continue to deliver this fraudulent traffic.
833,401,333 Mobile users reached daily
Our efforts to scale our traffic sources, and focus on mobile users has seen us grow our potential reach to over 800m mobile users around the world. This scale helps us attract and retain high-tier clients looking for global user acquisition.
2 Trillion Data Points Processed by nxus since launch
Our technology operates at scale, with a database of 2 trillion data points (such as who clicked on an ad, where they live, what device they used and more). nxus currently processes in excess of 6 billion data points each day to monitor and report on campaigns, and algorithmically recommends the most relevant traffic partner for an advertiser campaign. It represents a unique source of IP for our business.
For
per
sona
l use
onl
y
Tech Mpire
FY17 Full Year Results Presentation
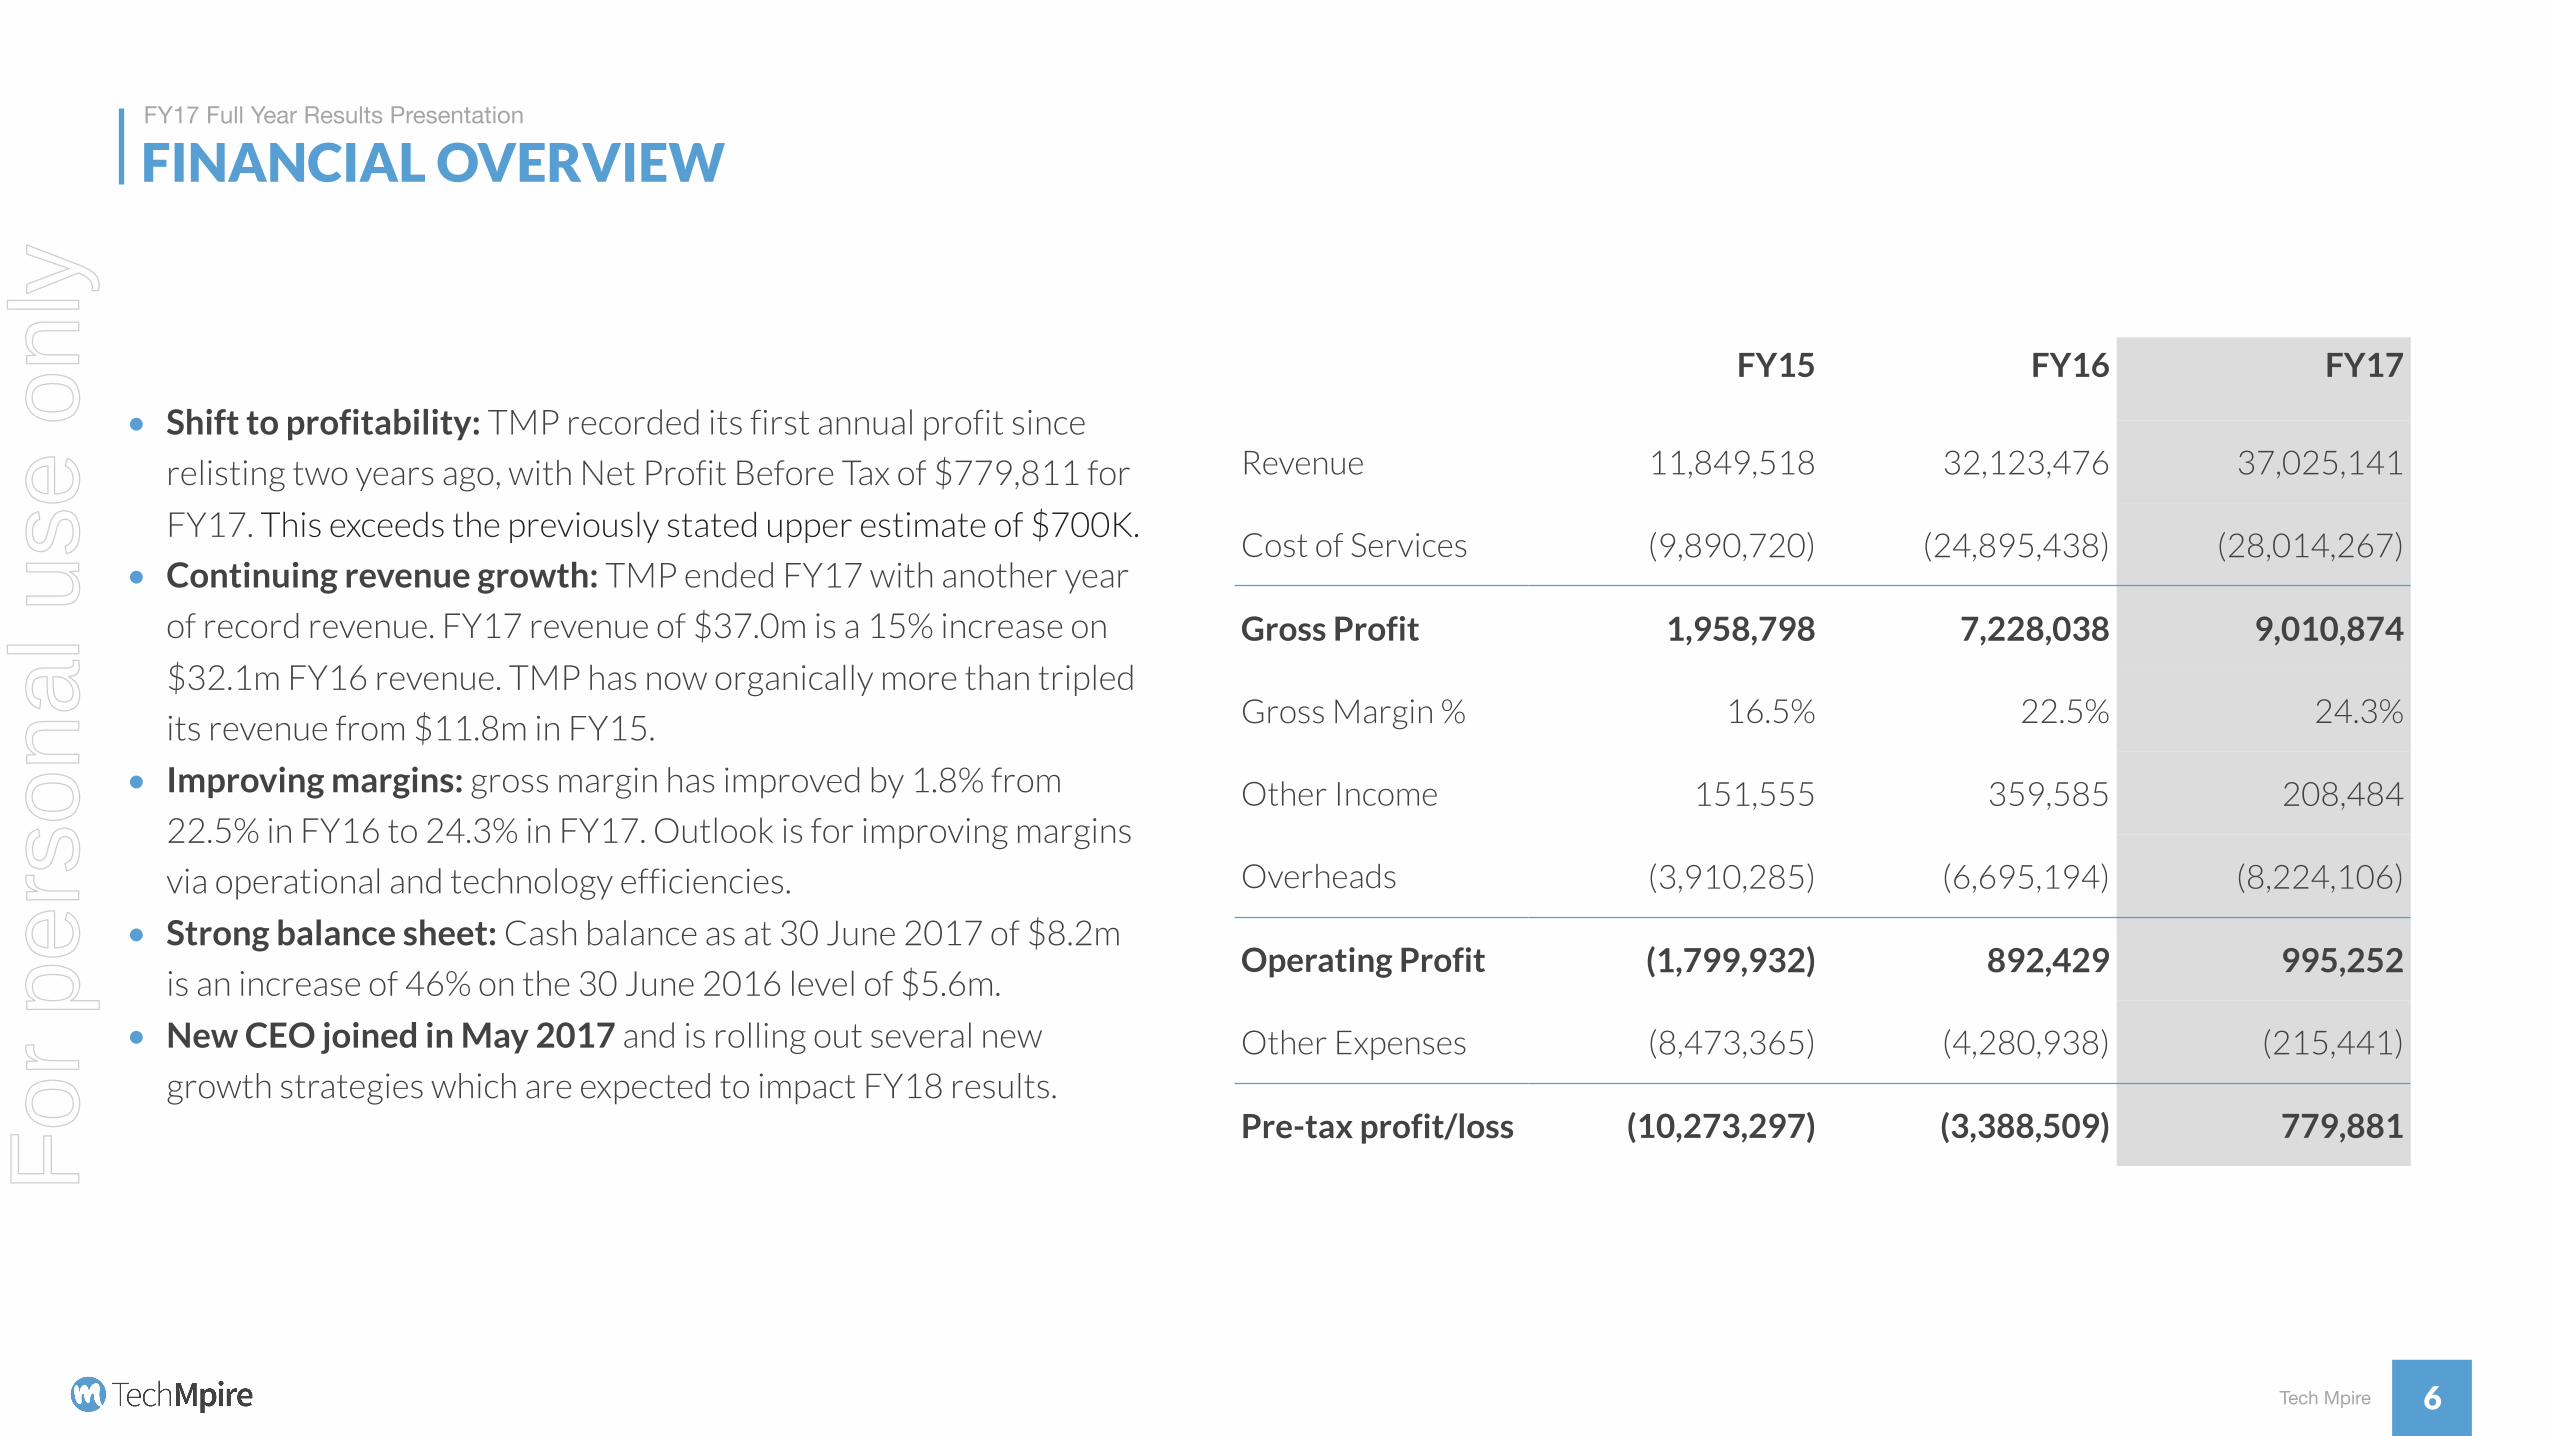
FINANCIAL OVERVIEW
6
FY15 FY16 FY17
Revenue 11,849,518 32,123,476 37,025,141
Cost of Services (9,890,720) (24,895,438) (28,014,267)
Gross Profit 1,958,798 7,228,038 9,010,874
Gross Margin % 16.5% 22.5% 24.3%
Other Income 151,555 359,585 208,484
Overheads (3,910,285) (6,695,194) (8,224,106)
Operating Profit (1,799,932) 892,429 995,252
Other Expenses (8,473,365) (4,280,938) (215,441)
Pre-tax profit/loss (10,273,297) (3,388,509) 779,881
• Shift to profitability: TMP recorded its first annual profit since
relisting two years ago, with Net Profit Before Tax of $779,811 for
FY17. This exceeds the previously stated upper estimate of $700K.
• Continuing revenue growth: TMP ended FY17 with another year
of record revenue. FY17 revenue of $37.0m is a 15% increase on
$32.1m FY16 revenue. TMP has now organically more than tripled
its revenue from $11.8m in FY15.
• Improving margins: gross margin has improved by 1.8% from
22.5% in FY16 to 24.3% in FY17. Outlook is for improving margins
via operational and technology efficiencies.
• Strong balance sheet: Cash balance as at 30 June 2017 of $8.2m
is an increase of 46% on the 30 June 2016 level of $5.6m.
• New CEO joined in May 2017 and is rolling out several new
growth strategies which are expected to impact FY18 results.
For
per
sona
l use
onl
y
Tech Mpire
FY17 Full Year Results Presentation
STRATEGY HIGHLIGHTS
7
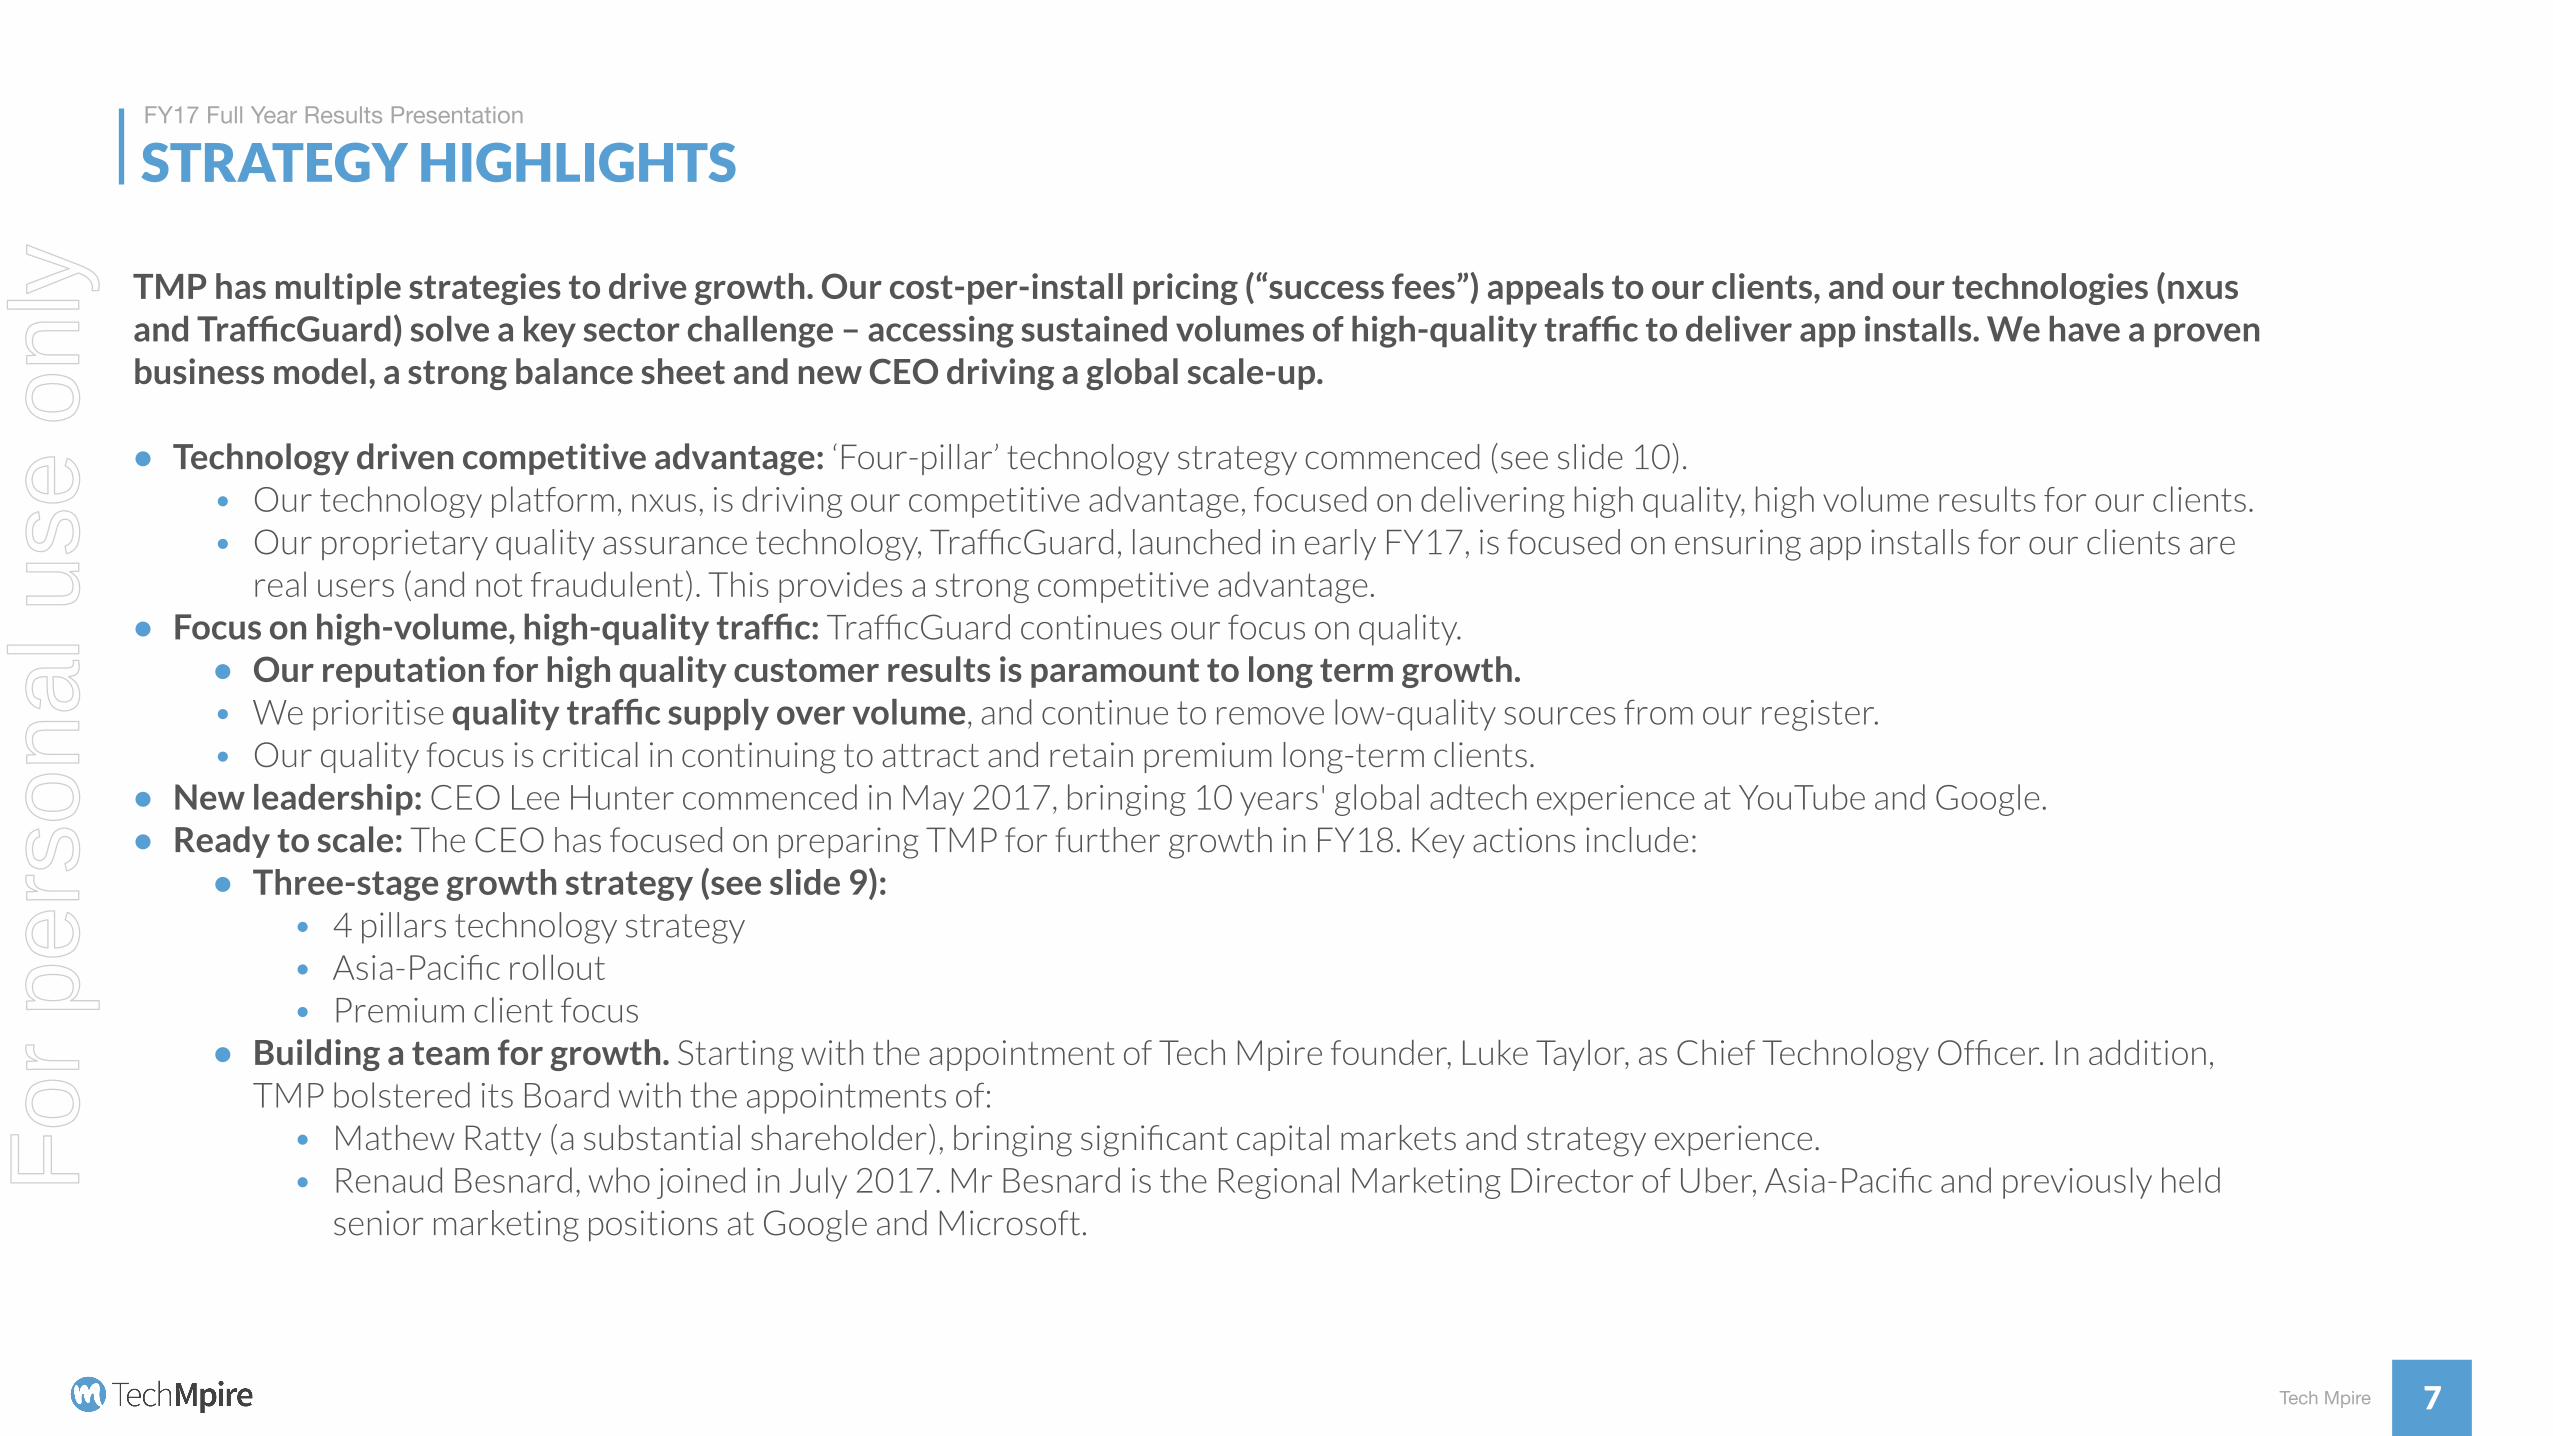
TMP has multiple strategies to drive growth. Our cost-per-install pricing (“success fees”) appeals to our clients, and our technologies (nxus and TrafficGuard) solve a key sector challenge – accessing sustained volumes of high-quality traffic to deliver app installs. We have a proven business model, a strong balance sheet and new CEO driving a global scale-up.
• Technology driven competitive advantage: ‘Four-pillar’ technology strategy commenced (see slide 10). • Our technology platform, nxus, is driving our competitive advantage, focused on delivering high quality, high volume results for our clients. • Our proprietary quality assurance technology, TrafficGuard, launched in early FY17, is focused on ensuring app installs for our clients are
real users (and not fraudulent). This provides a strong competitive advantage. • Focus on high-volume, high-quality traffic: TrafficGuard continues our focus on quality.
• Our reputation for high quality customer results is paramount to long term growth. • We prioritise quality traffic supply over volume, and continue to remove low-quality sources from our register. • Our quality focus is critical in continuing to attract and retain premium long-term clients.
• New leadership: CEO Lee Hunter commenced in May 2017, bringing 10 years' global adtech experience at YouTube and Google. • Ready to scale: The CEO has focused on preparing TMP for further growth in FY18. Key actions include:
• Three-stage growth strategy (see slide 9): • 4 pillars technology strategy • Asia-Pacific rollout • Premium client focus
• Building a team for growth. Starting with the appointment of Tech Mpire founder, Luke Taylor, as Chief Technology Officer. In addition, TMP bolstered its Board with the appointments of:
• Mathew Ratty (a substantial shareholder), bringing significant capital markets and strategy experience. • Renaud Besnard, who joined in July 2017. Mr Besnard is the Regional Marketing Director of Uber, Asia-Pacific and previously held
senior marketing positions at Google and Microsoft.
For
per
sona
l use
onl
y
Tech Mpire
FY17 Full Year Results Presentation
SECTOR GROWTHStrong growth in performance advertising and mobile marketing
8Sources: IAB/ PWC Internet advertising revenue report 2016, Magna Global research, 2016
36%
64%
CPC / CPACPM + Other2016
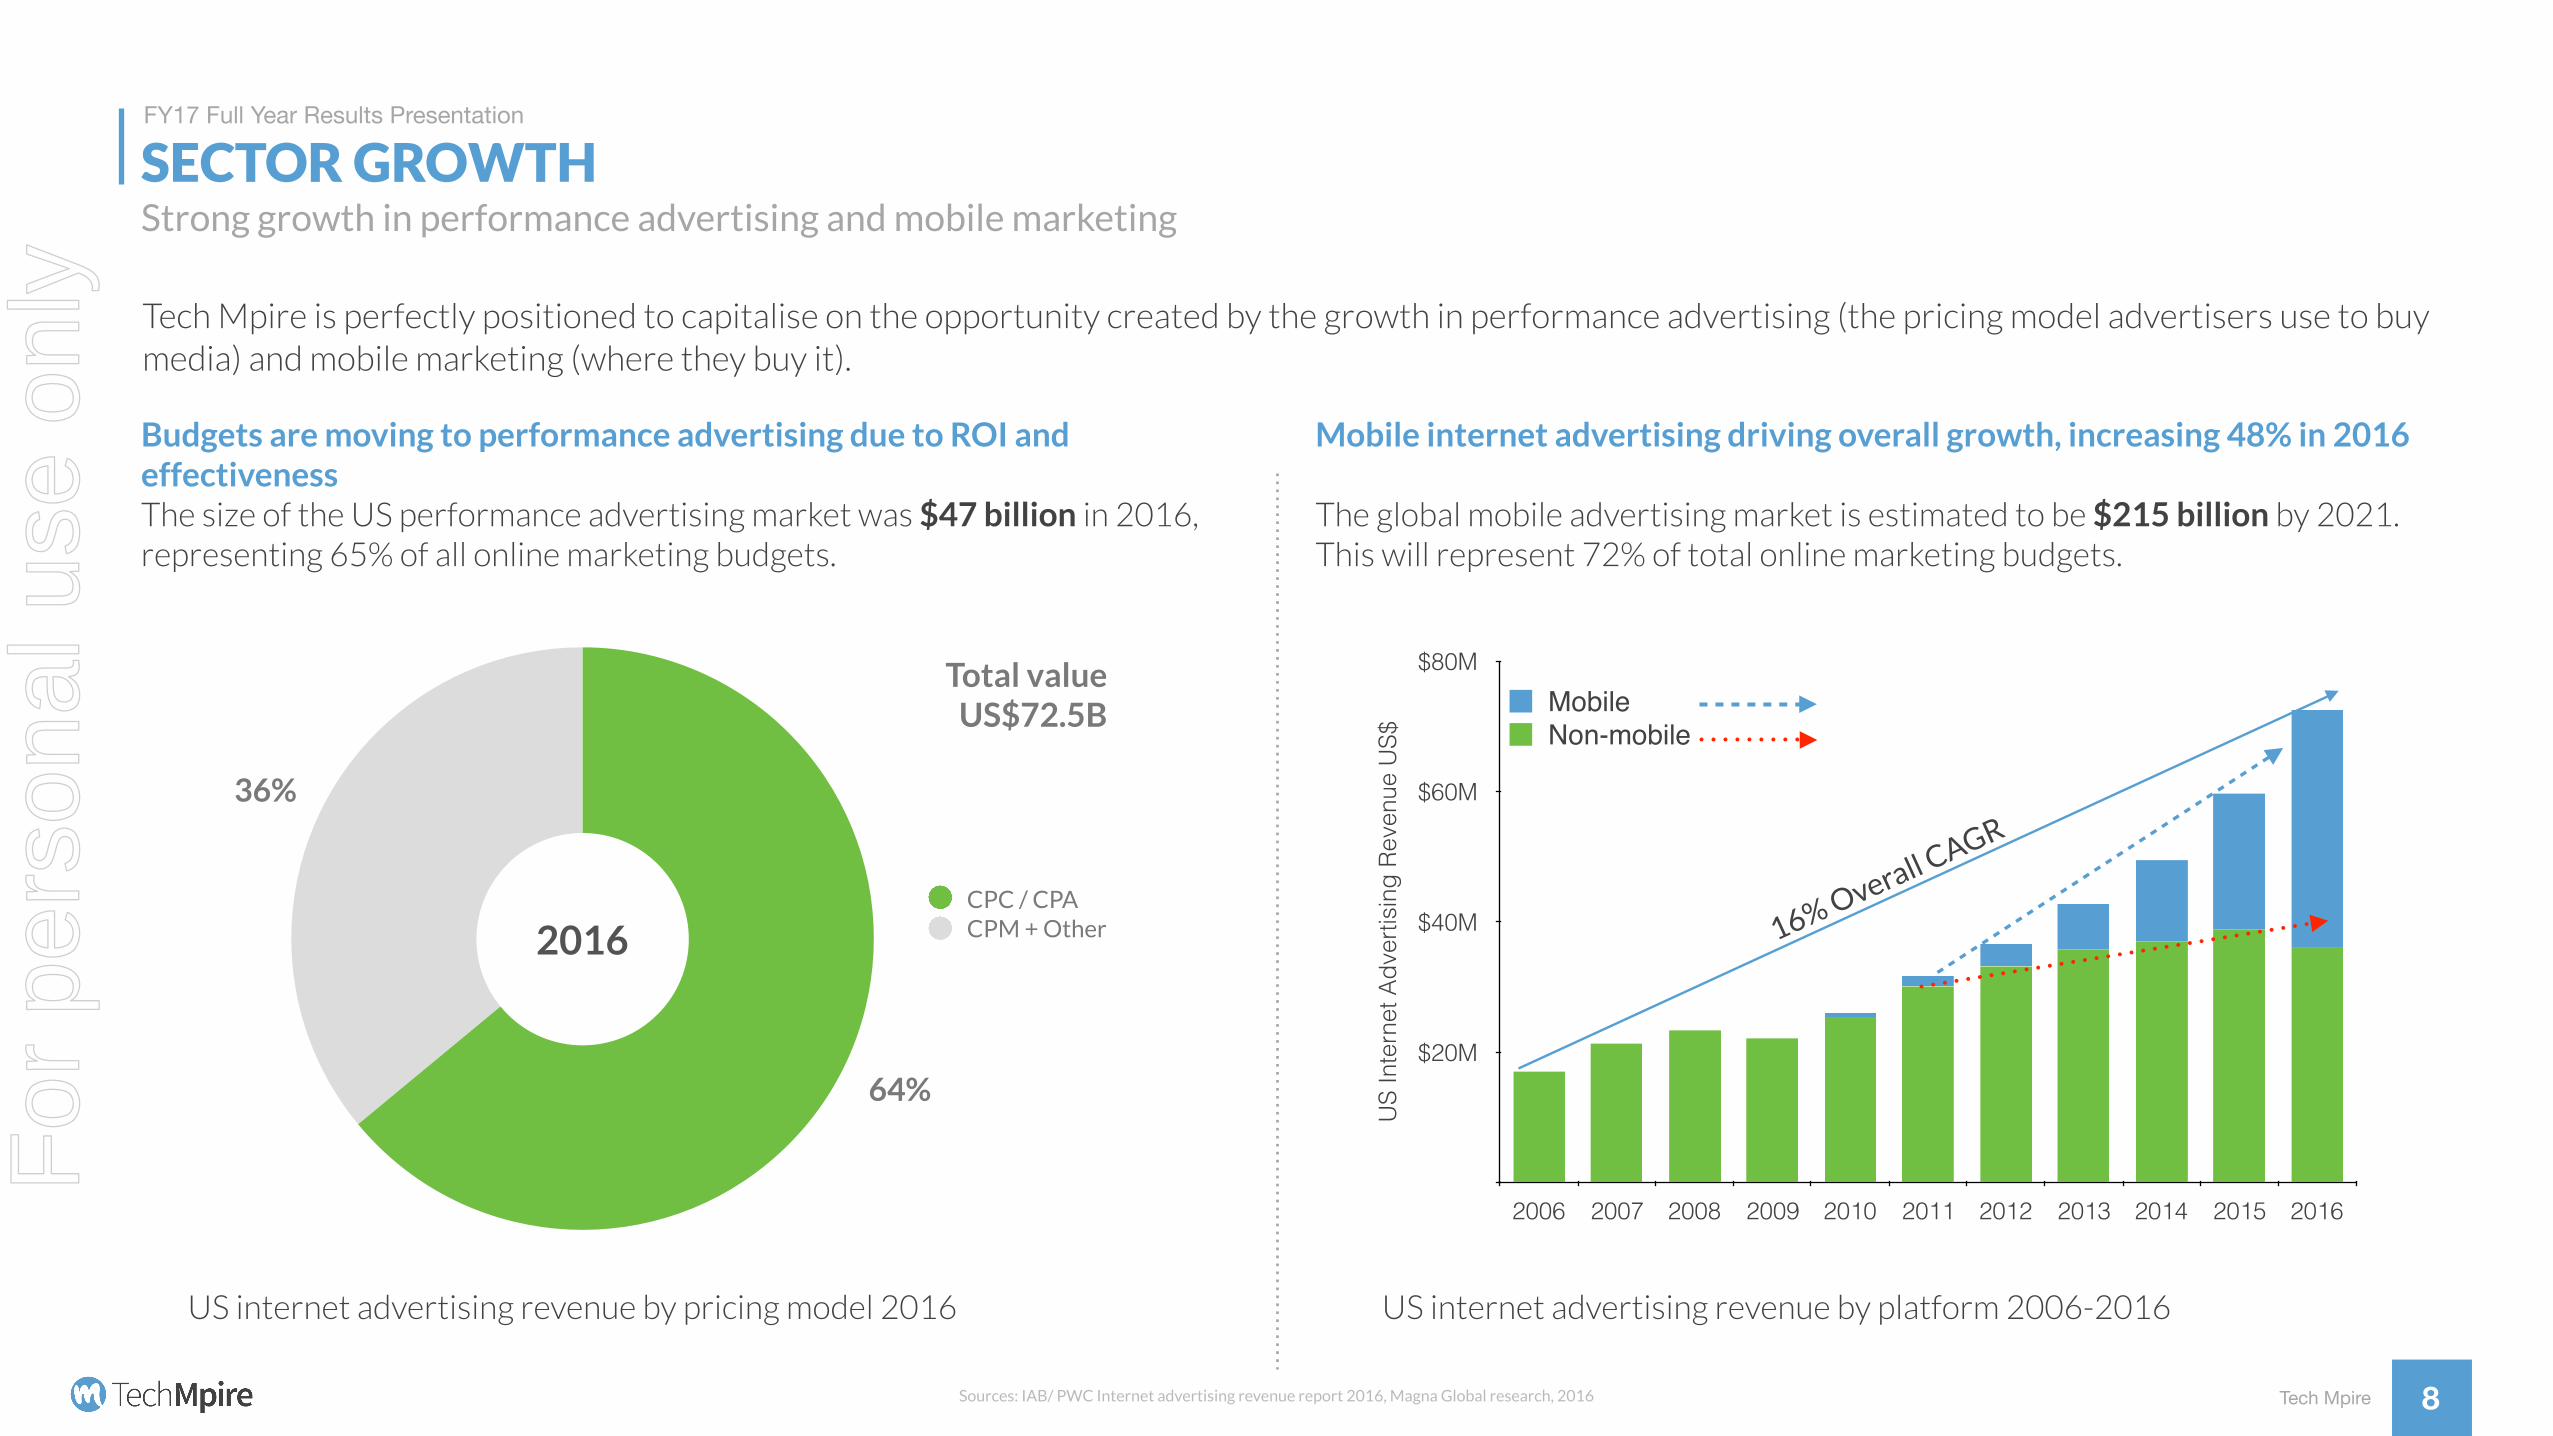
Mobile internet advertising driving overall growth, increasing 48% in 2016
The global mobile advertising market is estimated to be $215 billion by 2021. This will represent 72% of total online marketing budgets.
Budgets are moving to performance advertising due to ROI and effectiveness The size of the US performance advertising market was $47 billion in 2016, representing 65% of all online marketing budgets.
US
Inte
rnet
Adv
ertis
ing
Reve
nue
US$
$20M
$40M
$60M
$80M
2006 2007 2008 2009 2010 2011 2012 2013 2014 2015 2016
Non-mobileMobile
16% Overall CAGR
Tech Mpire is perfectly positioned to capitalise on the opportunity created by the growth in performance advertising (the pricing model advertisers use to buy media) and mobile marketing (where they buy it).
US internet advertising revenue by pricing model 2016 US internet advertising revenue by platform 2006-2016
Total value US$72.5B
For
per
sona
l use
onl
y
Tech Mpire
FY17 Full Year Results Presentation
MULTIPLE GROWTH STRATEGIES FOR FY18
9
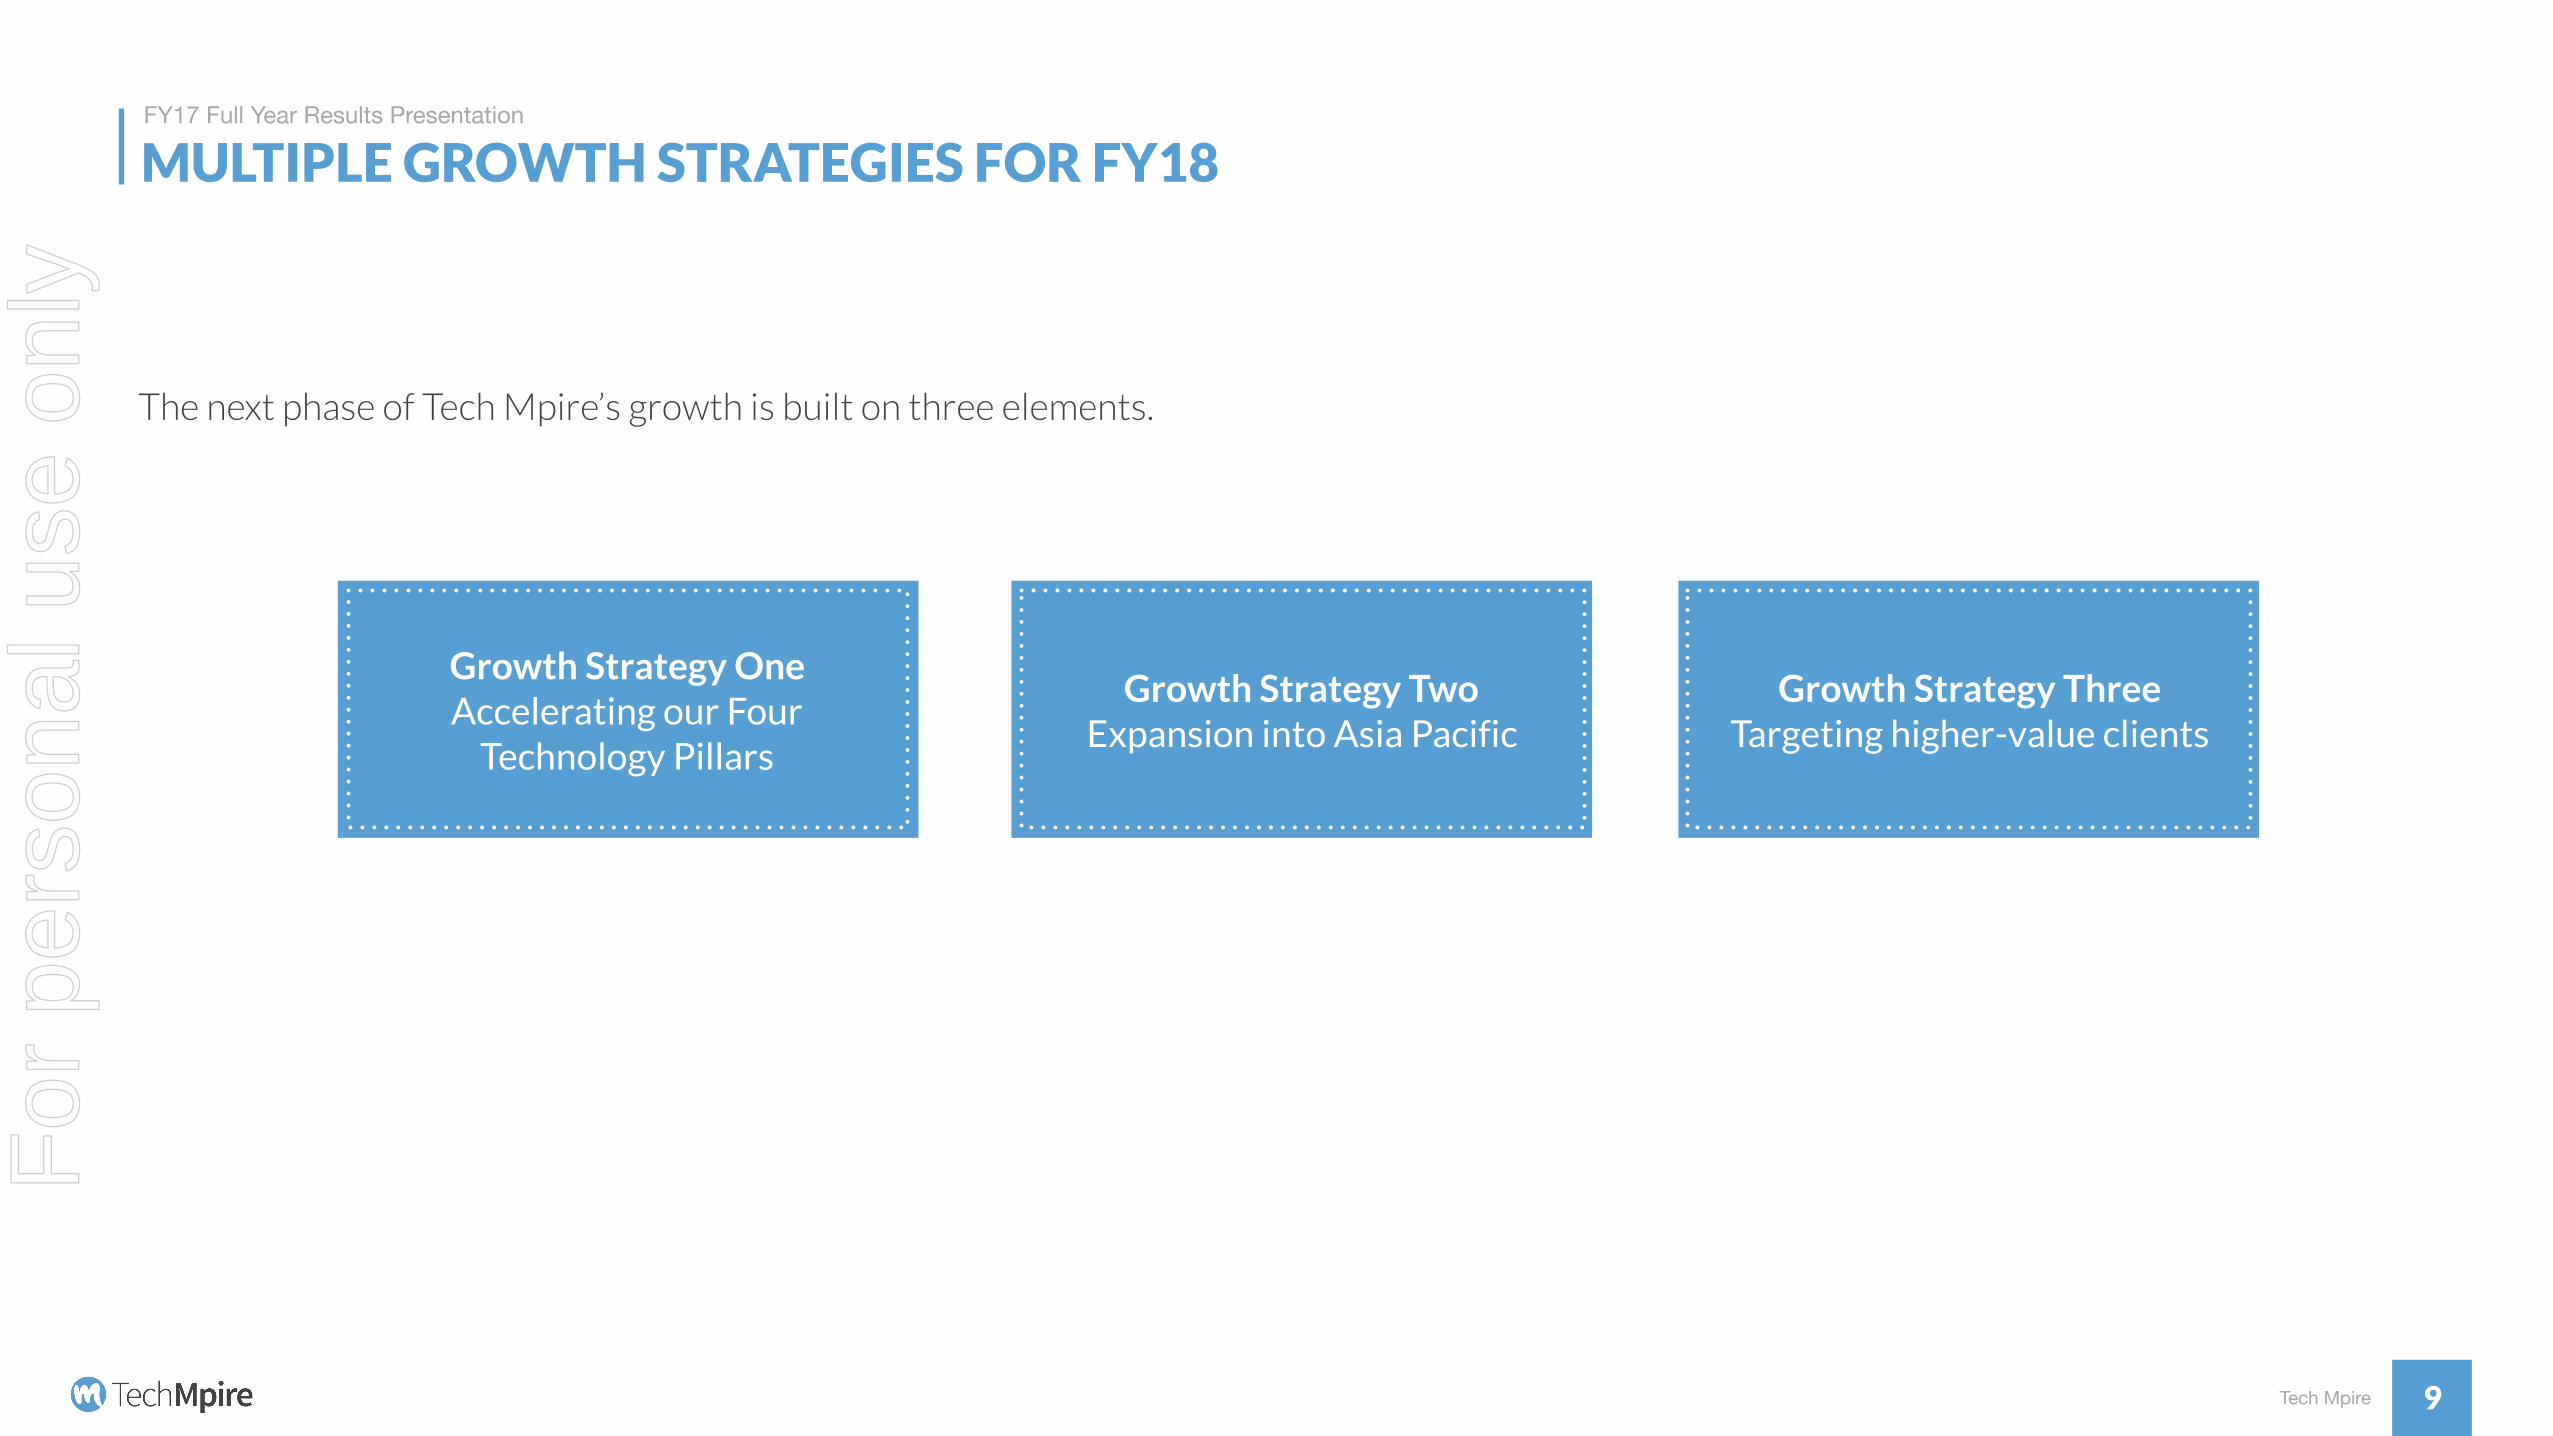
The next phase of Tech Mpire’s growth is built on three elements.
Growth Strategy One Accelerating our Four
Technology Pillars
Growth Strategy Two Expansion into Asia Pacific
Growth Strategy Three Targeting higher-value clients
For
per
sona
l use
onl
y
Tech Mpire
FY17 Full Year Results Presentation
GROWTH STRATEGY ONE: OUR 4 TECHNOLOGY PILLARS
10
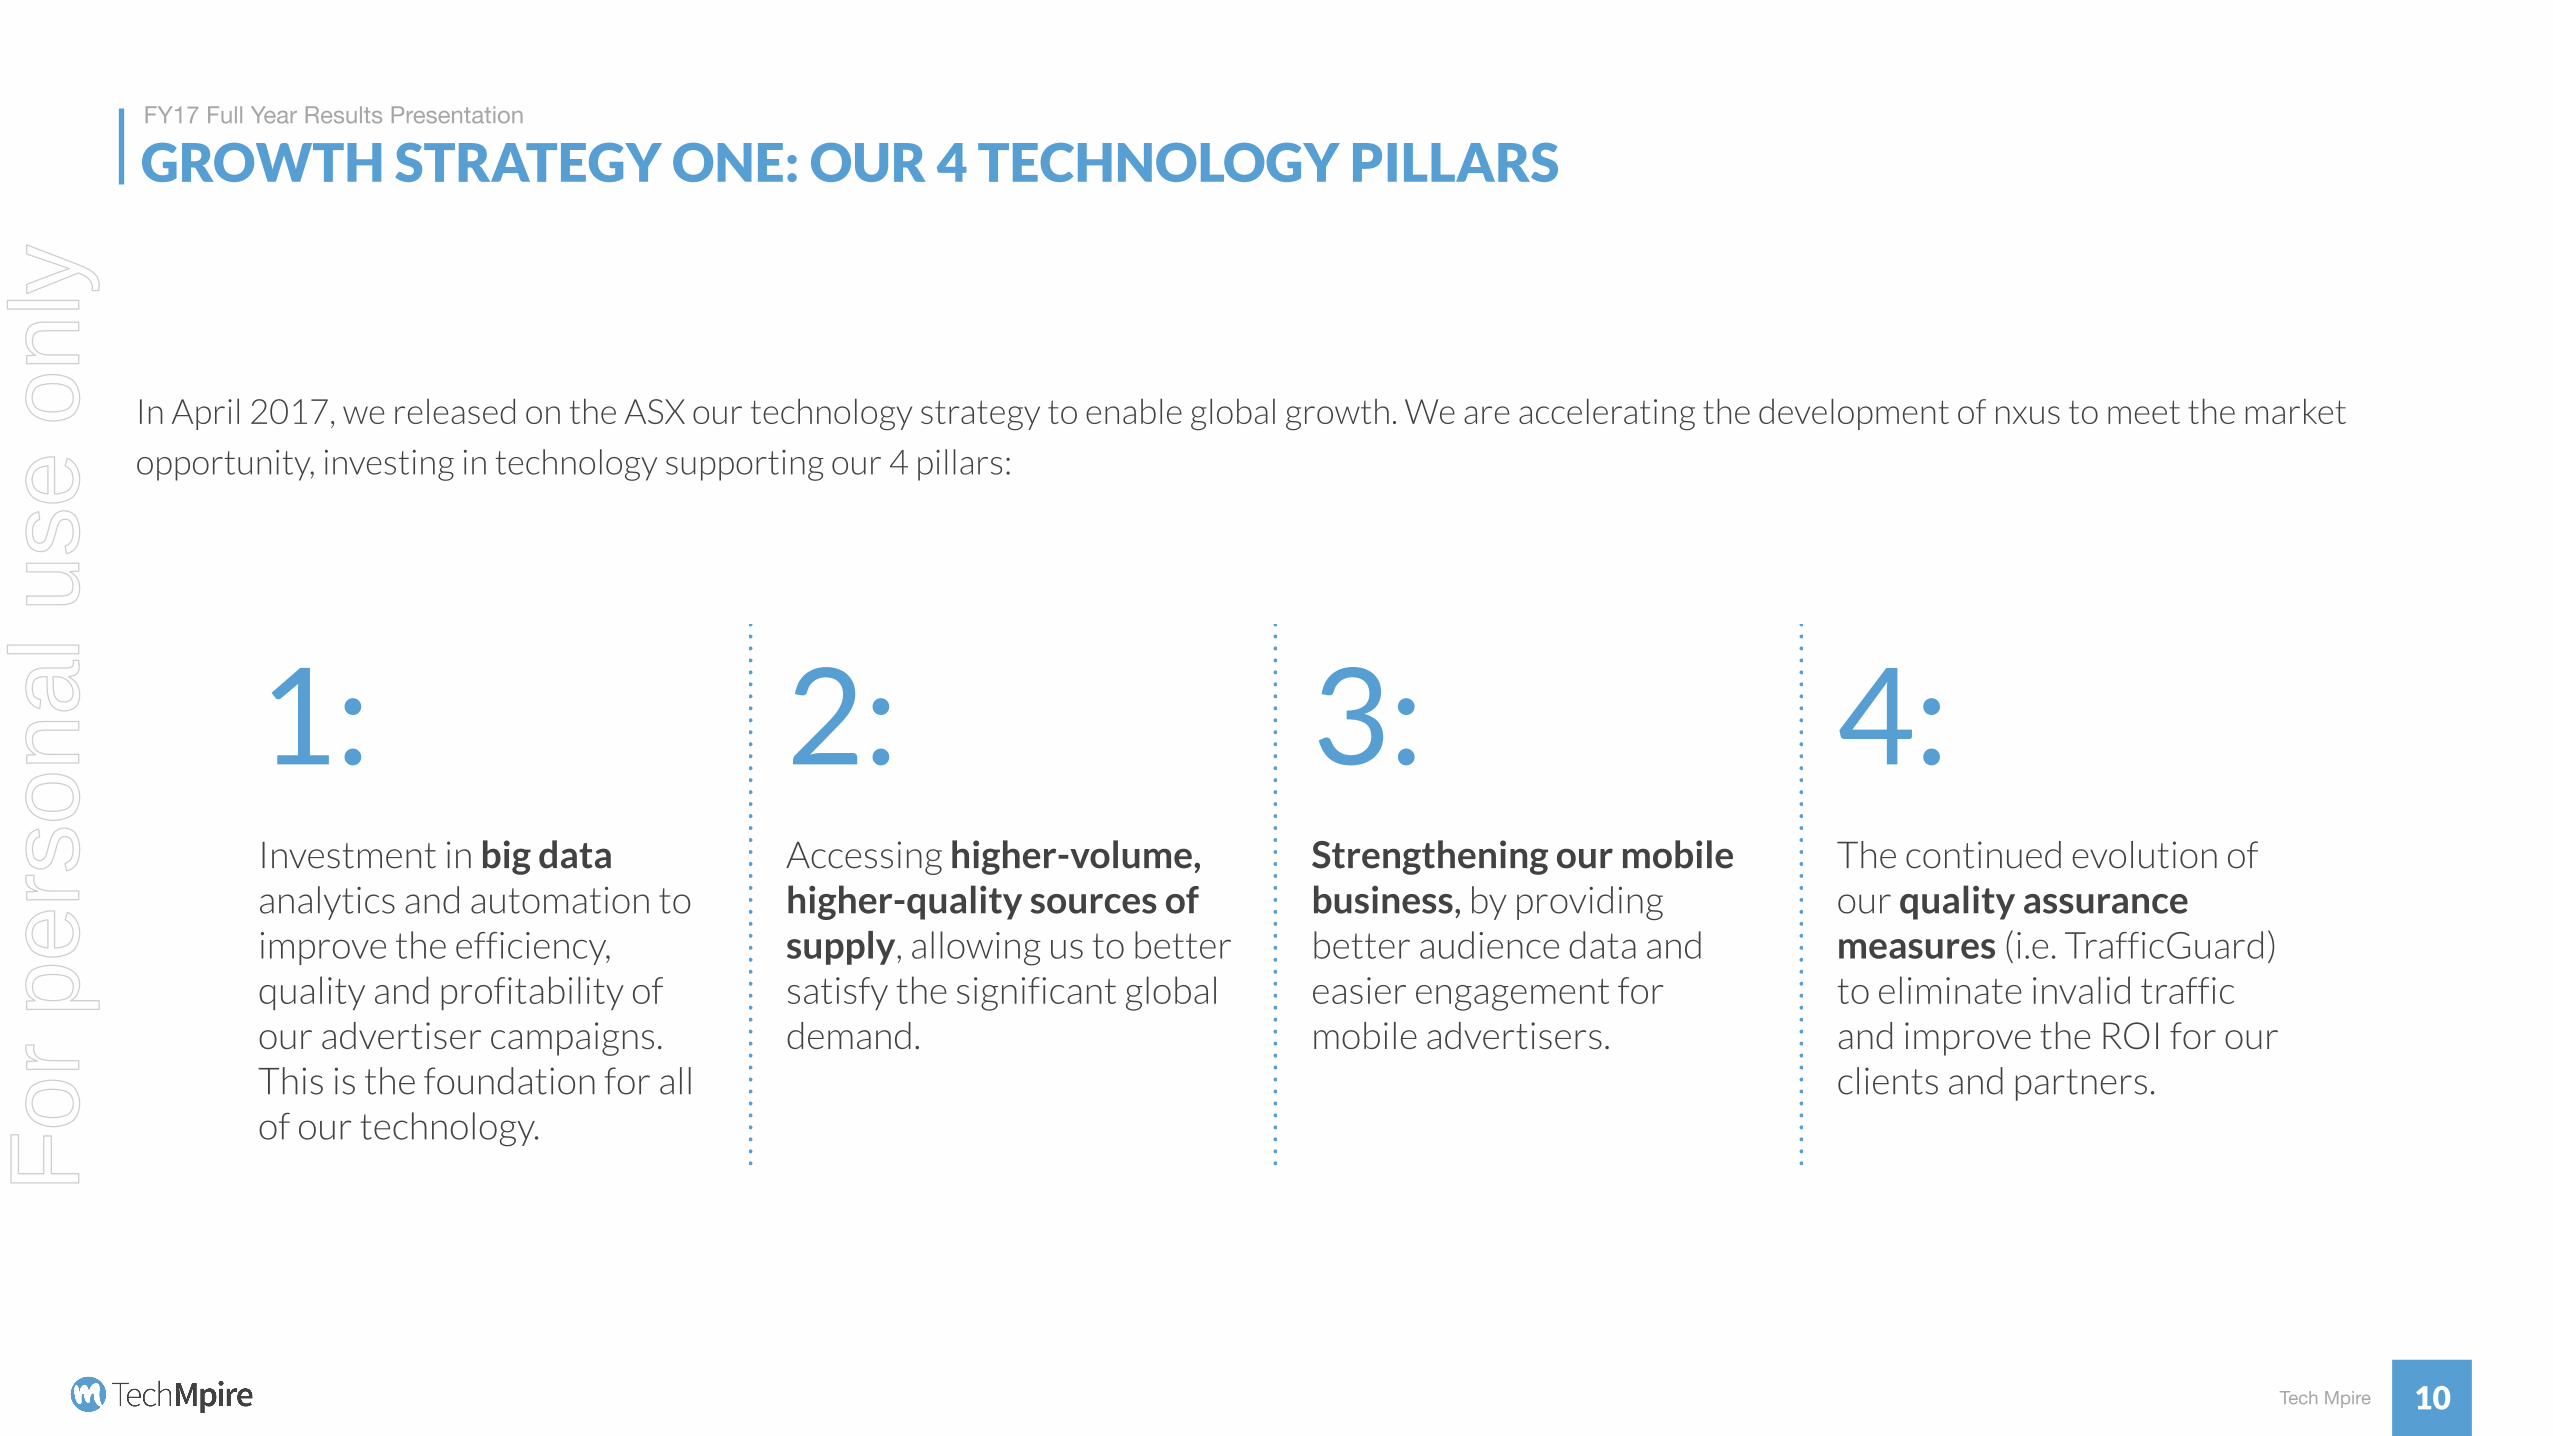
In April 2017, we released on the ASX our technology strategy to enable global growth. We are accelerating the development of nxus to meet the market
opportunity, investing in technology supporting our 4 pillars:
1: 2: 3: 4:Investment in big data analytics and automation to improve the efficiency, quality and profitability of our advertiser campaigns. This is the foundation for all of our technology.
Accessing higher-volume, higher-quality sources of supply, allowing us to better satisfy the significant global demand.
Strengthening our mobile business, by providing better audience data and easier engagement for mobile advertisers.
The continued evolution of our quality assurance measures (i.e. TrafficGuard) to eliminate invalid traffic and improve the ROI for our clients and partners.
For
per
sona
l use
onl
y
Tech Mpire
FY17 Full Year Results Presentation
GROWTH STRATEGY TWO: EXPANDING INTO ASIA PACIFIC
11
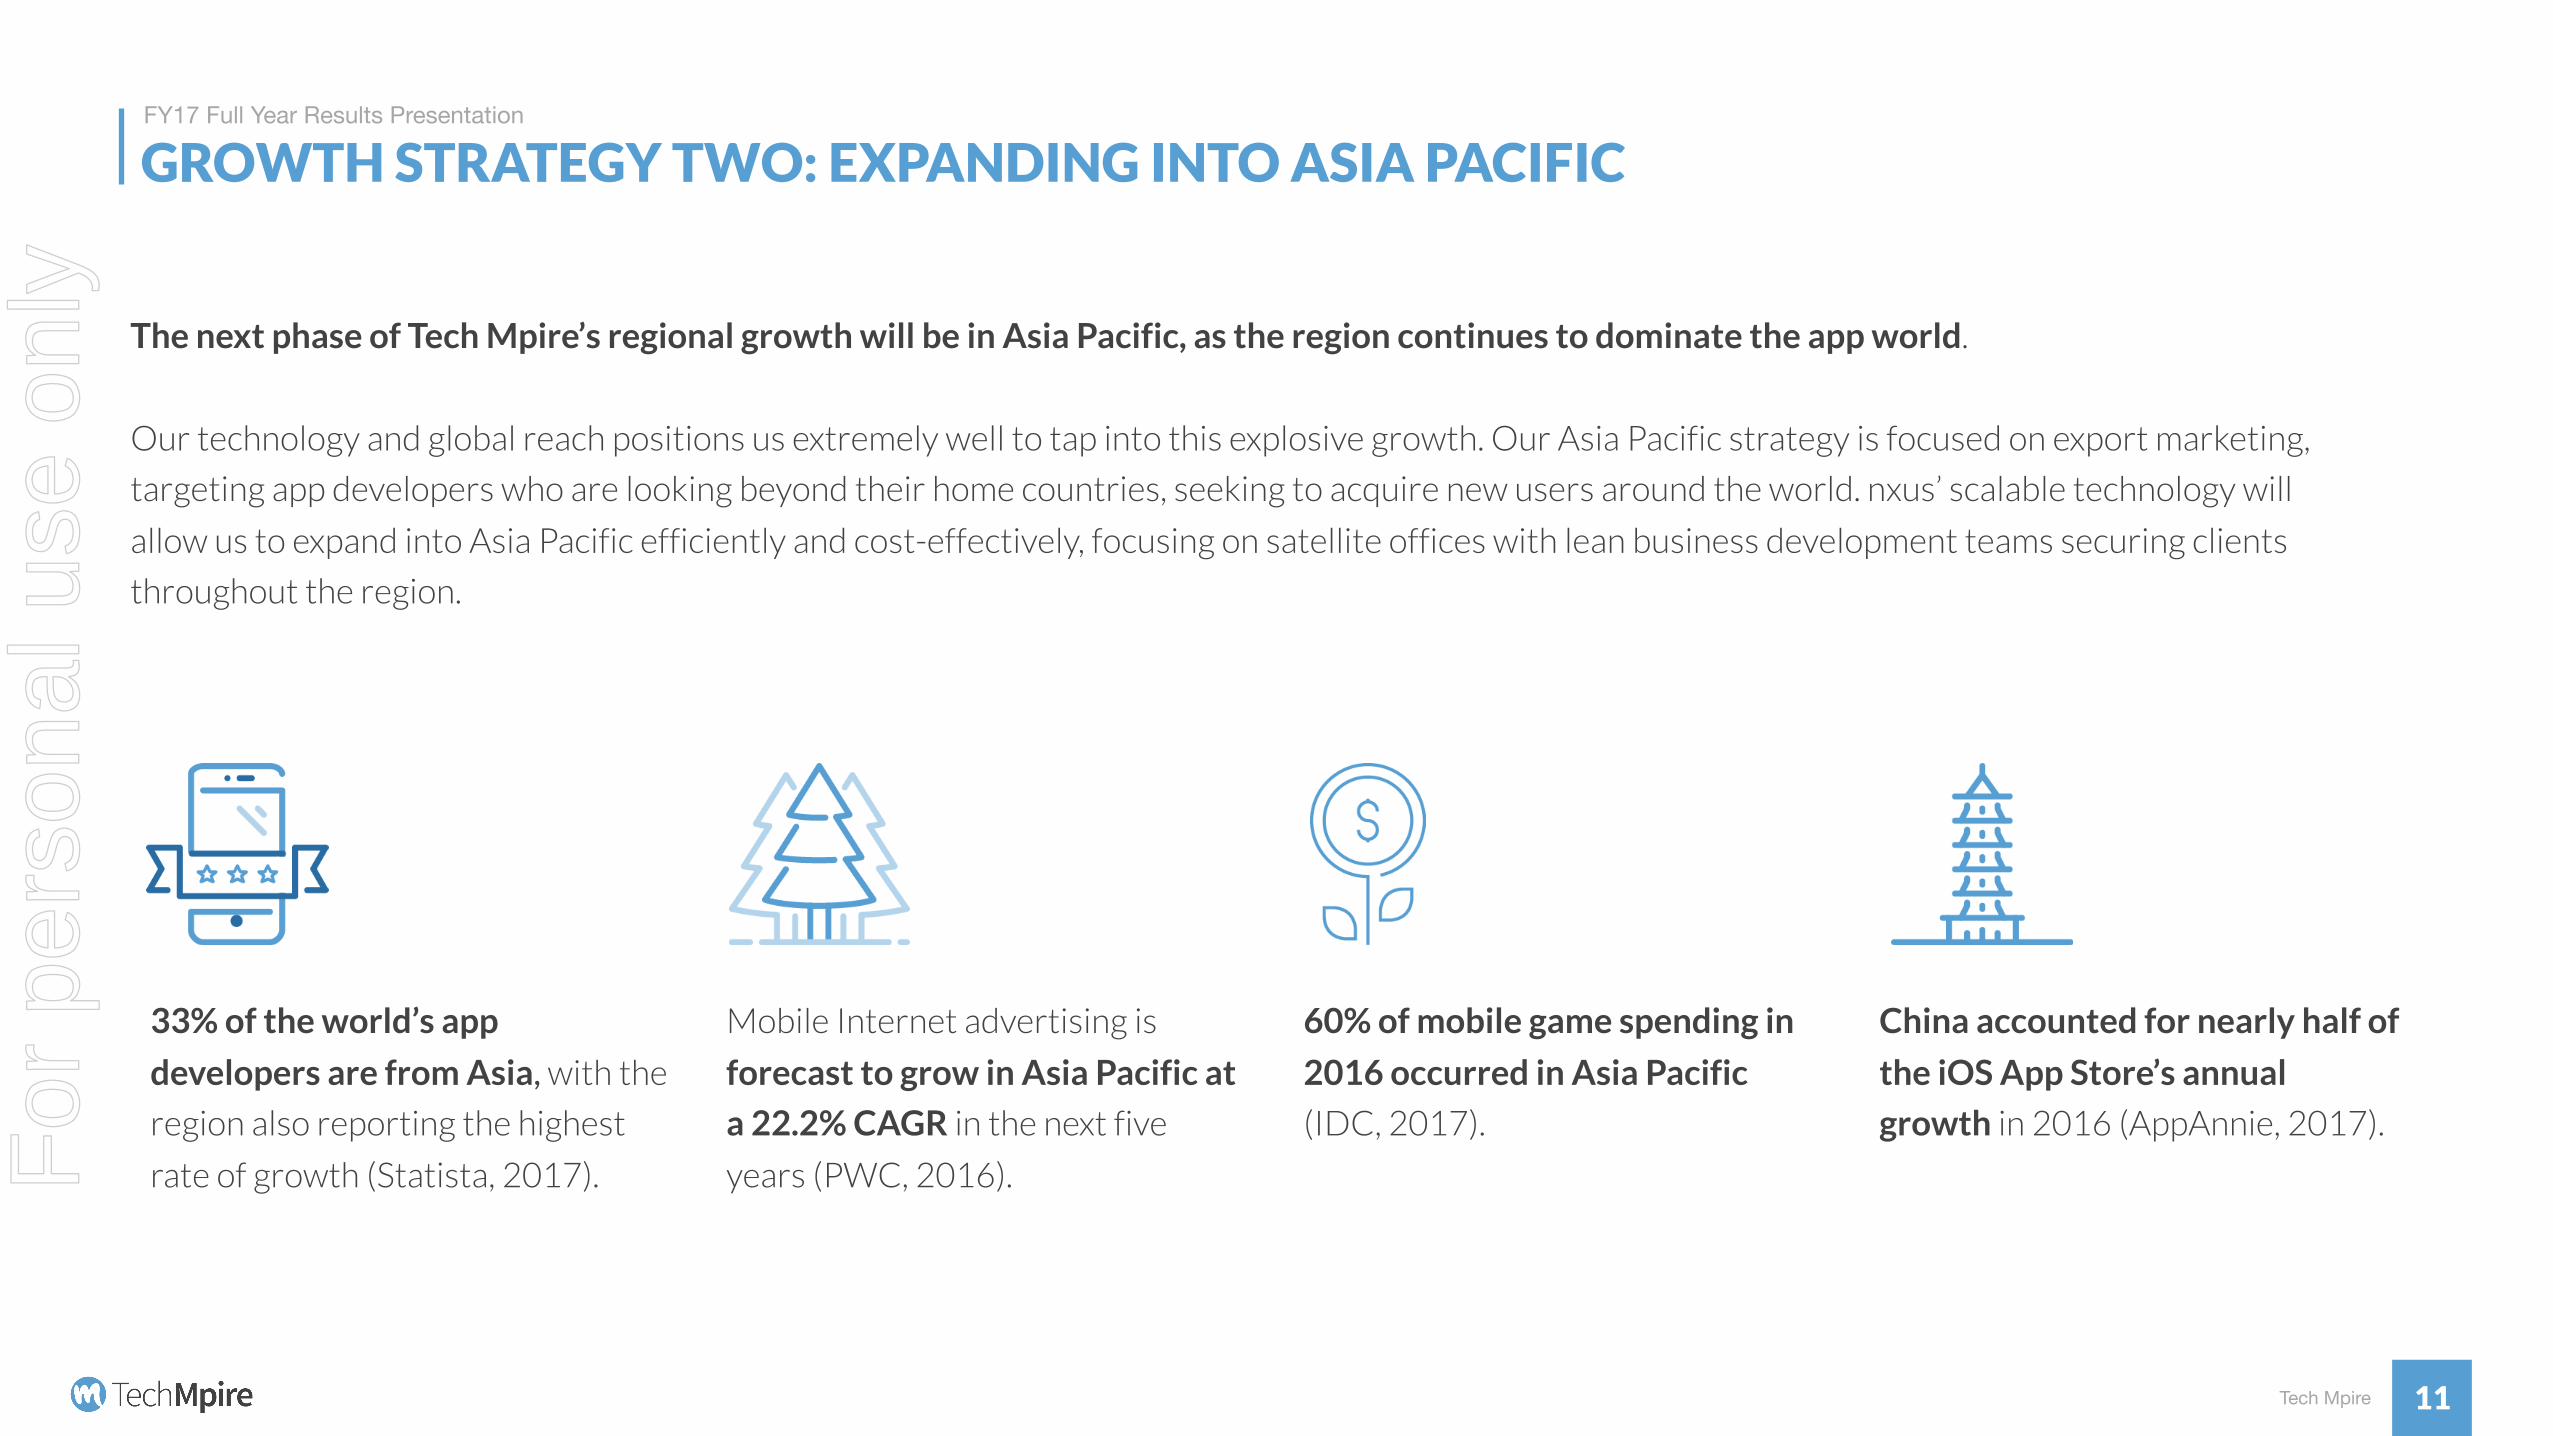
The next phase of Tech Mpire’s regional growth will be in Asia Pacific, as the region continues to dominate the app world.
Our technology and global reach positions us extremely well to tap into this explosive growth. Our Asia Pacific strategy is focused on export marketing,
targeting app developers who are looking beyond their home countries, seeking to acquire new users around the world. nxus’ scalable technology will
allow us to expand into Asia Pacific efficiently and cost-effectively, focusing on satellite offices with lean business development teams securing clients
throughout the region.
33% of the world’s app
developers are from Asia, with the
region also reporting the highest
rate of growth (Statista, 2017).
Mobile Internet advertising is
forecast to grow in Asia Pacific at
a 22.2% CAGR in the next five
years (PWC, 2016).
60% of mobile game spending in
2016 occurred in Asia Pacific
(IDC, 2017).
China accounted for nearly half of
the iOS App Store’s annual
growth in 2016 (AppAnnie, 2017).For
per
sona
l use
onl
y
Tech Mpire
FY17 Full Year Results Presentation
GROWTH STRATEGY THREE: TARGETING HIGHER-VALUE CLIENTS
12
With the developments to our supply sources, technology and management team, we are now in
a position to pursue more diversified client base of global brands.
Tech Mpire remains focused on high-tier brands and apps that are looking to grow their user bases on
a large scale. The companies we target are well funded, investing heavily and continuously seeking
global user acquisition for their apps.
Building a more diverse mix of clients is expected to result in:
• Broader market appeal for Tech Mpire across diverse app categories and traffic supply sources
• Greater revenue potential through a more strategic approach to business development and the
ability to extend our offering across verticals
• Reduced exposure to vertical-specific risk or seasonality
For
per
sona
l use
onl
y
Tech Mpire
FY17 Full Year Results Presentation
STRONG REVENUE GROWTH PREDICTED
13
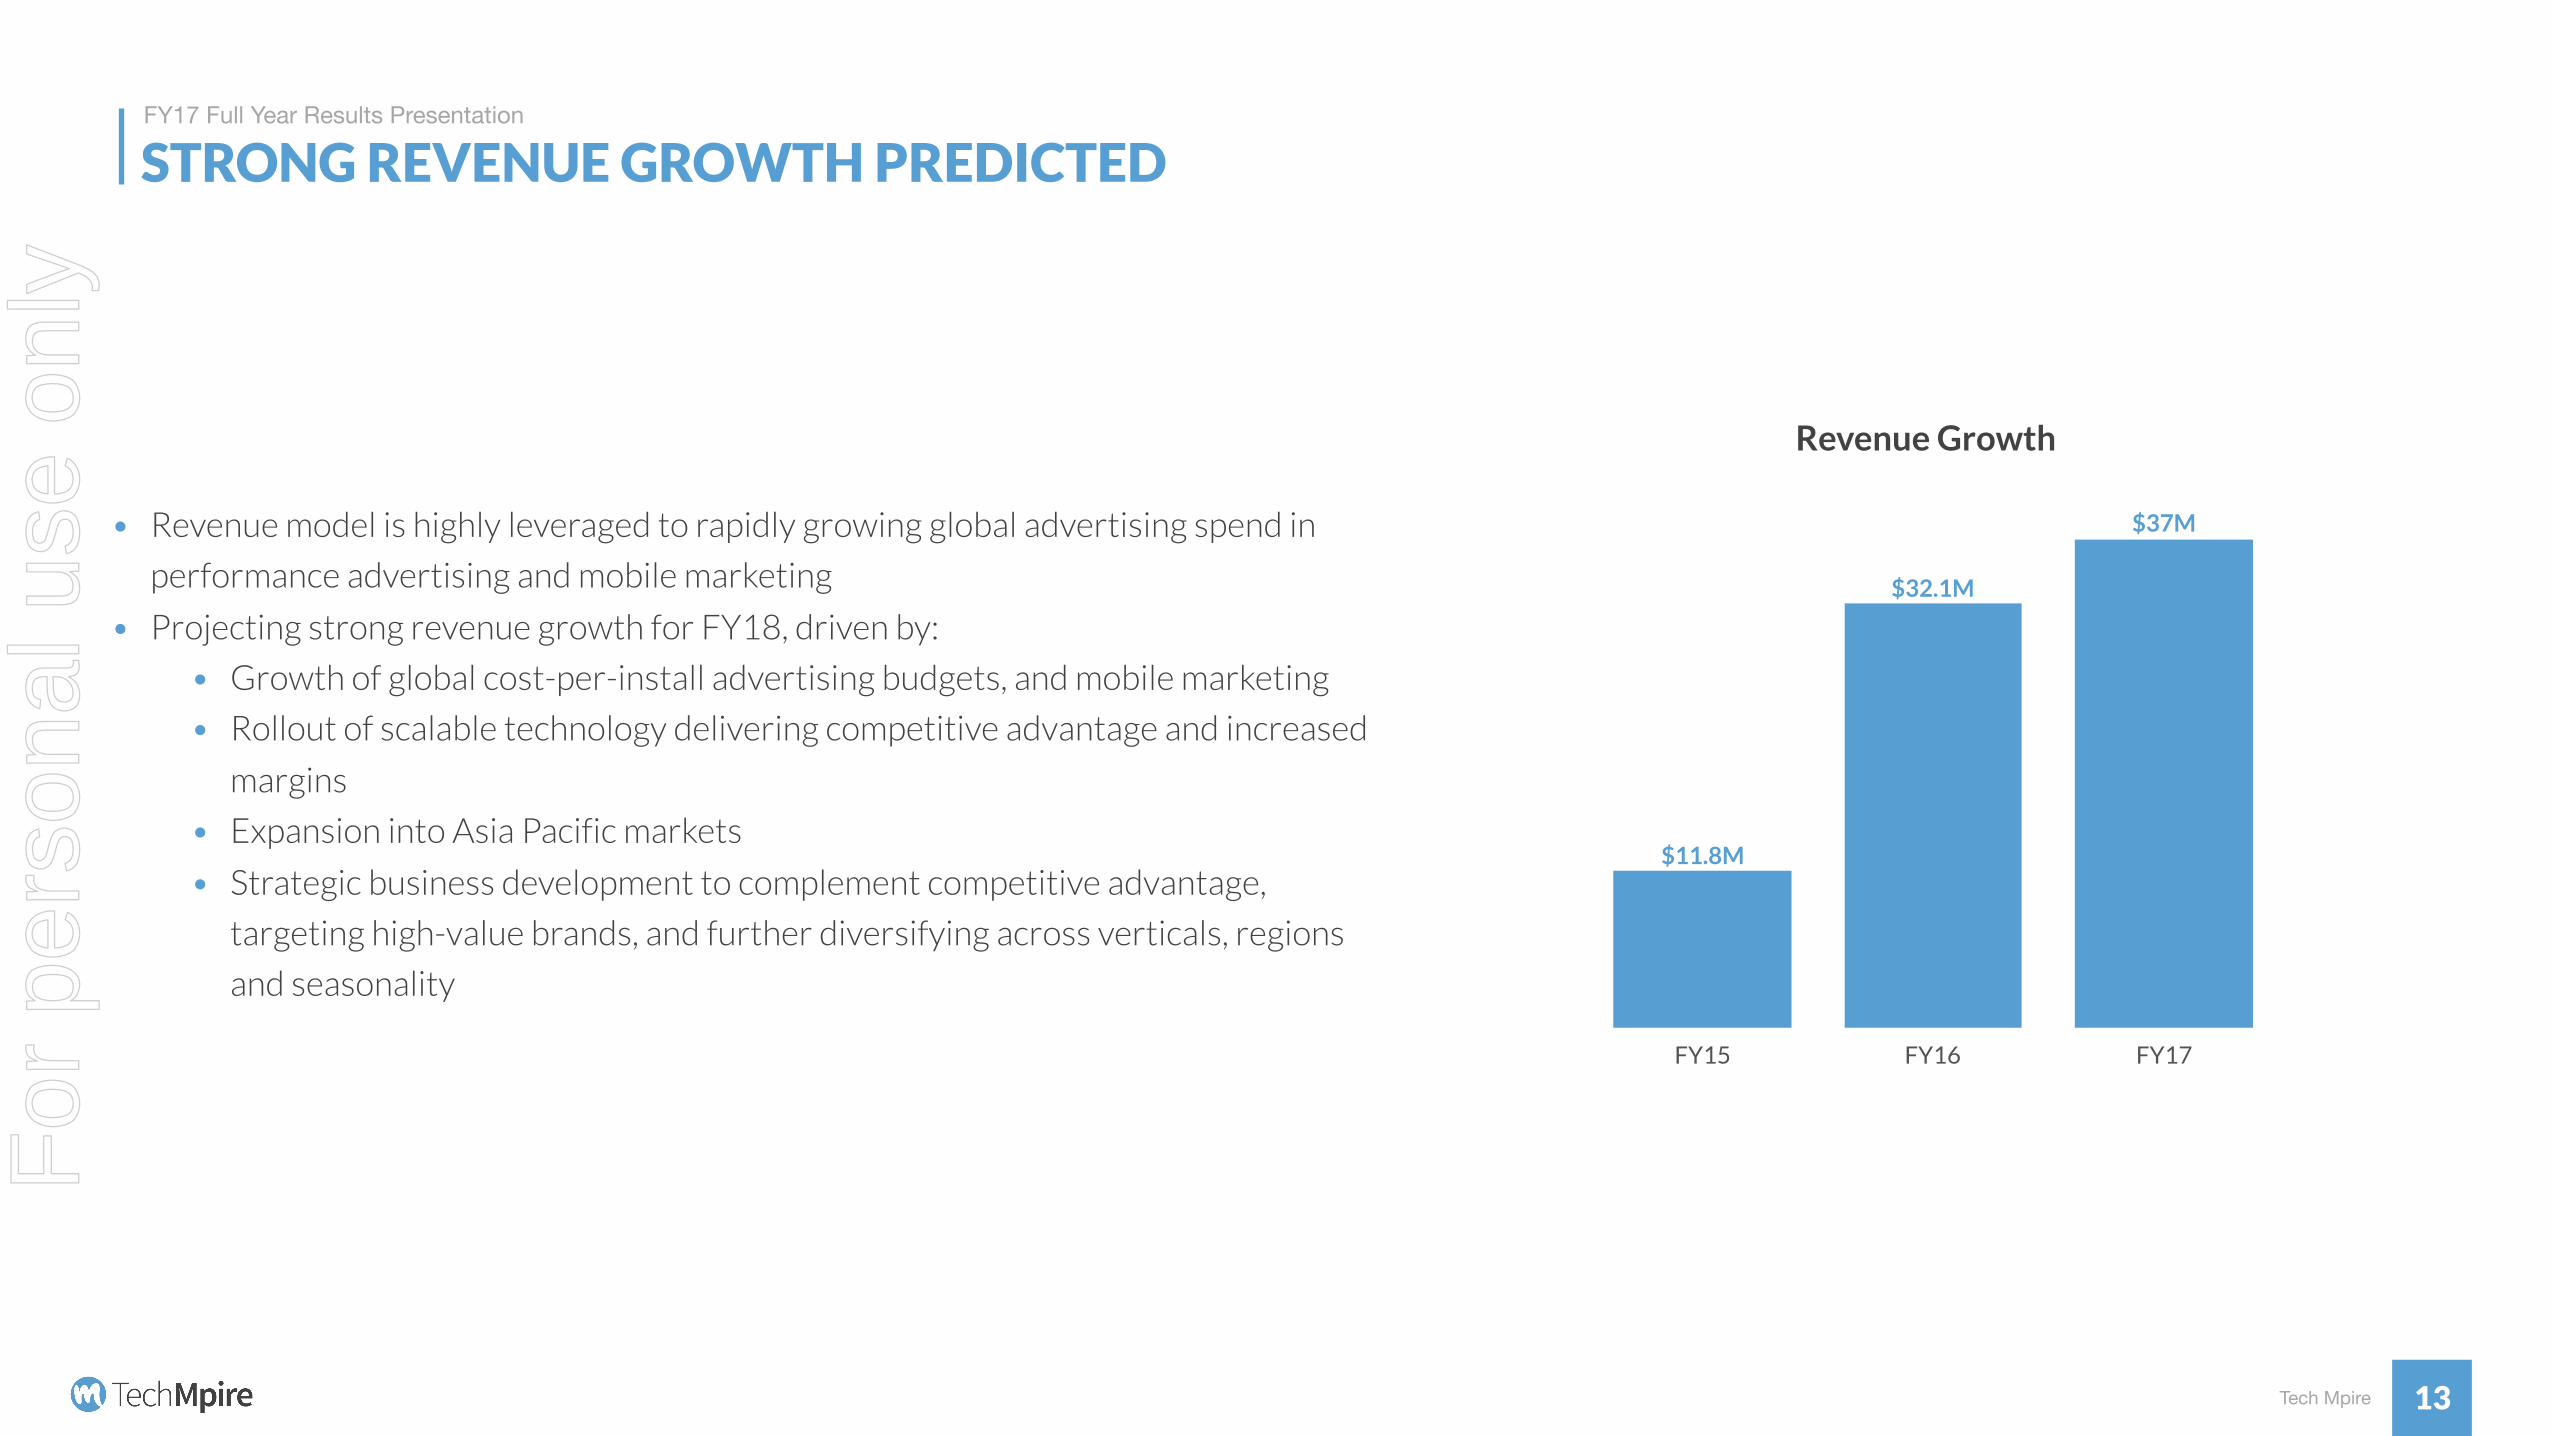
• Revenue model is highly leveraged to rapidly growing global advertising spend in
performance advertising and mobile marketing
• Projecting strong revenue growth for FY18, driven by:
• Growth of global cost-per-install advertising budgets, and mobile marketing
• Rollout of scalable technology delivering competitive advantage and increased
margins
• Expansion into Asia Pacific markets
• Strategic business development to complement competitive advantage,
targeting high-value brands, and further diversifying across verticals, regions
and seasonality
FY15 FY16 FY17
$37M
$32.1M
$11.8M
Revenue Growth
For
per
sona
l use
onl
y
Tech Mpire
FY17 Full Year Results Presentation
OUTLOOK FOR FY18
14
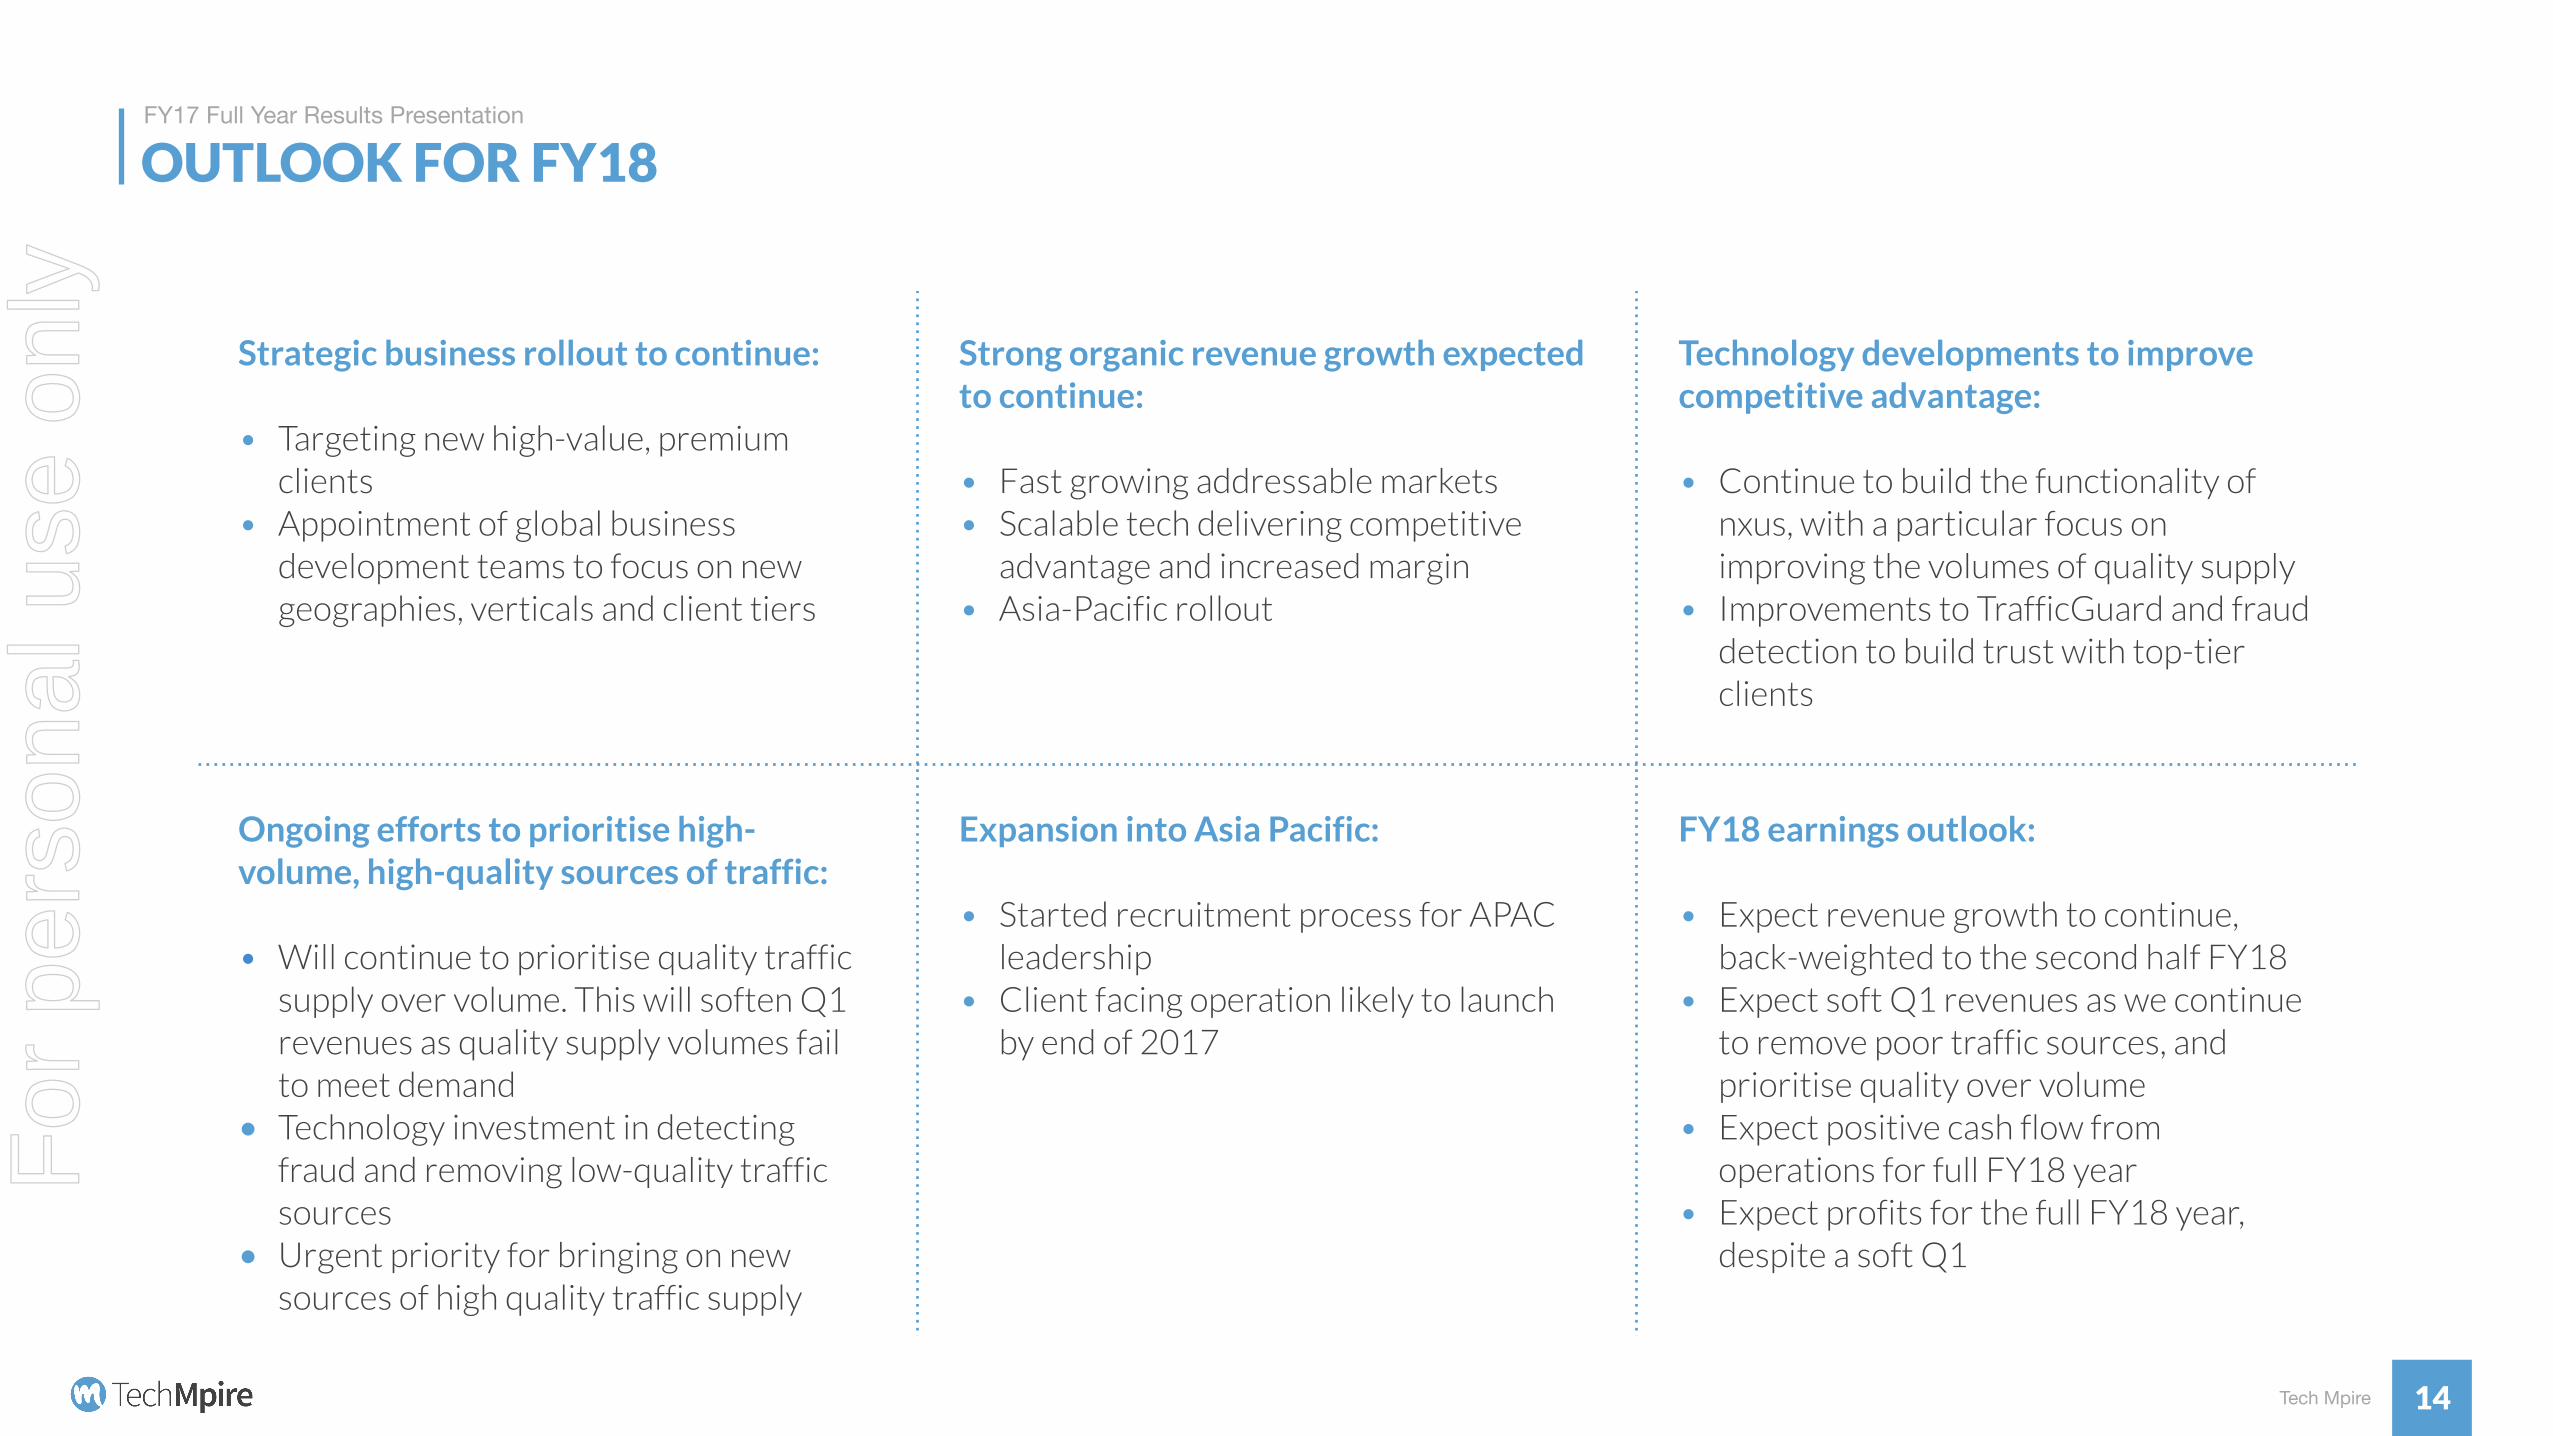
Strategic business rollout to continue:
• Targeting new high-value, premium clients
• Appointment of global business development teams to focus on new geographies, verticals and client tiers
Strong organic revenue growth expected to continue:
• Fast growing addressable markets • Scalable tech delivering competitive
advantage and increased margin • Asia-Pacific rollout
Technology developments to improve competitive advantage:
• Continue to build the functionality of nxus, with a particular focus on improving the volumes of quality supply
• Improvements to TrafficGuard and fraud detection to build trust with top-tier clients
Ongoing efforts to prioritise high-volume, high-quality sources of traffic:
• Will continue to prioritise quality traffic supply over volume. This will soften Q1 revenues as quality supply volumes fail to meet demand
• Technology investment in detecting fraud and removing low-quality traffic sources
• Urgent priority for bringing on new sources of high quality traffic supply
Expansion into Asia Pacific:
• Started recruitment process for APAC leadership
• Client facing operation likely to launch by end of 2017
FY18 earnings outlook:
• Expect revenue growth to continue, back-weighted to the second half FY18
• Expect soft Q1 revenues as we continue to remove poor traffic sources, and prioritise quality over volume
• Expect positive cash flow from operations for full FY18 year
• Expect profits for the full FY18 year, despite a soft Q1
For
per
sona
l use
onl
y
Confidential - Tech Mpire
APPENDICES
15
For
per
sona
l use
onl
y
Tech Mpire
FY17 Full Year Results Presentation
PROFIT & LOSS
16
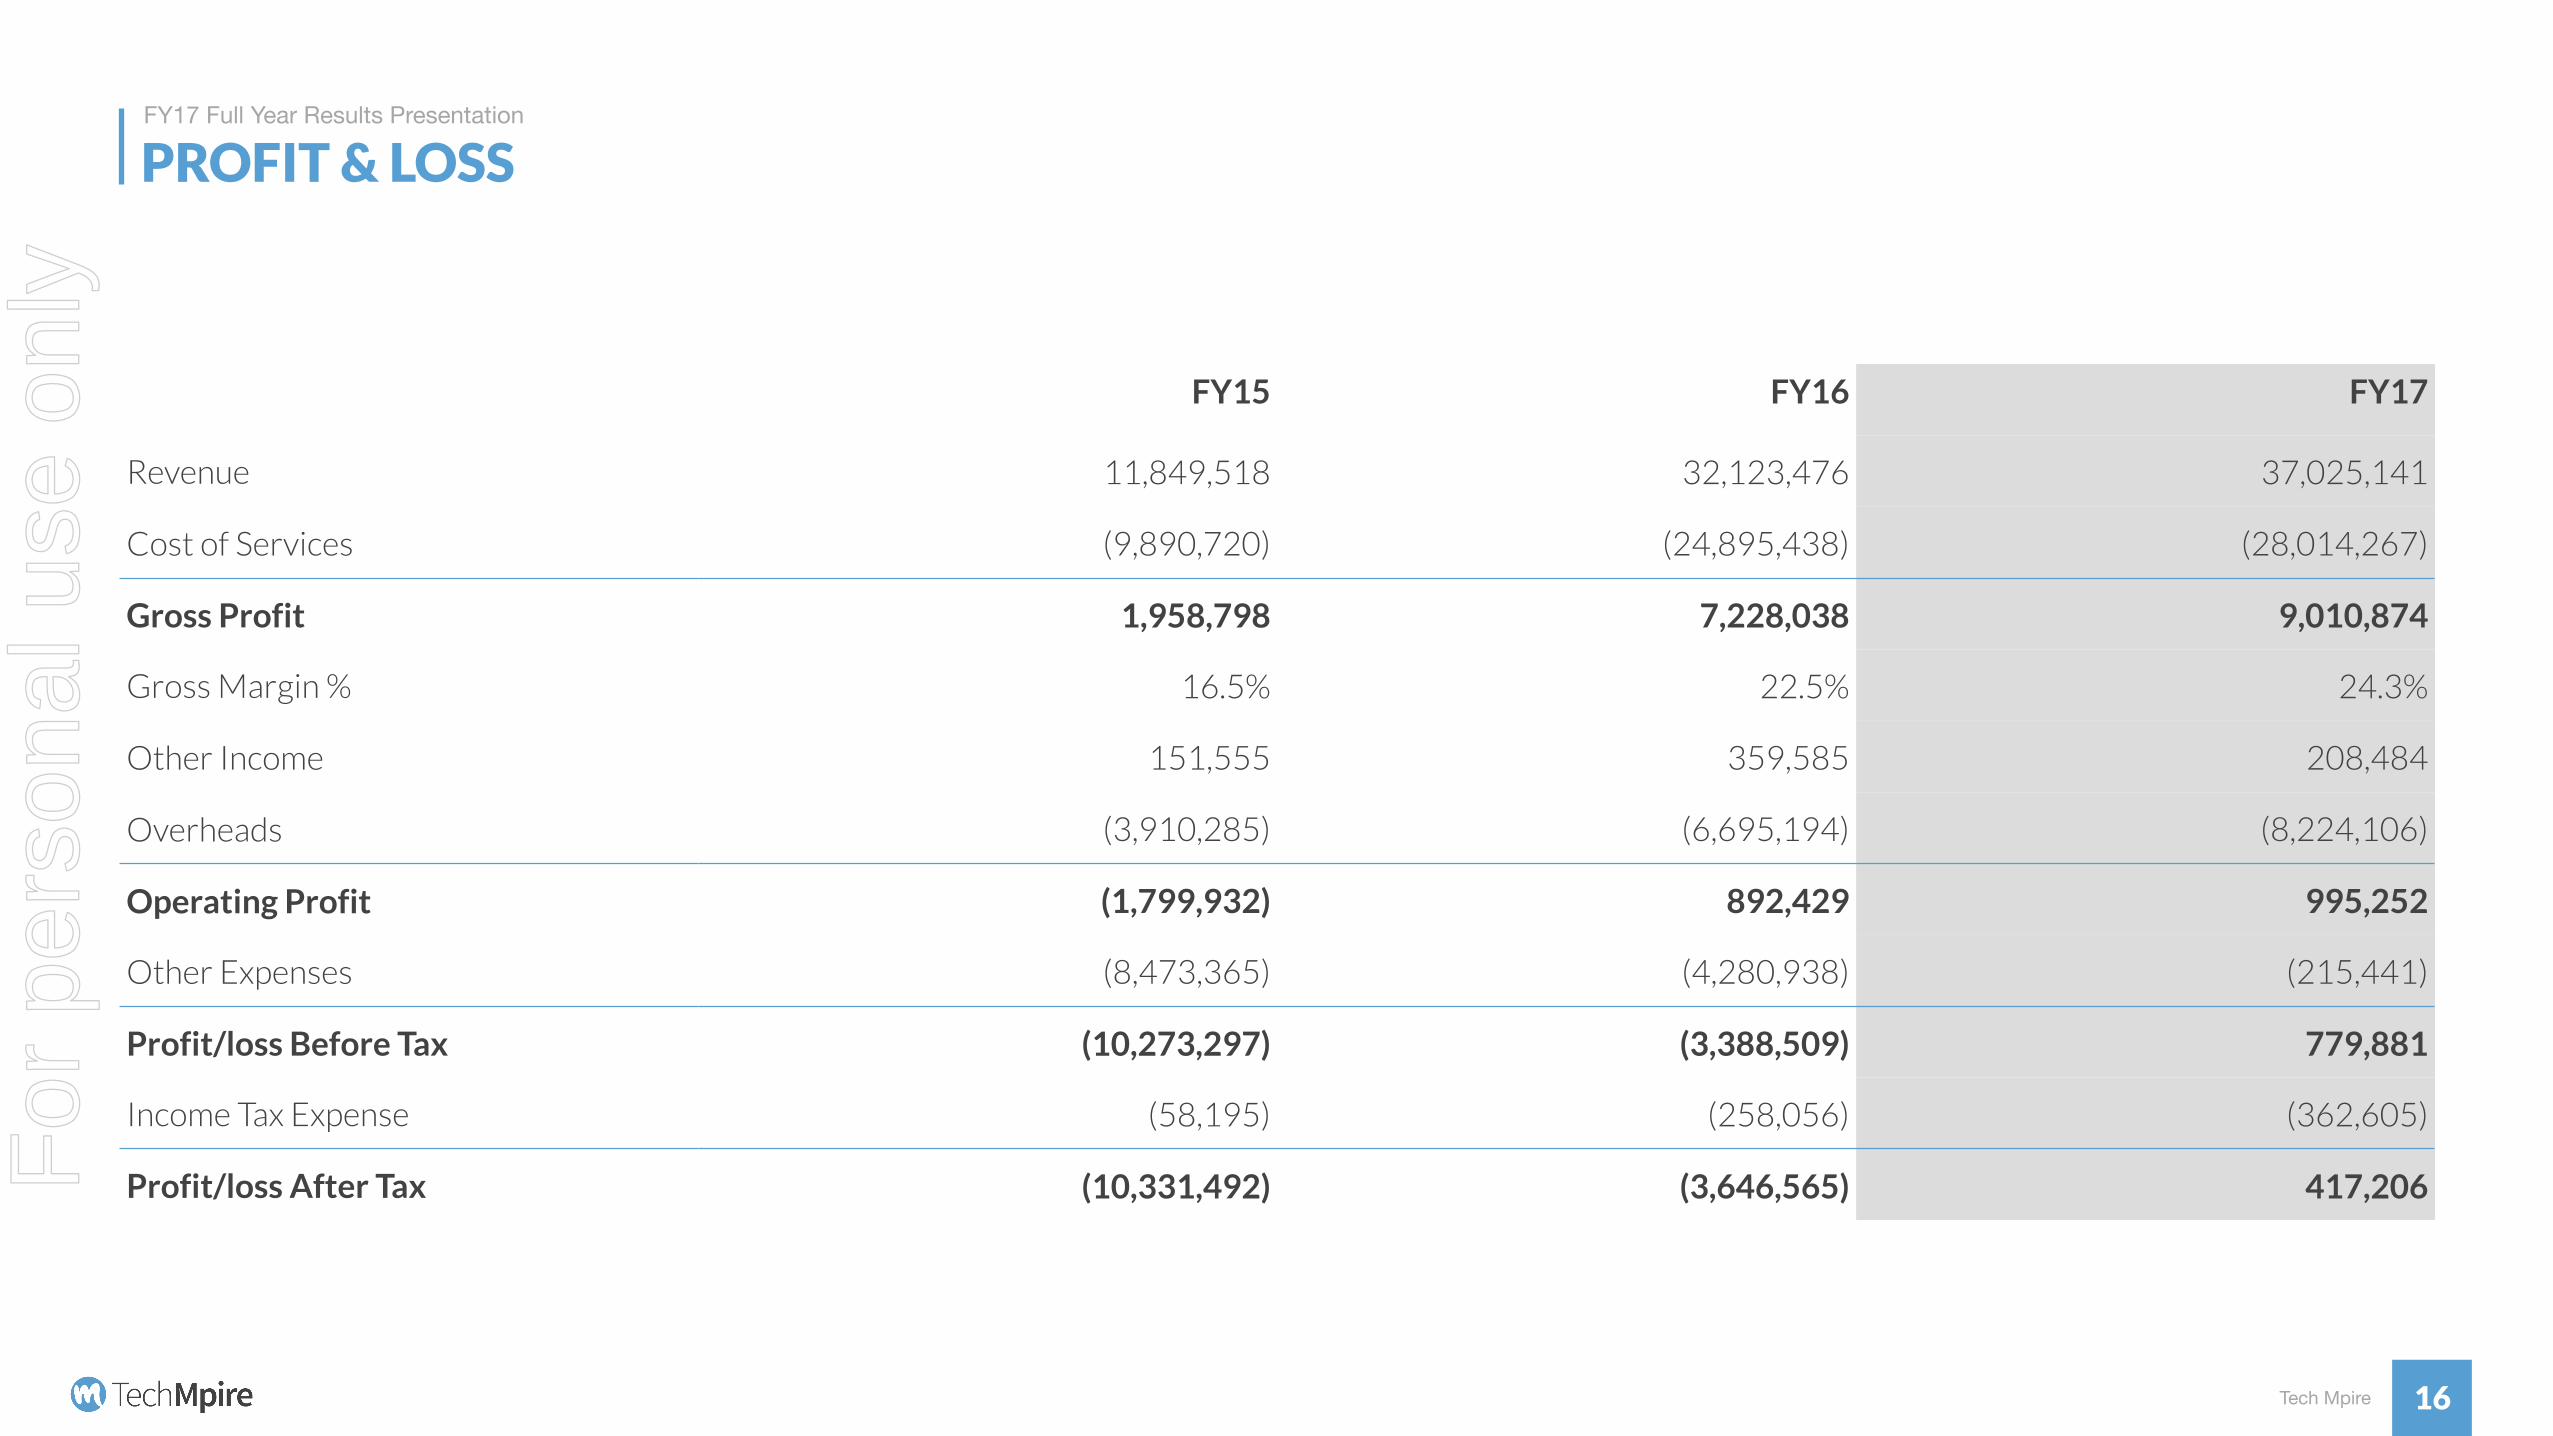
FY15 FY16 FY17
Revenue 11,849,518 32,123,476 37,025,141
Cost of Services (9,890,720) (24,895,438) (28,014,267)
Gross Profit 1,958,798 7,228,038 9,010,874
Gross Margin % 16.5% 22.5% 24.3%
Other Income 151,555 359,585 208,484
Overheads (3,910,285) (6,695,194) (8,224,106)
Operating Profit (1,799,932) 892,429 995,252
Other Expenses (8,473,365) (4,280,938) (215,441)
Profit/loss Before Tax (10,273,297) (3,388,509) 779,881
Income Tax Expense (58,195) (258,056) (362,605)
Profit/loss After Tax (10,331,492) (3,646,565) 417,206For
per
sona
l use
onl
y
Tech Mpire
FY17 Full Year Results Presentation
CASH FLOW
17
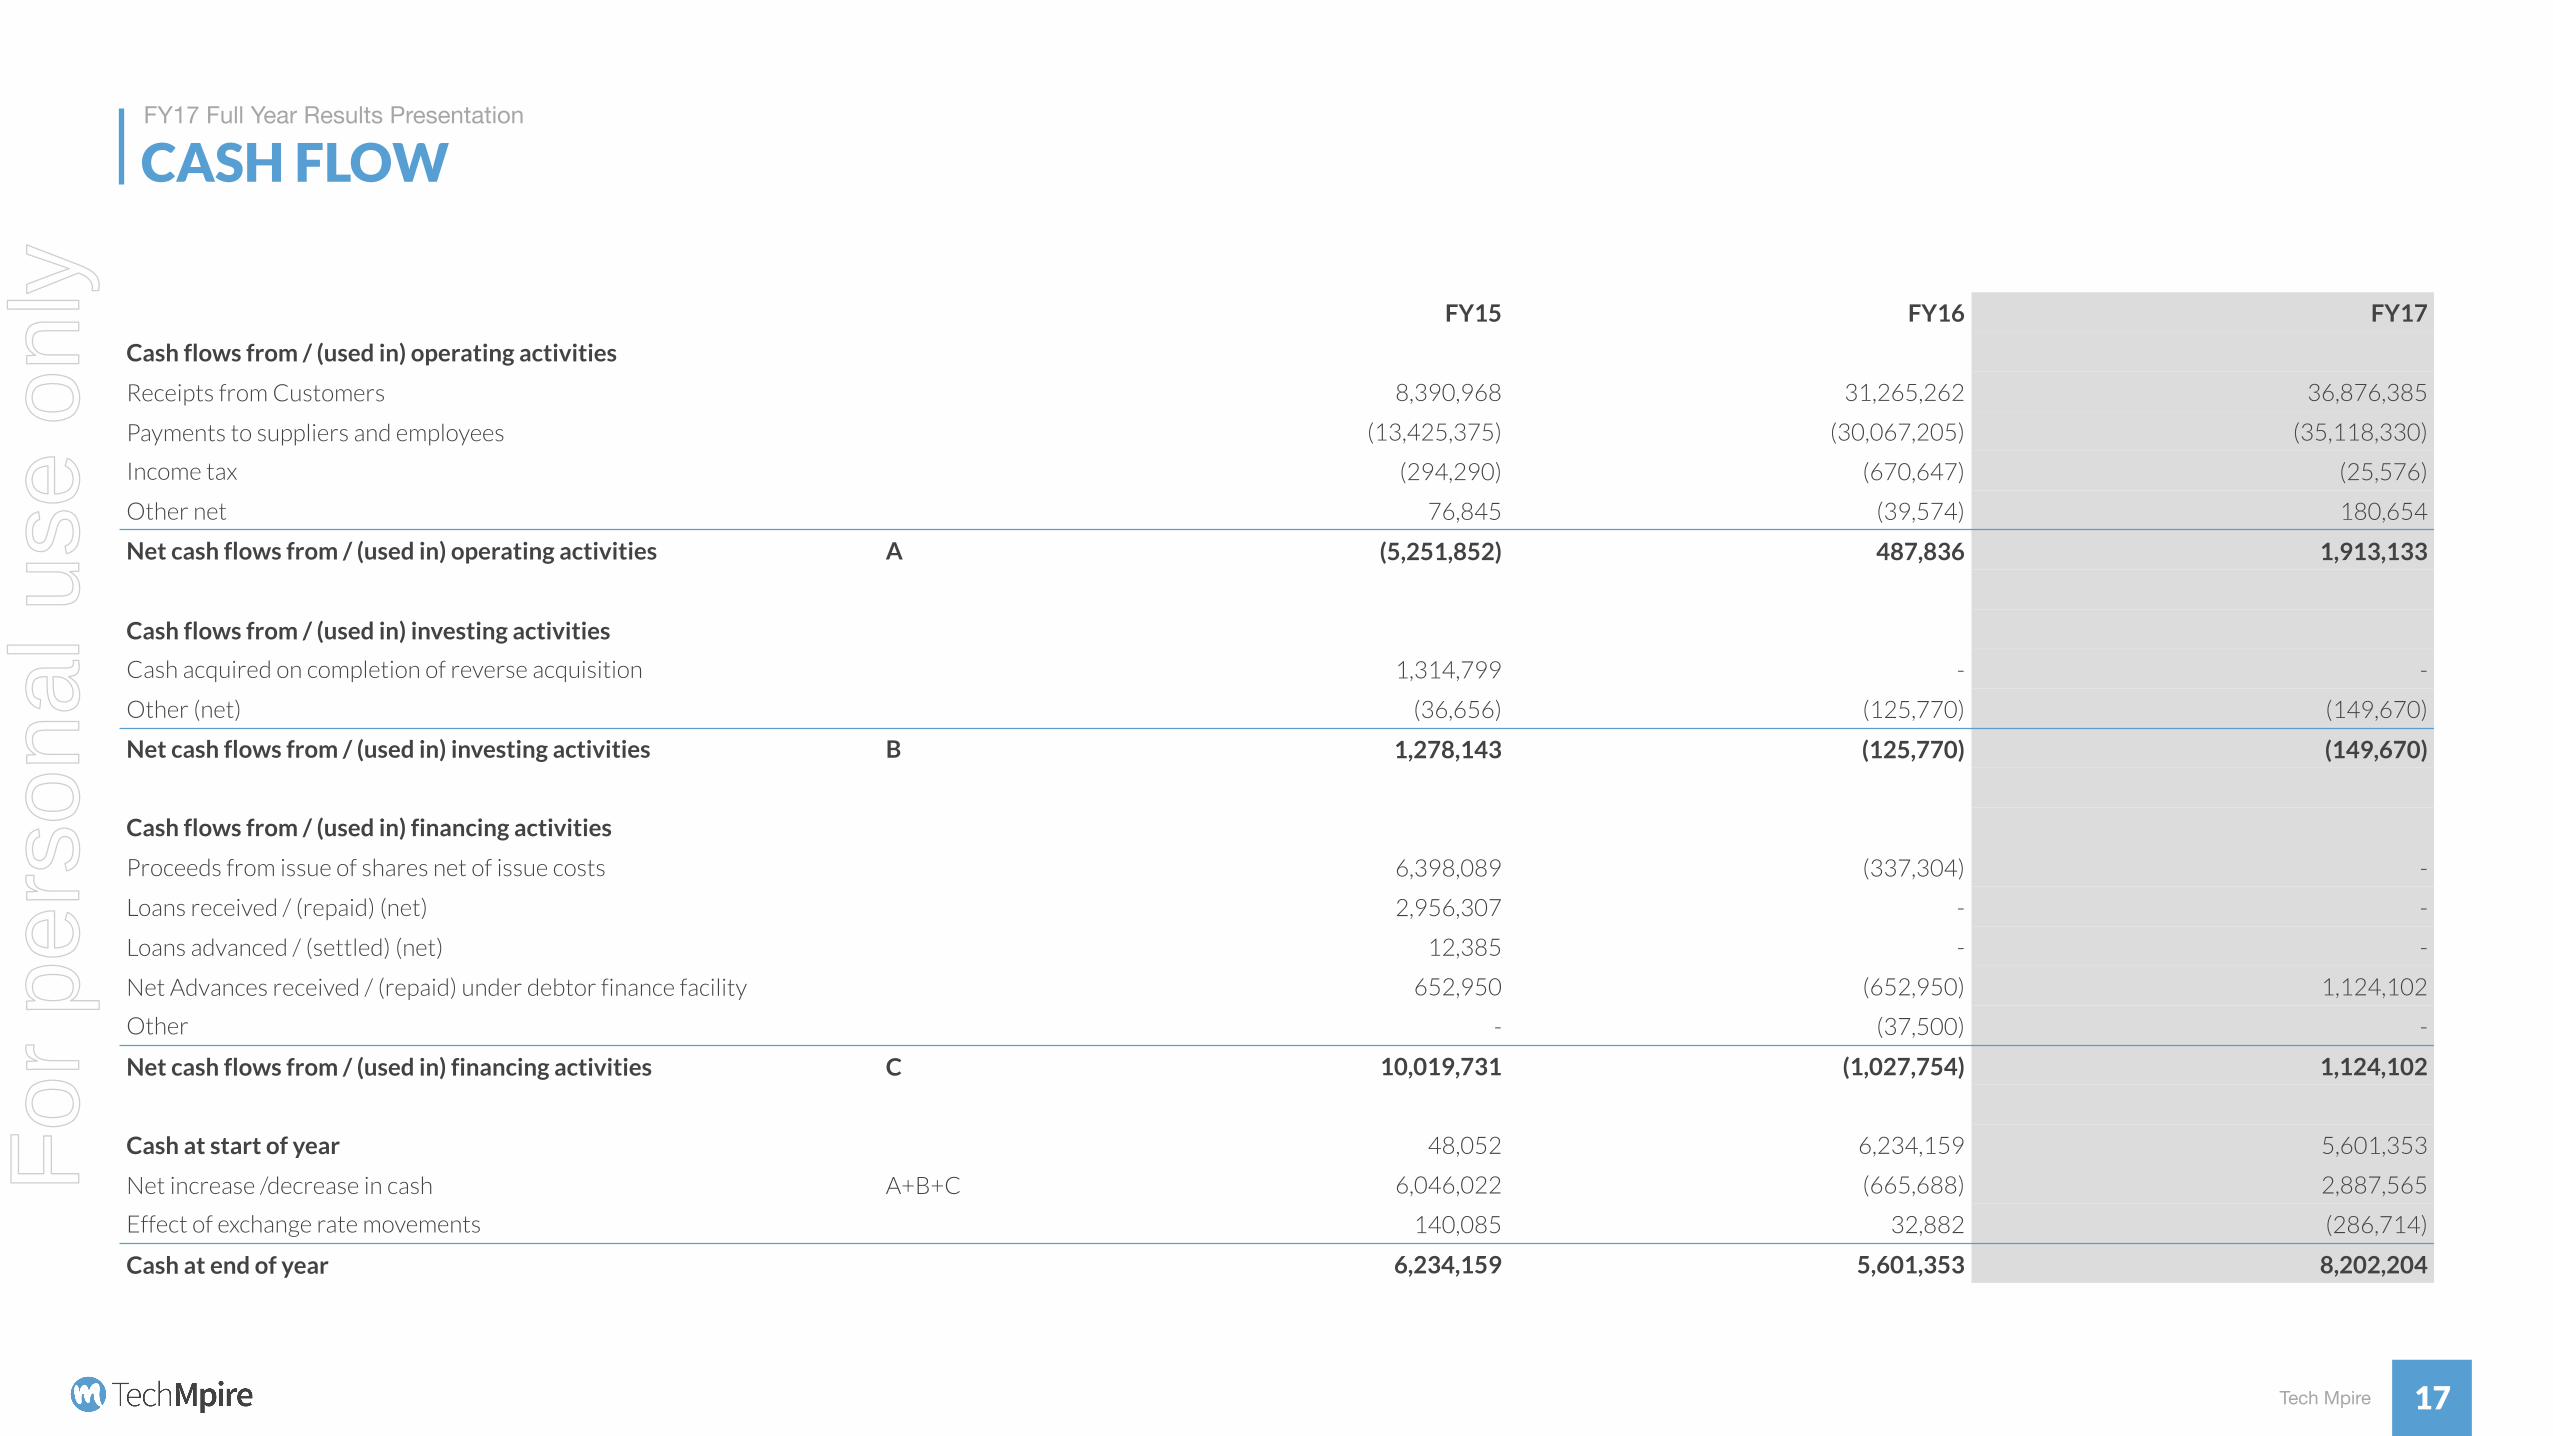
FY15 FY16 FY17
Cash flows from / (used in) operating activities
Receipts from Customers 8,390,968 31,265,262 36,876,385
Payments to suppliers and employees (13,425,375) (30,067,205) (35,118,330)
Income tax (294,290) (670,647) (25,576)
Other net 76,845 (39,574) 180,654
Net cash flows from / (used in) operating activities A (5,251,852) 487,836 1,913,133
Cash flows from / (used in) investing activities
Cash acquired on completion of reverse acquisition 1,314,799 - -
Other (net) (36,656) (125,770) (149,670)
Net cash flows from / (used in) investing activities B 1,278,143 (125,770) (149,670)
Cash flows from / (used in) financing activities
Proceeds from issue of shares net of issue costs 6,398,089 (337,304) -
Loans received / (repaid) (net) 2,956,307 - -
Loans advanced / (settled) (net) 12,385 - -
Net Advances received / (repaid) under debtor finance facility 652,950 (652,950) 1,124,102
Other - (37,500) -
Net cash flows from / (used in) financing activities C 10,019,731 (1,027,754) 1,124,102
Cash at start of year 48,052 6,234,159 5,601,353
Net increase /decrease in cash A+B+C 6,046,022 (665,688) 2,887,565
Effect of exchange rate movements 140,085 32,882 (286,714)
Cash at end of year 6,234,159 5,601,353 8,202,204
For
per
sona
l use
onl
y
Tech Mpire
FY17 Full Year Results Presentation
BALANCE SHEET
18
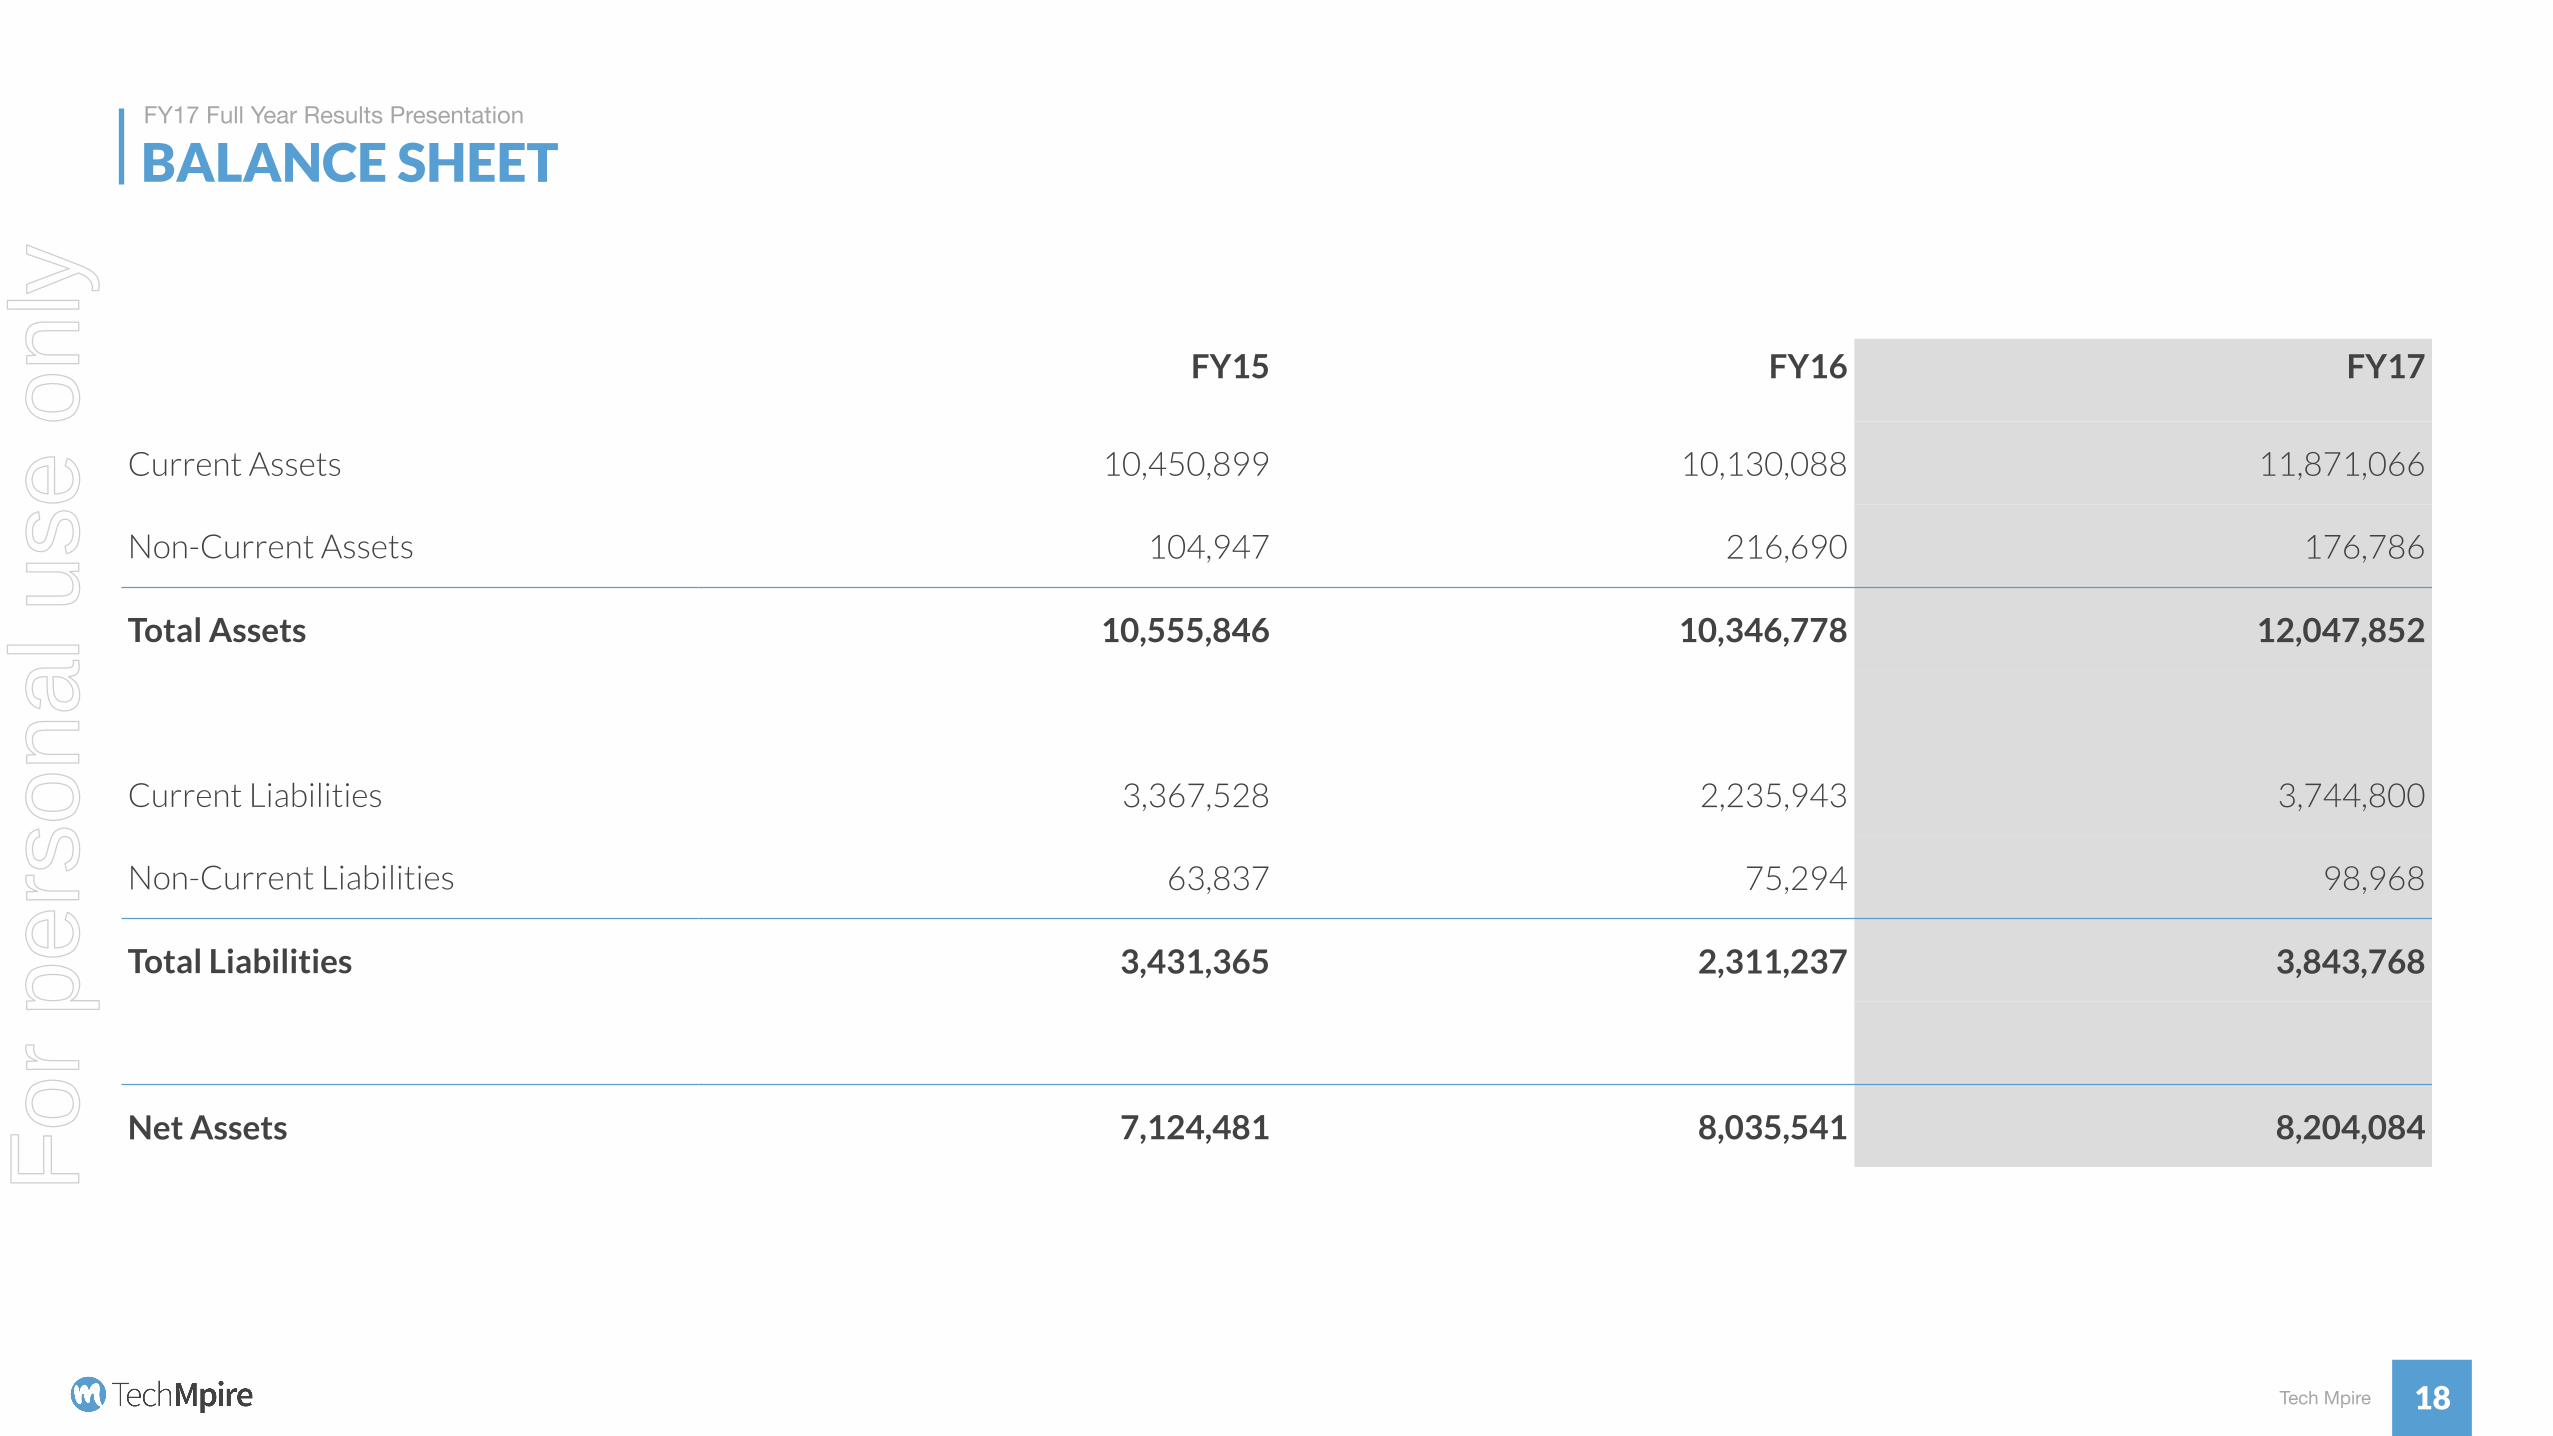
FY15 FY16 FY17
Current Assets 10,450,899 10,130,088 11,871,066
Non-Current Assets 104,947 216,690 176,786
Total Assets 10,555,846 10,346,778 12,047,852
Current Liabilities 3,367,528 2,235,943 3,744,800
Non-Current Liabilities 63,837 75,294 98,968
Total Liabilities 3,431,365 2,311,237 3,843,768
Net Assets 7,124,481 8,035,541 8,204,084For
per
sona
l use
onl
y
Tech Mpire
FY17 Full Year Results Presentation
DISCLAIMER
19
This presentation contains summary information about Tech Mpire Limited (Tech Mpire) and is current as at 6 September 2017. The information in this presentation is of general background and does not purport to be complete.
This presentation is not investment or financial product advice (nor tax, accounting or legal advice) and is not intended to be used for the basis of making an investment decision. Investors should obtain their own advice before making any investment decision.
This document has been prepared based on information available at the time of preparation. No representation or warranty, express or implied, is made as to the fairness, accuracy or completeness of the information, opinions and conclusions contained in this presentation.
Some of the statements appearing in this presentation are in the nature of forward looking statements. You should be aware that such statements are only predictions based on assumptions, and are subject to inherent risks and uncertainties. Those risks and uncertainties include factors and risks specific to the industry in which Tech Mpire operates as well as general economic conditions, prevailing exchange rates and interest rates and conditions in the financial markets.
Actual events or results may differ materially from the events or results expressed or implied in any forward looking statement. Neither Tech Mpire, or their officers or any person involved in the preparation of this presentation makes any representation or warranty (express or implied) as to the accuracy or likelihood of fulfilment of any forward looking statement, or any events or results expressed or implied in any forward looking statement, except to the extent required by law. You are cautioned not to place undue reliance on any forward looking statement. The forward looking statements in this presentation reflect Tech Mpire’s views as at the date of this presentation.
To the maximum extent permitted by law, Tech Mpire and its related bodies corporate (as that term is defined in the Corporations Act) and the officers, directors, employees, advisers and agents of those entities do not accept any responsibility or liability including, without limitation, any liability arising from fault or negligence on the part of any person, for any loss arising from the use of the presentation or its contents or otherwise arising in connection with it.
For
per
sona
l use
onl
y