For personal use only - · PDF fileA shovel ready project ... May 2015 For personal use only...
34
Investor Update Exceptionally high purity natural flake graphite ANNUAL GENERAL MEETING, 21 October 2016 For personal use only
Transcript of For personal use only - · PDF fileA shovel ready project ... May 2015 For personal use only...

Investor Update Exceptionally high purity natural flake graphite
ANNUAL GENERAL MEETING, 21 October 2016For
per
sona
l use
onl
y

Important Notices
The summary information contained herein has been provided by Magnis Resources (“Magnis Resources” or the “Company”). No representation,expressed or implied, or warranty as to the accuracy or completeness of the information contained herein is made by any party and nothing containedherein shall be relied upon as a promise or representation as to the future. In all cases, recipients should conduct their own investigation and analysisof Magnis Resources.
The information is neither an offer to sell nor a solicitation of an offer to buy any securities. The contents of this presentation are confidential andmust not be copied, published, reproduced, distributed in whole or in part to others at any time by recipients. This presentation is being provided torecipients on the basis that they keep confidential any information contained herein or otherwise made available, whether oral or in writing, inconnection with the Company.
All statements in this presentation, other than statements of historical facts, which address future production, reserve or resource potential,exploration drilling, exploitation activities and events or developments that the Company expects to occur, are forward looking statements. Althoughthe Company believes the expectations expressed in such statements are based on reasonable assumptions, such statements are not guarantees offuture performance and actual results or developments may differ materially from those in forward-looking statements.
Forward-looking statements involve and are subject to known and unknown risks, uncertainties and other factors which may cause the actual results,performance or achievements of the Company and/or its subsidiaries to be materially different from any future results, performance or achievementsexpressed or implied by the forward-looking information. Such factors include, among others, general business, economic, competitive, political andsocial uncertainties; the actual results of current exploration activities and feasibility studies; assumptions in economic valuations which prove to beinaccurate; possible variations of ore grade recovery or rates; climatic conditions; political instability; insurrection or war; arbitrary decisions bygovernmental authorities; delays in obtaining governmental approvals or financing or in the completion of development or construction activities.
To the extent permitted by law, the Company accepts no responsibility or liability for any losses or damages of any kind arising out of the use of anyinformation contained in this presentation. Recipients should make their own enquiries in relation to any investment decisions.
Although the Company has attempted to identify important factors that could cause actual actions, events or results to differ materially from thosedescribed in forward-looking information, there may be other factors that cause actions, events or results to differ from those anticipated, estimatedor intended. Forward-looking information contained herein is current as at the date of this presentation and the Company disclaims any obligation toupdate any forward-looking information, whether as a result of new information, future events or results otherwise. There can be no assurance thatforward-looking information or statements will prove to be accurate, as actual results and future events could differ materially from those anticipatedin such information or statements. Accordingly, readers should not place undue reliance on forward-looking statements.
2
For
per
sona
l use
onl
y
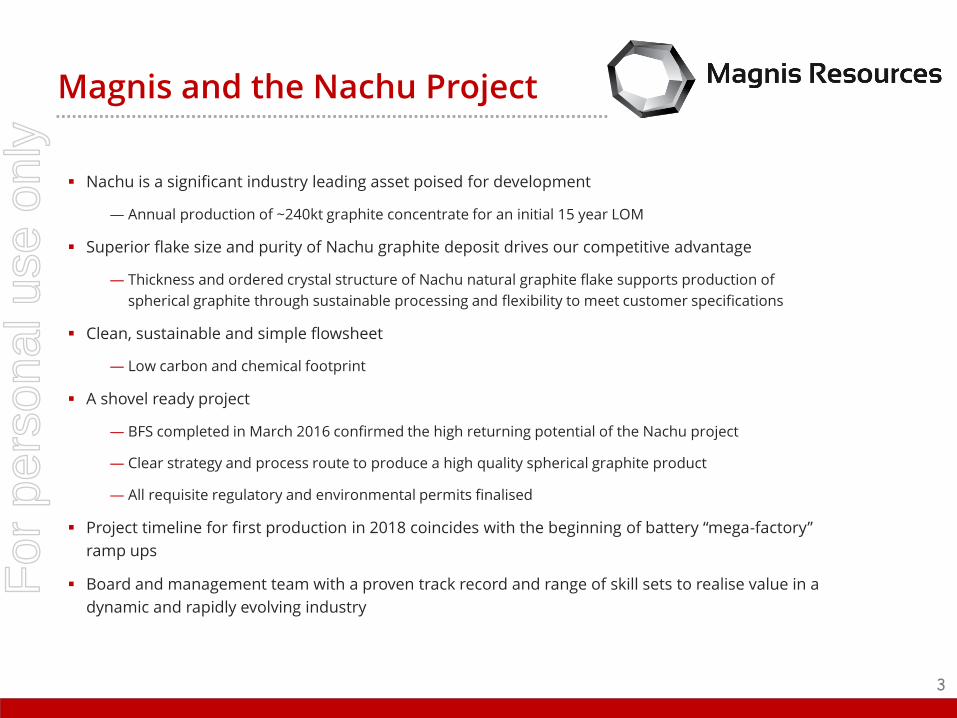
Magnis and the Nachu Project
Nachu is a significant industry leading asset poised for development
― Annual production of ~240kt graphite concentrate for an initial 15 year LOM
Superior flake size and purity of Nachu graphite deposit drives our competitive advantage
― Thickness and ordered crystal structure of Nachu natural graphite flake supports production of
spherical graphite through sustainable processing and flexibility to meet customer specifications
Clean, sustainable and simple flowsheet
― Low carbon and chemical footprint
A shovel ready project
― BFS completed in March 2016 confirmed the high returning potential of the Nachu project
― Clear strategy and process route to produce a high quality spherical graphite product
― All requisite regulatory and environmental permits finalised
Project timeline for first production in 2018 coincides with the beginning of battery “mega-factory”
ramp ups
Board and management team with a proven track record and range of skill sets to realise value in a
dynamic and rapidly evolving industry
3
For
per
sona
l use
onl
y

Corporate Overview
Major Shareholders
Analyst Coverage
4
Shareholder Shares (M) Ownership
Mazzdel Pty Ltd 48.6 10.9%
Pershing Aust. Noms 21.1 4.8%
Citicorp Noms 16.4 3.7%
Capital structure
ASX ticker MNS
ASX share price (20 Oct 2016) A$0.82
12 month share price range A$0.28 – 1.12
Shares on issue 444.1 million
Market capitalisation A$364 million
Options ($0.09533 strike, May 2017
expiry) 104 million
Options (various strike) 17.1 million
Average daily volume (3 months) 1.96 million
Cash A$5.4M
Debt A$0.0M
For
per
sona
l use
onl
y

Board and Management
Frank PoullasNon-Executive ChairmanMAICD
15 years in investment markets and engineering sectors
Partner in a successful IT firm
Cobb Johnstone Non-Executive DirectorB.Eng
Mining engineer with +30 years experience. Previous roles include Chief Operating Officer positions of Equinox Minerals and Sino Gold, served as General Manager of Kalgoorlie Super Pit, Olympic Dam and Northparkes
Lead Non-Executive Director of Evolution Mining
Len EldridgeExecutive DirectorB.Econ
14 year background in mining finance and commercial roles including senior positions with Equinox Minerals, JCP Investment Partners and Macquarie Group
Founding principal of Fivemark Partners, a specialist mining advisory group
Johann JacobsNon-Executive Director B.Acc, MBL, FCA, FAICD
30+ years experience in the resources sector
Managed established companies and acquisitions, including project expansions and start-up mining operations in Australia, South Africa and Indonesia
Peter TsegasNon-Executive Director
15+ years experience in Tanzania engaging both private and public sectors on projects; Tanzanian resident
Previous consulting roles to the Tanzanian government and to a number of mining companies including Rio Tinto
Dr Frank Houllis Chief Executive OfficerB.Sc (USyd BEng) (Chem 1st Class, USyd), PhD (USyd)
20 years practical experience in development and engineering of metallurgical process
Deep process experience across a wide range of commodities; led process development teams at ANSTO (process manager, 2008-2014), BHP Billiton (principal engineer, 2005-2008) and Intec Ltd (1995-2005)
Rod Chittenden Head of Operations
30 years experience, metallurgist with a strong track record in project development; has worked in Australia, Europe, Africa
Detailed involvement in metallurgical testing, feasibility studies, process design and commissioning for projects with Newcrest Mining, Barrick Gold, Paladin Energy and Mantra Resources
Shailesh UpretiLead battery consultant PhD (IIT Delhi)Post Doc (Prof Stan Whittingham, SUNY New York)
16+ years experience in lithium-ion battery technologies
Strong track record in product development and commercialisation
5 year PostDoc completed under the supervision of Professor Stan Whittingham , one of the leading pioneers in development of Lithium-ion batteries with over 40 years experience in the field
Brent LawsExploration Manager B.Sc Geology (Honours)
Geologist with a broad and diverse 12+ years of experience including exploration, resource development and mining management roles in emerging markets projects. Previous roles at Newmont and Oz Minerals
7+ years of African based project development experience
Deep technical expertise & relevant experience to advance Nachu and generate shareholder returns 5
For
per
sona
l use
onl
y

Shovel ready project of significance
Located west of the coastal city of Lindi and ~220km
by road from port city of Mtwara in south east
Tanzania
One of the most advanced graphite projects of scale
globally
BFS completed
ESIA completed in accordance with Equator Principles
guidelines
Power solution
Port access
All requisite environmental and mining permits
secured
― Special Mining Licence (SML) granted to Nachu
by the Ministry of Energy and Minerals of
Tanzania
Mineral Development Agreement (MDA) finalised for
Nachu
6
For
per
sona
l use
onl
y

A differentiated strategy
Not all graphite is created equal and the market for graphite
is not homogenous
Concentrate purity and a “sustainable” flowsheet to produce
coated spherical graphite are key value drivers in the
growing lithium-ion battery market
Capitalise on the significant divergence in graphite end
markets by focusing solely on growing and high value
product markets
― Avoid exposure to traditional graphite markets with clear
future oversupply risk in fine grain, lower purity products
― Produce a high quality spherical graphite product for use in
lithium-ion battery anodes
BFS work driven by a team with significant process
engineering experience and a focus on product
development
Progress discussions with potential off-takers in a manner
that will allow full value capture for the high purity Nachu
ore body
7
For
per
sona
l use
onl
y
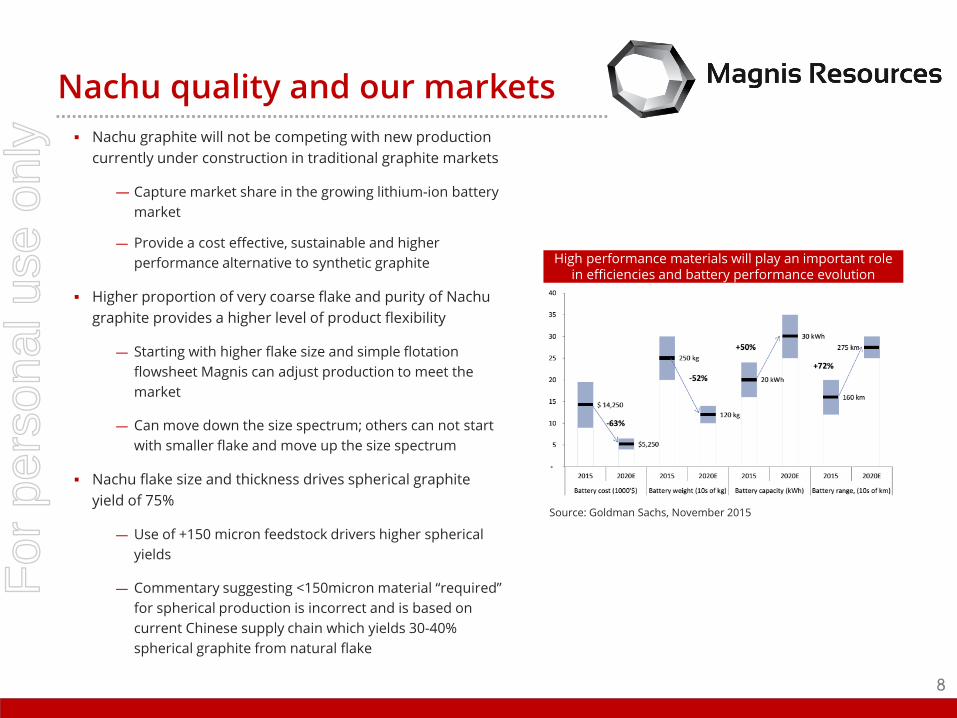
Nachu quality and our markets
8
Nachu graphite will not be competing with new production
currently under construction in traditional graphite markets
― Capture market share in the growing lithium-ion battery
market
― Provide a cost effective, sustainable and higher
performance alternative to synthetic graphite
Higher proportion of very coarse flake and purity of Nachu
graphite provides a higher level of product flexibility
― Starting with higher flake size and simple flotation
flowsheet Magnis can adjust production to meet the
market
― Can move down the size spectrum; others can not start
with smaller flake and move up the size spectrum
Nachu flake size and thickness drives spherical graphite
yield of 75%
― Use of +150 micron feedstock drivers higher spherical
yields
― Commentary suggesting <150micron material “required”
for spherical production is incorrect and is based on
current Chinese supply chain which yields 30-40%
spherical graphite from natural flake
Lithium-ion feedstock
Lithium-ion
feedstock Traditional
graphite markets
High purity and
expandable graphite markets
Source: Goldman Sachs, November 2015
High performance materials will play an important role in efficiencies and battery performance evolution
For
per
sona
l use
onl
y

Rapid evolution of a global industry
9
A global movement towards the adoption of clean
energy technology
― Transportation
― Energy storage
Strong Western world and Chinese investment in
battery mega-factories will increase competition
for raw materials
Mega-factories capacity forecasts are largely
representative of current EV visibility; this is just
the beginning
Value of sustainable footprint across the supply
chain is becoming a focus
0
50
100
150
200
250
300
2013 2014 2015 2016 2017 2018 2019 2020
Meg
afac
tori
es c
apac
ity
(GW
h)
Current capacity Tesla BYD FoxconnOptimum Nano China Aviation Samsung SDI Boston PowerShandong Winabattery LG chem BAK Battery Co. GuoxuanCATL Zhejiang Tianneng power China - Others
Source: Deutsche Bank, May 2016
Significant investment underway in the battery supply chain
For
per
sona
l use
onl
y

A structural change to anode demand looming
10
Current graphite anode demand dominated by
consumer electronics
Demand growth to be driven by larger scale
batteries
― Automotive demand a looming step change with
significant investment underway
― Energy storage demand evolving
― Step change in quantum, performance and quality
requirements
Nature of demand growth presents significant
challenges for current anode supply chains
Magins’ strategy is focused on providing an
alterntive to the current spherical graphite supply
chain through a greener, more cost effective and
secure route to market
Structural change looming in Lithium-ion demand (GWs)
Increasing market share for natural graphite
Source: Avicenne Energy, May 2015
For
per
sona
l use
onl
y
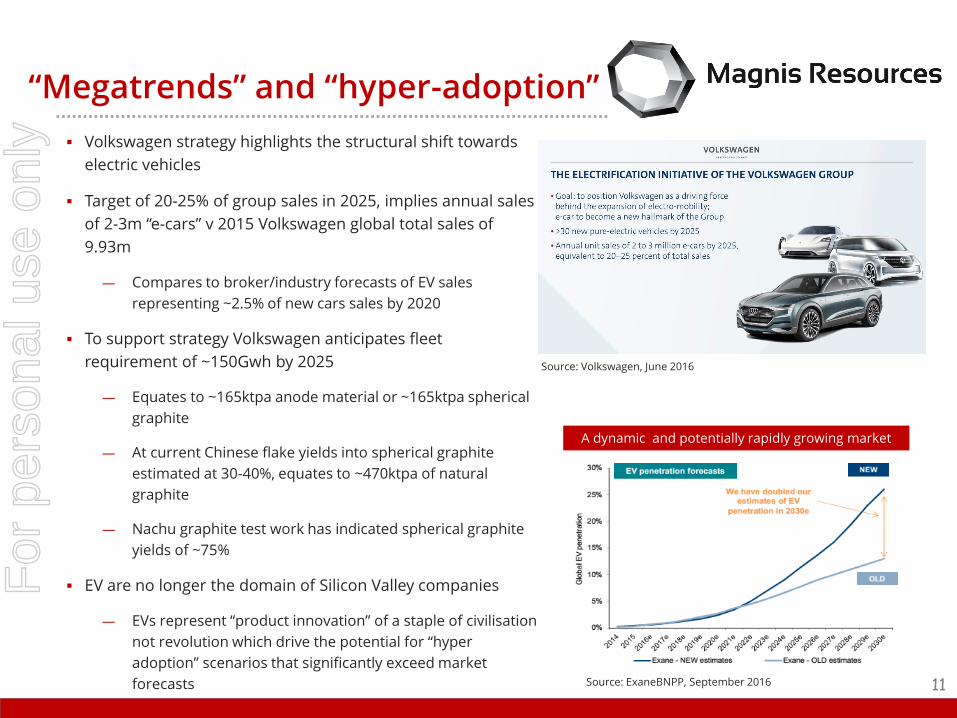
“Megatrends” and “hyper-adoption”
11
Volkswagen strategy highlights the structural shift towards
electric vehicles
Target of 20-25% of group sales in 2025, implies annual sales
of 2-3m “e-cars” v 2015 Volkswagen global total sales of
9.93m
― Compares to broker/industry forecasts of EV sales
representing ~2.5% of new cars sales by 2020
To support strategy Volkswagen anticipates fleet
requirement of ~150Gwh by 2025
― Equates to ~165ktpa anode material or ~165ktpa spherical
graphite
― At current Chinese flake yields into spherical graphite
estimated at 30-40%, equates to ~470ktpa of natural
graphite
― Nachu graphite test work has indicated spherical graphite
yields of ~75%
EV are no longer the domain of Silicon Valley companies
― EVs represent “product innovation” of a staple of civilisation
not revolution which drive the potential for “hyper
adoption” scenarios that significantly exceed market
forecasts
Source: Volkswagen, June 2016
Source: ExaneBNPP, September 2016
A dynamic and potentially rapidly growing market
For
per
sona
l use
onl
y

Outstanding Margin Dynamics
Nachu concentrate product purity and coarse flake distribution drive outstanding projected margins
Pricing outcomes reflect Magnis’ potential access to higher value end markets across entire reserve
base and product suite versus competing projects
Source: Various company exchange releases on Scoping Study, PFS and DFS outcomes
* Vittangi development case involves new direct processing technology and its basket price includes an assumed ~1kt super high-value graphene production
** Lac Knife (Focus) operating cost estimate does not include transport and product logistics
Global graphite project comparative
12
0.0%
5.0%
10.0%
15.0%
20.0%
25.0%
30.0%
0
250
500
750
1,000
1,250
1,500
1,750
2,000
2,250
2,500
Nac
hu(A
SX:M
NS)
Lac
Knife
(TSX
V:F
MS)
**
Vit
tang
i(A
SX:T
LG)*
Lac
Gu
eret
(TSX
V:L
LG)
Bis
sett
Ck
(TSX
V:N
GC
)
Mo
lo(T
SX:E
GZ)
Epan
ko(A
SX:K
NL)
Duw
i(A
SX:S
VM
)
Mah
enge
(ASX
:BK
T)
Chi
lalo
(ASX
:GP
X)
Bal
ama
(ASX
:SYR
)
Bal
ama
Nth
(ASX
:TO
N)
% TGCUS$/t conc Operating margin Basket price (FOB)
Operating/C1 cost (FOB) In-situ resource grade [RH axis]
For
per
sona
l use
onl
y

Product Streams and Pricing
240ktpa Flake Graphite Concentrate (average 98.3% TGC)*
22ktpa Super Jumbo Flake 77ktpa Jumbo Flake 141ktpa Battery Feedstock
Size: +500 microns, +35 mesh
Purity: 97.5% TGC
Key markets: Aerospace, composites
and niche markets
Current pricing: US$4,000-6,000/t CFR**
Size: 300-500 microns, +50/-35 mesh
Purity: 97.0% TGC
Key markets: Expandable graphite,
composites and electronics
Current pricing: US$2,500-3,000/t CFR**
Size: Sub 300 microns, -50 mesh
Purity: 99.2% TGC
Key markets: Spherical graphite for use
in Li-ion battery anodes
Value-in-use pricing: +US$2,100/t FOB**
Premium pricing due to purity, absence of halides and terminal product performance
― Spherical graphite produced from Nachu Battery Feedstock delivers superior performance to leading synthetic
graphite
Downstream margin capture
― Toll processing (spheronising and coating) to produce spherical graphite
Strong market outlook for all Nachu product streams
― In contrast, clear future oversupply risk in fine grain, lower purity products
― Large flake sizes provide significant marketing flexibility
13* Concentrate production rate over first 12 years of initial mine plan
** Current pricing based on industry sources and end user discussions
For
per
sona
l use
onl
y
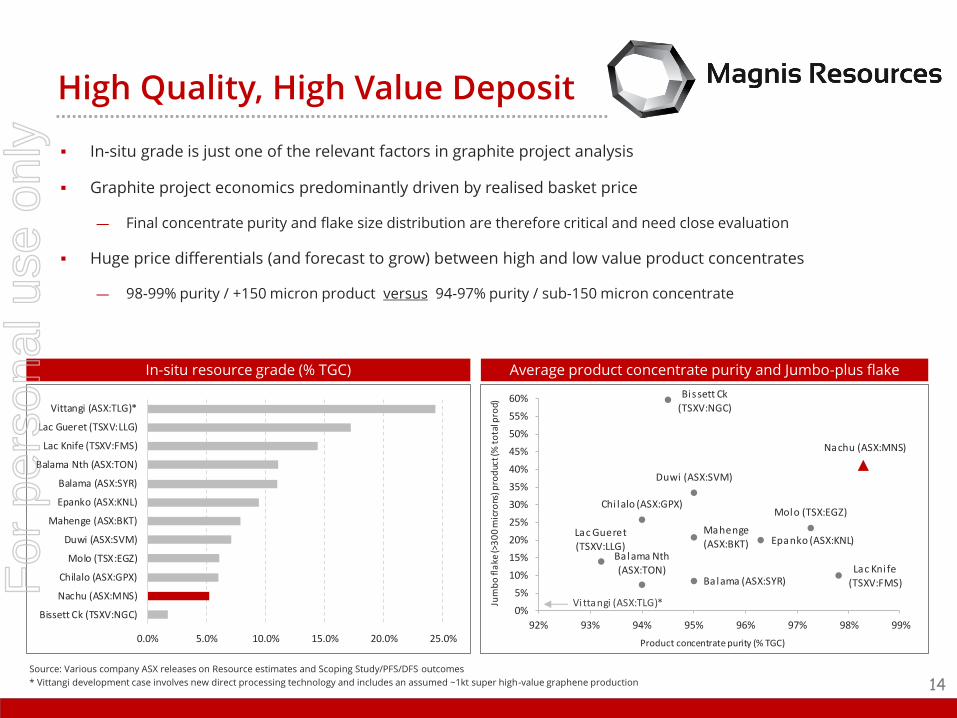
High Quality, High Value Deposit
In-situ grade is just one of the relevant factors in graphite project analysis
Graphite project economics predominantly driven by realised basket price
― Final concentrate purity and flake size distribution are therefore critical and need close evaluation
Huge price differentials (and forecast to grow) between high and low value product concentrates
― 98-99% purity / +150 micron product versus 94-97% purity / sub-150 micron concentrate
Source: Various company ASX releases on Resource estimates and Scoping Study/PFS/DFS outcomes
* Vittangi development case involves new direct processing technology and includes an assumed ~1kt super high-value graphene production
In-situ resource grade (% TGC) Average product concentrate purity and Jumbo-plus flake
14
0.0% 5.0% 10.0% 15.0% 20.0% 25.0%
Bissett Ck (TSXV:NGC)
Nachu (ASX:MNS)
Chilalo (ASX:GPX)
Molo (TSX:EGZ)
Duwi (ASX:SVM)
Mahenge (ASX:BKT)
Epanko (ASX:KNL)
Balama (ASX:SYR)
Balama Nth (ASX:TON)
Lac Knife (TSXV:FMS)
Lac Gueret (TSXV:LLG)
Vittangi (ASX:TLG)*
Nachu (ASX:MNS)
Epanko (ASX:KNL)
Duwi (ASX:SVM)
Balama (ASX:SYR)
Balama Nth (ASX:TON)
Chi lalo (ASX:GPX)
Mahenge (ASX:BKT)
Lac Gueret (TSXV:LLG)
Molo (TSX:EGZ)
Bissett Ck (TSXV:NGC)
Lac Kni fe (TSXV:FMS)
0%
5%
10%
15%
20%
25%
30%
35%
40%
45%
50%
55%
60%
92% 93% 94% 95% 96% 97% 98% 99%
Jum
bo
fla
ke (>
30
0 m
icro
ns) p
rod
uct (
% t
ota
l pro
d)
Product concentrate purity (% TGC)
Vittangi (ASX:TLG)*
For
per
sona
l use
onl
y

Exceptional Purity and Flake Size
Exceptional final concentrate grade of +99% TGC for sub-300 micron product from solely flotation = very rare
at 92% process recovery
― Driven by Nachu being coarse flake with impurities on the surface not within the crystalline structure
― High value, high appeal as removes/minimises need for expensive downstream chemical purification (HF/HCl
treatment) for use in Li-ion battery anodes and expanded graphite material
Over 40% of Nachu product in high value Super Jumbo (+500 microns) and Jumbo (+300 microns) flake sizes
Source: Various company ASX releases on Resource estimates and Scoping Study/PFS/DFS outcomes
* Vittangi development case involves new direct processing technology and includes ~1kt graphene
** Medium/Large size fraction for Epanko is 106-300 microns (ie includes significant Fine product)
ClassificationConcentrate
grade (% TGC)Sieve size (microns)
Sieve size (mesh)
Weight distribution
Super Jumbo 97.5% > 500 +35 9%
Jumbo 97.0% 300 - 500 +50/-35 32%
Large 99.2% 180 - 300 +80/-50 25%
Medium 99.1% 150 - 180 +100/-80 10%
Fine 99.0% 75 - 150 +200/-100 18%
Amorphous 98.9% < 75 -200 6%
Graphite flake size and concentrate grades Product flake size distribution and average concentrate purity
15
Battery Feedstock
90%
91%
92%
93%
94%
95%
96%
97%
98%
99%
100%
0%
10%
20%
30%
40%
50%
60%
70%
80%
90%
100%
Nachu(Magnis)
Duwi(Sovereign)
Epanko**(Kibaran)
Balama(Syrah)
McIntosh(Hexagon)
Vittangi*(Talga)
Con
cen
trat
e p
uri
ty (%
TG
C)
Pro
du
ct fl
ake
size
dis
trib
utio
n
Jumbo (>300 microns) Medium/Large (150-300 microns)
Fine/Amorphous (<150 microns) Concentrate purity [RH axis]
NA
For
per
sona
l use
onl
y

Concentrate flowsheet
16
For
per
sona
l use
onl
y

Excellent crystal structure
17
Excellent crystal structure with minimum
disorder (voids)
― Higher levels of control over particle
engineering and consistency
XRD Rietveld Analysis of Nachu Graphite
Flakes
― a = 2.46000(5) Å
― c = 6.70723(5) Å
― Cell volume = 35.1517(1) Å3
― R (Bragg) = 0.964
For
per
sona
l use
onl
y

18
C
Si
Al
Si
Extremely low impurity levels
Majority of flakes are clean and do not
exhibit any meaningful impurities
― Energy dispersive X ray analysis for impurity
mapping
Flakes with impurities show impurity phases
predominately on the crystal surface
Level and nature of impurities results in
ability to produce a battery specification
graphite with physical separation methods
― Avoids chemical and high temperature
thermal purification
― Opportunity to reduce the reliance on
Chinese dominated spherical graphite
supply chain
Impurities in Nachu battery feedstock are
benign to battery cell performance
― No meaningful presence in Nachu ore body
of impurities which exhibit multiple
oxidation states and complicate the
purification process
For
per
sona
l use
onl
y

Nachu spherical graphite
>99.8% purity uncoated spherical graphite
produced from Nachu concentrate
― No hydrofluoric acid or other corrosive acids
used in the process
― Utilising commercialised milling technology
outside of China
>70% yield from flake to spheroids
Flakes engineered to spheroids to maximise
packing density
Key performance parameters
― Tap Density: 100 taps = 0.92 g/cc, 1000 taps =
1.08 g/cc
― BET: 5.7m2/g
― First cycle efficiency 91.2%
― Discharge capacity (3rd cycle) 359mAh/g
Remaining impurities greater than 10ppm are
benign to cell performance
19
Nachu uncoated spherical graphite
For
per
sona
l use
onl
y

Supply Chain Strategy & IP
Magnis Resources’ supply chain has significant flexibility to meet
customers indicated specifications
― This starts and finishes with the quality of the in-situ graphite at
Nachu
Co-location potential of downstream facilities for efficiency, reduced
cost and rapid scale up potential to meet end user demand
― Establishment of a higher quality and consistent non Chinese
supply source
Magnis may supply both coated and uncoated spherical graphite
subject to customer requirements
― Coated Spherical Graphite @ >99.95% C
― Uncoated Spherical Graphite @ 99.90% C
Industry leading infrastructure and IP
― Team with cumulative 50+ years of Li-ion industry experience
― Access to IP to continue product evolution
Magnis Flakes From Mine ~ 180 Micron (d50)
(Purity 99.2%)
Spheroidisation~75 % Yield
(Purity 99.9%)
Coating/ Ultra Specification(Purity 99.95+%)
20
For
per
sona
l use
onl
y

Graphite/Silicon blend results highlight our R&D commitment
Graphite and silicon anode blend is an area receiving
significant attention from battery makers and car
manufacturers for the next generation of high
performance anode material
― Experience of the Magnis team allows for parallel
development of the silicon blend with delivery of coated
spherical graphite material from the Nachu project
Testwork conducted for a 10% silicon additive blended
with Nachu coated spherical graphite
Initial results from coin cell testing include
― First charge capacity capacity of 587+ mAh/g, a 65%
improvement over the energy density of ~355mAh/g for
current industry standard graphite anode
― First cycle efficiency >86%
― More than 98% capacity retention after 38 cycles
Potential to deliver significant increase in mileage and
power
― The 65% increase in anode capacity translates to 20-30%
increase in mileage for current battery pack sizes
21
Internal view of silicon composite particle
Nachu graphite & silicon blend anode performance result
For
per
sona
l use
onl
y

Tanzanian Operating Environment
Tanzania overview
― Broad stability following independence in 1961 and administered under English common law
― Presidential constitutional republic with democratic multi-party elections since 1995; most recent
October 2015 (current 5 year terms)
― Track record of successful foreign investment in the mining sector following reform of mining policy in
1998
― US$2bn invested in the gold sector since 1998 with Tanzania note the 4th largest gold producing country
in Africa
All requisite environmental and mining permits finalised
― Special Mining Licence (SML) granted to Nachu by the Ministry of Energy and Minerals of Tanzania
Mineral Development Agreement (MDA) executed for Nachu
― 30% corporate tax rate
― 3% production royalty
― 5% free carried interest in project for Tanzanian Government
― Environmental conditions, dispute resolution mechanisms
22
For
per
sona
l use
onl
y
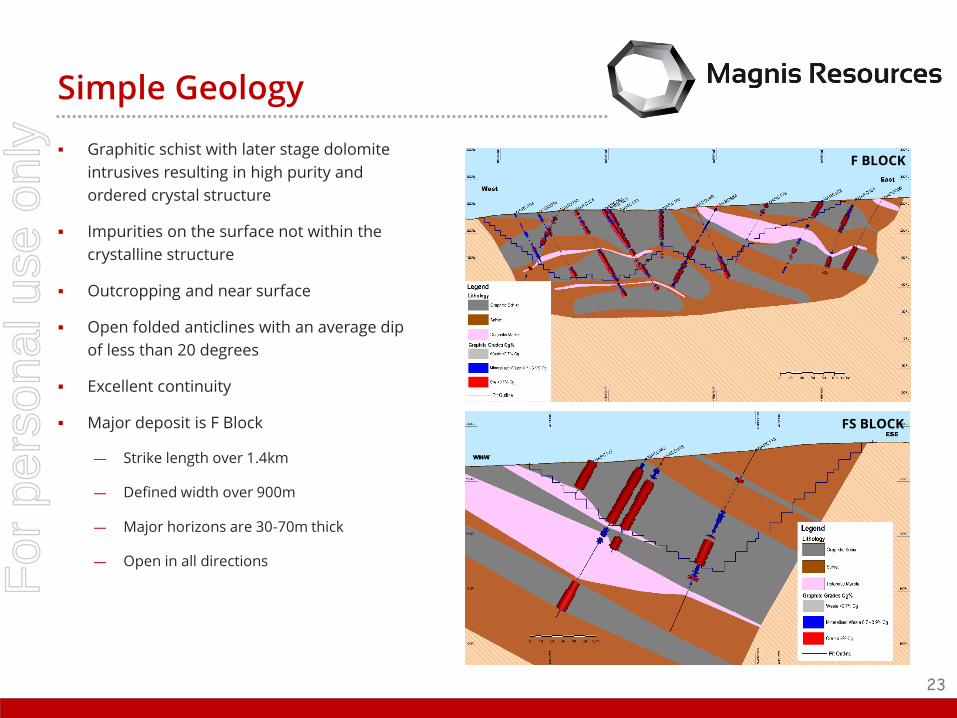
Simple Geology
Graphitic schist with later stage dolomite
intrusives resulting in high purity and
ordered crystal structure
Impurities on the surface not within the
crystalline structure
Outcropping and near surface
Open folded anticlines with an average dip
of less than 20 degrees
Excellent continuity
Major deposit is F Block
― Strike length over 1.4km
― Defined width over 900m
― Major horizons are 30-70m thick
― Open in all directions
23
F BLOCK
FS BLOCK
For
per
sona
l use
onl
y

Conventional Mining
Nachu reserve = 76mt at 4.8% TGC for 3.7mt contained
graphite
― Two open pits – F and FS
Broader resource = 174mt at 5.4% TGC for 9.3mt contained
graphite
― Represents only 2% of project licence area
Conventional drill and blast, truck and shovel open pit mining
techniques
A number of independent mining cost estimates received
and reviewed from contractors as part of BFS
― Assumed $3.95/t material moved in BFS
90t excavators (Cat 390) and 40t articulated trucks (Cat 475)
― Ramp design allows up to 90t Cat 777 trucks
Average strip ratio of 1.5:1 LOM
― 1.4:1 over the first 5 years
Lower grade ore (3.5% TGC) stockpiled for treatment in latter
years of initial mine life
24
Nachu ore reserve estimate1
ClassificationTonnes
(mt)Grade
(% TGC)Graphite
(mt)
Proved 50.5 4.6 2.3
Probable 25.7 5.1 1.3
Total ore reserves 76.3 4.8 3.7
1. Refer Magnis ASX releases on 1 February 2016 (Mineral resource estimate) and 31 March 2016 (Ore reserve estimate).
For
per
sona
l use
onl
y

Process and Metallurgical Rigour
Simple and proven process flowsheet – crushing and
screening, grinding, flotation, filtration, drying
Key processing parameters
― Front end throughput of 5mtpa ore
― Feed grade: avg 5.2% TGC first 12 years and avg 3.9% TGC
next 3 years (LG stockpiles)
― Processing recovery of 92%
― Final average concentrate purity of 98.3%
High volume and broad nature of Nachu testwork delivers
robust process and product parameters
― > 99% TGC and up to 99.6% TGC from basic flotation for
sub-300 microns concentrate
― Results repeated throughout Blocks F and FS
― Core sample tests from every diamond hole
25
For
per
sona
l use
onl
y

Infrastructure and Logistics
In-country transport
― Bagged concentrate loaded in containers and trucked to port
― 200km by road; 140km sealed and 60km hard dirt to site
Port access
― Mtwara facility has 400ktpa capacity; 130-140ktpa current
utilisation; required Nachu usage approximately 240ktpa
― Efficient consumables supply chain and product export route
Water availability
― Borehole field on-site; water recovery and re-use
Power
― Grid power agreement signed with Symbion Power
― Symbion to construct a dedicated 30MW power station,
associated substations and 132KV transmission line to Nachu
― Grid power pricing of US$0.08-0.10/kWh represents significant
cost saving over diesel or HFO
26
Typical section of flat lying road between Nangangaand Ruangwa
Mtwara port and proposed Magnis land allocation
For
per
sona
l use
onl
y
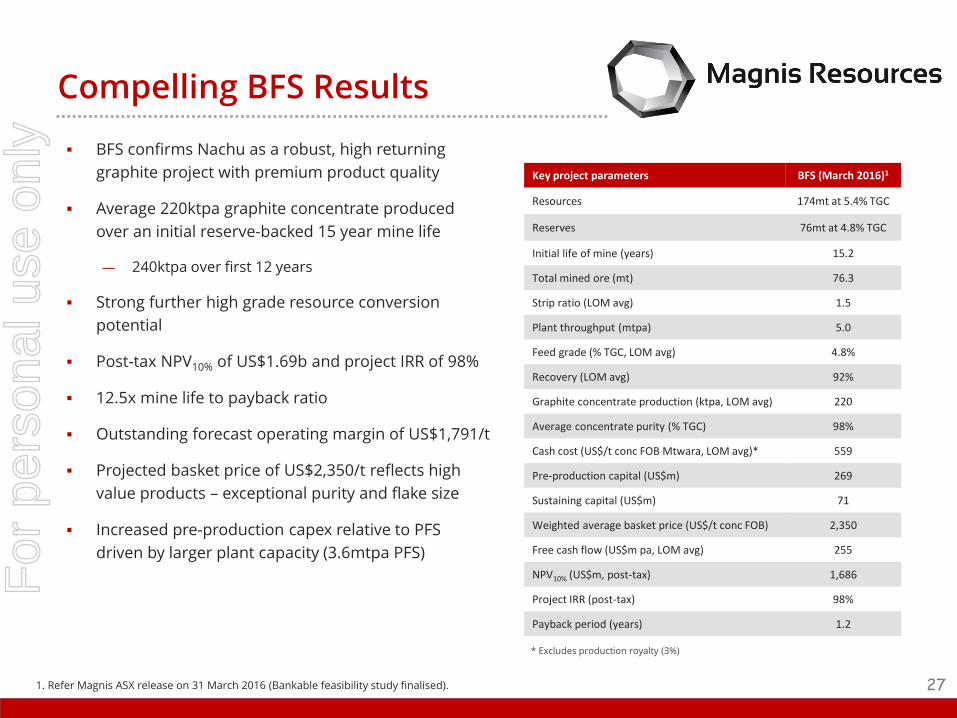
Compelling BFS Results
BFS confirms Nachu as a robust, high returning
graphite project with premium product quality
Average 220ktpa graphite concentrate produced
over an initial reserve-backed 15 year mine life
― 240ktpa over first 12 years
Strong further high grade resource conversion
potential
Post-tax NPV10% of US$1.69b and project IRR of 98%
12.5x mine life to payback ratio
Outstanding forecast operating margin of US$1,791/t
Projected basket price of US$2,350/t reflects high
value products – exceptional purity and flake size
Increased pre-production capex relative to PFS
driven by larger plant capacity (3.6mtpa PFS)
Key project parameters BFS (March 2016)1
Resources 174mt at 5.4% TGC
Reserves 76mt at 4.8% TGC
Initial life of mine (years) 15.2
Total mined ore (mt) 76.3
Strip ratio (LOM avg) 1.5
Plant throughput (mtpa) 5.0
Feed grade (% TGC, LOM avg) 4.8%
Recovery (LOM avg) 92%
Graphite concentrate production (ktpa, LOM avg) 220
Average concentrate purity (% TGC) 98%
Cash cost (US$/t conc FOB Mtwara, LOM avg)* 559
Pre-production capital (US$m) 269
Sustaining capital (US$m) 71
Weighted average basket price (US$/t conc FOB) 2,350
Free cash flow (US$m pa, LOM avg) 255
NPV10% (US$m, post-tax) 1,686
Project IRR (post-tax) 98%
Payback period (years) 1.2
* Excludes production royalty (3%)
271. Refer Magnis ASX release on 31 March 2016 (Bankable feasibility study finalised).
For
per
sona
l use
onl
y

Capital and Operating Costs
Pre-production capital estimate of US$269m (includes 11% or US$28m contingency provision)
― Increase from PFS estimate predominantly driven by bigger plant size (5mtpa)
― Sustaining capital of approximately US$4.7m pa
Cash operating cost LOM estimate of US$559/t concentrate FOB Mtwara
― US$502/t average across the first five years (240ktpa production rate)
― Contract mining and product transport
BFS cost estimates to an accuracy of -10%/+10%
Capital activity Capex (US$m)
Process plant 117
Infrastructure 60
Pre-mining and site preparation 25
Owner’s costs 20
EPCM 20
Contingency and escalation 28
Total pre-production capital cost 269
Nachu pre-production capital cost estimate
Production activity Opex (US$/t conc FOB)
Mining 217
Processing 51
Power 66
Diesel 48
Product logistics 81
Maintenance, G&A and other 96
Total cash operating cost (FOB Mtwara)* 559
Nachu cash operating cost LOM estimate
* Excludes production royalty (3%)28
For
per
sona
l use
onl
y

Target Development Timeline
29
Q3 Q4 Q1 Q2 Q3 Q4 Q1 Q2 Q3 Q4 Q1 Q2 Q3 Q4 Q1 Q2
Drilling & resource modelling R R
Metallurgical testwork R R R R R R
Pre-feasibility study R R
Cornerstone offtake agreements R R
Environmental impact study R R R R R
Mining approval & MDA R R
Detailed design R R R R R
Bankable Feasibility Study R R
Detailed engineering R R R
Offtake agreements
Project financing
Construction
Commissioning & production
2014 2015 2016 2017 2018
For
per
sona
l use
onl
y

Summary
Nachu is a high quality, long life graphite resource
Located in Tanzania, a well established mining jurisdiction
Development ready – all environmental and mining permits secured, fiscal stability with signed MDA
Nachu BFS delivers outstanding forecast returns – 98% post-tax IRR, US$1.69b post-tax NPV10%
Key advantages relative to graphite development peers
― High appeal, high value product given exceptional concentrate purity and coarse flake size
― High volume and broad nature of met testing delivers robust processing and product parameters
― Outstanding realised price and operating margin position expected given premium product composition
― No downstream chemical purification requirement for Nachu concentrate = strong ‘green credentials’
Project financing progressing in parallel with advanced North American, European and Asian buyer offtake
discussions
30
For
per
sona
l use
onl
y
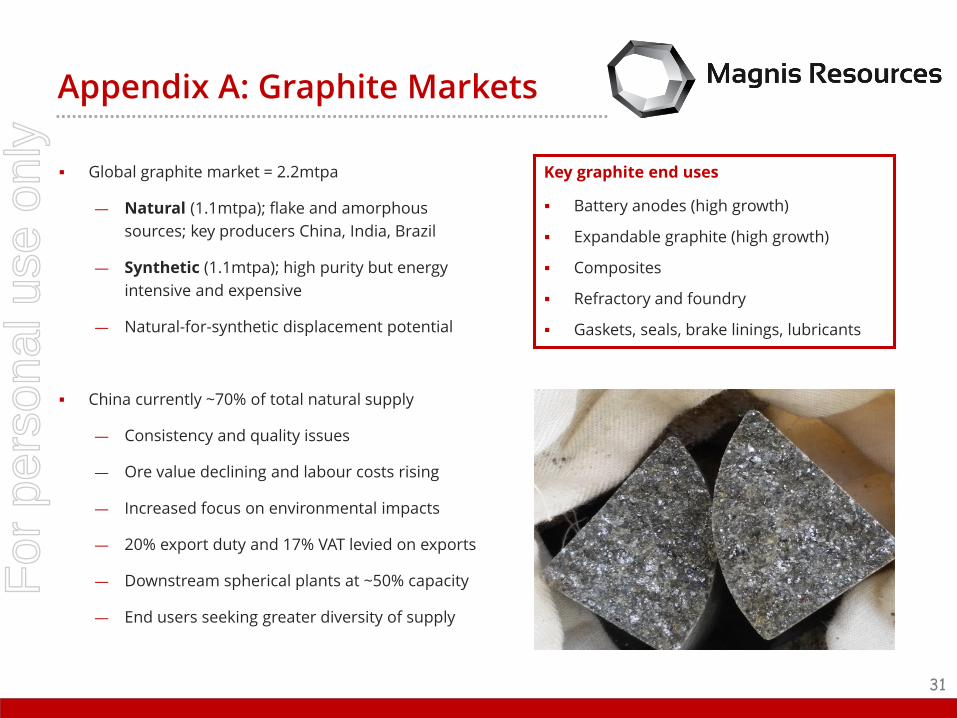
Appendix A: Graphite Markets
31
Global graphite market = 2.2mtpa
― Natural (1.1mtpa); flake and amorphous
sources; key producers China, India, Brazil
― Synthetic (1.1mtpa); high purity but energy
intensive and expensive
― Natural-for-synthetic displacement potential
China currently ~70% of total natural supply
― Consistency and quality issues
― Ore value declining and labour costs rising
― Increased focus on environmental impacts
― 20% export duty and 17% VAT levied on exports
― Downstream spherical plants at ~50% capacity
― End users seeking greater diversity of supply
Key graphite end uses
Battery anodes (high growth)
Expandable graphite (high growth)
Composites
Refractory and foundry
Gaskets, seals, brake linings, lubricants
For
per
sona
l use
onl
y

Typical pricing: US$750-1,000/t (94-95%, small to medium flake).
Significant issues with quality and consistency of predominant Chinese supply.
Pricing increases with purity and flake size (Nachu Battery Feedstock is +99% and large to medium flake).
Appendix B: Graphite in Li-ion Batteries
Natural flake graphite concentrate
Synthetic graphite feed sources
67% 15%
Li-ion batteriesSpherical graphite
Graphite anodes
~45% market share
~55% market share
Natural flake placed in a circulating terminal that spins the graphite, forcing the flakes to collide and bend. As the flakes bend, they form small spheres with a sub 20 micron diameter (uncoated spherical graphite).
Typical yield from this spheronising process is 30-50% (ie 50-70% loss from concentrate); Nachu yield is ~75%.
Uncoated spherical graphite is then purified to 99.95% via acid baths (HCl/HF), cleansed and coated with a single layer of carbon (coated spherical graphite).
Purification cost ranges widely driven by the extent of chemical (and thermal) treatment processes required; Nachu Battery Feed is already +99% vs typical 94-95%.
Close to 100% of current uncoated spherical graphite production occurs in China. The coating process occurs mainly in China, Japan, Korea and Taiwan.
Technology improvements and the large cost differential have delivered significant opportunity for spherical graphite to displace synthetic graphite in future anode material demand growth.
Typical pricing: US$12,000-20,000/t
Historically high performance anode material but expensive.
Synthetic graphite
SPHERONISATION AND PURIFICATION
32
Typical pricing: Coated US$7,000-10,000/t and Uncoated US$3,000-3,500/t.
Chinese product typically inferior to synthetic graphite in battery anodes; Nachu product testing indicates superior to both.
HIGH TEMPERATURE TREATMENT
Aggressive heat treatment (2,300-3,000ºC) to recreate the pressure-temperature environment required to form natural graphite. Highly energy intensive.
Carbon material such as petroleum coke, coal tar pitch, etc.
Source: Deutsche Bank, Syrah Resources, Industry sources, March 2016
GLOBAL NATURAL FLAKE SUPPLY
For
per
sona
l use
onl
y

Appendix C: Basket Price and Sensitivity
33
Price scenario Low (-35%) BFS base High (+35%)
Weighted average basket price (US$/t conc FOB) 1,528 2,350 3,173
Free cash flow (US$m pa, LOM avg) 125 255 383
NPV10% (US$m, post-tax) 779 1,686 2,592
Project IRR (post-tax) 54% 98% 139%
Payback period (years) 2.0 1.2 0.6
Sensitivity of BFS outcomes to basket price assumption
BFS basket price construction
ClassificationConcentrate
grade (% TGC)Sieve size (microns)
Sieve size (mesh)
Price (US$/t FOB)Weight
distribution
Super Jumbo 97.5% > 500 +35 4,000 9%
Jumbo 97.0% 300 - 500 +50/-35 2,500 32%
Battery Feedstock 99.1% < 300 -50 2,125 59%
Gross basket price 2,413 100%
Discounted net basket price 2,350
For
per
sona
l use
onl
y
Magnis Resources LimitedAustralia Head Office
Suite 9.03, Aurora Place88 Phillip Street
Sydney NSW 2000 Australia
E: [email protected]: +61 2 8397 9888
W: www.magnis.com.auASX: MNS
For
per
sona
l use
onl
y