For personal use only Results Presentation and …...2020/08/12 · Household Lending market share...
155
Results Presentation and Investor Discussion Pack For the full year ended 30 June 2020 For personal use only
Transcript of For personal use only Results Presentation and …...2020/08/12 · Household Lending market share...
Results Presentation and Investor Discussion PackFor the full year ended 30 June 2020
For
per
sona
l use
onl
y
2
Important information
Commonwealth Bank of Australia | ACN 123 123 124 |Commonwealth Bank of Australia | ACN 123 123 124 | Ground Floor Tower 1, 201 Sussex Street, Sydney NSW 2000This announcement has been authorised for release by Kara Nicholls, Group Company Secretary.
The material in this presentation is general background information about the Group and its activities current as at the date of the presentation, 12 August 2020. It is information given in summary form and does not purport to becomplete. Information in this presentation is not intended to be relied upon as advice to investors or potential investors and does not take into account the investment objectives, financial situation or needs of any particularinvestor. Investors should consider these factors, and consult with their own legal, tax, business and/or financial advisors in connection with any investment decision.
This presentation may contain certain forward-looking statements within the meaning of the United States Private Securities Litigation Reform Act of 1995 and the securities laws of other jurisdictions. Forward-looking statements cangenerally be identified by the use of forward-looking words such as “may”, “will”, “would”, “could”, “expect”, “intend”, “plan”, “aim”, “estimate”, “target”, “anticipate”, “believe”, “continue”, “objectives”, “outlook”, “guidance” or other similarwords, and include statements regarding the Group’s intent, belief or current expectations with respect to the Group’s business and operations, market conditions, results of operations and financial condition, capital adequacy and riskmanagement. Any forward-looking statements included in this presentation speak only as at the date of this presentation and undue reliance should not be placed upon such statements. Although the Group believes the forward-looking statements to be reasonable, they are not certain and involve known and unknown risks and assumptions, many of which are beyond the control of the Group, which may cause actual results, conditions or circumstances todiffer materially from those expressed or implied in such statements. To the maximum extent permitted by law, responsibility for the accuracy or completeness of any forward-looking statements, whether as a result of new information,future events or results or otherwise, is disclaimed. Readers are cautioned not to place undue reliance on forward-looking statements and the Group is under no obligation to update any of the forward-looking statements containedwithin this presentation, subject to disclosure requirements applicable to the Group.
Readers should also be aware that certain financial data in this presentation may be considered “non-GAAP financial measures” under Regulation G of the U.S. Securities and Exchange Act of 1934, and non-IFRS financial measures,including Net Profit After Tax (“statutory basis”), Net Profit After Tax (“cash basis”), earnings per share (“cash basis”), dividend payout ratio (“statutory basis”), dividend payout ratio (“cash basis”), dividend cover (“statutory basis”) anddividend cover (“cash basis”). The Group believes that these “non-GAAP financial measures” provide a useful means through which to examine the underlying performance of the business. The disclosure of such non-GAAP/IFRSfinancial measures in the manner included in this presentation would not be permissible in a registration statement under the U.S. Securities Act of 1933. Such non-GAAP/IFRS financial measures do not have a standardized meaningprescribed by Australian Accounting Standards or International Financial Reporting Standards (IFRS) and therefore may not be comparable to similarly titled measures presented by other entities, nor should they be construed as analternative to other financial measures determined in accordance with Australian Accounting Standards or IFRS. Readers are cautioned not to place undue reliance on any such measures.
This Presentation includes credit ratings. A credit rating is not a recommendation to buy, sell or hold any securities and may be changed at any time by the applicable credit ratings agency. Each credit rating should be evaluatedindependently of any other credit rating. Credit ratings are for distribution only to a person (a) who is not a “retail client” within the meaning of section 761G of the Corporations Act 2001 (Cth) and is also a sophisticated investor,professional investor or other investor in respect of whom disclosure is not required under Part 6D.2 or 7.9 of the Corporations Act, and (b) who is otherwise permitted to receive credit ratings in accordance with applicable law in anyjurisdiction in which the person may be located. Anyone who is not such a person is not entitled to receive this presentation and anyone who receives this presentation must not distribute it to any person who is not entitled to receive it.
For
per
sona
l use
onl
y
3
ContentsCEO & CFO Presentations 4
Overview & Strategy 34
Financial Overview 55
Home & Consumer Lending 89
Business & Corporate Lending 103
Deposits, Funding & Liquidity 115
Capital 122
Economic Overview 134
Sources, Glossary & Notes 147
Commonwealth Bank of Australia | ACN 123 123 124 |
For
per
sona
l use
onl
y

4Commonwealth Bank of Australia | ACN 123 123 124 | 12 August 2020
Results PresentationMatt Comyn, Chief Executive OfficerF
or p
erso
nal u
se o
nly
5
OverviewSupporting customers – balanced outcomes – further strategic progress
Supporting customers quickly with simple and efficient processes
Delivering balanced outcomes reflecting core franchise strength
Strengthening already strong balance sheet settings
Executing our strategy: leading in retail, business and digital
For
per
sona
l use
onl
y
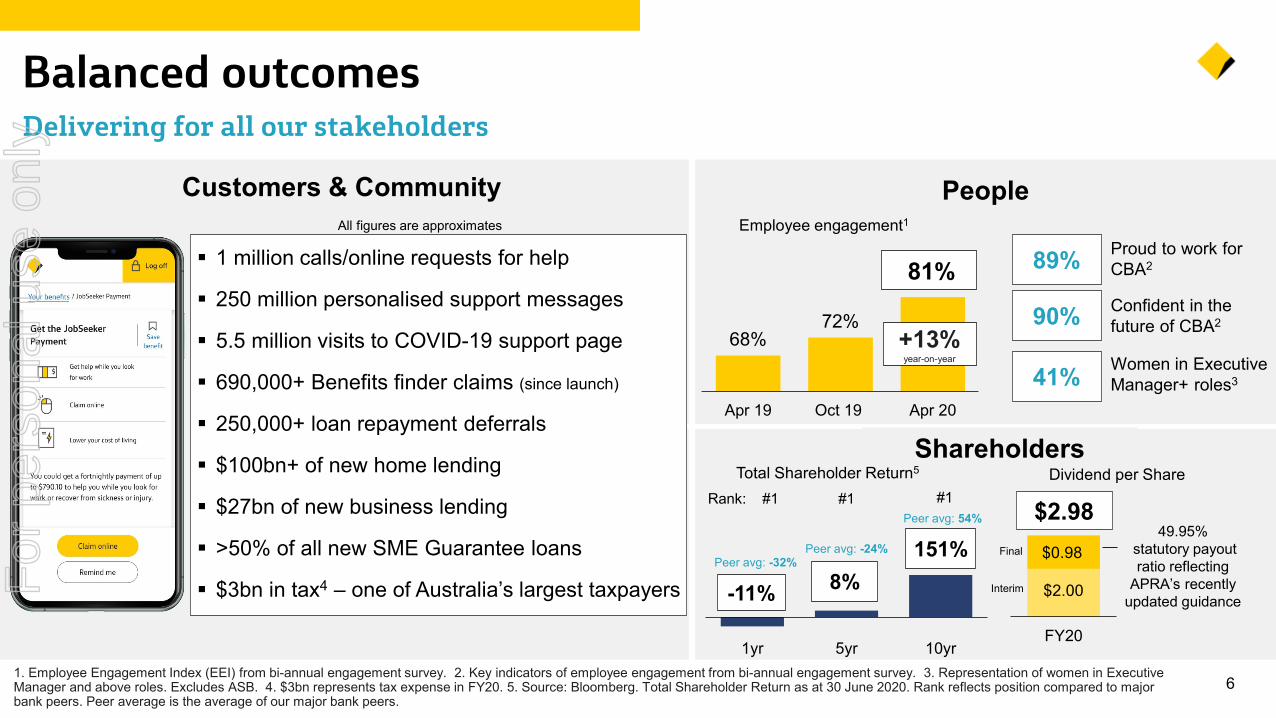
68%72%
81%
Apr 19 Oct 19 Apr 20
61. Employee Engagement Index (EEI) from bi-annual engagement survey. 2. Key indicators of employee engagement from bi-annual engagement survey. 3. Representation of women in Executive Manager and above roles. Excludes ASB. 4. $3bn represents tax expense in FY20. 5. Source: Bloomberg. Total Shareholder Return as at 30 June 2020. Rank reflects position compared to major bank peers. Peer average is the average of our major bank peers.
Balanced outcomesDelivering for all our stakeholders
Customers & Community People
-11% 8%151%
1yr 5yr 10yr
Employee engagement1
+13%year-on-year
ShareholdersTotal Shareholder Return5
FY20
$0.98
$2.00
$2.98
89% Proud to work for CBA2
90%
41%
Confident in the future of CBA2
Women in Executive Manager+ roles3
Final
Interim
49.95%statutory payout ratio reflecting
APRA’s recently updated guidance
Dividend per ShareRank: #1 #1 #1
1 million calls/online requests for help
250 million personalised support messages
5.5 million visits to COVID-19 support page
690,000+ Benefits finder claims (since launch)
250,000+ loan repayment deferrals
$100bn+ of new home lending
$27bn of new business lending
>50% of all new SME Guarantee loans
$3bn in tax4 – one of Australia’s largest taxpayers
All figures are approximates
Peer avg: -32%Peer avg: -24%
Peer avg: 54%
For
per
sona
l use
onl
y
7
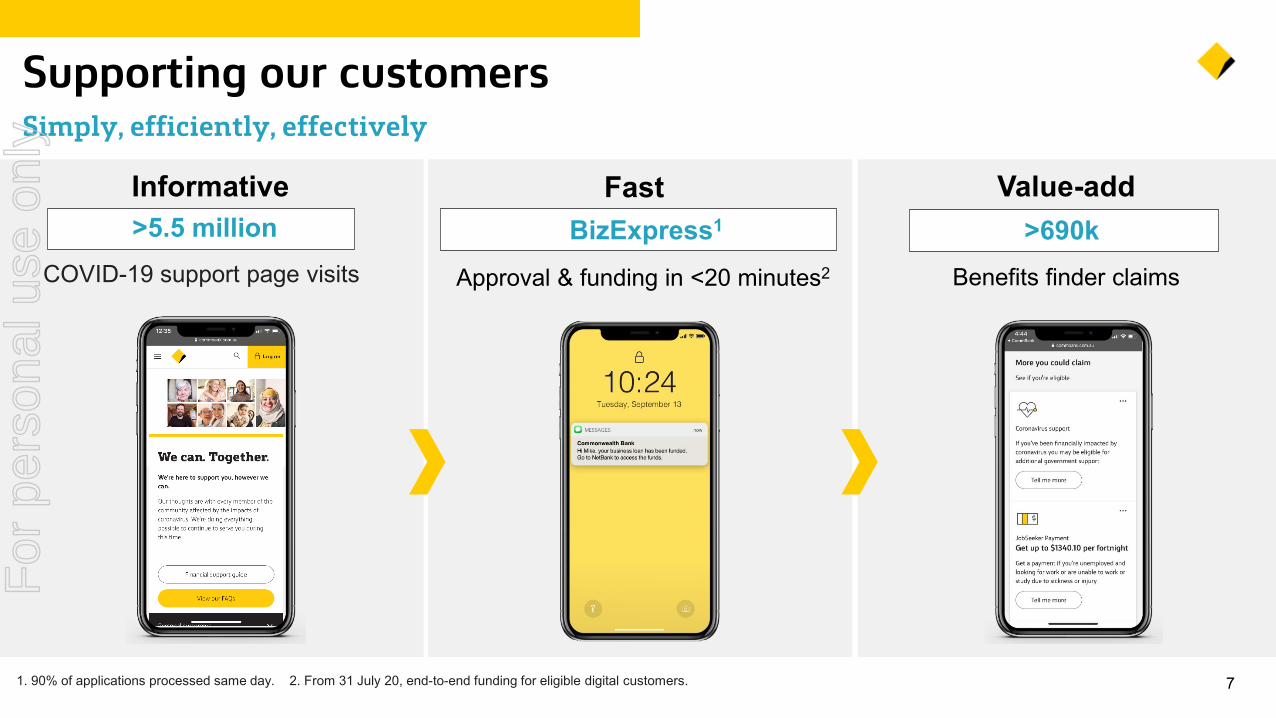
Supporting our customers Simply, efficiently, effectively
Informative Fast Value-add
Benefits finder claims
>5.5 millionCOVID-19 support page visits
BizExpress1 >690kApproval & funding in <20 minutes2
1. 90% of applications processed same day. 2. From 31 July 20, end-to-end funding for eligible digital customers.
For
per
sona
l use
onl
y
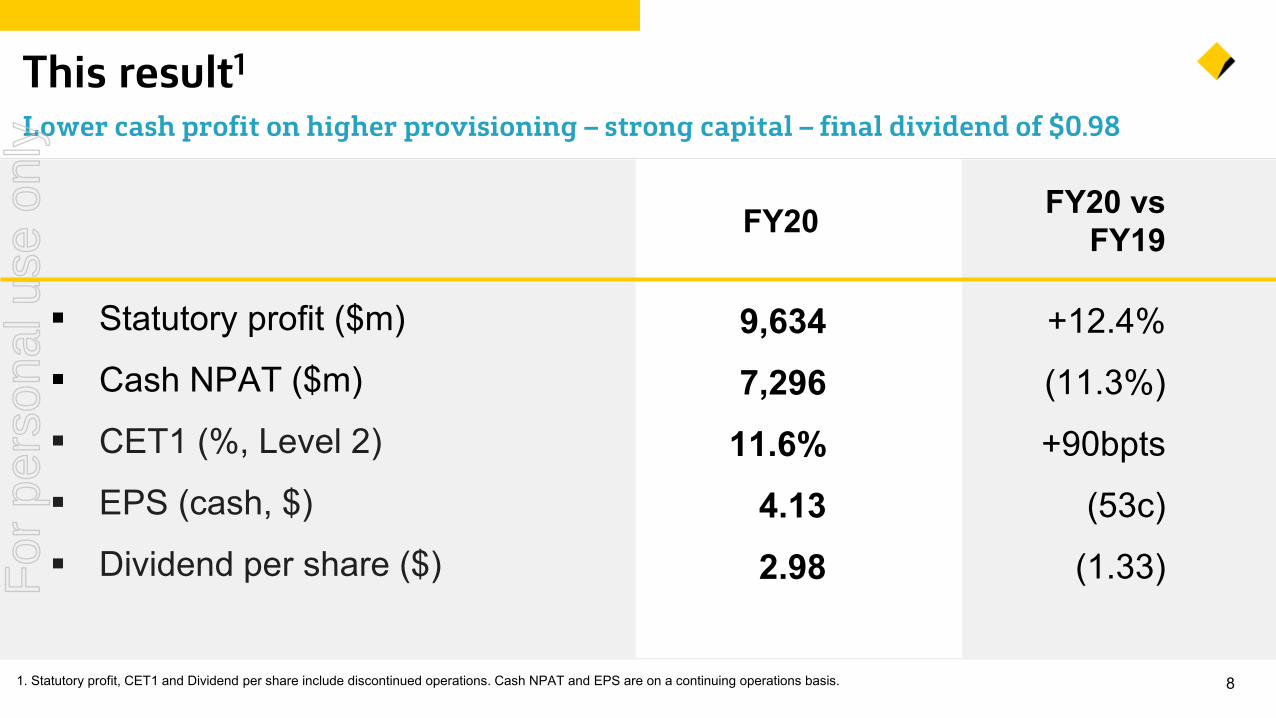
81. Statutory profit, CET1 and Dividend per share include discontinued operations. Cash NPAT and EPS are on a continuing operations basis.
This result1
Lower cash profit on higher provisioning – strong capital – final dividend of $0.98
Statutory profit ($m)
Cash NPAT ($m)
CET1 (%, Level 2)
EPS (cash, $)
Dividend per share ($)
9,6347,296
11.6%4.132.98
FY20 FY20 vs FY19
+12.4%
(11.3%)
+90bpts
(53c)
(1.33)For
per
sona
l use
onl
y
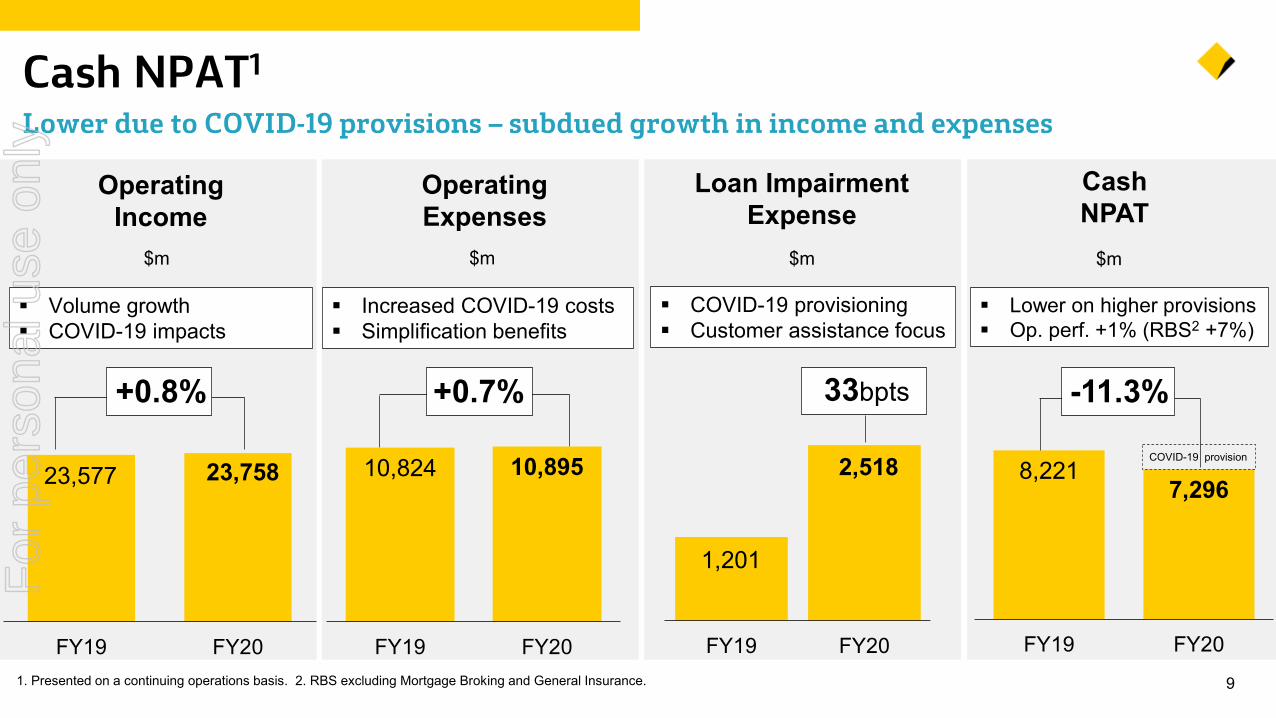
8,2217,296
FY19 FY20
91. Presented on a continuing operations basis. 2. RBS excluding Mortgage Broking and General Insurance.
Cash NPAT1
Lower due to COVID-19 provisions – subdued growth in income and expenses
Loan Impairment Expense
1,201
2,518
FY19 FY20
$m
33bpts
COVID-19 provisioning Customer assistance focus
23,577 23,758
FY19 FY20
10,824 10,895
FY19 FY20
Operating Income
+0.8%
Operating Expenses
+0.7%
$m $m
Increased COVID-19 costs Simplification benefits
Volume growth COVID-19 impacts
$m
Cash NPAT
-11.3%
Lower on higher provisions Op. perf. +1% (RBS2 +7%)
COVID-19 provision
For
per
sona
l use
onl
y
-30-1010305070
-35
-25
-15
-5
5
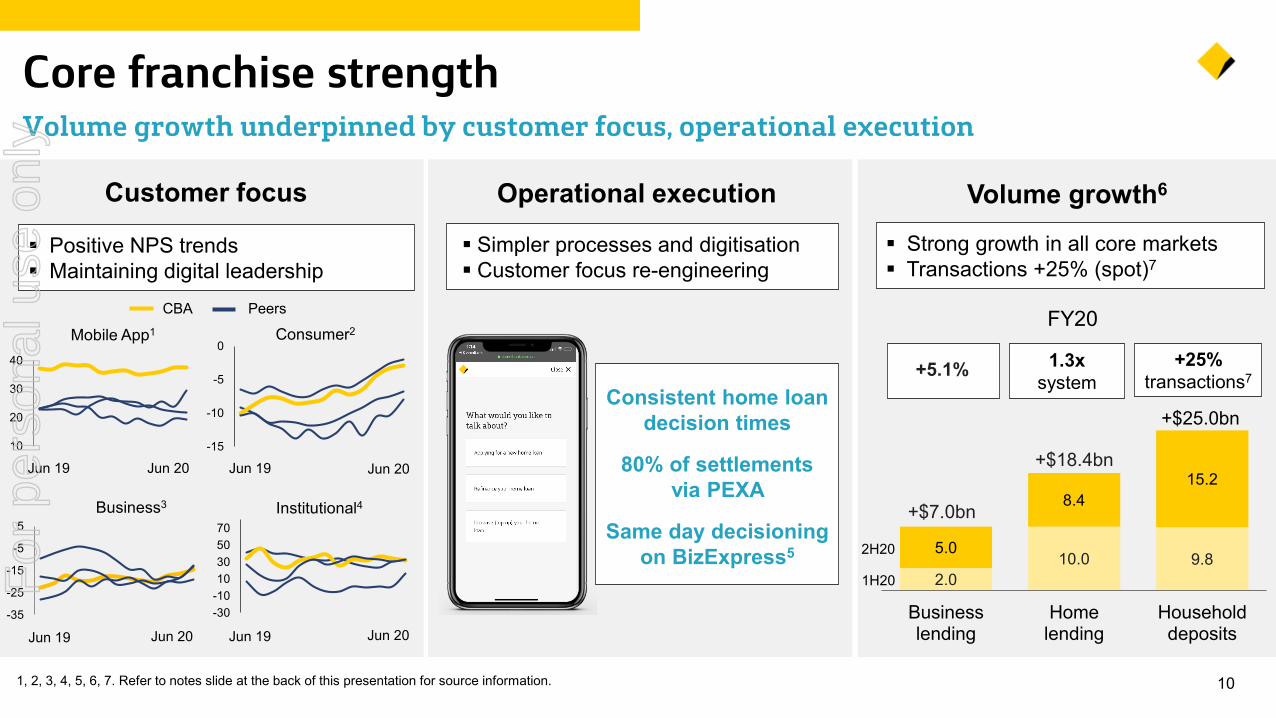
101, 2, 3, 4, 5, 6, 7. Refer to notes slide at the back of this presentation for source information.
Core franchise strengthVolume growth underpinned by customer focus, operational execution
Volume growth6
Strong growth in all core markets Transactions +25% (spot)7
FY20
Customer focus
Positive NPS trends Maintaining digital leadership
Mobile App1
Jun 19-15
-10
-5
0Consumer2
Jun 20Jun 19Jun 20
Business3
Jun 20Jun 19
Institutional4
Jun 20Jun 19
10
20
30
40
2.010.0 9.8
5.0
8.415.2
Businesslending
Homelending
Householddeposits
1.3x system
+25% transactions7
+$18.4bn
+$25.0bn
+$7.0bn
1H20
2H20
+5.1%
PeersCBA
Operational execution
Consistent home loan decision times
80% of settlements via PEXA
Same day decisioningon BizExpress5
Simpler processes and digitisation Customer focus re-engineering
For
per
sona
l use
onl
y
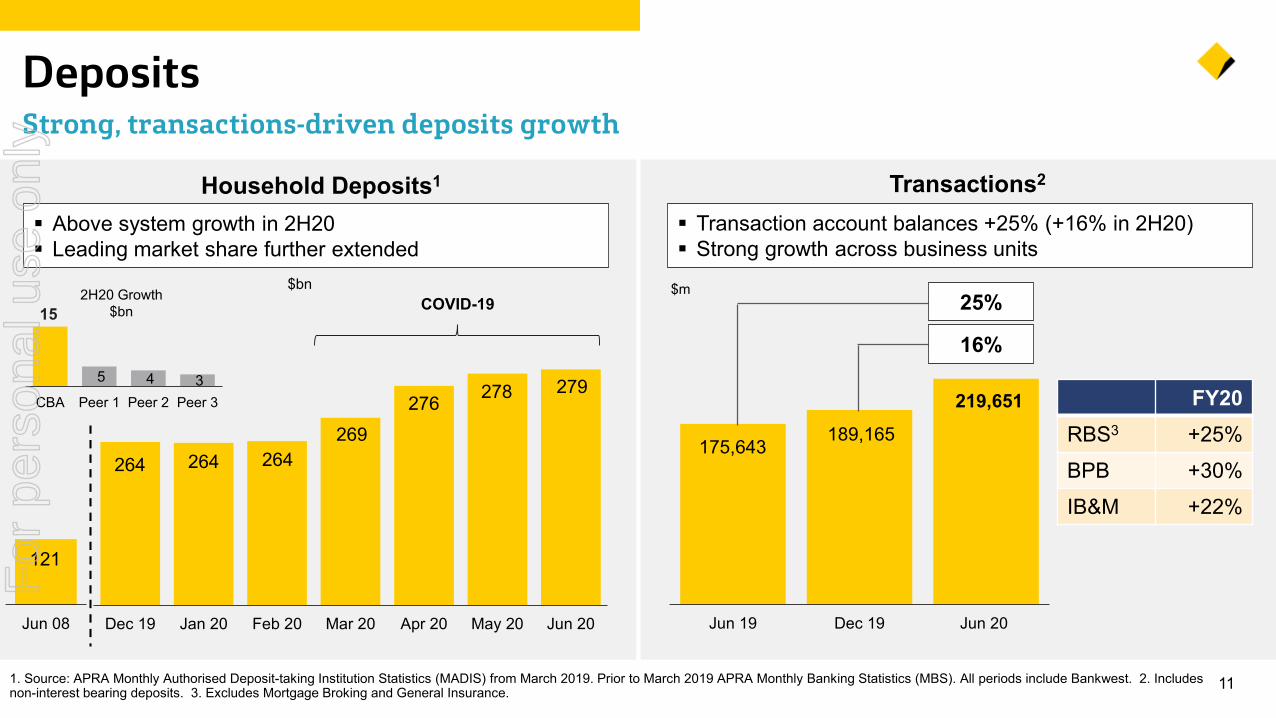
121
Jun 08
175,643 189,165
219,651
Jun 19 Dec 19 Jun 20
264 264 264269
276 278 279
Dec 19 Jan 20 Feb 20 Mar 20 Apr 20 May 20 Jun 20
111. Source: APRA Monthly Authorised Deposit-taking Institution Statistics (MADIS) from March 2019. Prior to March 2019 APRA Monthly Banking Statistics (MBS). All periods include Bankwest. 2. Includes non-interest bearing deposits. 3. Excludes Mortgage Broking and General Insurance.
DepositsStrong, transactions-driven deposits growth
Household Deposits1
2H20 Growth $bn
Above system growth in 2H20 Leading market share further extended
COVID-1915
Transactions2
Transaction account balances +25% (+16% in 2H20) Strong growth across business units
25%
16%
FY20RBS3 +25%BPB +30%IB&M +22%
$m$bn
5 4 3 CBA Peer 1 Peer 2 Peer 3
For
per
sona
l use
onl
y
5.0%
10.7%
11.6%
Jun 08 Jun 19 Jun 20
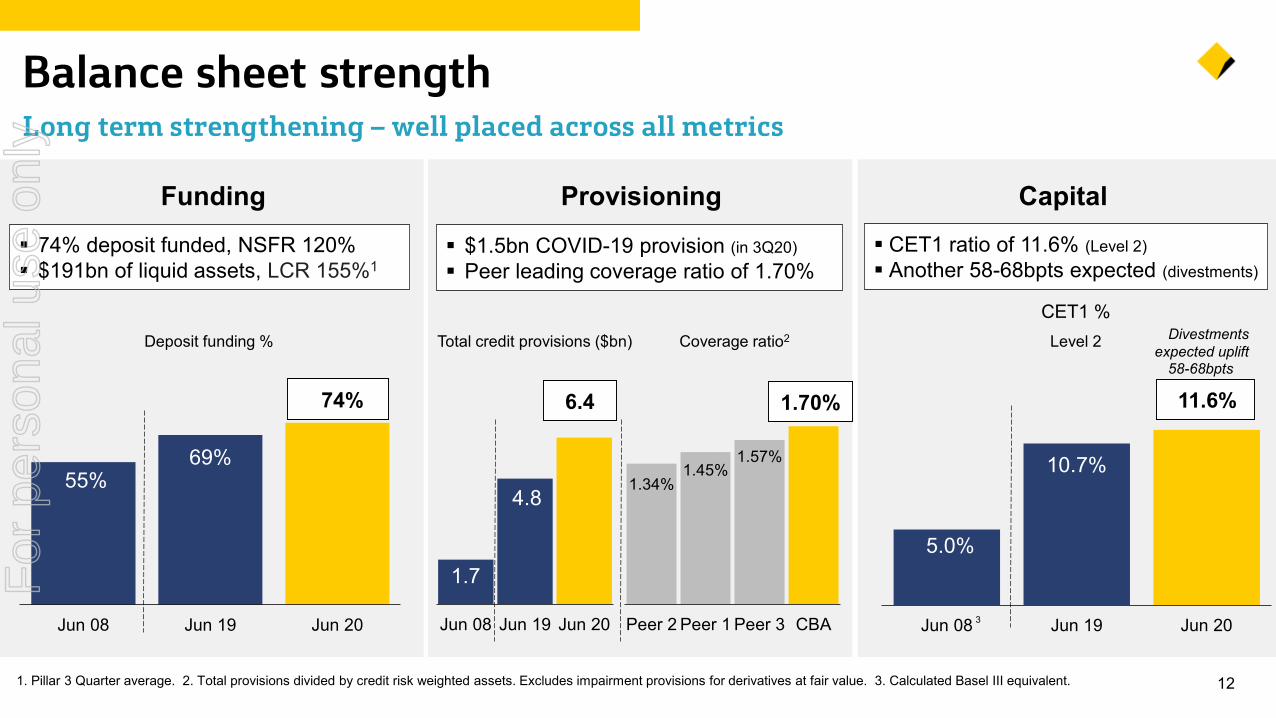
121. Pillar 3 Quarter average. 2. Total provisions divided by credit risk weighted assets. Excludes impairment provisions for derivatives at fair value. 3. Calculated Basel III equivalent.
Balance sheet strength Long term strengthening – well placed across all metrics
1.7
4.8
Jun 08 Jun 19 Jun 20
Provisioning
Total credit provisions ($bn) Coverage ratio2
1.70%6.4
$1.5bn COVID-19 provision (in 3Q20) Peer leading coverage ratio of 1.70%
1.34%1.45%
1.57%
Peer 2 Peer 1 Peer 3 CBA
Capital CET1 ratio of 11.6% (Level 2) Another 58-68bpts expected (divestments)
Level 2
CET1 %
3
Divestments expected uplift
58-68bpts
55%69%
74%
Jun 08 Jun 19 Jun 20
Funding
Deposit funding %
74% deposit funded, NSFR 120% $191bn of liquid assets, LCR 155%1
For
per
sona
l use
onl
y
15%
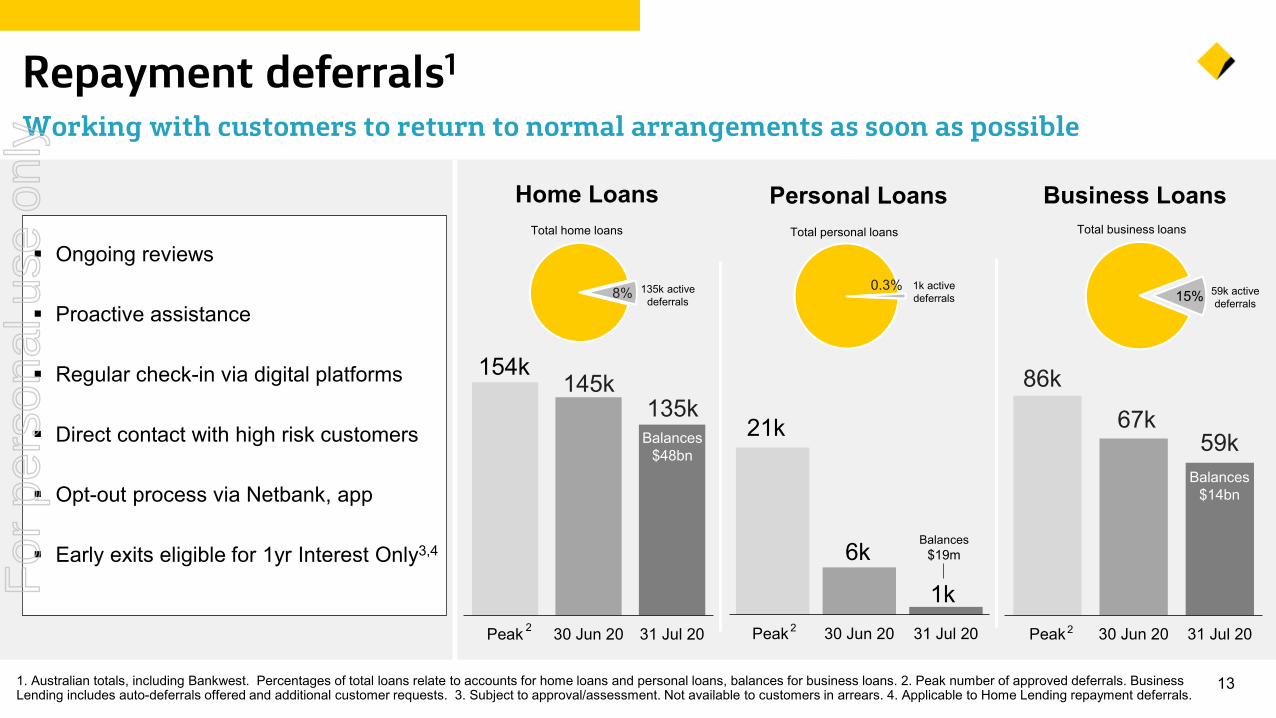
131. Australian totals, including Bankwest. Percentages of total loans relate to accounts for home loans and personal loans, balances for business loans. 2. Peak number of approved deferrals. Business Lending includes auto-deferrals offered and additional customer requests. 3. Subject to approval/assessment. Not available to customers in arrears. 4. Applicable to Home Lending repayment deferrals.
Repayment deferrals1
Working with customers to return to normal arrangements as soon as possible
Ongoing reviews
Proactive assistance
Regular check-in via digital platforms
Direct contact with high risk customers
Opt-out process via Netbank, app
Early exits eligible for 1yr Interest Only3,4
Business LoansTotal business loans
Peak 30 Jun 20 31 Jul 20
6k
Peak 30 Jun 20 31 Jul 20
Home Loans
154k
21k
8% 0.3%
145k 135k
Balances$48bn
1k
Balances$19m
2 2
135k activedeferrals
1k active deferrals
Personal LoansTotal home loans Total personal loans
Peak 30 Jun 20 31 Jul 20
86k
67k59k
Balances$14bn
2
59k active deferrals
For
per
sona
l use
onl
y
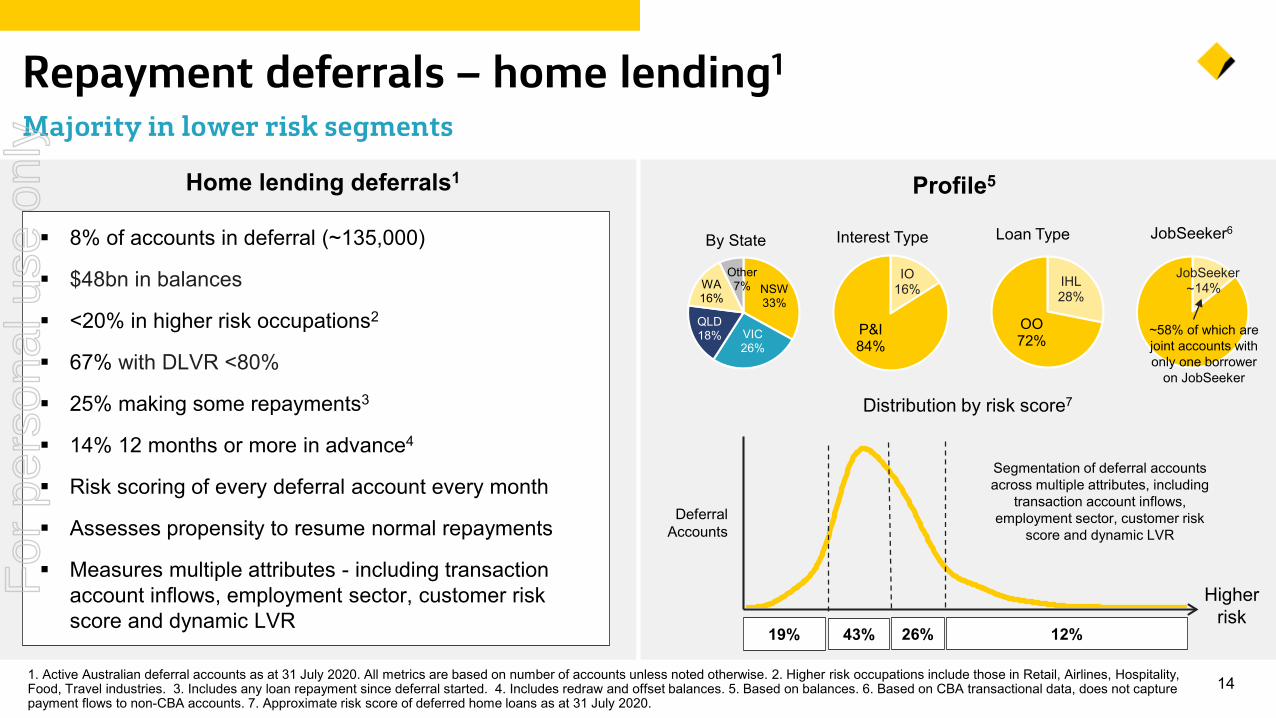
141. Active Australian deferral accounts as at 31 July 2020. All metrics are based on number of accounts unless noted otherwise. 2. Higher risk occupations include those in Retail, Airlines, Hospitality, Food, Travel industries. 3. Includes any loan repayment since deferral started. 4. Includes redraw and offset balances. 5. Based on balances. 6. Based on CBA transactional data, does not capture payment flows to non-CBA accounts. 7. Approximate risk score of deferred home loans as at 31 July 2020.
Repayment deferrals – home lending1
Majority in lower risk segments
Higher risk
Home lending deferrals1 Profile5
Deferral Accounts
Distribution by risk score7
8% of accounts in deferral (~135,000)
$48bn in balances
<20% in higher risk occupations2
67% with DLVR <80%
25% making some repayments3
14% 12 months or more in advance4
Risk scoring of every deferral account every month
Assesses propensity to resume normal repayments
Measures multiple attributes - including transaction account inflows, employment sector, customer risk score and dynamic LVR
IHL28%
OO72%
NSW33%
VIC26%
QLD18%
WA16%
Other7%
By State Loan Type
IO16%
P&I84%
Interest Type JobSeeker6
JobSeeker14%
43%19% 26% 12%
Segmentation of deferral accounts across multiple attributes, including
transaction account inflows, employment sector, customer risk
score and dynamic LVR
~
~58% of which are joint accounts with only one borrower
on JobSeeker
For
per
sona
l use
onl
y
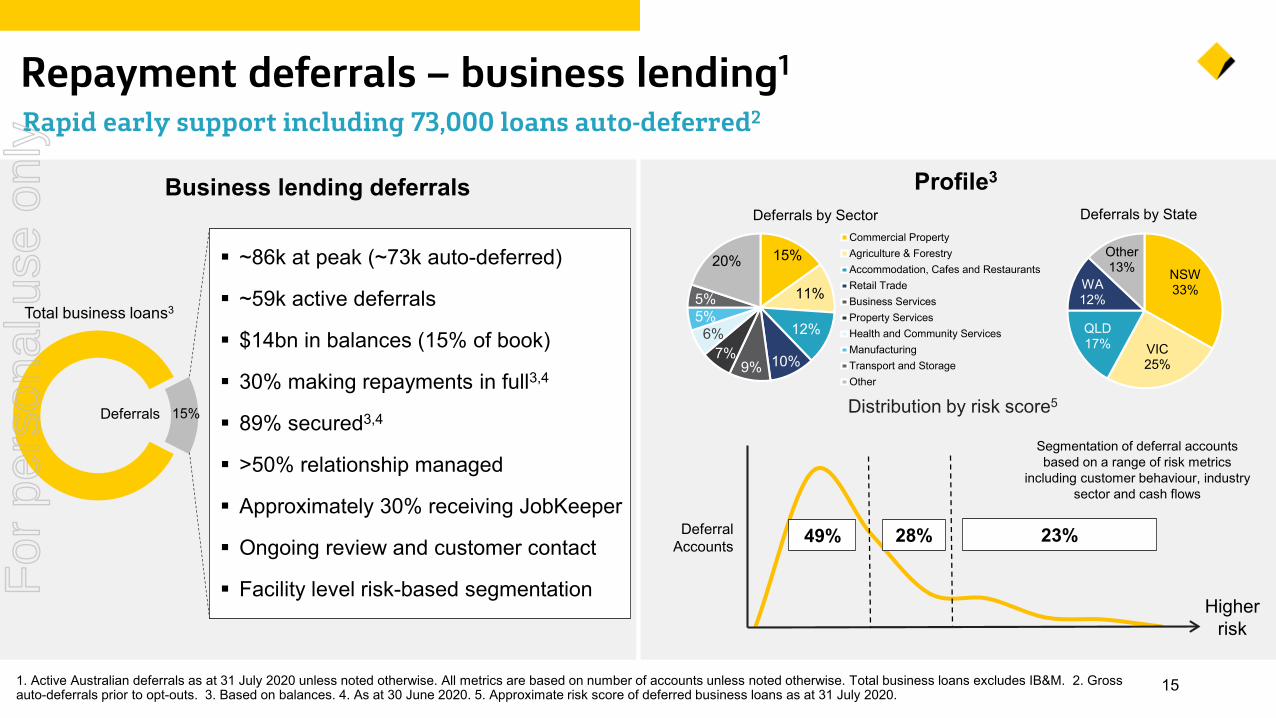
~86k at peak (~73k auto-deferred)
~59k active deferrals
$14bn in balances (15% of book)
30% making repayments in full3,4
89% secured3,4
>50% relationship managed
Approximately 30% receiving JobKeeper
Ongoing review and customer contact
Facility level risk-based segmentation
15%
11%
12%
10%9%7%
6%5%5%
20%Commercial PropertyAgriculture & ForestryAccommodation, Cafes and RestaurantsRetail TradeBusiness ServicesProperty ServicesHealth and Community ServicesManufacturingTransport and StorageOther
15%
15
Repayment deferrals – business lending1
Rapid early support including 73,000 loans auto-deferred2
1. Active Australian deferrals as at 31 July 2020 unless noted otherwise. All metrics are based on number of accounts unless noted otherwise. Total business loans excludes IB&M. 2. Gross auto-deferrals prior to opt-outs. 3. Based on balances. 4. As at 30 June 2020. 5. Approximate risk score of deferred business loans as at 31 July 2020.
Profile3
Distribution by risk score5
NSW33%
VIC25%
QLD17%
WA12%
Other13%
Total business loans3
Business lending deferrals Deferrals by State
Deferrals
Deferrals by Sector
Deferral Accounts
Higher risk
28%49% 23%
Segmentation of deferral accounts based on a range of risk metrics
including customer behaviour, industry sector and cash flows
For
per
sona
l use
onl
y
Simplify our business
16
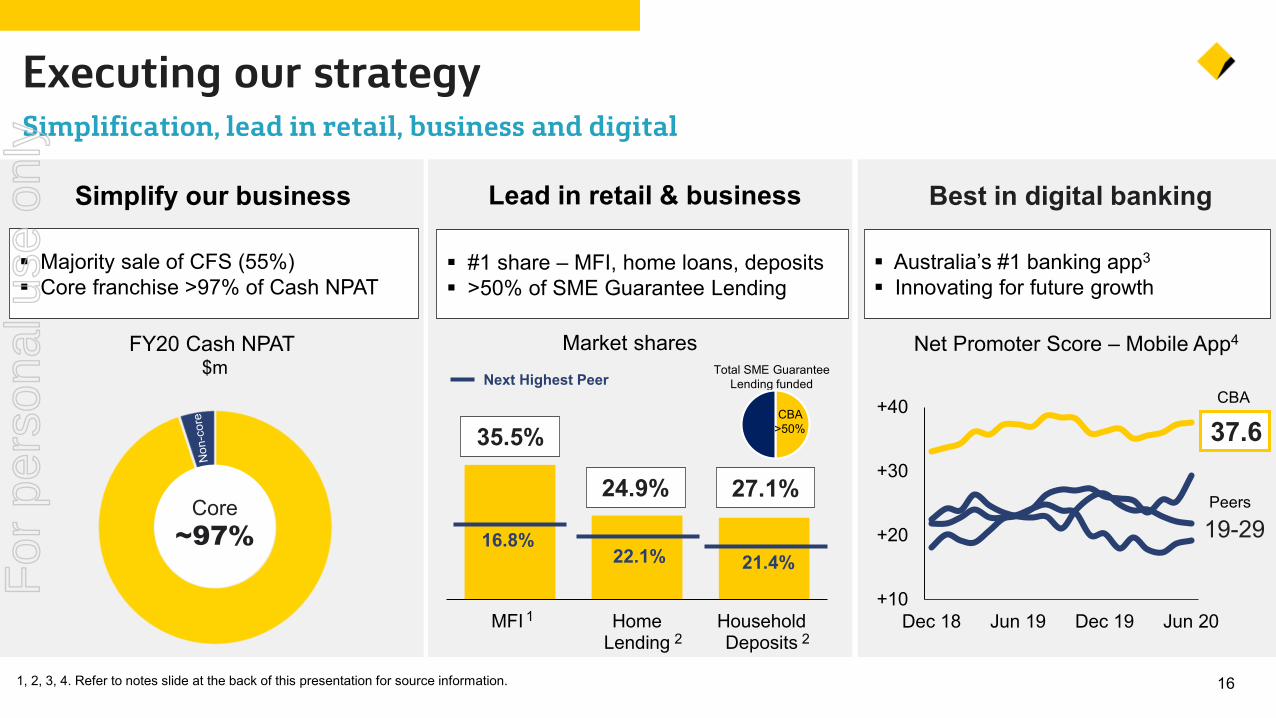
Executing our strategySimplification, lead in retail, business and digital
Lead in retail & business
Majority sale of CFS (55%) Core franchise >97% of Cash NPAT
FY20 Cash NPAT $m
Market shares
37.6
19-29Core
~97%
MFI HomeLending
HouseholdDeposits
35.5%
24.9% 27.1%
Next Highest Peer
16.8%22.1% 21.4%
12 2
Total SME Guarantee Lending funded
CBA>50%
#1 share – MFI, home loans, deposits >50% of SME Guarantee Lending
1, 2, 3, 4. Refer to notes slide at the back of this presentation for source information.
Best in digital banking
Australia’s #1 banking app3
Innovating for future growth
+10
+20
+30
+40
Dec 18 Jun 19 Dec 19 Jun 20
Net Promoter Score – Mobile App4
CBA
Peers
For
per
sona
l use
onl
y
17
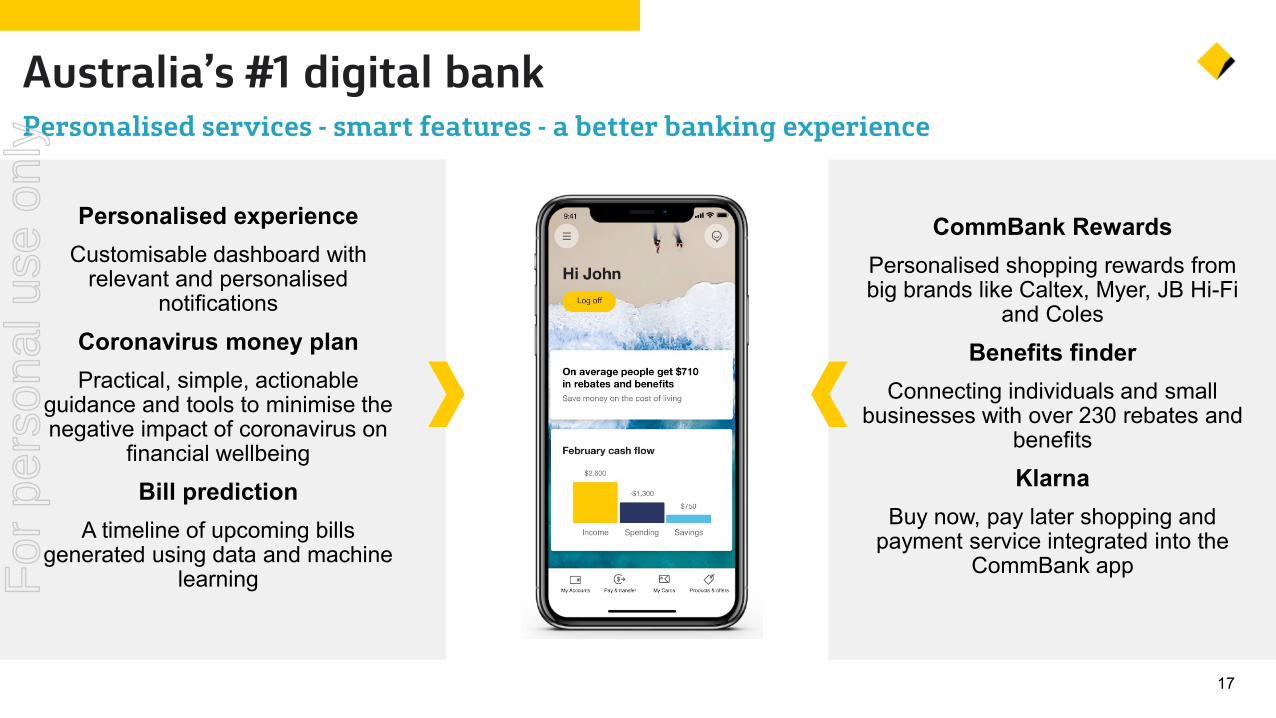
Australia’s #1 digital bankPersonalised services - smart features - a better banking experience
CommBank RewardsPersonalised shopping rewards from big brands like Caltex, Myer, JB Hi-Fi
and Coles
Benefits finder Connecting individuals and small
businesses with over 230 rebates and benefits
KlarnaBuy now, pay later shopping and
payment service integrated into the CommBank app
Personalised experienceCustomisable dashboard with
relevant and personalised notifications
Coronavirus money planPractical, simple, actionable
guidance and tools to minimise the negative impact of coronavirus on
financial wellbeing
Bill predictionA timeline of upcoming bills
generated using data and machine learningF
or p
erso
nal u
se o
nly

Commonwealth Bank of Australia | ACN 123 123 124 | 12 August 2020
Results PresentationAlan Docherty, Chief Financial OfficerF
or p
erso
nal u
se o
nly
19
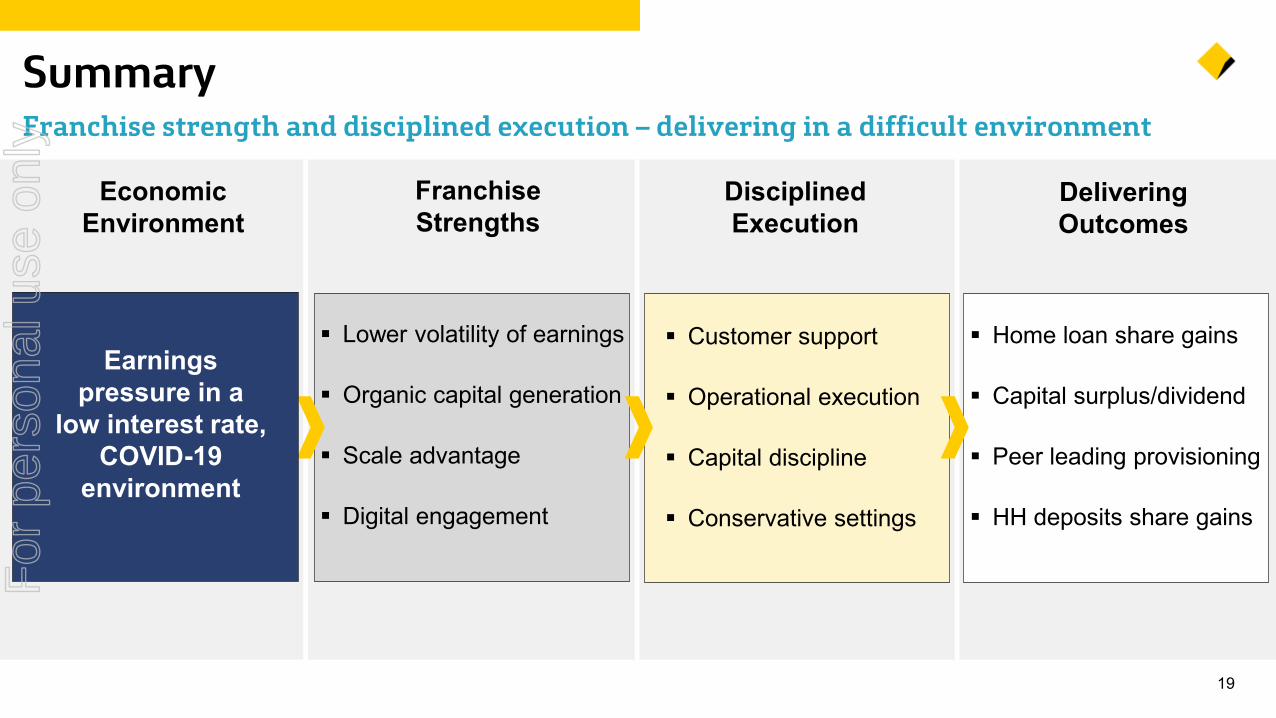
SummaryFranchise strength and disciplined execution – delivering in a difficult environment
Economic Environment
Franchise Strengths
Delivering Outcomes
Earnings pressure in a
low interest rate, COVID-19
environment
Customer support
Operational execution
Capital discipline
Conservative settings
Disciplined Execution
Home loan share gains
Capital surplus/dividend
Peer leading provisioning
HH deposits share gains
Lower volatility of earnings
Organic capital generation
Scale advantage
Digital engagement
For
per
sona
l use
onl
y
201. Includes gains and losses net of transaction and separation costs associated with the disposal of CFS, CFSGAM, Sovereign, TymeDigital SA, PTCL, Count Financial, Aegis, AUSIEX and other businesses, the deconsolidation and divestment of CommInsure Life, the dilution of the Group’s interest in Bank of Hangzhou and demerger costs for NewCo. 2. Includes unrealised accounting gains and losses arising from the application of “AASB 139 Financial Instruments: Recognition and Measurement”.
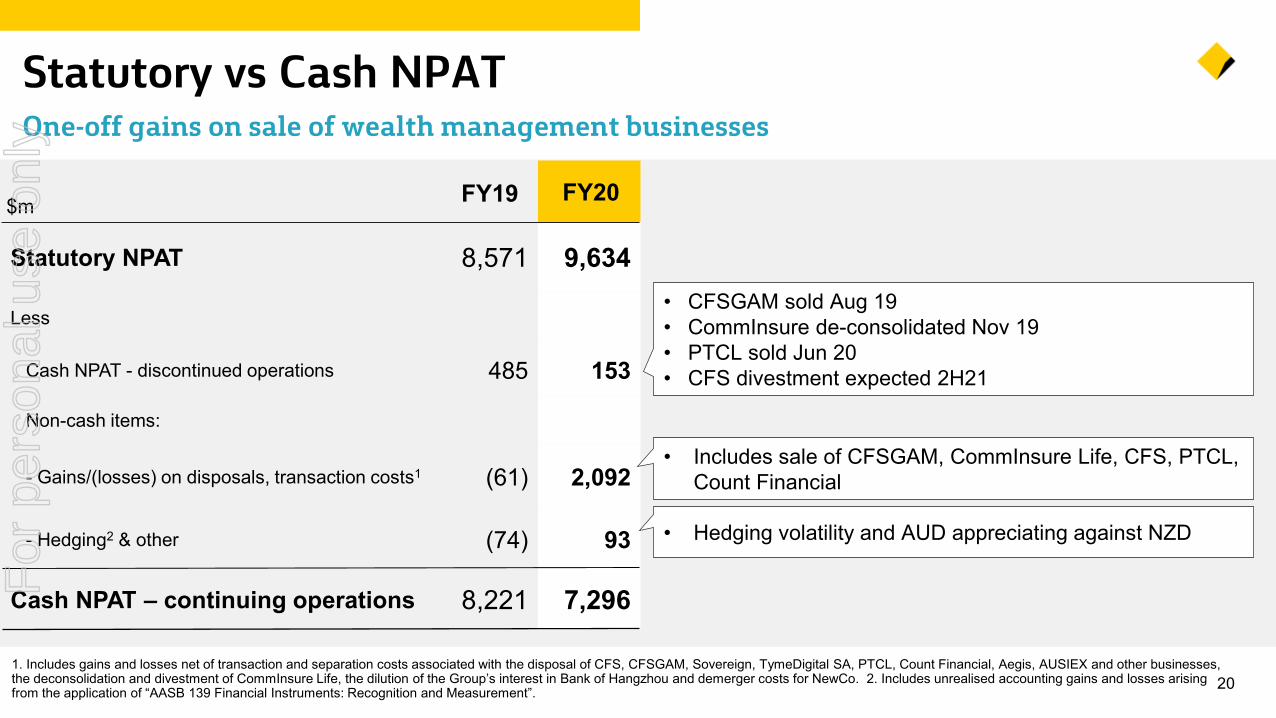
Statutory vs Cash NPAT One-off gains on sale of wealth management businesses
$m
Statutory NPAT 8,571 9,634
Less
Cash NPAT - discontinued operations 485 153
Non-cash items:
- Gains/(losses) on disposals, transaction costs1 (61) 2,092
- Hedging2 & other (74) 93
Cash NPAT – continuing operations 8,221 7,296
• Hedging volatility and AUD appreciating against NZD
• Includes sale of CFSGAM, CommInsure Life, CFS, PTCL, Count Financial
FY19
• CFSGAM sold Aug 19• CommInsure de-consolidated Nov 19• PTCL sold Jun 20 • CFS divestment expected 2H21
FY20
For
per
sona
l use
onl
y
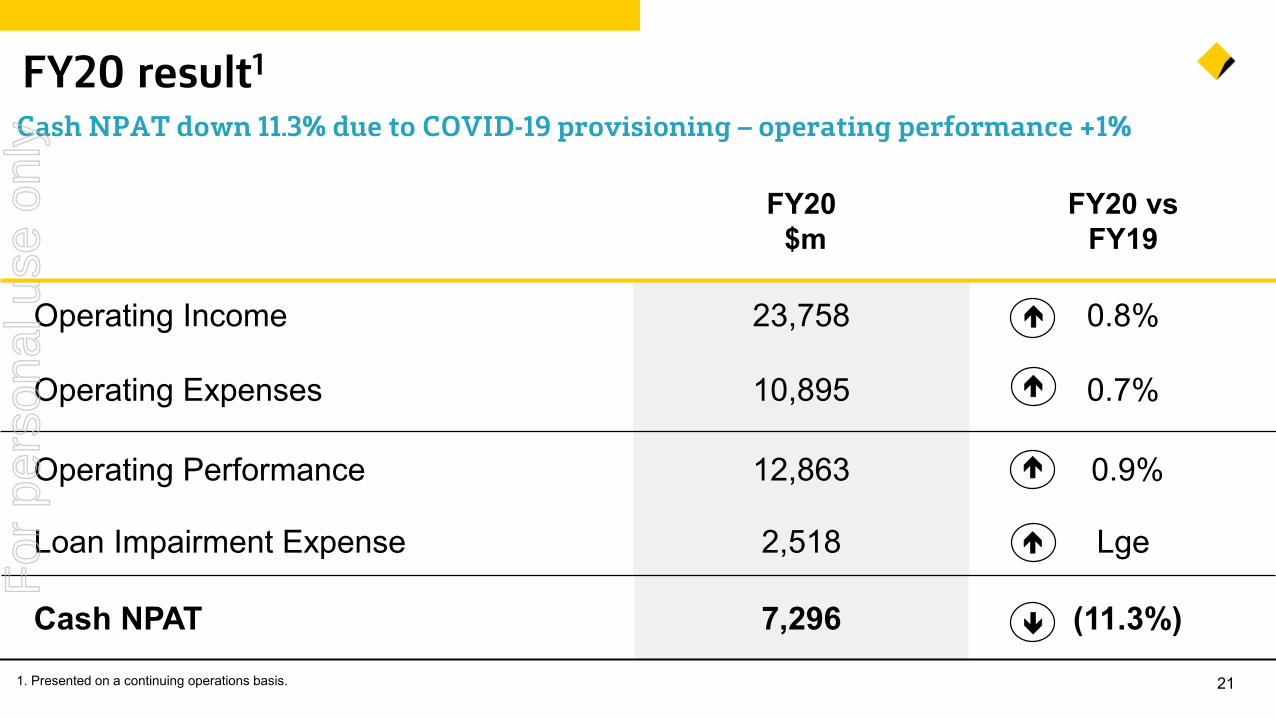
211. Presented on a continuing operations basis.
FY20 result1
Cash NPAT down 11.3% due to COVID-19 provisioning – operating performance +1%
FY20$m
FY20 vsFY19
Operating Income 23,758 0.8%
Operating Expenses 10,895 0.7%
Operating Performance 12,863 0.9%
Loan Impairment Expense 2,518 Lge
Cash NPAT 7,296 (11.3%)
For
per
sona
l use
onl
y
23,577 23,758
386(114)
(91)
FY19 NetInterestIncome
OtherBankingIncome
FundsManagement and Insurance Income
FY20
+0.8%
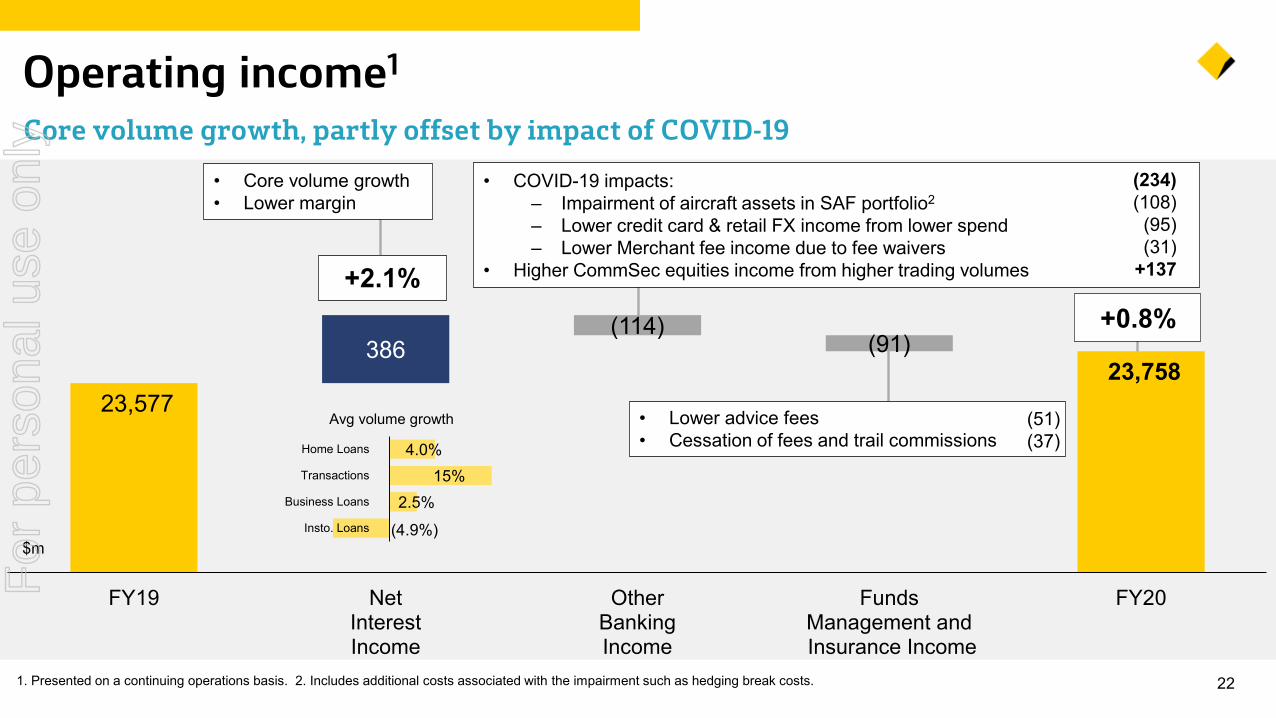
221. Presented on a continuing operations basis. 2. Includes additional costs associated with the impairment such as hedging break costs.
Operating income1
Core volume growth, partly offset by impact of COVID-19• Core volume growth• Lower margin
+2.1%
$m
• Lower advice fees • Cessation of fees and trail commissions
(51)(37)4.0%
15%2.5%
(4.9%)
Home Loans
Transactions
Business Loans
Insto. Loans
Avg volume growth
• COVID-19 impacts:‒ Impairment of aircraft assets in SAF portfolio2
‒ Lower credit card & retail FX income from lower spend‒ Lower Merchant fee income due to fee waivers
• Higher CommSec equities income from higher trading volumes
(234)(108)
(95)(31)
+137
For
per
sona
l use
onl
y
1 1 1 211
204
1H20 AssetPricing
Deposit Pricing& Funding
CapitalEarnings
HigherLiquids
PortfolioMix
Basis Risk(incl RP)
GlobalMarkets
2H20
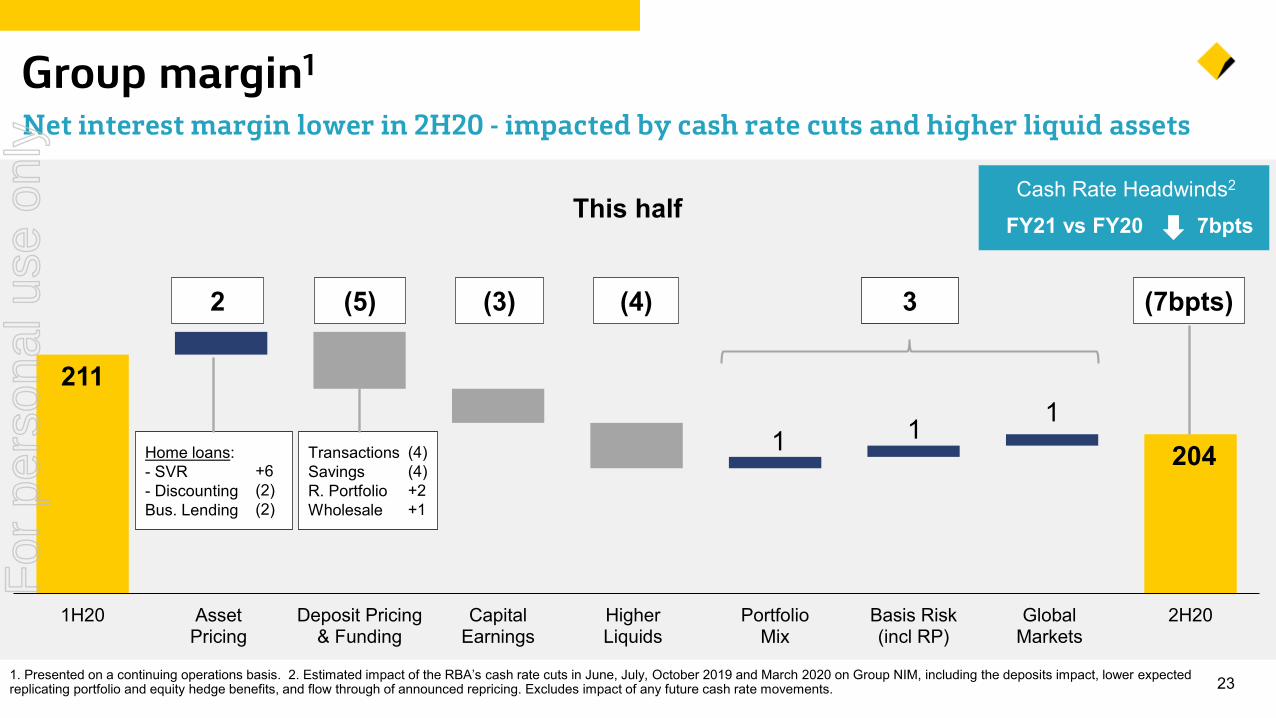
231. Presented on a continuing operations basis. 2. Estimated impact of the RBA’s cash rate cuts in June, July, October 2019 and March 2020 on Group NIM, including the deposits impact, lower expected replicating portfolio and equity hedge benefits, and flow through of announced repricing. Excludes impact of any future cash rate movements.
Group margin1
Net interest margin lower in 2H20 - impacted by cash rate cuts and higher liquid assets
This half
(7bpts)
FY21 vs FY20 7bptsCash Rate Headwinds2
3
Transactions SavingsR. PortfolioWholesale
(4)(4)+2+1
Home loans: - SVR - Discounting Bus. Lending
+6(2)(2)
2 (5) (3) (4)
For
per
sona
l use
onl
y
145 41 39 585 (381)
(358)
10,824 10,895
FY19 Non-recurrenceof 1H19 AUSTRAC
insurance recoveries
Customerand other
remediation
Risk &Complianceprograms,and other
Enhanced risk& resiliencycapability
Staff, IT,and other
BusinessSimplification
FY20
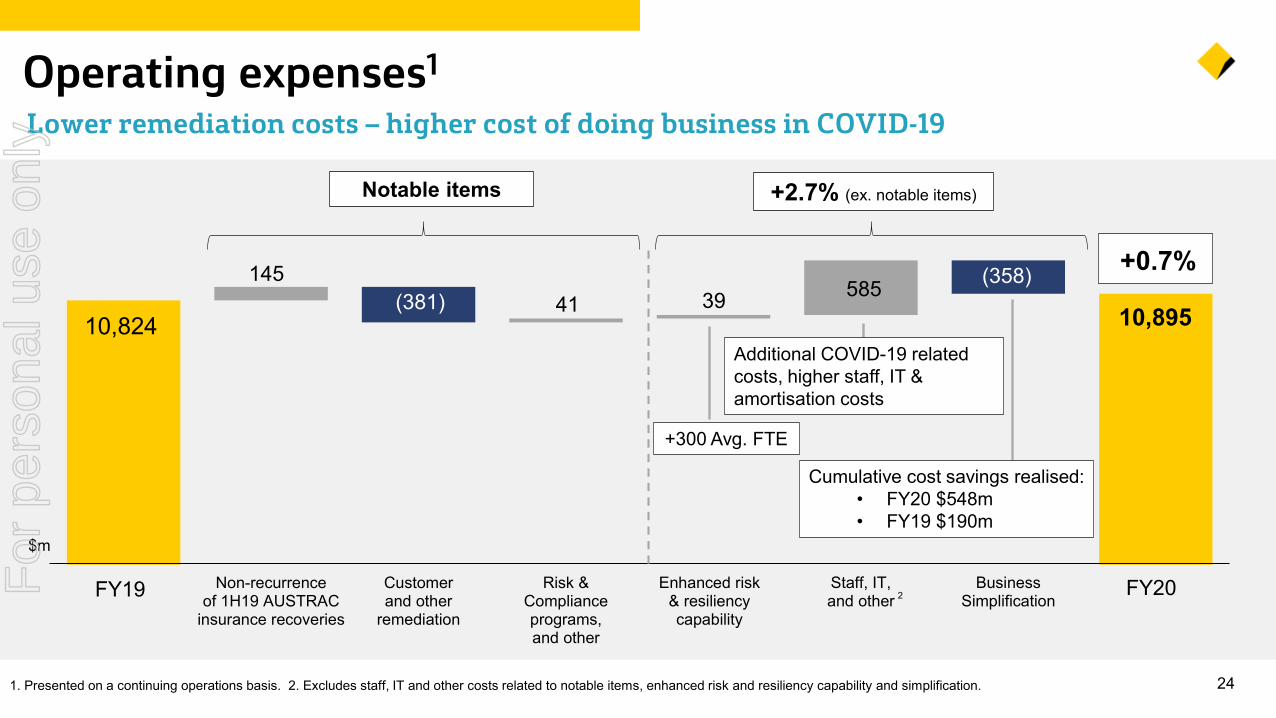
241. Presented on a continuing operations basis. 2. Excludes staff, IT and other costs related to notable items, enhanced risk and resiliency capability and simplification.
Operating expenses1
Lower remediation costs – higher cost of doing business in COVID-19
$m
FY19 FY20
Cumulative cost savings realised:• FY20 $548m• FY19 $190m
+0.7%
+300 Avg. FTE
+2.7% (ex. notable items)Notable items
2
Additional COVID-19 related costs, higher staff, IT & amortisation costs
For
per
sona
l use
onl
y
25
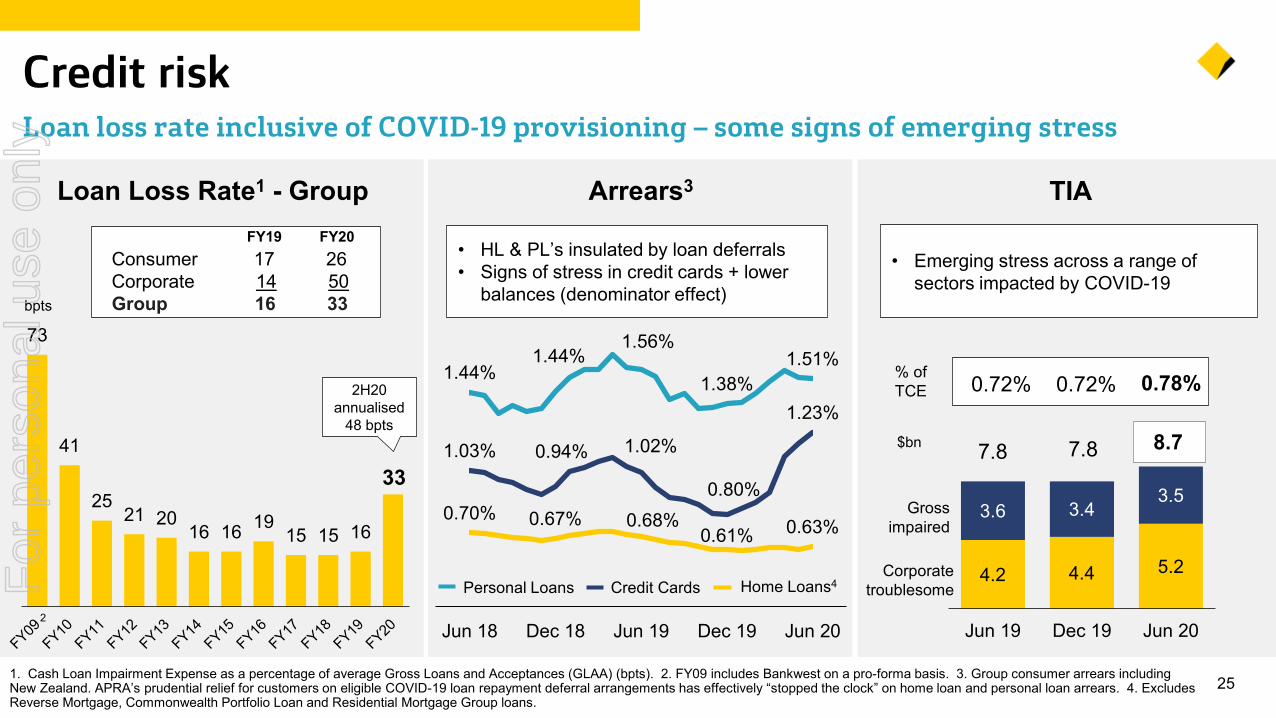
Credit risk
Arrears3
Personal Loans Home Loans4Credit Cards
• HL & PL’s insulated by loan deferrals• Signs of stress in credit cards + lower
balances (denominator effect)
Loan loss rate inclusive of COVID-19 provisioning – some signs of emerging stress
73
41
2521 20
16 16 1915 15 16
33
Loan Loss Rate1 - Group
2
0.70% 0.67% 0.68%0.61% 0.63%
1.44%1.44%
1.56%
1.38%1.51%
1.03% 0.94% 1.02%
0.80%
1.23%
Jun 18 Dec 18 Jun 19 Dec 19 Jun 20
TIA
• Emerging stress across a range of sectors impacted by COVID-19
$bn
% of TCE 0.72% 0.72%
Gross impaired
Corporate troublesome
0.78%
4.2 4.4 5.2
3.6 3.43.5
7.8 7.8 8.7
Jun 19 Dec 19 Jun 20
Consumer 17 26 Corporate 14 50Group 16 33
FY19 FY20
bpts
2H20 annualised
48 bpts
1. Cash Loan Impairment Expense as a percentage of average Gross Loans and Acceptances (GLAA) (bpts). 2. FY09 includes Bankwest on a pro-forma basis. 3. Group consumer arrears including New Zealand. APRA’s prudential relief for customers on eligible COVID-19 loan repayment deferral arrangements has effectively “stopped the clock” on home loan and personal loan arrears. 4. Excludes Reverse Mortgage, Commonwealth Portfolio Loan and Residential Mortgage Group loans.
For
per
sona
l use
onl
y
1.7%3.3%
Dec 19 Jun 20
3.0%4.9%
Dec 19 Jun 20
3.4%4.8%
Dec 19 Jun 20
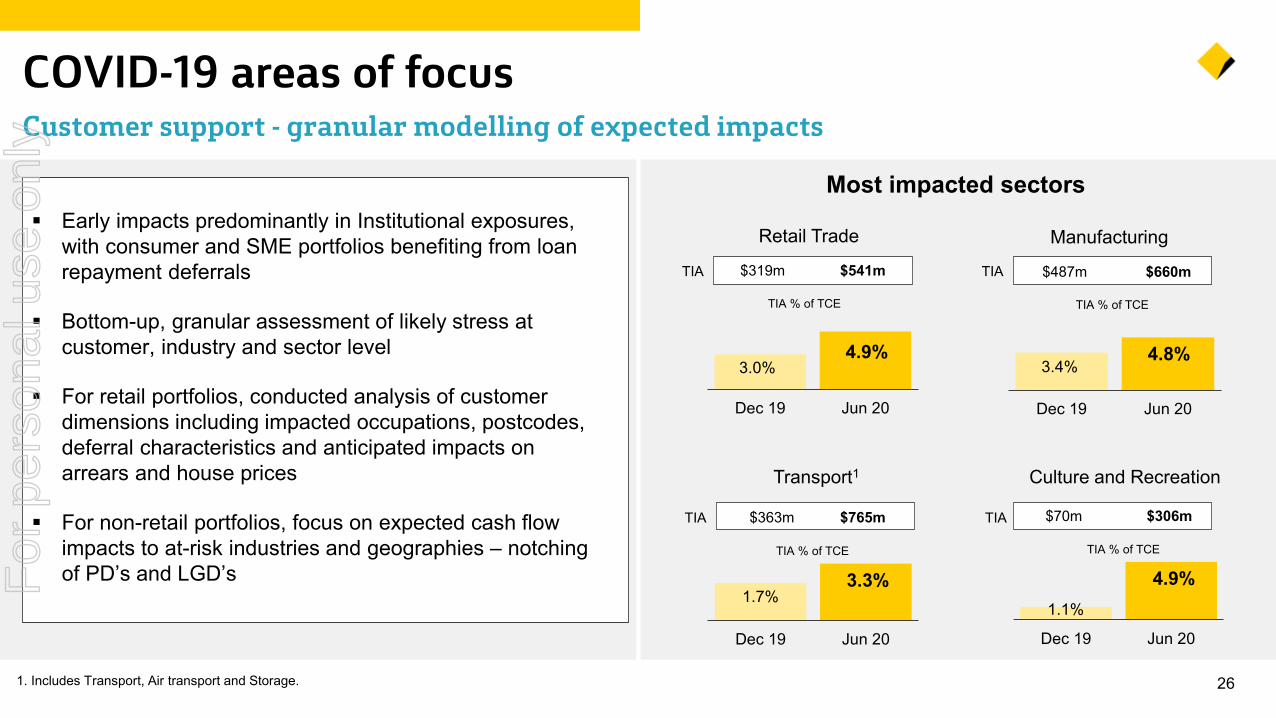
261. Includes Transport, Air transport and Storage.
COVID-19 areas of focusCustomer support - granular modelling of expected impacts
Retail Trade
Culture and Recreation Transport1
Manufacturing
TIA % of TCE
Most impacted sectors Early impacts predominantly in Institutional exposures,
with consumer and SME portfolios benefiting from loan repayment deferrals
Bottom-up, granular assessment of likely stress at customer, industry and sector level
For retail portfolios, conducted analysis of customer dimensions including impacted occupations, postcodes, deferral characteristics and anticipated impacts on arrears and house prices
For non-retail portfolios, focus on expected cash flow impacts to at-risk industries and geographies – notching of PD’s and LGD’s
1.1%
4.9%
Dec 19 Jun 20
TIA % of TCE
TIA % of TCE TIA % of TCE
TIA $319m $541m TIA $487m $660m
TIA $363m $765m TIA $70m $306m
For
per
sona
l use
onl
y
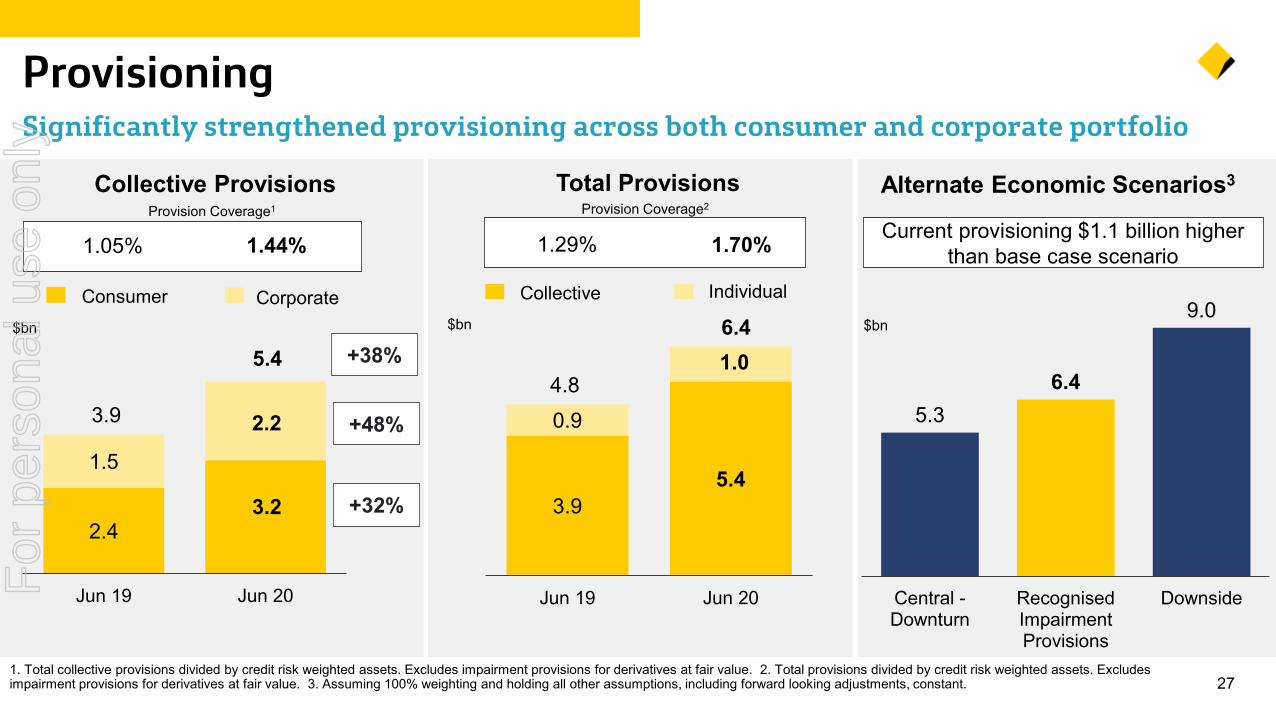
3.95.4
0.9
1.04.8
6.4
Jun 19 Jun 20
271. Total collective provisions divided by credit risk weighted assets. Excludes impairment provisions for derivatives at fair value. 2. Total provisions divided by credit risk weighted assets. Excludes impairment provisions for derivatives at fair value. 3. Assuming 100% weighting and holding all other assumptions, including forward looking adjustments, constant.
Provisioning Significantly strengthened provisioning across both consumer and corporate portfolio
2.43.2
1.5
2.23.9
5.4
Jun 19 Jun 20
$bn
Provision Coverage2
Collective Provisions Total Provisions
Consumer Corporate Collective Individual
1.44%Provision Coverage1
1.05% 1.70%1.29%
$bn
5.36.4
9.0
Central -Downturn
RecognisedImpairmentProvisions
Downside
$bn
Alternate Economic Scenarios3
Current provisioning $1.1 billion higher than base case scenario
+38%
+48%
+32%
For
per
sona
l use
onl
y
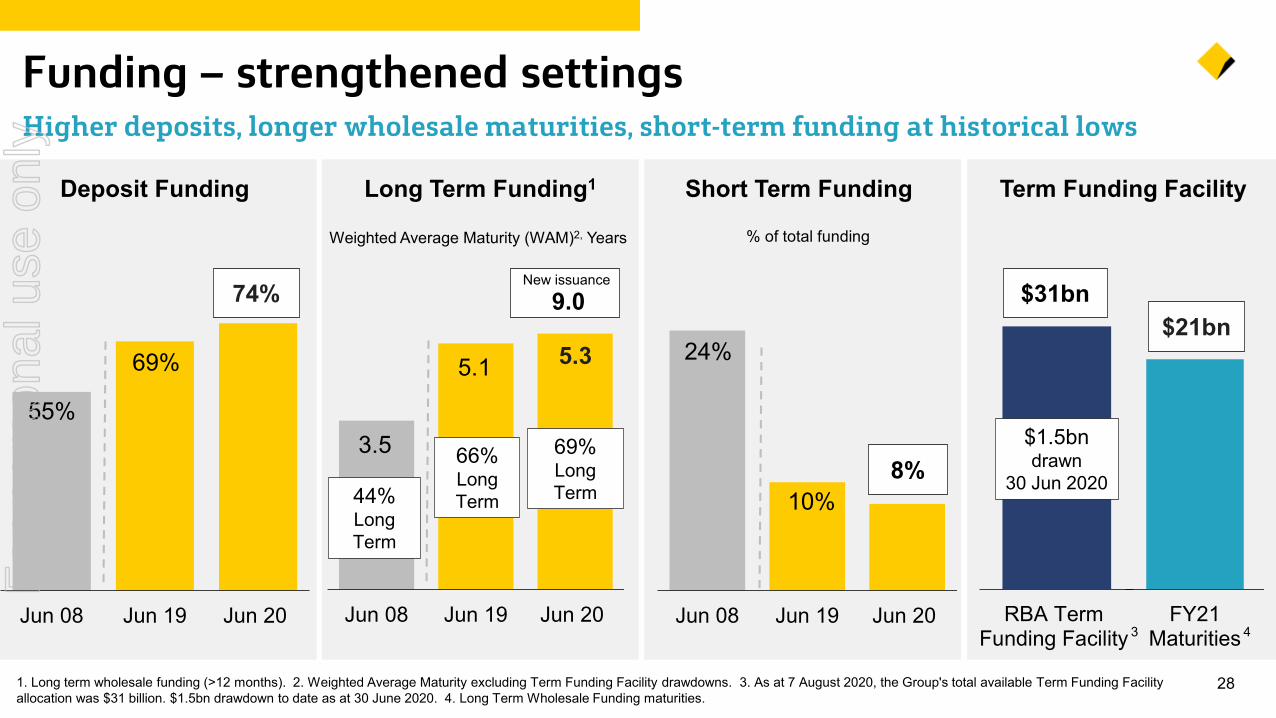
281. Long term wholesale funding (>12 months). 2. Weighted Average Maturity excluding Term Funding Facility drawdowns. 3. As at 7 August 2020, the Group's total available Term Funding Facility allocation was $31 billion. $1.5bn drawdown to date as at 30 June 2020. 4. Long Term Wholesale Funding maturities.
Funding – strengthened settingsHigher deposits, longer wholesale maturities, short-term funding at historical lows
Long Term Funding1 Term Funding Facility
Jun 08 Jun 19 Jun 20
5.35.1
69% Long Term
66% Long Term
Weighted Average Maturity (WAM)2, Years
New issuance
9.0
RBA TermFunding Facility
$31bn
FY21Maturities
$21bn
$1.5bndrawn
30 Jun 202044% Long Term
3.5
Deposit Funding
Jun 08 Jun 19 Jun 20
69%
74%
55%
Short Term Funding
Jun 08 Jun 19 Jun 20
% of total funding
24%
8%10%
3 4
For
per
sona
l use
onl
y
26 95 5(79) (43) (14)10.7% 11.7% 10.9% 11.6%
Jun 19Level 2
Dec 19Level 2
1H20 Dividend Divestments Provisions Cash NPAT(ex provisions)
RWA Other Jun 20Level 2
35 392156
Historical Average FY20
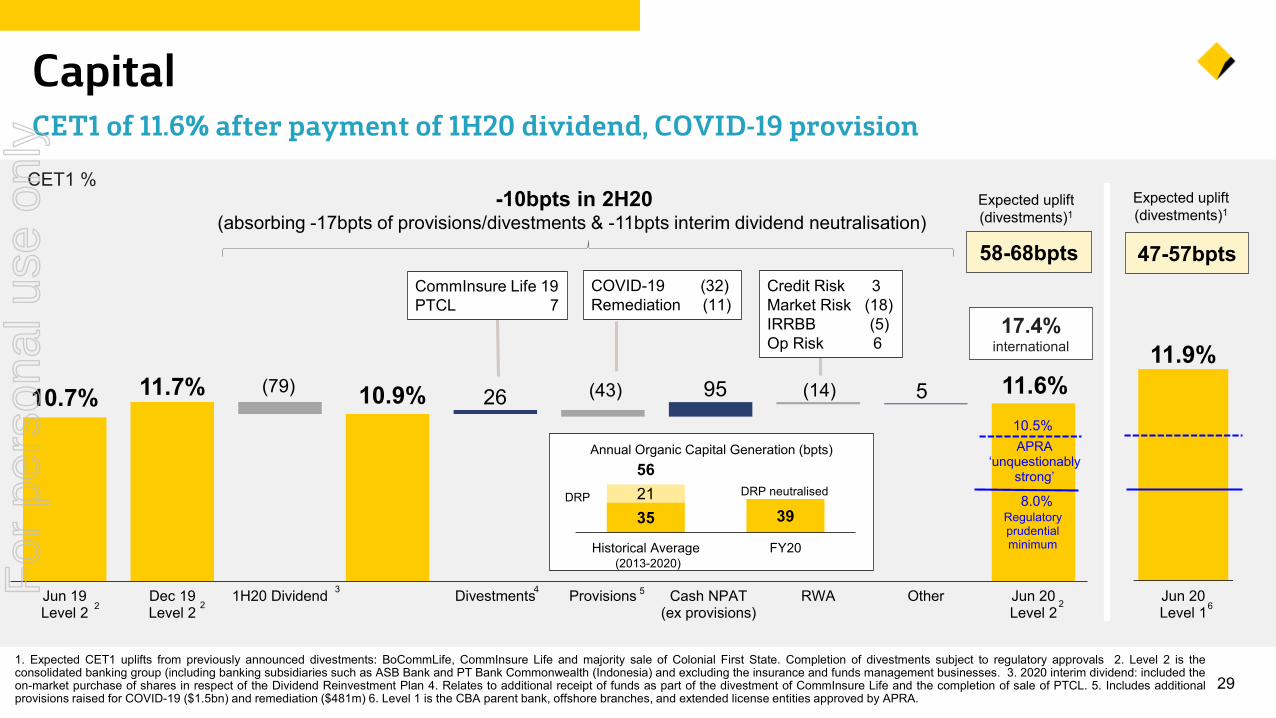
291. Expected CET1 uplifts from previously announced divestments: BoCommLife, CommInsure Life and majority sale of Colonial First State. Completion of divestments subject to regulatory approvals 2. Level 2 is theconsolidated banking group (including banking subsidiaries such as ASB Bank and PT Bank Commonwealth (Indonesia) and excluding the insurance and funds management businesses. 3. 2020 interim dividend: included theon-market purchase of shares in respect of the Dividend Reinvestment Plan 4. Relates to additional receipt of funds as part of the divestment of CommInsure Life and the completion of sale of PTCL. 5. Includes additionalprovisions raised for COVID-19 ($1.5bn) and remediation ($481m) 6. Level 1 is the CBA parent bank, offshore branches, and extended license entities approved by APRA.
CapitalCET1 of 11.6% after payment of 1H20 dividend, COVID-19 provision
CET1 %
CommInsure Life 19PTCL 7
Regulatory prudential minimum
3
2 24 5
Expected uplift (divestments)1
17.4%international
10.5%
8.0%
58-68bpts
2
COVID-19 (32)Remediation (11)
Credit Risk 3Market Risk (18)IRRBB (5)Op Risk 6
APRA ‘unquestionably
strong’
-10bpts in 2H20(absorbing -17bpts of provisions/divestments & -11bpts interim dividend neutralisation)
Annual Organic Capital Generation (bpts)
DRP
11.9%
Jun 20Level 16
Expected uplift (divestments)1
47-57bpts
DRP neutralised
(2013-2020)For
per
sona
l use
onl
y
Lvl 1Lvl 2
10.7% 10.6%
11.7%
10.7%
11.6%11.2% 11.0%
12.1%
11.1%
11.9%
Jun 19 Sep 19 Dec 19 Mar 20 Jun 20
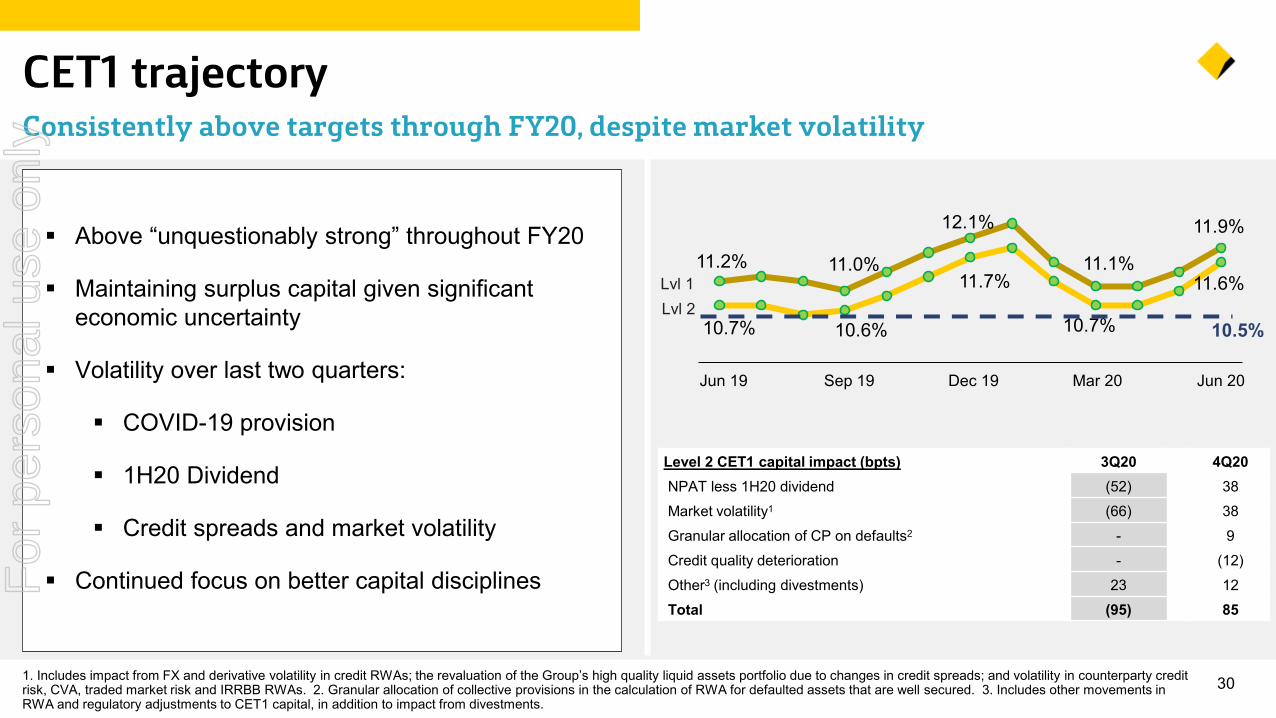
301. Includes impact from FX and derivative volatility in credit RWAs; the revaluation of the Group’s high quality liquid assets portfolio due to changes in credit spreads; and volatility in counterparty credit risk, CVA, traded market risk and IRRBB RWAs. 2. Granular allocation of collective provisions in the calculation of RWA for defaulted assets that are well secured. 3. Includes other movements in RWA and regulatory adjustments to CET1 capital, in addition to impact from divestments.
CET1 trajectoryConsistently above targets through FY20, despite market volatility
10.5%
Above “unquestionably strong” throughout FY20
Maintaining surplus capital given significant economic uncertainty
Volatility over last two quarters:
COVID-19 provision
1H20 Dividend
Credit spreads and market volatility
Continued focus on better capital disciplines
Level 2 CET1 capital impact (bpts) 3Q20 4Q20NPAT less 1H20 dividend (52) 38Market volatility1 (66) 38Granular allocation of CP on defaults2 - 9Credit quality deterioration - (12)Other3 (including divestments) 23 12Total (95) 85
Jun 19 Sep 19 Dec 19 Mar 20 Jun 20
For
per
sona
l use
onl
y
$1.99 $2.00 $2.00 $2.00
$2.30 $2.31 $2.31
$0.98 2
$4.29 $4.31 $4.31
75%
80% 88%
71%
FY17 FY18 FY19 FY20
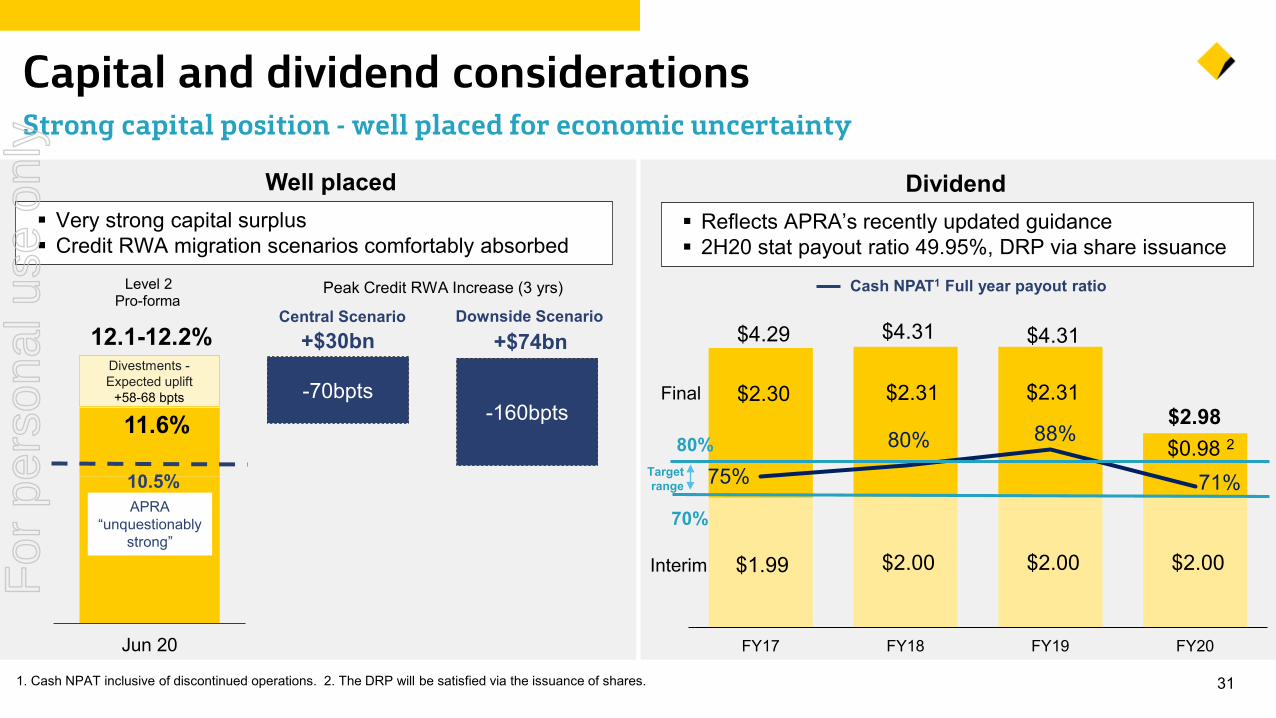
311. Cash NPAT inclusive of discontinued operations. 2. The DRP will be satisfied via the issuance of shares.
Capital and dividend considerationsStrong capital position - well placed for economic uncertainty
Dividend
Jun 20
Level 2
12.1-12.2%Divestments -Expected uplift
+58-68 bpts
11.6%
Pro-forma
Very strong capital surplus Credit RWA migration scenarios comfortably absorbed
10.5%APRA
“unquestionably strong”
Reflects APRA’s recently updated guidance 2H20 stat payout ratio 49.95%, DRP via share issuance
Cash NPAT1 Full year payout ratio
-70bpts-160bpts
Well placed
Peak Credit RWA Increase (3 yrs)
+$30bn +$74bn
Target range
80%
70%
Central Scenario Downside Scenario
Final
Interim
$2.98
For
per
sona
l use
onl
y
32
Economic OutlookSupporting our customers - prepared for a range of economic outcomes
Continued uncertainty in all major economies
Australia and New Zealand relatively well positioned
‒ Starting from position of fiscal and economic strength
‒ Strong mining exports, agriculture recovery, infrastructure pipeline
‒ Significant and effective income support measures in place
Base case similar to Reserve Bank – prepared for a range of scenarios
Upside and downside risks
‒ Management of the virus – test, trace and isolate effectiveness
‒ Vaccine development and treatment improvements
‒ Business and consumer confidence – demand and job creation
For
per
sona
l use
onl
y
1yr 5yr 10yr
33
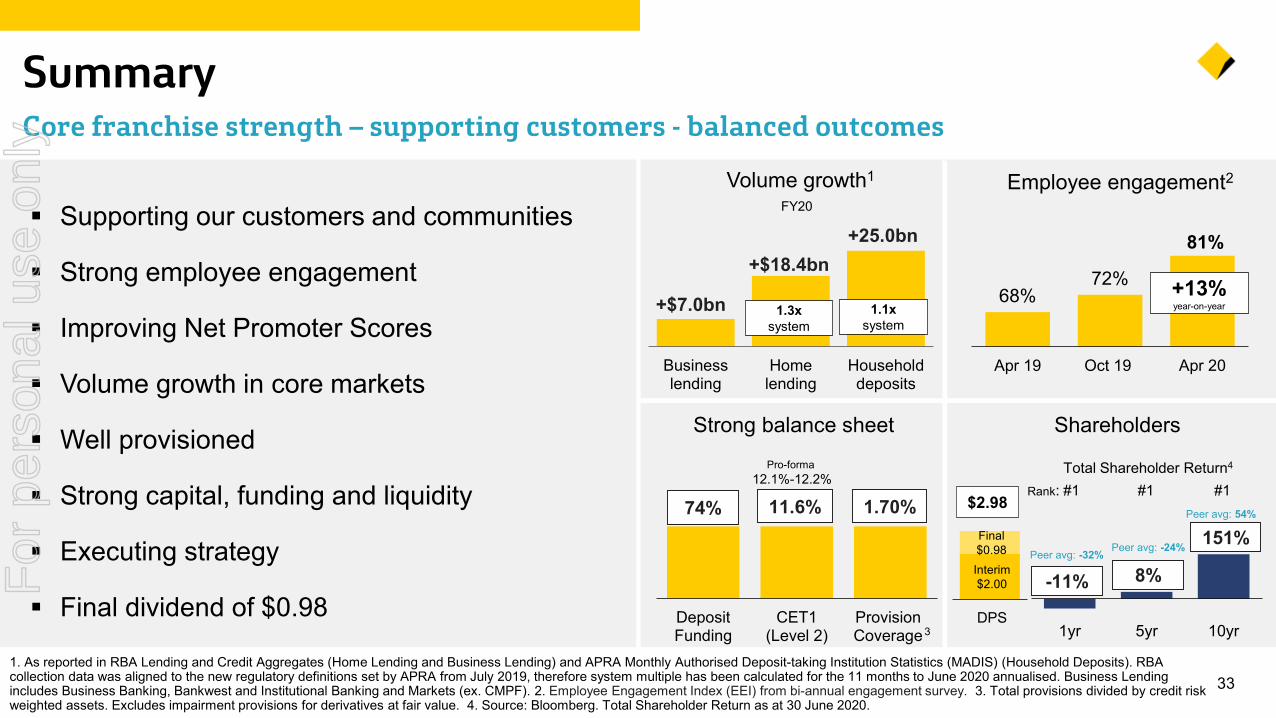
SummaryCore franchise strength – supporting customers - balanced outcomes
Supporting our customers and communities
Strong employee engagement
Improving Net Promoter Scores
Volume growth in core markets
Well provisioned
Strong capital, funding and liquidity
Executing strategy
Final dividend of $0.98 DepositFunding
CET1(Level 2)
ProvisionCoverage
Strong balance sheet
Volume growth1
Businesslending
Homelending
Householddeposits
+$18.4bn+25.0bn
+$7.0bn 1.3x system
1.1x system
74%
68%72%
81%
Apr 19 Oct 19 Apr 20
Employee engagement2
+13%year-on-year
Pro-forma12.1%-12.2%
11.6% 1.70%
Total Shareholder Return4
Shareholders
-11% 8%
151%
FY20
3
1. As reported in RBA Lending and Credit Aggregates (Home Lending and Business Lending) and APRA Monthly Authorised Deposit-taking Institution Statistics (MADIS) (Household Deposits). RBA collection data was aligned to the new regulatory definitions set by APRA from July 2019, therefore system multiple has been calculated for the 11 months to June 2020 annualised. Business Lending includes Business Banking, Bankwest and Institutional Banking and Markets (ex. CMPF). 2. Employee Engagement Index (EEI) from bi-annual engagement survey. 3. Total provisions divided by credit risk weighted assets. Excludes impairment provisions for derivatives at fair value. 4. Source: Bloomberg. Total Shareholder Return as at 30 June 2020.
Rank: #1 #1 #1
Peer avg: -32% Peer avg: -24%
Peer avg: 54%
CBA
$2.98
Final $0.98Interim $2.00
DPS
For
per
sona
l use
onl
y

34
Overview & StrategyFor
per
sona
l use
onl
y
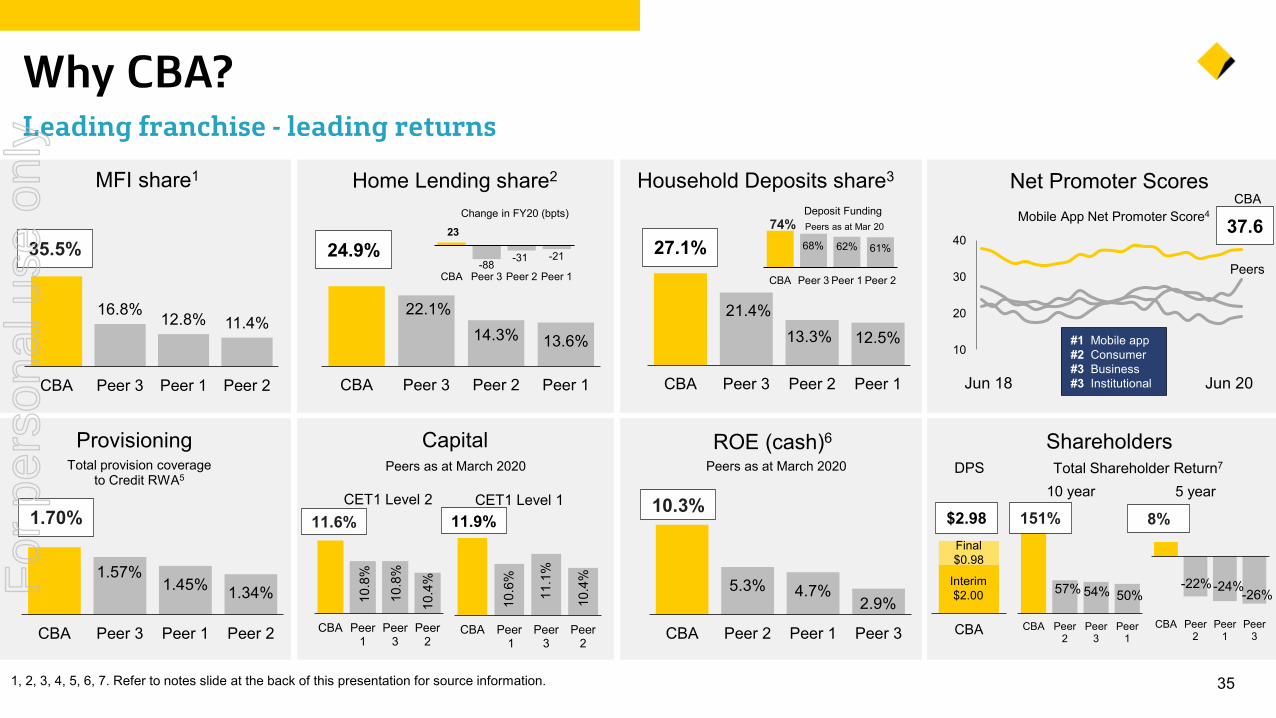
-22%-24%-26%
CBA Peer2
Peer1
Peer3
351, 2, 3, 4, 5, 6, 7. Refer to notes slide at the back of this presentation for source information.
Why CBA?Leading franchise - leading returns
CapitalTotal Shareholder Return7
57% 54% 50%
CBA Peer2
Peer3
Peer1
10 year 5 year
151% 8%
Provisioning ShareholdersDPS
1.70%
Total provision coverage to Credit RWA5
68% 62% 61%
CBA Peer 3 Peer 1 Peer 2
74%Deposit FundingPeers as at Mar 20
5.3% 4.7%2.9%
CBA Peer 2 Peer 1 Peer 3
10.3%
ROE (cash)6
Peers as at March 2020
16.8% 12.8% 11.4%
CBA Peer 3 Peer 1 Peer 2
MFI share1
35.5%
Net Promoter ScoresMobile App Net Promoter Score4
Jun 18 Jun 20
#1 Mobile app#2 Consumer #3 Business#3 Institutional
37.6
Peers as at March 2020
10.6
%
11.1
%
10.4
%
CBA Peer 1
Peer3
Peer2
CET1 Level 1 11.9%
10.8
%
10.8
%
10.4
%
CBA Peer1
Peer3
Peer2
CET1 Level 2 11.6%
1.57%1.45% 1.34%
CBA Peer 3 Peer 1 Peer 2
10
20
30
40
Home Lending share2 Household Deposits share3
27.1%
22.1%14.3% 13.6%
CBA Peer 3 Peer 2 Peer 1
21.4%13.3% 12.5%
CBA Peer 3 Peer 2 Peer 1
24.9%
Change in FY20 (bpts)
23
-88 -31 -21
CBA Peer 3 Peer 2 Peer 1
CBA
$2.98Final $0.98
Interim $2.00
CBA
Peers
For
per
sona
l use
onl
y
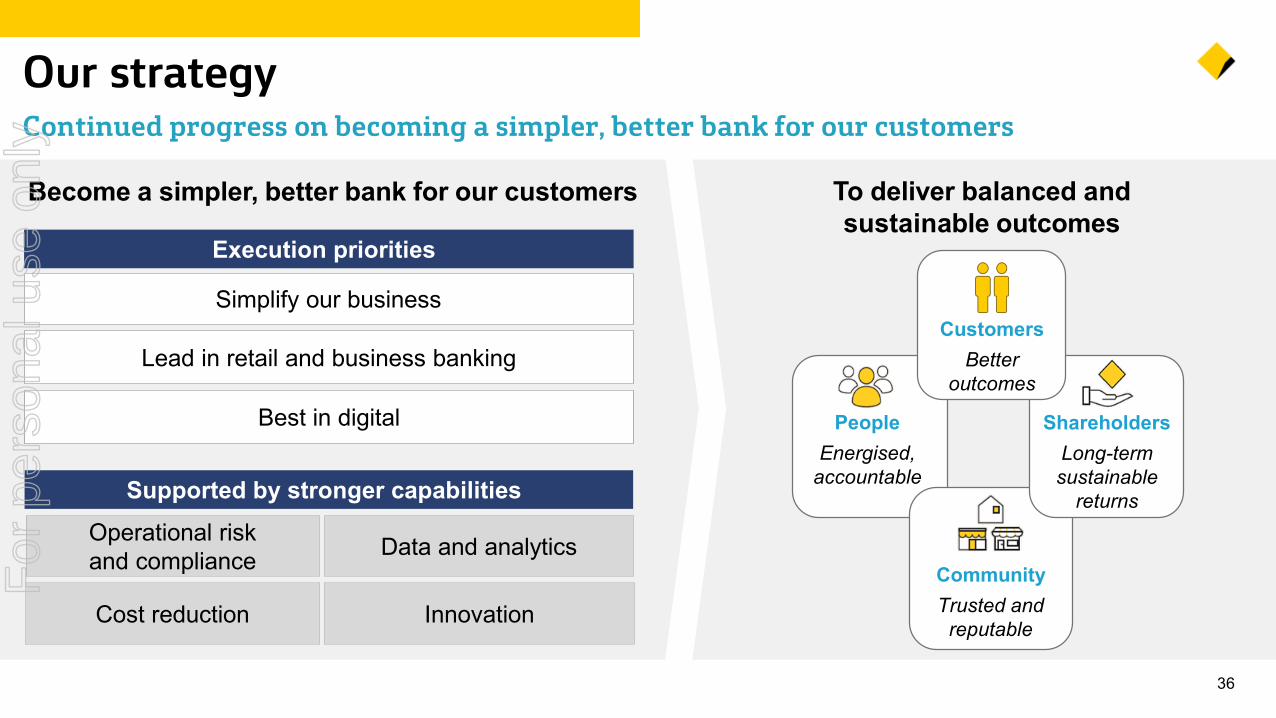
36
Our strategyContinued progress on becoming a simpler, better bank for our customers
Supported by stronger capabilities
Execution priorities
Operational risk and compliance Data and analytics
Innovation
Simplify our business
Lead in retail and business banking
Best in digital
Cost reduction
To deliver balanced andsustainable outcomes
PeopleEnergised,
accountable
CommunityTrusted and
reputable
ShareholdersLong-term sustainable
returns
CustomersBetter
outcomes
Become a simpler, better bank for our customers
For
per
sona
l use
onl
y
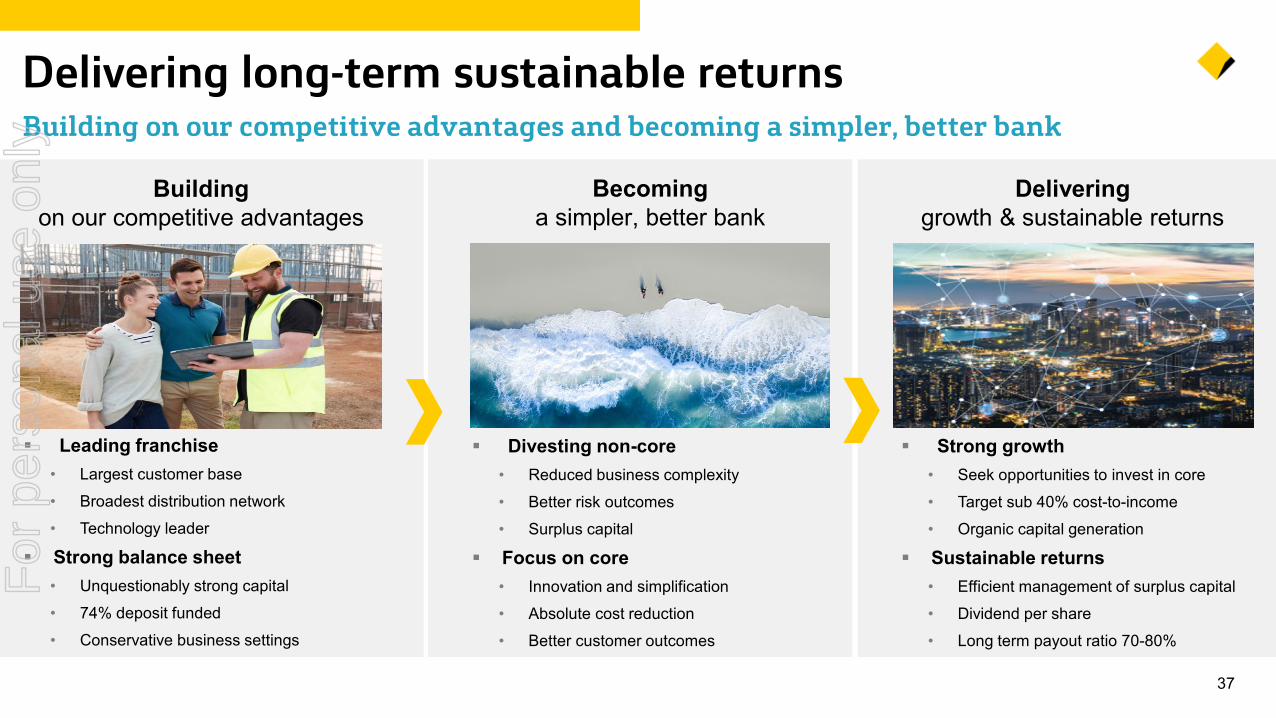
37
Delivering long-term sustainable returns Building on our competitive advantages and becoming a simpler, better bank
Buildingon our competitive advantages
Becominga simpler, better bank
Delivering growth & sustainable returns
Divesting non-core• Reduced business complexity• Better risk outcomes• Surplus capital
Focus on core• Innovation and simplification• Absolute cost reduction • Better customer outcomes
Strong growth• Seek opportunities to invest in core• Target sub 40% cost-to-income• Organic capital generation
Sustainable returns • Efficient management of surplus capital• Dividend per share• Long term payout ratio 70-80%
Leading franchise • Largest customer base• Broadest distribution network• Technology leader
Strong balance sheet• Unquestionably strong capital• 74% deposit funded• Conservative business settings
For
per
sona
l use
onl
y
Jun 20
CET1 Impact
38
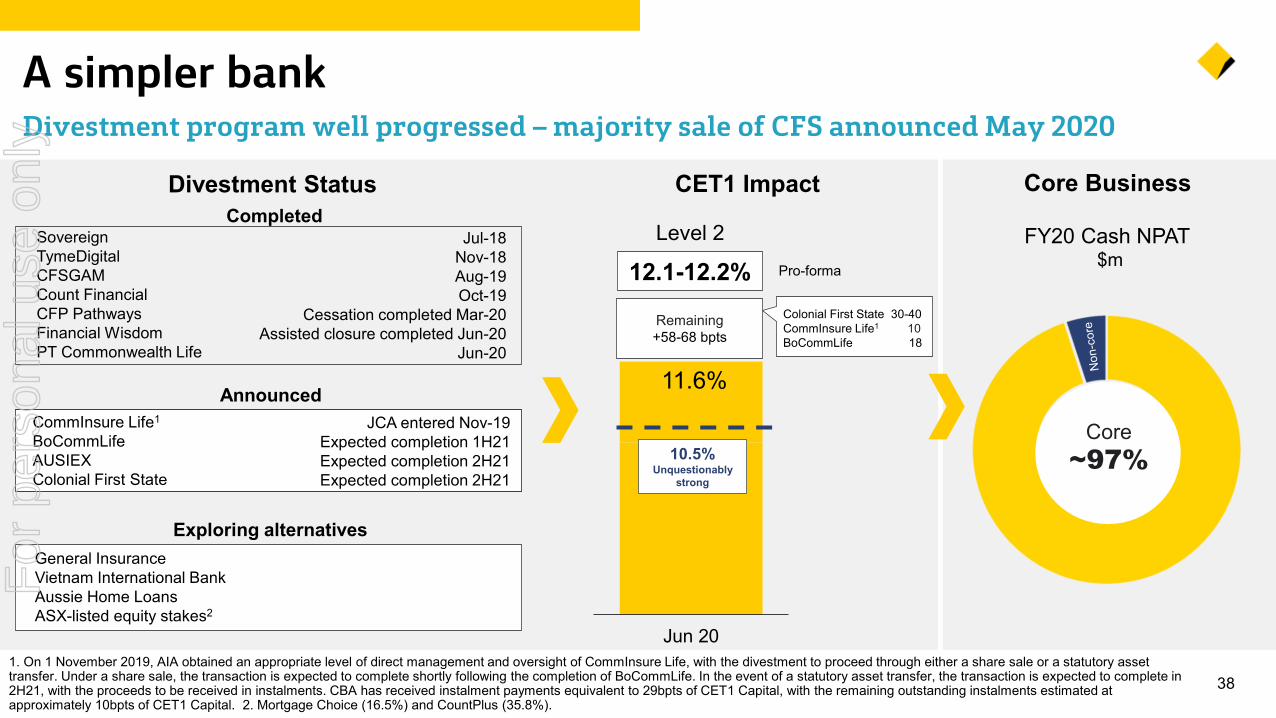
A simpler bank Divestment program well progressed – majority sale of CFS announced May 2020
FY20 Cash NPAT $m
Core Business
Level 2
10.5%Unquestionably
strong
12.1-12.2%
Remaining+58-68 bpts
Colonial First State 30-40CommInsure Life1 10BoCommLife 18
Pro-forma
11.6%
Core~97%
1. On 1 November 2019, AIA obtained an appropriate level of direct management and oversight of CommInsure Life, with the divestment to proceed through either a share sale or a statutory asset transfer. Under a share sale, the transaction is expected to complete shortly following the completion of BoCommLife. In the event of a statutory asset transfer, the transaction is expected to complete in 2H21, with the proceeds to be received in instalments. CBA has received instalment payments equivalent to 29bpts of CET1 Capital, with the remaining outstanding instalments estimated at approximately 10bpts of CET1 Capital. 2. Mortgage Choice (16.5%) and CountPlus (35.8%).
Divestment StatusCompleted
AnnouncedCommInsure Life1
BoCommLifeAUSIEXColonial First State
Sovereign TymeDigitalCFSGAM Count Financial CFP Pathways Financial WisdomPT Commonwealth Life
Jul-18Nov-18Aug-19Oct-19
Cessation completed Mar-20Assisted closure completed Jun-20
Jun-20
JCA entered Nov-19Expected completion 1H21Expected completion 2H21Expected completion 2H21
Exploring alternativesGeneral InsuranceVietnam International BankAussie Home LoansASX-listed equity stakes2
For
per
sona
l use
onl
y
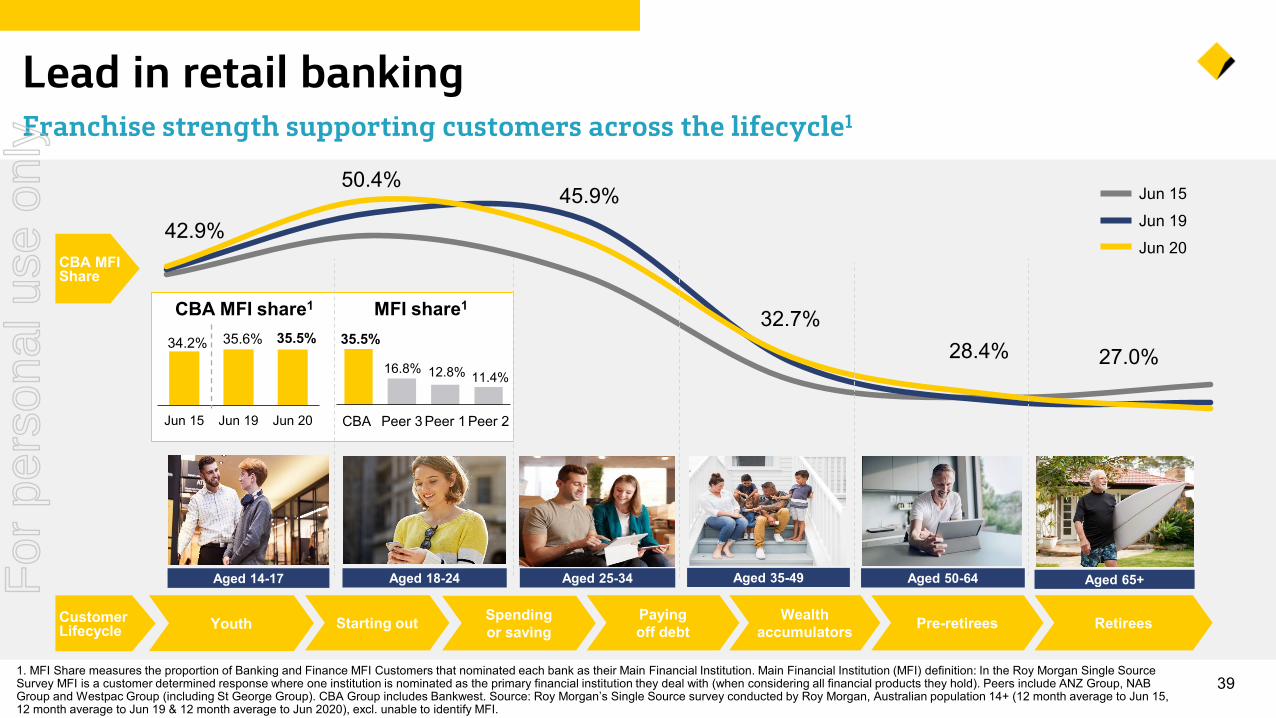
42.9%
50.4%45.9%
32.7%28.4% 27.0%
391. MFI Share measures the proportion of Banking and Finance MFI Customers that nominated each bank as their Main Financial Institution. Main Financial Institution (MFI) definition: In the Roy Morgan Single Source Survey MFI is a customer determined response where one institution is nominated as the primary financial institution they deal with (when considering all financial products they hold). Peers include ANZ Group, NAB Group and Westpac Group (including St George Group). CBA Group includes Bankwest. Source: Roy Morgan’s Single Source survey conducted by Roy Morgan, Australian population 14+ (12 month average to Jun 15, 12 month average to Jun 19 & 12 month average to Jun 2020), excl. unable to identify MFI.
Lead in retail banking Franchise strength supporting customers across the lifecycle1
Aged 14-17 Aged 25-34 Aged 35-49 Aged 50-64 Aged 65+Aged 18-24
CBA MFIShare
Starting out Spending or saving
Payingoff debt
Wealth accumulators Pre-retirees RetireesYouthCustomer
Lifecycle
Jun 15Jun 19Jun 20
MFI share1CBA MFI share1
34.2% 35.6% 35.5%
Jun 15 Jun 19 Jun 20
35.5%
16.8% 12.8% 11.4%
CBA Peer 3 Peer 1 Peer 2
For
per
sona
l use
onl
y
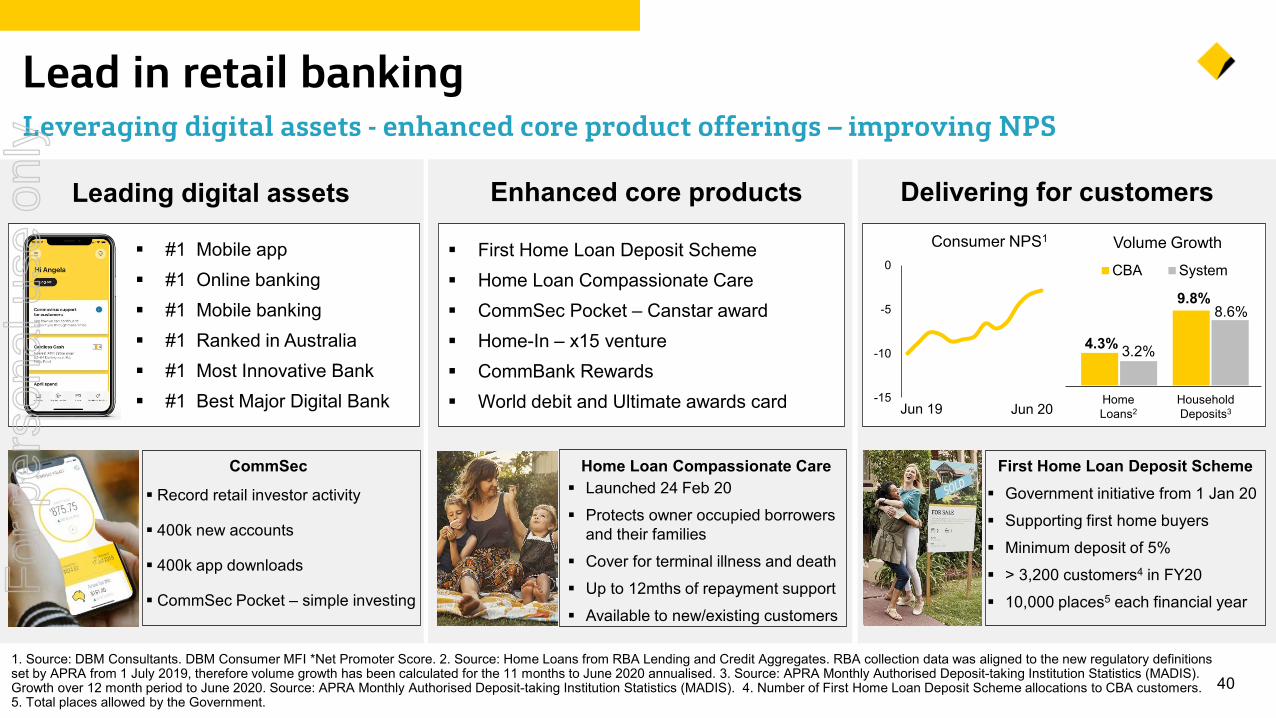
401. Source: DBM Consultants. DBM Consumer MFI *Net Promoter Score. 2. Source: Home Loans from RBA Lending and Credit Aggregates. RBA collection data was aligned to the new regulatory definitions set by APRA from 1 July 2019, therefore volume growth has been calculated for the 11 months to June 2020 annualised. 3. Source: APRA Monthly Authorised Deposit-taking Institution Statistics (MADIS). Growth over 12 month period to June 2020. Source: APRA Monthly Authorised Deposit-taking Institution Statistics (MADIS). 4. Number of First Home Loan Deposit Scheme allocations to CBA customers. 5. Total places allowed by the Government.
Lead in retail banking Leveraging digital assets - enhanced core product offerings – improving NPS
Leading digital assets Delivering for customersEnhanced core products
First Home Loan Deposit Scheme Home Loan Compassionate Care CommSec Pocket – Canstar award Home-In – x15 venture CommBank Rewards World debit and Ultimate awards card
#1 Mobile app #1 Online banking #1 Mobile banking #1 Ranked in Australia #1 Most Innovative Bank #1 Best Major Digital Bank
Home Loan Compassionate CareCommSec
Consumer NPS1
Record retail investor activity
400k new accounts
400k app downloads
CommSec Pocket – simple investing
First Home Loan Deposit Scheme
-15
-10
-5
0
Jun 20Jun 19HomeLoans2
HouseholdDeposits3
Volume Growth
Launched 24 Feb 20 Protects owner occupied borrowers
and their families Cover for terminal illness and death Up to 12mths of repayment support Available to new/existing customers
Government initiative from 1 Jan 20 Supporting first home buyers Minimum deposit of 5% > 3,200 customers4 in FY20 10,000 places5 each financial year
4.3%
9.8%
3.2%
8.6%
CBA System
For
per
sona
l use
onl
y
411. Business and Private Banking (BPB), excludes Institutional Banking. 2. Source: DBM Consultants. DBM Business MFI *Net Promoter Score. 3. Source: CBA Business Brand Tracker 2019/2020. Overall Brand Consideration. 3 month moving average data used from Jul-19 onwards. 4. Funded Loans for Government SME Guarantee Scheme as at 30 June 2020.
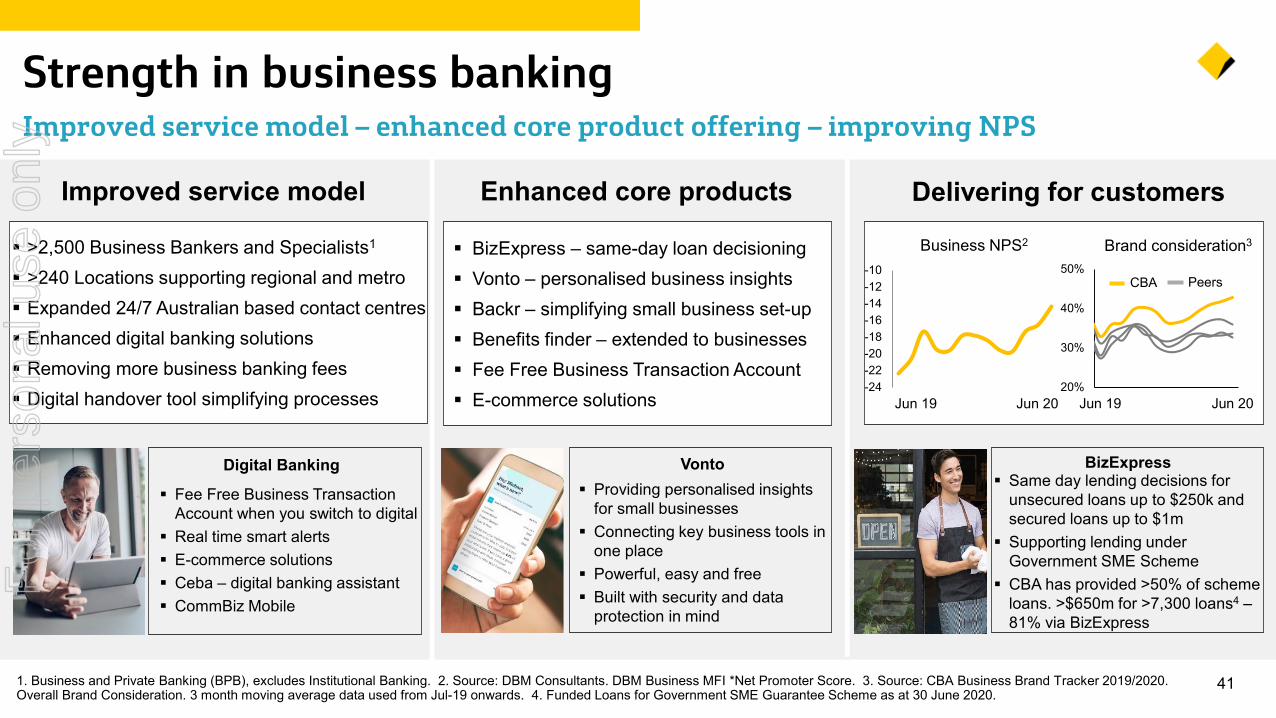
Strength in business banking Improved service model – enhanced core product offering – improving NPS
BizExpress – same-day loan decisioning Vonto – personalised business insights Backr – simplifying small business set-up Benefits finder – extended to businesses Fee Free Business Transaction Account E-commerce solutions
Improved service model Delivering for customersEnhanced core products
Fee Free Business Transaction Account when you switch to digital
Real time smart alerts E-commerce solutions Ceba – digital banking assistant CommBiz Mobile
VontoDigital Banking
>2,500 Business Bankers and Specialists1
>240 Locations supporting regional and metro Expanded 24/7 Australian based contact centres Enhanced digital banking solutions Removing more business banking fees Digital handover tool simplifying processes
BizExpress
-24-22-20-18-16-14-12-10
Business NPS2
Jun 20Jun 19
Brand consideration3
20%
30%
40%
50%
Jun 19 Jun 20
PeersCBA
Same day lending decisions for unsecured loans up to $250k and secured loans up to $1m
Supporting lending under Government SME Scheme
CBA has provided >50% of scheme loans. >$650m for >7,300 loans4 –81% via BizExpress
Providing personalised insights for small businesses
Connecting key business tools in one place
Powerful, easy and free Built with security and data
protection in mind
For
per
sona
l use
onl
y
42
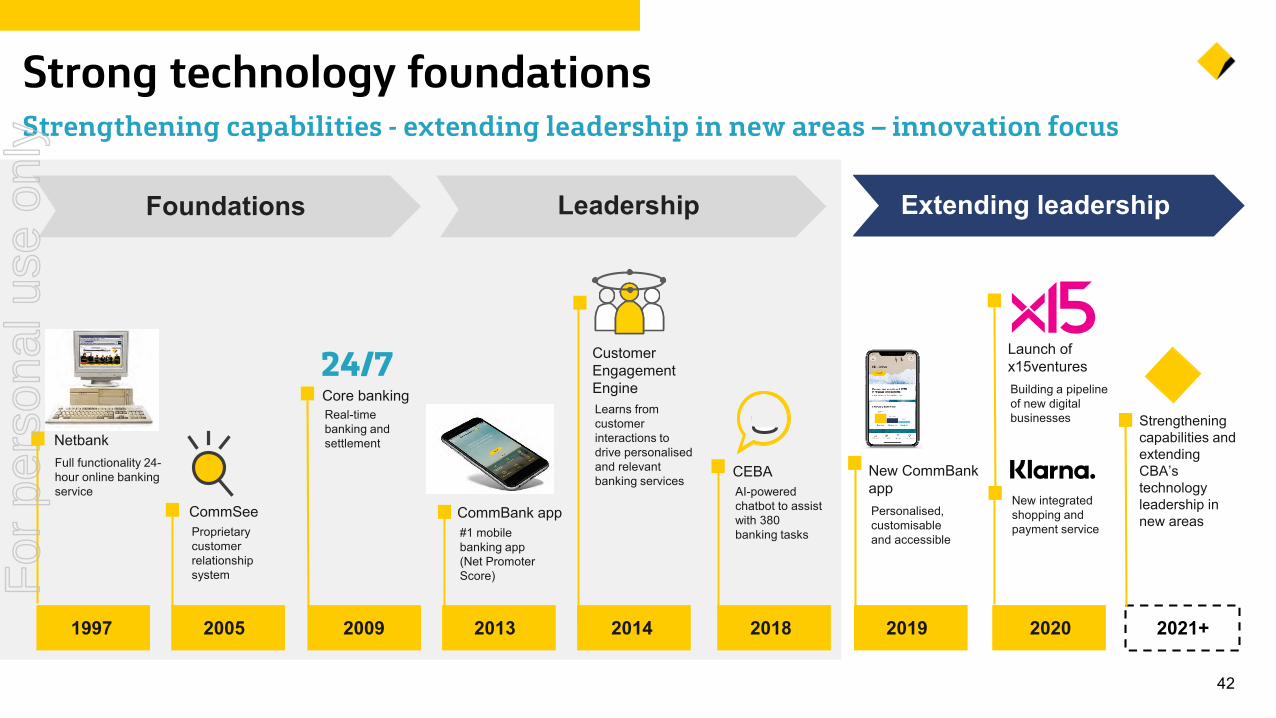
Strong technology foundations Strengthening capabilities - extending leadership in new areas – innovation focus
1997 2005 2009 2013 2014 2018 2019 2020
NetbankFull functionality 24-hour online banking service
Foundations
2021+
CommSeeProprietary customer relationship system
New CommBankappPersonalised, customisable and accessible
Core bankingReal-time banking and settlement
24/7
CommBank app#1 mobile banking app(Net Promoter Score)
Customer Engagement EngineLearns from customer interactions to drive personalised and relevant banking services
CEBAAI-powered chatbot to assist with 380 banking tasks
Launch of x15venturesBuilding a pipeline of new digital businesses
New integrated shopping and payment service
Strengthening capabilities and extending CBA’s technology leadership in new areas
Leadership Extending leadership
For
per
sona
l use
onl
y
431, 2, 3, 4, 5, 6, 7, 8, 9,10. Refer to notes slide at the back of this presentation for source information.
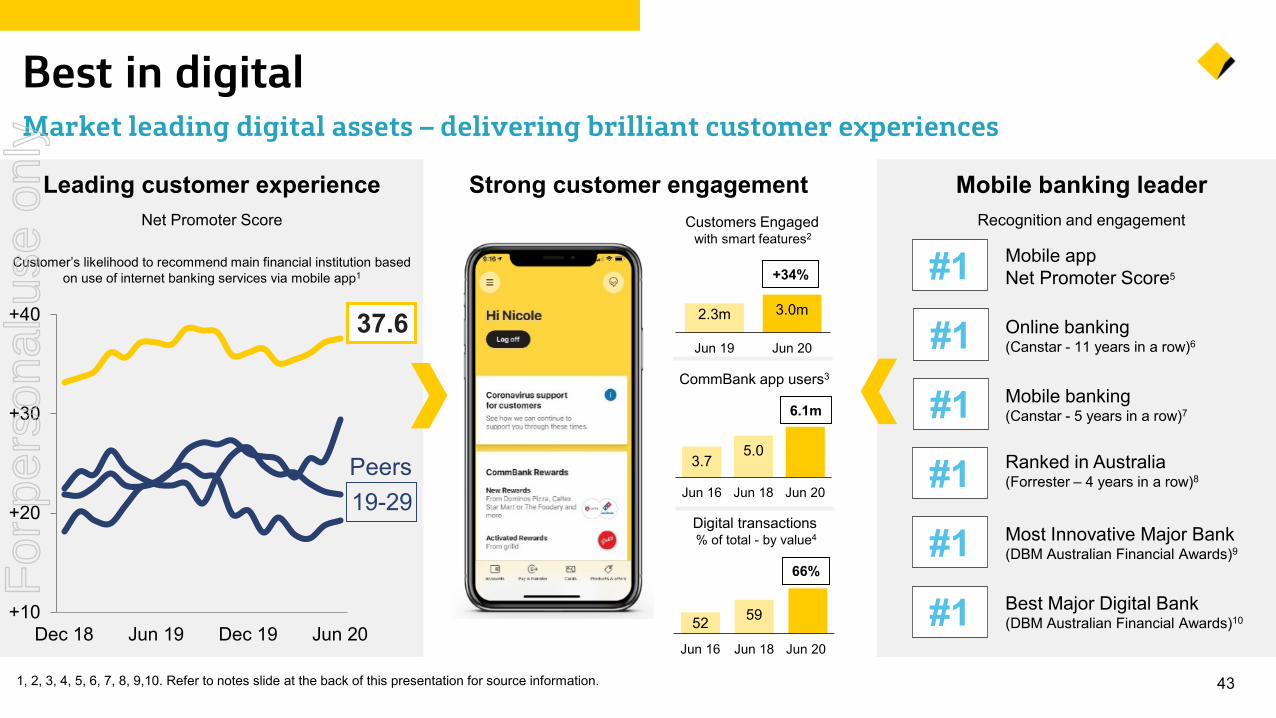
Best in digitalMarket leading digital assets – delivering brilliant customer experiences
Digital transactions
52 59
Jun 16 Jun 18 Jun 20
% of total - by value4
66%
Strong customer engagement
3.75.0
Jun 16 Jun 18 Jun 20
CommBank app users3
6.1m
Mobile banking leaderRecognition and engagement
Mobile appNet Promoter Score5#1Online banking (Canstar - 11 years in a row)6#1Mobile banking (Canstar - 5 years in a row)7#1Ranked in Australia(Forrester – 4 years in a row)8#1Most Innovative Major Bank(DBM Australian Financial Awards)9#1Best Major Digital Bank(DBM Australian Financial Awards)10#1
Leading customer experienceNet Promoter Score
+10
+20
+30
+40
Dec 18 Jun 19 Dec 19 Jun 20
Peers19-29
Customer’s likelihood to recommend main financial institution based on use of internet banking services via mobile app1
37.6 2.3m 3.0m
Jun 19 Jun 20
+34%
Customers Engagedwith smart features2
For
per
sona
l use
onl
y
441. Start of COVID-19 Pandemic refers to March 11 2020, following the announcement from World Health Organisation.
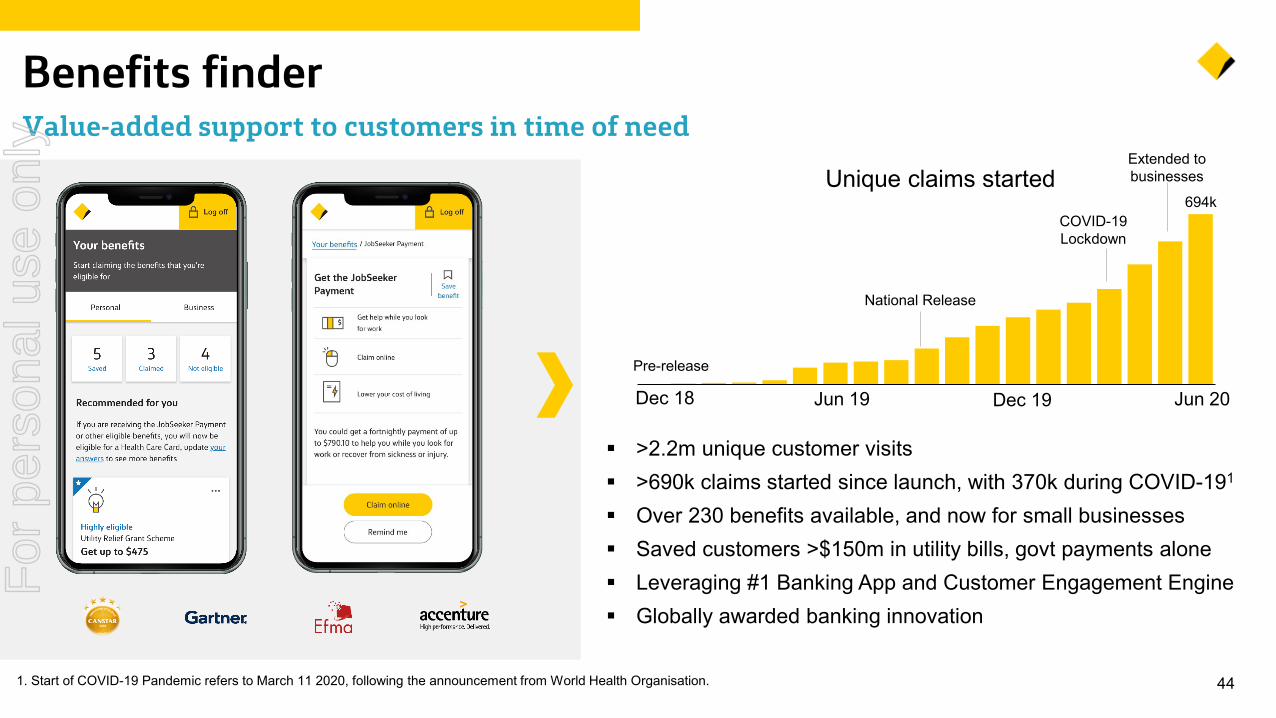
Benefits finderValue-added support to customers in time of need
>2.2m unique customer visits >690k claims started since launch, with 370k during COVID-191
Over 230 benefits available, and now for small businesses Saved customers >$150m in utility bills, govt payments alone Leveraging #1 Banking App and Customer Engagement Engine Globally awarded banking innovation
Dec 18 Jun 19 Dec 19 Jun 20
Extended to businesses
COVID-19 Lockdown
Pre-release
National Release
Unique claims started694k
For
per
sona
l use
onl
y
45
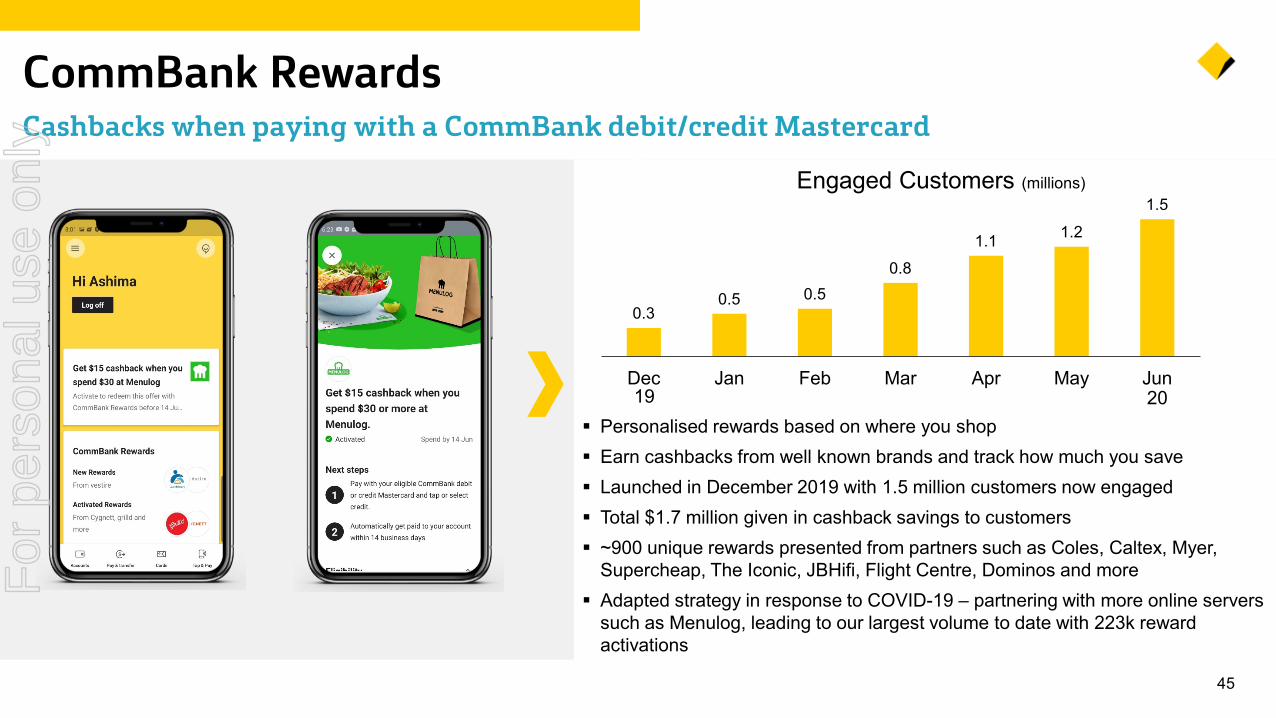
CommBank Rewards Cashbacks when paying with a CommBank debit/credit Mastercard
Personalised rewards based on where you shop Earn cashbacks from well known brands and track how much you save Launched in December 2019 with 1.5 million customers now engaged Total $1.7 million given in cashback savings to customers ~900 unique rewards presented from partners such as Coles, Caltex, Myer,
Supercheap, The Iconic, JBHifi, Flight Centre, Dominos and more Adapted strategy in response to COVID-19 – partnering with more online servers
such as Menulog, leading to our largest volume to date with 223k reward activations
0.30.5 0.5
0.81.1 1.2
1.5
Dec Jan Feb Mar Apr May Jun
Engaged Customers (millions)
19 20
For
per
sona
l use
onl
y
46
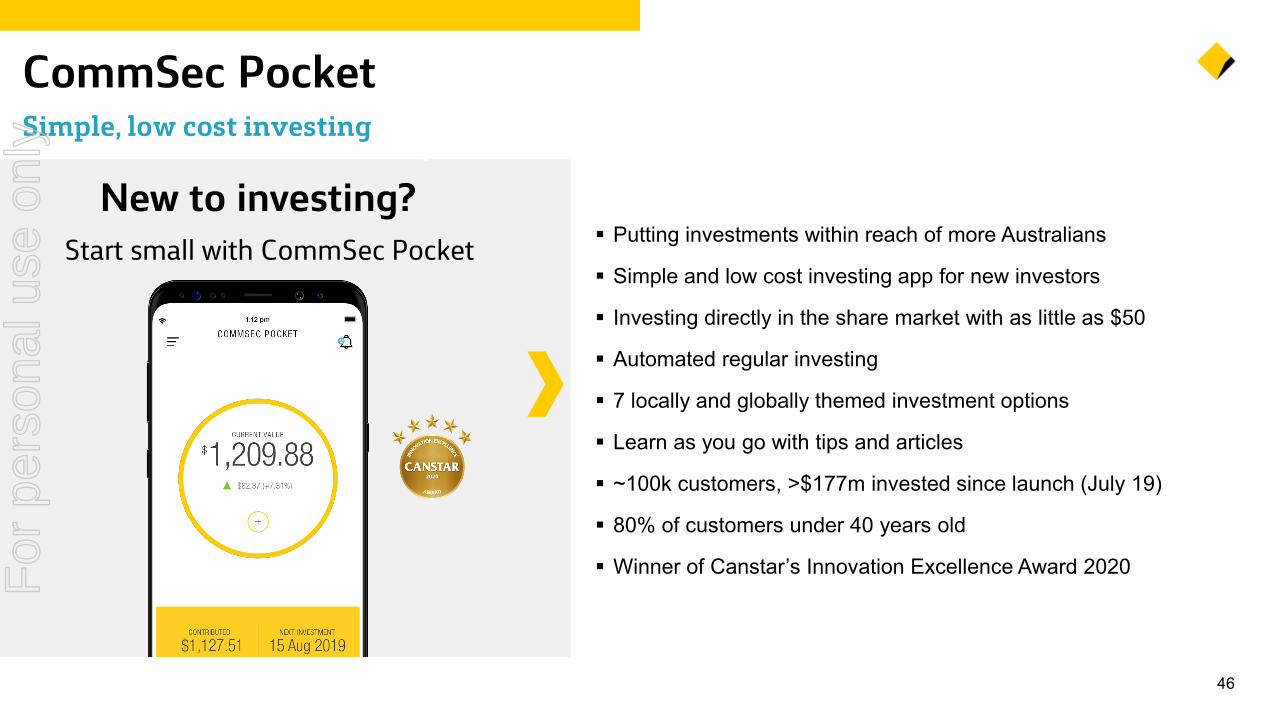
CommSec PocketSimple, low cost investing
New to investing?Start small with CommSec Pocket Putting investments within reach of more Australians
Simple and low cost investing app for new investors
Investing directly in the share market with as little as $50
Automated regular investing
7 locally and globally themed investment options
Learn as you go with tips and articles
~100k customers, >$177m invested since launch (July 19)
80% of customers under 40 years old
Winner of Canstar’s Innovation Excellence Award 2020For
per
sona
l use
onl
y
471. Funded Loans for Government SME Guarantee Scheme as at 30 June 2020.
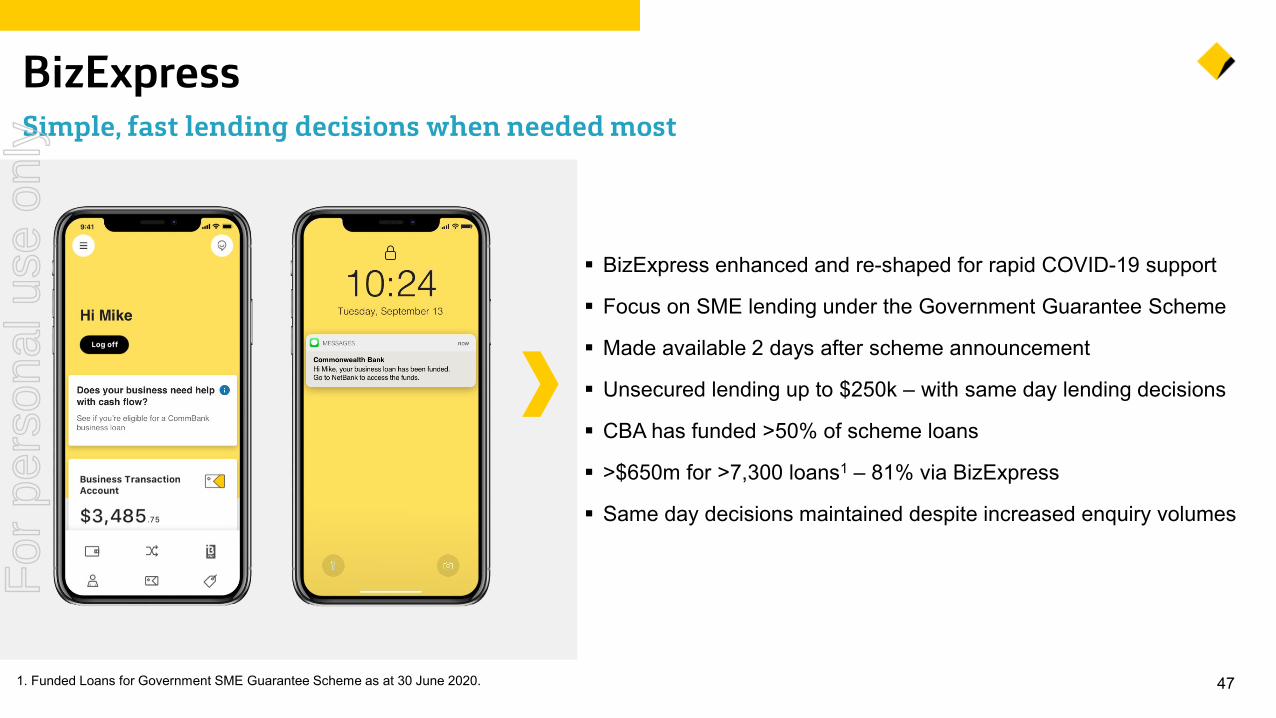
BizExpressSimple, fast lending decisions when needed most
BizExpress enhanced and re-shaped for rapid COVID-19 support
Focus on SME lending under the Government Guarantee Scheme
Made available 2 days after scheme announcement
Unsecured lending up to $250k – with same day lending decisions
CBA has funded >50% of scheme loans
>$650m for >7,300 loans1 – 81% via BizExpress
Same day decisions maintained despite increased enquiry volumes
For
per
sona
l use
onl
y
48
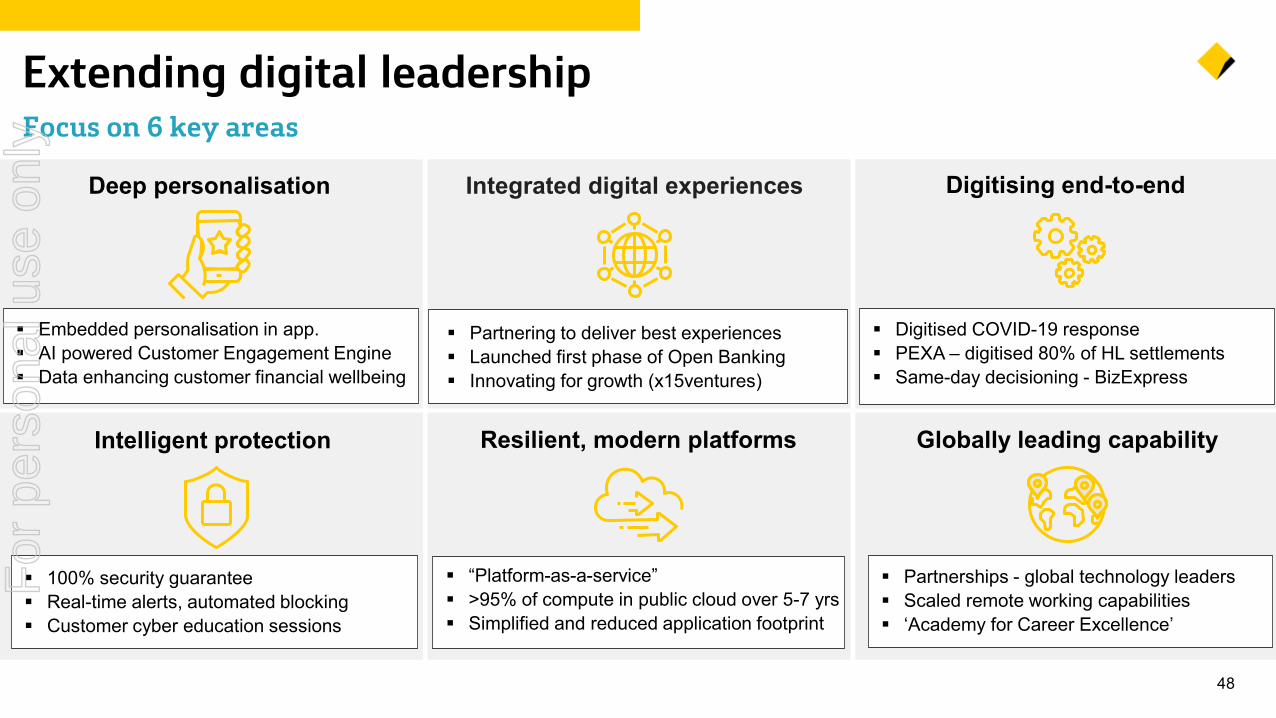
Extending digital leadership Focus on 6 key areas
Integrated digital experiences Digitising end-to-end
Resilient, modern platforms Globally leading capability
Partnering to deliver best experiences Launched first phase of Open Banking Innovating for growth (x15ventures)
Digitised COVID-19 response PEXA – digitised 80% of HL settlements Same-day decisioning - BizExpress
“Platform-as-a-service” >95% of compute in public cloud over 5-7 yrs Simplified and reduced application footprint
Partnerships - global technology leaders Scaled remote working capabilities ‘Academy for Career Excellence’
Deep personalisation
Embedded personalisation in app. AI powered Customer Engagement Engine Data enhancing customer financial wellbeing
Intelligent protection
100% security guarantee Real-time alerts, automated blocking Customer cyber education sessions
For
per
sona
l use
onl
y
49
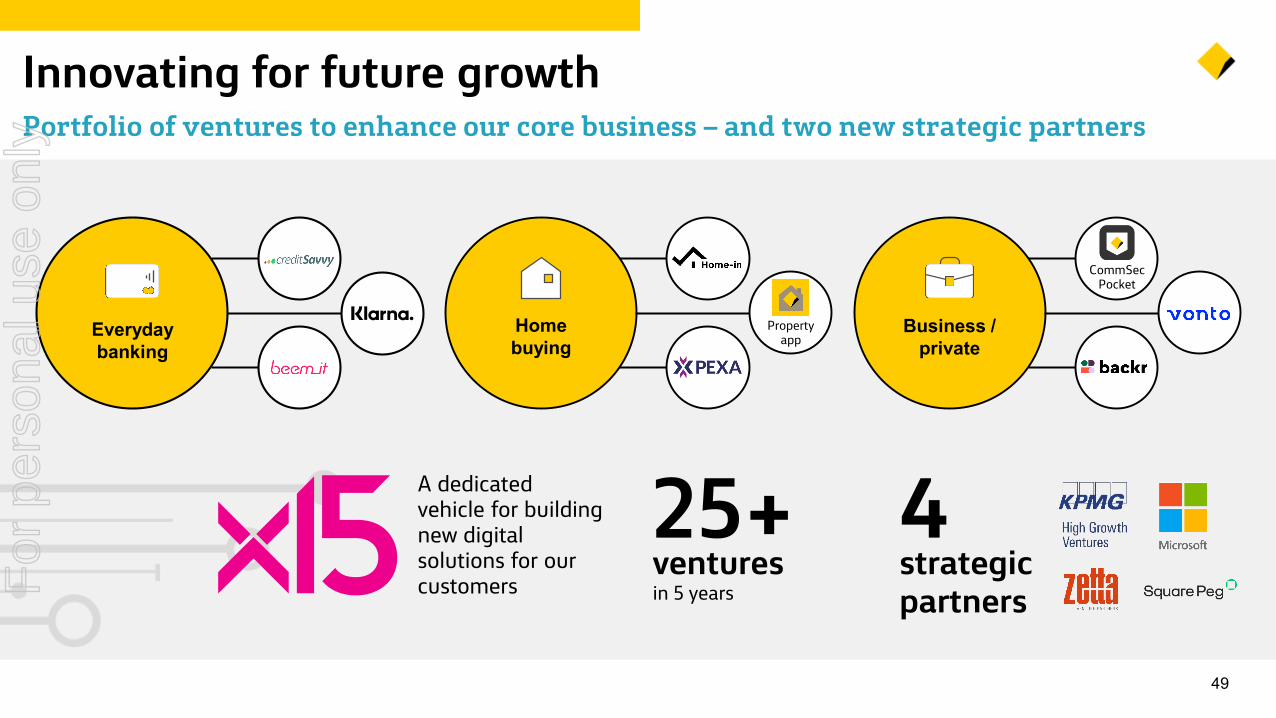
Innovating for future growthPortfolio of ventures to enhance our core business – and two new strategic partners
A dedicated vehicle for building new digital solutions for our customers
25+venturesin 5 years
Business /private
CommSecPocket
Homebuying
Property appEveryday
banking
4strategic partnersF
or p
erso
nal u
se o
nly
50
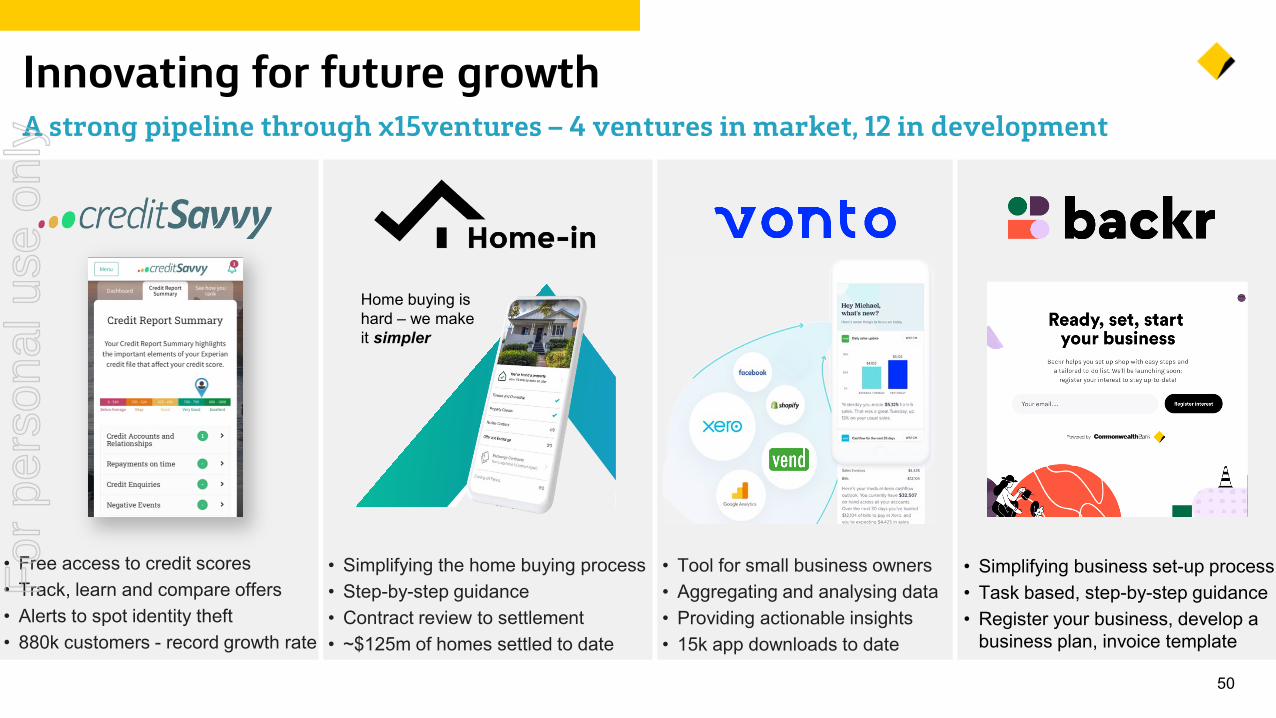
Innovating for future growthA strong pipeline through x15ventures – 4 ventures in market, 12 in development
• Tool for small business owners• Aggregating and analysing data • Providing actionable insights• 15k app downloads to date
Home buying is hard – we make it simpler
• Simplifying the home buying process • Step-by-step guidance • Contract review to settlement • ~$125m of homes settled to date
• Free access to credit scores• Track, learn and compare offers • Alerts to spot identity theft • 880k customers - record growth rate
• Simplifying business set-up process• Task based, step-by-step guidance • Register your business, develop a
business plan, invoice template
For
per
sona
l use
onl
y
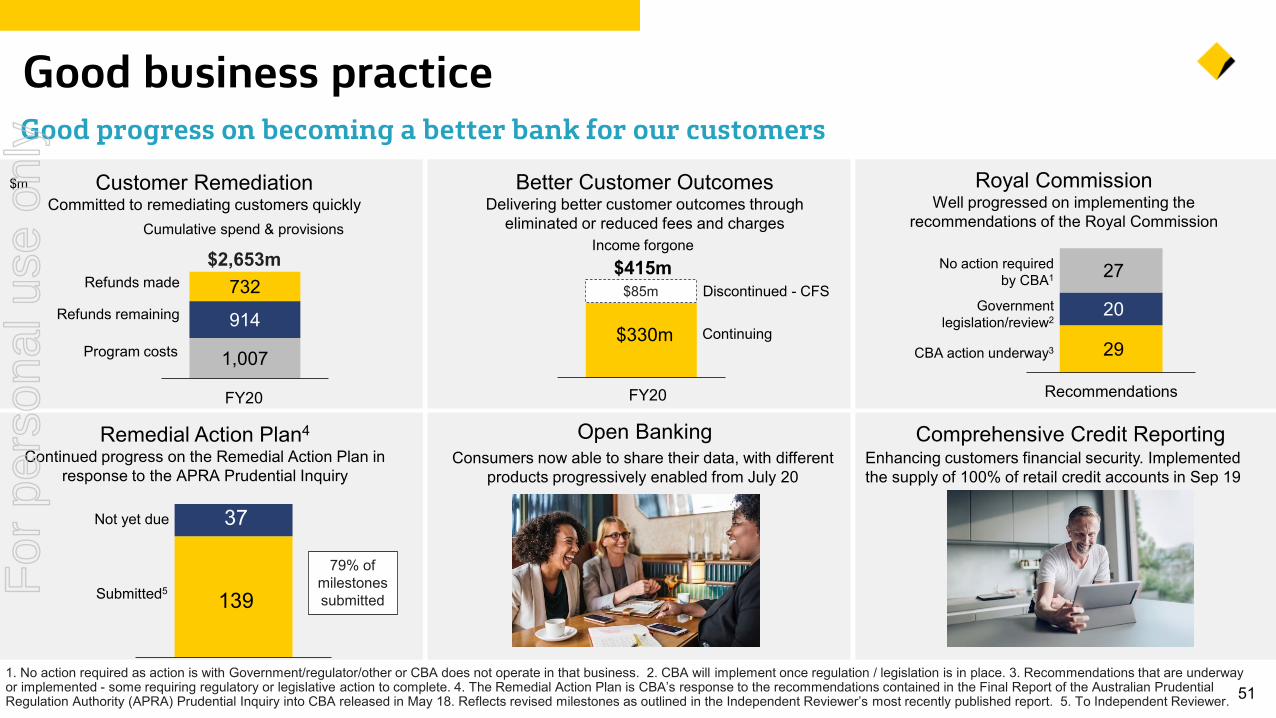
511. No action required as action is with Government/regulator/other or CBA does not operate in that business. 2. CBA will implement once regulation / legislation is in place. 3. Recommendations that are underway or implemented - some requiring regulatory or legislative action to complete. 4. The Remedial Action Plan is CBA’s response to the recommendations contained in the Final Report of the Australian Prudential Regulation Authority (APRA) Prudential Inquiry into CBA released in May 18. Reflects revised milestones as outlined in the Independent Reviewer’s most recently published report. 5. To Independent Reviewer.
Good business practice Good progress on becoming a better bank for our customers
Open BankingConsumers now able to share their data, with different
products progressively enabled from July 20Enhancing customers financial security. Implemented the supply of 100% of retail credit accounts in Sep 19
Comprehensive Credit Reporting
Submitted5
Not yet due
Remedial Action Plan4
Continued progress on the Remedial Action Plan in response to the APRA Prudential Inquiry
139
37
Royal Commission Well progressed on implementing the
recommendations of the Royal Commission
29
20
27
Recommendations
Government legislation/review2
CBA action underway3
No action required by CBA1
Income forgone
Better Customer OutcomesDelivering better customer outcomes through
eliminated or reduced fees and charges
$330m
FY20
$85m$415m
Discontinued - CFS
Continuing
1,007
914
732 $2,653m
Cumulative spend & provisions
Customer RemediationCommitted to remediating customers quickly
Refunds remaining
Refunds made
Program costs
FY20
$m
79% of milestones submitted F
or p
erso
nal u
se o
nly
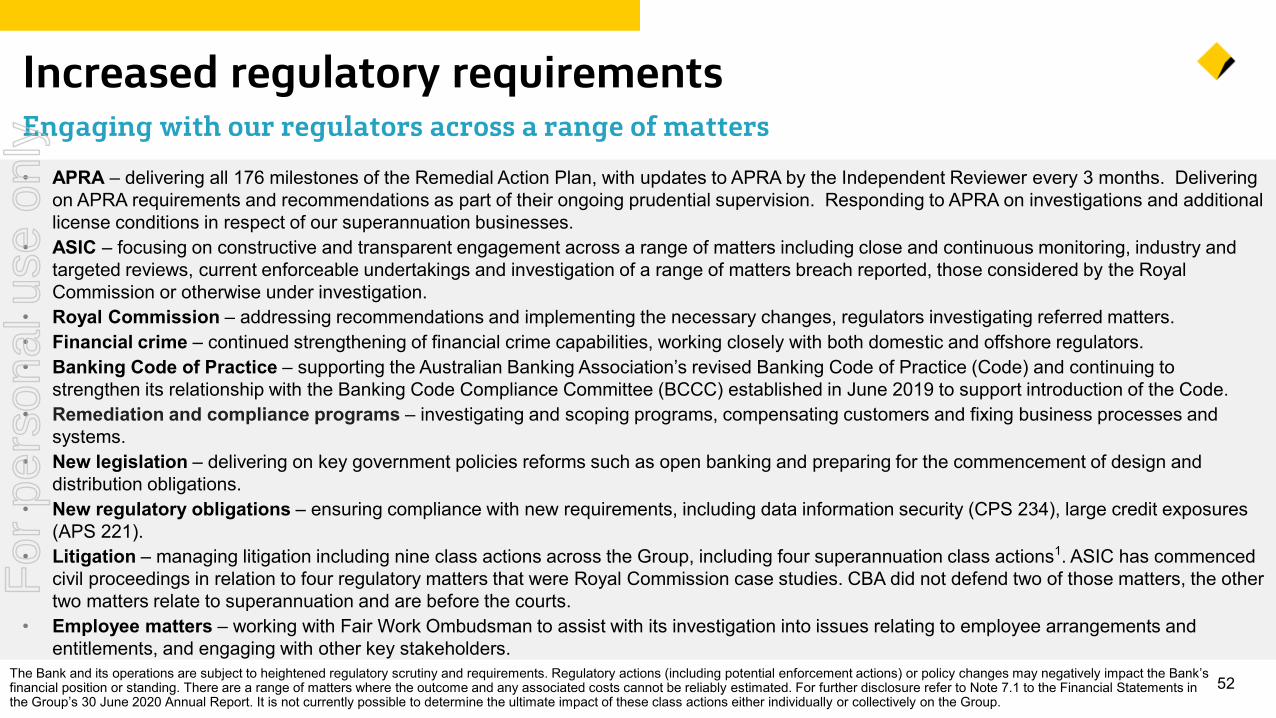
52The Bank and its operations are subject to heightened regulatory scrutiny and requirements. Regulatory actions (including potential enforcement actions) or policy changes may negatively impact the Bank’s financial position or standing. There are a range of matters where the outcome and any associated costs cannot be reliably estimated. For further disclosure refer to Note 7.1 to the Financial Statements in the Group’s 30 June 2020 Annual Report. It is not currently possible to determine the ultimate impact of these class actions either individually or collectively on the Group.
Increased regulatory requirements Engaging with our regulators across a range of matters • APRA – delivering all 176 milestones of the Remedial Action Plan, with updates to APRA by the Independent Reviewer every 3 months. Delivering
on APRA requirements and recommendations as part of their ongoing prudential supervision. Responding to APRA on investigations and additional license conditions in respect of our superannuation businesses.
• ASIC – focusing on constructive and transparent engagement across a range of matters including close and continuous monitoring, industry and targeted reviews, current enforceable undertakings and investigation of a range of matters breach reported, those considered by the Royal Commission or otherwise under investigation.
• Royal Commission – addressing recommendations and implementing the necessary changes, regulators investigating referred matters. • Financial crime – continued strengthening of financial crime capabilities, working closely with both domestic and offshore regulators. • Banking Code of Practice – supporting the Australian Banking Association’s revised Banking Code of Practice (Code) and continuing to
strengthen its relationship with the Banking Code Compliance Committee (BCCC) established in June 2019 to support introduction of the Code. • Remediation and compliance programs – investigating and scoping programs, compensating customers and fixing business processes and
systems. • New legislation – delivering on key government policies reforms such as open banking and preparing for the commencement of design and
distribution obligations.• New regulatory obligations – ensuring compliance with new requirements, including data information security (CPS 234), large credit exposures
(APS 221). • Litigation – managing litigation including nine class actions across the Group, including four superannuation class actions1. ASIC has commenced
civil proceedings in relation to four regulatory matters that were Royal Commission case studies. CBA did not defend two of those matters, the other two matters relate to superannuation and are before the courts.
• Employee matters – working with Fair Work Ombudsman to assist with its investigation into issues relating to employee arrangements and entitlements, and engaging with other key stakeholders.
For
per
sona
l use
onl
y
61.667.1
CBA Pulse ScoreAverage of peer companies
68%72%
81%
Apr 19 Oct 19 Apr 20
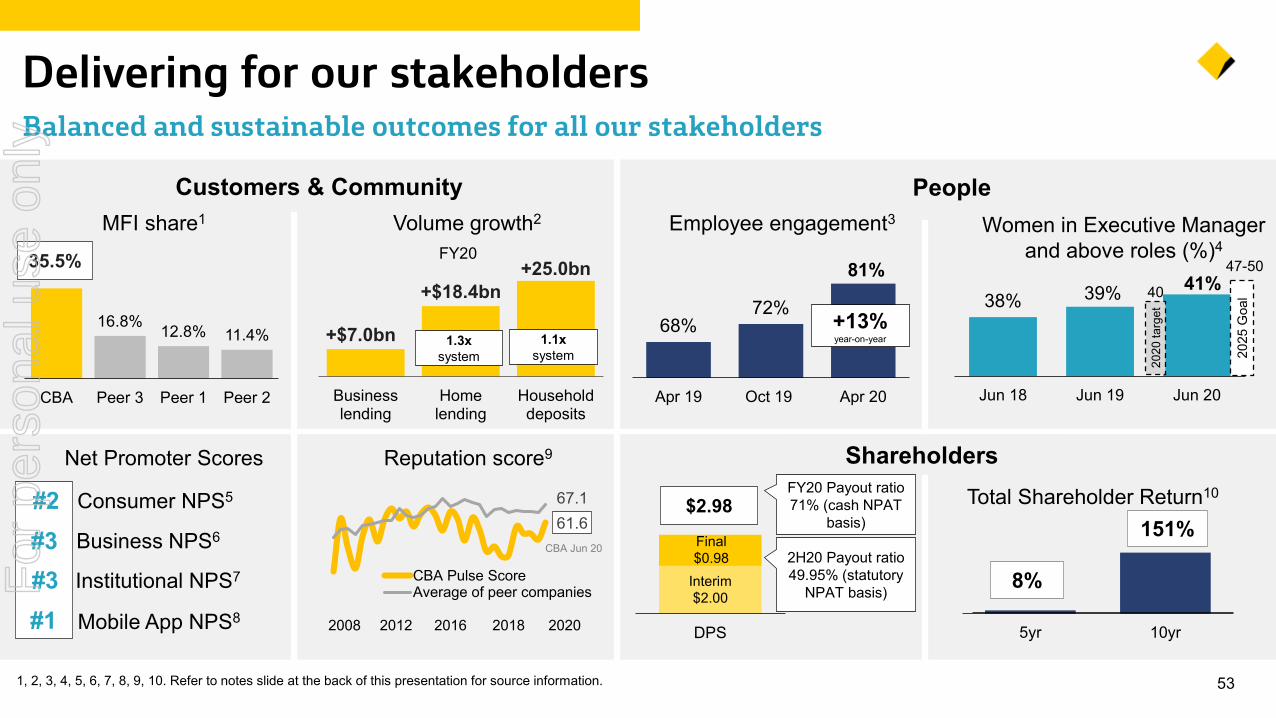
531, 2, 3, 4, 5, 6, 7, 8, 9, 10. Refer to notes slide at the back of this presentation for source information.
Delivering for our stakeholders Balanced and sustainable outcomes for all our stakeholders
Customers & Community People
8%
151%
5yr 10yr
MFI share1
Reputation score9
2008 2016 20182012
CBA Jun 20
2020
Employee engagement3
+13%year-on-year
Businesslending
Homelending
Householddeposits
+$18.4bn+25.0bn
+$7.0bn
Volume growth2
Consumer NPS5
Business NPS6
Institutional NPS7
Mobile App NPS8
Net Promoter Scores ShareholdersTotal Shareholder Return10
FY20
1.3x system
1.1x system
#2#3#3#1
16.8% 12.8% 11.4%
CBA Peer 3 Peer 1 Peer 2
35.5%
38% 39% 41%
Jun 18 Jun 19 Jun 20
2020
targ
et
40
2025
Goa
l
Women in Executive Managerand above roles (%)4
47-50
DPS
FY20 Payout ratio 71% (cash NPAT
basis)Final $0.98
Interim $2.00
$2.98
2H20 Payout ratio 49.95% (statutory
NPAT basis)For
per
sona
l use
onl
y
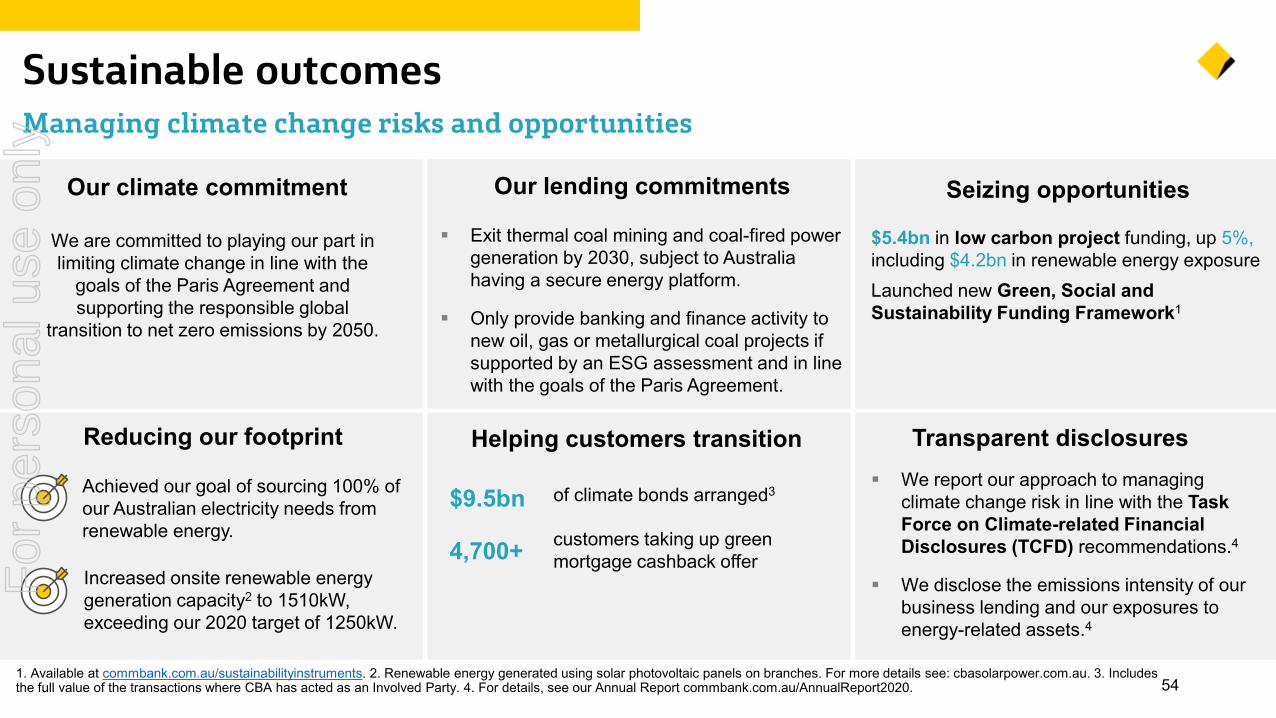
541. Available at commbank.com.au/sustainabilityinstruments. 2. Renewable energy generated using solar photovoltaic panels on branches. For more details see: cbasolarpower.com.au. 3. Includes the full value of the transactions where CBA has acted as an Involved Party. 4. For details, see our Annual Report commbank.com.au/AnnualReport2020.
Sustainable outcomesManaging climate change risks and opportunities
Achieved our goal of sourcing 100% of our Australian electricity needs from renewable energy.
$9.5bn
4,700+
Exit thermal coal mining and coal-fired power generation by 2030, subject to Australia having a secure energy platform.
Only provide banking and finance activity to new oil, gas or metallurgical coal projects if supported by an ESG assessment and in line with the goals of the Paris Agreement.
We report our approach to managing climate change risk in line with the Task Force on Climate-related Financial Disclosures (TCFD) recommendations.4
We disclose the emissions intensity of our business lending and our exposures to energy-related assets.4
Increased onsite renewable energy generation capacity2 to 1510kW, exceeding our 2020 target of 1250kW.
Our climate commitment
We are committed to playing our part in limiting climate change in line with the
goals of the Paris Agreement and supporting the responsible global
transition to net zero emissions by 2050.
Our lending commitments Seizing opportunities
Transparent disclosuresReducing our footprint Helping customers transition
of climate bonds arranged3
customers taking up green mortgage cashback offer
$5.4bn in low carbon project funding, up 5%, including $4.2bn in renewable energy exposureLaunched new Green, Social and Sustainability Funding Framework1
For
per
sona
l use
onl
y

55
Financial OverviewFor
per
sona
l use
onl
y
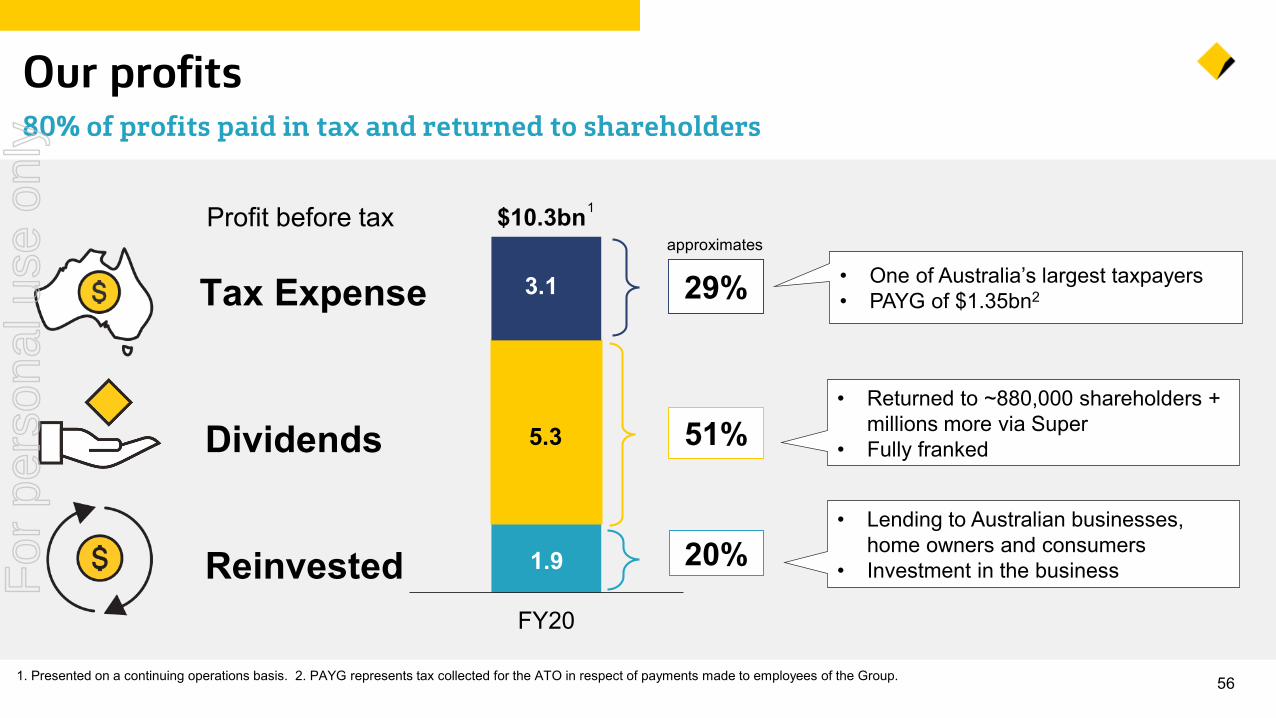
561. Presented on a continuing operations basis. 2. PAYG represents tax collected for the ATO in respect of payments made to employees of the Group.
Our profits 80% of profits paid in tax and returned to shareholders
Reinvested
Tax Expense
Dividends
Profit before tax
FY20
51%
20%
29%
$10.3bn
3.1
1.9
5.3
1
approximates
• One of Australia’s largest taxpayers • PAYG of $1.35bn2
• Returned to ~880,000 shareholders + millions more via Super
• Fully franked
• Lending to Australian businesses, home owners and consumers
• Investment in the business For
per
sona
l use
onl
y
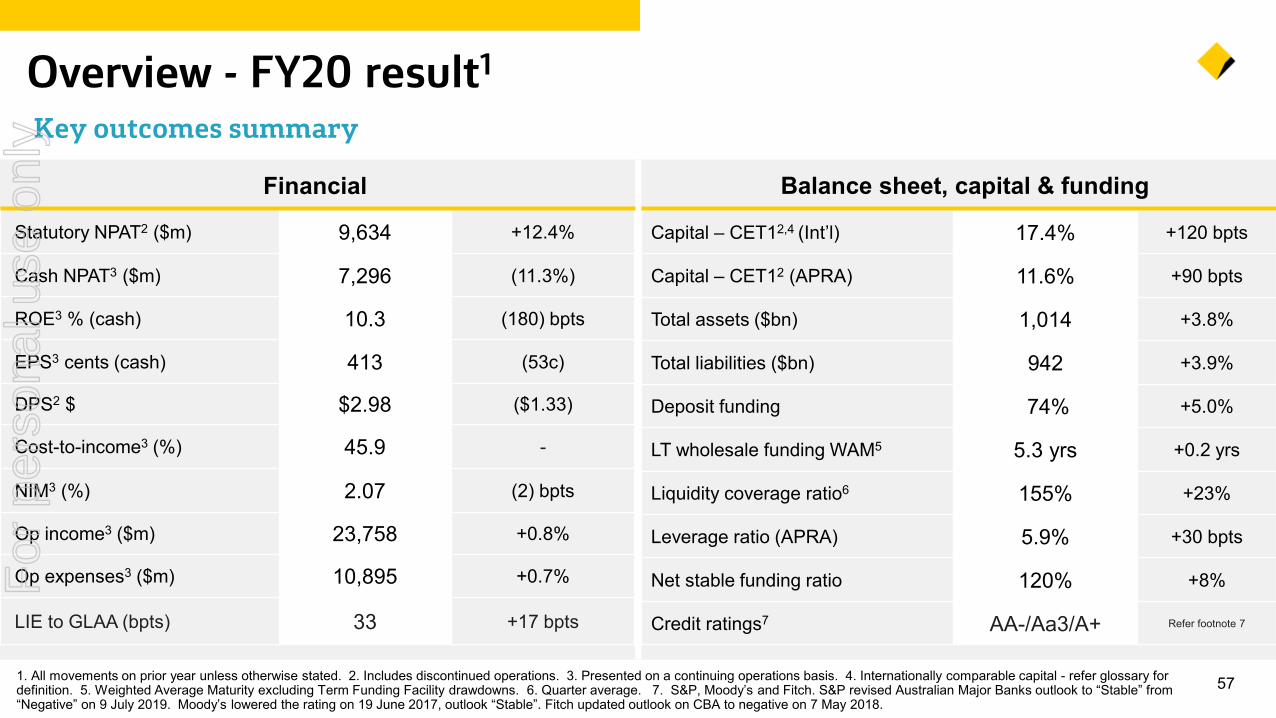
571. All movements on prior year unless otherwise stated. 2. Includes discontinued operations. 3. Presented on a continuing operations basis. 4. Internationally comparable capital - refer glossary for definition. 5. Weighted Average Maturity excluding Term Funding Facility drawdowns. 6. Quarter average. 7. S&P, Moody’s and Fitch. S&P revised Australian Major Banks outlook to “Stable” from “Negative” on 9 July 2019. Moody’s lowered the rating on 19 June 2017, outlook “Stable”. Fitch updated outlook on CBA to negative on 7 May 2018.
Overview - FY20 result1
Key outcomes summary
Balance sheet, capital & fundingFinancial
Capital – CET12,4 (Int’l) 17.4% +120 bpts
Capital – CET12 (APRA) 11.6% +90 bpts
Total assets ($bn) 1,014 +3.8%
Total liabilities ($bn) 942 +3.9%
Deposit funding 74% +5.0%
LT wholesale funding WAM5 5.3 yrs +0.2 yrs
Liquidity coverage ratio6 155% +23%
Leverage ratio (APRA) 5.9% +30 bpts
Net stable funding ratio 120% +8%
Credit ratings7 AA-/Aa3/A+ Refer footnote 7
Statutory NPAT2 ($m) 9,634 +12.4%
Cash NPAT3 ($m) 7,296 (11.3%)
ROE3 % (cash) 10.3 (180) bpts
EPS3 cents (cash) 413 (53c)
DPS2 $ $2.98 ($1.33)
Cost-to-income3 (%) 45.9 -
NIM3 (%) 2.07 (2) bpts
Op income3 ($m) 23,758 +0.8%
Op expenses3 ($m) 10,895 +0.7%
LIE to GLAA (bpts) 33 +17 bpts
For
per
sona
l use
onl
y
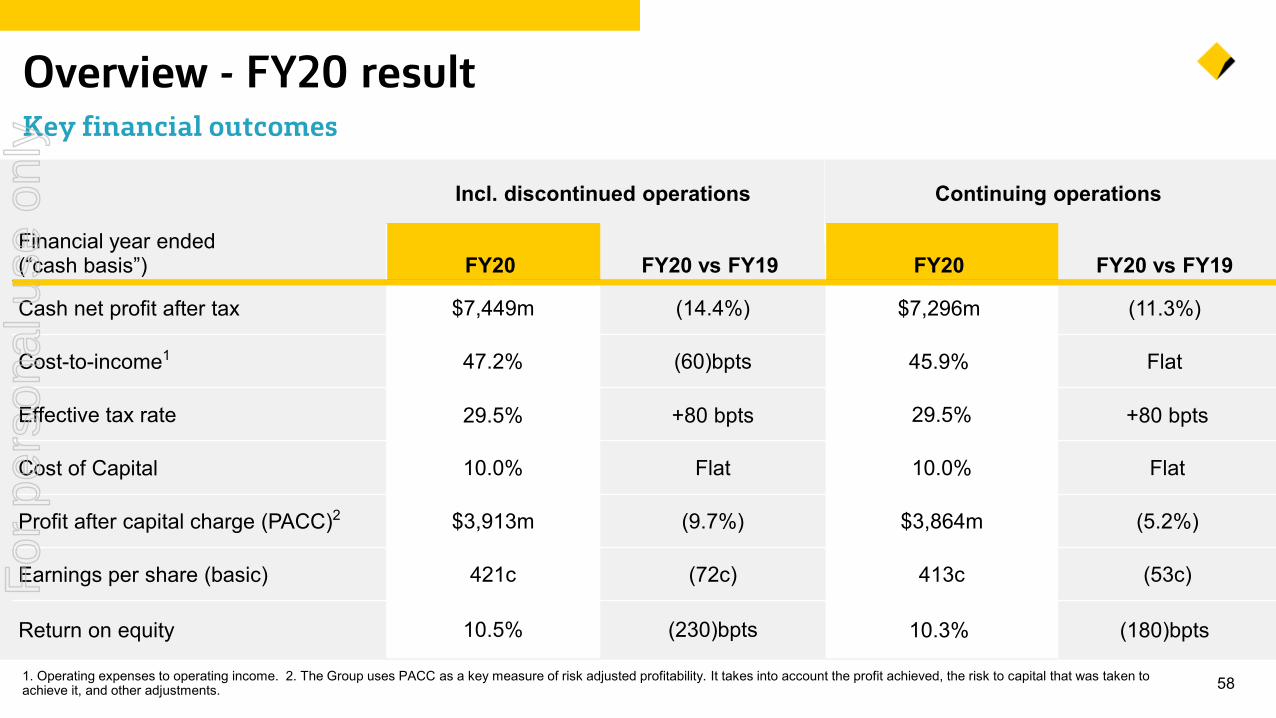
Incl. discontinued operations Continuing operations
Financial year ended (“cash basis”) FY20 FY20 vs FY19 FY20 FY20 vs FY19
Cash net profit after tax $7,449m (14.4%) $7,296m (11.3%)
Cost-to-income1 47.2% (60)bpts 45.9% Flat
Effective tax rate 29.5% +80 bpts 29.5% +80 bpts
Cost of Capital 10.0% Flat 10.0% Flat
Profit after capital charge (PACC)2 $3,913m (9.7%) $3,864m (5.2%)
Earnings per share (basic) 421c (72c) 413c (53c)
Return on equity 10.5% (230)bpts 10.3% (180)bpts
581. Operating expenses to operating income. 2. The Group uses PACC as a key measure of risk adjusted profitability. It takes into account the profit achieved, the risk to capital that was taken to achieve it, and other adjustments.
Overview - FY20 result Key financial outcomes
For
per
sona
l use
onl
y
209 207
FY19 FY20
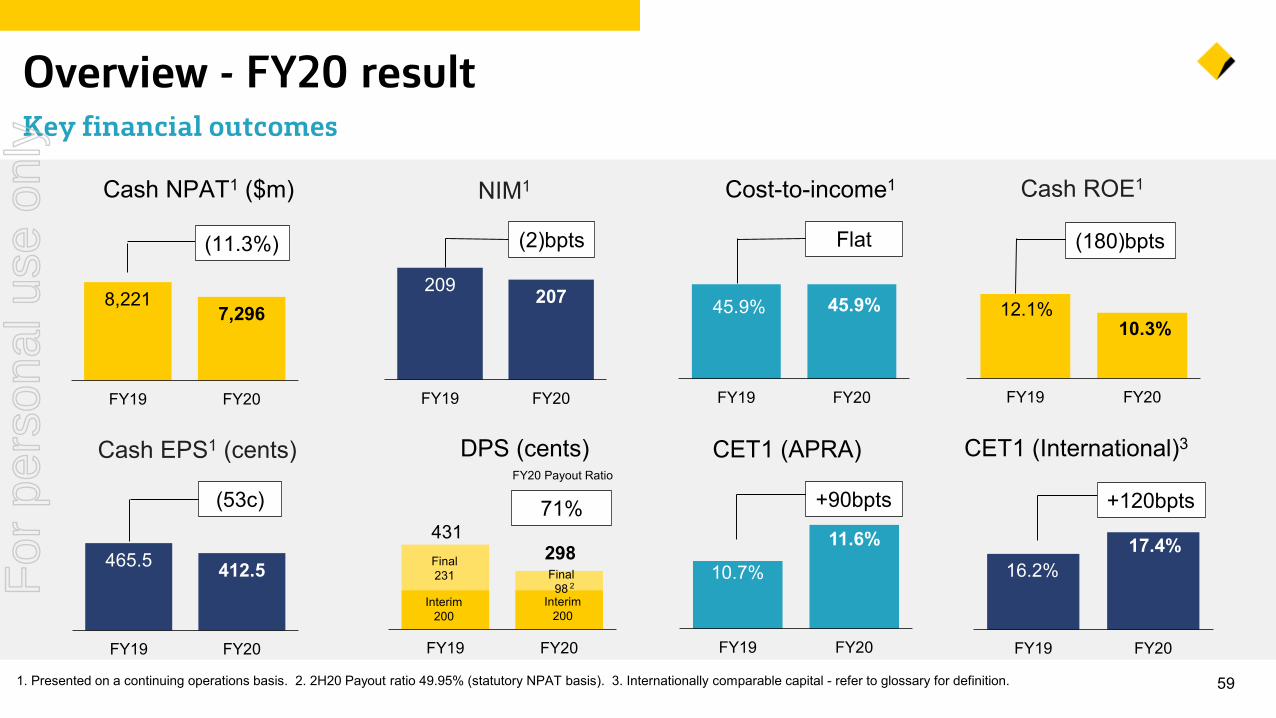
591. Presented on a continuing operations basis. 2. 2H20 Payout ratio 49.95% (statutory NPAT basis). 3. Internationally comparable capital - refer to glossary for definition.
Overview - FY20 resultKey financial outcomes
12.1%10.3%
FY19 FY20
45.9% 45.9%
FY19 FY20
NIM1 Cost-to-income1 Cash ROE1
(180)bpts(2)bpts Flat
8,2217,296
FY19 FY20
Cash NPAT1 ($m)
(11.3%)
465.5 412.5
FY19 FY20
Cash EPS1 (cents)
(53c)
10.7%
11.6%
FY19 FY20
CET1 (APRA)
+90bpts
CET1 (International)3
FY19 FY20
DPS (cents)
71%431
298Final 98
Interim 200
Final 231
Interim 200
FY20 Payout Ratio
16.2%17.4%
FY19 FY20
+120bpts
2For
per
sona
l use
onl
y
23,577 23,758
FY19 FY20
209 207
FY19 FY20
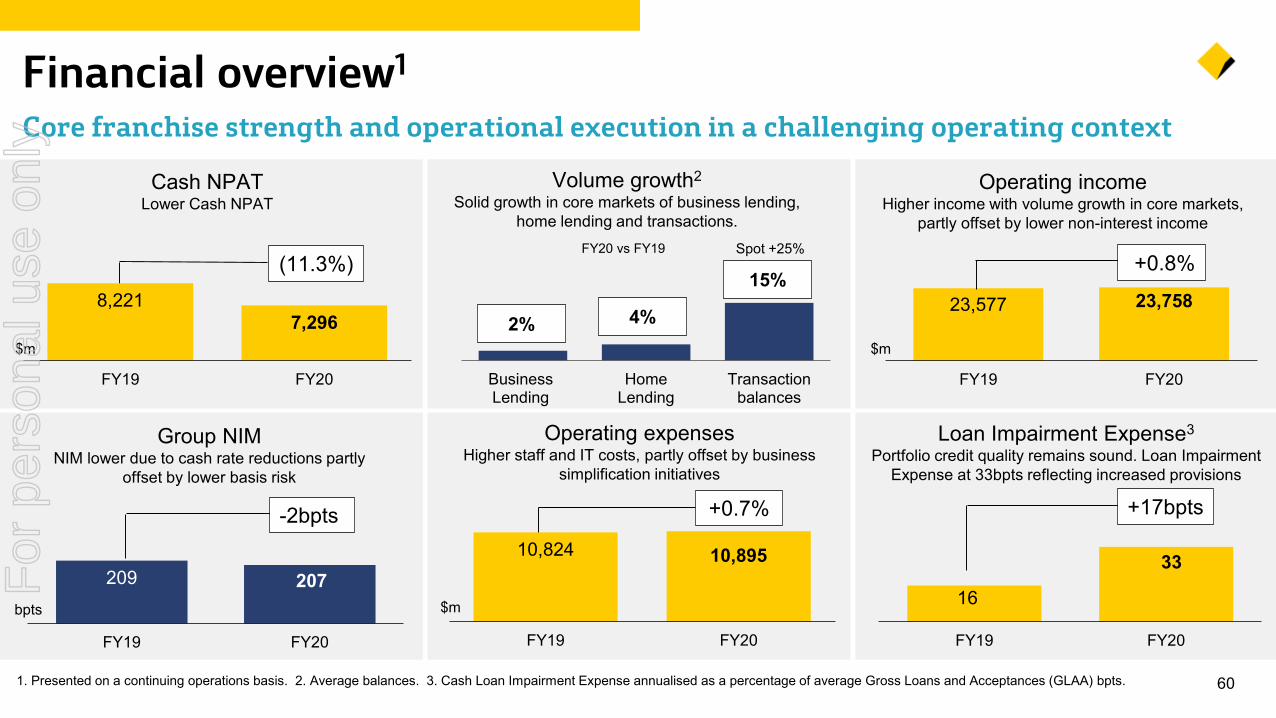
601. Presented on a continuing operations basis. 2. Average balances. 3. Cash Loan Impairment Expense annualised as a percentage of average Gross Loans and Acceptances (GLAA) bpts.
Financial overview1
Core franchise strength and operational execution in a challenging operating context
$m
bpts
Cash NPAT Lower Cash NPAT
Operating income Higher income with volume growth in core markets,
partly offset by lower non-interest income
+0.8%
-2bpts
8,2217,296
FY19 FY20
$m
(11.3%)
10,824 10,895
FY19 FY20
$m
+0.7%
Operating expenses Higher staff and IT costs, partly offset by business
simplification initiatives
Group NIMNIM lower due to cash rate reductions partly
offset by lower basis risk
BusinessLending
HomeLending
Transactionbalances
FY20 vs FY19
Volume growth2
Solid growth in core markets of business lending, home lending and transactions.
2% 4%
15%
16
33
FY19 FY20
Loan Impairment Expense3
Portfolio credit quality remains sound. Loan Impairment Expense at 33bpts reflecting increased provisions
+17bpts
Spot +25%
For
per
sona
l use
onl
y
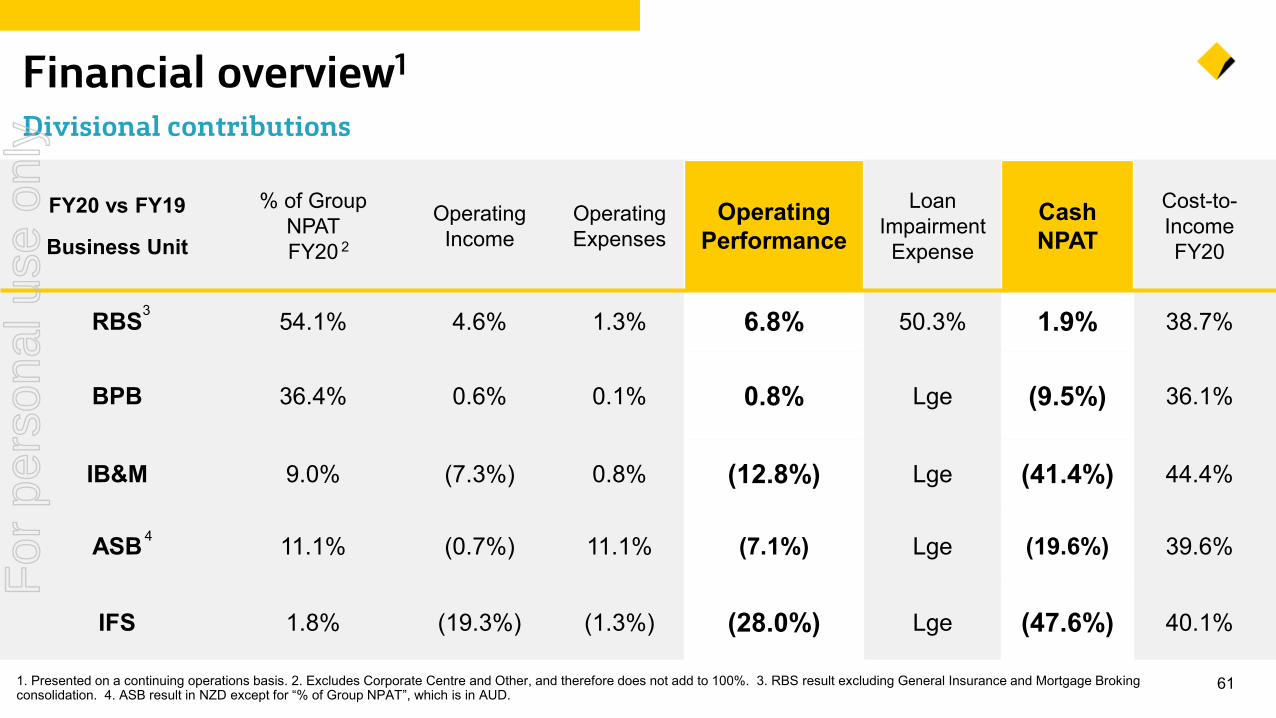
611. Presented on a continuing operations basis. 2. Excludes Corporate Centre and Other, and therefore does not add to 100%. 3. RBS result excluding General Insurance and Mortgage Broking consolidation. 4. ASB result in NZD except for “% of Group NPAT”, which is in AUD.
Financial overview1
Divisional contributions
FY20 vs FY19
Business Unit
% of Group NPAT FY20
Operating Income
OperatingExpenses
Operating Performance
Loan Impairment Expense
Cash NPAT
Cost-to-IncomeFY20
RBS 54.1% 4.6% 1.3% 6.8% 50.3% 1.9% 38.7%
BPB 36.4% 0.6% 0.1% 0.8% Lge (9.5%) 36.1%
IB&M 9.0% (7.3%) 0.8% (12.8%) Lge (41.4%) 44.4%
ASB 11.1% (0.7%) 11.1% (7.1%) Lge (19.6%) 39.6%
IFS 1.8% (19.3%) (1.3%) (28.0%) Lge (47.6%) 40.1%
3
4
2
For
per
sona
l use
onl
y
18,224 18,610
4,951 4,837402 311
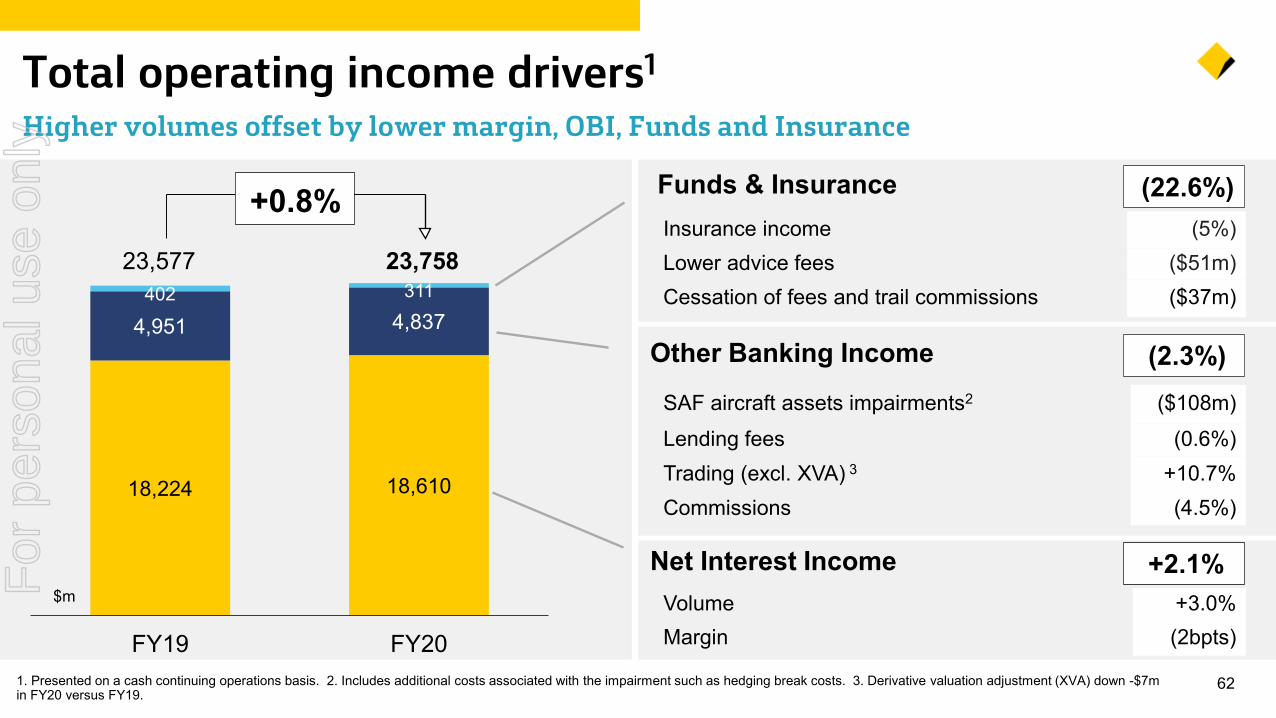
FY19 FY20621. Presented on a cash continuing operations basis. 2. Includes additional costs associated with the impairment such as hedging break costs. 3. Derivative valuation adjustment (XVA) down -$7m
in FY20 versus FY19.
Total operating income drivers1
Higher volumes offset by lower margin, OBI, Funds and Insurance
$m
23,75823,577
+0.8%
Other Banking Income
Net Interest Income
Insurance income (5%)Lower advice fees ($51m)Cessation of fees and trail commissions ($37m)
SAF aircraft assets impairments2 ($108m)Lending fees (0.6%)Trading (excl. XVA) 3 +10.7%Commissions (4.5%)
Volume +3.0%Margin (2bpts)
Funds & Insurance
(2.3%)
+2.1%
(22.6%)
For
per
sona
l use
onl
y
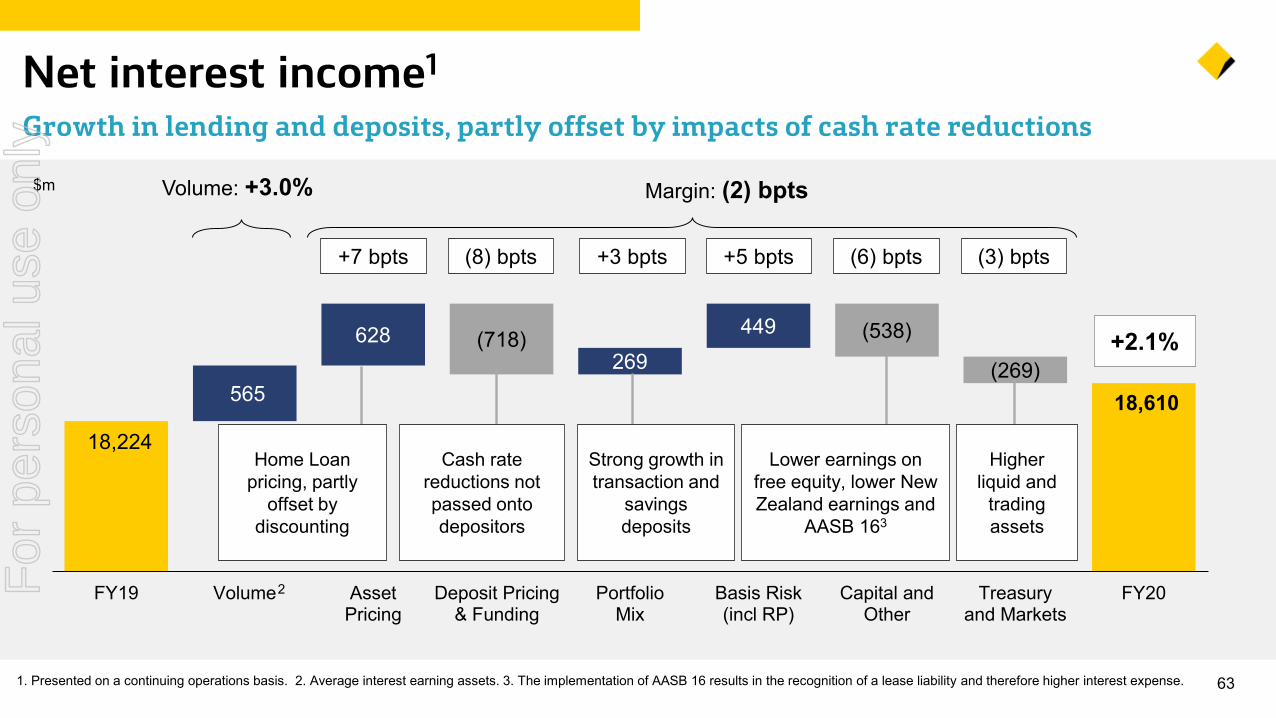
18,224
18,610 565
628269
449(718) (538)
(269)
FY19 Volume AssetPricing
Deposit Pricing& Funding
PortfolioMix
Basis Risk(incl RP)
Capital andOther
Treasuryand Markets
FY20
631. Presented on a continuing operations basis. 2. Average interest earning assets. 3. The implementation of AASB 16 results in the recognition of a lease liability and therefore higher interest expense.
Net interest income1
Growth in lending and deposits, partly offset by impacts of cash rate reductions
$m Margin: (2) bpts
2
Volume: +3.0%
+7 bpts
Home Loan pricing, partly
offset by discounting
Cash rate reductions not passed onto depositors
Strong growth in transaction and
savings deposits
+2.1%
(8) bpts +3 bpts +5 bpts (6) bpts (3) bpts
Lower earnings on free equity, lower New Zealand earnings and
AASB 163
Higher liquid and
trading assets
For
per
sona
l use
onl
y
7.2% 6.2% 4.8% 4.9%
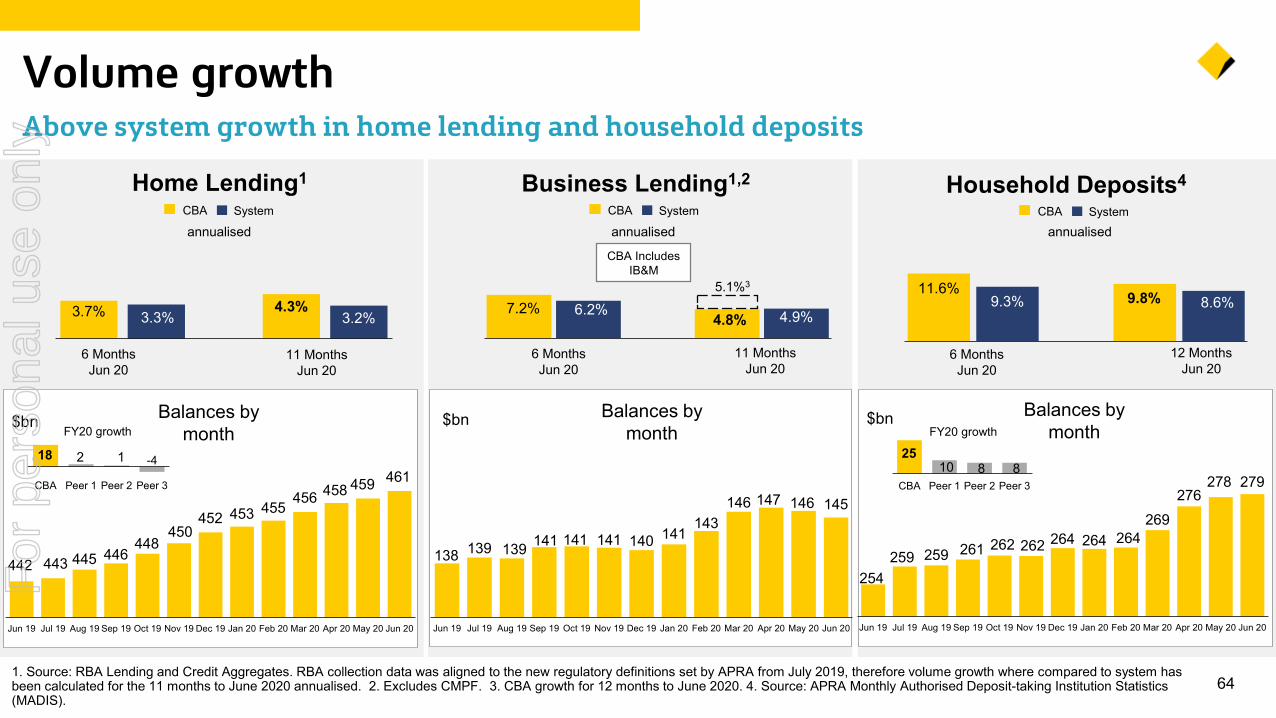
641. Source: RBA Lending and Credit Aggregates. RBA collection data was aligned to the new regulatory definitions set by APRA from July 2019, therefore volume growth where compared to system has been calculated for the 11 months to June 2020 annualised. 2. Excludes CMPF. 3. CBA growth for 12 months to June 2020. 4. Source: APRA Monthly Authorised Deposit-taking Institution Statistics (MADIS).
Volume growthAbove system growth in home lending and household deposits
Business Lending1,2
6 MonthsJun 20
annualised
CBA Includes IB&M
$bn Balances by month
11 MonthsJun 20
SystemCBA
442 443 445 446448
450452 453 455
456 458 459 461
Jun 19 Jul 19 Aug 19 Sep 19 Oct 19 Nov 19 Dec 19 Jan 20 Feb 20 Mar 20 Apr 20 May 20 Jun 20
18 2 1 -4
CBA Peer 1 Peer 2 Peer 3
Home Lending1
annualisedSystemCBA
6 MonthsJun 20
11 MonthsJun 20
$bn Balances by month
3.7% 3.3%4.3%
3.2%
FY20 growth
Household Deposits4
6 MonthsJun 20
annualised
12 MonthsJun 20
$bn Balances by monthFY20 growth
SystemCBA
11.6%9.3% 9.8% 8.6%
25 10 8 8
CBA Peer 1 Peer 2 Peer 3
254259 259 261 262 262 264 264 264
269276
278 279
Jun 19 Jul 19 Aug 19 Sep 19 Oct 19 Nov 19 Dec 19 Jan 20 Feb 20 Mar 20 Apr 20 May 20 Jun 20
138 139 139 141 141 141 140 141 143
146 147 146 145
Jun 19 Jul 19 Aug 19 Sep 19 Oct 19 Nov 19 Dec 19 Jan 20 Feb 20 Mar 20 Apr 20 May 20 Jun 20
5.1%3
For
per
sona
l use
onl
y
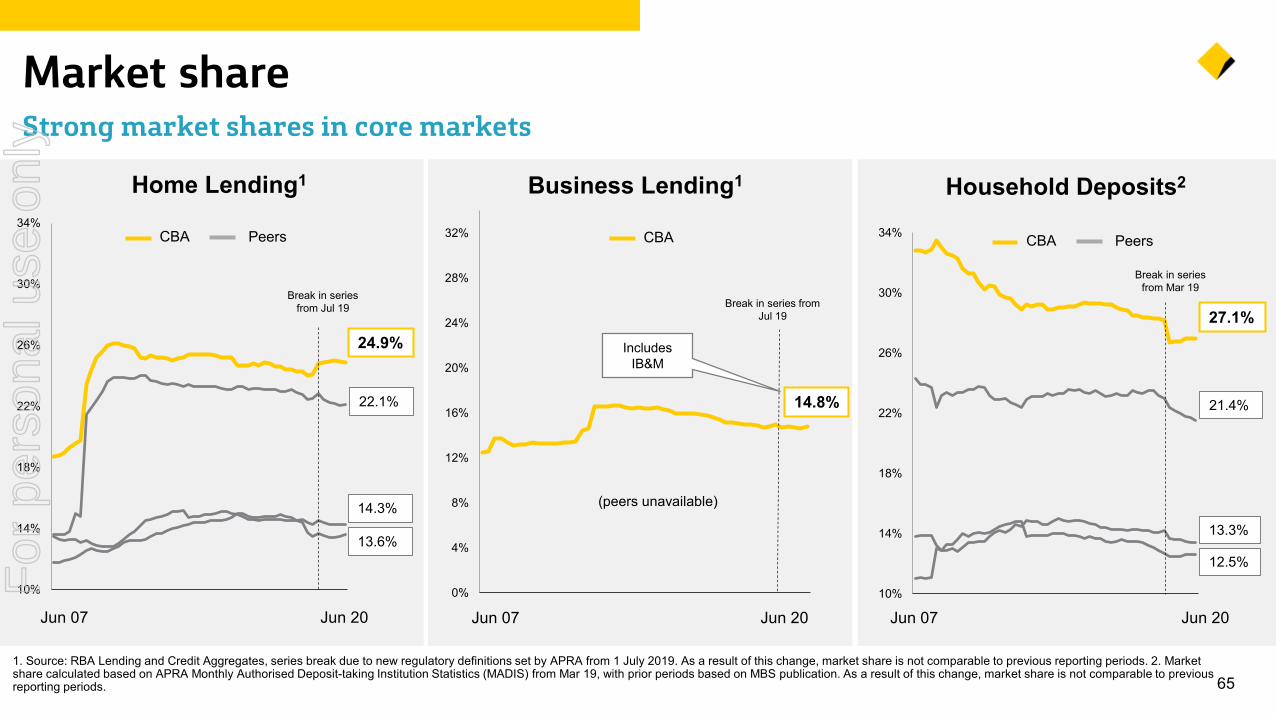
65
Market shareStrong market shares in core markets
Home Lending1 Household Deposits2
1. Source: RBA Lending and Credit Aggregates, series break due to new regulatory definitions set by APRA from 1 July 2019. As a result of this change, market share is not comparable to previous reporting periods. 2. Market share calculated based on APRA Monthly Authorised Deposit-taking Institution Statistics (MADIS) from Mar 19, with prior periods based on MBS publication. As a result of this change, market share is not comparable to previous reporting periods.
0%
4%
8%
12%
16%
20%
24%
28%
32%
Break in series from Jul 19
Business Lending1
Jun 07
(peers unavailable)
14.8%
Jun 20
Includes IB&M
CBA
10%
14%
18%
22%
26%
30%
34%
24.9%
Jun 07 Jun 20
PeersCBA
22.1%
14.3%
13.6%
Break in series from Jul 19
10%
14%
18%
22%
26%
30%
34%
27.1%
Jun 20Jun 07
21.4%
13.3%
12.5%
Break in series from Mar 19
PeersCBA
For
per
sona
l use
onl
y
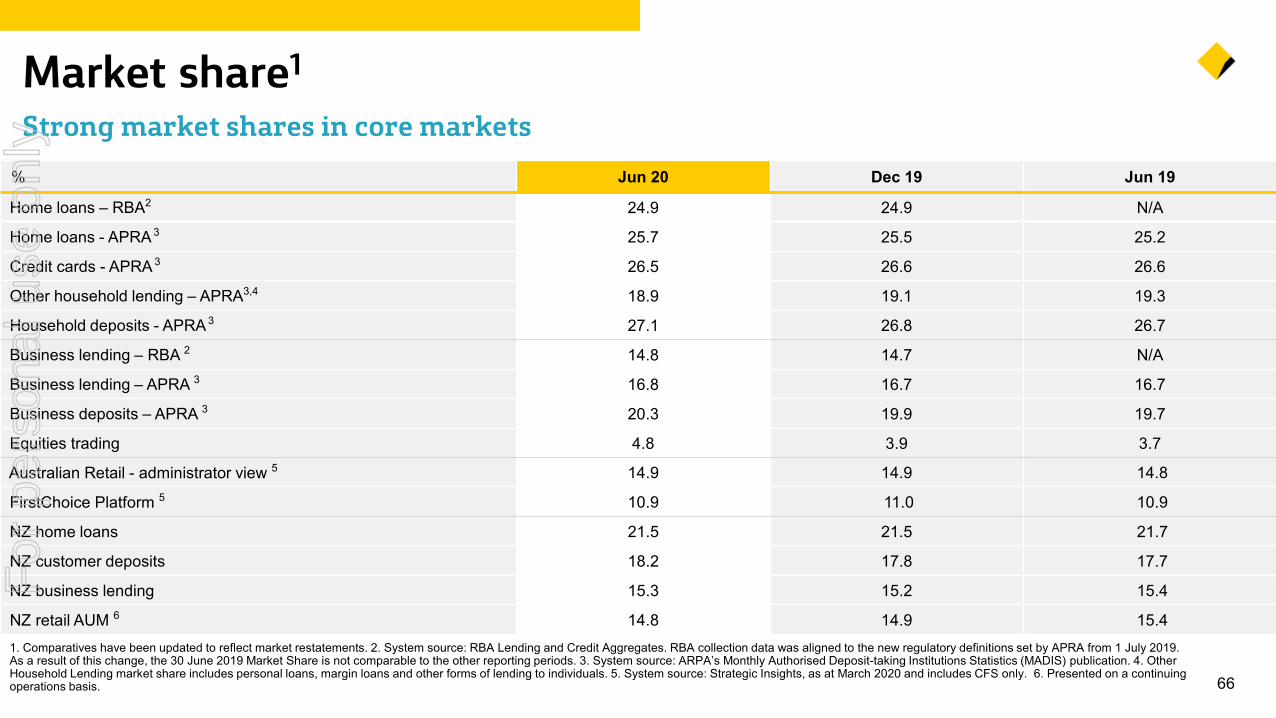
% Jun 20 Dec 19 Jun 19
Home loans – RBA2 24.9 24.9 N/A
Home loans - APRA 3 25.7 25.5 25.2
Credit cards - APRA 3 26.5 26.6 26.6
Other household lending – APRA3,4 18.9 19.1 19.3
Household deposits - APRA 3 27.1 26.8 26.7
Business lending – RBA 2 14.8 14.7 N/A
Business lending – APRA 3 16.8 16.7 16.7
Business deposits – APRA 3 20.3 19.9 19.7
Equities trading 4.8 3.9 3.7
Australian Retail - administrator view 5 14.9 14.9 14.8
FirstChoice Platform 5 10.9 11.0 10.9
NZ home loans 21.5 21.5 21.7
NZ customer deposits 18.2 17.8 17.7
NZ business lending 15.3 15.2 15.4
NZ retail AUM 6 14.8 14.9 15.4
66
1. Comparatives have been updated to reflect market restatements. 2. System source: RBA Lending and Credit Aggregates. RBA collection data was aligned to the new regulatory definitions set by APRA from 1 July 2019. As a result of this change, the 30 June 2019 Market Share is not comparable to the other reporting periods. 3. System source: ARPA’s Monthly Authorised Deposit-taking Institutions Statistics (MADIS) publication. 4. Other Household Lending market share includes personal loans, margin loans and other forms of lending to individuals. 5. System source: Strategic Insights, as at March 2020 and includes CFS only. 6. Presented on a continuing operations basis.
Market share1
Strong market shares in core markets
For
per
sona
l use
onl
y
760 770 778
Jun 19 Dec 19 Jun 20
635 661699
Jun 19 Dec 19 Jun 20
67
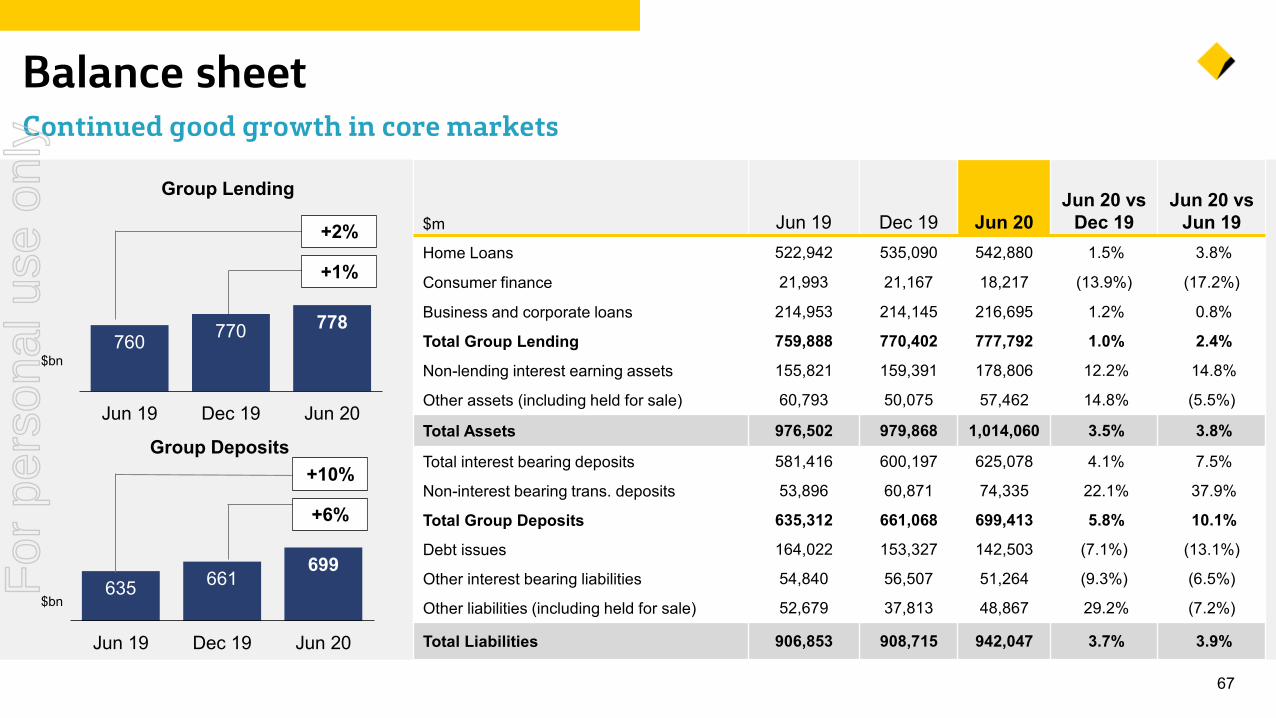
Balance sheet Continued good growth in core markets
$m Jun 19 Dec 19 Jun 20Jun 20 vs
Dec 19Jun 20 vs
Jun 19Home Loans 522,942 535,090 542,880 1.5% 3.8%
Consumer finance 21,993 21,167 18,217 (13.9%) (17.2%)
Business and corporate loans 214,953 214,145 216,695 1.2% 0.8%
Total Group Lending 759,888 770,402 777,792 1.0% 2.4%
Non-lending interest earning assets 155,821 159,391 178,806 12.2% 14.8%
Other assets (including held for sale) 60,793 50,075 57,462 14.8% (5.5%)
Total Assets 976,502 979,868 1,014,060 3.5% 3.8%
Total interest bearing deposits 581,416 600,197 625,078 4.1% 7.5%
Non-interest bearing trans. deposits 53,896 60,871 74,335 22.1% 37.9%
Total Group Deposits 635,312 661,068 699,413 5.8% 10.1%
Debt issues 164,022 153,327 142,503 (7.1%) (13.1%)
Other interest bearing liabilities 54,840 56,507 51,264 (9.3%) (6.5%)
Other liabilities (including held for sale) 52,679 37,813 48,867 29.2% (7.2%)
Total Liabilities 906,853 908,715 942,047 3.7% 3.9%
Group Lending
Group Deposits
$bn
$bn
+2%
+1%
+10%
+6%
For
per
sona
l use
onl
y
68
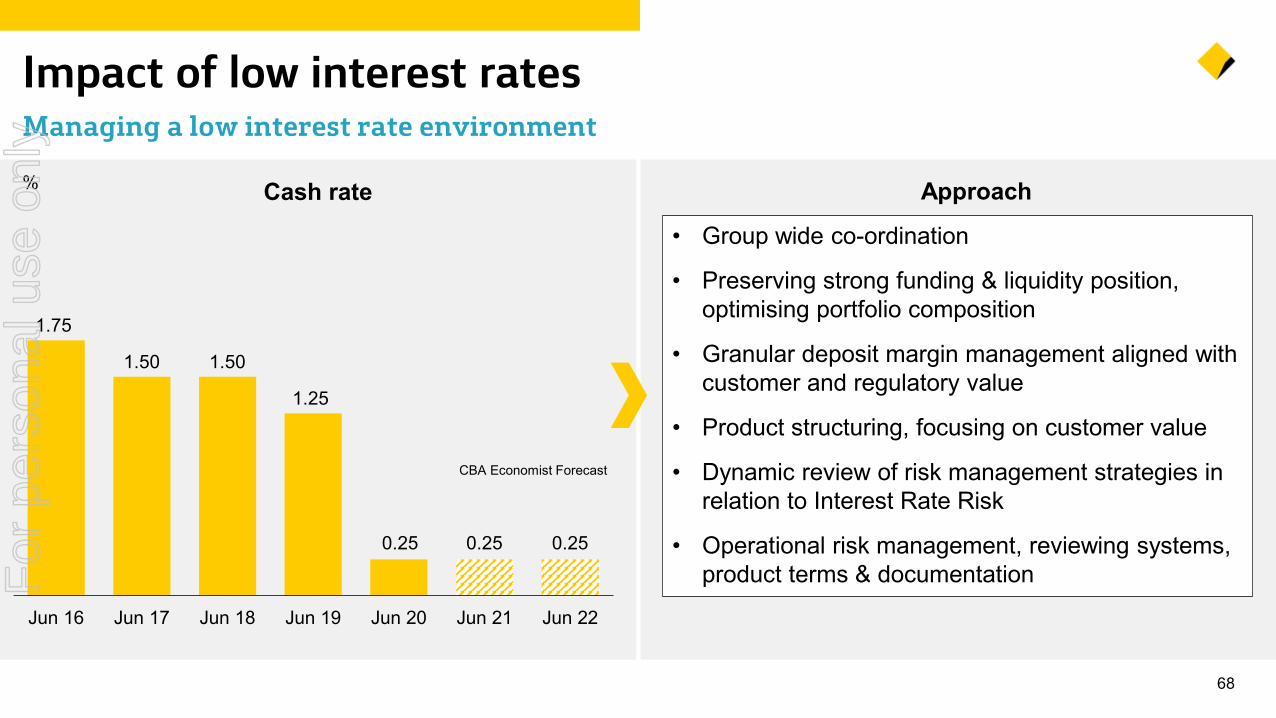
Impact of low interest ratesManaging a low interest rate environment
Cash rate %
1.75
1.50 1.50
1.25
0.25 0.25 0.25
Jun 16 Jun 17 Jun 18 Jun 19 Jun 20 Jun 21 Jun 22
CBA Economist Forecast
• Group wide co-ordination
• Preserving strong funding & liquidity position, optimising portfolio composition
• Granular deposit margin management aligned with customer and regulatory value
• Product structuring, focusing on customer value
• Dynamic review of risk management strategies in relation to Interest Rate Risk
• Operational risk management, reviewing systems, product terms & documentation
Approach
For
per
sona
l use
onl
y
209207
73
5
-
(8) (6)
(3)
FY19 AssetPricing
Deposit Pricing &Funding
PortfolioMix
Basis Risk(Incl RP)
Capital and Other
Treasury andMarkets
FY20
691. Presented on a continuing operations basis. 2. The implementation of AASB 16 results in the recognition of a lease liability and therefore higher interest expense.
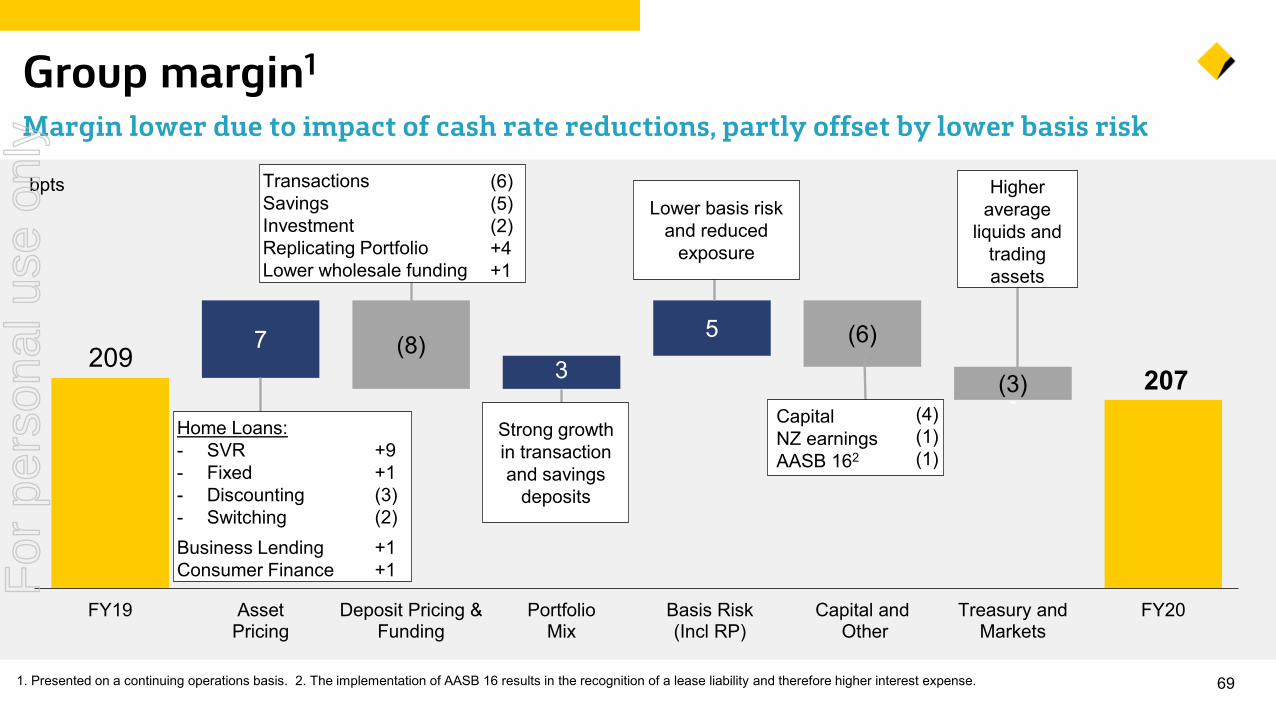
Group margin1
Margin lower due to impact of cash rate reductions, partly offset by lower basis risk
bpts
Strong growth in transaction and savings
deposits
Higher average
liquids and trading assets
Lower basis risk and reduced
exposure
Home Loans: - SVR- Fixed- Discounting- SwitchingBusiness LendingConsumer Finance
+9+1(3)(2)+1+1
TransactionsSavings InvestmentReplicating Portfolio Lower wholesale funding
(6)(5)(2)+4+1
Capital NZ earningsAASB 162
(4)(1)(1)
For
per
sona
l use
onl
y
701. Earnings impact on domestic transactions and savings deposits excluding impact from the hedge. 2. Tractor is the moving average hedge rate on equity and rate insensitive deposits. Exit Tractor rate represents average rate for June 2020. 3. Estimates based on Jun-20 interest rates and assumes the additional liquids are funded with a combination of at-call deposits and partial drawdown of TFF 4. Includes the impact of basis risk on replicating portfolio. 5. Average exposure to Basis Risk in June 2020.
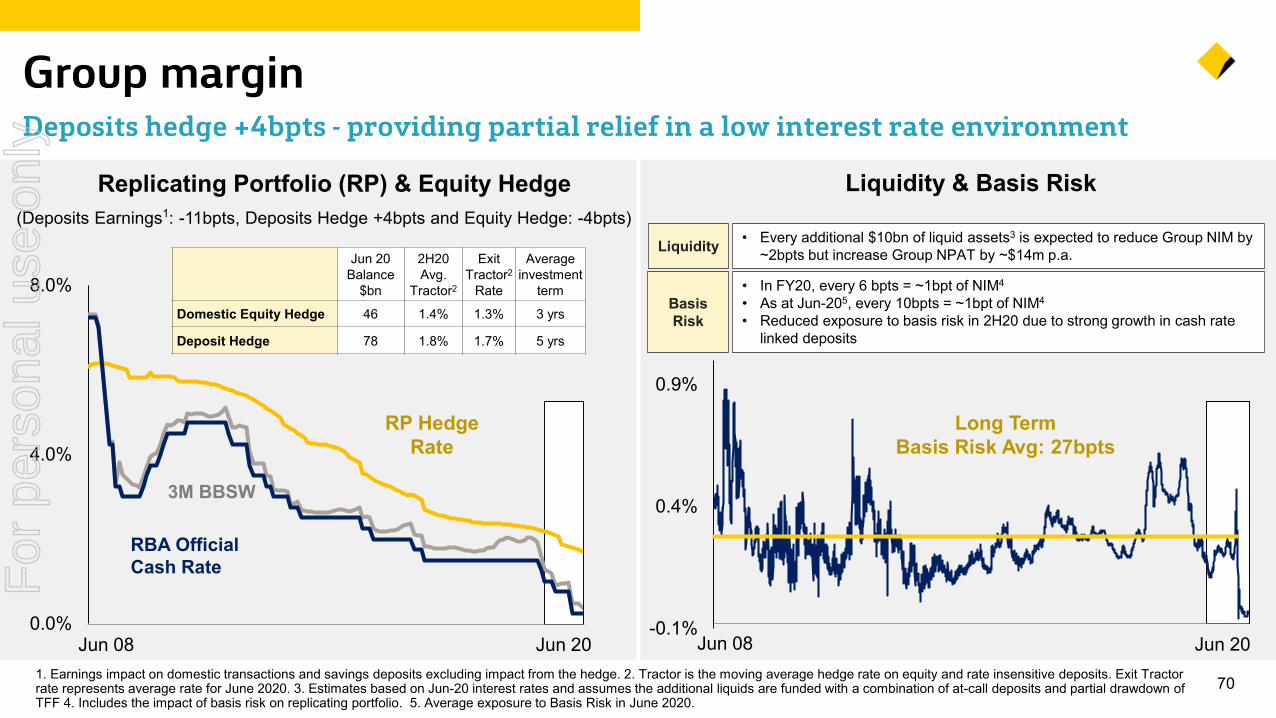
Group marginDeposits hedge +4bpts - providing partial relief in a low interest rate environment
Replicating Portfolio (RP) & Equity Hedge
Jun 08 Jun 20
3M BBSW
RP Hedge Rate
RBA Official Cash Rate
-0.1%
0.4%
0.9%
Jun 08 Jun 20
Liquidity & Basis Risk
Long Term Basis Risk Avg: 27bpts
(Deposits Earnings1: -11bpts, Deposits Hedge +4bpts and Equity Hedge: -4bpts)
• In FY20, every 6 bpts = ~1bpt of NIM4
• As at Jun-205, every 10bpts = ~1bpt of NIM4
• Reduced exposure to basis risk in 2H20 due to strong growth in cash rate linked deposits
0.0%
4.0%
8.0%
• Every additional $10bn of liquid assets3 is expected to reduce Group NIM by ~2bpts but increase Group NPAT by ~$14m p.a.Liquidity
Basis Risk
Jun 20 Balance
$bn
2H20 Avg.
Tractor2
ExitTractor2
Rate
Average investment
term
Domestic Equity Hedge 46 1.4% 1.3% 3 yrs
Deposit Hedge 78 1.8% 1.7% 5 yrs
For
per
sona
l use
onl
y
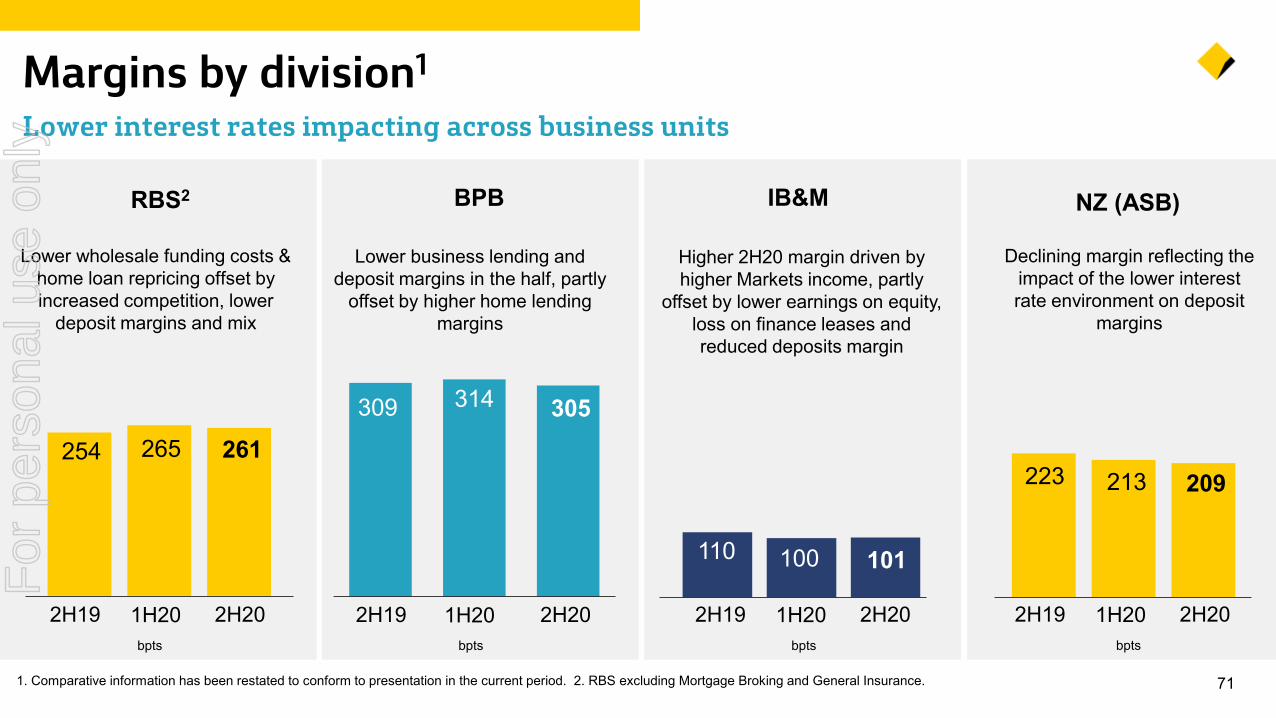
711. Comparative information has been restated to conform to presentation in the current period. 2. RBS excluding Mortgage Broking and General Insurance.
Margins by division1
Lower interest rates impacting across business units
NZ (ASB)
bpts
2H202H19 1H20bpts
2H202H19 1H20bpts
Declining margin reflecting the impact of the lower interest rate environment on deposit
margins
213 209223
BPB
Lower business lending and deposit margins in the half, partly
offset by higher home lending margins
309 314 305
IB&M
Higher 2H20 margin driven by higher Markets income, partly
offset by lower earnings on equity, loss on finance leases and reduced deposits margin
bpts
2H202H19 1H20
100 101110
RBS2
Lower wholesale funding costs & home loan repricing offset by increased competition, lower
deposit margins and mix
254 265 261
2H202H19 1H20
For
per
sona
l use
onl
y
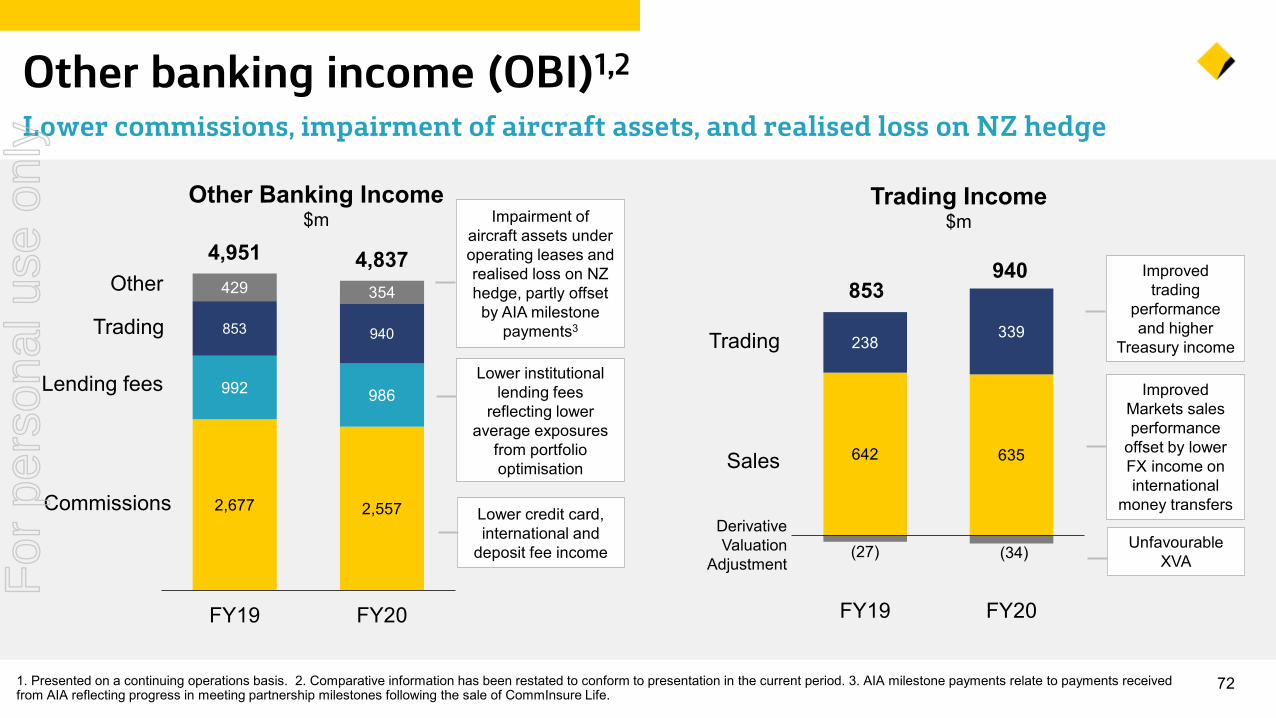
2,677 2,557
992 986
853 940
429 354
4,951 4,837
FY19 FY20
642 635
238 339
(27) (34)
853940
FY19 FY20
721. Presented on a continuing operations basis. 2. Comparative information has been restated to conform to presentation in the current period. 3. AIA milestone payments relate to payments received from AIA reflecting progress in meeting partnership milestones following the sale of CommInsure Life.
Other banking income (OBI)1,2
Lower commissions, impairment of aircraft assets, and realised loss on NZ hedge
Other Banking Income$m
Trading Income$m
Commissions
Lending fees
Trading
Other
Sales
Trading
Derivative Valuation
Adjustment
Lower institutional lending fees
reflecting lower average exposures
from portfolio optimisation
Lower credit card, international and
deposit fee income
Improved trading
performance and higher
Treasury income
Unfavourable XVA
Impairment of aircraft assets under operating leases and realised loss on NZ hedge, partly offset by AIA milestone
payments3
Improved Markets sales performance
offset by lower FX income on international
money transfers
For
per
sona
l use
onl
y
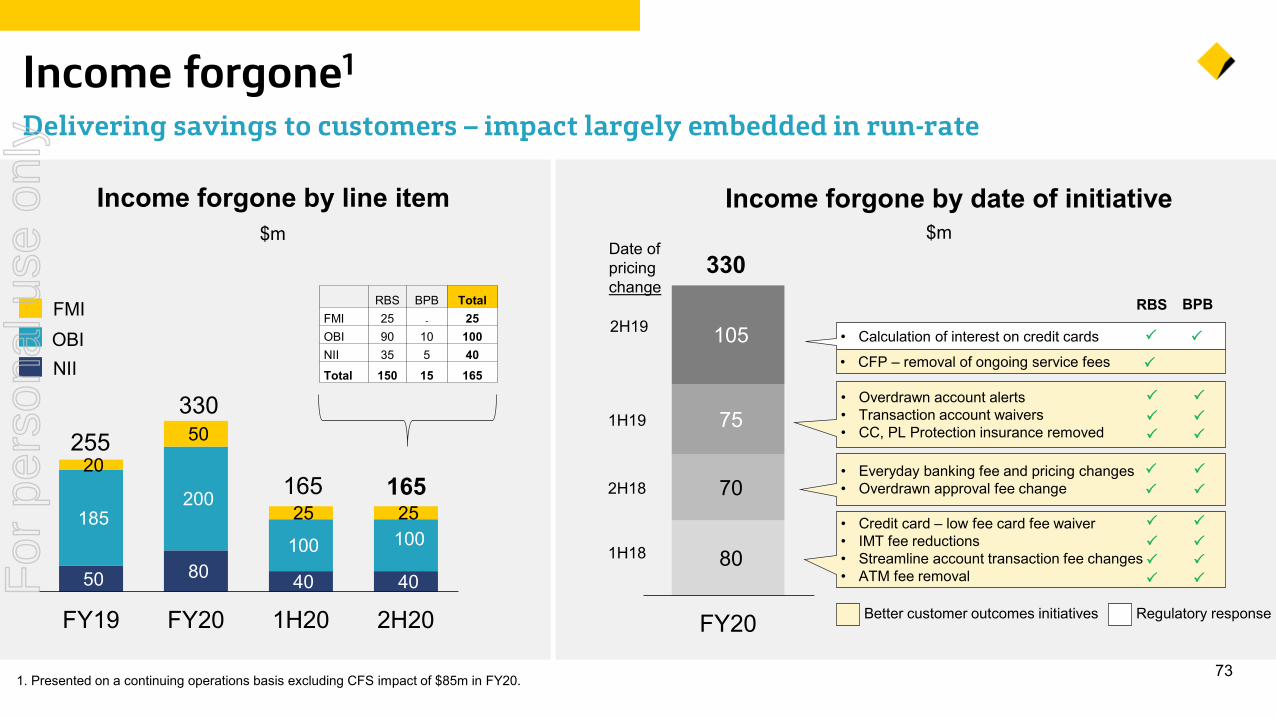
50 80 40 40
185 200
100 100
20 50
25 25
FY19 FY20 1H20 2H20
73
Income forgone1
Delivering savings to customers – impact largely embedded in run-rate
Income forgone by line item
255
165
330
FMIOBINII
80
70
75
105
FY20
Date of pricing change
1H18
2H18
1H19
2H19
330RBS BPB Total
FMI 25 - 25OBI 90 10 100NII 35 5 40Total 150 15 165
• Overdrawn account alerts • Transaction account waivers • CC, PL Protection insurance removed
• Everyday banking fee and pricing changes • Overdrawn approval fee change
• Credit card – low fee card fee waiver• IMT fee reductions • Streamline account transaction fee changes• ATM fee removal
• Calculation of interest on credit cards
RBS BPB
• CFP – removal of ongoing service fees
Better customer outcomes initiatives Regulatory response
Income forgone by date of initiative$m $m
165
1. Presented on a continuing operations basis excluding CFS impact of $85m in FY20.
For
per
sona
l use
onl
y
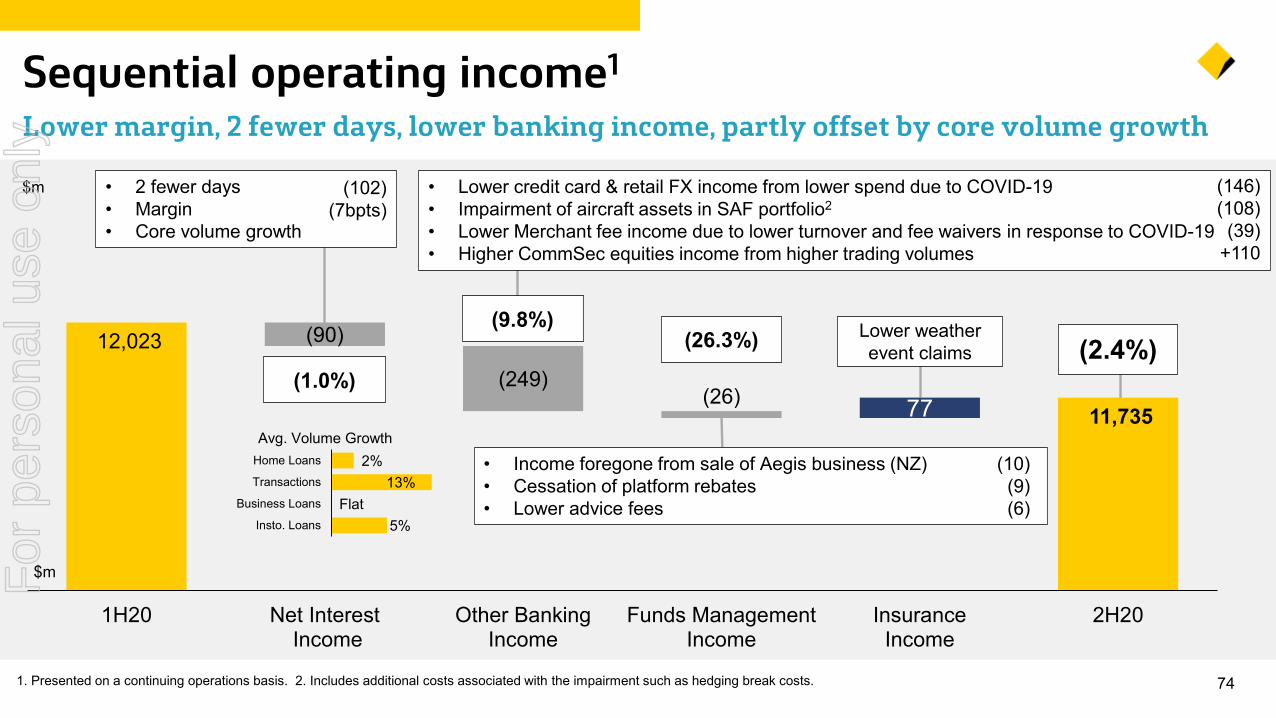
12,023
11,735 77
(90)
(249)(26)
1H20 Net Interest Income
Other BankingIncome
Funds ManagementIncome
InsuranceIncome
2H20
741. Presented on a continuing operations basis. 2. Includes additional costs associated with the impairment such as hedging break costs.
Sequential operating income1
Lower margin, 2 fewer days, lower banking income, partly offset by core volume growth
$m • 2 fewer days• Margin• Core volume growth
• Lower credit card & retail FX income from lower spend due to COVID-19 • Impairment of aircraft assets in SAF portfolio2
• Lower Merchant fee income due to lower turnover and fee waivers in response to COVID-19• Higher CommSec equities income from higher trading volumes
• Income foregone from sale of Aegis business (NZ)• Cessation of platform rebates• Lower advice fees
(2.4%)Lower weather event claims
(1.0%)
(9.8%)(26.3%)
2%13%
Flat5%
Home Loans
Transactions
Business Loans
Insto. Loans
Avg. Volume Growth
(146)(108)
(39)+110
(102)(7bpts)
(10)(9)(6)
$mFor
per
sona
l use
onl
y
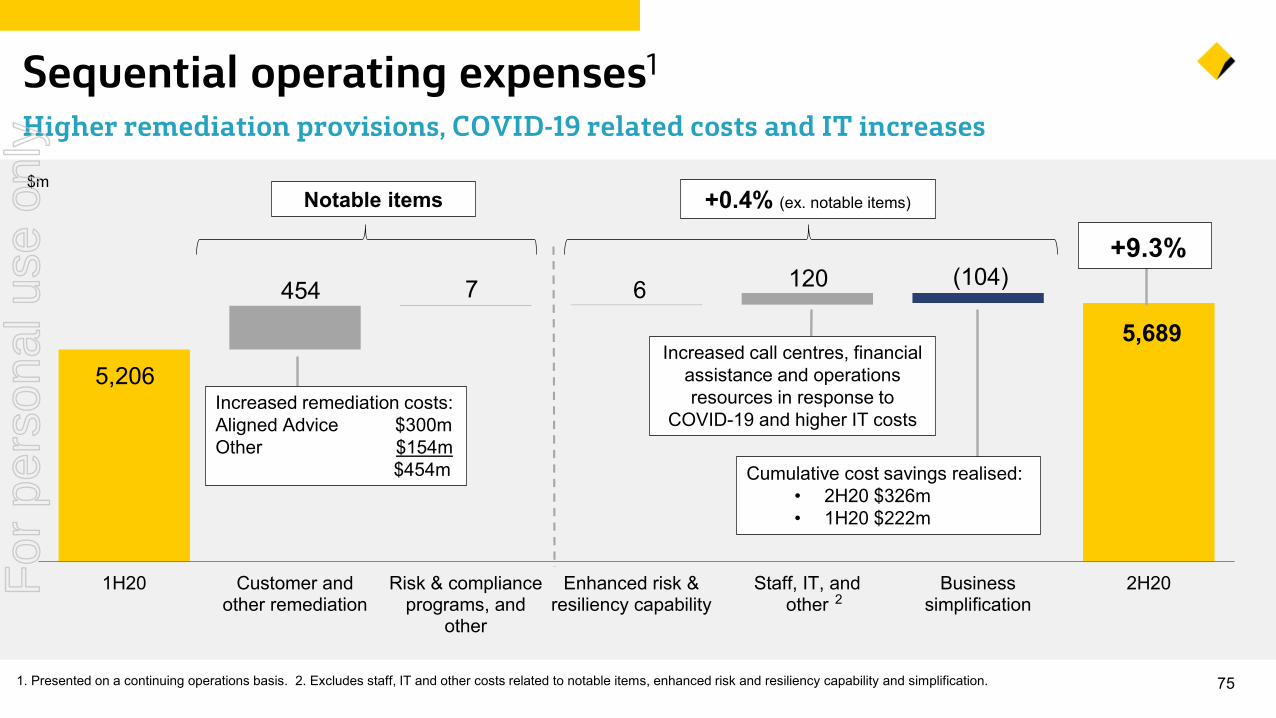
751. Presented on a continuing operations basis. 2. Excludes staff, IT and other costs related to notable items, enhanced risk and resiliency capability and simplification.
Sequential operating expenses1
Higher remediation provisions, COVID-19 related costs and IT increases
454 7 6 120 (104)
5,206
5,689
3,000
4,000
5,000
6,000
7,000
1H20 Customer andother remediation
Risk & complianceprograms, and
other
Enhanced risk &resiliency capability
Staff, IT, andother
Businesssimplification
2H20
$m
2
Notable items
+9.3%
+0.4% (ex. notable items)
Increased call centres, financial assistance and operations resources in response to
COVID-19 and higher IT costs
Cumulative cost savings realised:• 2H20 $326m• 1H20 $222m
Increased remediation costs:Aligned Advice $300mOther $154m
$454m
For
per
sona
l use
onl
y
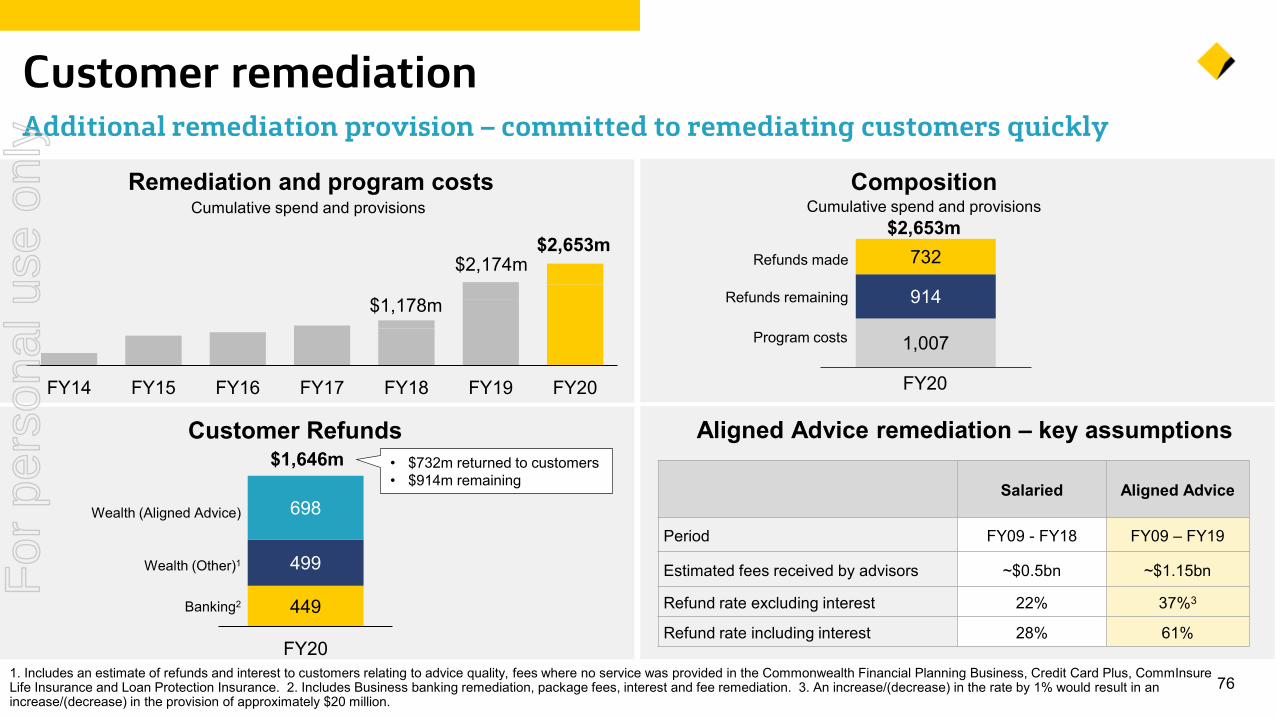
761. Includes an estimate of refunds and interest to customers relating to advice quality, fees where no service was provided in the Commonwealth Financial Planning Business, Credit Card Plus, CommInsureLife Insurance and Loan Protection Insurance. 2. Includes Business banking remediation, package fees, interest and fee remediation. 3. An increase/(decrease) in the rate by 1% would result in an increase/(decrease) in the provision of approximately $20 million.
Customer remediationAdditional remediation provision – committed to remediating customers quickly
Composition
Customer Refunds Aligned Advice remediation – key assumptions
Salaried Aligned Advice
Period FY09 - FY18 FY09 – FY19
Estimated fees received by advisors ~$0.5bn ~$1.15bn
Refund rate excluding interest 22% 37%3
Refund rate including interest 28% 61%449
499
698
FY20
$1,646m
Wealth (Other)1
Banking2
Wealth (Aligned Advice)
Remediation and program costs
FY14 FY15 FY16 FY17 FY18 FY19 FY20
$1,178m
$2,653m$2,174m
• $732m returned to customers • $914m remaining
Refunds remaining
1,007
914
732 Refunds made
Program costs
$2,653m
FY20
Cumulative spend and provisionsCumulative spend and provisions
For
per
sona
l use
onl
y
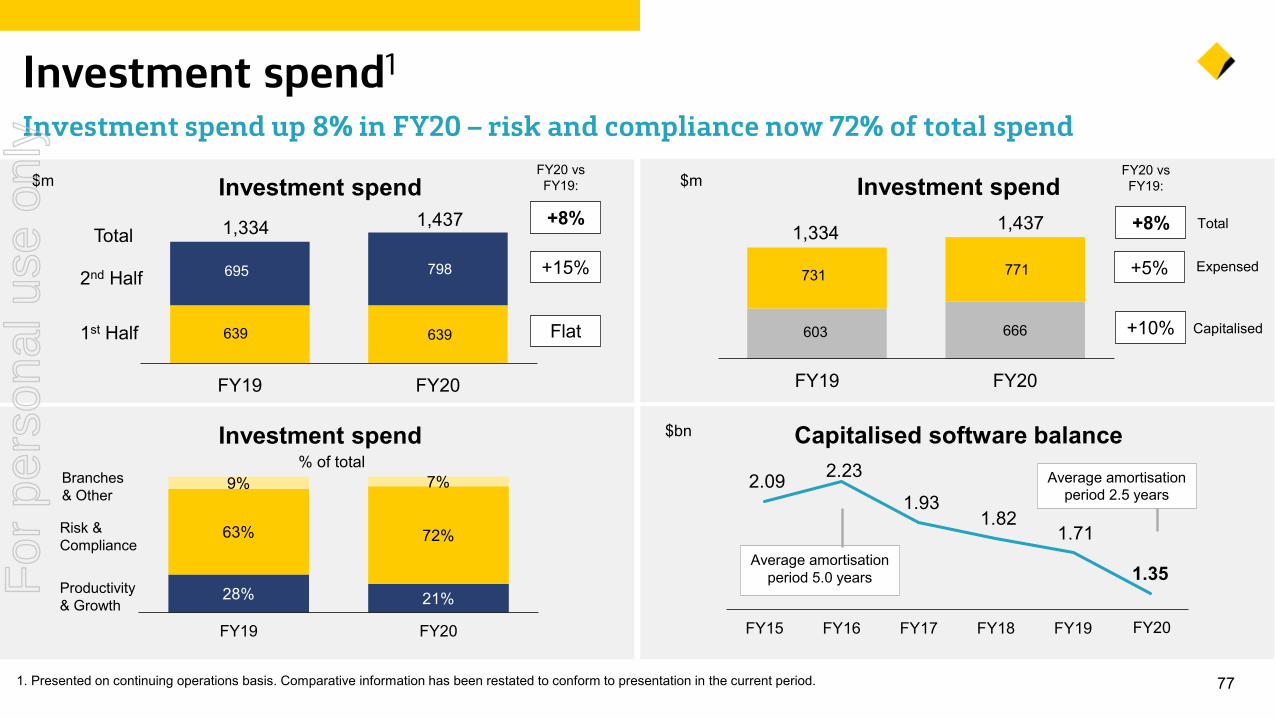
771. Presented on continuing operations basis. Comparative information has been restated to conform to presentation in the current period.
Investment spend1
Investment spend up 8% in FY20 – risk and compliance now 72% of total spend
2.09 2.23
1.93 1.82
1.71
1.35
FY15 FY16 FY17 FY18 FY19 1H20
Average amortisation period 5.0 years
Average amortisationperiod 2.5 years
Investment spend% of total
Investment spendInvestment spend$m $m
Capitalised software balance
1st Half
2nd Half
FY20 vs FY19:
$bn
FY20 vs FY19:
Total
639 639
695 798
FY19 FY20
+8%
+15%
Flat
1,334 1,437
603 666
731 771
FY19 FY20
+8%
+5%
+10%
Total
Expensed
Capitalised
1,334 1,437
28% 21%
63% 72%
9% 7%
FY19 FY20
Branches & Other
Productivity& Growth
Risk &Compliance
FY20
For
per
sona
l use
onl
y
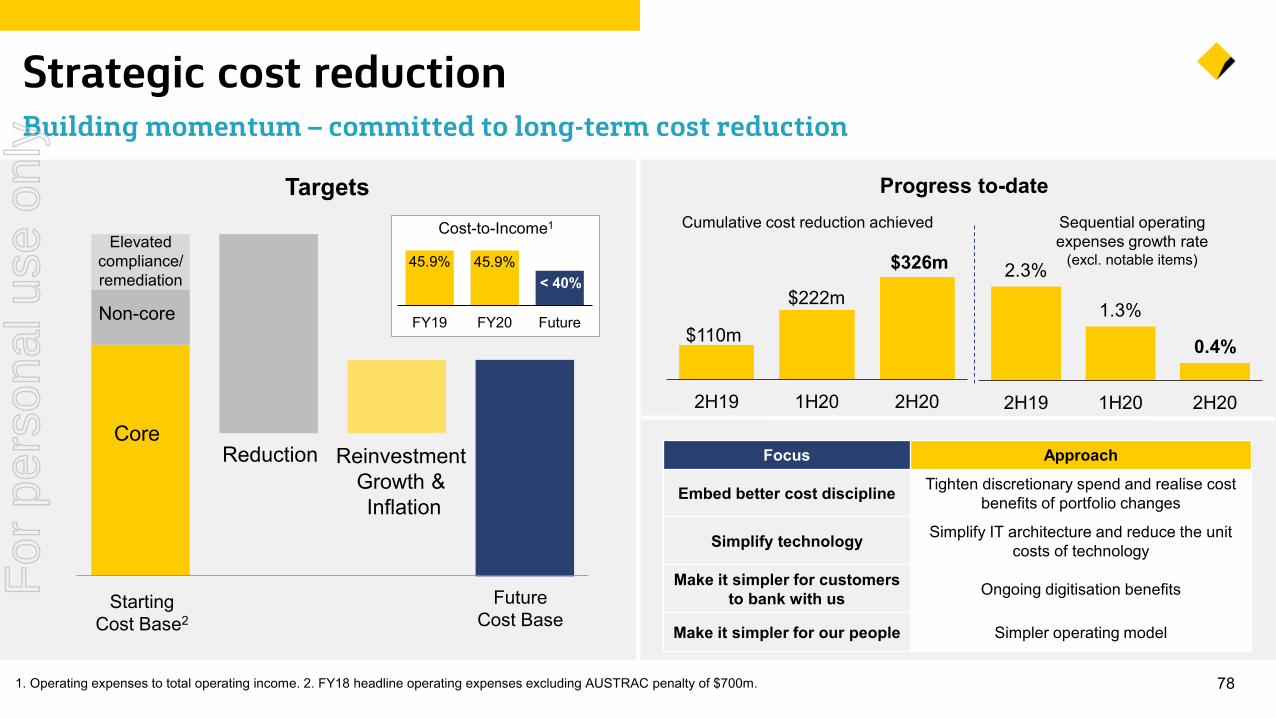
78
Strategic cost reduction Building momentum – committed to long-term cost reduction
Focus Approach
Embed better cost discipline Tighten discretionary spend and realise cost benefits of portfolio changes
Simplify technology Simplify IT architecture and reduce the unit costs of technology
Make it simpler for customers to bank with us Ongoing digitisation benefits
Make it simpler for our people Simpler operating model
FY18Cost Base
FutureCost Base
Future Cost Base
CoreReduction Reinvestment
Growth & Inflation
Elevated compliance/ remediation
Non-core
Starting Cost Base2
1. Operating expenses to total operating income. 2. FY18 headline operating expenses excluding AUSTRAC penalty of $700m.
45.9% 45.9%< 40%
FY19 FY20 Future
Cost-to-Income1
Targets
2.3%
1.3%
0.4%
2H19 1H20 2H20
Progress to-date Cumulative cost reduction achieved
$110m
$222m
$326m
2H19 1H20 2H20
Sequential operating expenses growth rate
(excl. notable items)
For
per
sona
l use
onl
y
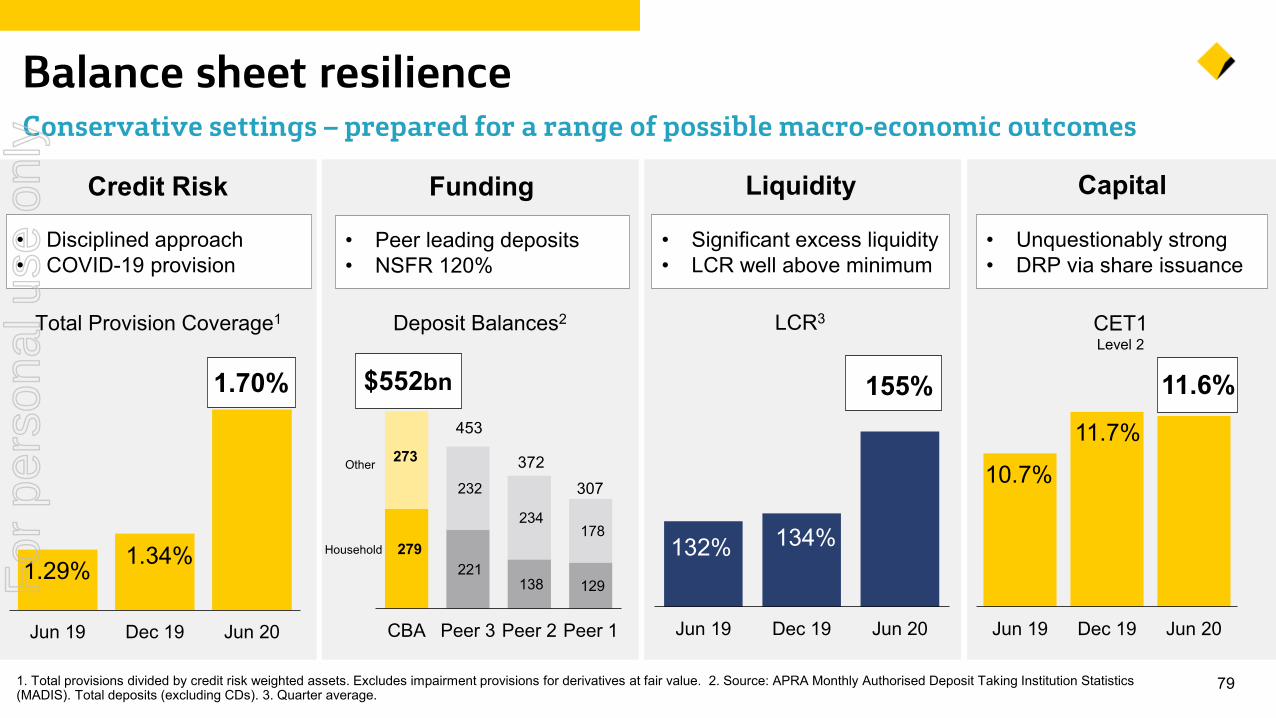
10.7%
11.6%
Jun 19 Dec 19 Jun 20
1.29% 1.34%
1.70%
Jun 19 Dec 19 Jun 20
791. Total provisions divided by credit risk weighted assets. Excludes impairment provisions for derivatives at fair value. 2. Source: APRA Monthly Authorised Deposit Taking Institution Statistics (MADIS). Total deposits (excluding CDs). 3. Quarter average.
Balance sheet resilience Conservative settings – prepared for a range of possible macro-economic outcomes
Total Provision Coverage1 CET1Level 2
Credit Risk Funding Liquidity Capital
• Disciplined approach• COVID-19 provision
• Peer leading deposits• NSFR 120%
• Unquestionably strong• DRP via share issuance
11.7%
Deposit Balances2 LCR3
• Significant excess liquidity• LCR well above minimum
132% 134%
155%
Jun 19 Dec 19 Jun 20
Household
Other
$552bn
279 221
138 129
273
232
234 178
CBA Peer 3 Peer 2 Peer 1
307372
453
For
per
sona
l use
onl
y
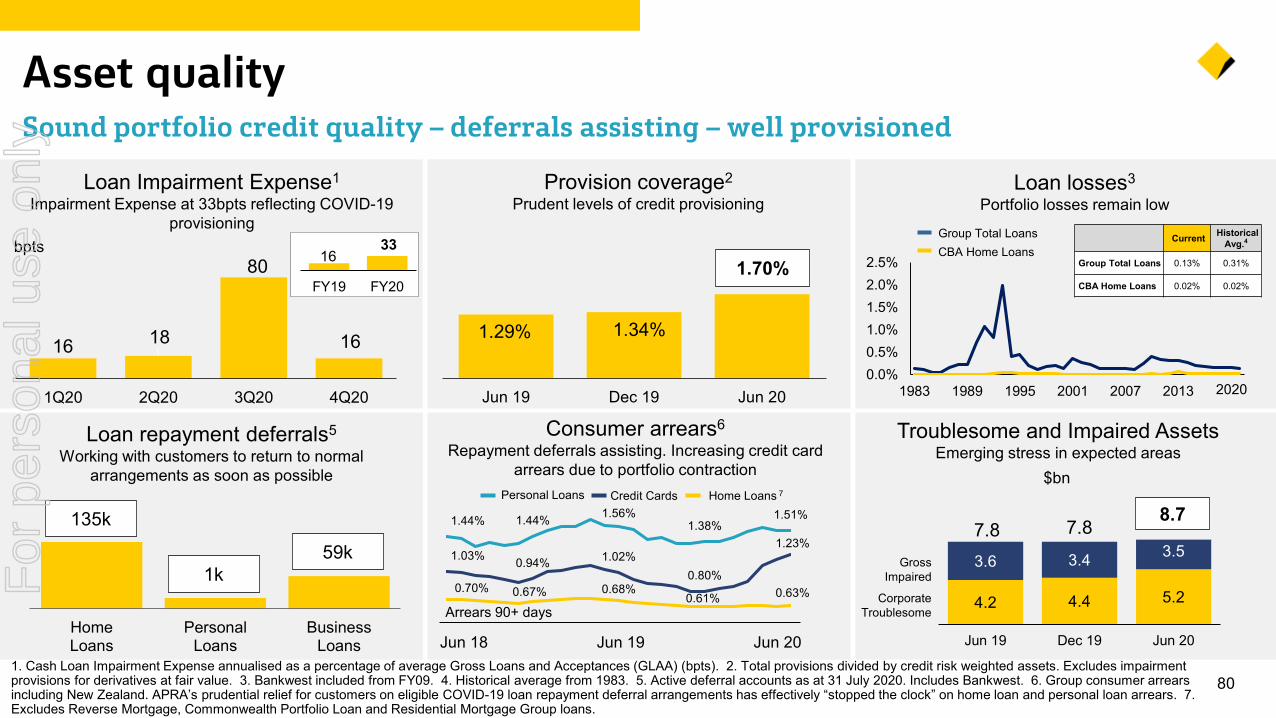
0.70% 0.67% 0.68%0.61% 0.63%
1.44% 1.44% 1.56%1.38%
1.51%
1.03% 0.94% 1.02%0.80%
1.23%
801. Cash Loan Impairment Expense annualised as a percentage of average Gross Loans and Acceptances (GLAA) (bpts). 2. Total provisions divided by credit risk weighted assets. Excludes impairment provisions for derivatives at fair value. 3. Bankwest included from FY09. 4. Historical average from 1983. 5. Active deferral accounts as at 31 July 2020. Includes Bankwest. 6. Group consumer arrears including New Zealand. APRA’s prudential relief for customers on eligible COVID-19 loan repayment deferral arrangements has effectively “stopped the clock” on home loan and personal loan arrears. 7. Excludes Reverse Mortgage, Commonwealth Portfolio Loan and Residential Mortgage Group loans.
Asset quality Sound portfolio credit quality – deferrals assisting – well provisioned
Loan repayment deferrals5
Working with customers to return to normal arrangements as soon as possible
140
2268
HomeLoans
PersonalLoans
BusinessLoans
135k
1k59k
Provision coverage2
Prudent levels of credit provisioning
16 18
80
16
1Q20 2Q20 3Q20 4Q20
Loan Impairment Expense1
Impairment Expense at 33bpts reflecting COVID-19 provisioning
1.29% 1.34%
1.70%
Jun 19 Dec 19 Jun 20
1633
FY19 FY20
Troublesome and Impaired AssetsEmerging stress in expected areas
Consumer arrears6
Repayment deferrals assisting. Increasing credit card arrears due to portfolio contraction
Jun 18 Jun 19 Jun 20
Personal Loans Credit Cards Home Loans 7
Arrears 90+ days 4.2 4.4 5.2
3.6 3.4 3.57.8 7.8
8.7
Jun 19 Dec 19 Jun 20
Gross Impaired
CorporateTroublesome
Loan losses3
Portfolio losses remain low
Current Historical Avg.4
Group Total Loans 0.13% 0.31%
CBA Home Loans 0.02% 0.02%
Group Total LoansCBA Home Loans
0.0%0.5%1.0%1.5%2.0%2.5%
1983 1989 1995 2001 2007 2013 20192020
$bn
bpts
For
per
sona
l use
onl
y
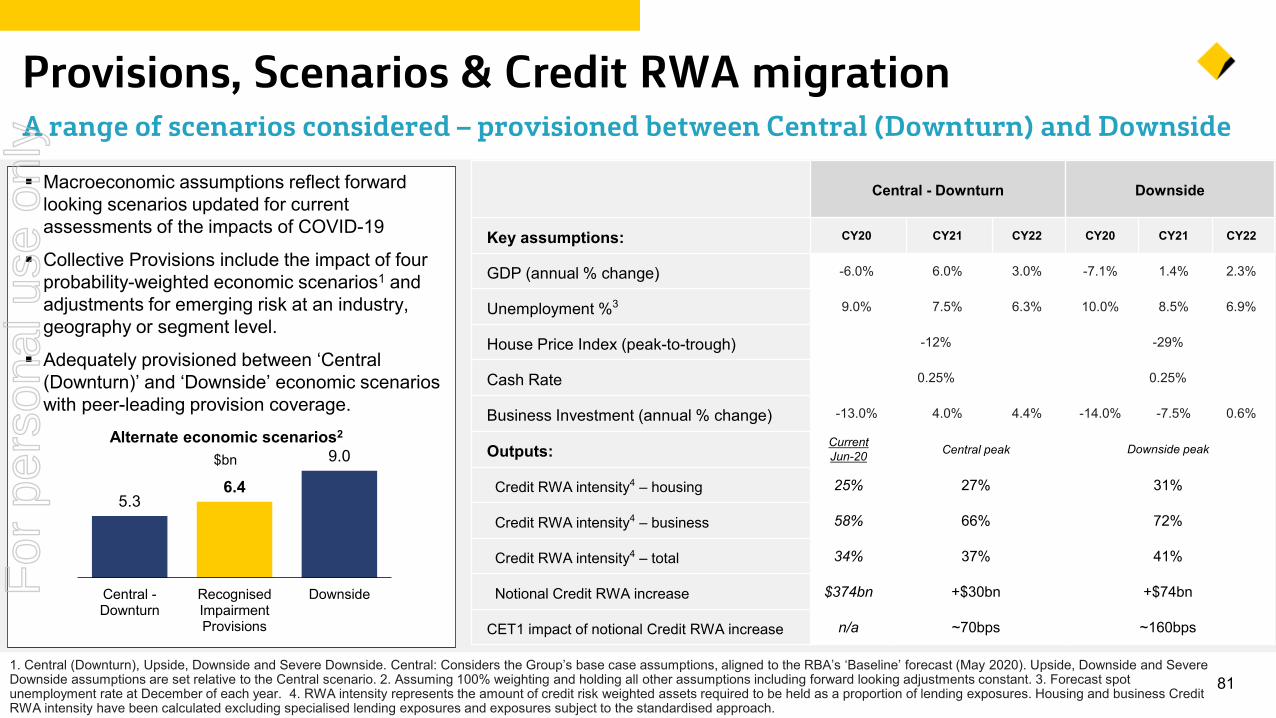
811. Central (Downturn), Upside, Downside and Severe Downside. Central: Considers the Group’s base case assumptions, aligned to the RBA’s ‘Baseline’ forecast (May 2020). Upside, Downside and Severe Downside assumptions are set relative to the Central scenario. 2. Assuming 100% weighting and holding all other assumptions including forward looking adjustments constant. 3. Forecast spot unemployment rate at December of each year. 4. RWA intensity represents the amount of credit risk weighted assets required to be held as a proportion of lending exposures. Housing and business Credit RWA intensity have been calculated excluding specialised lending exposures and exposures subject to the standardised approach.
Provisions, Scenarios & Credit RWA migration A range of scenarios considered – provisioned between Central (Downturn) and Downside
Central - Downturn Downside
Key assumptions: CY20 CY21 CY22 CY20 CY21 CY22
GDP (annual % change) -6.0% 6.0% 3.0% -7.1% 1.4% 2.3%
Unemployment %3 9.0% 7.5% 6.3% 10.0% 8.5% 6.9%
House Price Index (peak-to-trough) -12% -29%
Cash Rate 0.25% 0.25%
Business Investment (annual % change) -13.0% 4.0% 4.4% -14.0% -7.5% 0.6%
Outputs: CurrentJun-20 Central peak Downside peak
Credit RWA intensity4 – housing 25% 27% 31%
Credit RWA intensity4 – business 58% 66% 72%
Credit RWA intensity4 – total 34% 37% 41%
Notional Credit RWA increase $374bn +$30bn +$74bn
CET1 impact of notional Credit RWA increase n/a ~70bps ~160bps
Macroeconomic assumptions reflect forward looking scenarios updated for current assessments of the impacts of COVID-19
Collective Provisions include the impact of four probability-weighted economic scenarios1 and adjustments for emerging risk at an industry, geography or segment level.
Adequately provisioned between ‘Central (Downturn)’ and ‘Downside’ economic scenarios with peer-leading provision coverage.
$bnAlternate economic scenarios2
5.36.4
9.0
Central -Downturn
RecognisedImpairmentProvisions
DownsideFor
per
sona
l use
onl
y
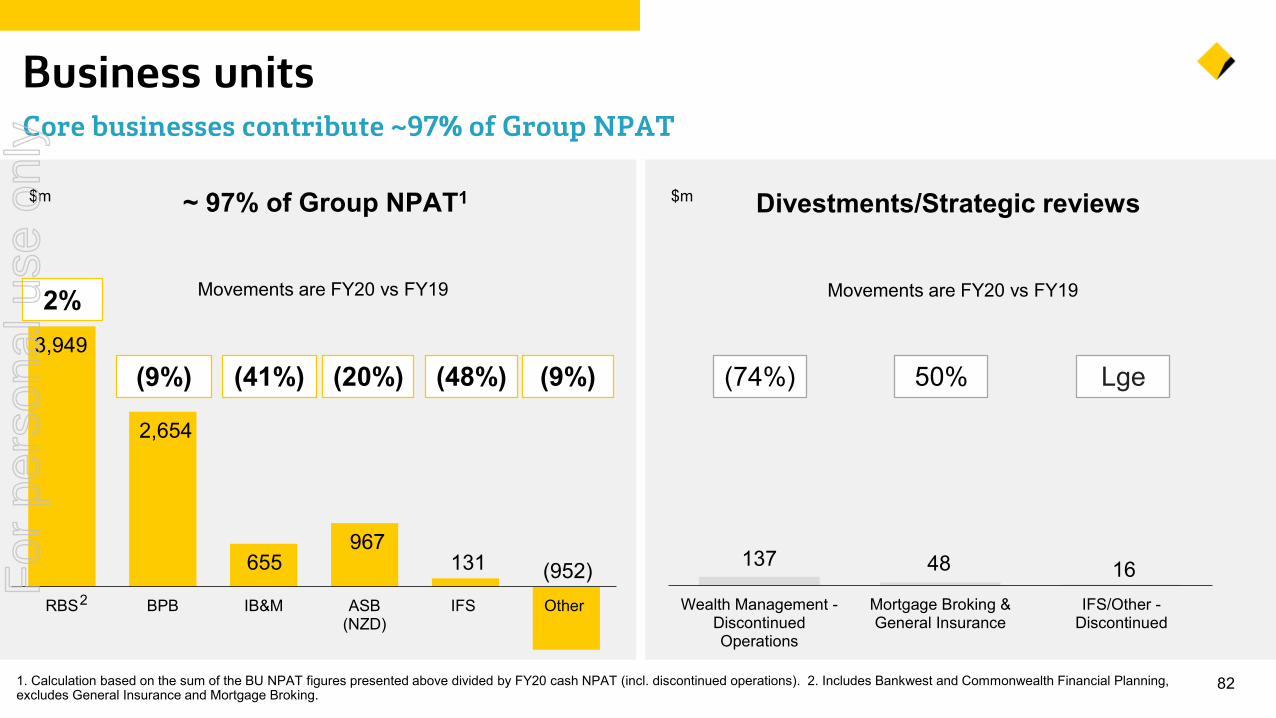
3,949
2,654
655 967
131 (952)RBS BPB IB&M ASB
(NZD)IFS Other
821. Calculation based on the sum of the BU NPAT figures presented above divided by FY20 cash NPAT (incl. discontinued operations). 2. Includes Bankwest and Commonwealth Financial Planning, excludes General Insurance and Mortgage Broking.
Business unitsCore businesses contribute ~97% of Group NPAT
$m
2
~ 97% of Group NPAT1
Movements are FY20 vs FY19
Divestments/Strategic reviews
Movements are FY20 vs FY19
$m
137 48 16Wealth Management -
DiscontinuedOperations
Mortgage Broking &General Insurance
IFS/Other -Discontinued
2%
(41%) (48%)(20%) (74%)(9%) Lge50%(9%)
For
per
sona
l use
onl
y
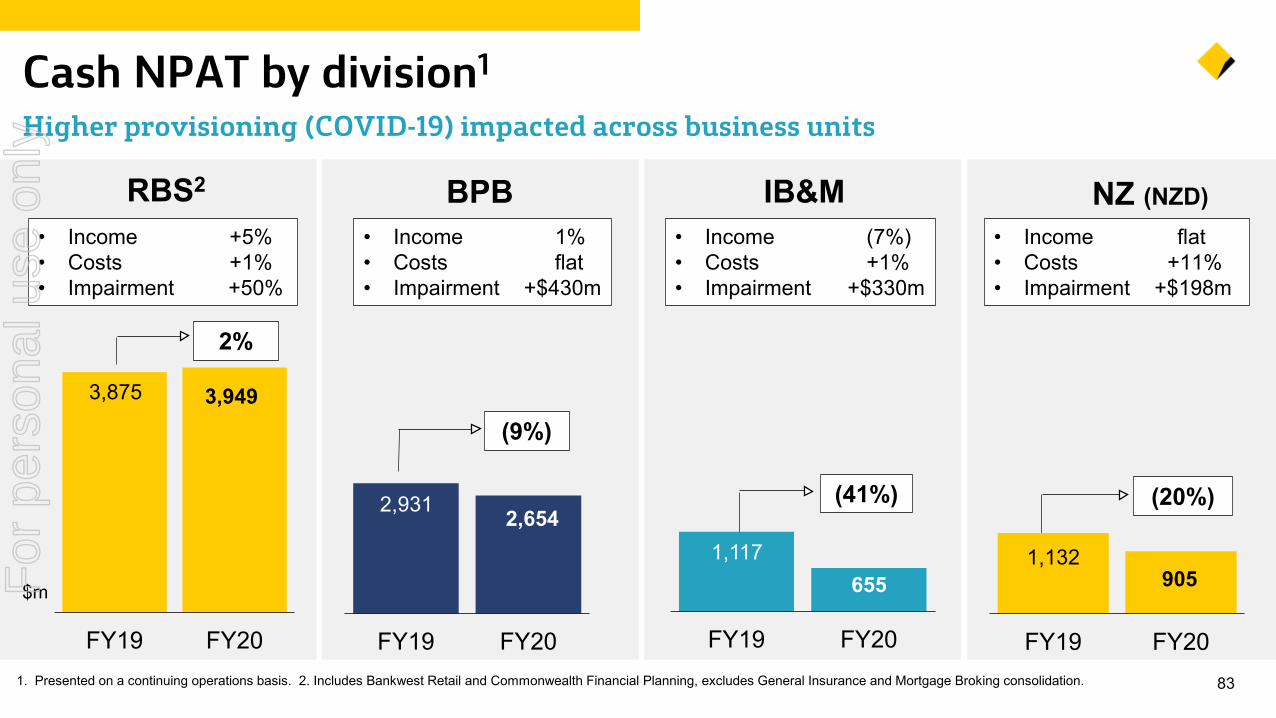
831. Presented on a continuing operations basis. 2. Includes Bankwest Retail and Commonwealth Financial Planning, excludes General Insurance and Mortgage Broking consolidation.
Cash NPAT by division1
Higher provisioning (COVID-19) impacted across business units
NZ (NZD)
1,132905
FY19 FY20
(20%)
• Income flat• Costs +11%• Impairment +$198m
3,875 3,949
FY19 FY20
$m
RBS2
• Income +5%• Costs +1%• Impairment +50%
2%
2,931 2,654
FY19 FY20
BPB
(9%)
• Income 1%• Costs flat• Impairment +$430m
IB&M
1,117 655
FY19 FY20
(41%)
• Income (7%)• Costs +1%• Impairment +$330m
For
per
sona
l use
onl
y
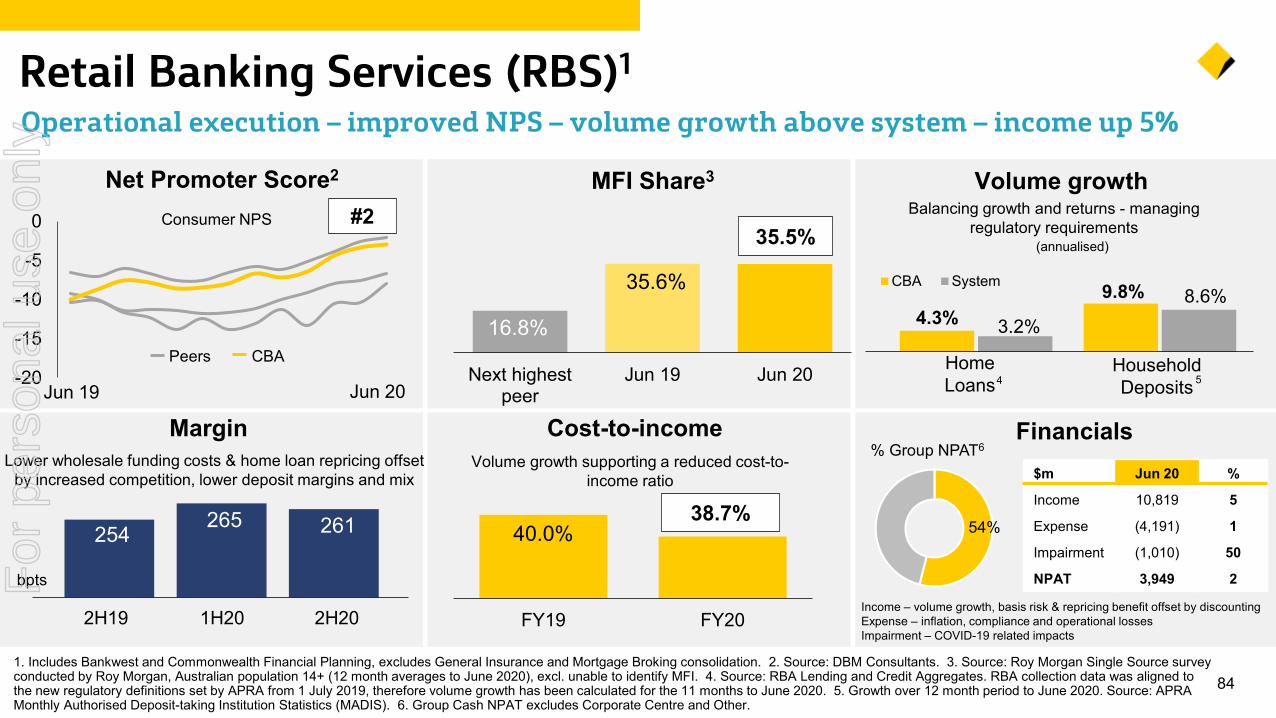
HomeLoans
84
Retail Banking Services (RBS)1
Operational execution – improved NPS – volume growth above system – income up 5%
Financials$m Jun 20 %
Income 10,819 5
Expense (4,191) 1
Impairment (1,010) 50
NPAT 3,949 2
% Group NPAT6
Income – volume growth, basis risk & repricing benefit offset by discountingExpense – inflation, compliance and operational lossesImpairment – COVID-19 related impacts
254 265 261
MarginLower wholesale funding costs & home loan repricing offset
by increased competition, lower deposit margins and mix
bpts
2H19 1H20 2H20
54%
Cost-to-incomeVolume growth supporting a reduced cost-to-
income ratio
40.0%
FY19 FY20
Next highestpeer
Jun 19 Jun 20
35.5%
35.6%
16.8%
MFI Share3
Consumer NPS #2
Jun 20Jun 19
Net Promoter Score2
CBAPeers -20
-15
-10
-5
0
Volume growthBalancing growth and returns - managing
regulatory requirements(annualised)
HouseholdDeposits4 5
38.7%
1. Includes Bankwest and Commonwealth Financial Planning, excludes General Insurance and Mortgage Broking consolidation. 2. Source: DBM Consultants. 3. Source: Roy Morgan Single Source survey conducted by Roy Morgan, Australian population 14+ (12 month averages to June 2020), excl. unable to identify MFI. 4. Source: RBA Lending and Credit Aggregates. RBA collection data was aligned to the new regulatory definitions set by APRA from 1 July 2019, therefore volume growth has been calculated for the 11 months to June 2020. 5. Growth over 12 month period to June 2020. Source: APRA Monthly Authorised Deposit-taking Institution Statistics (MADIS). 6. Group Cash NPAT excludes Corporate Centre and Other.
4.3%9.8%
3.2%8.6%
CBA System
For
per
sona
l use
onl
y
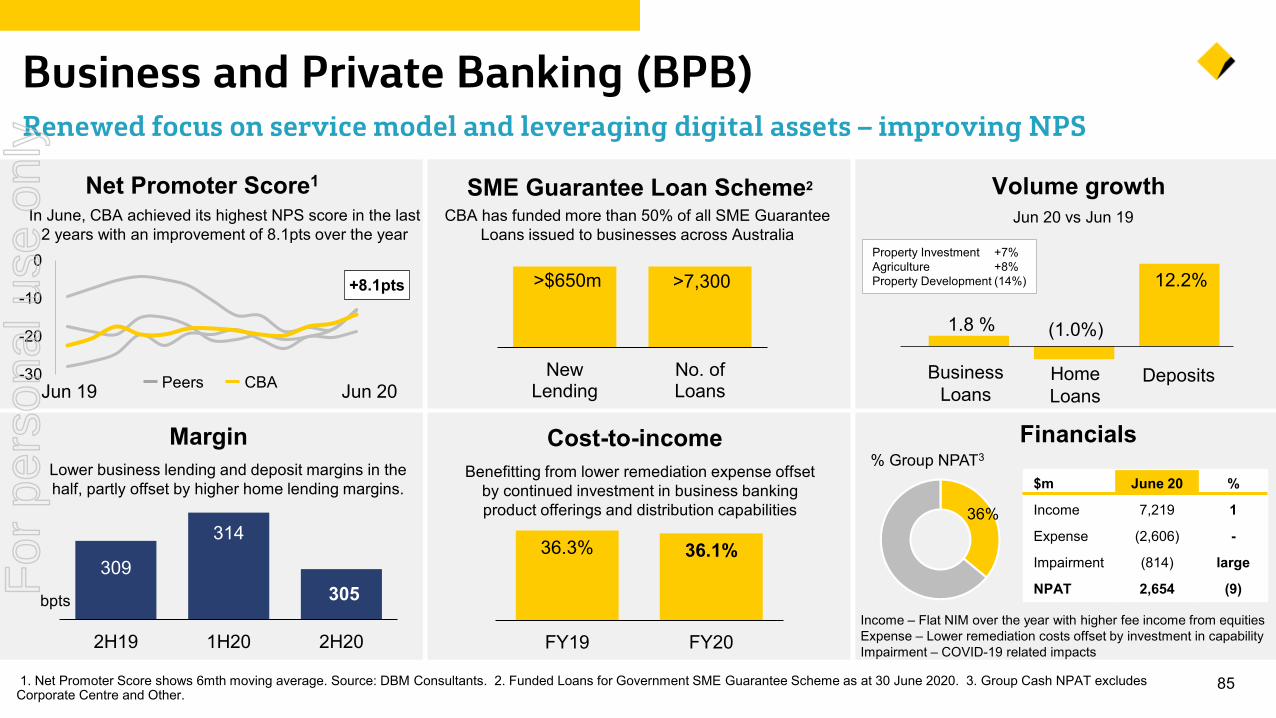
-30
-20
-10
0
85
Business and Private Banking (BPB)Renewed focus on service model and leveraging digital assets – improving NPS
Volume growth
36%
$m June 20 %
Income 7,219 1
Expense (2,606) -
Impairment (814) large
NPAT 2,654 (9)
% Group NPAT3
Financials
Net Promoter Score1
CBAPeers New
LendingNo. ofLoans
CBA has funded more than 50% of all SME Guarantee Loans issued to businesses across Australia
Jun 20Jun 19
bptsIncome – Flat NIM over the year with higher fee income from equitiesExpense – Lower remediation costs offset by investment in capabilityImpairment – COVID-19 related impacts
SME Guarantee Loan Scheme2
+8.1pts
Business Loans
DepositsHome Loans
Jun 20 vs Jun 19
(1.0%)
12.2%
1.8 %
Property Investment +7%Agriculture +8%Property Development (14%)
Margin
309
314
305
2H19 1H20 2H20
Lower business lending and deposit margins in the half, partly offset by higher home lending margins.
Cost-to-income
36.3% 36.1%
FY19 FY20
Benefitting from lower remediation expense offset by continued investment in business banking product offerings and distribution capabilities
In June, CBA achieved its highest NPS score in the last 2 years with an improvement of 8.1pts over the year
>$650m >7,300
1. Net Promoter Score shows 6mth moving average. Source: DBM Consultants. 2. Funded Loans for Government SME Guarantee Scheme as at 30 June 2020. 3. Group Cash NPAT excludes Corporate Centre and Other.
For
per
sona
l use
onl
y
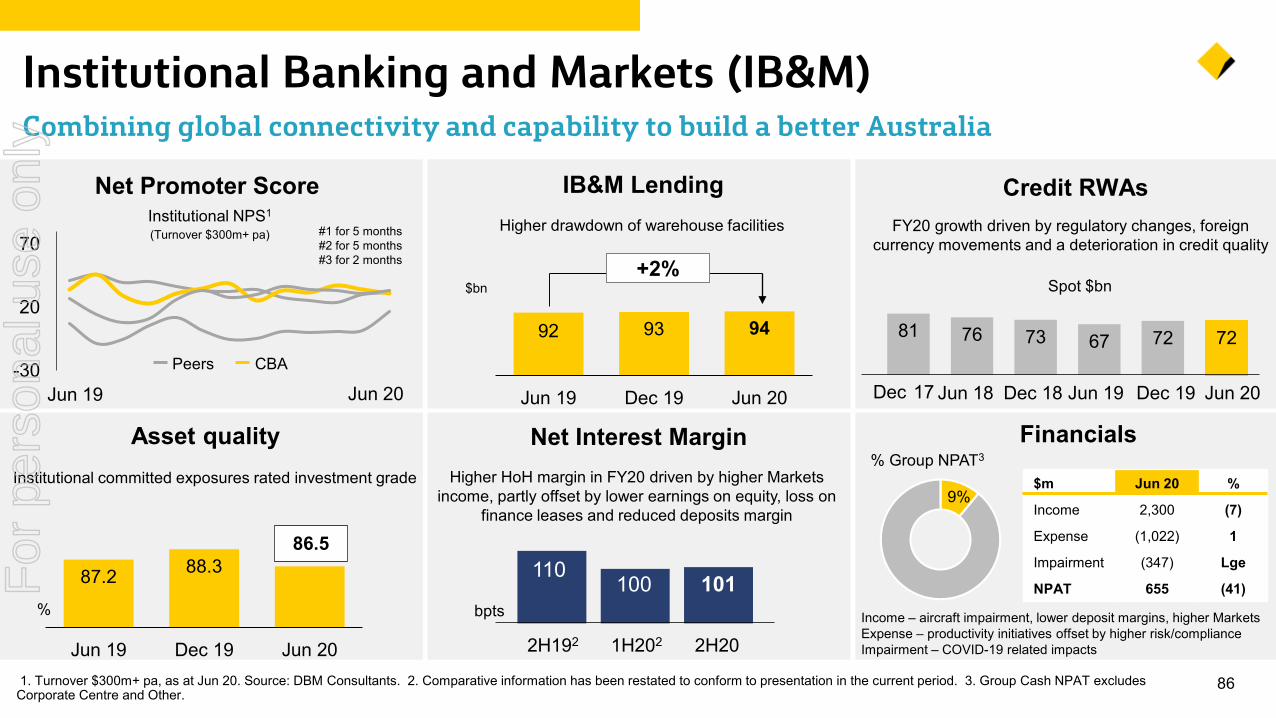
81 76 73 67 72 72
-30
20
70
861. Turnover $300m+ pa, as at Jun 20. Source: DBM Consultants. 2. Comparative information has been restated to conform to presentation in the current period. 3. Group Cash NPAT excludes Corporate Centre and Other.
Institutional Banking and Markets (IB&M)
$m Jun 20 %
Income 2,300 (7)
Expense (1,022) 1
Impairment (347) Lge
NPAT 655 (41)
Financials
Combining global connectivity and capability to build a better Australia
Income – aircraft impairment, lower deposit margins, higher MarketsExpense – productivity initiatives offset by higher risk/compliance Impairment – COVID-19 related impacts
Net Promoter Score
Jun 20Jun 19CBAPeers
Institutional NPS1
(Turnover $300m+ pa)
Net Interest Margin
2H20
bpts
Higher HoH margin in FY20 driven by higher Markets income, partly offset by lower earnings on equity, loss on
finance leases and reduced deposits margin
100
Credit RWAsFY20 growth driven by regulatory changes, foreign
currency movements and a deterioration in credit quality
Spot $bn
1H202
101
92 93 94
Jun 19 Dec 19 Jun 20
IB&M Lending
$bn+2%
Jun 18Dec 17 Dec 18 Jun 19 Dec 19 Jun 20
87.2 88.386.5
Jun 19 Dec 19 Jun 20
Asset quality
%
Institutional committed exposures rated investment grade
Higher drawdown of warehouse facilities
2H192
110
#1 for 5 months#2 for 5 months#3 for 2 months
9%
% Group NPAT3
For
per
sona
l use
onl
y
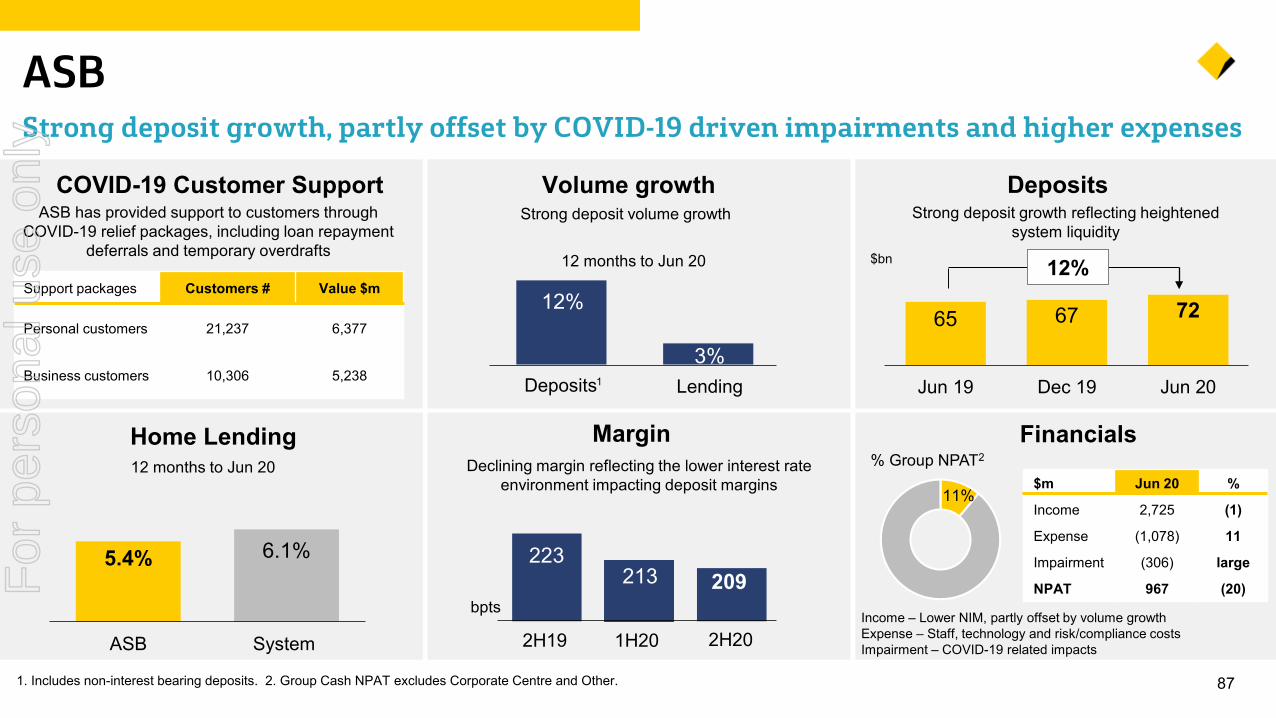
871. Includes non-interest bearing deposits. 2. Group Cash NPAT excludes Corporate Centre and Other.
ASBStrong deposit growth, partly offset by COVID-19 driven impairments and higher expenses
Margin
Volume growth
bpts
Deposits3%
12%
12 months to Jun 20
Strong deposit volume growth
Lending
Declining margin reflecting the lower interest rate environment impacting deposit margins
1
2H202H19 1H20
223213 209
COVID-19 Customer Support Deposits Strong deposit growth reflecting heightened
system liquidity$bn 12%
ASB has provided support to customers through COVID-19 relief packages, including loan repayment
deferrals and temporary overdrafts
11%$m Jun 20 %
Income 2,725 (1)
Expense (1,078) 11
Impairment (306) large
NPAT 967 (20)
% Group NPAT2
Financials
Income – Lower NIM, partly offset by volume growthExpense – Staff, technology and risk/compliance costsImpairment – COVID-19 related impacts
Home Lending12 months to Jun 20
5.4% 6.1%
ASB System
65 67 72
Jun 19 Dec 19 Jun 20
Support packages Customers # Value $m
Personal customers 21,237 6,377
Business customers 10,306 5,238
For
per
sona
l use
onl
y
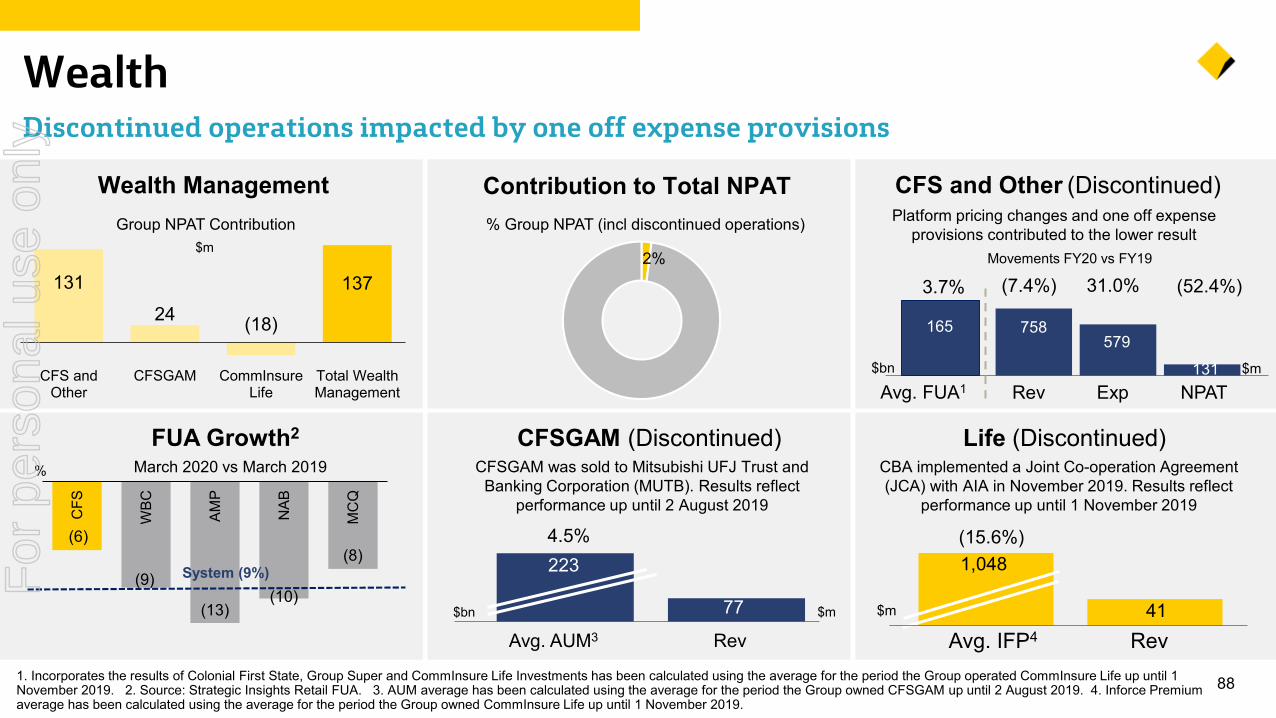
(6)
(9)
(13)(10)
(8)
CFS
WBC
AMP
NAB
MC
Q
%
881. Incorporates the results of Colonial First State, Group Super and CommInsure Life Investments has been calculated using the average for the period the Group operated CommInsure Life up until 1 November 2019. 2. Source: Strategic Insights Retail FUA. 3. AUM average has been calculated using the average for the period the Group owned CFSGAM up until 2 August 2019. 4. Inforce Premium average has been calculated using the average for the period the Group owned CommInsure Life up until 1 November 2019.
WealthDiscontinued operations impacted by one off expense provisions
Contribution to Total NPATWealth Management
Life (Discontinued)
Avg. IFP4 Rev
1,048
41
(15.6%)
$m
CBA implemented a Joint Co-operation Agreement (JCA) with AIA in November 2019. Results reflect
performance up until 1 November 2019
Avg. AUM3 Rev
223
77
4.5%
$bn $m
CFSGAM was sold to Mitsubishi UFJ Trust and Banking Corporation (MUTB). Results reflect
performance up until 2 August 2019
CFSGAM (Discontinued) FUA Growth2
March 2020 vs March 2019
System (9%)
Platform pricing changes and one off expense provisions contributed to the lower result
Movements FY20 vs FY19
CFS and Other (Discontinued)
Avg. FUA1$bn $m
Rev Exp NPAT
3.7% (7.4%) 31.0% (52.4%)2%
% Group NPAT (incl discontinued operations)Group NPAT Contribution
758579
131
165
13124 (18)
137
CFS andOther
CFSGAM CommInsureLife
Total WealthManagement
$m
For
per
sona
l use
onl
y

89
Home and Consumer Lending For
per
sona
l use
onl
y
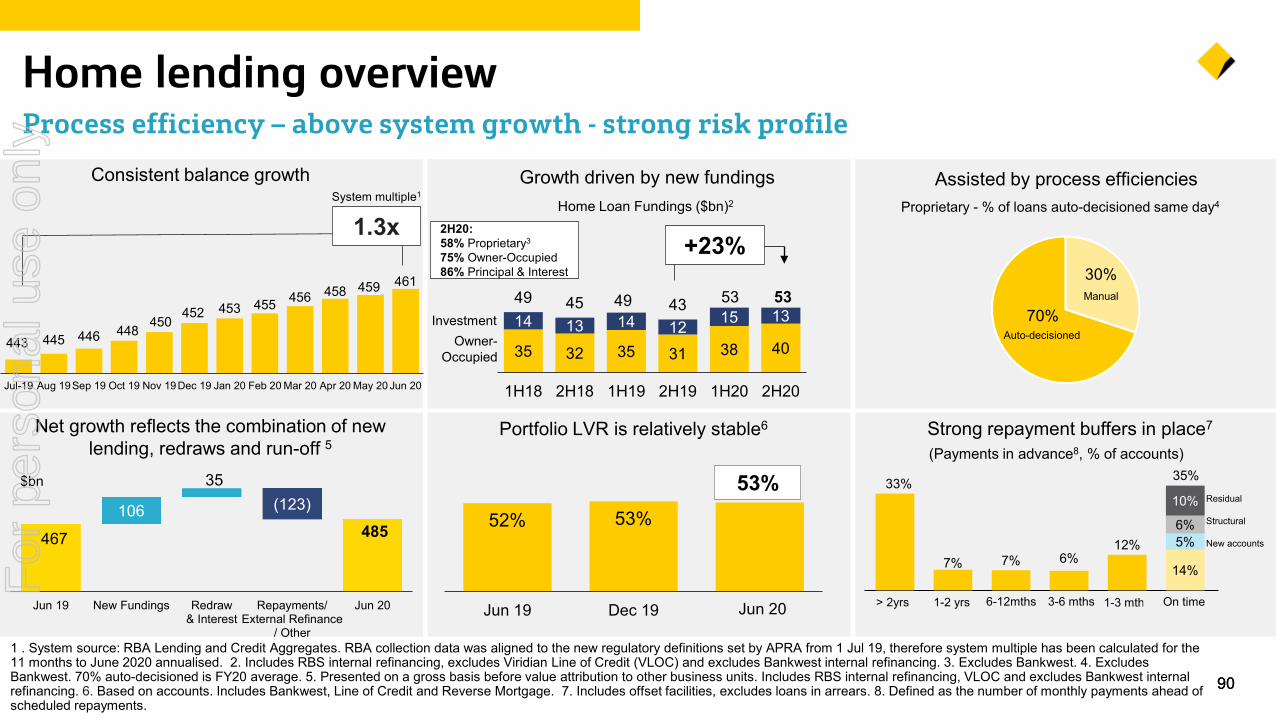
443 445 446 448 450452 453 455 456 458 459 461
Jul-19 Aug 19Sep 19 Oct 19 Nov 19Dec 19 Jan 20 Feb 20 Mar 20 Apr 20 May 20 Jun 20
90
1 . System source: RBA Lending and Credit Aggregates. RBA collection data was aligned to the new regulatory definitions set by APRA from 1 Jul 19, therefore system multiple has been calculated for the 11 months to June 2020 annualised. 2. Includes RBS internal refinancing, excludes Viridian Line of Credit (VLOC) and excludes Bankwest internal refinancing. 3. Excludes Bankwest. 4. Excludes Bankwest. 70% auto-decisioned is FY20 average. 5. Presented on a gross basis before value attribution to other business units. Includes RBS internal refinancing, VLOC and excludes Bankwest internal refinancing. 6. Based on accounts. Includes Bankwest, Line of Credit and Reverse Mortgage. 7. Includes offset facilities, excludes loans in arrears. 8. Defined as the number of monthly payments ahead of scheduled repayments.
Home lending overviewProcess efficiency – above system growth - strong risk profile
90
467 485 106
35(123)
Jun 19 New Fundings Redraw& Interest
Repayments/External Refinance
/ Other
Jun 20
Net growth reflects the combination of new lending, redraws and run-off 5
$bn
35 32 35 31 38 4014 13 14 12 15 1349 45 49 43 53 53
1H18 2H18 1H19 2H19 1H20 2H20
Growth driven by new fundingsHome Loan Fundings ($bn)2
InvestmentOwner-
Occupied
Assisted by process efficiencies
2H20:58% Proprietary3
75% Owner-Occupied86% Principal & Interest
+23%
Consistent balance growthSystem multiple1
1.3xProprietary - % of loans auto-decisioned same day4
70%
30%Manual
Auto-decisioned
52% 53%
Jun 19 Dec 19 May 20
53%
Jun 20
(Payments in advance8, % of accounts)
> 2yrs 1-2 yrs 6-12mths 3-6 mths 1-3 mths
Residual
Structural
New accounts
Strong repayment buffers in place7
On time
33%
7% 7% 6%12%
14%
5%6%
10%
35%
Portfolio LVR is relatively stable6
For
per
sona
l use
onl
y
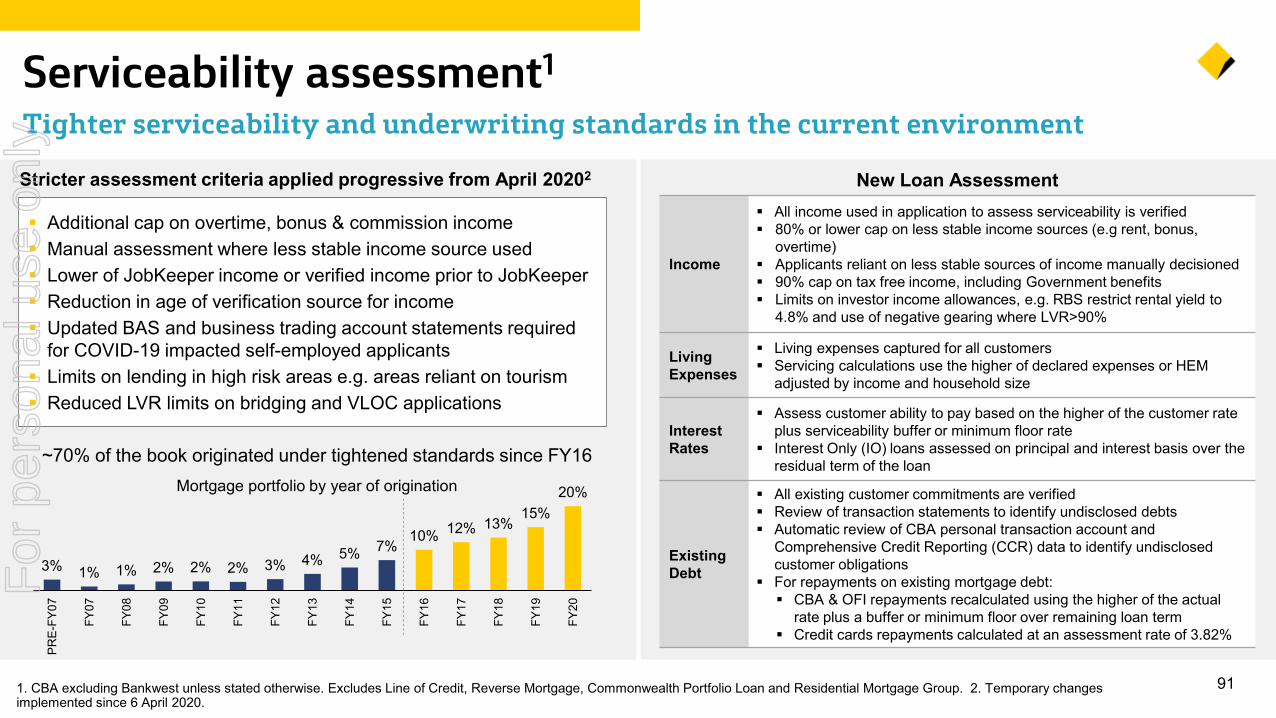
3% 1% 1% 2% 2% 2% 3% 4% 5% 7%10% 12% 13%
15%20%
PRE-
FY07
FY07
FY08
FY09
FY10
FY11
FY12
FY13
FY14
FY15
FY16
FY17
FY18
FY19
FY20
911. CBA excluding Bankwest unless stated otherwise. Excludes Line of Credit, Reverse Mortgage, Commonwealth Portfolio Loan and Residential Mortgage Group. 2. Temporary changes implemented since 6 April 2020.
Serviceability assessment1
Tighter serviceability and underwriting standards in the current environment
New Loan Assessment
Income
All income used in application to assess serviceability is verified 80% or lower cap on less stable income sources (e.g rent, bonus,
overtime) Applicants reliant on less stable sources of income manually decisioned 90% cap on tax free income, including Government benefits Limits on investor income allowances, e.g. RBS restrict rental yield to
4.8% and use of negative gearing where LVR>90%
Living Expenses
Living expenses captured for all customers Servicing calculations use the higher of declared expenses or HEM
adjusted by income and household size
Interest Rates
Assess customer ability to pay based on the higher of the customer rate plus serviceability buffer or minimum floor rate
Interest Only (IO) loans assessed on principal and interest basis over the residual term of the loan
Existing Debt
All existing customer commitments are verified Review of transaction statements to identify undisclosed debts Automatic review of CBA personal transaction account and
Comprehensive Credit Reporting (CCR) data to identify undisclosed customer obligations
For repayments on existing mortgage debt: CBA & OFI repayments recalculated using the higher of the actual
rate plus a buffer or minimum floor over remaining loan term Credit cards repayments calculated at an assessment rate of 3.82%
Mortgage portfolio by year of origination
Stricter assessment criteria applied progressive from April 20202
Additional cap on overtime, bonus & commission income Manual assessment where less stable income source used Lower of JobKeeper income or verified income prior to JobKeeper Reduction in age of verification source for income Updated BAS and business trading account statements required
for COVID-19 impacted self-employed applicants Limits on lending in high risk areas e.g. areas reliant on tourism Reduced LVR limits on bridging and VLOC applications
~70% of the book originated under tightened standards since FY16
For
per
sona
l use
onl
y
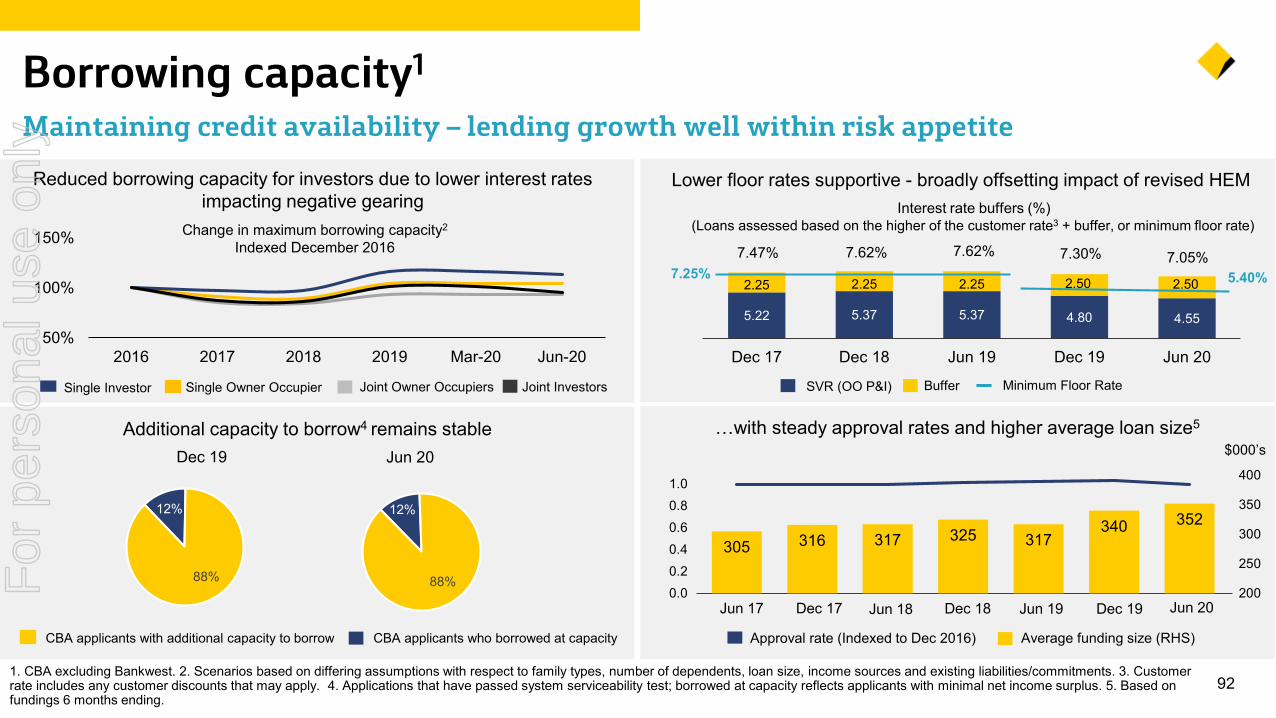
SVR (OO P&I)
921. CBA excluding Bankwest. 2. Scenarios based on differing assumptions with respect to family types, number of dependents, loan size, income sources and existing liabilities/commitments. 3. Customer rate includes any customer discounts that may apply. 4. Applications that have passed system serviceability test; borrowed at capacity reflects applicants with minimal net income surplus. 5. Based on fundings 6 months ending.
Borrowing capacity1
Maintaining credit availability – lending growth well within risk appetite
Additional capacity to borrow4 remains stable
CBA applicants with additional capacity to borrow CBA applicants who borrowed at capacity
Jun 20Dec 19
Reduced borrowing capacity for investors due to lower interest rates impacting negative gearing
Change in maximum borrowing capacity2
Indexed December 2016
Single Owner OccupierSingle Investor Joint InvestorsJoint Owner Occupiers
…with steady approval rates and higher average loan size5
$000’s
Average funding size (RHS)Approval rate (Indexed to Dec 2016)
Dec 19Dec 18Dec 17 Jun 20Jun 17 Jun 18 Jun 19
5.22 5.37 5.37 4.80 4.55
2.25 2.25 2.25 2.50 2.50
Dec 17 Dec 18 Jun 19 Dec 19 Jun 20
7.30%
Lower floor rates supportive - broadly offsetting impact of revised HEM
(Loans assessed based on the higher of the customer rate3 + buffer, or minimum floor rate)Interest rate buffers (%)
7.62% 7.05%5.40%7.25%
Buffer Minimum Floor Rate
7.62%7.47%
12%
88%
12%
88%
50%
100%
150%
2016 2017 2018 2019 Mar-20 Jun-20
305 316 317 325 317340 352
0.00.20.40.60.81.0
200
250
300
350
400
For
per
sona
l use
onl
y
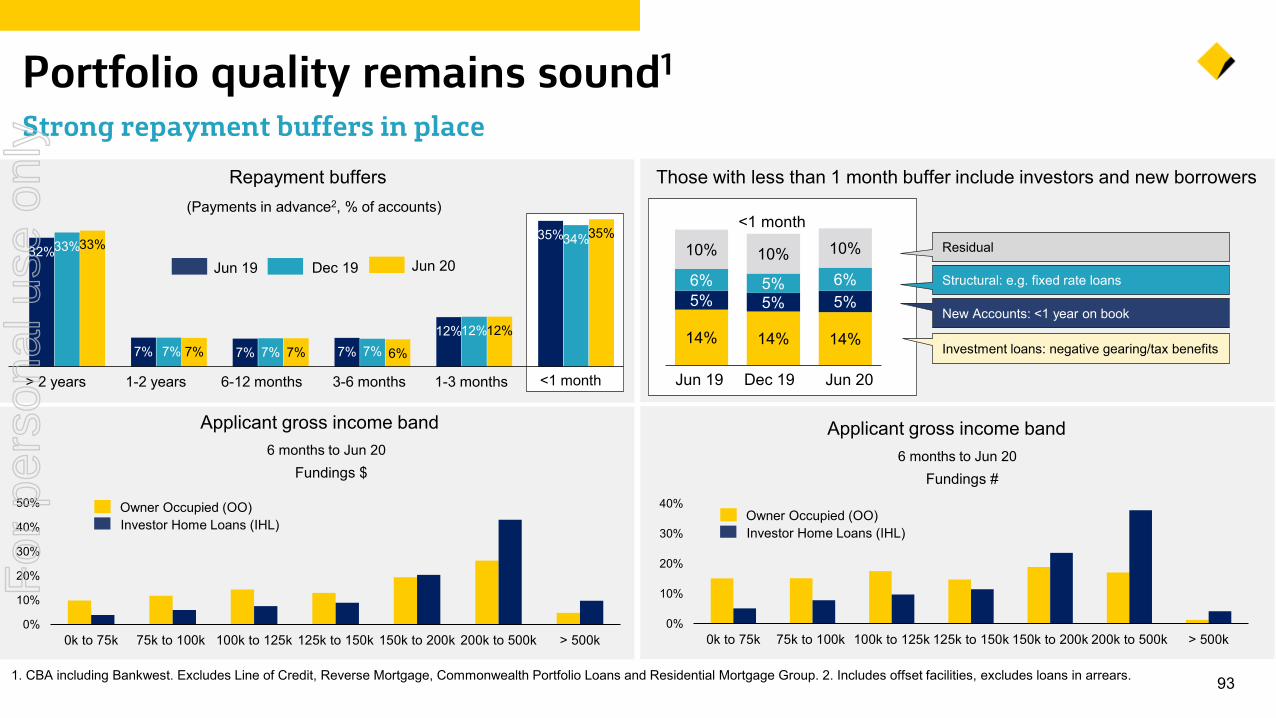
32%33%33%
7% 7% 7% 7% 7% 7% 7% 7% 6%12%12%12%
35%34%35%
931. CBA including Bankwest. Excludes Line of Credit, Reverse Mortgage, Commonwealth Portfolio Loans and Residential Mortgage Group. 2. Includes offset facilities, excludes loans in arrears.
Portfolio quality remains sound1
Strong repayment buffers in placeRepayment buffers
(Payments in advance2, % of accounts)
> 2 years 1-2 years 6-12 months 3-6 months 1-3 months <1 month
Jun 20Jun 19
Those with less than 1 month buffer include investors and new borrowers
<1 month
Jun 20
Residual
Structural: e.g. fixed rate loans
New Accounts: <1 year on book
Investment loans: negative gearing/tax benefits
Applicant gross income band
Fundings $
Investor Home Loans (IHL)Owner Occupied (OO)
6 months to Jun 20
Jun 19
Dec 19
Dec 19
14% 14% 14%
5% 5% 5%6% 5% 6%
10% 10% 10%
Fundings #
Investor Home Loans (IHL)Owner Occupied (OO)
6 months to Jun 20
0%
10%
20%
30%
40%
50%
0k to 75k 75k to 100k 100k to 125k 125k to 150k 150k to 200k 200k to 500k > 500k
Applicant gross income band
0%
10%
20%
30%
40%
0k to 75k 75k to 100k 100k to 125k 125k to 150k 150k to 200k 200k to 500k > 500k
For
per
sona
l use
onl
y
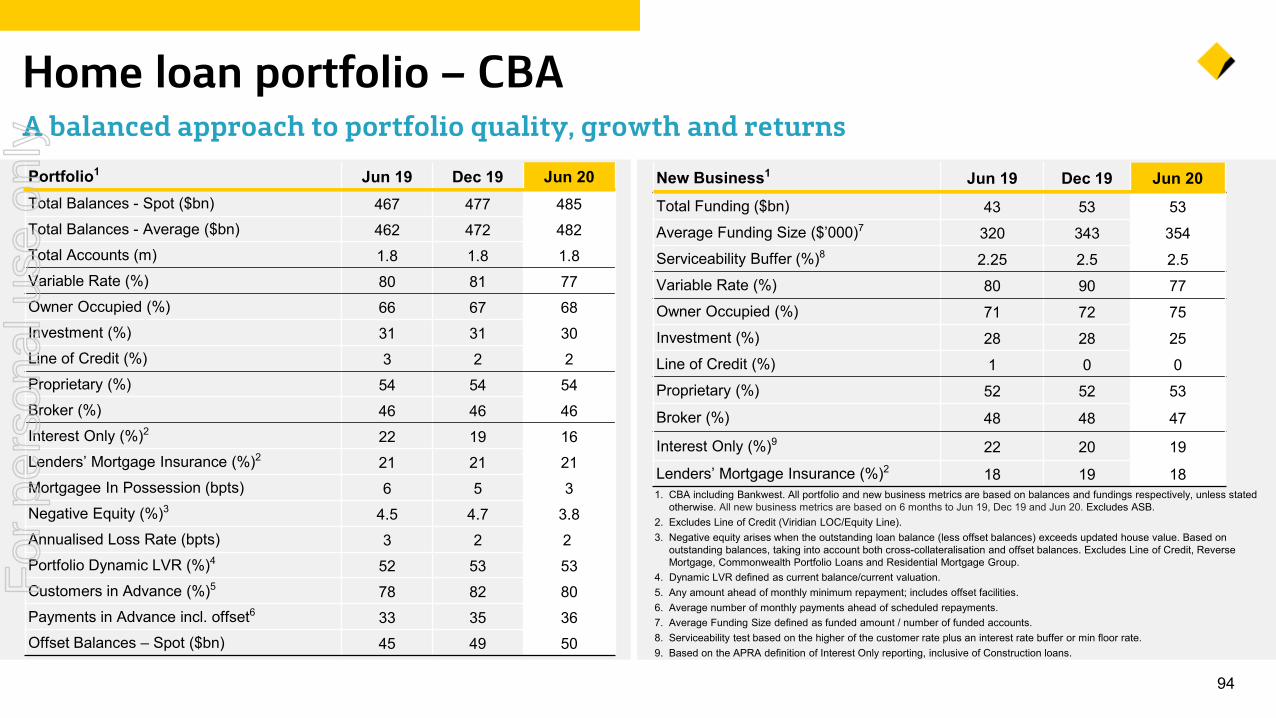
94
Home loan portfolio – CBAA balanced approach to portfolio quality, growth and returnsPortfolio1 Jun 19 Dec 19 Jun 20Total Balances - Spot ($bn) 467 477 485Total Balances - Average ($bn) 462 472 482Total Accounts (m) 1.8 1.8 1.8Variable Rate (%) 80 81 77Owner Occupied (%) 66 67 68Investment (%) 31 31 30Line of Credit (%) 3 2 2Proprietary (%) 54 54 54Broker (%) 46 46 46Interest Only (%)2 22 19 16Lenders’ Mortgage Insurance (%)2 21 21 21Mortgagee In Possession (bpts) 6 5 3Negative Equity (%)3 4.5 4.7 3.8Annualised Loss Rate (bpts) 3 2 2Portfolio Dynamic LVR (%)4 52 53 53Customers in Advance (%)5 78 82 80Payments in Advance incl. offset6 33 35 36Offset Balances – Spot ($bn) 45 49 50
New Business1 Jun 19 Dec 19 Jun 20Total Funding ($bn) 43 53 53Average Funding Size ($’000)7 320 343 354Serviceability Buffer (%)8 2.25 2.5 2.5Variable Rate (%) 80 90 77Owner Occupied (%) 71 72 75Investment (%) 28 28 25Line of Credit (%) 1 0 0Proprietary (%) 52 52 53
Broker (%) 48 48 47
Interest Only (%)9 22 20 19
Lenders’ Mortgage Insurance (%)2 18 19 181. CBA including Bankwest. All portfolio and new business metrics are based on balances and fundings respectively, unless stated
otherwise. All new business metrics are based on 6 months to Jun 19, Dec 19 and Jun 20. Excludes ASB.2. Excludes Line of Credit (Viridian LOC/Equity Line).3. Negative equity arises when the outstanding loan balance (less offset balances) exceeds updated house value. Based on
outstanding balances, taking into account both cross-collateralisation and offset balances. Excludes Line of Credit, Reverse Mortgage, Commonwealth Portfolio Loans and Residential Mortgage Group.
4. Dynamic LVR defined as current balance/current valuation.5. Any amount ahead of monthly minimum repayment; includes offset facilities.6. Average number of monthly payments ahead of scheduled repayments.7. Average Funding Size defined as funded amount / number of funded accounts. 8. Serviceability test based on the higher of the customer rate plus an interest rate buffer or min floor rate.9. Based on the APRA definition of Interest Only reporting, inclusive of Construction loans.
For
per
sona
l use
onl
y
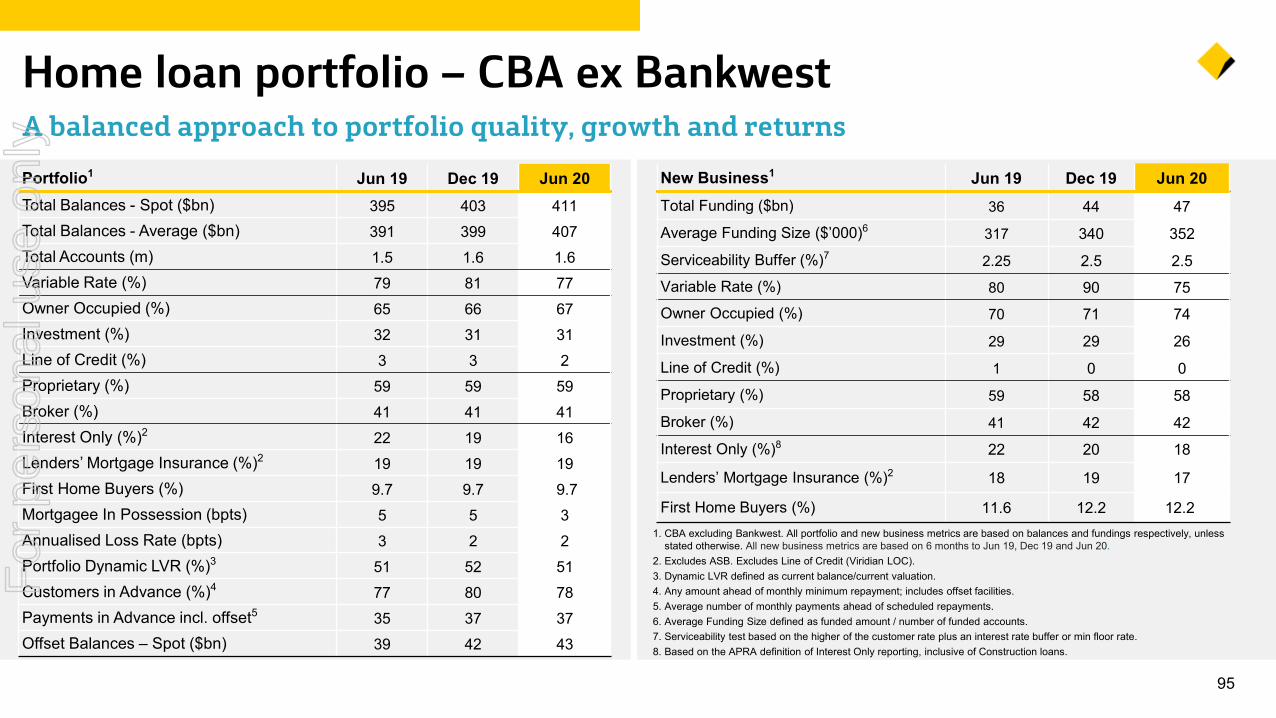
95
Home loan portfolio – CBA ex Bankwest A balanced approach to portfolio quality, growth and returnsPortfolio1 Jun 19 Dec 19 Jun 20Total Balances - Spot ($bn) 395 403 411Total Balances - Average ($bn) 391 399 407Total Accounts (m) 1.5 1.6 1.6Variable Rate (%) 79 81 77Owner Occupied (%) 65 66 67Investment (%) 32 31 31Line of Credit (%) 3 3 2Proprietary (%) 59 59 59Broker (%) 41 41 41Interest Only (%)2 22 19 16Lenders’ Mortgage Insurance (%)2 19 19 19First Home Buyers (%) 9.7 9.7 9.7Mortgagee In Possession (bpts) 5 5 3Annualised Loss Rate (bpts) 3 2 2Portfolio Dynamic LVR (%)3 51 52 51Customers in Advance (%)4 77 80 78Payments in Advance incl. offset5 35 37 37Offset Balances – Spot ($bn) 39 42 43
New Business1 Jun 19 Dec 19 Jun 20Total Funding ($bn) 36 44 47
Average Funding Size ($’000)6 317 340 352
Serviceability Buffer (%)7 2.25 2.5 2.5Variable Rate (%) 80 90 75Owner Occupied (%) 70 71 74
Investment (%) 29 29 26
Line of Credit (%) 1 0 0
Proprietary (%) 59 58 58
Broker (%) 41 42 42
Interest Only (%)8 22 20 18
Lenders’ Mortgage Insurance (%)2 18 19 17
First Home Buyers (%) 11.6 12.2 12.21. CBA excluding Bankwest. All portfolio and new business metrics are based on balances and fundings respectively, unless
stated otherwise. All new business metrics are based on 6 months to Jun 19, Dec 19 and Jun 20. 2. Excludes ASB. Excludes Line of Credit (Viridian LOC).3. Dynamic LVR defined as current balance/current valuation.4. Any amount ahead of monthly minimum repayment; includes offset facilities.5. Average number of monthly payments ahead of scheduled repayments.6. Average Funding Size defined as funded amount / number of funded accounts. 7. Serviceability test based on the higher of the customer rate plus an interest rate buffer or min floor rate.8. Based on the APRA definition of Interest Only reporting, inclusive of Construction loans.
For
per
sona
l use
onl
y
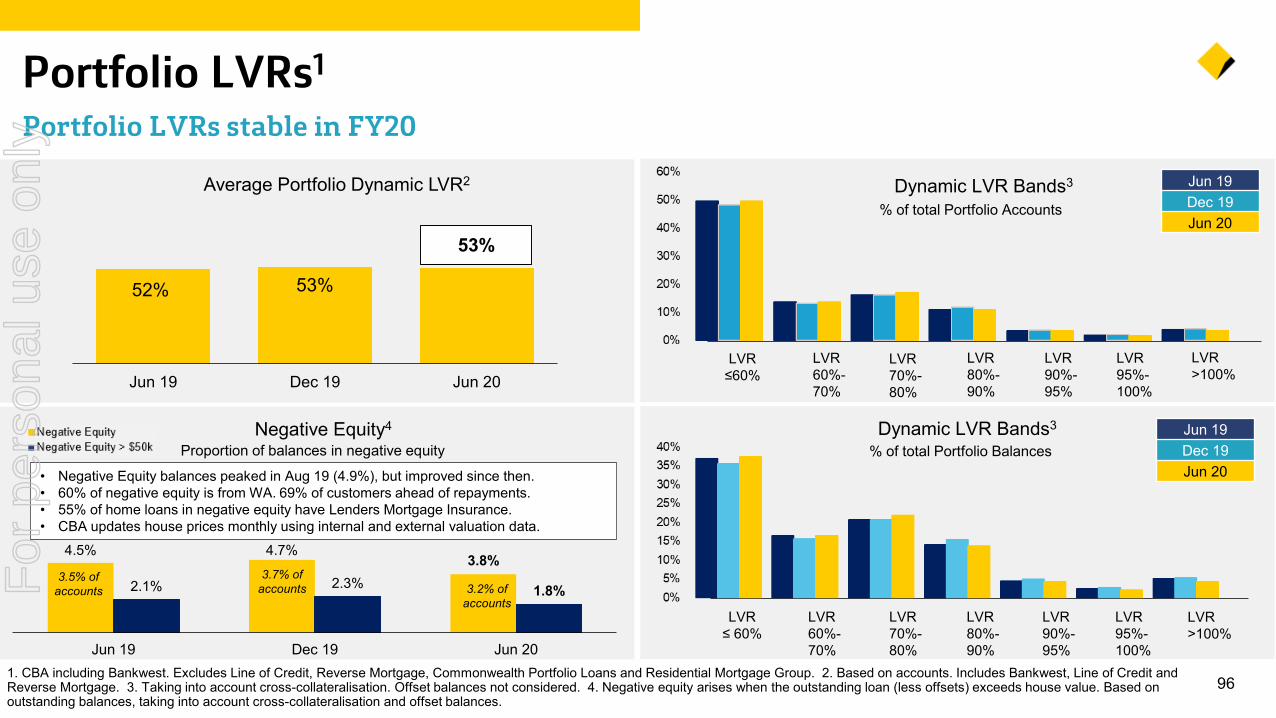
961. CBA including Bankwest. Excludes Line of Credit, Reverse Mortgage, Commonwealth Portfolio Loans and Residential Mortgage Group. 2. Based on accounts. Includes Bankwest, Line of Credit and Reverse Mortgage. 3. Taking into account cross-collateralisation. Offset balances not considered. 4. Negative equity arises when the outstanding loan (less offsets) exceeds house value. Based on outstanding balances, taking into account cross-collateralisation and offset balances.
Portfolio LVRs1
Portfolio LVRs stable in FY20
Jun 19Dec 19Jun 20
Dynamic LVR Bands3
% of total Portfolio Accounts
LVR ≤60%
LVR 60%-70%
LVR 70%-80%
LVR 80%-90%
LVR 90%-95%
LVR 95%-100%
LVR >100%
Average Portfolio Dynamic LVR2
Proportion of balances in negative equity
LVR ≤ 60%
LVR 60%-70%
LVR 70%-80%
LVR 80%-90%
LVR 90%-95%
LVR 95%-100%
LVR >100%
% of total Portfolio BalancesDynamic LVR Bands3 Jun 19
Dec 19Jun 20
Negative Equity4
52% 53%
53%
Jun 19 Dec 19 Jun 20
4.5% 4.7%3.8%
2.1% 2.3% 1.8%
Jun 19 Dec 19 Jun 20
3.5% of accounts
3.7% of accounts 3.2% of
accounts
• Negative Equity balances peaked in Aug 19 (4.9%), but improved since then. • 60% of negative equity is from WA. 69% of customers ahead of repayments.• 55% of home loans in negative equity have Lenders Mortgage Insurance. • CBA updates house prices monthly using internal and external valuation data.
For
per
sona
l use
onl
y
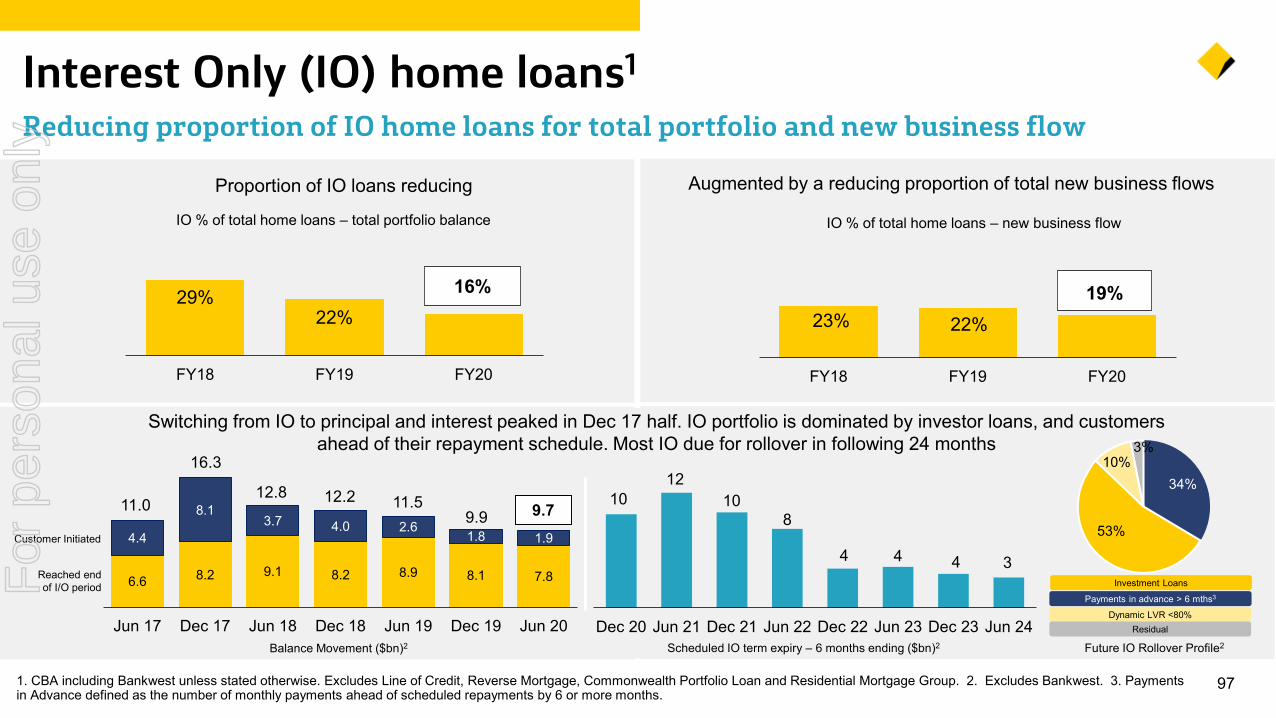
Switching from IO to principal and interest peaked in Dec 17 half. IO portfolio is dominated by investor loans, and customers ahead of their repayment schedule. Most IO due for rollover in following 24 months
34%
53%
10%3%
23% 22%19%
FY18 FY19 FY20
971. CBA including Bankwest unless stated otherwise. Excludes Line of Credit, Reverse Mortgage, Commonwealth Portfolio Loan and Residential Mortgage Group. 2. Excludes Bankwest. 3. Payments in Advance defined as the number of monthly payments ahead of scheduled repayments by 6 or more months.
Interest Only (IO) home loans1
Reducing proportion of IO home loans for total portfolio and new business flow
Proportion of IO loans reducing Augmented by a reducing proportion of total new business flows
IO % of total home loans – total portfolio balance IO % of total home loans – new business flow
Customer Initiated
Reached end of I/O period
Balance Movement ($bn)2 Scheduled IO term expiry – 6 months ending ($bn)2 Future IO Rollover Profile2
Payments in advance > 6 mths3
Investment Loans
Dynamic LVR <80% Residual
6.6 8.2 9.1 8.2 8.9 8.1 7.8
4.4
8.13.7 4.0 2.6
1.8 1.9
Jun 17 Dec 17 Jun 18 Dec 18 Jun 19 Dec 19 Jun 20
29%22%
16%
FY18 FY19 FY20
9.711.0 12.212.8 11.5
16.3
9.910
1210
8
4 4 4 3
Dec 20 Jun 21 Dec 21 Jun 22 Dec 22 Jun 23 Dec 23 Jun 24
For
per
sona
l use
onl
y
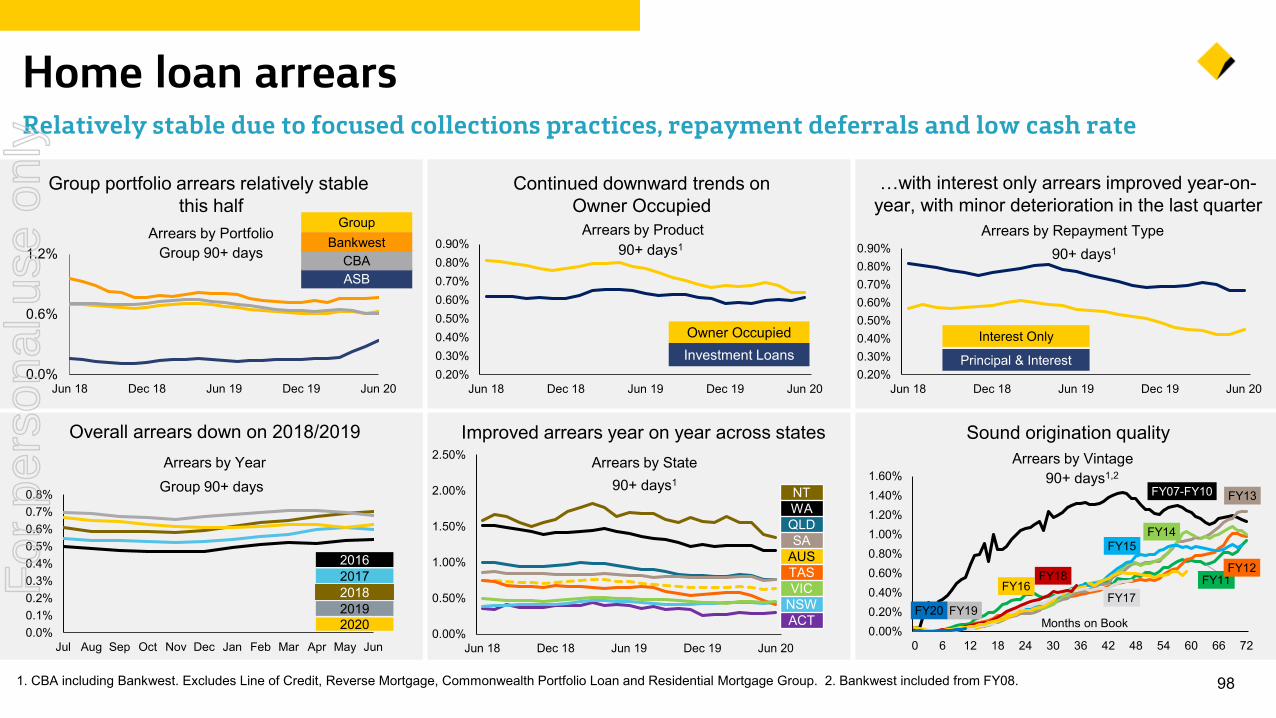
0.0%
0.6%
1.2%
Jun 18 Dec 18 Jun 19 Dec 19 Jun 200.20%0.30%0.40%0.50%0.60%0.70%0.80%0.90%
Jun 18 Dec 18 Jun 19 Dec 19 Jun 200.20%0.30%0.40%0.50%0.60%0.70%0.80%0.90%
Jun 18 Dec 18 Jun 19 Dec 19 Jun 20
0.00%
0.50%
1.00%
1.50%
2.00%
2.50%
Jun 18 Dec 18 Jun 19 Dec 19 Jun 200.0%0.1%0.2%0.3%0.4%0.5%0.6%0.7%0.8%
Jul Aug Sep Oct Nov Dec Jan Feb Mar Apr May Jun
Group portfolio arrears relatively stablethis half
…with interest only arrears improved year-on-year, with minor deterioration in the last quarter
Continued downward trends on Owner Occupied
Overall arrears down on 2018/2019 Improved arrears year on year across states
981. CBA including Bankwest. Excludes Line of Credit, Reverse Mortgage, Commonwealth Portfolio Loan and Residential Mortgage Group. 2. Bankwest included from FY08.
Home loan arrears Relatively stable due to focused collections practices, repayment deferrals and low cash rate
Investment LoansOwner Occupied
90+ days1Arrears by ProductArrears by Portfolio
Group 90+ days
Principal & Interest
Interest Only
90+ days1
Arrears by Repayment Type
ASB
Group
CBABankwest
Arrears by YearGroup 90+ days NT
WAQLDSA
AUSTASVIC
NSWACT
90+ days1
Arrears by State
20172016
202020192018
Sound origination quality
90+ days1,2Arrears by Vintage
FY19
FY07-FY10
FY11FY12
FY13
FY14FY15
FY16FY17
FY18
FY20
0.00%0.20%0.40%0.60%0.80%1.00%1.20%1.40%1.60%
0 6 12 18 24 30 36 42 48 54 60 66 72
Months on Book
For
per
sona
l use
onl
y
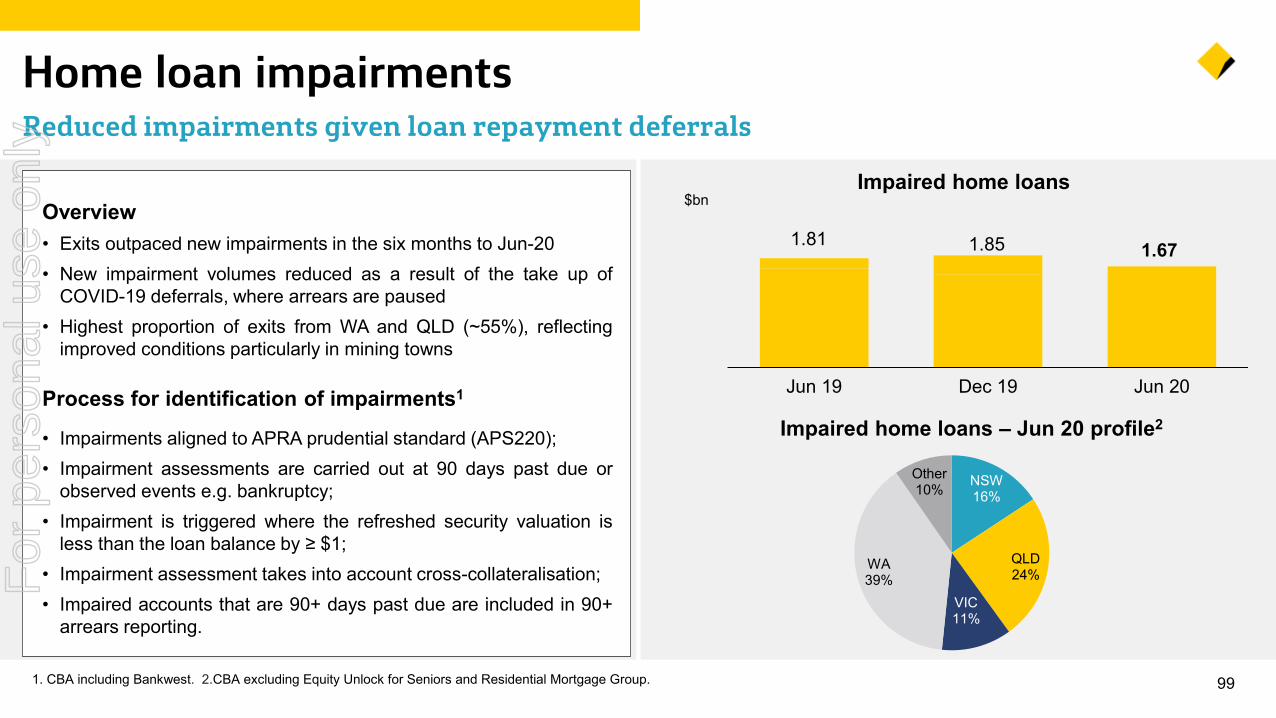
1.81 1.85 1.67
Jun 19 Dec 19 Jun 20
991. CBA including Bankwest. 2.CBA excluding Equity Unlock for Seniors and Residential Mortgage Group.
Home loan impairments Reduced impairments given loan repayment deferrals
Impaired home loans
Impaired home loans – Jun 20 profile2
Overview• Exits outpaced new impairments in the six months to Jun-20• New impairment volumes reduced as a result of the take up of
COVID-19 deferrals, where arrears are paused• Highest proportion of exits from WA and QLD (~55%), reflecting
improved conditions particularly in mining towns
Process for identification of impairments1
• Impairments aligned to APRA prudential standard (APS220);• Impairment assessments are carried out at 90 days past due or
observed events e.g. bankruptcy;• Impairment is triggered where the refreshed security valuation is
less than the loan balance by ≥ $1;• Impairment assessment takes into account cross-collateralisation;• Impaired accounts that are 90+ days past due are included in 90+
arrears reporting.
NSW16%
QLD24%
VIC11%
WA39%
Other10%
$bn
For
per
sona
l use
onl
y
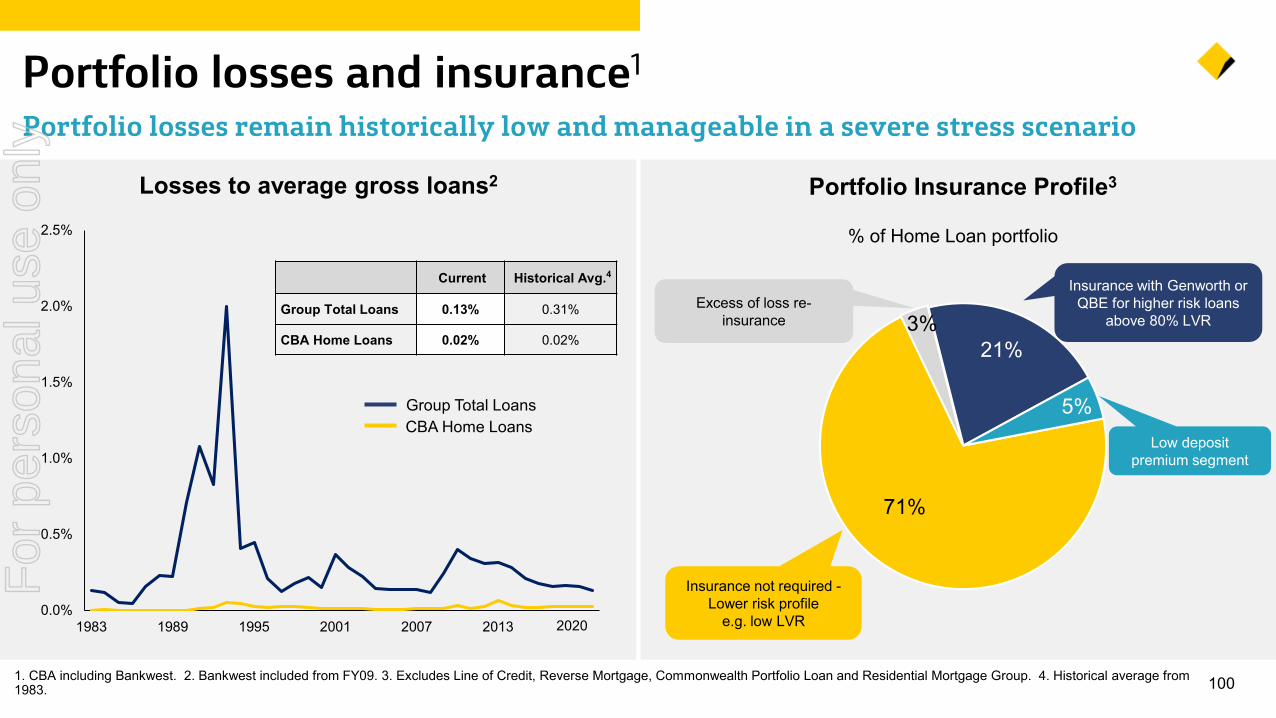
0.0%
0.5%
1.0%
1.5%
2.0%
2.5%
1983 1989 1995 2001 2007 2013 2019
1001. CBA including Bankwest. 2. Bankwest included from FY09. 3. Excludes Line of Credit, Reverse Mortgage, Commonwealth Portfolio Loan and Residential Mortgage Group. 4. Historical average from 1983.
Portfolio losses and insurance1
Portfolio losses remain historically low and manageable in a severe stress scenario
% of Home Loan portfolio
Low deposit premium segment
Portfolio Insurance Profile3
Insurance with Genworth or QBE for higher risk loans
above 80% LVR
Insurance not required -Lower risk profile
e.g. low LVR
Excess of loss re-insurance
70%
71%
3%21%
5%
Losses to average gross loans2
Group Total LoansCBA Home Loans
Current Historical Avg.4
Group Total Loans 0.13% 0.31%
CBA Home Loans 0.02% 0.02%
2020
For
per
sona
l use
onl
y
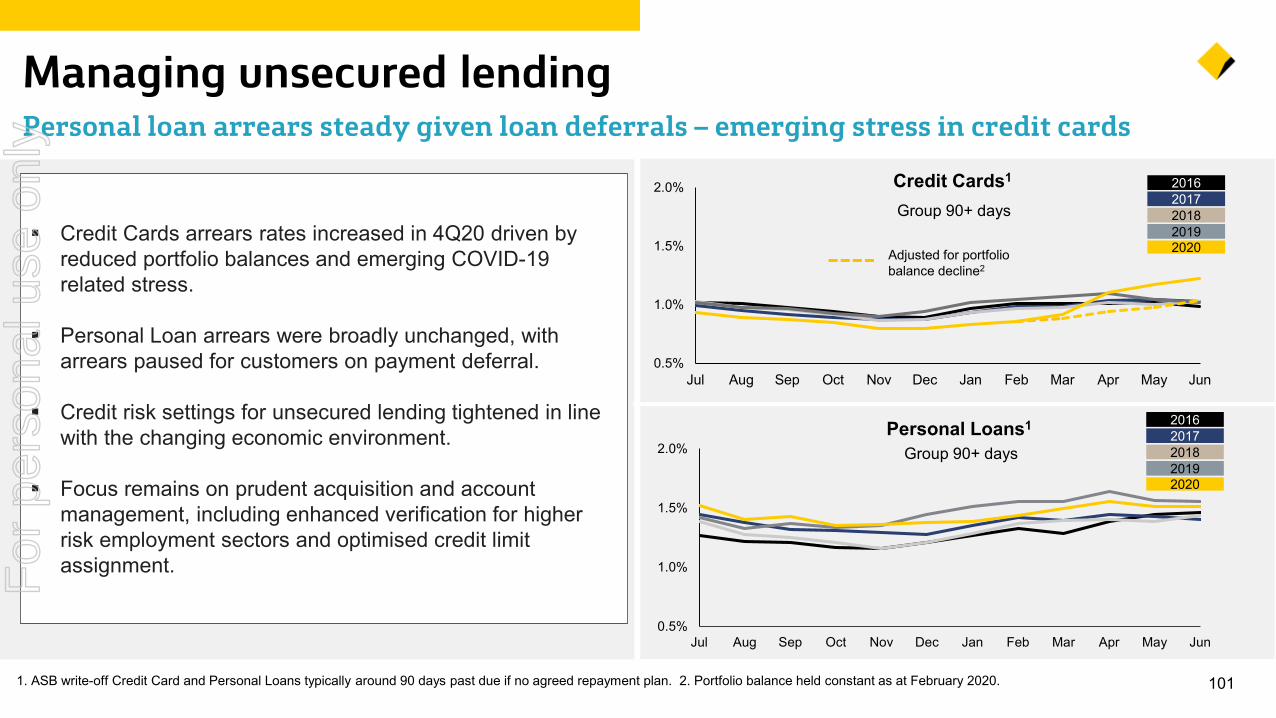
1011. ASB write-off Credit Card and Personal Loans typically around 90 days past due if no agreed repayment plan. 2. Portfolio balance held constant as at February 2020.
Managing unsecured lendingPersonal loan arrears steady given loan deferrals – emerging stress in credit cards
Personal Loans1
Group 90+ days
Credit Cards arrears rates increased in 4Q20 driven by reduced portfolio balances and emerging COVID-19 related stress.
Personal Loan arrears were broadly unchanged, with arrears paused for customers on payment deferral.
Credit risk settings for unsecured lending tightened in line with the changing economic environment.
Focus remains on prudent acquisition and account management, including enhanced verification for higher risk employment sectors and optimised credit limit assignment.
0.5%
1.0%
1.5%
2.0%
Jul Aug Sep Oct Nov Dec Jan Feb Mar Apr May Jun
0.5%
1.0%
1.5%
2.0%
Jul Aug Sep Oct Nov Dec Jan Feb Mar Apr May Jun
Credit Cards1
Group 90+ days20172016
202020192018
Adjusted for portfolio balance decline2
20172016
202020192018
For
per
sona
l use
onl
y
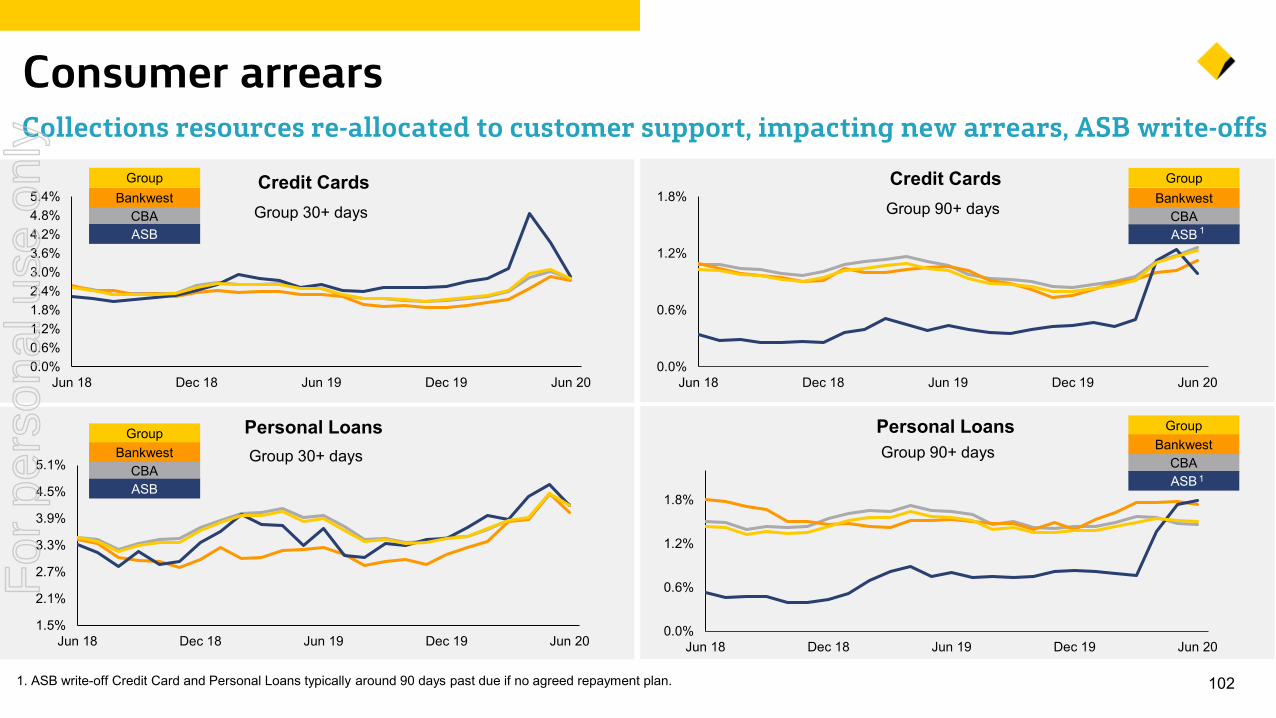
0.0%
0.6%
1.2%
1.8%
Jun 18 Dec 18 Jun 19 Dec 19 Jun 20
0.0%
0.6%
1.2%
1.8%
Jun 18 Dec 18 Jun 19 Dec 19 Jun 20
1021. ASB write-off Credit Card and Personal Loans typically around 90 days past due if no agreed repayment plan.
Consumer arrearsCollections resources re-allocated to customer support, impacting new arrears, ASB write-offs
Group 90+ days
Credit Cards Group
CBAASB
Bankwest
1
Personal Loans Group
CBAASB
Bankwest
1
Group 90+ days
Group 30+ days
Credit CardsGroup
CBAASB
Bankwest
Group
CBAASB
Bankwest
Personal LoansGroup 30+ days
0.0%0.6%1.2%1.8%2.4%3.0%3.6%4.2%4.8%5.4%
Jun 18 Dec 18 Jun 19 Dec 19 Jun 20
1.5%
2.1%
2.7%
3.3%
3.9%
4.5%
5.1%
Jun 18 Dec 18 Jun 19 Dec 19 Jun 20
For
per
sona
l use
onl
y

103
Business and Corporate Lending For
per
sona
l use
onl
y
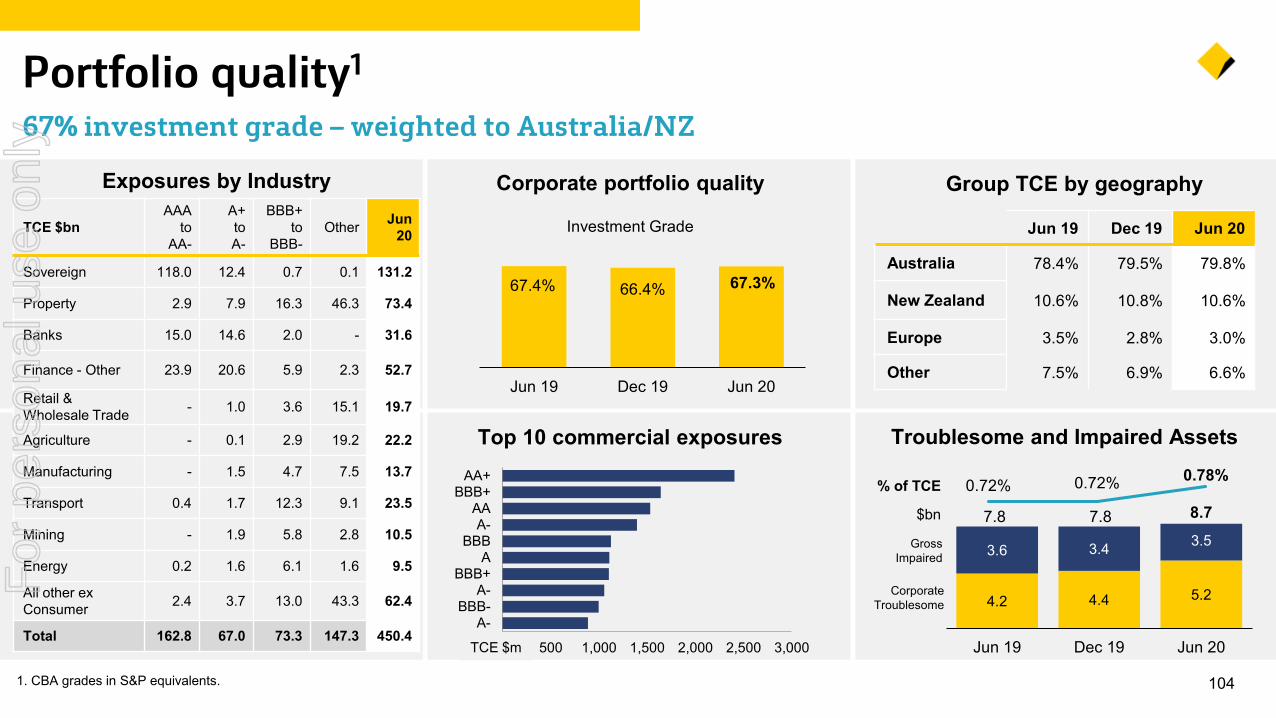
1041. CBA grades in S&P equivalents.
Portfolio quality1
67% investment grade – weighted to Australia/NZ
Corporate portfolio quality
Investment Grade
Exposures by Industry Group TCE by geography
Top 10 commercial exposures Troublesome and Impaired Assets
Gross Impaired
CorporateTroublesome
% of TCE
$bn
0.72% 0.72% 0.78%
67.4% 66.4% 67.3%
Jun 19 Dec 19 Jun 20
TCE $bnAAA
to AA-
A+ to A-
BBB+ to
BBB-Other Jun
20
Sovereign 118.0 12.4 0.7 0.1 131.2
Property 2.9 7.9 16.3 46.3 73.4
Banks 15.0 14.6 2.0 - 31.6
Finance - Other 23.9 20.6 5.9 2.3 52.7
Retail &Wholesale Trade - 1.0 3.6 15.1 19.7
Agriculture - 0.1 2.9 19.2 22.2
Manufacturing - 1.5 4.7 7.5 13.7
Transport 0.4 1.7 12.3 9.1 23.5
Mining - 1.9 5.8 2.8 10.5
Energy 0.2 1.6 6.1 1.6 9.5
All other ex Consumer 2.4 3.7 13.0 43.3 62.4
Total 162.8 67.0 73.3 147.3 450.4
Jun 19 Dec 19 Jun 20
Australia 78.4% 79.5% 79.8%
New Zealand 10.6% 10.8% 10.6%
Europe 3.5% 2.8% 3.0%
Other 7.5% 6.9% 6.6%
4.2 4.4 5.2
3.6 3.4 3.57.8 7.8 8.7
Jun 19 Dec 19 Jun 20 - 500 1,000 1,500 2,000 2,500 3,000
AA+BBB+
AAA-
BBBA
BBB+A-
BBB-A-
TCE $m
For
per
sona
l use
onl
y
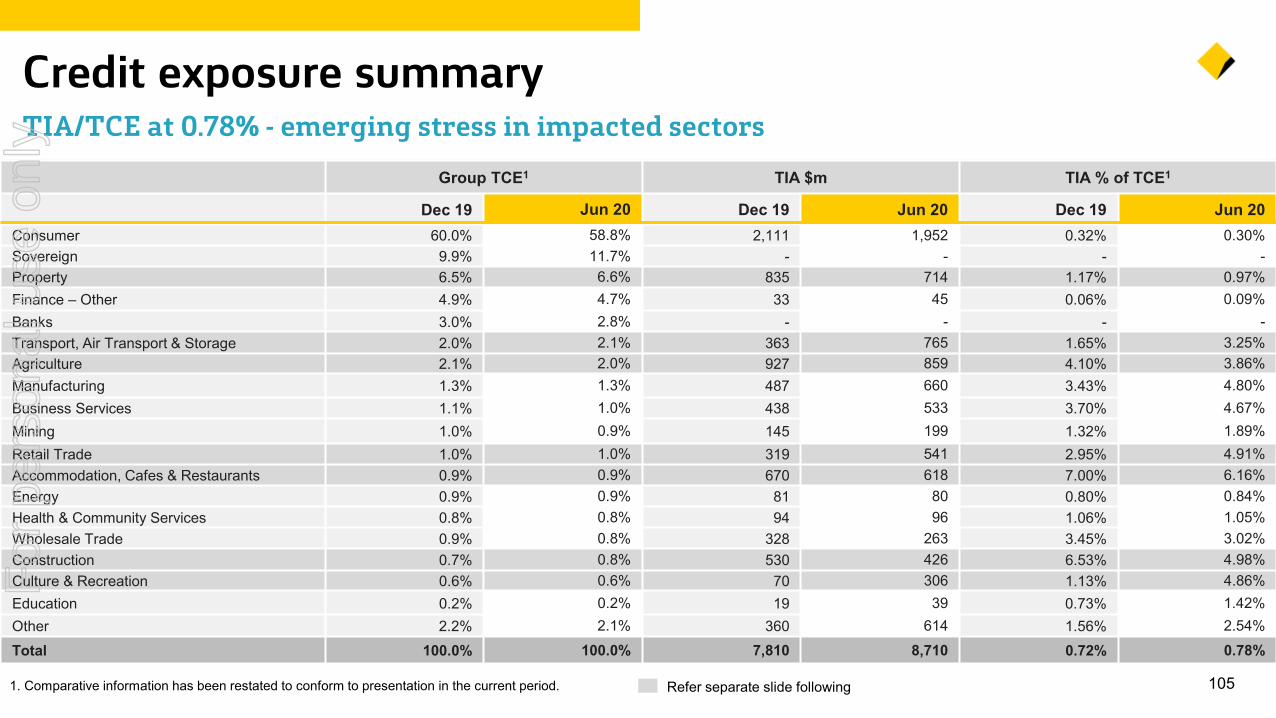
105
Credit exposure summary TIA/TCE at 0.78% - emerging stress in impacted sectors
Group TCE1 TIA $m TIA % of TCE1
Dec 19 Jun 20 Dec 19 Jun 20 Dec 19 Jun 20Consumer 60.0% 58.8% 2,111 1,952 0.32% 0.30%Sovereign 9.9% 11.7% - - - -Property 6.5% 6.6% 835 714 1.17% 0.97%Finance – Other 4.9% 4.7% 33 45 0.06% 0.09%Banks 3.0% 2.8% - - - -Transport, Air Transport & Storage 2.0% 2.1% 363 765 1.65% 3.25%Agriculture 2.1% 2.0% 927 859 4.10% 3.86%Manufacturing 1.3% 1.3% 487 660 3.43% 4.80%Business Services 1.1% 1.0% 438 533 3.70% 4.67%Mining 1.0% 0.9% 145 199 1.32% 1.89%Retail Trade 1.0% 1.0% 319 541 2.95% 4.91%Accommodation, Cafes & Restaurants 0.9% 0.9% 670 618 7.00% 6.16%Energy 0.9% 0.9% 81 80 0.80% 0.84%Health & Community Services 0.8% 0.8% 94 96 1.06% 1.05%Wholesale Trade 0.9% 0.8% 328 263 3.45% 3.02%Construction 0.7% 0.8% 530 426 6.53% 4.98%Culture & Recreation 0.6% 0.6% 70 306 1.13% 4.86%Education 0.2% 0.2% 19 39 0.73% 1.42%Other 2.2% 2.1% 360 614 1.56% 2.54%Total 100.0% 100.0% 7,810 8,710 0.72% 0.78%
Refer separate slide following1. Comparative information has been restated to conform to presentation in the current period.
For
per
sona
l use
onl
y
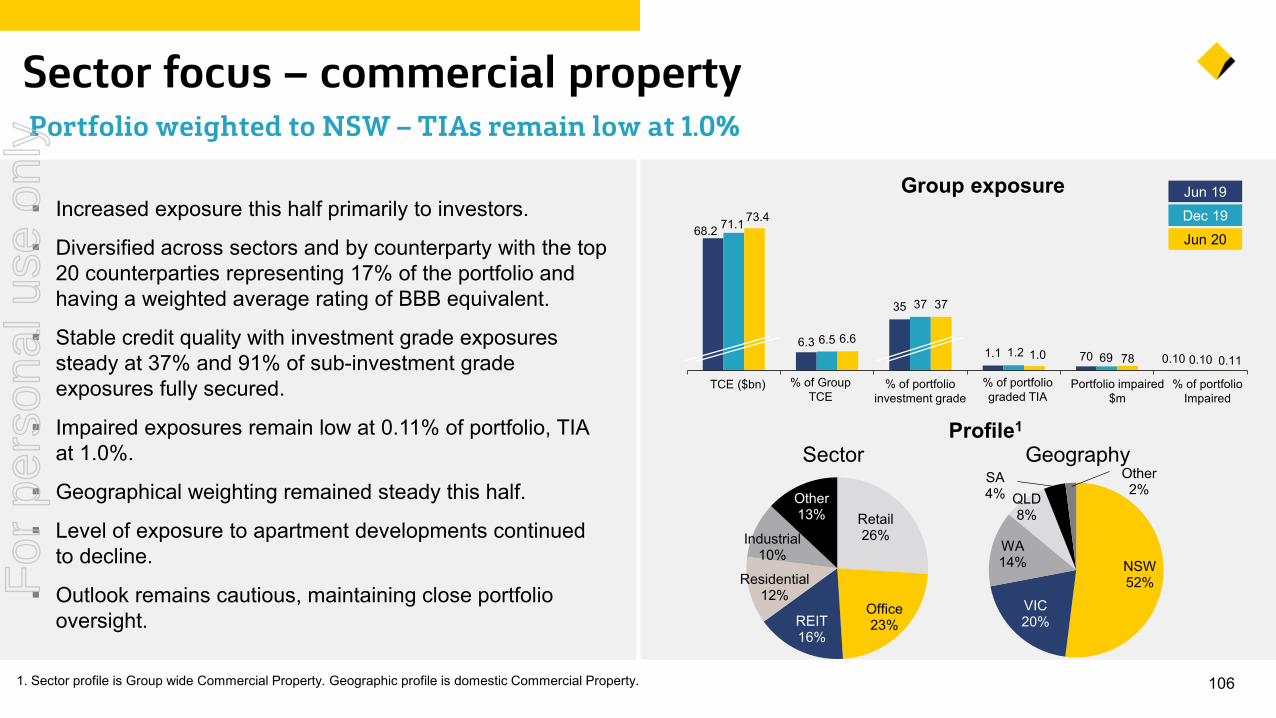
1061. Sector profile is Group wide Commercial Property. Geographic profile is domestic Commercial Property.
Sector focus – commercial property Portfolio weighted to NSW – TIAs remain low at 1.0%
Group exposure
% of GroupTCE
Portfolio impaired $m
% of portfolio investment grade
TCE ($bn) % of portfolio graded TIA
% of portfolio Impaired
68.2
6.3
35
1.1 70 0.10
71.1
6.5
37
1.2 69 0.10
73.4
6.6
37
1.0 78 0.11
Profile1
Sector Geography
Retail26%
Office23%REIT
16%
Residential12%
Industrial10%
Other13%
NSW52%
VIC20%
WA14%
QLD8%
SA4%
Other2%
Jun 20Dec 19Jun 19
Increased exposure this half primarily to investors.
Diversified across sectors and by counterparty with the top 20 counterparties representing 17% of the portfolio and having a weighted average rating of BBB equivalent.
Stable credit quality with investment grade exposures steady at 37% and 91% of sub-investment grade exposures fully secured.
Impaired exposures remain low at 0.11% of portfolio, TIA at 1.0%.
Geographical weighting remained steady this half.
Level of exposure to apartment developments continued to decline.
Outlook remains cautious, maintaining close portfolio oversight.
For
per
sona
l use
onl
y
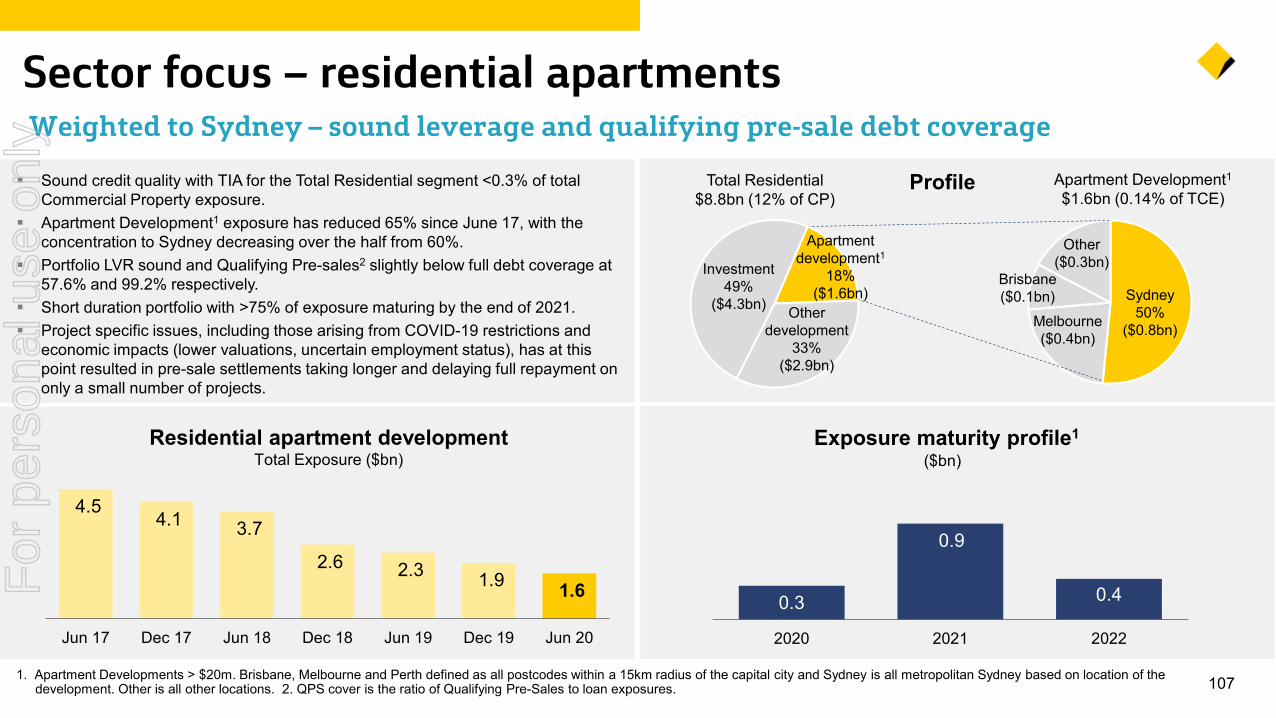
1071. Apartment Developments > $20m. Brisbane, Melbourne and Perth defined as all postcodes within a 15km radius of the capital city and Sydney is all metropolitan Sydney based on location of the development. Other is all other locations. 2. QPS cover is the ratio of Qualifying Pre-Sales to loan exposures.
Sector focus – residential apartments Weighted to Sydney – sound leverage and qualifying pre-sale debt coverage
Brisbane($0.1bn)
Sound credit quality with TIA for the Total Residential segment <0.3% of total Commercial Property exposure.
Apartment Development1 exposure has reduced 65% since June 17, with the concentration to Sydney decreasing over the half from 60%.
Portfolio LVR sound and Qualifying Pre-sales2 slightly below full debt coverage at 57.6% and 99.2% respectively.
Short duration portfolio with >75% of exposure maturing by the end of 2021. Project specific issues, including those arising from COVID-19 restrictions and
economic impacts (lower valuations, uncertain employment status), has at this point resulted in pre-sale settlements taking longer and delaying full repayment on only a small number of projects.
0.3
0.9
0.4
2020 2021 2022
Profile
Apartmentdevelopment1
18%($1.6bn)
Other development
33%($2.9bn)
Investment49%
($4.3bn)
Total Residential$8.8bn (12% of CP)
($bn)Exposure maturity profile1
Melbourne($0.4bn)
Other($0.3bn)
Apartment Development1$1.6bn (0.14% of TCE)
Sydney50%
($0.8bn)
Residential apartment developmentTotal Exposure ($bn)
4.5 4.1 3.7
2.6 2.3 1.9 1.6
Jun 17 Dec 17 Jun 18 Dec 18 Jun 19 Dec 19 Jun 20
For
per
sona
l use
onl
y
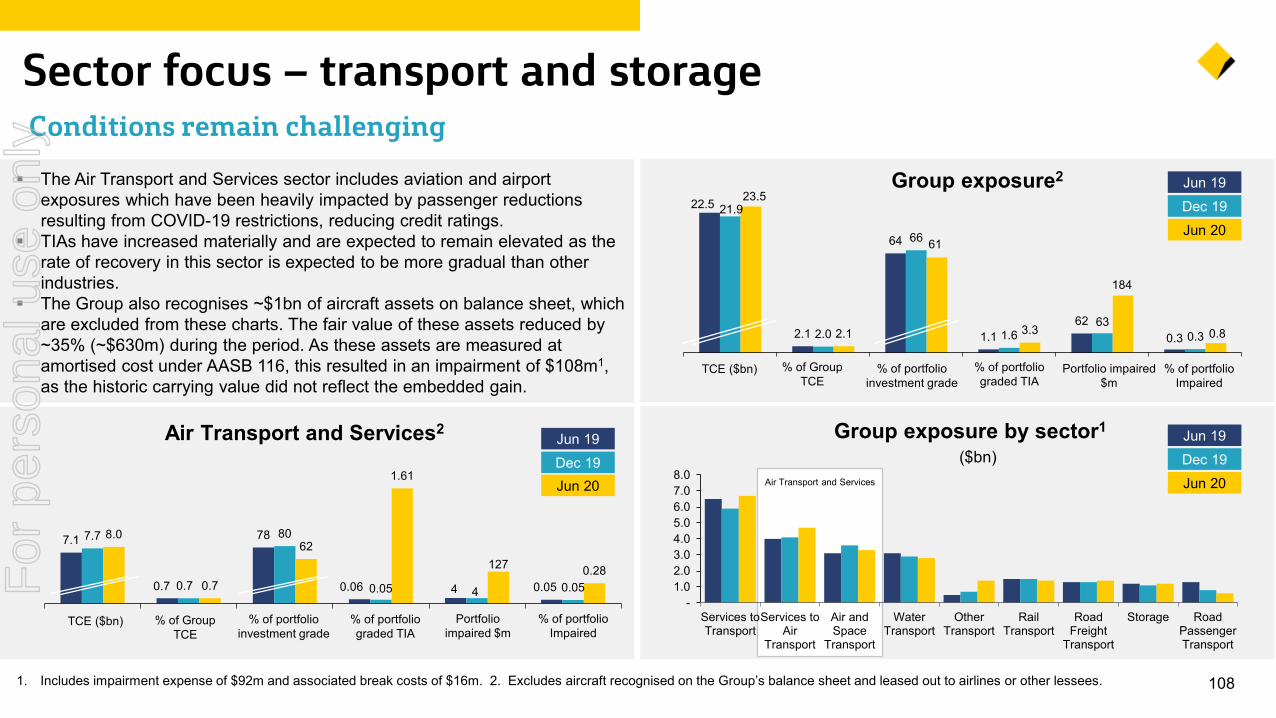
22.5
2.1
64
1.162
0.3
21.9
2.0
66
1.663
0.3
23.5
2.1
61
3.3
184
0.8
1081. Includes impairment expense of $92m and associated break costs of $16m. 2. Excludes aircraft recognised on the Group’s balance sheet and leased out to airlines or other lessees.
Sector focus – transport and storageConditions remain challenging
Group exposure2
% of GroupTCE
Portfolio impaired $m
% of portfolio investment grade
TCE ($bn) % of portfolio graded TIA
% of portfolio Impaired
Group exposure by sector1
($bn)
7.1
0.7
78
0.06 4 0.05
7.7
0.7
80
0.05 4 0.05
8.0
0.7
62
1.61
127 0.28
Air Transport and Services2
% of GroupTCE
Portfolio impaired $m
% of portfolio investment grade
TCE ($bn) % of portfolio graded TIA
% of portfolio Impaired
Jun 20Dec 19Jun 19
Jun 20Dec 19Jun 19
Jun 20Dec 19Jun 19
The Air Transport and Services sector includes aviation and airport exposures which have been heavily impacted by passenger reductions resulting from COVID-19 restrictions, reducing credit ratings.
TIAs have increased materially and are expected to remain elevated as the rate of recovery in this sector is expected to be more gradual than other industries.
The Group also recognises ~$1bn of aircraft assets on balance sheet, which are excluded from these charts. The fair value of these assets reduced by ~35% (~$630m) during the period. As these assets are measured at amortised cost under AASB 116, this resulted in an impairment of $108m1, as the historic carrying value did not reflect the embedded gain.
-1.02.03.04.05.06.07.08.0
Services toTransport
Services toAir
Transport
Air andSpace
Transport
WaterTransport
OtherTransport
RailTransport
RoadFreight
Transport
Storage RoadPassengerTransport
Air Transport and Services
For
per
sona
l use
onl
y
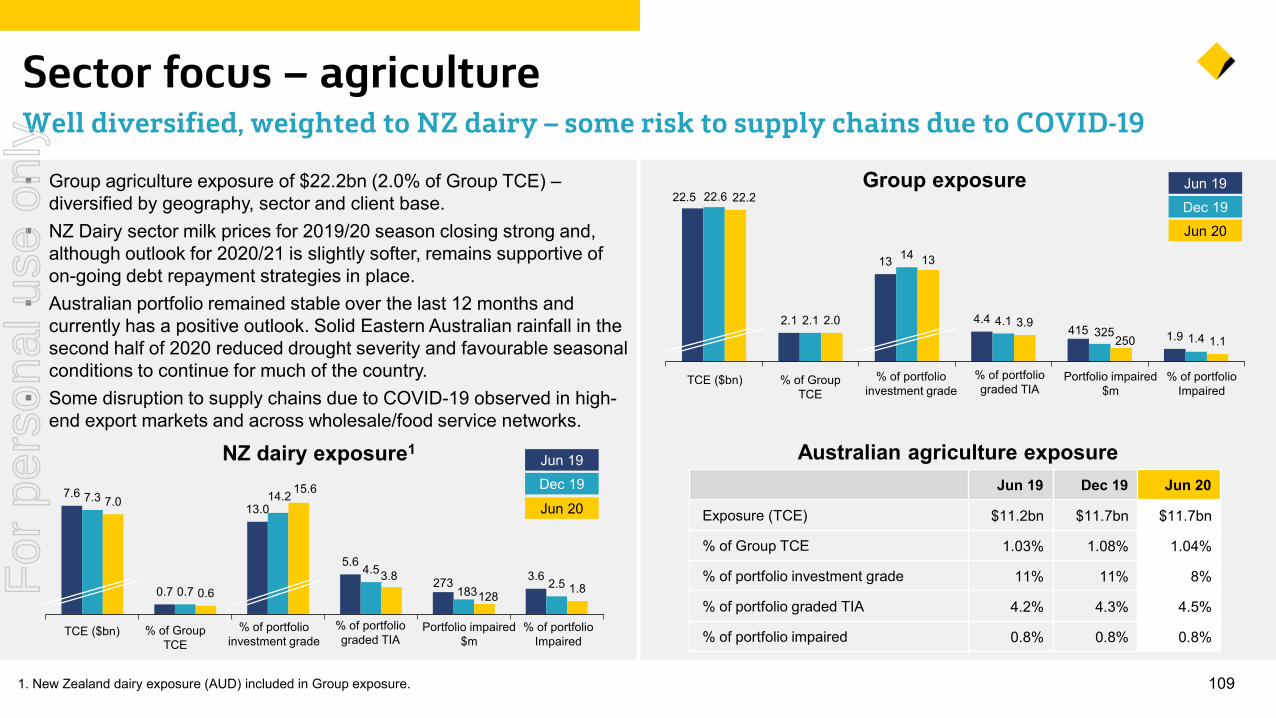
109
Sector focus – agricultureWell diversified, weighted to NZ dairy – some risk to supply chains due to COVID-19
Australian agriculture exposureJun 19 Dec 19 Jun 20
Exposure (TCE) $11.2bn $11.7bn $11.7bn
% of Group TCE 1.03% 1.08% 1.04%
% of portfolio investment grade 11% 11% 8%
% of portfolio graded TIA 4.2% 4.3% 4.5%
% of portfolio impaired 0.8% 0.8% 0.8%
Group agriculture exposure of $22.2bn (2.0% of Group TCE) –diversified by geography, sector and client base.
NZ Dairy sector milk prices for 2019/20 season closing strong and, although outlook for 2020/21 is slightly softer, remains supportive of on-going debt repayment strategies in place.
Australian portfolio remained stable over the last 12 months and currently has a positive outlook. Solid Eastern Australian rainfall in the second half of 2020 reduced drought severity and favourable seasonal conditions to continue for much of the country.
Some disruption to supply chains due to COVID-19 observed in high-end export markets and across wholesale/food service networks.
22.5
2.1
13
4.4415 1.9
22.6
2.1
14
4.1325 1.4
22.2
2.0
13
3.9250 1.1
Group exposure
% of GroupTCE
Portfolio impaired $m
% of portfolio investment grade
TCE ($bn) % of portfolio graded TIA
% of portfolio Impaired
Jun 20Dec 19Jun 19
7.6
0.7
13.0
5.6
273 3.6
7.3
0.7
14.2
4.5
183 2.5
7.0
0.6
15.6
3.8
1281.8
NZ dairy exposure1
% of GroupTCE
Portfolio impaired $m
% of portfolio investment grade
TCE ($bn) % of portfolio graded TIA
% of portfolio Impaired
Jun 20
Dec 19Jun 19
1. New Zealand dairy exposure (AUD) included in Group exposure.
For
per
sona
l use
onl
y
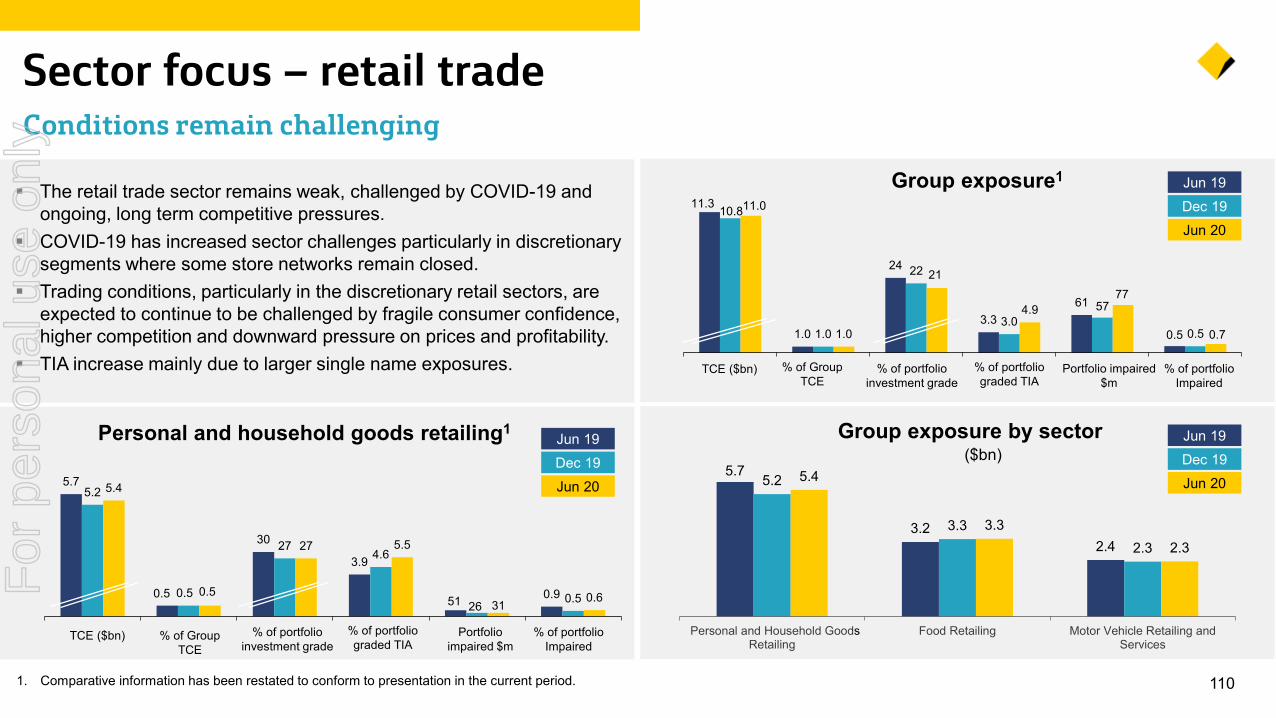
11.3
1.0
24
3.361
0.5
10.8
1.0
22
3.057
0.5
11.0
1.0
21
4.977
0.7
1101. Comparative information has been restated to conform to presentation in the current period.
Sector focus – retail trade Conditions remain challenging
Group exposure1
% of GroupTCE
Portfolio impaired $m
% of portfolio investment grade
TCE ($bn) % of portfolio graded TIA
% of portfolio Impaired
5.7
3.2 2.4
5.2
3.3 2.3
5.4
3.3 2.3
Personal and Household GoodRetailing
Food Retailing Motor Vehicle Retailing andServices
Group exposure by sector($bn)
5.7
0.5
30
3.9
51 0.9
5.2
0.5
274.6
26 0.5
5.4
0.5
27 5.5
31 0.6
Personal and household goods retailing1
% of GroupTCE
Portfolio impaired $m
% of portfolio investment grade
TCE ($bn) % of portfolio graded TIA
% of portfolio Impaired
The retail trade sector remains weak, challenged by COVID-19 and ongoing, long term competitive pressures.
COVID-19 has increased sector challenges particularly in discretionary segments where some store networks remain closed.
Trading conditions, particularly in the discretionary retail sectors, are expected to continue to be challenged by fragile consumer confidence, higher competition and downward pressure on prices and profitability.
TIA increase mainly due to larger single name exposures.
Jun 20Dec 19Jun 19
Jun 20Dec 19Jun 19
Jun 20Dec 19Jun 19
s
For
per
sona
l use
onl
y
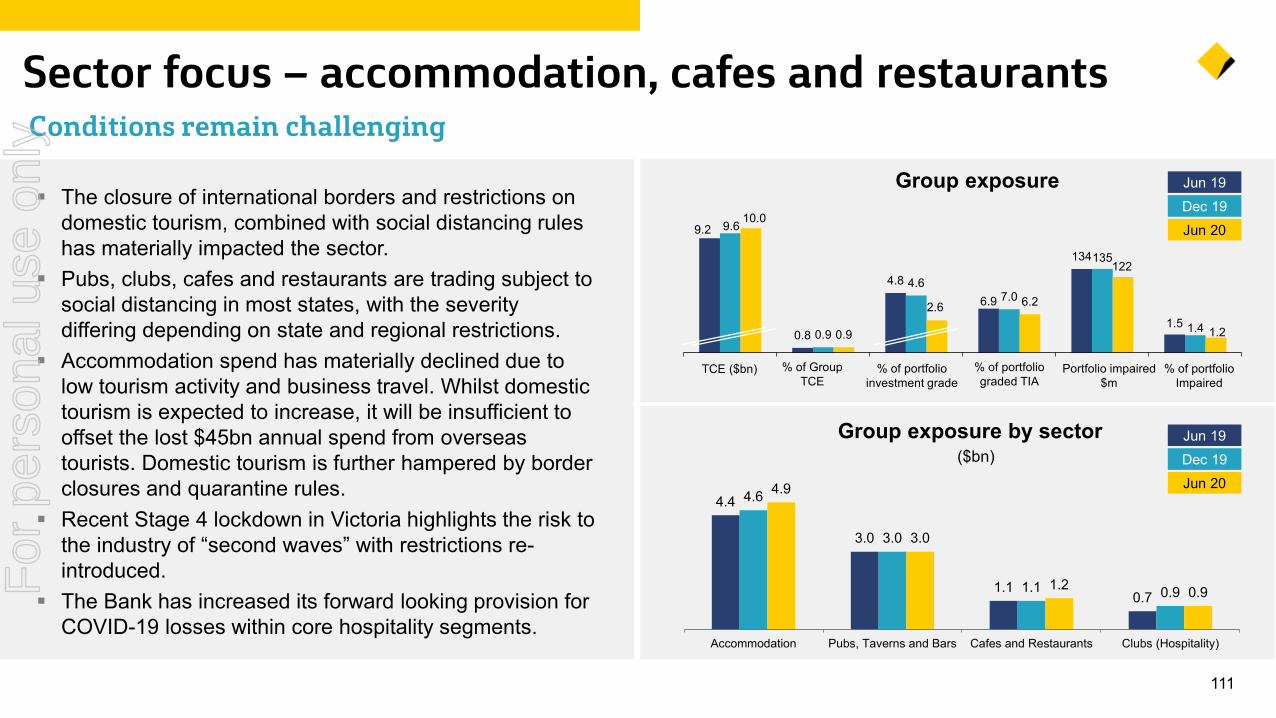
9.2
0.8
4.8
6.9
134
1.5
9.6
0.9
4.67.0
135
1.4
10.0
0.9
2.6 6.2
122
1.2
111
Sector focus – accommodation, cafes and restaurantsConditions remain challenging
Group exposure
% of GroupTCE
Portfolio impaired $m
% of portfolio investment grade
TCE ($bn) % of portfolio graded TIA
% of portfolio Impaired
Group exposure by sector($bn)
The closure of international borders and restrictions on domestic tourism, combined with social distancing rules has materially impacted the sector.
Pubs, clubs, cafes and restaurants are trading subject to social distancing in most states, with the severity differing depending on state and regional restrictions.
Accommodation spend has materially declined due to low tourism activity and business travel. Whilst domestic tourism is expected to increase, it will be insufficient to offset the lost $45bn annual spend from overseas tourists. Domestic tourism is further hampered by border closures and quarantine rules.
Recent Stage 4 lockdown in Victoria highlights the risk to the industry of “second waves” with restrictions re-introduced.
The Bank has increased its forward looking provision for COVID-19 losses within core hospitality segments.
Jun 20Dec 19Jun 19
Jun 20Dec 19Jun 19
4.4
3.0
1.1 0.7
4.6
3.0
1.1 0.9
4.9
3.0
1.2 0.9
Accommodation Pubs, Taverns and Bars Cafes and Restaurants Clubs (Hospitality)
For
per
sona
l use
onl
y
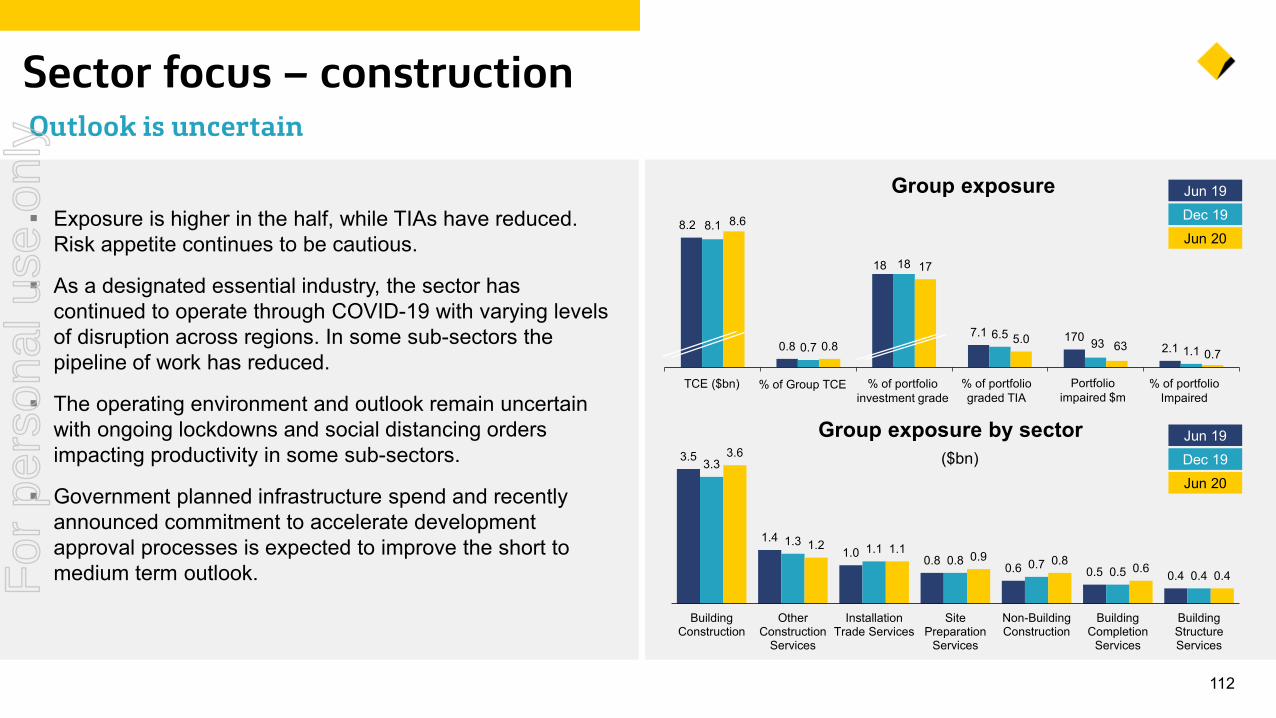
112
Sector focus – construction Outlook is uncertain
Exposure is higher in the half, while TIAs have reduced. Risk appetite continues to be cautious.
As a designated essential industry, the sector has continued to operate through COVID-19 with varying levels of disruption across regions. In some sub-sectors the pipeline of work has reduced.
The operating environment and outlook remain uncertain with ongoing lockdowns and social distancing orders impacting productivity in some sub-sectors.
Government planned infrastructure spend and recently announced commitment to accelerate development approval processes is expected to improve the short to medium term outlook.
8.2
0.8
18
7.1 1702.1
8.1
0.7
18
6.593 1.1
8.6
0.8
17
5.0 63 0.7
Group exposure by sector
% of Group TCE Portfolio impaired $m
% of portfolio investment grade
TCE ($bn) % of portfolio graded TIA
% of portfolio Impaired
($bn)
Jun 20Dec 19Jun 19Group exposure
Jun 20Dec 19Jun 19
3.5
1.4 1.0 0.8 0.6 0.5 0.4
3.3
1.3 1.1 0.8 0.7 0.5 0.4
3.6
1.2 1.1 0.9 0.8 0.6 0.4
BuildingConstruction
OtherConstruction
Services
InstallationTrade Services
SitePreparation
Services
Non-BuildingConstruction
BuildingCompletion
Services
BuildingStructureServices
For
per
sona
l use
onl
y
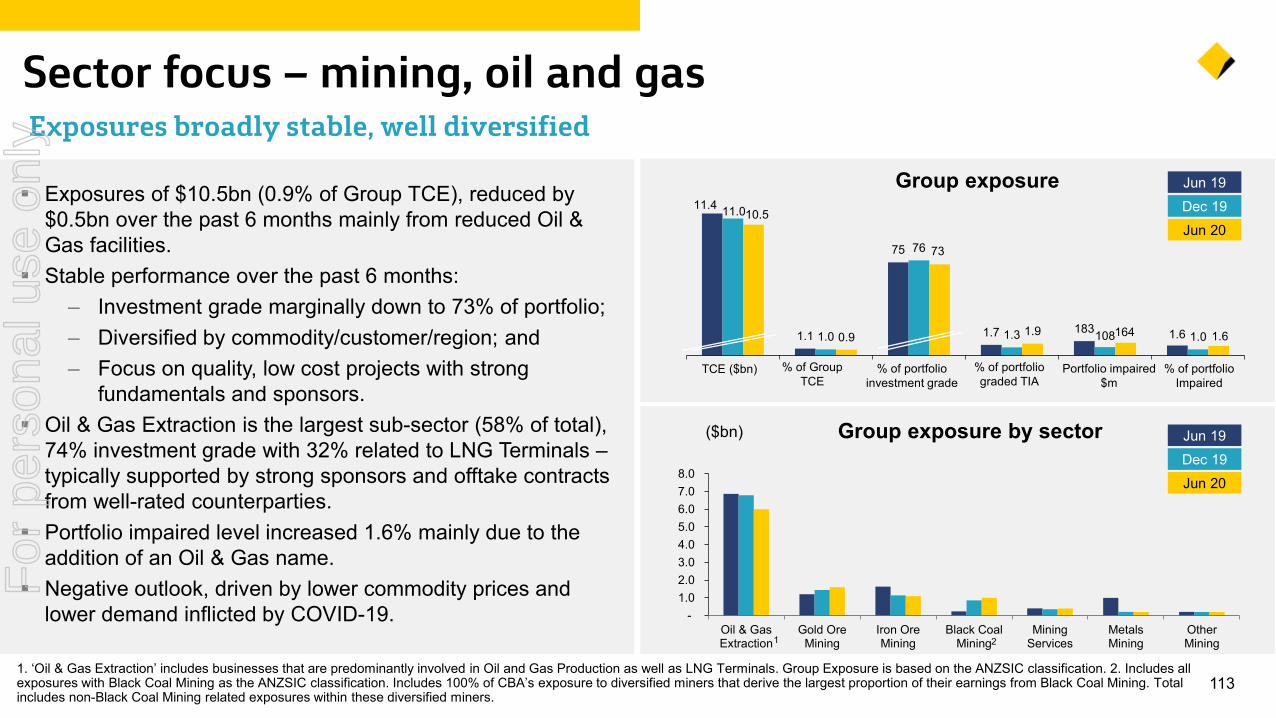
11.4
1.1
75
1.7 183 1.6
11.0
1.0
76
1.3 108 1.0
10.5
0.9
73
1.9 164 1.6
1131. ‘Oil & Gas Extraction’ includes businesses that are predominantly involved in Oil and Gas Production as well as LNG Terminals. Group Exposure is based on the ANZSIC classification. 2. Includes all exposures with Black Coal Mining as the ANZSIC classification. Includes 100% of CBA’s exposure to diversified miners that derive the largest proportion of their earnings from Black Coal Mining. Total includes non-Black Coal Mining related exposures within these diversified miners.
Sector focus – mining, oil and gas
Group exposure
% of GroupTCE
Portfolio impaired $m
% of portfolio investment grade
TCE ($bn) % of portfolio graded TIA
% of portfolio Impaired
-1.02.03.04.05.06.07.08.0
Oil & GasExtraction
Gold OreMining
Iron OreMining
Black CoalMining
MiningServices
MetalsMining
OtherMining
Group exposure by sector($bn)
Exposures of $10.5bn (0.9% of Group TCE), reduced by $0.5bn over the past 6 months mainly from reduced Oil & Gas facilities.
Stable performance over the past 6 months:‒ Investment grade marginally down to 73% of portfolio;‒ Diversified by commodity/customer/region; and‒ Focus on quality, low cost projects with strong
fundamentals and sponsors. Oil & Gas Extraction is the largest sub-sector (58% of total),
74% investment grade with 32% related to LNG Terminals –typically supported by strong sponsors and offtake contracts from well-rated counterparties.
Portfolio impaired level increased 1.6% mainly due to the addition of an Oil & Gas name.
Negative outlook, driven by lower commodity prices and lower demand inflicted by COVID-19.
Jun 20Dec 19Jun 19
Jun 20Dec 19Jun 19
Exposures broadly stable, well diversified
1 2
For
per
sona
l use
onl
y
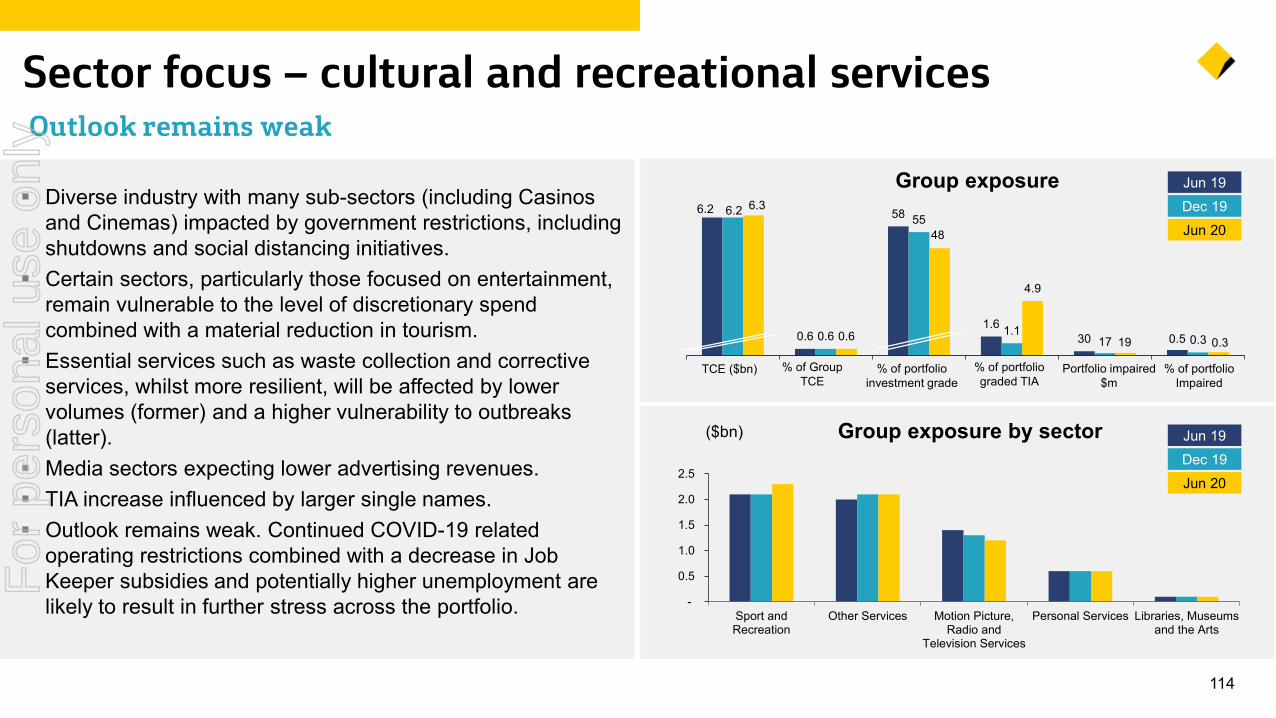
6.2
0.6
58
1.630 0.5
6.2
0.6
55
1.117 0.3
6.3
0.6
48
4.9
19 0.3
114
Sector focus – cultural and recreational services
Group exposure
% of GroupTCE
Portfolio impaired $m
% of portfolio investment grade
TCE ($bn) % of portfolio graded TIA
% of portfolio Impaired
-
0.5
1.0
1.5
2.0
2.5
Sport andRecreation
Other Services Motion Picture,Radio and
Television Services
Personal Services Libraries, Museumsand the Arts
Group exposure by sector($bn)
Jun 20Dec 19Jun 19
Jun 20Dec 19Jun 19
Outlook remains weak
Diverse industry with many sub-sectors (including Casinos and Cinemas) impacted by government restrictions, including shutdowns and social distancing initiatives.
Certain sectors, particularly those focused on entertainment, remain vulnerable to the level of discretionary spend combined with a material reduction in tourism.
Essential services such as waste collection and corrective services, whilst more resilient, will be affected by lower volumes (former) and a higher vulnerability to outbreaks (latter).
Media sectors expecting lower advertising revenues. TIA increase influenced by larger single names. Outlook remains weak. Continued COVID-19 related
operating restrictions combined with a decrease in Job Keeper subsidies and potentially higher unemployment are likely to result in further stress across the portfolio.
For
per
sona
l use
onl
y
115
Deposits, Funding and Liquidity For
per
sona
l use
onl
y
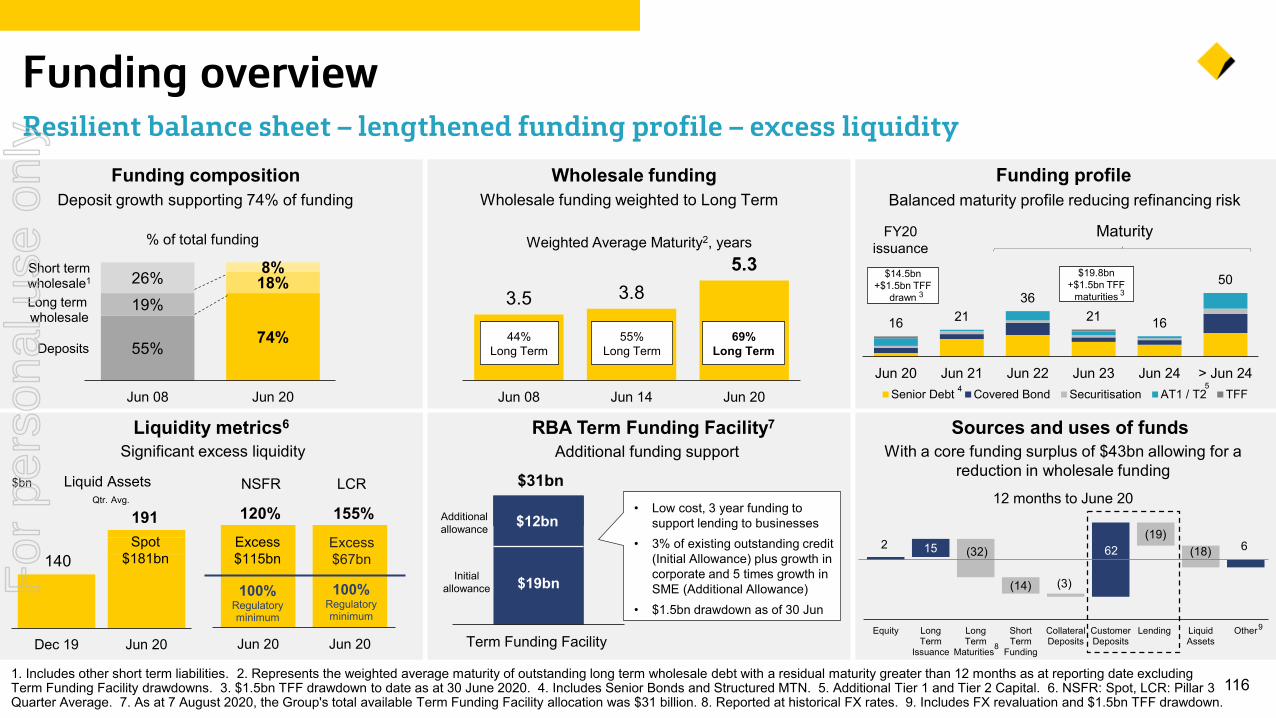
16 2136
21 16
50
Jun 20 Jun 21 Jun 22 Jun 23 Jun 24 > Jun 24Senior Debt Covered Bond Securitisation AT1 / T2 TFF
2 15 62 6 (32)
(14) (3)
(19)(18)
Equity LongTerm
Issuance
LongTerm
Maturities*
ShortTerm
Funding
CollateralDeposits
CustomerDeposits
Lending LiquidAssets
Other
3.5 3.85.3
Jun 08 Jun 14 Jun 20
1161. Includes other short term liabilities. 2. Represents the weighted average maturity of outstanding long term wholesale debt with a residual maturity greater than 12 months as at reporting date excluding Term Funding Facility drawdowns. 3. $1.5bn TFF drawdown to date as at 30 June 2020. 4. Includes Senior Bonds and Structured MTN. 5. Additional Tier 1 and Tier 2 Capital. 6. NSFR: Spot, LCR: Pillar 3 Quarter Average. 7. As at 7 August 2020, the Group's total available Term Funding Facility allocation was $31 billion. 8. Reported at historical FX rates. 9. Includes FX revaluation and $1.5bn TFF drawdown.
Funding overviewResilient balance sheet – lengthened funding profile – excess liquidity
Additional funding support
• Low cost, 3 year funding to support lending to businesses
• 3% of existing outstanding credit (Initial Allowance) plus growth in corporate and 5 times growth in SME (Additional Allowance)
• $1.5bn drawdown as of 30 Jun
RBA Term Funding Facility7
$19bn
Term Funding Facility
Initial allowance
Additional allowance $12bn
Wholesale funding
Weighted Average Maturity2, years
Wholesale funding weighted to Long Term
55% Long Term
44% Long Term
69% Long Term
$31bn
Balanced maturity profile reducing refinancing risk
Maturity
Funding profile
FY20issuance
4 5
Funding composition
55%74%
19%18%26% 8%
Jun 08 Jun 20
Deposits
Long term wholesale
Short term wholesale1
% of total funding
Deposit growth supporting 74% of funding
Significant excess liquidityLiquidity metrics6
Liquid Assets$bn
140
191
Dec 19 Jun 20
Qtr. Avg. 120% 155%
Jun 20 Jun 20
Excess$115bn
100%
NSFR LCR
Regulatory minimum
Excess$67bn
100%Regulatory minimum
Spot $181bn
8
Sources and uses of funds
12 months to June 20
With a core funding surplus of $43bn allowing for a reduction in wholesale funding
$14.5bn +$1.5bn TFF
drawn
$19.8bn +$1.5bn TFF
maturities
9
3 3
For
per
sona
l use
onl
y
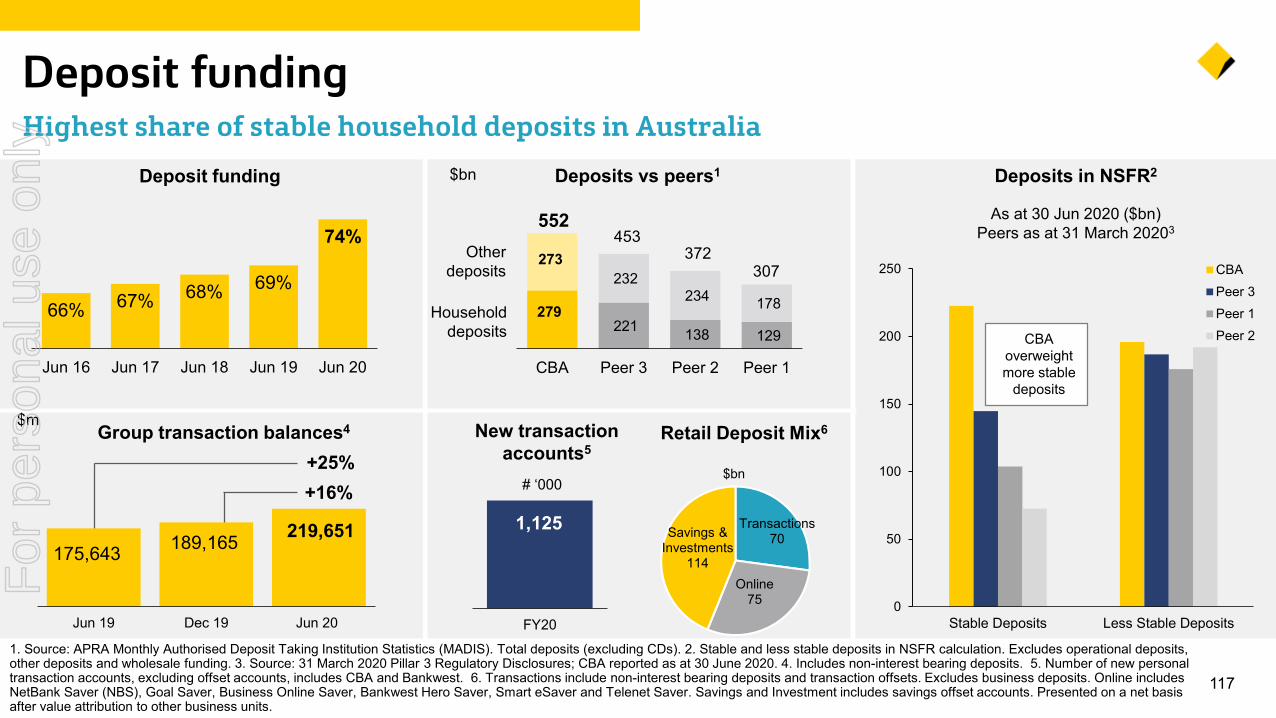
Transactions70
Online75
Savings & Investments
114
117
Deposit funding Highest share of stable household deposits in Australia
Deposits vs peers1Deposit funding $bn
$bn# ‘000
Group transaction balances4$m
1. Source: APRA Monthly Authorised Deposit Taking Institution Statistics (MADIS). Total deposits (excluding CDs). 2. Stable and less stable deposits in NSFR calculation. Excludes operational deposits, other deposits and wholesale funding. 3. Source: 31 March 2020 Pillar 3 Regulatory Disclosures; CBA reported as at 30 June 2020. 4. Includes non-interest bearing deposits. 5. Number of new personal transaction accounts, excluding offset accounts, includes CBA and Bankwest. 6. Transactions include non-interest bearing deposits and transaction offsets. Excludes business deposits. Online includes NetBank Saver (NBS), Goal Saver, Business Online Saver, Bankwest Hero Saver, Smart eSaver and Telenet Saver. Savings and Investment includes savings offset accounts. Presented on a net basis after value attribution to other business units.
175,643 189,165 219,651
Jun 19 Dec 19 Jun 20
+25%+16%
1,125
FY20
66% 67% 68% 69%
74%
Jun 16 Jun 17 Jun 18 Jun 19 Jun 20
Deposits in NSFR2
CBA overweight more stable
deposits
0
50
100
150
200
250
Stable Deposits Less Stable Deposits
CBAPeer 3Peer 1Peer 2
As at 30 Jun 2020 ($bn)Peers as at 31 March 20203
Householddeposits
Otherdeposits
552
New transactionaccounts5
Retail Deposit Mix6
279 221 138 129
273 232
234 178
CBA Peer 3 Peer 2 Peer 1
307372
453
For
per
sona
l use
onl
y
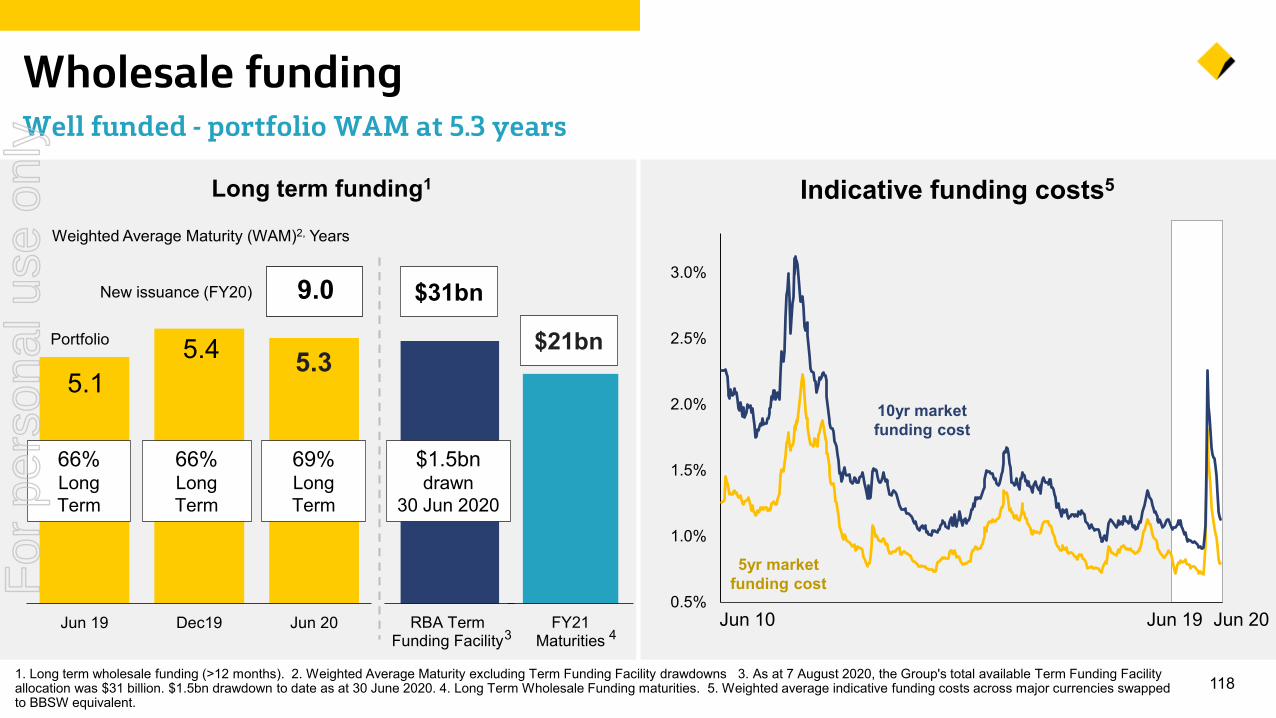
v
0.5%
1.0%
1.5%
2.0%
2.5%
3.0%
Jun 19 Dec19 Jun 20
66% Long Term
66% Long Term
69% Long Term
118
Wholesale fundingWell funded - portfolio WAM at 5.3 years
Indicative funding costs5
Weighted Average Maturity (WAM)2, Years
New issuance (FY20) 9.0
Jun 10 Jun 20
10yr market funding cost
5yr market funding cost
Jun 19
Portfolio 5.4 5.35.1
Long term funding1
RBA TermFunding Facility
$31bn
FY21Maturities
$21bn
$1.5bn drawn
30 Jun 2020
3
1. Long term wholesale funding (>12 months). 2. Weighted Average Maturity excluding Term Funding Facility drawdowns 3. As at 7 August 2020, the Group's total available Term Funding Facility allocation was $31 billion. $1.5bn drawdown to date as at 30 June 2020. 4. Long Term Wholesale Funding maturities. 5. Weighted average indicative funding costs across major currencies swapped to BBSW equivalent.
4
For
per
sona
l use
onl
y
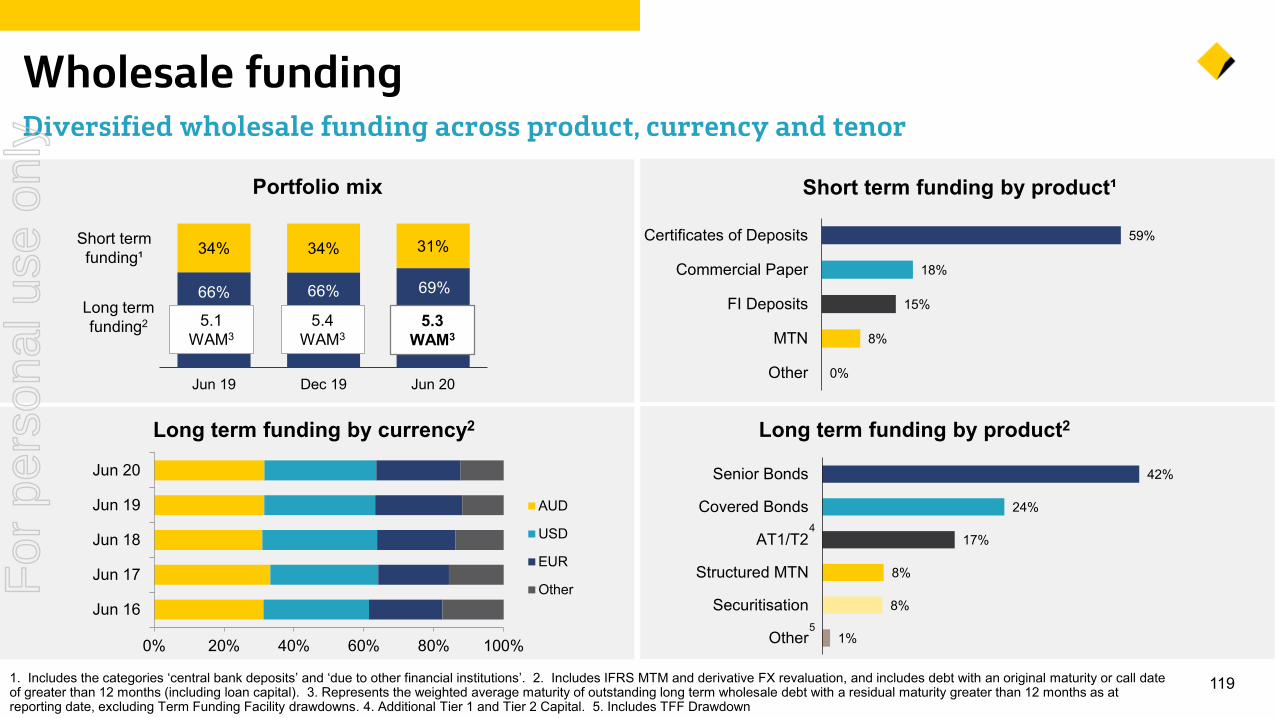
1191. Includes the categories ‘central bank deposits’ and ‘due to other financial institutions’. 2. Includes IFRS MTM and derivative FX revaluation, and includes debt with an original maturity or call date of greater than 12 months (including loan capital). 3. Represents the weighted average maturity of outstanding long term wholesale debt with a residual maturity greater than 12 months as at reporting date, excluding Term Funding Facility drawdowns. 4. Additional Tier 1 and Tier 2 Capital. 5. Includes TFF Drawdown
Wholesale funding Diversified wholesale funding across product, currency and tenor
Long term funding by product2Long term funding by currency2
Short term funding by product¹
4
Portfolio mix
66% 66% 69%
34% 34% 31%
Jun 19 Dec 19 Jun 20
Long term funding2
Short term funding¹
0% 20% 40% 60% 80% 100%
Jun 16
Jun 17
Jun 18
Jun 19
Jun 20
AUD
USD
EUR
Other
1%
8%
8%
17%
24%
42%
Other
Securitisation
Structured MTN
AT1/T2
Covered Bonds
Senior Bonds
5
0%
8%
15%
18%
59%
Other
MTN
FI Deposits
Commercial Paper
Certificates of Deposits
5.3 WAM3
5.4 WAM3
5.1 WAM3
For
per
sona
l use
onl
y
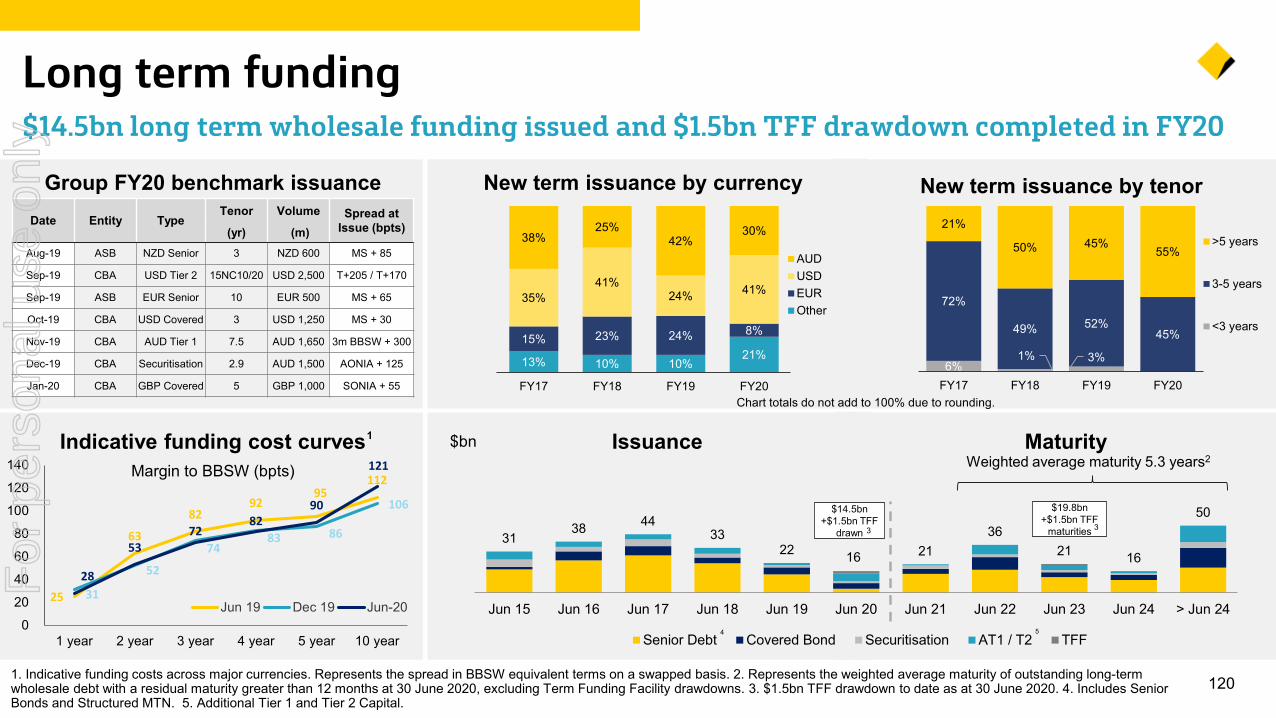
3138 44
3322 16 21
3621 16
50
Jun 15 Jun 16 Jun 17 Jun 18 Jun 19 Jun 20 Jun 21 Jun 22 Jun 23 Jun 24 > Jun 24
Senior Debt Covered Bond Securitisation AT1 / T2 TFF
1201. Indicative funding costs across major currencies. Represents the spread in BBSW equivalent terms on a swapped basis. 2. Represents the weighted average maturity of outstanding long-term wholesale debt with a residual maturity greater than 12 months at 30 June 2020, excluding Term Funding Facility drawdowns. 3. $1.5bn TFF drawdown to date as at 30 June 2020. 4. Includes Senior Bonds and Structured MTN. 5. Additional Tier 1 and Tier 2 Capital.
Long term funding$14.5bn long term wholesale funding issued and $1.5bn TFF drawdown completed in FY20
Group FY20 benchmark issuance
Issuance MaturityWeighted average maturity 5.3 years2
New term issuance by currency New term issuance by tenor
Chart totals do not add to 100% due to rounding.
$bn
Margin to BBSW (bpts)
Indicative funding cost curves
Date Entity TypeTenor Volume Spread at
Issue (bpts)(yr) (m)Aug-19 ASB NZD Senior 3 NZD 600 MS + 85
Sep-19 CBA USD Tier 2 15NC10/20 USD 2,500 T+205 / T+170
Sep-19 ASB EUR Senior 10 EUR 500 MS + 65
Oct-19 CBA USD Covered 3 USD 1,250 MS + 30
Nov-19 CBA AUD Tier 1 7.5 AUD 1,650 3m BBSW + 300
Dec-19 CBA Securitisation 2.9 AUD 1,500 AONIA + 125
Jan-20 CBA GBP Covered 5 GBP 1,000 SONIA + 55
4 5
1
13% 10% 10%21%
15% 23% 24% 8%
35%41%
24% 41%
38%25%
42%30%
FY17 FY18 FY19 FY20
AUDUSDEUROther
6%1% 3%
72%
49% 52%45%
21%
50% 45%55%
FY17 FY18 FY19 FY20
>5 years
3-5 years
<3 years
25
63
82 92
95 112
31
52
74 83 86
106
28
53 72
82 90
121
0
20
40
60
80
100
120
140
1 year 2 year 3 year 4 year 5 year 10 year
Jun 19 Dec 19 Jun-20
$14.5bn +$1.5bn TFF
drawn
$19.8bn +$1.5bn TFF
maturities3 3
For
per
sona
l use
onl
y
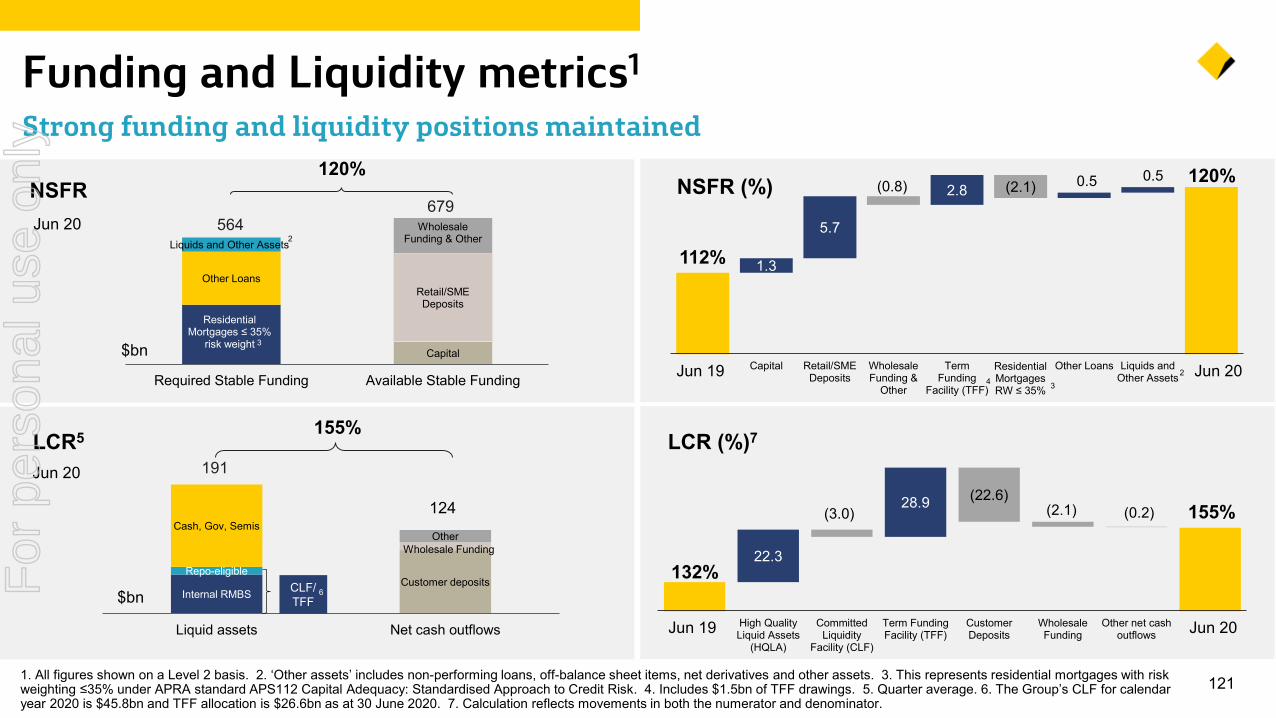
22.3
28.9 (3.0)
(22.6)(2.1) (0.2)
132%
155%
High QualityLiquid Assets
(HQLA)
CommittedLiquidity
Facility (CLF)
Term FundingFacility (TFF)
CustomerDeposits
WholesaleFunding
Other net cashoutflows
1211. All figures shown on a Level 2 basis. 2. ‘Other assets’ includes non-performing loans, off-balance sheet items, net derivatives and other assets. 3. This represents residential mortgages with risk weighting ≤35% under APRA standard APS112 Capital Adequacy: Standardised Approach to Credit Risk. 4. Includes $1.5bn of TFF drawings. 5. Quarter average. 6. The Group’s CLF for calendar year 2020 is $45.8bn and TFF allocation is $26.6bn as at 30 June 2020. 7. Calculation reflects movements in both the numerator and denominator.
Funding and Liquidity metrics1
Strong funding and liquidity positions maintained
Residential Mortgages ≤ 35%
risk weight
Other Loans
Liquids and Other Assets
Capital
Retail/SME Deposits
Wholesale Funding & Other
Required Stable Funding Available Stable Funding
Customer deposits
Wholesale FundingOther
Internal RMBS
Repo-eligible
Cash, Gov, Semis
Liquid assets Net cash outflows
NSFR NSFR (%)
LCR5 LCR (%)7
124
191
679564Jun 20
Jun 20
2
2
CLF/TFF
$bn
$bn
155%
120%
3
3
6
Jun 19 Jun 20
Jun 19 Jun 20
1.3
5.7
2.8 0.5 0.5 (0.8) (2.1)
112%
120%
Capital Retail/SMEDeposits
WholesaleFunding &
Other
TermFunding
Facility (TFF)
Residential Mortgages RW ≤ 35%
Other Loans Liquids andOther Assets4
For
per
sona
l use
onl
y

122
Capital For
per
sona
l use
onl
y
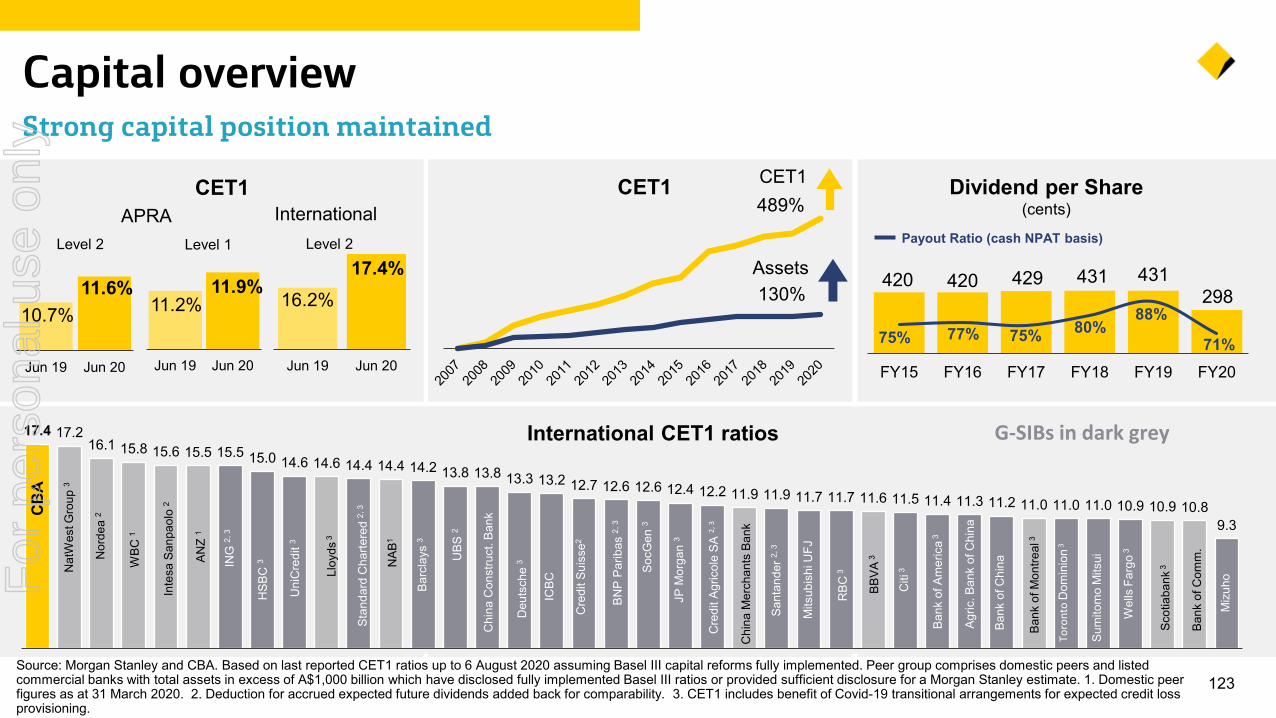
11.2%11.9%
Jun 19 Jun 20
17.4 17.216.1 15.8 15.6 15.5 15.5 15.0 14.6 14.6 14.4 14.4 14.2 13.8 13.8 13.3 13.2 12.7 12.6 12.6 12.4 12.2 11.9 11.9 11.7 11.7 11.6 11.5 11.4 11.3 11.2 11.0 11.0 11.0 10.9 10.9 10.8
9.3
Toro
nto
Dom
inio
n3
Cre
dit A
gric
ole
SA 2,
3
Miz
uho
16.2%17.4%
Jun 19 Jun 20
10.7%11.6%
Jun 19 Jun 20
123Source: Morgan Stanley and CBA. Based on last reported CET1 ratios up to 6 August 2020 assuming Basel III capital reforms fully implemented. Peer group comprises domestic peers and listed commercial banks with total assets in excess of A$1,000 billion which have disclosed fully implemented Basel III ratios or provided sufficient disclosure for a Morgan Stanley estimate. 1. Domestic peer figures as at 31 March 2020. 2. Deduction for accrued expected future dividends added back for comparability. 3. CET1 includes benefit of Covid-19 transitional arrangements for expected credit loss provisioning.
Capital overview Strong capital position maintained
CET1International
Level 2 Level 2
APRALevel 1
130%Assets
489%CET1 Dividend per Share
(cents)
420 420 429 431 431
75% 77% 75% 80%88%
71%FY15 FY16 FY17 FY18 FY19 FY20
Payout Ratio (cash NPAT basis)
CET1
G-SIBs in dark greyInternational CET1 ratios
298
Nor
dea
2CB
A
HSB
C 3
Lloy
ds3
ING
2, 3
ANZ
1
WBC
1
NAB
1
Nat
Wes
t Gro
up 3
Deu
tsch
e 3U
BS 2
ICBC
Cre
dit S
uiss
e2
Mits
ubis
hi U
FJ
Citi
3
JP M
orga
n 3
Sum
itom
o M
itsui
Inte
sa S
anpa
olo
2
SocG
en3
BNP
Parib
as 2,
3
Barc
lays
3
Bank
of C
hina
Bank
of C
omm
.
RBC
3
Wel
ls F
argo
3
Scot
iaba
nk3
Uni
Cre
dit3
Sant
ande
r 2, 3
BBVA
3
Stan
dard
Cha
rtere
d 2,
3
Chi
na C
onst
ruct
. Ban
k
Chi
na M
erch
ants
Ban
k
Bank
of A
mer
ica
3
Agric
. Ban
k of
Chi
na
Bank
of M
ontre
al3
For
per
sona
l use
onl
y
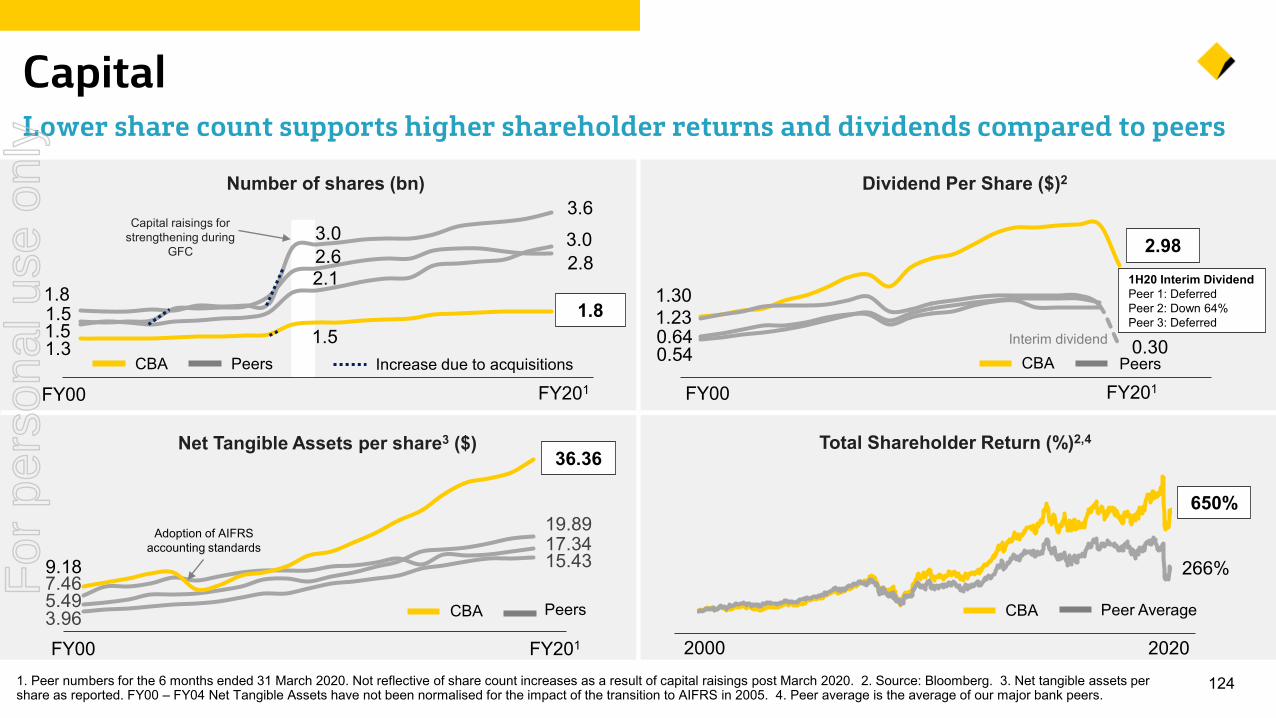
3.96
15.43
5.49
19.89
7.46
17.349.18
1.3 1.5
1.8
3.0 3.6
1.5
2.6 2.8
1.5
2.1
3.0
1241. Peer numbers for the 6 months ended 31 March 2020. Not reflective of share count increases as a result of capital raisings post March 2020. 2. Source: Bloomberg. 3. Net tangible assets per share as reported. FY00 – FY04 Net Tangible Assets have not been normalised for the impact of the transition to AIFRS in 2005. 4. Peer average is the average of our major bank peers.
CapitalLower share count supports higher shareholder returns and dividends compared to peers
Number of shares (bn)
CBA Peers
Capital raisings for strengthening during
GFC
Increase due to acquisitions
Net Tangible Assets per share3 ($)
FY00 FY201
1.8
CBA Peers
Total Shareholder Return (%)2,4
CBA Peer Average
2000 2020
650%
266%
Adoption of AIFRS accounting standards
FY201FY00
36.36
Dividend Per Share ($)2
FY00 FY201
1.30
0.54 0.64 1.23
0.30 CBA Peers
2.981H20 Interim DividendPeer 1: DeferredPeer 2: Down 64%Peer 3: Deferred
Interim dividend
For
per
sona
l use
onl
y
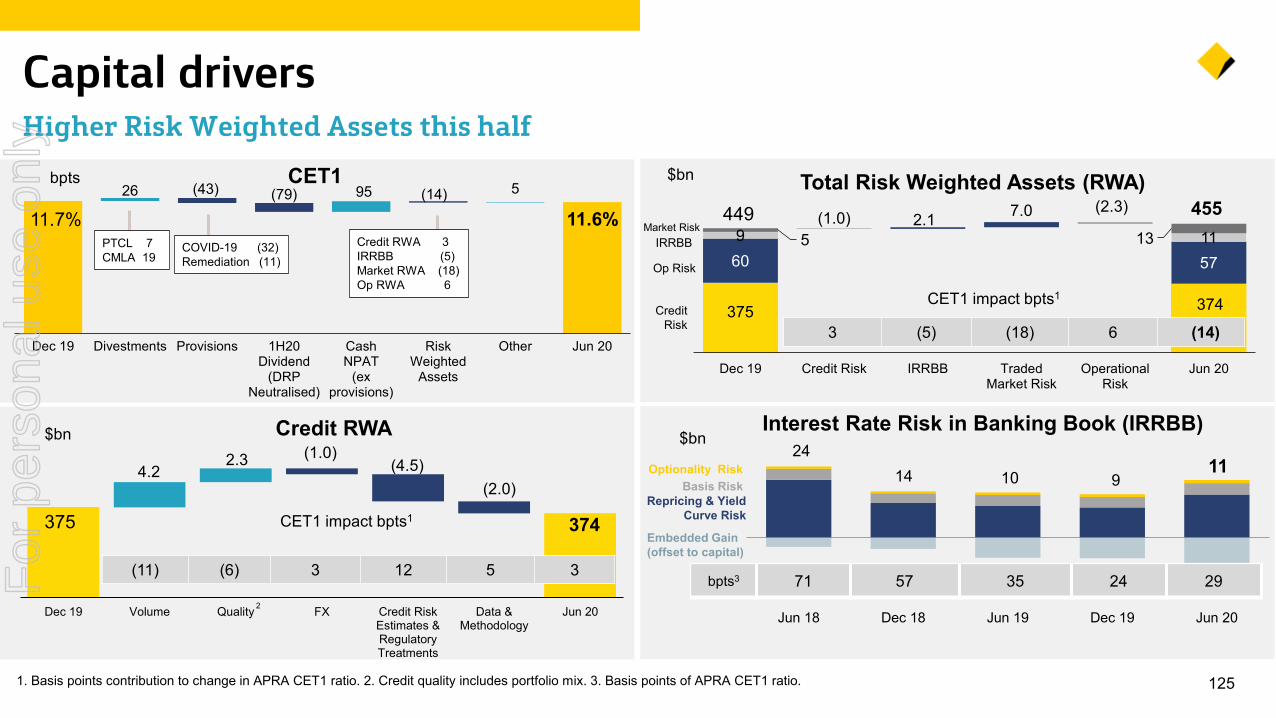
375 374
4.22.3 (1.0)
(4.5)(2.0)
Dec 19 Volume Quality FX Credit RiskEstimates &RegulatoryTreatments
Data &Methodology
Jun 20
26 95 5(43) (79) (14)
11.7% 11.6%
Dec 19 Divestments Provisions 1H20Dividend
(DRPNeutralised)
CashNPAT
(exprovisions)
RiskWeighted
Assets
Other Jun 20
1251. Basis points contribution to change in APRA CET1 ratio. 2. Credit quality includes portfolio mix. 3. Basis points of APRA CET1 ratio.
Capital driversHigher Risk Weighted Assets this half
375 374
60 57
9 115 132.1 7.0(1.0)
(2.3)
Dec 19 Credit Risk IRRBB TradedMarket Risk
OperationalRisk
Jun 20
Total Risk Weighted Assets (RWA)$bn
3 (5) (18) 6 (14)
CET1 impact bpts1
455449
Credit Risk
Op Risk
IRRBBMarket Risk
CET1
Credit RWA 3IRRBB (5)Market RWA (18) Op RWA 6
bpts
$bn
CET1 impact bpts1
COVID-19 (32)Remediation (11)
Credit RWA
PTCL 7CMLA 19
Jun 18 Dec 18 Jun 19 Dec 19 Jun 20
Interest Rate Risk in Banking Book (IRRBB)$bn
Repricing & Yield Curve Risk
Basis RiskOptionality Risk
bpts3 71 57 35 24 29
Embedded Gain (offset to capital)
(11) (6) 3 12 5 3
2414 10 9
11
2
For
per
sona
l use
onl
y
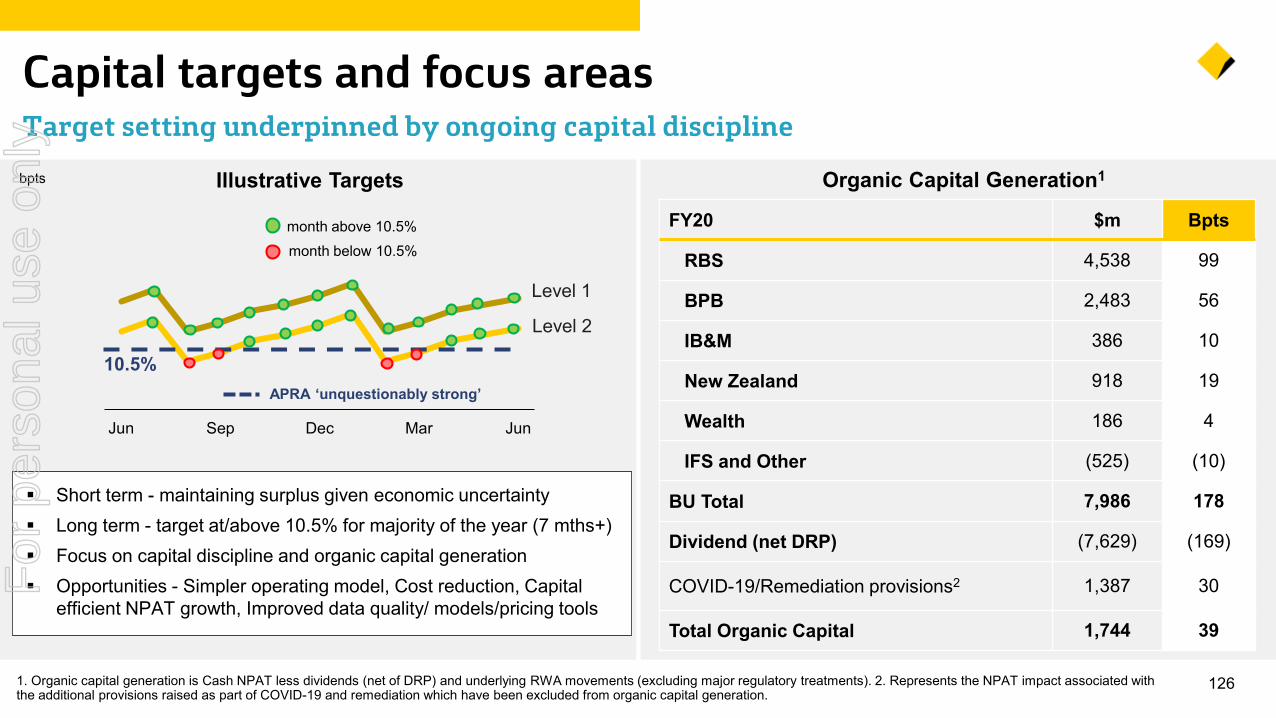
1261. Organic capital generation is Cash NPAT less dividends (net of DRP) and underlying RWA movements (excluding major regulatory treatments). 2. Represents the NPAT impact associated with the additional provisions raised as part of COVID-19 and remediation which have been excluded from organic capital generation.
Capital targets and focus areas Target setting underpinned by ongoing capital discipline
Organic Capital Generation1
FY20 $m Bpts
RBS 4,538 99
BPB 2,483 56
IB&M 386 10
New Zealand 918 19
Wealth 186 4
IFS and Other (525) (10)
BU Total 7,986 178
Dividend (net DRP) (7,629) (169)
COVID-19/Remediation provisions2 1,387 30
Total Organic Capital 1,744 39
bpts
10.5%
Level 2
Jun Sep Dec Mar Jun
Level 1
Illustrative Targets
APRA ‘unquestionably strong’
month above 10.5%month below 10.5%
Short term - maintaining surplus given economic uncertainty Long term - target at/above 10.5% for majority of the year (7 mths+) Focus on capital discipline and organic capital generation Opportunities - Simpler operating model, Cost reduction, Capital
efficient NPAT growth, Improved data quality/ models/pricing tools
For
per
sona
l use
onl
y
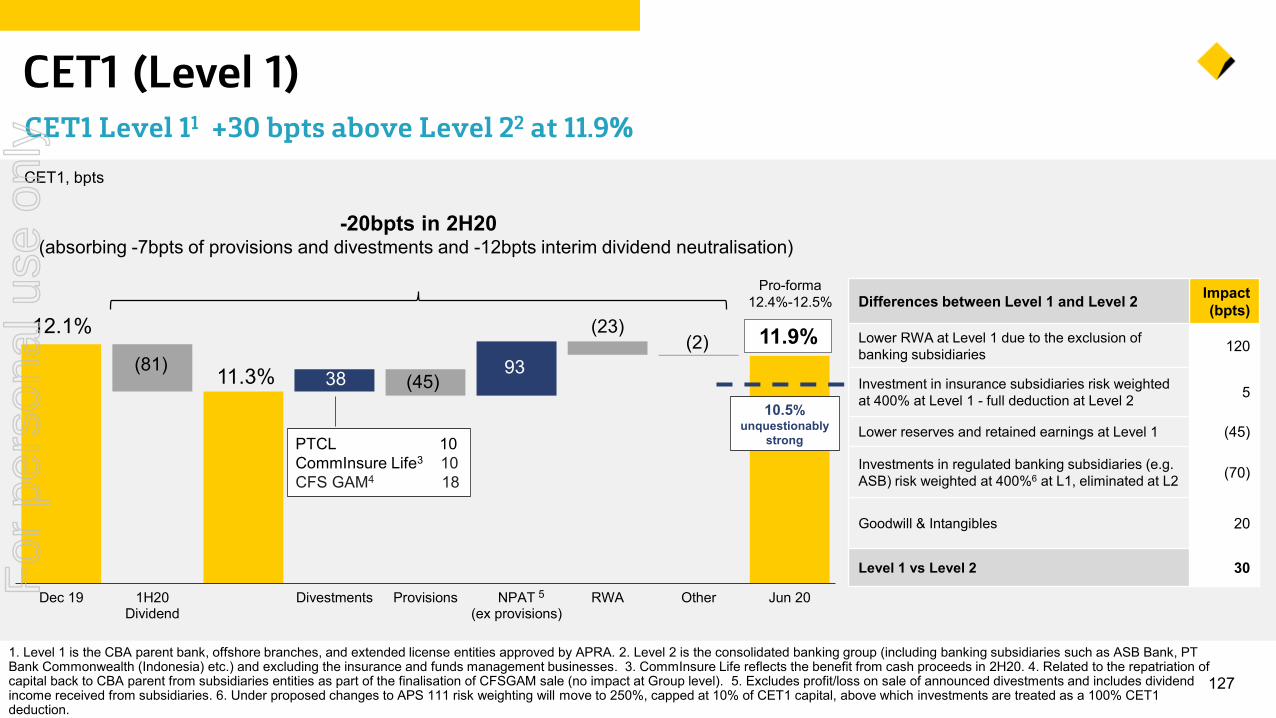
Differences between Level 1 and Level 2 Impact (bpts)
Lower RWA at Level 1 due to the exclusion of banking subsidiaries 120
Investment in insurance subsidiaries risk weighted at 400% at Level 1 - full deduction at Level 2 5
Lower reserves and retained earnings at Level 1 (45)
Investments in regulated banking subsidiaries (e.g. ASB) risk weighted at 400%6 at L1, eliminated at L2 (70)
Goodwill & Intangibles 20
Level 1 vs Level 2 30
38 93(81)(45)
(23)(2)
12.1%
11.3%
11.9%
Dec 19 1H20Dividend
Divestments Provisions NPAT(ex provisions)
RWA Other Jun 20
127
1. Level 1 is the CBA parent bank, offshore branches, and extended license entities approved by APRA. 2. Level 2 is the consolidated banking group (including banking subsidiaries such as ASB Bank, PT Bank Commonwealth (Indonesia) etc.) and excluding the insurance and funds management businesses. 3. CommInsure Life reflects the benefit from cash proceeds in 2H20. 4. Related to the repatriation of capital back to CBA parent from subsidiaries entities as part of the finalisation of CFSGAM sale (no impact at Group level). 5. Excludes profit/loss on sale of announced divestments and includes dividend income received from subsidiaries. 6. Under proposed changes to APS 111 risk weighting will move to 250%, capped at 10% of CET1 capital, above which investments are treated as a 100% CET1 deduction.
CET1 (Level 1)CET1 Level 11 +30 bpts above Level 22 at 11.9% CET1, bpts
10.5% unquestionably
strongPTCL 10CommInsure Life3 10CFS GAM4 18
5
Pro-forma 12.4%-12.5%
-20bpts in 2H20(absorbing -7bpts of provisions and divestments and -12bpts interim dividend neutralisation)
For
per
sona
l use
onl
y
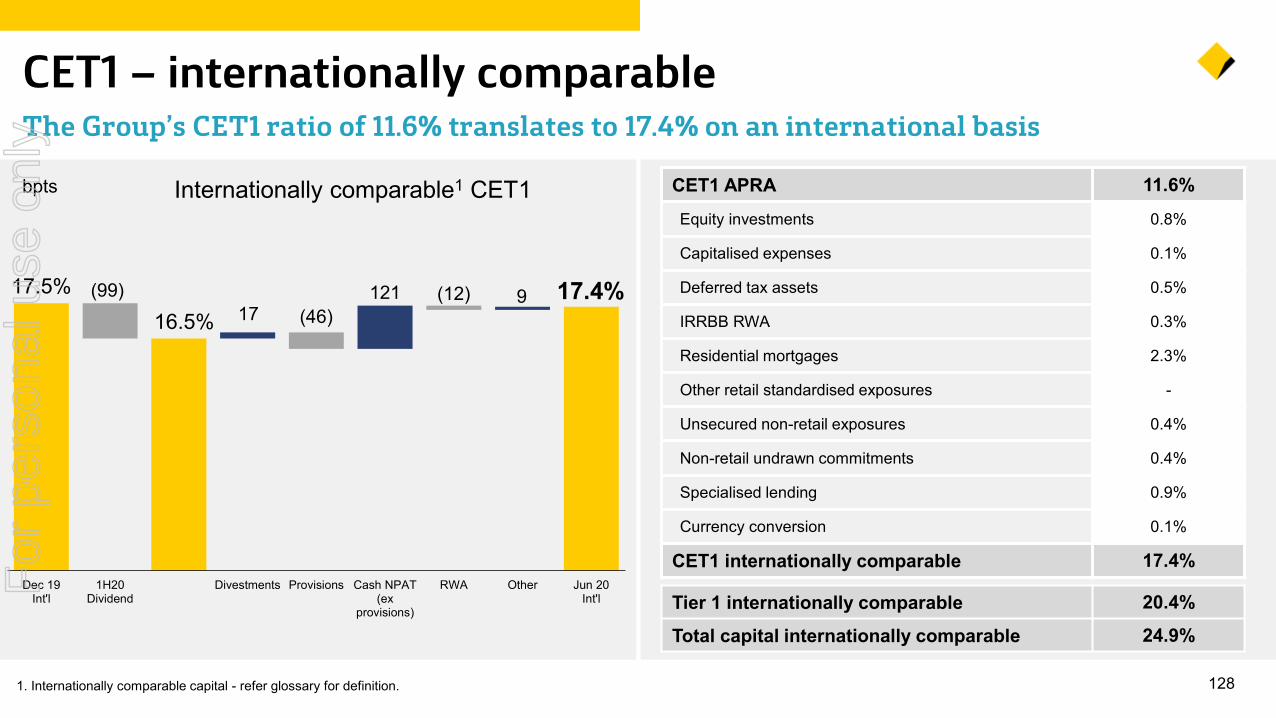
1281. Internationally comparable capital - refer glossary for definition.
CET1 – internationally comparable The Group’s CET1 ratio of 11.6% translates to 17.4% on an international basis
Internationally comparable1 CET1bpts CET1 APRA 11.6%Equity investments 0.8%
Capitalised expenses 0.1%
Deferred tax assets 0.5%
IRRBB RWA 0.3%
Residential mortgages 2.3%
Other retail standardised exposures -
Unsecured non-retail exposures 0.4%
Non-retail undrawn commitments 0.4%
Specialised lending 0.9%
Currency conversion 0.1%
CET1 internationally comparable 17.4%
Tier 1 internationally comparable 20.4%
Total capital internationally comparable 24.9%
17121 9(99)
(46)(12)17.5%
16.5%17.4%
Dec 19Int'l
1H20Dividend
Divestments Provisions Cash NPAT(ex
provisions)
RWA Other Jun 20Int'lF
or p
erso
nal u
se o
nly
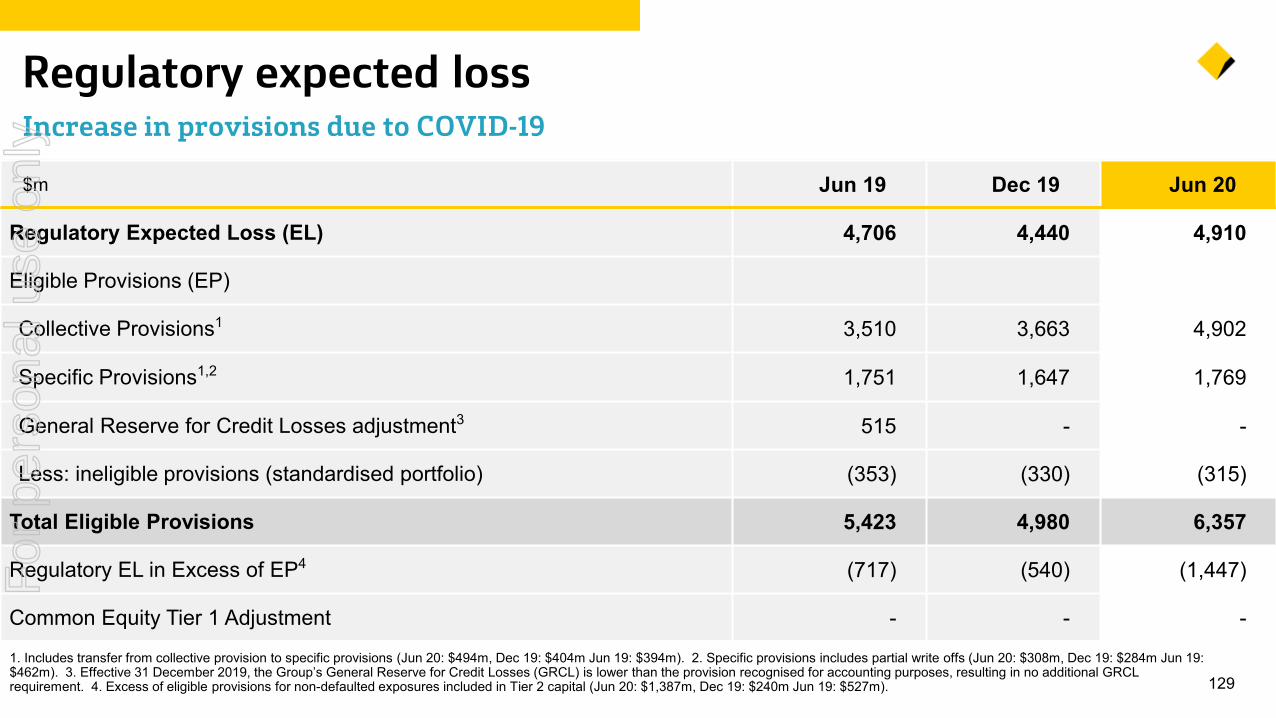
1291. Includes transfer from collective provision to specific provisions (Jun 20: $494m, Dec 19: $404m Jun 19: $394m). 2. Specific provisions includes partial write offs (Jun 20: $308m, Dec 19: $284m Jun 19: $462m). 3. Effective 31 December 2019, the Group’s General Reserve for Credit Losses (GRCL) is lower than the provision recognised for accounting purposes, resulting in no additional GRCL requirement. 4. Excess of eligible provisions for non-defaulted exposures included in Tier 2 capital (Jun 20: $1,387m, Dec 19: $240m Jun 19: $527m).
Regulatory expected loss Increase in provisions due to COVID-19
$m Jun 19 Dec 19 Jun 20
Regulatory Expected Loss (EL) 4,706 4,440 4,910
Eligible Provisions (EP)
Collective Provisions1 3,510 3,663 4,902
Specific Provisions1,2 1,751 1,647 1,769
General Reserve for Credit Losses adjustment3 515 - -
Less: ineligible provisions (standardised portfolio) (353) (330) (315)
Total Eligible Provisions 5,423 4,980 6,357
Regulatory EL in Excess of EP4 (717) (540) (1,447)
Common Equity Tier 1 Adjustment - - -
For
per
sona
l use
onl
y
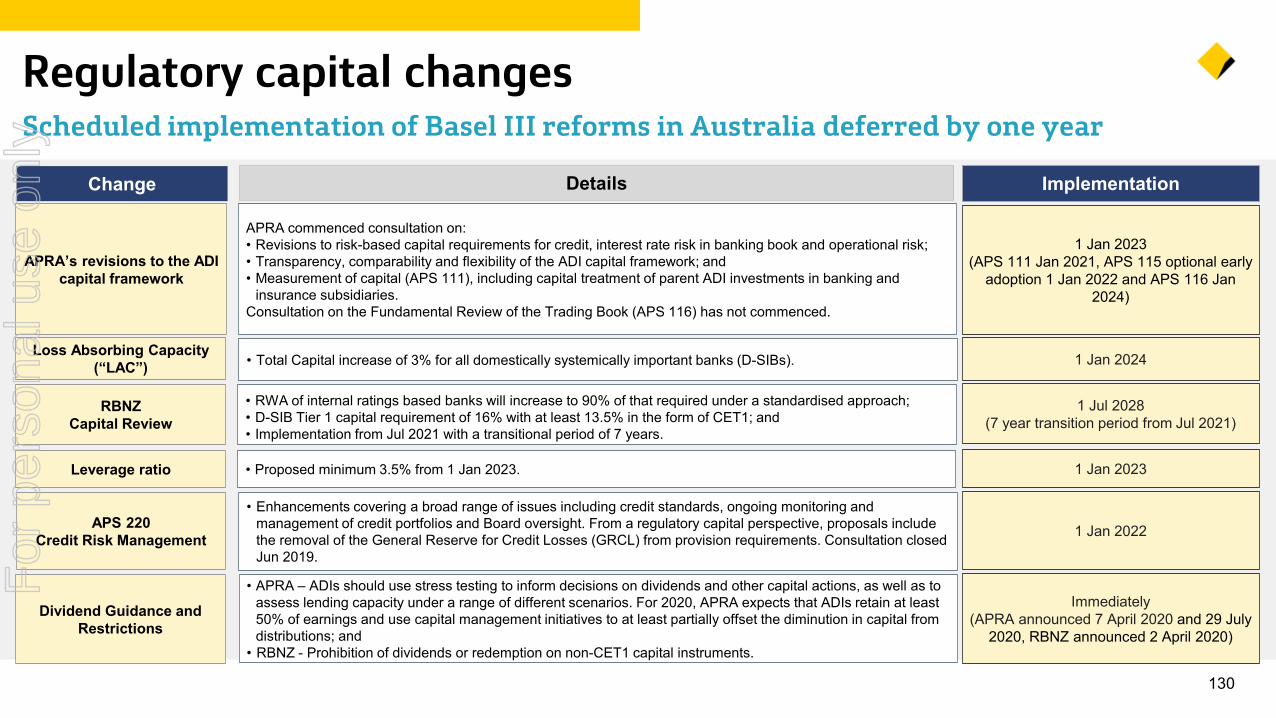
130
Regulatory capital changes
Leverage ratio
Details
1 Jan 2023
1 Jan 2023(APS 111 Jan 2021, APS 115 optional early
adoption 1 Jan 2022 and APS 116 Jan 2024)
APRA commenced consultation on:• Revisions to risk-based capital requirements for credit, interest rate risk in banking book and operational risk;• Transparency, comparability and flexibility of the ADI capital framework; and• Measurement of capital (APS 111), including capital treatment of parent ADI investments in banking and
insurance subsidiaries.Consultation on the Fundamental Review of the Trading Book (APS 116) has not commenced.
APRA’s revisions to the ADI capital framework
Loss Absorbing Capacity (“LAC”) 1 Jan 2024• Total Capital increase of 3% for all domestically systemically important banks (D-SIBs).
• Proposed minimum 3.5% from 1 Jan 2023.
RBNZ Capital Review
• RWA of internal ratings based banks will increase to 90% of that required under a standardised approach;• D-SIB Tier 1 capital requirement of 16% with at least 13.5% in the form of CET1; and • Implementation from Jul 2021 with a transitional period of 7 years.
APS 220 Credit Risk Management 1 Jan 2022
• Enhancements covering a broad range of issues including credit standards, ongoing monitoring and management of credit portfolios and Board oversight. From a regulatory capital perspective, proposals include the removal of the General Reserve for Credit Losses (GRCL) from provision requirements. Consultation closed Jun 2019.
1 Jul 2028(7 year transition period from Jul 2021)
ImplementationChange
Dividend Guidance and Restrictions
Immediately (APRA announced 7 April 2020 and 29 July
2020, RBNZ announced 2 April 2020)
• APRA – ADIs should use stress testing to inform decisions on dividends and other capital actions, as well as to assess lending capacity under a range of different scenarios. For 2020, APRA expects that ADIs retain at least 50% of earnings and use capital management initiatives to at least partially offset the diminution in capital from distributions; and
• RBNZ - Prohibition of dividends or redemption on non-CET1 capital instruments.
Scheduled implementation of Basel III reforms in Australia deferred by one year
For
per
sona
l use
onl
y
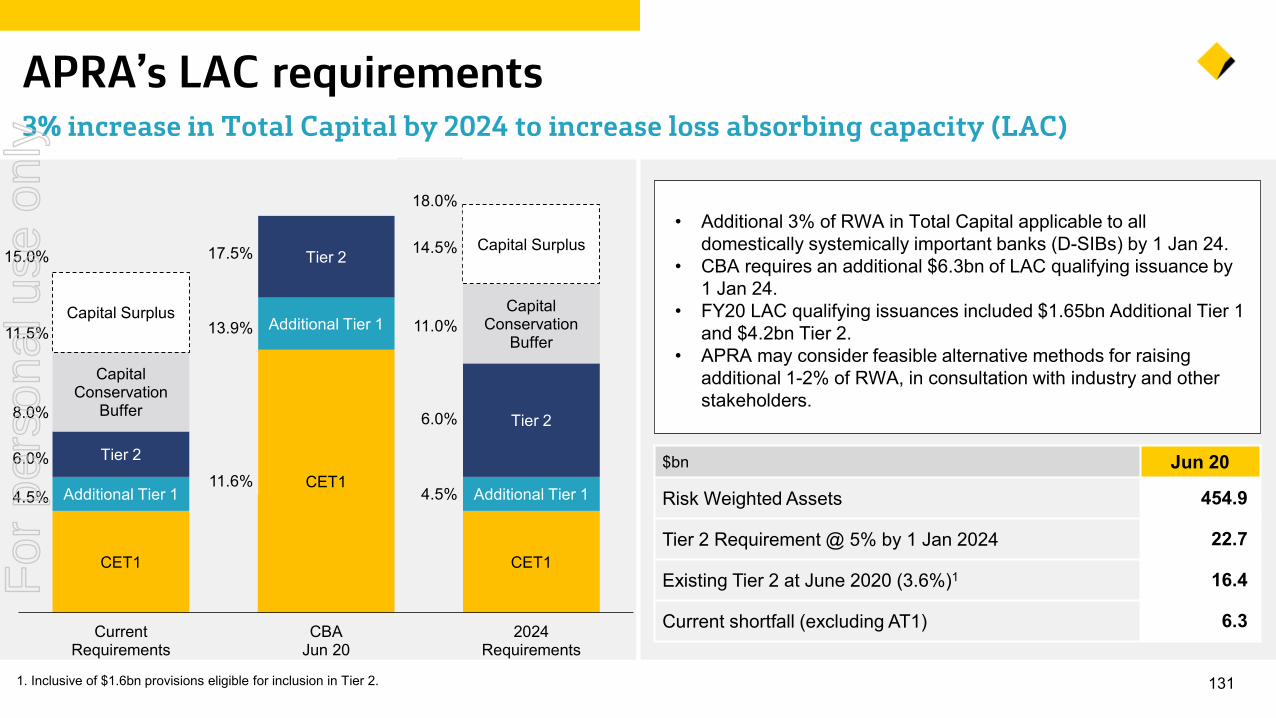
1311. Inclusive of $1.6bn provisions eligible for inclusion in Tier 2.
APRA’s LAC requirements 3% increase in Total Capital by 2024 to increase loss absorbing capacity (LAC)
CET1
CET1
CET1
Additional Tier 1
Additional Tier 1
Additional Tier 1
Tier 2
Tier 2
Tier 2
CapitalConservation
Buffer
CapitalConservation
Buffer
Capital Surplus
Capital Surplus
CurrentRequirements
CBAJun 20
2024Requirements
$bn Jun 20
Risk Weighted Assets 454.9
Tier 2 Requirement @ 5% by 1 Jan 2024 22.7
Existing Tier 2 at June 2020 (3.6%)1 16.4
Current shortfall (excluding AT1) 6.3
• Additional 3% of RWA in Total Capital applicable to all domestically systemically important banks (D-SIBs) by 1 Jan 24.
• CBA requires an additional $6.3bn of LAC qualifying issuance by 1 Jan 24.
• FY20 LAC qualifying issuances included $1.65bn Additional Tier 1 and $4.2bn Tier 2.
• APRA may consider feasible alternative methods for raising additional 1-2% of RWA, in consultation with industry and other stakeholders.
15.0%
11.5%
8.0%
6.0%
4.5%
18.0%
14.5%
11.0%
6.0%
4.5%
17.5%
13.9%
11.6%
For
per
sona
l use
onl
y
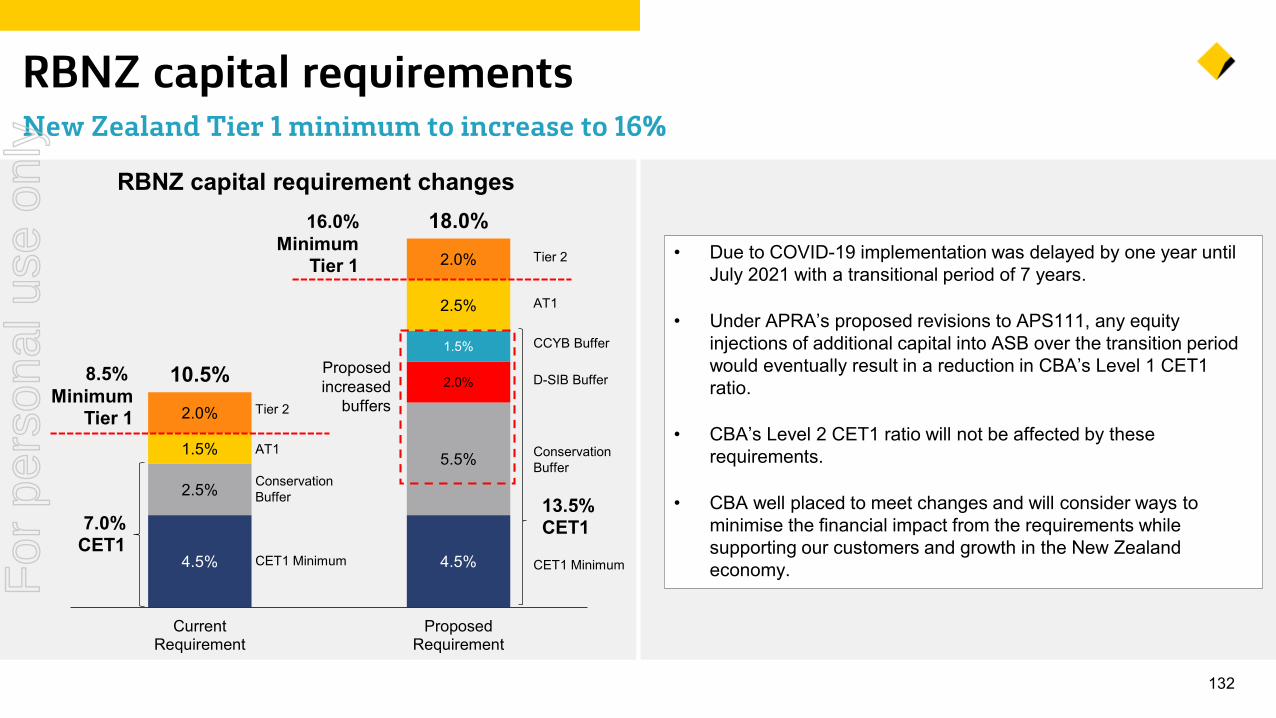
132
RBNZ capital requirements New Zealand Tier 1 minimum to increase to 16%
• Due to COVID-19 implementation was delayed by one year until July 2021 with a transitional period of 7 years.
• Under APRA’s proposed revisions to APS111, any equity injections of additional capital into ASB over the transition period would eventually result in a reduction in CBA’s Level 1 CET1 ratio.
• CBA’s Level 2 CET1 ratio will not be affected by these requirements.
• CBA well placed to meet changes and will consider ways to minimise the financial impact from the requirements while supporting our customers and growth in the New Zealand economy.4.5% 4.5%
2.5%
5.5%
2.0%
1.5%
1.5%
2.5%
2.0%
2.0%
10.5%
18.0%
CurrentRequirement
ProposedRequirement
Tier 2
AT1
CCYB Buffer
D-SIB Buffer
Conservation Buffer
CET1 Minimum
16.0% Minimum
Tier 1
Proposed increased
buffers
RBNZ capital requirement changes
Tier 2
AT1
Conservation Buffer
CET1 Minimum
8.5% Minimum
Tier 1
7.0%CET1
13.5%CET1
For
per
sona
l use
onl
y
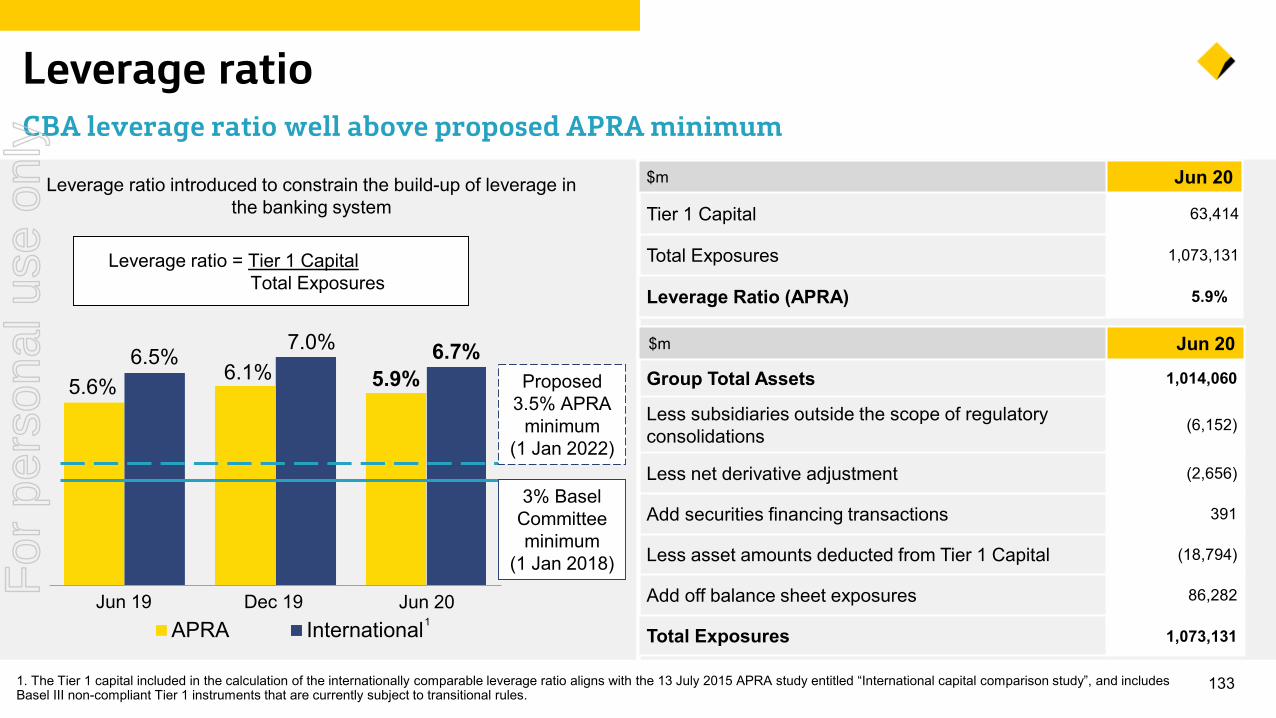
1331. The Tier 1 capital included in the calculation of the internationally comparable leverage ratio aligns with the 13 July 2015 APRA study entitled “International capital comparison study”, and includes Basel III non-compliant Tier 1 instruments that are currently subject to transitional rules.
Leverage ratioCBA leverage ratio well above proposed APRA minimum
$m Jun 20
Group Total Assets 1,014,060
Less subsidiaries outside the scope of regulatory consolidations (6,152)
Less net derivative adjustment (2,656)
Add securities financing transactions 391
Less asset amounts deducted from Tier 1 Capital (18,794)
Add off balance sheet exposures 86,282
Total Exposures 1,073,131
$m Jun 20
Tier 1 Capital 63,414
Total Exposures 1,073,131
Leverage Ratio (APRA) 5.9%
5.6%6.1% 5.9%
6.5%7.0% 6.7%
APRA International
Leverage ratio = Tier 1 CapitalTotal Exposures
Leverage ratio introduced to constrain the build-up of leverage in the banking system
Jun 20Jun 19
3% Basel Committee minimum
(1 Jan 2018)
Dec 19
Proposed 3.5% APRA
minimum(1 Jan 2022)
1
For
per
sona
l use
onl
y

134
Economic Overview CBA Chief Economist
For
per
sona
l use
onl
y
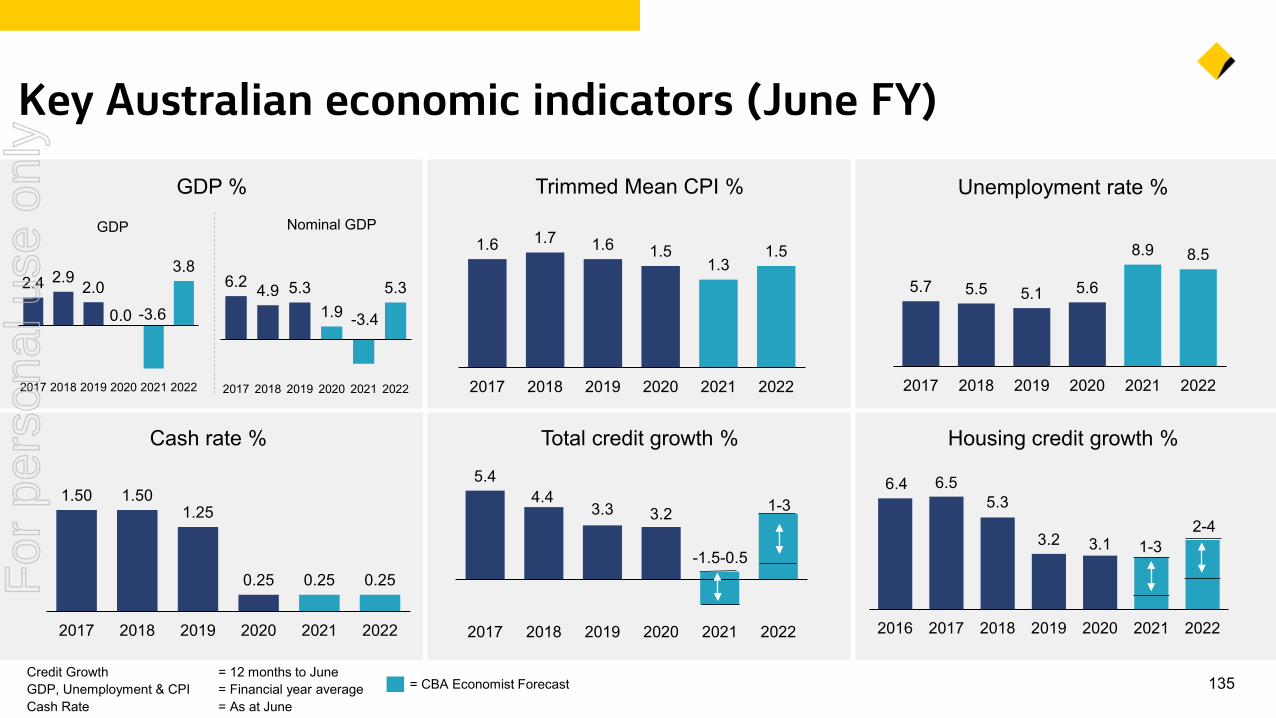
5.44.4
3.3 3.2
2017 2018 2019 2020 2021 2022
135
Key Australian economic indicators (June FY)
Credit Growth = 12 months to June GDP, Unemployment & CPI = Financial year averageCash Rate = As at June
= CBA Economist Forecast
2.4 2.9 2.0
0.0 -3.6
3.8
2017 2018 2019 2020 2021 2022
GDP % Trimmed Mean CPI % Unemployment rate %
Cash rate % Total credit growth % Housing credit growth %
1.6 1.7 1.6 1.51.3
1.5
2017 2018 2019 2020 2021 2022
5.7 5.5 5.1 5.6
8.9 8.5
2017 2018 2019 2020 2021 2022
1.50 1.501.25
0.25 0.25 0.25
2017 2018 2019 2020 2021 2022
1-36.4 6.5
5.3
3.2 3.1
2016 2017 2018 2019 2020 2021 2022
6.2 4.9 5.31.9 -3.4
5.3
2017 2018 2019 2020 2021 2022
Nominal GDPGDP
-1.5-0.51-3
2-4
For
per
sona
l use
onl
y
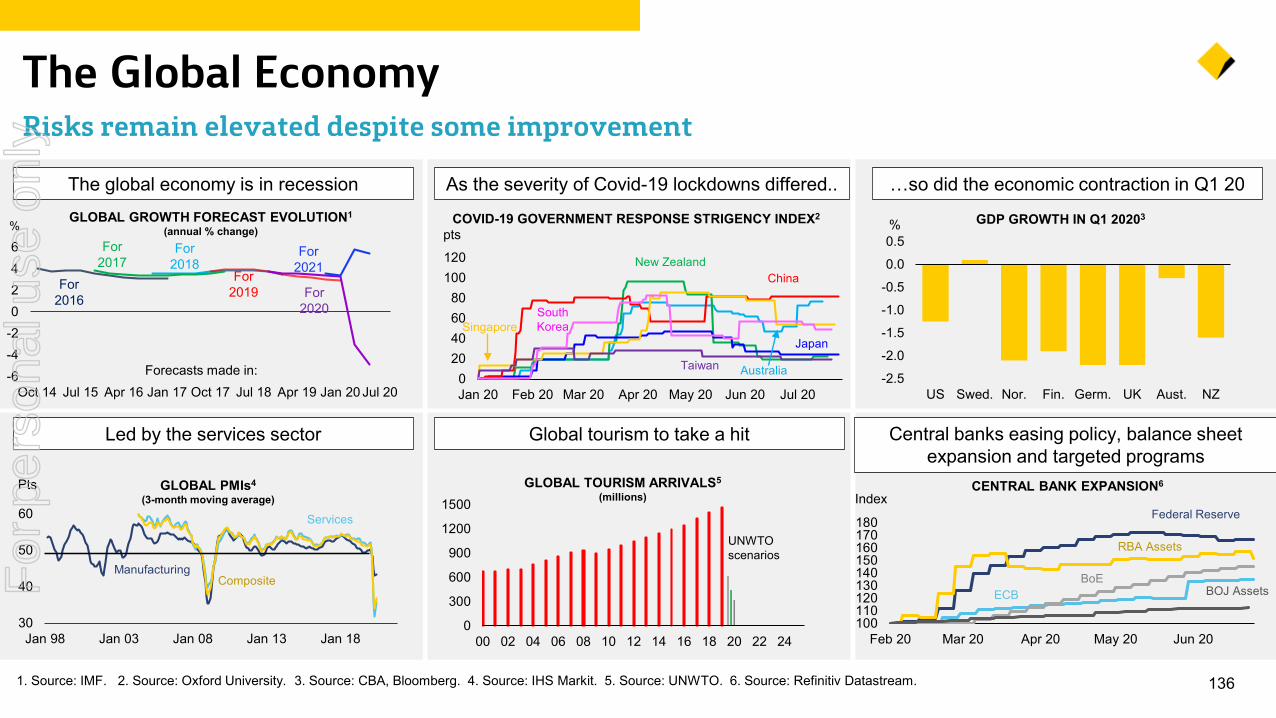
1361. Source: IMF. 2. Source: Oxford University. 3. Source: CBA, Bloomberg. 4. Source: IHS Markit. 5. Source: UNWTO. 6. Source: Refinitiv Datastream.
The Global Economy Risks remain elevated despite some improvement
The global economy is in recession As the severity of Covid-19 lockdowns differed.. …so did the economic contraction in Q1 20
Central banks easing policy, balance sheet expansion and targeted programs
Global tourism to take a hitLed by the services sector
-6-4-20246
Oct 14 Jul 15 Apr 16 Jan 17 Oct 17 Jul 18 Apr 19 Jan 20
%
For 2016
GLOBAL GROWTH FORECAST EVOLUTION1
(annual % change)For
2017For
2018For
2019 For 2020
For 2021
Forecasts made in: 020406080
100120
Jan 20 Feb 20 Mar 20 Apr 20 May 20 Jun 20 Jul 20
COVID-19 GOVERNMENT RESPONSE STRIGENCY INDEX2
pts
Taiwan
Singapore
Australia
Japan
South Korea
New ZealandChina
-2.5
-2.0
-1.5
-1.0
-0.5
0.0
0.5
US Swed. Nor. Fin. Germ. UK Aust. NZ
GDP GROWTH IN Q1 20203%
30
40
50
60
Jan 98 Jan 03 Jan 08 Jan 13 Jan 18
GLOBAL PMIs4
(3-month moving average)
Services
ManufacturingComposite
Pts
0
300
600
900
1200
1500
00 02 04 06 08 10 12 14 16 18 20 22 24
GLOBAL TOURISM ARRIVALS5
(millions)
UNWTO scenarios
100110120130140150160170180
Feb 20 Mar 20 Apr 20 May 20 Jun 20
Jul 20
Federal Reserve
ECBBoE
RBA Assets
BOJ Assets
CENTRAL BANK EXPANSION6
Index
For
per
sona
l use
onl
y
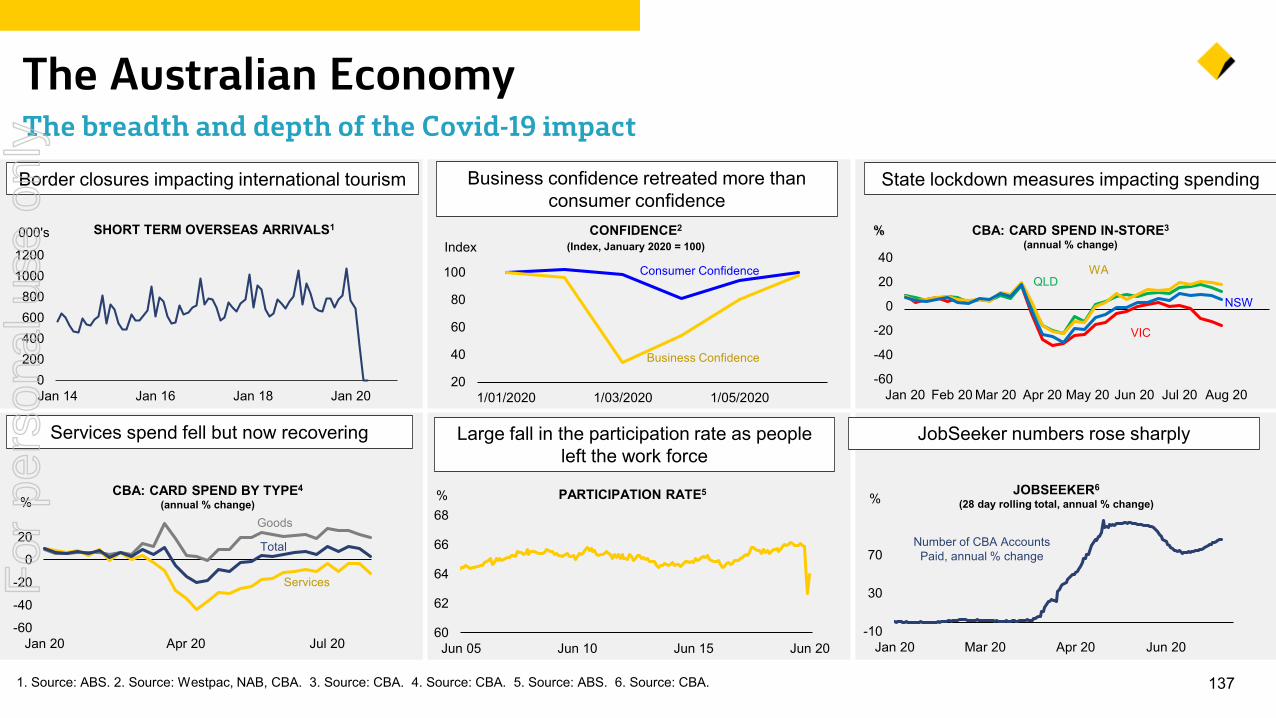
60
62
64
66
68
Jun 05 Jun 10 Jun 15 Jun 20
PARTICIPATION RATE5
1371. Source: ABS. 2. Source: Westpac, NAB, CBA. 3. Source: CBA. 4. Source: CBA. 5. Source: ABS. 6. Source: CBA.
The Australian Economy The breadth and depth of the Covid-19 impact
Business confidence retreated more than consumer confidence
State lockdown measures impacting spendingBorder closures impacting international tourism
JobSeeker numbers rose sharplyServices spend fell but now recovering Large fall in the participation rate as people left the work force
0200400600800
10001200
Jan 14 Jan 16 Jan 18 Jan 20
000's SHORT TERM OVERSEAS ARRIVALS1
20
40
60
80
100
1/01/2020 1/03/2020 1/05/2020
CONFIDENCE2
(Index, January 2020 = 100)
Business Confidence
Consumer Confidence
Index
-60
-40
-20
0
20
40
Jan 20 Feb 20 Mar 20 Apr 20 May 20 Jun 20 Jul 20 Aug 20
CBA: CARD SPEND IN-STORE3
(annual % change)%
QLD
NSW
VIC
%
WA
-60
-40
-20
0
20
Jan 20 Apr 20 Jul 20
CBA: CARD SPEND BY TYPE4
(annual % change)%
Services
Goods
Total
-10
30
70
Jan 20 Mar 20 Apr 20 Jun 20
JOBSEEKER6
(28 day rolling total, annual % change)%
Number of CBA Accounts Paid, annual % change
%
For
per
sona
l use
onl
y
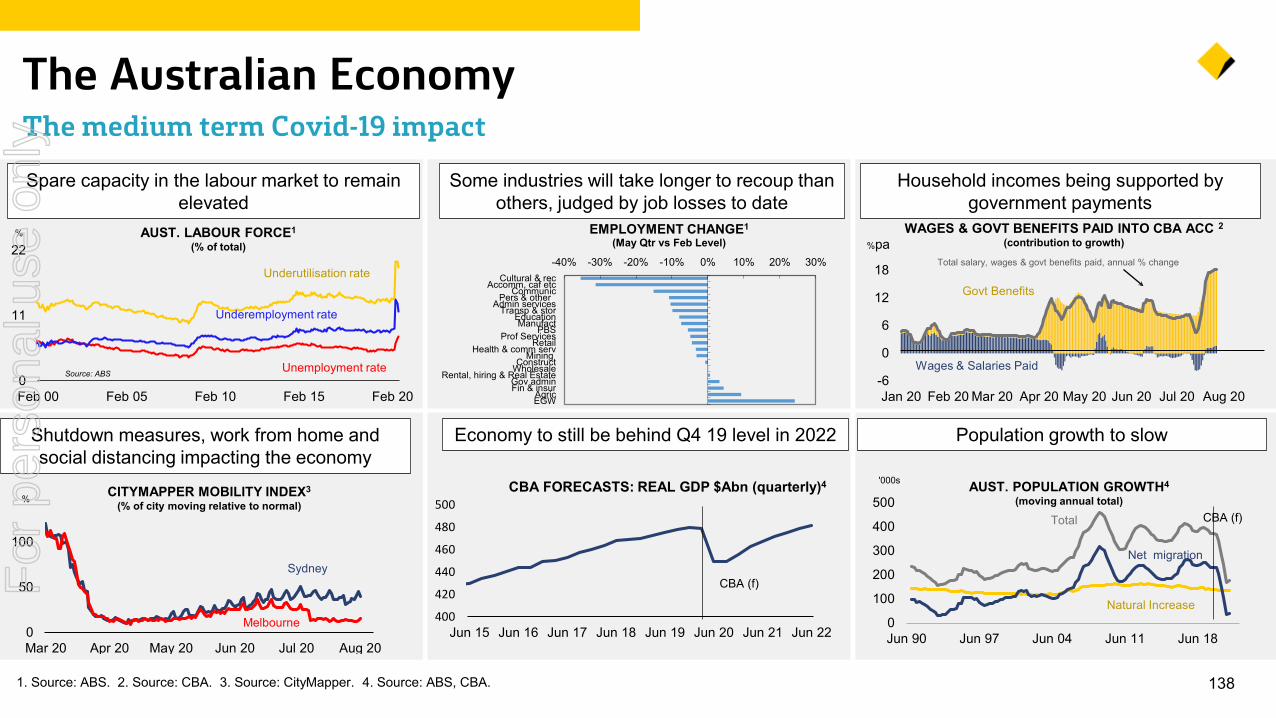
0
11
22
Feb 00 Feb 05 Feb 10 Feb 15 Feb 20
%
Unemployment rate
Underemployment rate
AUST. LABOUR FORCE1
(% of total)
Underutilisation rate
Source: ABS
-40% -30% -20% -10% 0% 10% 20% 30%Cultural & rec
Accomm, caf etcCommunic
Pers & otherAdmin services
Transp & storEducationManufact
PBSProf Services
RetailHealth & comm serv
Mining ConstructWholesale
Rental, hiring & Real EstateGov adminFin & insur
AgricEGW
EMPLOYMENT CHANGE1
(May Qtr vs Feb Level)
%
1381. Source: ABS. 2. Source: CBA. 3. Source: CityMapper. 4. Source: ABS, CBA.
The Australian Economy The medium term Covid-19 impact
Population growth to slow
Spare capacity in the labour market to remain elevated
Economy to still be behind Q4 19 level in 2022Shutdown measures, work from home and social distancing impacting the economy
Some industries will take longer to recoup than others, judged by job losses to date
Household incomes being supported by government payments
400
420
440
460
480
500
Jun 15 Jun 16 Jun 17 Jun 18 Jun 19 Jun 20 Jun 21 Jun 22
CBA FORECASTS: REAL GDP $Abn (quarterly)4
CBA (f)
0
100
200
300
400
500
Jun 90 Jun 97 Jun 04 Jun 11 Jun 18
Net migration
'000s
Natural Increase
Total
AUST. POPULATION GROWTH4
(moving annual total)CBA (f)
-6
0
6
12
18
Jan 20 Feb 20 Mar 20 Apr 20 May 20 Jun 20 Jul 20 Aug 20
Total salary, wages & govt benefits paid, annual % change
WAGES & GOVT BENEFITS PAID INTO CBA ACC 2
(contribution to growth)%pa
Govt Benefits
Wages & Salaries Paid
0
50
100
Mar 20 Apr 20 May 20 Jun 20 Jul 20 Aug 20
CITYMAPPER MOBILITY INDEX3
(% of city moving relative to normal)%
Sydney
Melbourne
For
per
sona
l use
onl
y
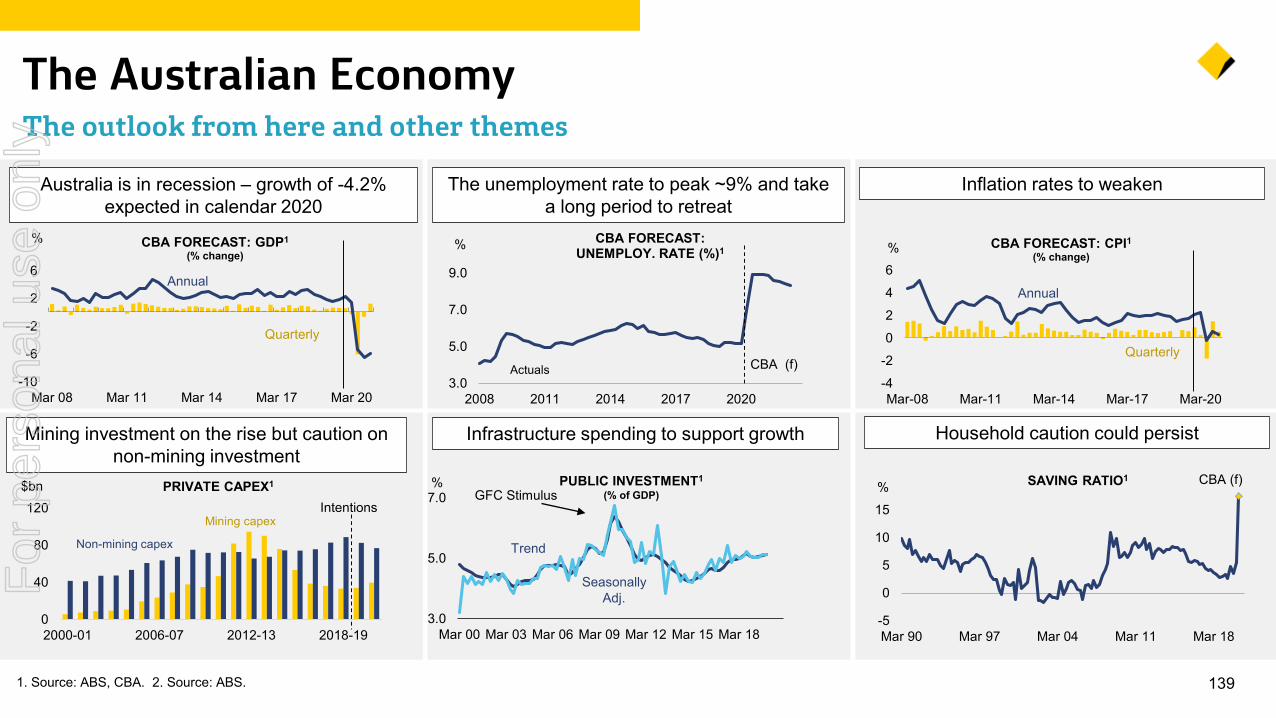
1391. Source: ABS, CBA. 2. Source: ABS.
The Australian Economy The outlook from here and other themes
Australia is in recession – growth of -4.2% expected in calendar 2020
The unemployment rate to peak ~9% and take a long period to retreat
Inflation rates to weaken
Mining investment on the rise but caution on non-mining investment
Infrastructure spending to support growth Household caution could persist
0
40
80
120
2000-01 2006-07 2012-13 2018-19
PRIVATE CAPEX1$bnIntentions
3.0
5.0
7.0
Mar 00 Mar 03 Mar 06 Mar 09 Mar 12 Mar 15 Mar 18
% PUBLIC INVESTMENT1
(% of GDP)
Trend
SeasonallyAdj.
GFC Stimulus
-5
0
5
10
15
Mar 90 Mar 97 Mar 04 Mar 11 Mar 18
SAVING RATIO1% CBA (f)
-10
-6
-2
2
6
Mar 08 Mar 11 Mar 14 Mar 17 Mar 20
CBA FORECAST: GDP1
(% change)%
Annual
Quarterly
3.0
5.0
7.0
9.0
2008 2011 2014 2017 2020
CBA FORECAST: UNEMPLOY. RATE (%)1%
Actuals CBA (f)-4
-2
0
2
4
6
Mar-08 Mar-11 Mar-14 Mar-17 Mar-20
CBA FORECAST: CPI1(% change)
%
Annual
Quarterly
Mining capex
Non-mining capex
For
per
sona
l use
onl
y
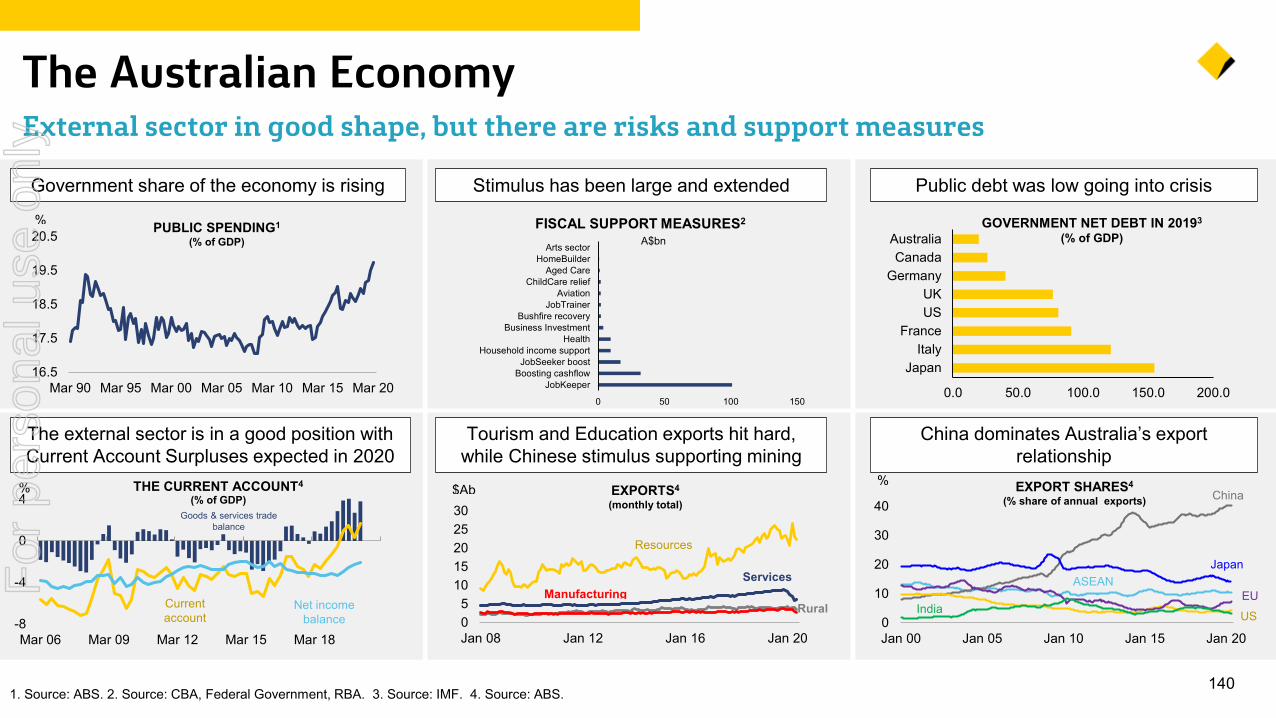
1401. Source: ABS. 2. Source: CBA, Federal Government, RBA. 3. Source: IMF. 4. Source: ABS.
The Australian Economy External sector in good shape, but there are risks and support measures
The external sector is in a good position with Current Account Surpluses expected in 2020
Government share of the economy is rising Public debt was low going into crisisStimulus has been large and extended
0.0 50.0 100.0 150.0 200.0
JapanItaly
FranceUSUK
GermanyCanada
AustraliaGOVERNMENT NET DEBT IN 20193
(% of GDP)
China dominates Australia’s export relationship
Tourism and Education exports hit hard, while Chinese stimulus supporting mining
16.5
17.5
18.5
19.5
20.5
Mar 90 Mar 95 Mar 00 Mar 05 Mar 10 Mar 15 Mar 20
PUBLIC SPENDING1
(% of GDP)
%
0 50 100 150
JobKeeperBoosting cashflow
JobSeeker boostHousehold income support
HealthBusiness Investment
Bushfire recoveryJobTrainer
AviationChildCare relief
Aged CareHomeBuilder
Arts sector
FISCAL SUPPORT MEASURES2
-8
-4
0
4
Mar 06 Mar 09 Mar 12 Mar 15 Mar 18
THE CURRENT ACCOUNT4
(% of GDP)%
Goods & services tradebalance
Currentaccount
Net incomebalance 0
51015202530
Jan 08 Jan 12 Jan 16 Jan 20
EXPORTS4
(monthly total)$Ab
ServicesManufacturing
Rural
Resources
0
10
20
30
40
Jan 00 Jan 05 Jan 10 Jan 15 Jan 20
EXPORT SHARES4
(% share of annual exports)
%
Japan
China
ASEAN
USEU
India
A$bn
For
per
sona
l use
onl
y
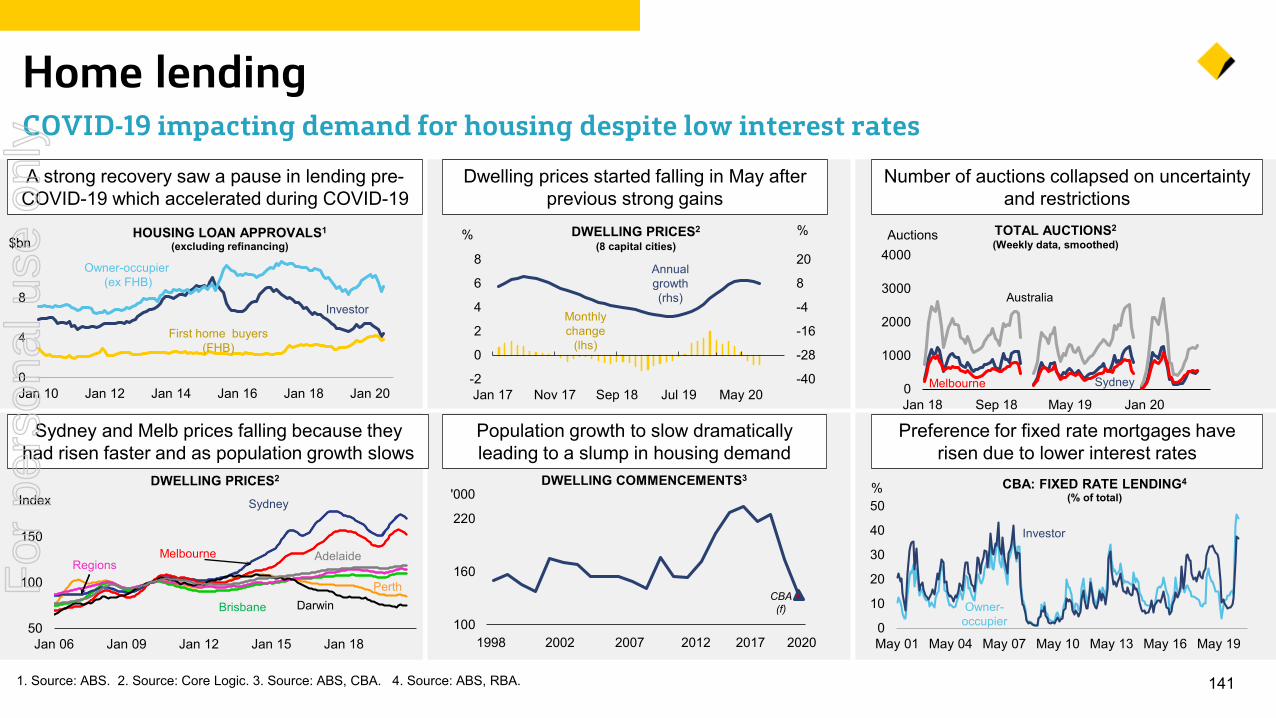
1411. Source: ABS. 2. Source: Core Logic. 3. Source: ABS, CBA. 4. Source: ABS, RBA.
Home lending COVID-19 impacting demand for housing despite low interest ratesA strong recovery saw a pause in lending pre-COVID-19 which accelerated during COVID-19
Dwelling prices started falling in May after previous strong gains
Sydney and Melb prices falling because they had risen faster and as population growth slows
Population growth to slow dramatically leading to a slump in housing demand
Number of auctions collapsed on uncertainty and restrictions
Preference for fixed rate mortgages have risen due to lower interest rates
0
1000
2000
3000
4000
Jan 18 Sep 18 May 19 Jan 20
TOTAL AUCTIONS2
(Weekly data, smoothed)Auctions
Melbourne Sydney
Australia
100
160
220
1.00 5.00 9.00 13.00 17.00 21.00
'000DWELLING COMMENCEMENTS3
CBA(f)
0
10
20
30
40
50
May 01 May 04 May 07 May 10 May 13 May 16 May 19
CBA: FIXED RATE LENDING4
(% of total)%
Investor
Owner-occupier
0
4
8
Jan 10 Jan 12 Jan 14 Jan 16 Jan 18 Jan 20
HOUSING LOAN APPROVALS1
(excluding refinancing)$bn
Owner-occupier (ex FHB)
First home buyers(FHB)
Investor
-40
-28
-16
-4
8
20
-2
0
2
4
6
8
Jan 17 Nov 17 Sep 18 Jul 19 May 20
DWELLING PRICES2
(8 capital cities)%%
Annualgrowth(rhs)
Monthlychange
(lhs)
50
100
150
Jan 06 Jan 09 Jan 12 Jan 15 Jan 18
DWELLING PRICES2
Sydney
Brisbane
Index
Melbourne
Perth
AdelaideRegions
Darwin
1998 2002 2007 2012 2017 2020
For
per
sona
l use
onl
y
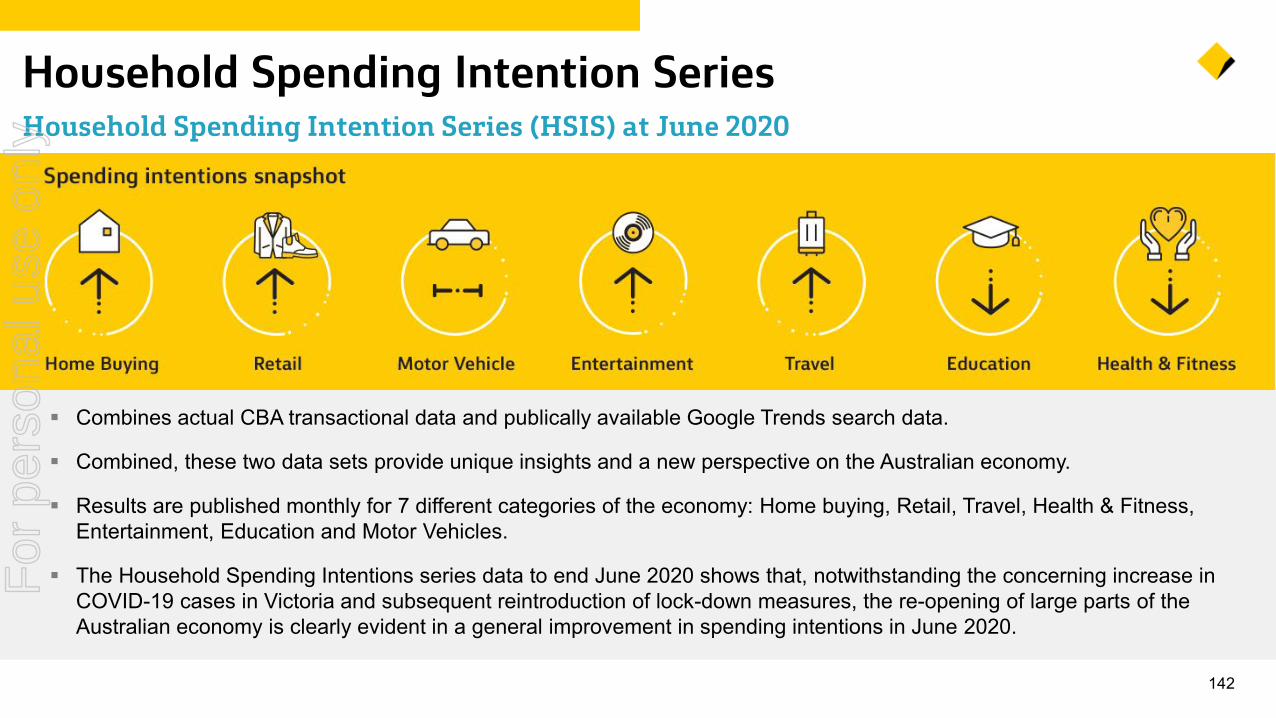
142
Household Spending Intention Series Household Spending Intention Series (HSIS) at June 2020
Combines actual CBA transactional data and publically available Google Trends search data.
Combined, these two data sets provide unique insights and a new perspective on the Australian economy.
Results are published monthly for 7 different categories of the economy: Home buying, Retail, Travel, Health & Fitness, Entertainment, Education and Motor Vehicles.
The Household Spending Intentions series data to end June 2020 shows that, notwithstanding the concerning increase in COVID-19 cases in Victoria and subsequent reintroduction of lock-down measures, the re-opening of large parts of the Australian economy is clearly evident in a general improvement in spending intentions in June 2020.
For
per
sona
l use
onl
y
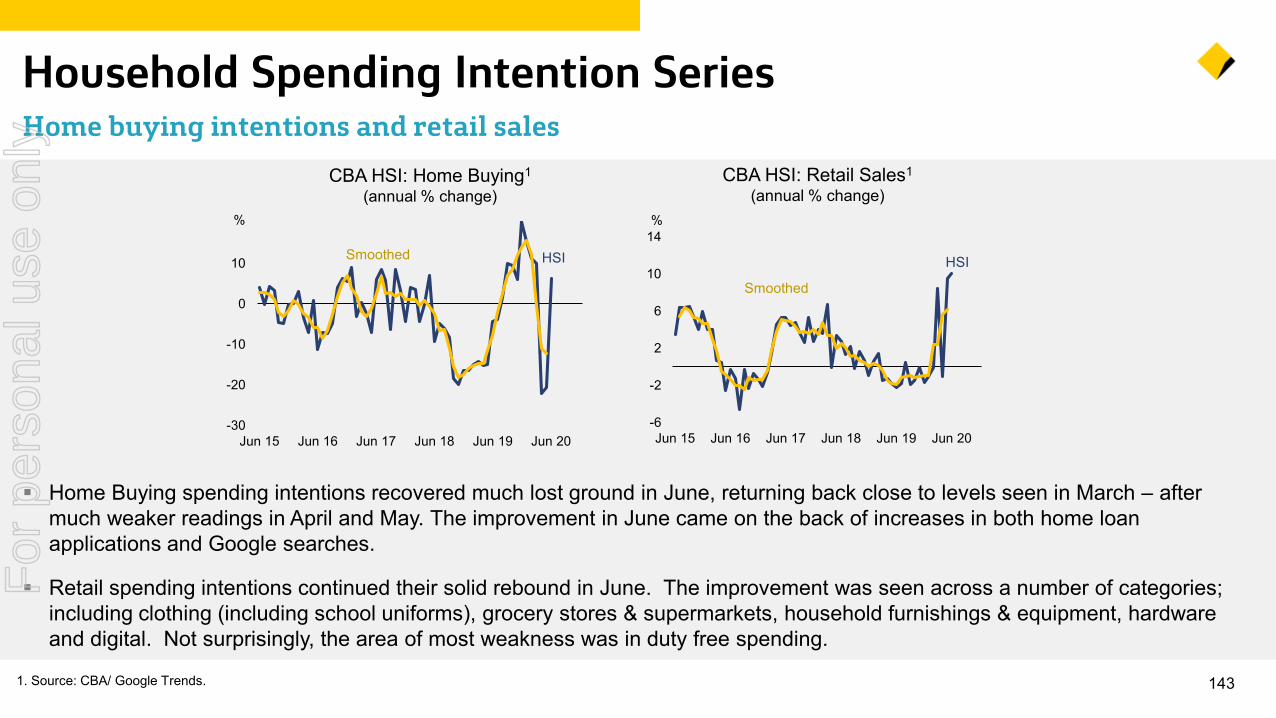
-6
-2
2
6
10
14
Jun 15 Jun 16 Jun 17 Jun 18 Jun 19 Jun 20
%
Smoothed
1431. Source: CBA/ Google Trends.
Household Spending Intention Series Home buying intentions and retail sales
Home Buying spending intentions recovered much lost ground in June, returning back close to levels seen in March – after much weaker readings in April and May. The improvement in June came on the back of increases in both home loan applications and Google searches.
Retail spending intentions continued their solid rebound in June. The improvement was seen across a number of categories; including clothing (including school uniforms), grocery stores & supermarkets, household furnishings & equipment, hardware and digital. Not surprisingly, the area of most weakness was in duty free spending.
CBA HSI: Home Buying1
(annual % change) CBA HSI: Retail Sales1
(annual % change)
-30
-20
-10
0
10
Jun 15 Jun 16 Jun 17 Jun 18 Jun 19 Jun 20
%
HSISmoothed HSI
For
per
sona
l use
onl
y
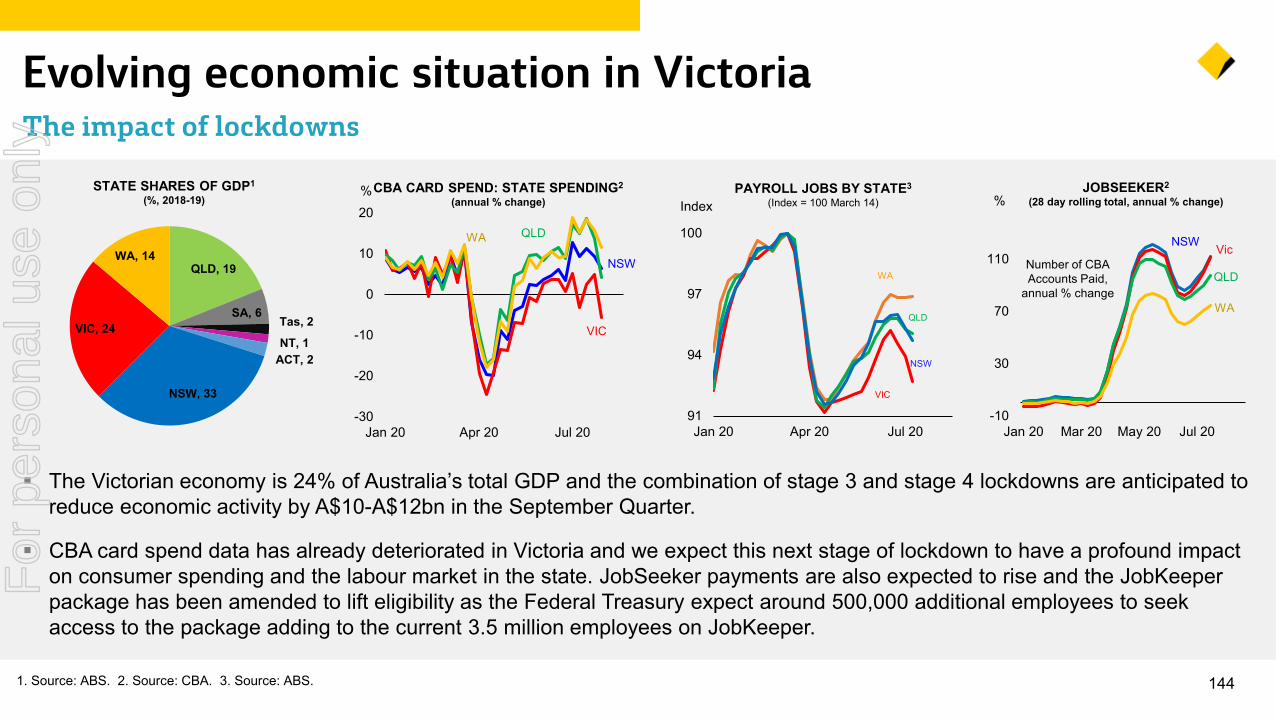
1441. Source: ABS. 2. Source: CBA. 3. Source: ABS.
Evolving economic situation in VictoriaThe impact of lockdowns
The Victorian economy is 24% of Australia’s total GDP and the combination of stage 3 and stage 4 lockdowns are anticipated to reduce economic activity by A$10-A$12bn in the September Quarter.
CBA card spend data has already deteriorated in Victoria and we expect this next stage of lockdown to have a profound impact on consumer spending and the labour market in the state. JobSeeker payments are also expected to rise and the JobKeeperpackage has been amended to lift eligibility as the Federal Treasury expect around 500,000 additional employees to seek access to the package adding to the current 3.5 million employees on JobKeeper.
QLD, 19
SA, 6Tas, 2NT, 1
ACT, 2
NSW, 33
VIC, 24
WA, 14
STATE SHARES OF GDP1
(%, 2018-19)
-30
-20
-10
0
10
20
Jan 20 Apr 20 Jul 20
CBA CARD SPEND: STATE SPENDING2
(annual % change)%
QLD
NSW
VIC
WA
91
94
97
100
Jan 20 Apr 20 Jul 20
NSW
QLD
VIC
WA
PAYROLL JOBS BY STATE3
(Index = 100 March 14)Index
-10
30
70
110
Jan 20 Mar 20 May 20 Jul 20
JOBSEEKER2
(28 day rolling total, annual % change)%
Number of CBA Accounts Paid,
annual % change
NSW Vic
WA
QLD
For
per
sona
l use
onl
y
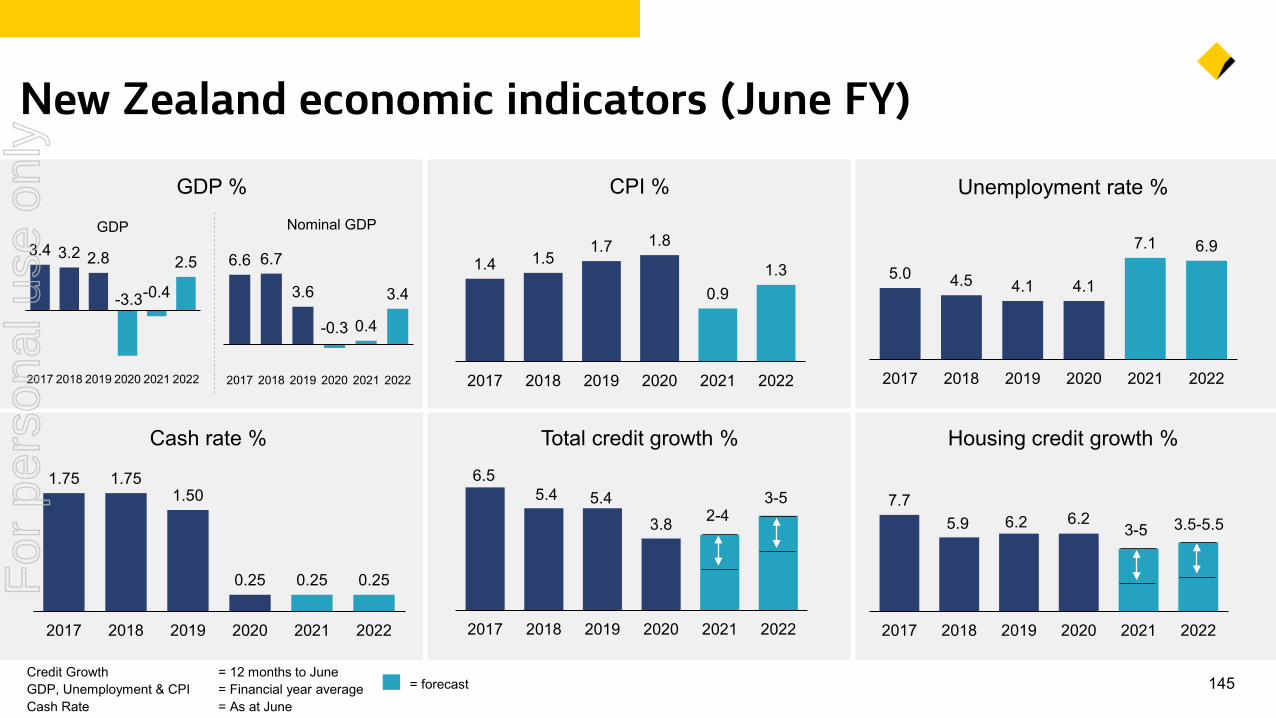
7.75.9 6.2 6.2
2017 2018 2019 2020 2021 2022
145
New Zealand economic indicators (June FY)
Credit Growth = 12 months to June GDP, Unemployment & CPI = Financial year averageCash Rate = As at June
= forecast
GDP % CPI % Unemployment rate %
Cash rate % Total credit growth % Housing credit growth %
1.4 1.51.7 1.8
0.91.3
2017 2018 2019 2020 2021 2022
5.0 4.5 4.1 4.1
7.1 6.9
2017 2018 2019 2020 2021 2022
1.75 1.751.50
0.25 0.25 0.25
2017 2018 2019 2020 2021 2022
6.55.4 5.4
3.8
2017 2018 2019 2020 2021 2022
6.6 6.7
3.6
-0.3 0.4
3.4
2017 2018 2019 2020 2021 2022
Nominal GDPGDP3.4 3.2 2.8
-3.3-0.4
2.5
2017 2018 2019 2020 2021 2022
3.5-5.53-5
3-52-4
For
per
sona
l use
onl
y
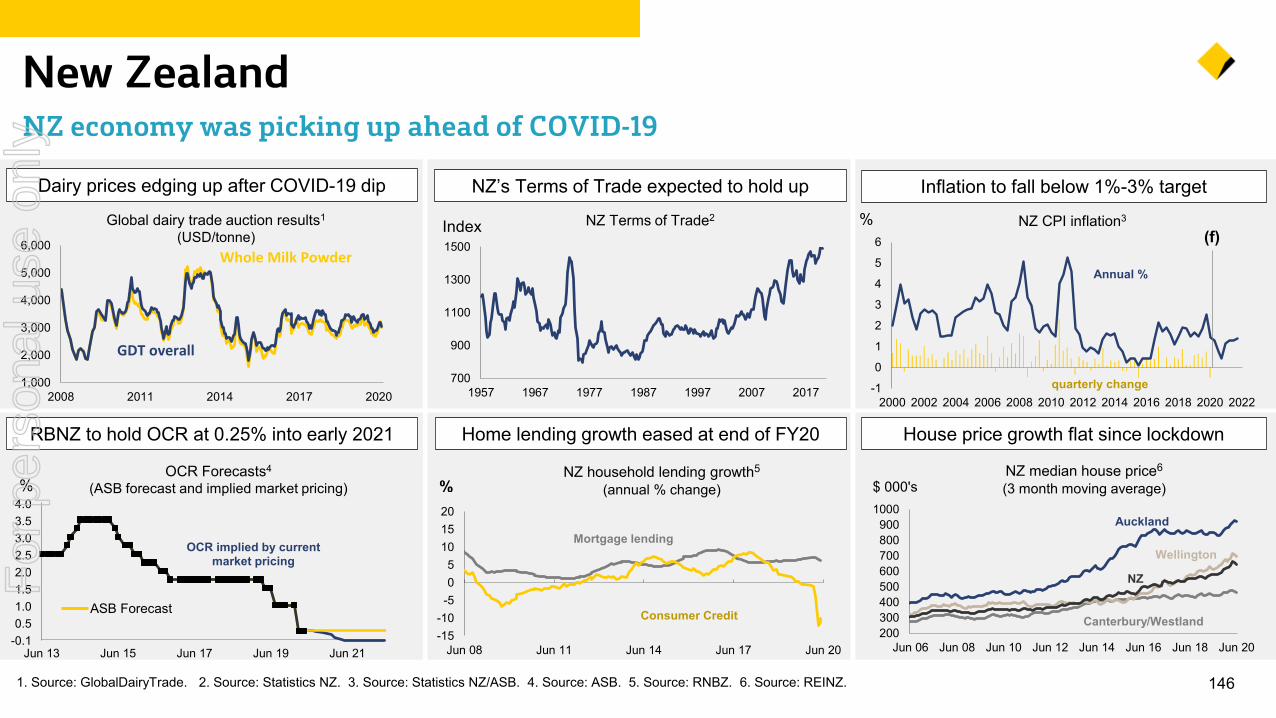
-1
0
1
2
3
4
5
6
2000 2002 2004 2006 2008 2010 2012 2014 2016 2018 2020 2022
% (f)
Annual %
quarterly change
1461. Source: GlobalDairyTrade. 2. Source: Statistics NZ. 3. Source: Statistics NZ/ASB. 4. Source: ASB. 5. Source: RNBZ. 6. Source: REINZ.
New ZealandNZ economy was picking up ahead of COVID-19
Dairy prices edging up after COVID-19 dip NZ’s Terms of Trade expected to hold up Inflation to fall below 1%-3% target
Home lending growth eased at end of FY20 House price growth flat since lockdownRBNZ to hold OCR at 0.25% into early 2021
NZ CPI inflation3Global dairy trade auction results1
(USD/tonne) NZ Terms of Trade2
OCR Forecasts4
(ASB forecast and implied market pricing) NZ household lending growth5
(annual % change)NZ median house price6
(3 month moving average)
ASB Forecast
-15-10-505
101520
Jun 08 Jun 11 Jun 14 Jun 17 Jun 20
%
Mortgage lending
Consumer Credit
1,000
2,000
3,000
4,000
5,000
6,000
2008 2011 2014 2017 2020
Whole Milk Powder
GDT overall
700
900
1100
1300
1500
1957 1967 1977 1987 1997 2007 2017
Index
-0.10.51.01.52.02.53.03.54.0
Jun 13 Jun 15 Jun 17 Jun 19 Jun 21
%
OCR implied by current market pricing
200300400500600700800900
1000
Jun 06 Jun 08 Jun 10 Jun 12 Jun 14 Jun 16 Jun 18 Jun 20
Auckland
Wellington
Canterbury/Westland
NZ
$ 000's
For
per
sona
l use
onl
y

147
Sources, Glossary & Notes For
per
sona
l use
onl
y
148
Sources and Notes Core franchise strength Slide 101. Net Promoter Score - Mobile App (via mobile app on a mobile phone or tablet): Roy Morgan Research. Australian population 14+ who used the internet banking services of their (self-nominated) main financial
institution in the last 4 weeks, rolling average of the last 6 months of spot scores, as at June 2020. Rank based on comparison to ANZ, NAB and Westpac (at a brand level). Net Promoter®, Net Promoter System®, Net Promoter Score®, NPS® and the NPS-related emoticons are registered trademarks of Bain & Company, Inc., Fred Reichheld and Satmetrix Systems, Inc. Total average NetBank, the CommBank mobile app, CommBank tablet app and old mobile app logons per day in the month of June 2020. Includes Face ID logons.
2. DBM Consumer MFI *Net Promoter Score. Based on Australian population aged 14+ years old rating their Main Financial Institution. Net Promoter Score refers to customer likelihood to recommend their MFI using a scale from 0-10 (where 0 is ‘Not at all likely’ and 10 is ‘Extremely likely) and NPS is calculated by subtracting the percentage of Detractors (scores 0-6) from the percentage of Promoters (scores 9-10). NPS results are shown as a six-month rolling average. For the major banks, NPS is reported for main brand only. *Net Promoter Score is a trademark of Bain & Co Inc., Satmetrix Systems, Inc., and Mr Frederick Reichheld.
3. DBM Business MFI *Net Promoter Score: Based on Australian businesses rating their Main Financial Institution for Business Banking. Net Promoter Score refers to customer likelihood to recommend their MFI using a scale from 0-10 (where 0 is ‘Extremely unlikely’ and 10 is ‘Extremely likely’) and NPS is calculated by subtracting the percentage of Detractors (scores 0-6) from the percentage of Promoters (scores 9-10). NPS results are shown as a six-month rolling average. For the major banks, NPS is reported for main brand only. *Net Promoter Score is a trademark of Bain & Co Inc., Satmetrix Systems, Inc., and Mr Frederick Reichheld.
4. DBM Institutional $300M+ Business MFI *Net Promoter Score: Based on Australian businesses with an annual revenue of $300M or more for the previous financial year rating their Main Financial Institution for Business Banking. Net Promoter Score refers to customer likelihood to recommend their MFI using a scale from 0-10 where (where 0 is ‘Extremely unlikely’ and 10 is ‘Extremely likely’) and NPS is calculated by subtracting the percentage of Detractors (scores 0-6) from the percentage of Promoters (scores 9-10). NPS results are shown as a six-month rolling average. For the major banks, NPS is reported for main brand only. *Net Promoter Score is a trademark of Bain & Co Inc., Satmetrix Systems, Inc., and Mr Frederick Reichheld.
5. BizExpress in FY20 was an assisted experience for business lending <$1m. BizExpress has been extended this financial year to Online access. 90% of applications via BizExpress processed on the same day. 6. As reported in RBA Lending and Credit Aggregates (Home Lending and Business Lending) and APRA Monthly ADI Statistics (MADIS) (Household Deposits). RBA collection data was aligned to the new
regulatory definitions set by APRA from July 2019, therefore the Home Lending system multiple has been calculated for the 11 months to June 2020 annualised. Business Lending includes Business and Private Banking, Bankwest and Institutional Banking and Markets (ex. CMPF) and growth is calculated for 12 months.
7. Total group transaction deposits growth, including non-interest bearing deposits.
For
per
sona
l use
onl
y
149
Sources and Notes Executing our strategySlide 161. MFI Share measures the proportion of Banking and Finance MFI Customers that nominated each bank as their Main Financial Institution. Main Financial Institution (MFI) definition: In the Roy
Morgan Single Source Survey MFI is a customer determined response where one institution is nominated as the primary financial institution they deal with (when considering all financial products they hold). Peers include ANZ Group, NAB Group and Westpac Group (including St George Group). CBA Group includes Bankwest. Source: Roy Morgan Single Source survey conducted by Roy Morgan, Australian population 14+ (12 month averages to June 2020), excl. unable to identify MFI.
2. RBA Lending and Credit Aggregates (Home Loans) and APRA Monthly Authorised Deposit-taking Institution Statistics (MADIS) (Deposits). RBA collection data was aligned to the new regulatory definitions set by APRA from 1 July 2019.
3. The Forrester Digital Experience ReviewTM: Australian Mobile Banking Apps, Q3 2020. Forrester Research does not endorse any company included in any Digital Experience ReviewTM report.4. Net Promoter Score - Mobile App (via mobile app on a mobile phone or tablet): Roy Morgan Research. Australian population 14+ who used the internet banking services of their (self-nominated)
main financial institution in the last 4 weeks, rolling average of the last 6 months of spot scores, as at June 2020. Rank based on comparison to ANZ, NAB and Westpac (at a brand level). Net Promoter®, Net Promoter System®, Net Promoter Score®, NPS® and the NPS-related emoticons are registered trademarks of Bain & Company, Inc., Fred Reichheld and Satmetrix Systems, Inc.
Why CBA?Slide 351. MFI Share measures the proportion of Banking and Finance MFI Customers that nominated each bank as their Main Financial Institution. Main Financial Institution (MFI) definition: In the Roy Morgan Single
Source Survey MFI is a customer determined response where one institution is nominated as the primary financial institution they deal with (when considering all financial products they hold). Peers include ANZ Group, NAB Group and Westpac Group (including St George Group). CBA Group includes Bankwest. Source: Roy Morgan Single Source survey conducted by Roy Morgan, Australian population 14+ (12 month averages to June 2020), excl. unable to identify MFI.
2. Source: RBA Lending and Credit Aggregates, series break due to new regulatory definitions set by APRA from 1 July 2019. As a result of this change, market share is not comparable to previous reporting periods and for the purpose of this chart has been compared to July 2019.
3. Market share calculated based on APRA Monthly Authorised Deposit-taking Institution Statistics (MADIS) . 4. Net Promoter Score - Mobile App (via mobile app on a mobile phone or tablet): Roy Morgan Research. Australian population 14+ who used the internet banking services of their (self-nominated) main financial
institution in the last 4 weeks, rolling average of the last 6 months of spot scores, as at June 2020. Rank based on comparison to ANZ, NAB and Westpac (at a brand level). Net Promoter®, Net Promoter System®, Net Promoter Score®, NPS® and the NPS-related emoticons are registered trademarks of Bain & Company, Inc., Fred Reichheld and Satmetrix Systems, Inc.
5. Total provisions divided by credit risk weighted assets. Excludes impairment provisions for derivatives at fair value. 6. Peers as reported at March 2020. On continuing operations basis where applicable. 7. Source: Bloomberg. Total Shareholder Return as at 30 June 2020.
For
per
sona
l use
onl
y
150
Sources and Notes Best in digitalSlide 43
1. Net Promoter Score (NPS) - Mobile App (via mobile app on a mobile phone or tablet): Roy Morgan Research. Australian population 14+ who used the internet banking services of their (self-nominated) main financial institution in the last 4 weeks, rolling average of the last 6 months of spot scores, as at June 2020. Rank based on comparison to ANZ, NAB and Westpac (at a brand level). Net Promoter®, Net Promoter System®, Net Promoter Score®, NPS® and the NPS-related emoticons are registered trademarks of Bain & Company, Inc., Fred Reichheld and SatmetrixSystems, Inc.
2. Total number of customers that use 1 or more extended features in the month (e.g. Cash Flow View).3. The total number of customers that have logged into the CommBank mobile app at least once in the month of June 2020. Includes Face ID logons.4. The total value ($) of transfers and BPAY payments made in digital (NetBank, the CommBank mobile app, CommBank tablet app and old mobile app) as a proportion of the total value ($) of
transfers in over-the-counter, ATM, EFTPOS and digital transactions over the period of July 2019 – June 2020. 5. Net Promoter Score - Mobile App (via mobile app on a mobile phone or tablet): Roy Morgan Research. Australian population 14+ who used the internet banking services of their (self-
nominated) main financial institution in the last 4 weeks, rolling average of the last 6 months of spot scores, as at June 2020. Rank based on comparison to ANZ, NAB and Westpac (at a brand level). Net Promoter®, Net Promoter System®, Net Promoter Score®, NPS® and the NPS-related emoticons are registered trademarks of Bain & Company, Inc., Fred Reichheld and SatmetrixSystems, Inc.
6. Online banking: CBA won Canstar's Bank of the Year - Online Banking award for 2020 (for the 11th year in a row). Awarded June 2020.7. Mobile banking: CBA won Canstar’s Bank of the Year - Mobile Banking award for 2020 (for the 5th year in a row). Awarded June 2020. 8. The Forrester Digital Experience ReviewTM: Australian Mobile Banking Apps, Q3 2020. Commonwealth Bank of Australia was named the Overall Digital Experience LeaderTM among mobile
apps in Australia in Forrester's proprietary Digital Experience ReviewTM. Forrester Research does not endorse any company included in any Digital Experience ReviewTM report and does not advise any person or organization to select the products or services of any particular company based on the ratings included in such reports.
9. DBM Australian Financial Awards - Most Innovative Major Bank. Presented March 2020. Award based on DBM Atlas data January to December 2019.10. DBM Australian Financial Awards - Best Major Digital Bank. Presented March 2020. Award based on DBM Atlas data January to December 2019.
For
per
sona
l use
onl
y
151
Sources and Notes Delivering for our stakeholders Slide 531. MFI Share measures the proportion of Banking and Finance MFI Customers that nominated each bank as their Main Financial Institution. Main Financial Institution (MFI) definition: In the Roy
Morgan Single Source Survey MFI is a customer determined response where one institution is nominated as the primary financial institution they deal with (when considering all financial products they hold). Peers include ANZ Group, NAB Group and Westpac Group (including St George Group). CBA Group includes Bankwest. Source: Roy Morgan Single Source survey conducted by Roy Morgan, Australian population 14+ (12 month averages to June 2020), excl. unable to identify MFI.
2. As reported in RBA Lending and Credit Aggregates (Home Lending and Business Lending) and APRA Monthly ADI Statistics (MADIS) (Household Deposits). Business Lending includes Business Banking, Bankwest and Institutional Banking and Markets (ex. CMPF). RBA collection data was aligned to the new regulatory definitions set by APRA from 1 July 2019, therefore system multiple has been calculated for the 11 months to June 2020 annualised.
3. Employee Engagement Index (EEI) from bi-annual engagement survey. 4. Representation of women in Executive Manager and above roles. Excludes ASB. 5. DBM Consumer MFI *Net Promoter Score. Based on Australian population aged 14+ years old rating their Main Financial Institution. Net Promoter Score refers to customer likelihood to
recommend their MFI using a scale from 0-10 (where 0 is ‘Not at all likely’ and 10 is ‘Extremely likely) and NPS is calculated by subtracting the percentage of Detractors (scores 0-6) from the percentage of Promoters (scores 9-10). NPS results are shown as a six-month rolling average. For the major banks, NPS is reported for main brand only. *Net Promoter Score is a trademark of Bain & Co Inc., Satmetrix Systems, Inc., and Mr Frederick Reichheld.
6. DBM Business MFI *Net Promoter Score: Based on Australian businesses rating their Main Financial Institution for Business Banking. Net Promoter Score refers to customer likelihood to recommend their MFI using a scale from 0-10 (where 0 is ‘Extremely unlikely’ and 10 is ‘Extremely likely’) and NPS is calculated by subtracting the percentage of Detractors (scores 0-6) from the percentage of Promoters (scores 9-10). NPS results are shown as a six-month rolling average. For the major banks, NPS is reported for main brand only. *Net Promoter Score is a trademark of Bain & Co Inc., Satmetrix Systems, Inc., and Mr Frederick Reichheld.
7. DBM Institutional $300M+ Business MFI *Net Promoter Score: Based on Australian businesses with an annual revenue of $300M or more for the previous financial year rating their Main Financial Institution for Business Banking. Net Promoter Score refers to customer likelihood to recommend their MFI using a scale from 0-10 where (where 0 is ‘Extremely unlikely’ and 10 is ‘Extremely likely’) and NPS is calculated by subtracting the percentage of Detractors (scores 0-6) from the percentage of Promoters (scores 9-10). NPS results are shown as a six-month rolling average. For the major banks, NPS is reported for main brand only. *Net Promoter Score is a trademark of Bain & Co Inc., Satmetrix Systems, Inc., and Mr Frederick Reichheld.
8. Net Promoter Score - Mobile App (via mobile app on a mobile phone or tablet): Roy Morgan Research. Australian population 14+ who used the internet banking services of their (self-nominated) main financial institution in the last 4 weeks, rolling average of the last 6 months of spot scores, as at June 2020. Rank based on comparison to ANZ, NAB and Westpac (at a brand level). Net Promoter®, Net Promoter System®, Net Promoter Score®, NPS® and the NPS-related emoticons are registered trademarks of Bain & Company, Inc., Fred Reichheld and Satmetrix Systems, Inc. Total average NetBank, the CommBank mobile app, CommBank tablet app and old mobile app logons per day in the month of June 2020. Includes Face ID logons.
9. Reputation score amongst top 16 ASX customer-facing companies. Source: RepTrak, The RepTrak Company (formerly Reputation Institute), June 2020. 10. Source: Bloomberg. Total Shareholder Return as at 30 June 2020.
For
per
sona
l use
onl
y
152
Sources and Notes Cash Profit
The Profit Announcement discloses the net profit after tax on both a statutory and cash basis. The statutory basis is prepared in accordance with the Corporations Act and the Australian Accounting Standards, which comply with International Financial Reporting Standards (IFRS). The cash basis is used by management to present a clear view of the Bank’s operating results. It is not a measure based on cash accounting or cash flows. The items excluded from cash profit, such as hedging and IFRS volatility and losses or gains on acquisition, disposal, closure and demerger of businesses are calculated consistently with the prior year and prior half disclosures and do not discriminate between positive and negative adjustments. A list of items excluded from cash profit is provided on page 3 of the Group’s 30 June 2020 Profit Announcement (PA), which can be accessed at our website: www.commbank.com.au/results
Images
Mastercard is a registered trademark and the circles design is a trademark of Mastercard International Incorporated.Apple, the Apple logo, iPhone and iPad are trademarks of Apple Inc., registered in the U.S. and other countries. App Store is a service mark of Apple Inc.
For
per
sona
l use
onl
y
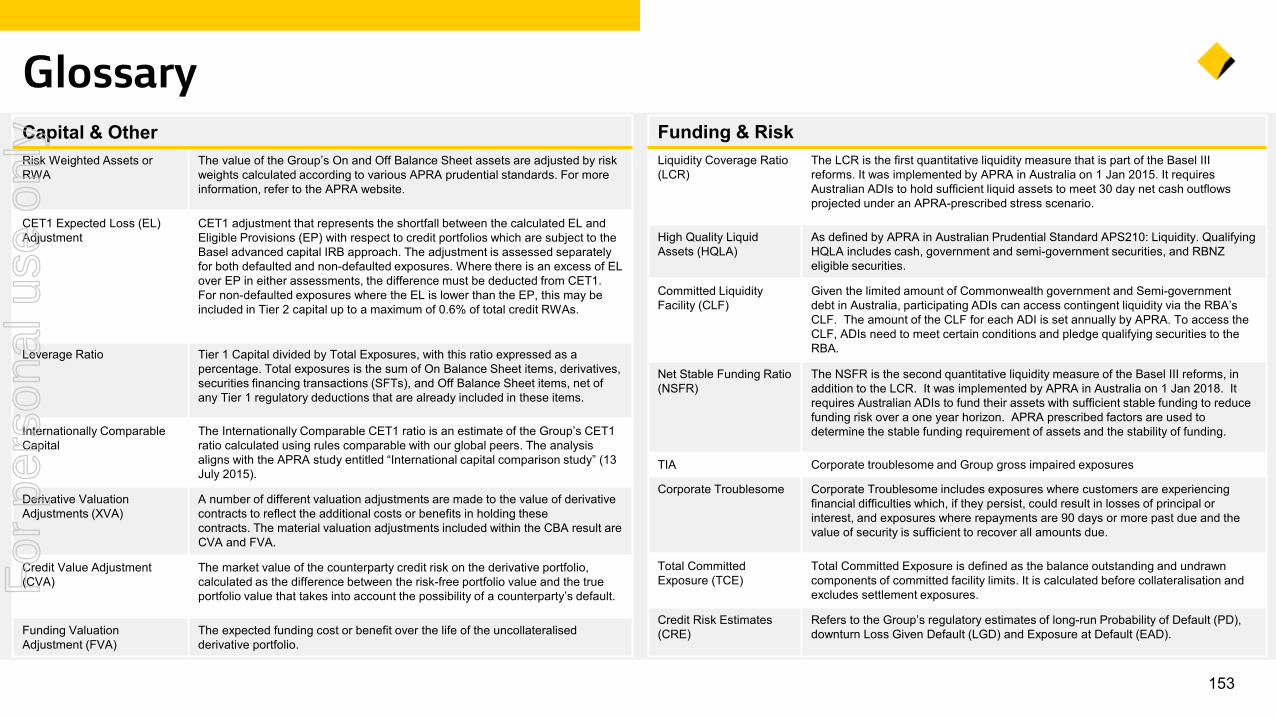
153
GlossaryFunding & RiskLiquidity Coverage Ratio (LCR)
The LCR is the first quantitative liquidity measure that is part of the Basel III reforms. It was implemented by APRA in Australia on 1 Jan 2015. It requires Australian ADIs to hold sufficient liquid assets to meet 30 day net cash outflows projected under an APRA-prescribed stress scenario.
High Quality Liquid Assets (HQLA)
As defined by APRA in Australian Prudential Standard APS210: Liquidity. Qualifying HQLA includes cash, government and semi-government securities, and RBNZ eligible securities.
Committed Liquidity Facility (CLF)
Given the limited amount of Commonwealth government and Semi-government debt in Australia, participating ADIs can access contingent liquidity via the RBA’s CLF. The amount of the CLF for each ADI is set annually by APRA. To access the CLF, ADIs need to meet certain conditions and pledge qualifying securities to the RBA.
Net Stable Funding Ratio (NSFR)
The NSFR is the second quantitative liquidity measure of the Basel III reforms, in addition to the LCR. It was implemented by APRA in Australia on 1 Jan 2018. It requires Australian ADIs to fund their assets with sufficient stable funding to reduce funding risk over a one year horizon. APRA prescribed factors are used to determine the stable funding requirement of assets and the stability of funding.
TIA Corporate troublesome and Group gross impaired exposures
Corporate Troublesome Corporate Troublesome includes exposures where customers are experiencing financial difficulties which, if they persist, could result in losses of principal or interest, and exposures where repayments are 90 days or more past due and the value of security is sufficient to recover all amounts due.
Total Committed Exposure (TCE)
Total Committed Exposure is defined as the balance outstanding and undrawn components of committed facility limits. It is calculated before collateralisation and excludes settlement exposures.
Credit Risk Estimates (CRE)
Refers to the Group’s regulatory estimates of long-run Probability of Default (PD), downturn Loss Given Default (LGD) and Exposure at Default (EAD).
Capital & OtherRisk Weighted Assets or RWA
The value of the Group’s On and Off Balance Sheet assets are adjusted by risk weights calculated according to various APRA prudential standards. For more information, refer to the APRA website.
CET1 Expected Loss (EL) Adjustment
CET1 adjustment that represents the shortfall between the calculated EL and Eligible Provisions (EP) with respect to credit portfolios which are subject to the Basel advanced capital IRB approach. The adjustment is assessed separately for both defaulted and non-defaulted exposures. Where there is an excess of EL over EP in either assessments, the difference must be deducted from CET1. For non-defaulted exposures where the EL is lower than the EP, this may be included in Tier 2 capital up to a maximum of 0.6% of total credit RWAs.
Leverage Ratio Tier 1 Capital divided by Total Exposures, with this ratio expressed as a percentage. Total exposures is the sum of On Balance Sheet items, derivatives, securities financing transactions (SFTs), and Off Balance Sheet items, net of any Tier 1 regulatory deductions that are already included in these items.
Internationally Comparable Capital
The Internationally Comparable CET1 ratio is an estimate of the Group’s CET1 ratio calculated using rules comparable with our global peers. The analysis aligns with the APRA study entitled “International capital comparison study” (13 July 2015).
Derivative Valuation Adjustments (XVA)
A number of different valuation adjustments are made to the value of derivative contracts to reflect the additional costs or benefits in holding these contracts. The material valuation adjustments included within the CBA result areCVA and FVA.
Credit Value Adjustment (CVA)
The market value of the counterparty credit risk on the derivative portfolio, calculated as the difference between the risk-free portfolio value and the true portfolio value that takes into account the possibility of a counterparty’s default.
Funding Valuation Adjustment (FVA)
The expected funding cost or benefit over the life of the uncollateralised derivative portfolio.
For
per
sona
l use
onl
y

Thank YouContact us
Investor RelationsMelanie KirkInvestor Relations
02 9118 [email protected]
Media RelationsDanny JohnMedia Relations
02 9118 6919 [email protected]
Investor CentreFor more information commbank.com.au/investors
For
per
sona
l use
onl
y

Thank You
For
per
sona
l use
onl
y