For personal use only - ASXNet debt of $77.2m at 30 June 2015, $74.7m at 30 June 2014 Gearing ratio...
30
McPherson’s Limited Results for the Year Ended 30 June 2015 Paul Maguire – Managing Director Paul Witheridge – Chief Financial Officer 24 August 2015 For personal use only
Transcript of For personal use only - ASXNet debt of $77.2m at 30 June 2015, $74.7m at 30 June 2014 Gearing ratio...

McPherson’s Limited Results for the Year Ended
30 June 2015 Paul Maguire – Managing Director
Paul Witheridge – Chief Financial Officer
24 August 2015
For
per
sona
l use
onl
y

2
MCP FY2015 Financial Overview
Overall Sales Revenue of $349.1m, 1.0% below prior year
Sales Revenue, excluding the partially divested Housewares business, of $318.2m, 15.3% above prior year
Comparable sales, i.e. excluding FY2014 and FY2015 acquisitions and Housewares, grew 4.3% on prior year
Underlying FY2015 PBT in line with guidance
– Underlying EBIT of $22.5m, 15.4% below prior year
– Underlying PBT of $16.4m, 18.2% below prior year
– Underlying PAT of $12.0m, 16.1% below prior year
– Underlying EPS of 12.4 cents, 19.5% below prior year
For
per
sona
l use
onl
y

3
MCP FY2015 Financial Overview
Cash flow from operations before interest and tax payments of $19.5m, 89% of EBITDA
Net debt of $77.2m at 30 June 2015, $74.7m at 30 June 2014
Gearing ratio of 43.9% at 30 June 2015, 44.6% at 30 June 2014
EBIT Interest Cover1 of 3.6 times and Leverage Ratio2 of 3.1 for the 12 months to 30 June 2015
Final dividend of 2 cents per share fully franked; total dividend of 8 cents
– Payout ratio 65% of underlying EPS
– Payment date of 10 November 2015
– Dividend Reinvestment Plan (DRP) retained
1. Underlying EBIT / Net borrowing cost, excluding one-off interest rate swap termination cost 2. Net Debt / Underlying EBITDA
For
per
sona
l use
onl
y
4
MCP FY2015 Financial Overview
Successful refinancing of debt at 31 March 2015
$60m of Corporate Bonds issued comprising:
– $30m, 4 year floating rate of 4.30% above BBSW
– $30m, 6 year fixed rate of 7.10%
New 2 year Working Capital Facility established with NAB & WBC
Funding certainty over medium term and capital diversity achieved
Consistent approach to FX hedging
– Proportionally lower purchases denominated in USD in FY2015 due to Health and Beauty expansion
For
per
sona
l use
onl
y

STRATEGY UPDATE
Paul Maguire Managing Director
For
per
sona
l use
onl
y

6
Trading commentary
Significant AUD/USD currency devaluation throughout FY2015
Raw material prices remained high until 4th Quarter FY2015
Volatility persists in currency and raw material markets
McPherson’s profit impacted in 2H FY2015 by the requirement to supply private label product at low margin, which has now ceased
Price increase negotiations with retailers protracted but now satisfactorily resolved
Revenue performance solid in FY2015 but profitability hit by the delay in price increase implementation
Promotional spend higher than anticipated in 2H FY2015 but the benefit will be felt in FY2016
For
per
sona
l use
onl
y

7
# The revenue summary above excludes Housewares due to the divestment of 51% of the Housewares business, which has been equity accounted since Nov 2014
* Health & Beauty growth rate excluding acquisitions 1.1% ** Home Appliance growth rate excluding acquisitions 10.6%
Divisional revenue summary (Aus & NZ)#
SHARE OF REVENUE
FY2015
REVENUE GROWTH
FY15 vs FY14
REASONS OUTLOOK
HEALTH & BEAUTY
45% 32%* Acquisitions & new agencies
Growth in revenue and
profit
HOME APPLIANCES
21% 12%** Acquisition & new products
Growth in revenue and
profit
HOUSEHOLD CONSUMABLES
29% 7% Market leadership maintained
Consistent performance
IMPULSE MERCHANDISING
3% 3% Improving distribution
Growth through new distribution F
or p
erso
nal u
se o
nly
8
Company transformation
McPherson’s stated strategy is:
“to substantially transform through acquisition/divestment, the
establishment of new agency partnerships and channel expansion
.......diversifying away from margin constrained channels and
increasing participation in channels with greater profit potential”
For
per
sona
l use
onl
y
9
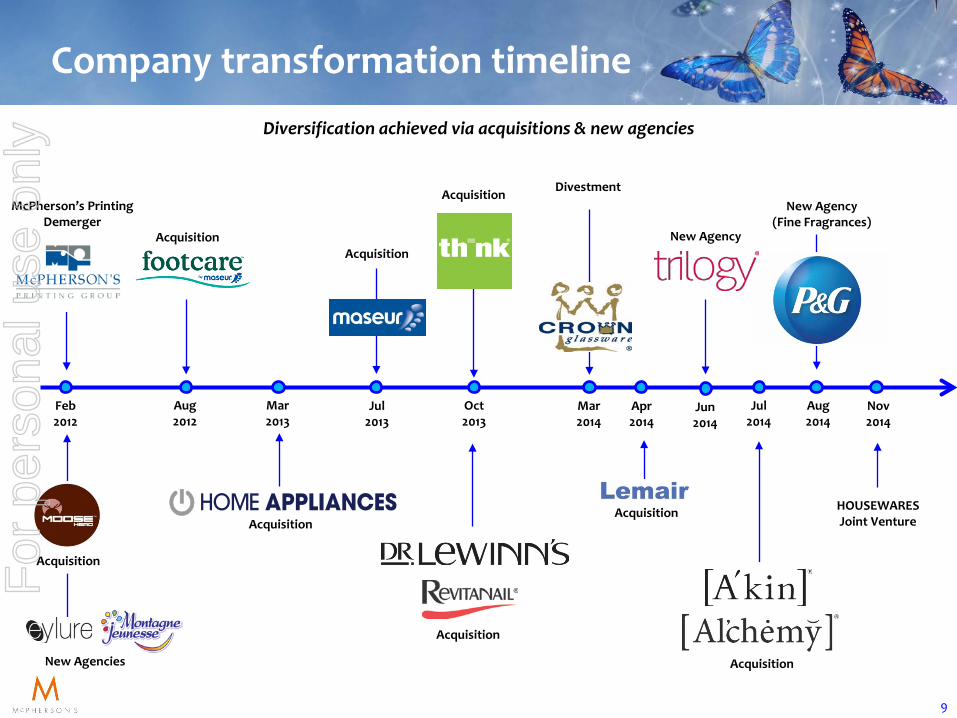
Nov 2014
HOUSEWARES Joint Venture
Mar 2014
Divestment
Acquisition
Mar 2013
Acquisition
New Agencies
Acquisition
Aug 2012
New Agency (Fine Fragrances)
Aug 2014
Acquisition
Jul 2014
Acquisition
Apr 2014
New Agency
Jun 2014
McPherson’s Printing Demerger
Feb 2012
Acquisition
Acquisition
Acquisition
Oct 2013
Jul 2013
Company transformation timeline Diversification achieved via acquisitions & new agencies
For
per
sona
l use
onl
y

10
Transformation progress
Over the past year we have…
... acquired and successfully integrated two natural skincare & haircare brands (A’kin and Alchemy) delivering synergy benefits and growth
... partnered with Trilogy International to distribute the Trilogy brand
... partnered with Procter & Gamble to distribute Fine Fragrances in Australia - Gucci, Dolce&Gabbana and Hugo Boss
... formed a Housewares joint venture with Fackelmann from Germany
... implemented performance improvement initiatives - restructuring, product rationalisation and price increases (late 2H FY2015)
... launched comprehensive new innovative product ranges
For
per
sona
l use
onl
y

11
Beauty acquisitions
A’kin & Al’chemy – Natural skincare (A’kin) and natural haircare (Al’chemy) – Leveraging MCP strengths – Significant growth potential
For
per
sona
l use
onl
y

12
New beauty agency – natural skincare F
or p
erso
nal u
se o
nly

13
New beauty agency – fine fragrances F
or p
erso
nal u
se o
nly

14
Housewares joint venture
‘McPherson’s Housewares’ joint venture established with FACKELMANN from Germany; (FMG 51% : MCP 49%)
FACKELMANN is a global manufacturer and distributor of kitchen, baking, home & leisure products, operating 35 manufacturing & distribution centres globally
‘McPherson’s Housewares’ is benefiting substantially from:
– Manufacturing and shared sourcing capability – Scale, combined product assortments and brands – Integrating infrastructure and reducing overheads
For
per
sona
l use
onl
y

15
Performance improvement initiatives
Price increases implemented by all divisions late 2H FY2015
USD product cost reductions achieved by all divisions 2H FY2015
McPherson’s Australia – restructuring in Sydney distribution centre, field sales and administration 2H FY2015
McPherson’s New Zealand – 1H FY2015 restructuring, Aus ERP System implemented and logistics outsourced to a large scale 3PL provider
In progress – brand consolidation and product range harmonisation in Health & Beauty, Housewares and Home Appliances
For
per
sona
l use
onl
y

16
Transformation Benefits
Transforming through diversification reduces risk:
– Lessened exposure to foreign exchange
• USD purchases will reduce to 63% of total purchases in FY2015, down from 85% in FY2014
– A more profitable channel and customer mix
• In FY2016 the mix of business across the channels will continue to improve
FY2014 FY2015
Grocery 47%
Pharmacy 16%
Disc. Dept. Stores
9%
Dept. Stores 3%
Commercial 5%
Independents 15%
Hardware 2%
Retail Outlets 1%
Export 1%
Grocery 43%
Pharmacy 23%
Disc. Dept. Stores
7%
Dept. Stores
3%
Commercial 6%
Independents 15%
Hardware 2%
Retail Outlets 0%
Export 1%
For
per
sona
l use
onl
y

17
Health and Beauty division
Current Status
Revenue 32% ahead of prior year
Successful new products under trusted brands
Acquisitions and new agencies boosting McPherson’s presence in Pharmacy and Department Stores and reaffirming McPherson’s beauty industry credentials:
– Dr LeWinn’s and Revitanail FY2014
– Trilogy, A’kin and Al’chemy FY2015
– Gucci, Dolce&Gabbana, Hugo Boss FY2015
Outlook
Brand consolidation
Range harmonisation
Profitability boosted by price increases and structural reforms
Focus on advanced beauty and natural beauty
Enhanced digital capability
Continued growth through:
– new product development
– effect of recent acquisitions/agencies
– the potential to utilise available DC capacity for 2000+ product lines
For
per
sona
l use
onl
y
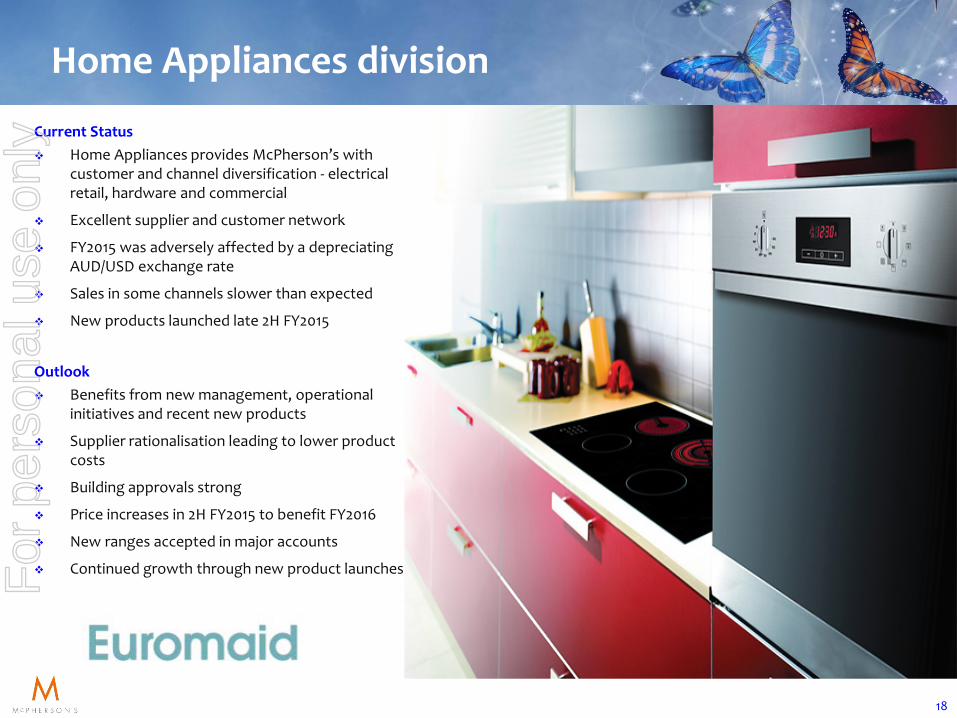
18
Home Appliances division
Current Status Home Appliances provides McPherson’s with
customer and channel diversification - electrical retail, hardware and commercial
Excellent supplier and customer network
FY2015 was adversely affected by a depreciating AUD/USD exchange rate
Sales in some channels slower than expected
New products launched late 2H FY2015
Outlook Benefits from new management, operational
initiatives and recent new products
Supplier rationalisation leading to lower product costs
Building approvals strong
Price increases in 2H FY2015 to benefit FY2016
New ranges accepted in major accounts
Continued growth through new product launches For
per
sona
l use
onl
y

19
Household Consumables division
Current Status
Revenue 7% ahead of prior year
Profit impacted by:
– protracted negotiations prior to the acceptance of price increases
– the requirement to supply low margin private label....now exited
– increased ‘customer support’ required
– high commodity prices until Q4 FY2015
– AUD/USD currency depreciation
Outlook
Multix market leadership maintained
Reduced private label involvement
Favourable impact of price increases, innovative new products and easing commodity prices
Sourcing initiatives benefiting profitability For
per
sona
l use
onl
y

20
Housewares division
Current Status
Joint venture performing to plan
‘New Zealand Housewares’ joined JV 1 July 2015
Range rationalisation and clearance complete, leading to overhead reductions and a focus on major brands
Price increases implemented in 2H FY2015
Outlook
Profitability boosted by price increases
Continued product range optimisation to boost profitability
Launch of profitable new product ranges
Operational excellence initiatives to further reduce overheads
The joint venture will continue to leverage scale and manufacturing & sourcing capability to boost competitiveness
For
per
sona
l use
onl
y

21
Outlook
Retail trading conditions expected to remain consistent with the past year
Financial performance across all divisions boosted by recent price increases, operational initiatives and reduced operational expenditure
Health & Beauty to benefit from new products and new agencies
Home Appliances to benefit from new management and new ranging
Household Consumables to benefit from new ranging and exiting low margin private label
Housewares joint venture favourably impacted by new ranging
Innovative new products to support the portfolio of market leading brands
Company transformation to continue through further price increases, restructuring, expense reductions, e-commerce capability, brand consolidation, divestment and improved channel mix
For
per
sona
l use
onl
y

Mission
To be a world class consumer products company through 1st choice products for consumers
and by being a
1st choice partner for customers and suppliers 1st choice employer for employees 1st choice investment for shareholders
MCPHERSON’S LIMITED RESULTS FOR THE YEAR ENDED 30 JUNE 2015 Paul Maguire – Managing Director Paul Witheridge – Chief Financial Officer
For
per
sona
l use
onl
y

APPENDIX MCPHERSON’S LIMITED FINANCIAL PERFORMANCE FOR THE YEAR ENDED 30 JUNE 2015
Paul Witheridge Chief Financial Officer
For
per
sona
l use
onl
y

24
Group Financial Summary for FY2015 Underlying (i.e. excluding significant non-recurring items)
June 2014 ($A million)
June 2015 ($A million)
Sales 352.7 349.1
EBITDA 29.5 25.2
Depreciation & amortisation (2.9) (2.7)
EBIT 26.6 22.5
Interest (6.6) (6.1)
PBT 20.0 16.4
Tax (5.7) (4.4)
PAT 14.3 12.0
Operating cash flow (before interest and tax) 33.9 19.5
EPS excluding non-recurring items (cents) 15.4 12.4
Total dividend (cents – fully franked) 11.0 8.0
1.0% Sales decrease
15.4% EBIT decrease
Interest cover 3.6 times
16.1% PAT decrease
18.2% PBT decrease
For
per
sona
l use
onl
y

25
Group Financial Summary for FY2015 Statutory (i.e. including significant non-recurring items)
June 2014 ($A million)
June 2015 ($A million)
PBT excluding non-recurring items 20.0 16.4
Non-recurring items:
- Interest rate swap termination loss - (2.0)
- Contingent consideration adjustment benefit - 2.0
- Impairment of intangibles (80.0) (0.6)
- Restructuring costs (1.5) (4.1)
- Other non-recurring items (1.1) (0.3)
Statutory PBT (62.6) 11.2
Income tax expense (4.4) (2.4)
Statutory PAT (67.0) 8.8
Statutory EPS (cents per share) (72.4) 9.2 For
per
sona
l use
onl
y

26
Overview of Group Balance Sheet
June 2014 ($A million)
June 2015 ($A million)
Inventories 45.5 57.8
Receivables 60.7 55.0
Assets held for sale (inventories) 26.1 19.7
Payables (50.6) (60.4)
Net working capital 81.7 72.1
Property, plant & equipment 6.0 5.5
Investments (49% of Housewares Australia, Singapore and Hong Kong) - 8.8
Non-current receivables - 2.6
Intangibles 88.3 89.4
Other assets held for sale 19.3 17.8
Provisions & other net liabilities (26.0) (18.5)
Total funds employed 169.3 177.7
Net financial debt (74.7) (77.2)
Net tax balances (1.8) (1.8)
Shareholders’ funds 92.8 98.7
Gearing [Net debt / (Net debt + Shareholders’ funds)] 44.6% 43.9%
ROFE (Underlying EBIT / Total funds employed) 15.7% 12.7%
ROSF (Underlying PAT / Shareholders’ funds) 15.4% 12.2%
For
per
sona
l use
onl
y

27
Group Operating Cash Flows
June 2014 ($A million)
June 2015 ($A million)
cash flows from operations
Receipts from customers (inclusive of GST) 379.1 382.8
Payments to suppliers and employees (inclusive of GST) (345.2) (363.3)
Net cash inflows from operations before interest and tax 33.9 19.5
Net interest and borrowing costs paid (6.4) (8.5)
Income tax paid (4.3) (4.0)
Net cash inflows from operations 23.2 7.0
For
per
sona
l use
onl
y

28
Group Investing and Financing Cash Flows
June 2014 ($A million)
June 2015 ($A million)
cash flows from investing activities
Payments for purchase of property, plant and equipment (1.3) (2.0)
Payments for acquisition of business assets (23.7) (8.1)
Payments for purchase of intangibles (1.1) (1.4)
Proceeds from sale of business assets 2.2 8.5
Net cash outflows from investing activities (23.9) (3.0)
cash flows from financing activities
Net proceeds from capital raising 4.7 -
Net proceeds from (repayment of) borrowings 7.1 11.8
Dividends paid (net of DRP participation) (8.7) (8.4)
Net cash inflows from financing activities 3.1 3.4
Net increase in cash held 2.4 7.4
For
per
sona
l use
onl
y
29
FX Hedging (Australia)
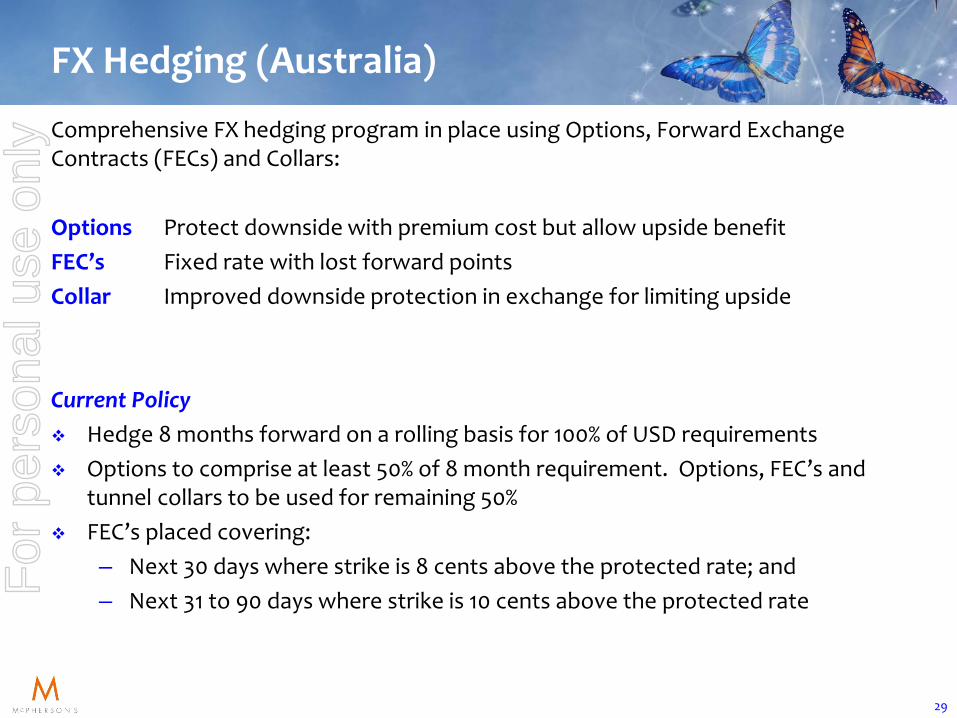
Comprehensive FX hedging program in place using Options, Forward Exchange Contracts (FECs) and Collars: Options Protect downside with premium cost but allow upside benefit FEC’s Fixed rate with lost forward points Collar Improved downside protection in exchange for limiting upside Current Policy Hedge 8 months forward on a rolling basis for 100% of USD requirements Options to comprise at least 50% of 8 month requirement. Options, FEC’s and
tunnel collars to be used for remaining 50% FEC’s placed covering:
– Next 30 days where strike is 8 cents above the protected rate; and – Next 31 to 90 days where strike is 10 cents above the protected rate
For
per
sona
l use
onl
y
McPherson’s Limited
Non-IFRS measures The non-IFRS measures used by the Company are relevant because they are consistent with measures used internally by management to assess the operating performance of the business. The non-IFRS measures have not been subject to audit or review. Disclaimer Statements contained in this presentation, particularly those regarding possible or assumed future performance, estimated company earnings, potential growth of the company, industry growth or other trend projections are or may be forward looking statements. Such statements relate to future events and expectations and therefore involve risks and uncertainties. Actual results may differ materially from those expressed or implied by these forward looking statements.
For
per
sona
l use
onl
y