For personal use only - ASX · For personal use only. ... raw material from what was historically...
48
TPI ENTERPRISES LIMITED (ACN 107 872 453) 2015 ANNUAL REPORT For personal use only
Transcript of For personal use only - ASX · For personal use only. ... raw material from what was historically...

TPI ENTERPRISES LIMITED (ACN 107 872 453)
2015 ANNUAL REPORT
For
per
sona
l use
onl
y

CONTENTS
TPI ENTERPRISES LTD – 2015 ANNUAL REPORT 2
Directors’ Report 3 Auditor’s Independence Declaration 14 Corporate Governance 15 Statement of Profit or Loss and Other Comprehensive Income 16 Statement of Financial Position 17 Statement of Changes in Equity 18 Statement of Cash Flows 19 Notes to the Financial Statements 20 Declaration by Directors 45 Independent Auditor’s Report 46 Shareholder Information 47 Board of Directors and Company Particulars 48
For
per
sona
l use
onl
y

DIRECTORS’ REPORT
TPI ENTERPRISES LTD – 2015 ANNUAL REPORT 3
The Board of Directors of TPI Enterprises Ltd (“TPI” or the “Company”) has resolved to submit the following report together with the financial statements of the Company and its wholly owned subsidiaries (“the Group”) for the year ended 31 December 2015. Directors The following persons were directors of the Company during the financial year and up to the date of this report: Mr. Peter Robinson (Non-Executive Chairman) Mr. Jarrod Ritchie (Managing Director and CEO) Mr. Todd Barlow was appointed as a Non-Executive Director of the Company on 18 June 2015. Mr. Ross Dobinson was the Non-Executive Chairman of the Company from the beginning of the year until his retirement on 18 June 2015. Details of each director’s qualifications and special responsibilities, together with meetings attended, are set forth in other parts of this report. Company Secretary: Mr. Roger McPherson was appointed as Company Secretary on 9 October 2015. Mr. Jarrod Ritchie was Company Secretary from the beginning of the year until 19 June 2015, Mr. Peter Varnay was Company Secretary from 19 June 2015 until his resignation on 9 October 2015. Principal activities The principal activities of the Group during the course of the financial year were the manufacture and supply of alkaloids to international markets utilising TPI’s technology for solvent free extraction of alkaloids from opium poppies. There were no significant changes in the nature of the activities of the Group during the year. Review of operations 2015 was a transformational year for TPI. It was a year in which the company raised $36.5 million, listed on the Australian Securities Exchange, relocated and relicensed its manufacturing facility from Tasmania to Victoria, and significantly increased its ability to obtain raw material from what was historically one source in Australia two years ago, to now four geographies (Victoria, South Australia, Northern Territory and Tasmania). The company also established the ability to obtain raw material from two northern hemisphere geographies. TPI is on track to deliver a positive EBITDA in 2016, subject to market conditions, seed pricing and foreign exchange rates, and utilise the full capacity of its new manufacturing facility within 3-4 years. The key outcomes for 2015 were follows: a. Agricultural
i. Despite an exceptionally dry year in Victoria and Tasmania, TPI has sufficient raw material (including northern hemisphere straw) to report a positive EBITDA in 20161.
ii. Crop harvested to date is slightly below budgeted cost. iii. Confirmed viability of Victorian growing with the best crop grossing over $4,500/Ha. iv. A 30% increase in the Victorian kg/ha harvested in 2015/16 compared to 2014/15, despite a 30% reduction in yield of all
other Victorian winter cereal crops2. v. New harvester technology proved successful by almost doubling the assay of harvested material. vi. Increased field officers from 6 in January 2015 to 11 in early 2016. vii. A 31% increase in the kg/ha in the Tasmania crops, which slightly mitigated a 46% decrease in total kg harvested due to
exceptionally dry conditions and lack of water. viii. Of the Tasmanian contracts signed only 70% were sown and of those sown only 65% was harvested. ix. Legislation passed in November for growing of poppies in South Australia.
1 Subject to market conditions, seed pricing and foreign exchange 2http://www.agriculture.gov.au/abares/publications/display?url=http://143.188.17.20/anrdl/DAFFService/display.php?fid=pb_aucrpd9aba_20160209_11a.xml
For
per
sona
l use
onl
y

DIRECTORS’ REPORT
TPI ENTERPRISES LTD – 2015 ANNUAL REPORT 4
b. Production
i. Tasmanian facility shutdown, relocated and rebuilt in Victoria in under 12 months. ii. Successfully completed commissioning and process verification within 2 months. iii. 2 commercial batches totalling approximately 1 tonne were sold in December 2015. iv. Significant efficiency gains from relocation including removal of 5 processing steps resulting in:
1. reduction in raw material cost/kg of NRM by up to 25% 2. reduction in expected full time equivalent employees (FTE)
F
or p
erso
nal u
se o
nly

DIRECTORS’ REPORT
TPI ENTERPRISES LTD – 2015 ANNUAL REPORT 5
c. Commercial i. Significant interest from existing and new customers after 6 customer visits and audits since completion of commissioning. ii. Signed a new 3 year supply agreement with a cornerstone European customer. iii. Both Morphine and Thebaine have been tested by customers, passing all specifications required. iv. Portugal site (ex-Merck) for expansion into active pharmaceutical ingredients (API´s) has been acquired. License
application for Portugal API license (Stage 1 and 2) has been submitted. v. Equipment capable of making validation batches of all Narcotic API´s has been relocated to Portugal ready for assembly
once the is license granted.
Financial summary The financial results of the Group for the year ended 31 December 2015 are summarised as follows: Operating results: The Group produced a loss before income tax of $25,899,838 (2014: $14,524,553) with an underlying operational loss of $14,463,783
(2014: $10,500,998). During the ten-month period to October 2015 there was no processing of poppy straw into narcotic raw materials whilst the factory was being relocated from Tasmania to Victoria and the required licences were being obtained. While the absence of sales revenue was the major factor that caused the loss, impairment charges against assets and inventory as well as expenditure associated with the relocation were also factors.
Consolidated revenue including other income during the period was $3,679,063 (2014: $8,390,395). This revenue included sale of
goods (narcotic raw materials and poppy seed) of $2,064,578 (2014: $7,567,242), government grants of $1,047,034 (2014: $267,573) and a R&D Tax Incentive of $368,085 (2014: $243,570).
Total consolidated operating expenses for the period were $28,799,639 (2014: $22,110,064).
Non-recurring costs of $11,436,055 (2014: $4,023,555) made up as follows:
• Impairment of assets, primarily associated with the Tasmanian facility, including the gas let down station of $7,127,013 (2014: $1,375,520)
• Impairment of intangible assets $Nil (2014: $ 1,778,194) • Trial crops in Portugal and the Northern Territory $2,237,456 (2014: $Nil) • Relocation expenses of $1,662,256 (2014: $869,841) • Listing expenses of $409,330 (2014: $Nil).
Basic and diluted net loss per share increased to 52.07¢ (2014: 33.30¢) due to an increase in the loss. Statement of cash flows: The Group’s cash outflow from operations over the period was $15,518,107 (2014: $6,254,396). The increase is mainly due to the lack of receipts from customers during the period the factory was being relocated. Business strategies and prospects The Group is licensed to grow, extract, export and sell licit narcotics. It supplies narcotic raw materials (NRM) to pharmaceutical companies participating in the active pharmaceutical ingredient sector of the market. The Group’s strategy is to further develop its business model based on a significant disparity in supply and demand of licit narcotics which supports long term industry growth. TPI’s water based, solvent-free extraction process provides a cost of manufacturing advantage and enables TPI to compete with more established producers in the manufacture and sale of NRMs to the global market. Currently TPI has the ability to source opium poppies from Victorian, Northern Territory and northern hemisphere growers, in addition to Tasmania. On 19 November 2015 the South Australian government passed legislation which will enable the commercial growing of poppies in that state. This diversification in the raw material supply enables TPI to source crop at a freight discount to that sourced from Tasmanian suppliers, who currently supply up to 45% of the global demand. Once consolidated, TPI plans to expand its market share by expanding into the active pharmaceutical ingredient (API) sector and other controlled drugs. This expansion will be made possible as the majority of the cost of the API is the NRM input. TPI´s technology and low administrative cost base will allow it to compete in both the NRM and API sectors. Material business risks: The Group is subject to a number of risks. The Board regularly reviews the possible impact of these risks and seeks to minimise this impact through a commitment to its corporate governance principles and risk management function. However, not all risks are manageable or within the control of the Group. The key business risks faced by the Group that are likely to have an effect on its future prospects include: 1. Government licences TPI is required to obtain licences and permits across many jurisdictions. The majority of the licences are renewed either annually or biannually. There is a risk that laws or regulations may be amended in Australia or elsewhere in a manner that restricts TPI´s markets for saleable product and for raw material supply. Any such change may affect the ability of TPI to carry on its business and may have a material impact on TPI´s financial performance and future prospects of the business.
For
per
sona
l use
onl
y

DIRECTORS’ REPORT
TPI ENTERPRISES LTD – 2015 ANNUAL REPORT 6
2. Raw material supply TPI is currently able to grow poppies in Victoria, Tasmania, the Northern Territory and Portugal. On 19 November 2015 legislation was passed in South Australia which will enable the commercial growing of poppies in that state. This will allow for TPI to grow poppies in four Australian states/territories in addition to Portugal and further enhances the raw material supply chain. While the different growing areas helps to mitigate the risk, if TPI was unable to obtain sufficient raw material, whether due to adverse weather conditions or other issues it could materially impact on TPI's operations and TPI's financial performance and future prospects. 3. Sovereign risk The narcotics industry in which TPI operates is highly regulated. Changes, whether as a result of changes in government or otherwise, in international, national or state conventions, laws or regulations relating to the growing, manufacture, export or sale of narcotic raw materials could materially impact TPI's ability to operate. This may adversely affect TPI's financial performance and future prospects. 4. Loss of key personnel The manufacturers in the licit NRM sector and API sector are relatively small in number and, as a consequence, the number of people skilled in the industry is lower than other pharmaceutical sectors. TPI is currently operating as a relatively flat organisation and is reliant on a few key staff. TPI operates across two countries and has facilities in three jurisdictions. Management of a complex business that operates globally has a higher employee risk/complexity than a business which operates in one jurisdiction. Loss of a few key personnel could have a material impact on TPI´s operations and may impact the financial performance and future prospects of the business. 5. Diversion of material TPI employs state of the art security and has a highly regulated and monitored security system at its facilities. Despite this, any diversion (theft or illicit use) of material during manufacture, storage or freight could result in a loss of an operating licence or substantial fine and/or reputational damage. This may have a material impact on TPI's ability to compete and may impact the financial performance and future prospects of the business. . 6. Competition TPI competes against both State owned enterprises and large multinationals. Both have a capacity to operate at a loss or compete aggressively for market share for a longer period than TPI. This may place pricing pressure on TPI and may impact TPI's ability to retain existing customers or attract new customers. If TPI cannot compete successfully, TPI's financial performance and the future prospects of the business may be adversely affected. 7. Foreign exchange TPI sells NRM in US dollars and poppy seed in Euros. It buys its raw material (opium poppies) predominantly in Australian dollars and Euros. Any adverse change in currency could have a material impact on TPI´s financial performance and future prospects of the business. 8. Poppy seed price volatility Poppy seed is a commodity based product the price of which varies in response to supply and demand. The revenue derived from poppy seed contributes to a proportion of the cost of the raw material and hence contributes a material amount to TPI's revenue and profit. The poppy seed market can be volatile and pricing can change rapidly. This volatility, in combination with €/AUD foreign exchange changes, could have a material impact on TPI's ability to compete and may impact the financial performance and future prospects of the business. Significant changes in state of affairs Other than the closure of the factory during the relocation from Tasmania to Victoria and the subsequent impact on production (detailed earlier in this report), the March 2015 capital raising and subsequent debt repayment and the listing on the Australian Securities Exchange there were no significant changes to the state of affairs of TPI Enterprises Ltd and its controlled entities during the year. Likely developments and expected results of operations Having purchased a site in Portugal during the year TPI is currently progressing plans to apply for expansion into active pharmaceutical ingredients (API´s). License application for Portugal API license (Stage 1 and 2) has been submitted. Equipment capable of making validation batches of all Narcotic API´s has been relocated to Portugal ready for assembly once the license is granted. Further information about likely developments in the operations of the Group and the expected results of those operations in future financial years has not been included in this report because disclosure of the information would be likely to result in unreasonable prejudice to the Group. Events since the end of the financial year Material events subsequent to the end of the year that have not been recognised in the financial statements: In January 2016, the Company extended its finance facility with Washington H. Soul Pattinson Company Ltd, a substantial shareholder to $20,000,000 to meet working capital needs predominantly associated with the seasonal nature of the purchase of raw materials (poppy crop) which is mainly harvested in the first quarter each year. No other matter or circumstance has arisen since 31 December 2015 that has significantly affected or may significantly affect: - TPI Enterprises Ltd’s operations in future financial years, or the results of those operations in future financial years, or TPI Enterprises Ltd’s state of affairs in future years.
For
per
sona
l use
onl
y

DIRECTORS’ REPORT
TPI ENTERPRISES LTD – 2015 ANNUAL REPORT 7
Dividends No dividends were paid or declared during the course of the financial year and no dividends are recommended in respect to the financial year ended 31 December 2015. Environmental regulation The Group’s operations are subject to environmental regulation under both Commonwealth and State legislation and the board is not aware of any significant breaches during the period covered by this report. Indemnification and insurance of officers and auditors During the financial year, the Company paid a premium in respect of a contract insuring the Directors and Company Secretary (as named above), and all executive officers of the Group against a liability incurred when acting in their capacity as a Director, Company Secretary or executive officer to the extent permitted by the Corporations Act 2001. Further disclosure required under section 300(9) of the Corporations Act 2001 is prohibited under the terms of the insurance contract.
Other than to the extent permitted by law, the Company has not otherwise, during or since the end of the financial year, indemnified or agreed to indemnify an officer or auditor of the Company or any other related body corporate against a liability incurred as such by an officer or auditor. Meetings of directors The number of meetings of the Company’s Directors (including committee meetings of Directors) held during the year ended 31 December 2015 and the numbers of meetings attended by each Director were:
Director Board of Directors Human Capital Committee Audit & Risk Committee
Held and Eligible to
Attend
Attended Held and Eligible to
Attend
Attended Held and Eligible to
Attend
Attended
Peter Robinson 12 12 7 7 1 1
Jarrod Ritchie1 12 12 - 6 - 1
Todd Barlow3 7 7 7 7 1 1
Ross Dobinson2 5 5 1 1 - -
1. Jarrod Ritchie was not a member of the Human Capital Committee or the Audit & Risk Committee but was invited to attend these meetings.
2. Ross Dobinson retired as a director on 18 June 2015. 3. Todd Barlow was appointed as a director on 18 June 2015.
Proceedings on behalf of the Company No person has applied to the Court under Section 237 of the Corporations Act 2001 for leave to bring proceedings on behalf of the Company, or to intervene in any proceedings to which the Company is a party, for the purpose of taking responsibility on behalf of the Company for all or part of those proceedings. No proceedings have been brought or intervened on behalf of the Company with leave of the Court under Section 237 of the Corporations Act 2001.
For
per
sona
l use
onl
y

DIRECTORS’ REPORT
TPI ENTERPRISES LTD – 2015 ANNUAL REPORT 8
Information on directors and key management personnel in office during or since the end of the financial year and to the date of this report
Name and Position
Qualifications and Experience
Shares held in TPI
Enterprises Ltd
Non-Executive Chairman Peter Robinson BCom, FAICD
Peter Robinson joined Washington H Soul Pattinson and Company Limited (WHSP) in 1978 and retired as Executive Director of this diversified investment Company at the end of March 2015. He joined the WHSP board in 1984 and has over 30 years’ experience as a public Company director. As the Executive Director of WHSP, Peter had the responsibility of managing a diverse range of investments in various industry segments including pharmaceuticals, coal mining, telecommunications, building supplies, nutraceuticals, copper and gold production and property development. Peter is also the Chairman of Australian Pharmaceutical Industries Limited and Clover Corporation Limited. He was previously a non-executive director of New Hope Corporation Limited, CopperChem Limited and Pitt Capital Partners. Director of TPI Enterprises Ltd since 1 February 2013.
84,900
Managing Director and Chief Executive Officer Jarrod Ritchie BSc (Hons)
Jarrod Ritchie has over 20 years’ experience in the opiates industry. He has led TPI from its inception as a start-up to its current position as Australia’s third licensed poppy processor with a strong international reputation. Jarrod has led new research in the opiates industry including TPI’s unique, environmentally-sustainable, solvent-free manufacturing process. He has also led the successful trialling of a new thebaine-rich variety of poppy; the introduction of commercial crops to Victoria; the trialling of poppy crops in the Northern Territory; and the expansion of TPI’s global operations to Portugal. Director of TPI Enterprises Ltd since 5 February 2004. Other Directorships of listed companies over the past three years: None.
3,099,407
Non-Executive Director Todd Barlow B.Bus/LLB (Hons)
Todd Barlow is the Managing Director and CEO of Washington H. Soul Pattinson and Company Limited and a non-executive Director of ASX listed New Hope Corporation Limited and PM Capital Asian Opportunities Fund Limited. Before joining Washington H. Soul Pattinson, he was Managing Director of Pitt Capital Partners Limited, a Sydney based corporate advisory firm. He continues to serve as a non-executive director of Pitt Capital Partners Limited as well as a number of unlisted entities. Between 2005 and 2008, Todd was based in Hong Kong and provided advice on cross-border transactions between Asia and Australia. He previously practiced as a lawyer, specialising in corporate law and mergers and acquisitions. Director of TPI Enterprises Ltd since 18 June 2015.
Nil
Former Non-Executive Chairman Ross Dobinson BBus (Acc), CA
Ross Dobinson is a former chartered accountant with experience in developing early stage technology companies. He is the managing director of TSL Group Limited, which provides commercial advisory advice to the life sciences sector. Ross has a background in investment banking and stockbroking. He was the founding director and is now Chairman of Acrux Limited. He was a Director of Starpharma Holdings Limited (ASX: SPL), former Executive Chairman of Hexima Limited which was listed on the ASX from July 2010 to June 2011, a former Director of Roc Oil Company Limited (ASX: ROC) and a former Director of Racing Victoria Limited. Director of TPI Enterprises Ltd from 12 April 2007 to 18 June 2015.
N/A
CFO and Company Secretary Roger McPherson CPA, GAICD
Roger McPherson has more than 25 years’ experience in senior finance roles in a wide variety of industries. His early career included working with a Chartered Accounting practice and two years with the Australian Taxation Office. Before joining TPI, Roger was the Chief Operating Officer (incorporating CFO and Company Secretary) at Patrys Limited (ASX: PAB). Roger has over 18 years of biotechnology and pharmaceutical experience, in addition to Patrys he also had 4 years with Cerylid Biosciences Limited as CFO and Company Secretary was part of Amrad Corporation Ltd. for 6 years in varying senior finance roles.
10,000
For
per
sona
l use
onl
y

DIRECTORS’ REPORT
TPI ENTERPRISES LTD – 2015 ANNUAL REPORT 9
REMUNERATION REPORT (Audited) The remuneration report is set out under the following main headings: A. Key management personnel B. Remuneration governance C. Principals used to determine the nature and amount of remuneration D. Details of remuneration E. Service Agreements
A) Key management personnel (KMP)
Founded in 2004, TPI is one of the world’s eight licensed suppliers of licit narcotics (specifically morphine, oripavine, codeine and thebaine) to the global pharmaceutical sector. TPI has spent the last 10 years developing its water based, solvent-free extraction process while acquiring multiple international, national, state and territory licenses. Throughout this period the CEO and the Board have set the strategy and direction of the company. The company has a fairly flat structure with 7 direct reports to the CEO, whom form the executive management team. In October 2015, Roger McPherson was appointed as Chief Financial Officer and Company Secretary, reporting to the CEO. This appointment creates an executive role responsible for guiding and directing financial strategy, in conjunction with the Board and CEO and as such the Board designated him KMP. The key management personnel are as follows: (a) Directors (i) Non-Executive Chairman
Mr. Peter Robinson (appointed as Non-Executive Chairman on 18 June 2015) Mr. Ross Dobinson (retired 18 June 2015) (ii) Managing Director and Chief Executive Officer
Mr. Jarrod Ritchie (iii) Non-Executive Directors
Mr. Todd Barlow (appointed 18 June 2015)
(b) Executives The following people were the executives with the greatest authority for the strategic direction and management of the group (“other key management personnel”) during the financial period: Mr. Roger McPherson Chief Financial Officer and Company Secretary (appointed 5 October 2015) B) Remuneration governance The Board is responsible for determining and reviewing compensation arrangements for the Directors themselves, the Non-Executive Chairman and the Executive Management team. The Board has established a Human Capital Committee, comprising of three Directors, the majority of which are Non-Executive Directors. This Committee is primarily responsible for making recommendations to the board on: the over-arching executive remuneration framework; the operation of incentive plans, including key performance indicators and performance hurdles; remuneration levels of executive directors and other key management personnel; and non-executive director fees. The objective of the Committee is to ensure that remuneration policies and structures are fair and competitive and aligned with the long-term interests of the Company. The Corporate Governance Statement provides further information on the role of this committee. C) Principles used to determine the nature and amount of remuneration The Company’s goal is to engage and promote excellence at Board level, in staff members and partner organisations. The Company looks to engage the services of individuals and organisations with the experience necessary to assist the Company in meeting its strategic objectives. The Board of Directors has determined that recurring costs associated with full time employment should be closely managed while maintaining a high level of competency in core skills in agriculture and pharmaceutical manufacturing management. The Board seeks to ensure that executive reward complies with good reward governance practices: Competitiveness and reasonableness; Acceptability to shareholders; Performance linkage; Transparency; and Capital management. The Company has structured an executive remuneration framework that is market competitive and complimentary to the reward strategy of the organisation. The Company’s remuneration framework seeks alignment with shareholders’ interests and is in particular aligned to the rapid commercialisation of the Company’s intellectual property and in achieving its milestones in a highly ethical and professional manner. The executive remuneration framework will provide a mix of fixed and variable pay and performance incentive rewards. The Company is currently developing a Short Term Incentive (STI) and Long Term Incentive (LTI) scheme. The STI will be designed to align
For
per
sona
l use
onl
y

DIRECTORS’ REPORT
TPI ENTERPRISES LTD – 2015 ANNUAL REPORT 10
the organisation around key shorter-term objectives that drive long-term shareholder value and the Board will set annual key performance indicators (KPIs) for the CEO which also serve as the Company’s objectives. The objective of other KMPs will be set accordingly. In order to implement the LTI, TPI has established an Employee Share Ownership Plan (ESOP) to assist in the motivation, retention and reward of executives and employees by aligning the interests of the employees with the interests of Shareholders. The Directors consider that the ESOP reflects industry standards for incentive plans of this kind. Full time or part time employees, contractors; and executive or non-executive directors of TPI or any of its subsidiaries are eligible to participate in the ESOP. The Executive and Non-Executive Directors of TPI are not currently permitted to participate in the ESOP as approval has not been sought from TPI’s Shareholders. During the year the Company engaged Towers Watson Australia Pty Ltd as remuneration consultants to assist the Board with a review of the salary package of the CEO and provide recommendations in respect of the STI and LTI. The Company paid $41,385 for these services. It is anticipated that the STI and LTI will be introduced in the first half of 2016. (a) Non-Executive Directors’ fees Directors’ fees are determined by reference to industry standards and were last reviewed effective 21 July 2015. Directors fees are paid in cash. A Non-Executive Directors’ Fee Pool of $700,000 has been set. Directors’ fees were set effective 21 July 2015 at $120,000 for the Chairman and $70,000 per Non-Executive Director plus statutory superannuation and reflect the demands which are made on and the responsibilities of the Directors. (b) Executive pay The executive pay and reward framework has three components: Base pay and benefits; Short term performance incentives; and Long term incentives. The combination of these comprises the executive’s total remuneration. (i) Base pay and benefits
A total employment cost package may include a combination of cash and prescribed non-financial benefits at the executive’s discretion. Executives are offered a competitive base pay that comprises the fixed component of pay and rewards. The base pay for executives is reviewed annually to ensure the executive’s pay is competitive with the market. An executive’s pay is also reviewed on promotion. There are no ongoing guaranteed base pay increases included in any executive contracts. (ii) Short term incentives (STI)
It is envisaged that incentives payable to executives will be based upon the attainment of agreed corporate and individual milestones and reviewed and approved by the Board of Directors. (iii) Long term incentives (LTI)
Executives will be issued with equity instruments as LTIs in a manner that aligns this element of remuneration with the creation of shareholder wealth. LTI grants will be made to executives who are able to influence the generation of shareholder wealth and thus have a direct impact on the creation of shareholder wealth. The Board of Directors did not issue any equity instruments to Executives during the year ended 31 December 2015. (iv) Relationship between remuneration policy and company performance
Equity instruments and STI may be issued to new employees, and upon performance review based on performance of the individual and the Company in absolute terms. Equity instruments that are issued for performance are subject to performance targets set and approved by the Human Capital Committee. The Company’s remuneration policy seeks to reward staff members for their contribution to achieving significant operational, strategic, partnering, preclinical, clinical and regulatory milestones. These milestones build sustainable and long term shareholder value. In considering the Group’s performance and benefits for shareholder value, the Human Capital Committee have regard to the following indices in respect of the current financial year and the previous four financial years.
2015 2014 2013 2012 2011
Revenue 3,679,063 8,390,395 15,487,945 9,683,256 6,406,808 Net profit/(loss) after tax (25,899,838) (14,443,973) (6,794,656) (12,362,789) (17,932,470) Closing share price $3.90 N/A N/A N/A N/A Price increase/(decrease) $ N/A N/A N/A N/A N/A Price increase/(decrease) % N/A N/A N/A N/A N/A Earnings per share (cents) (52.07) (33.30) (17.79) (39.47) (63.15)
For
per
sona
l use
onl
y

DIRECTORS’ REPORT
TPI ENTERPRISES LTD – 2015 ANNUAL REPORT 11
D) Details of remuneration Year ended 31 December 2015 Details of the remuneration of each Director of TPI and the key management personnel (KMP) of the Group are set out in the following table for the year ended 31 December 2015. As indicated above incentives are dependent upon the attainment of agreed corporate and individual milestones. 2015 Short-term employee benefits Post employment benefits Equity-based payments
Total Name Cash salary
& fees Cash Bonus
Non-monetary benefits4
Super-annuation
Termination Payments
Shares & Options
% of Total Remu-
neration $ $ $ $ $ $ $ Executive Directors Jarrod Ritchie 568,750 - 80,211 27,083 - - - 676,044
Subtotal Executive Directors 568,750 - 80,211 27,083 - -
- 676,044
Non-Executive Directors
Peter Robinson 76,697 - - 7,286 - - - 83,983 Todd Barlow1 33,323 - - 3,166 - - - 36,489 Ross Dobinson2 93,939 - - - - - - 93,939
Subtotal Non-Executive Directors
203,959
-
-
10,452
-
-
-
214,411
Total Directors 772,709 - 80,211 37,535 - - - 890,455
Other KMP Roger McPherson2 55,096 - - 8,750 - - - 63,846 Total Other KMP 55,096 - - 8,750 - - - 63,846
Total 827,805 - 80,211 46,285 - - - 954,301 1. Todd Barlow was appointed as a Non-Executive Director on 18 June 2015. 2. Ross Dobinson retired on 18 June 2015. 3. Roger McPherson was appointed on 5 October 2015. 4. Non-monetary benefits relate to accommodation, transport, school fees and other associated expenses paid whilst Mr Ritchie and
his family were temporarily relocated to Portugal for the establishment of activities in that jurisdiction.
Performance related remuneration for year ended 31 December 2015 During the year ended 31 December 2015 (2014: Nil) there was no performance related remuneration paid to the KMP.
For
per
sona
l use
onl
y

DIRECTORS’ REPORT
TPI ENTERPRISES LTD – 2015 ANNUAL REPORT 12
Year ended 31 December 2014 Details of the remuneration of each Director of TPI and the key management personnel (KMP) of the Group are set out in the following table for the year ended 31 December 2014. As indicated above incentives are dependent upon the attainment of agreed corporate and individual milestones. 2014 Short-term employee benefits Post employment benefits Equity-based payments
Total Name Cash salary
& fees Cash Bonus
Non-monetary benefits2
Super-annuation
Termination Payments
Shares & Options
% of Total Remu-
neration $ $ $ $ $ $ $ Executive Directors Jarrod Ritchie 425,000 - 357,339 25,000 - - - 807,339
Subtotal Executive Directors 425,000 - 357,339 25,000 - - 807,339
Non-Executive Directors
Peter Robinson 44,417 - - 4,166 - - - 48,583 Ross Dobinson 200,000 - - - - - - 200,000
Subtotal Non-Executive Directors
244,417
-
-
4,166
-
-
248,583
Total 669,417 - 357,339 29,166 - - - 1,055,922 1. During the 2014 year only the Board and CEO were regarded as KMP. 2. Non-monetary benefits relate to accommodation, transport, school fees and other associated expenses paid whilst Mr Ritchie and
his family were temporarily relocated to Portugal for the establishment of activities in that jurisdiction.
E) Service agreements Remuneration and other terms of employment for the Non-Executive Chairman, Managing Director and Chief Executive Officer, Non-Executive Directors and other key management personnel are formalised in service agreements. These agreements may provide for the provision of performance related cash bonuses and the award of equity in the Company. Other major provisions of the agreements relating to remuneration are set out below: Peter Robinson, Non-Executive Chairman Term of Agreement – Commencing from 1 February 2013. A new agreement became effective 21 July 2015. Director’s fee – $120,000 plus statutory superannuation per annum to be reviewed independently and annually by the Board of
Directors. Termination – No terms have been agreed. Bonus – Nil. Equity - Nil Jarrod Ritchie, Managing Director and Chief Executive Officer Term of Agreement – Commencing from 21 July 2015 and ongoing unless terminated in accordance with its terms. Base Remuneration –$800,000 per annum, subject to annual increases at the discretion of the Board of Directors. Termination – By twelve months’ notice from either side. Bonus – At the discretion of the Board of Directors. Equity – The Director shall be entitled to participate in the Employee Share Ownership Plan of the Company. Todd Barlow, Non-Executive Director Term of Agreement – Commencing from 18 June 2015. Director’s Fees - $70,000 plus statutory superannuation per annum to be reviewed independently and annually by the Board of
Directors. Termination – No terms have been agreed. Bonus – Nil. Equity – Nil.
Roger McPherson, Chief Financial Officer and Company Secretary Term of Agreement – Commencing from 5 October 2015 and ongoing unless terminated in accordance with its terms. Base Remuneration –$300,000 per annum, subject to annual increases at the discretion of the Board of Directors. Termination – By three months’ notice from either side. Bonus – At the discretion of the Board of Directors. Equity – The Executive shall be entitled to participate in the Employee Share Ownership Plan of the Company. END OF REMUNERATION REPORT (Audited)
For
per
sona
l use
onl
y

DIRECTORS’ REPORT
TPI ENTERPRISES LTD – 2015 ANNUAL REPORT 13
Non-audit services The Company may decide to employ the auditor on assignments additional to their statutory audit duties where the auditor’s expertise and experience with the Company and/or the Group are important. Details of the amount paid or payable to the auditor (KPMG) for audit and non-audit services provided during the year are set out below. The Board of Directors has considered the position and, in accordance with the advice received from the Audit & Risk Committee, is satisfied that the provision of the non-audit services is compatible with the general standard of independence for auditors imposed by the Corporations Act 2001 for the following reasons: All non-audit services have been reviewed by the Audit & Risk Committee to ensure they do not impact the impartiality and objectivity
of the auditor. None of the services undermine the general principles relating to auditor independence as set out in Professional Statement APES
110, including reviewing or auditing the auditor’s own work, acting in a management or a decision-making capacity for the Company, acting as advocate for the Company or jointly sharing economic risk and rewards.
During the year the following fees were paid or payable for services provided by the auditor of the parent entity, its related practices and non-related audit firms:
Consolidated 2015
$ 2014
$ Audit services Audit and review of financial reports and other audit work under the Corporations Act 2001 132,000 62,000 Audit and review of financial reports and other audit work for Portugal subsidiaries 18,437 11,749 Total remuneration for audit services 150,437 73,749 Other advisory services Compilation of financial statements: - 8,000 Advice on taxation and other matters and review and lodgement of corporate tax returns – Portugal subsidiaries 47,094 128,617 Total remuneration 197,531 210,366
No officers were previously partners of the audit firm KPMG. Auditor’s Independence Declaration The Lead auditor’s independence declaration is set out on page 14 and forms part of the Directors’ Report for the financial year ended 31 December 2015. Auditor KPMG continues in office in accordance with Section 327 of the Corporations Act 2001. This report is made in accordance with a resolution of the Directors.
Peter Robinson Director Sydney 29 March 2016
For
per
sona
l use
onl
y

ABCD
© 2016 KPMG, an Australian partnership and a member firm of the KPMG network of independent member firms affiliated with KPMG International Cooperative (“KPMG International”), a Swiss legal entity.
Liability limited by a scheme approved under Professional Standards Legislation.
LEAD AUDITOR’S INDEPENDENCE DECLARATION UNDER SECTION 307C OF THE CORPORATIONS ACT 2001
14
To: the directors of TPI Enterprises Limited
I declare that, to the best of my knowledge and belief, in relation to the audit for the financial year ended 31 December 2015 there has been:
(a) no contraventions of the auditor independence requirements as set out in the Corporations Act 2001 in relation to the audit; and
(b) no contraventions of any applicable code of professional conduct in relation to the audit.
KPMG
Tony Nimac Partner
Sydney
29 March 2016
For
per
sona
l use
onl
y

CORPORATE GOVERNANCE
TPI ENTERPRISES LTD – 2015 ANNUAL REPORT 15
The Board of Directors of TPI Enterprises Ltd (Board) is responsible for the corporate governance of the Company. The Board guides and monitors the business and affairs of the Company on behalf of the shareholders by whom they are elected and to whom they are accountable. The Board supports the core corporate governance principles published by the ASX Corporate Governance Council (Council). The Company’s corporate governance framework is designed to comply with the Council's principles whilst being relevant, efficient and cost effective for the current stage of the Company’s development. The Corporate Governance Statement contains certain specific information and discloses the extent to which the Company has followed the Council’s principles during the 2015 financial year. TPI's Corporate Governance Statement is structured with reference to the ASX Corporate Governance Principles and Recommendations and can be found on the “Corporate Governance” section of the TPI website at: http://tpienterprises.com/investors. The Board will continue its ongoing review process to ensure that the model is relevant, efficient and cost effective to the Company and its shareholders.
For
per
sona
l use
onl
y

TPI ENTERPRISES LTD ACN 107 872 453 STATEMENT OF PROFIT OR LOSS AND OTHER COMPREHENSIVE INCOME FOR THE YEAR ENDED 31 DECEMBER 2015
TPI ENTERPRISES LTD – 2015 ANNUAL REPORT 16
Consolidated 2015 2014
Note $ $ Revenue Sale of goods 2,064,578 7,567,242 Other income 1,614,485 823,153 5(a) 3,679,063 8,390,395 Expenses Production expenses (1,145,547) (5,169,892) Changes in inventory of finished goods (437,450) (449,035) Impairment of inventory to net realisable value (951,048) (4,742,482) Impairment of other assets (7,127,013) (3,153,714) Agricultural area trialling costs (2,237,456) - Employee benefits expenses (5,492,256) (2,918,081) Depreciation and amortisation expense (3,556,296) (1,998,551) Legal and listing expenses (1,029,163) (429,663) Travel expenses (1,239,859) (741,418) Relocation expenses (1,662,256) (869,841) Occupancy expenses (1,709,844) (671,992) Other expenses (2,211,451) (965,395) 5(b) (28,799,639) (22,110,064) Loss from operating activities
(25,120,576)
(13,719,669)
Finance income 415,082 287,441 Finance expenses (1,194,344) (1,092,325)
Net finance expenses 5(c) (779,262) (804,884) Loss before tax (25,899,838) (14,524,553) Income tax benefit 6 - 80,580 Loss for the year (25,899,838) (14,443,973) Other comprehensive income Exchange differences on translating foreign operations (112,386) - Total comprehensive loss for the year (26,012,224) (14,443,973)
Earnings per share:
Basic loss per share - from continuing operations 7 (52.07¢) (33.30¢) Diluted loss per share - from continuing operations 7 (52.07¢) (33.30¢) The above consolidated Statement of Profit or Loss and Other Comprehensive Income should be read in conjunction with the accompanying notes.
For
per
sona
l use
onl
y

TPI ENTERPRISES LTD ACN 107 872 453 STATEMENT OF FINANCIAL POSITION AS AT 31 DECEMBER 2015
TPI ENTERPRISES LTD – 2015 ANNUAL REPORT 17
Consolidated
Note
2015 $
2014 $
Current assets Cash and cash equivalents 8 568,002 565,901 Trade and other receivables 9 1,368,435 1,189,219 Inventories 10 7,722,656 5,235,750 Biological assets 11 932,958 1,196,966 Prepayments 204,481 98,818 Assets held for sale 12 - 2,231,480 Total current assets 10,796,532 10,518,134 Non-current assets Property, plant and equipment 13 28,628,592 26,277,093 Investments 14 100,673 297,659 Intangible assets 15 2,003,745 3,138,257 Total non-current assets 30,733,010 29,713,009 Total assets 41,529,542 40,231,143 Current liabilities Trade and other payables 16 5,258,406 1,213,451 Loans and borrowings 17 144,697 17,561,149 Deferred income 778,059 778,059 Employee benefits 18 622,743 438,487 Total current liabilities 6,803,905 19,991,146 Non-current liabilities Loans and borrowings 17 13,871,552 8,505,122 Employee benefits 18 226,472 133,818 Total non-current liabilities 14,098,024 8,638,940 Total liabilities 20,901,929 28,630,086 Net assets 20,627,613 11,601,057
Equity Issued capital 19 118,190,663 83,151,883 Reserves 20 1,809,543 1,921,929 Accumulated losses (99,372,593) (73,472,755) Total equity 20,627,613 11,601,057 The above consolidated Statement of Financial Position should be read in conjunction with the accompanying notes. F
or p
erso
nal u
se o
nly
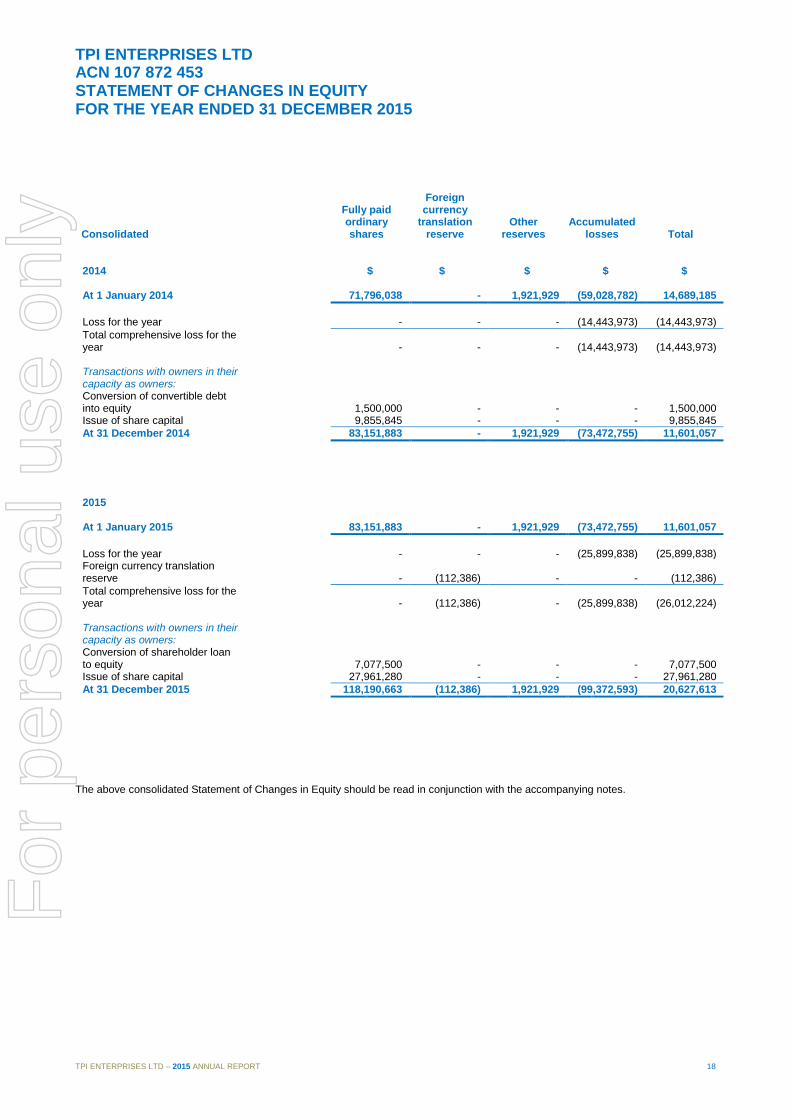
TPI ENTERPRISES LTD ACN 107 872 453 STATEMENT OF CHANGES IN EQUITY FOR THE YEAR ENDED 31 DECEMBER 2015
TPI ENTERPRISES LTD – 2015 ANNUAL REPORT 18
Consolidated
Fully paid ordinary shares
Foreign currency
translation reserve
Other reserves
Accumulated losses Total
2014 $ $ $ $ $ At 1 January 2014 71,796,038 - 1,921,929 (59,028,782) 14,689,185 Loss for the year - - - (14,443,973) (14,443,973) Total comprehensive loss for the year - - - (14,443,973) (14,443,973) Transactions with owners in their capacity as owners:
Conversion of convertible debt into equity 1,500,000 - - - 1,500,000 Issue of share capital 9,855,845 - - - 9,855,845 At 31 December 2014 83,151,883 - 1,921,929 (73,472,755) 11,601,057
2015 At 1 January 2015 83,151,883 - 1,921,929 (73,472,755) 11,601,057 Loss for the year - - - (25,899,838) (25,899,838) Foreign currency translation reserve - (112,386) - - (112,386) Total comprehensive loss for the year - (112,386) - (25,899,838) (26,012,224) Transactions with owners in their capacity as owners: Conversion of shareholder loan to equity 7,077,500 - - - 7,077,500 Issue of share capital 27,961,280 - - - 27,961,280 At 31 December 2015 118,190,663 (112,386) 1,921,929 (99,372,593) 20,627,613
The above consolidated Statement of Changes in Equity should be read in conjunction with the accompanying notes.
For
per
sona
l use
onl
y

TPI ENTERPRISES LTD ACN 107 872 453 STATEMENT OF CASH FLOWS FOR THE YEAR ENDED 31 DECEMBER 2015
TPI ENTERPRISES LTD – 2015 ANNUAL REPORT 19
Consolidated
Note
2015 $
2014 $
Cash flows from operating activities Cash receipts from customers 2,542,650 9,800,529 Cash payments to employees and suppliers (18,156,538) (16,012,530) Cash receipts from government grants 995,730 267,573 Other cash receipts 383,326 553,795 Cash used in operating activities (14,234,832) (5,390,633) Interest received 101,098 38,533 Finance costs paid (1,384,373) (902,296) Net cash used in operating activities 22 (15,518,107) (6,254,396) Cash flows from investing activities Payment for property, plant and equipment (9,909,855) (2,586,204) Payment for intangible assets (460,747) (1,343,039) Proceeds from disposal of property, plant and equipment 2,291,581 - Proceeds from disposal of investments 250,139 - Net cash used in investing activities (7,828,882) (3,929,243) Cash flows from financing activities Proceeds from issue of shares 27,961,280 9,855,845 Proceeds from borrowings 10,638,028 635,864 Repayment of borrowings (15,420,520) - Net cash from financing activities 23,178,788 10,491,709 Net increase/(decrease) in cash and cash equivalents (168,201) 308,070 Effects of exchange rate changes on the balance of assets held in foreign currencies 170,302 - Cash and cash equivalent at beginning of year 565,901 257,831 Cash and cash equivalents at end of year 8 568,002 565,901 The above consolidated Statement of Cash Flows should be read in conjunction with the accompanying notes.
For
per
sona
l use
onl
y

TPI ENTERPRISES LTD ACN 107 872 453 NOTES TO THE FINANCIAL STATEMENTS FOR THE YEAR ENDED 31 DECEMBER 2015
TPI ENTERPRISES LTD – 2015 ANNUAL REPORT 20
NOTE 1: REPORTING ENTITY The financial report covers TPI Enterprises Ltd (“TPI” or “Company”), as a consolidated entity consisting of TPI and the entities it controlled at the end of or during the year (“Group”). TPI is a listed public company limited by shares (ASX: TPE), incorporated and domiciled in Australia. The Company’s registered office is at Level 1, 333 Collins Street, Melbourne VIC 3000. The Group is primarily involved in manufacturing and supplying alkaloids to international markets utilising the Group’s technology for solvent free extraction of alkaloids from opium poppies. The Group is a for-profit entity. The financial report was authorised for issue by the Board of Directors of TPI on the date shown on the Declaration by Directors attached to the Financial Statements. NOTE 2: BASIS OF PREPARATION (a) Statement of compliance The consolidated financial statements are general purpose financial statements which have been prepared in accordance with Australian Accounting Standards (AASBs) adopted by the Australian Accounting Standards Board (AASB) and the Corporations Act 2001. The consolidated financial statements comply with International Financial Reporting Standards (IFRSs) adopted by the International Accounting Standards Board (IASB). (b) Basis of measurement The consolidated financial statements have been prepared on the historical cost basis. (c) Functional and presentation currency These consolidated financial statements are presented in Australian dollars, which is the Group’s functional currency. (d) Use of estimates and judgements The preparation of consolidated financial statements in conformity with AASBs requires management to make judgements, estimates and assumptions that affect the application of accounting policies and the reported amounts of assets, liabilities, income and expenses. Actual results may differ from these estimates. Estimates and underlying assumptions are reviewed on an ongoing basis. Revisions to accounting estimates are recognised in the period in which the estimates are revised and in any future periods affected. Assumptions and estimation uncertainties Information about assumptions and estimation uncertainties that have a significant risk of resulting in a material adjustment in the year ending 31 December 2015 is included in the following notes: Notes 13 and 15 – impairment test: key assumptions underlying recoverable amounts of property, plant and equipment and intangible assets. Measurement of fair values A number of the Group’s accounting policies and disclosures require the measurement of fair values for both financial and non-financial assets and liabilities. When measuring the fair value of an asset or a liability, the Group uses observable market data as far as possible. Fair values are categorised into different levels in a fair value hierarchy based on the inputs used in the valuation techniques as follows.
• Level 1: quoted prices (unadjusted) in active markets for identical assets or liabilities. • Level 2: inputs other than quoted prices in Level 1 that are observable for the asset or liability, either directly (i.e. as prices) or
indirectly (i.e. derived from prices). • Level 3: inputs for the asset or liability that are not based on observable market date (unobservable inputs).
If the inputs used to measure the fair value of an asset or a liability fall into different levels of the fair value hierarchy, then the fair value measurement is categorised in its entirety in the same level of the fair value hierarchy as the lowest level input that is significant to the entire measurement. The Group recognises transfers between levels of the fair value hierarchy at the end of the reporting period during which the change has occurred.
For
per
sona
l use
onl
y

TPI ENTERPRISES LTD ACN 107 872 453 NOTES TO THE FINANCIAL STATEMENTS FOR THE YEAR ENDED 31 DECEMBER 2015
TPI ENTERPRISES LTD – 2015 ANNUAL REPORT 21
(e) Principles of consolidation The consolidated financial statements incorporate the assets and liabilities of all subsidiaries of TPI as at 31 December 2015 and the results of all subsidiaries for the year then ended. Subsidiaries are all those companies over which the Group has the power to govern the financial and operating policies, generally accompanying a shareholding of more than one-half of the voting rights. The existence and effect of potential voting rights that are currently exercisable or convertible are considered when assessing whether the Group controls another entity. The financial statements of subsidiaries are included in the consolidated financial statements from the date that control commences until the date control eases. Intercompany transactions, balances and unrealised gains on transactions between Group companies are eliminated. Unrealised losses are also eliminated unless the transaction provides evidence of the impairment of the asset transferred. Accounting policies of subsidiaries are consistent with the policies adopted by the Group. (f) Parent entity financial information The financial information for the parent entity, TPI Enterprises Limited, disclosed in Note 27, has been prepared on the same basis as the consolidated financial statements, except for investments in subsidiaries. Investments in subsidiaries are accounted for at cost in the financial statements of TPI Enterprises Limited. (g) Going concern The consolidated preliminary financial statements have been prepared on a going concern basis, which assumes that the Group will be able to continue trading, realise its assets and discharge its liabilities in the ordinary course of business for a period of at least 12 months from the date that these financial statements are approved. The Directors note the following events and conditions which have been considered in assessing the appropriateness of the going concern assumption:
• For the year ended 31 December 2015 the Group generated a loss after income tax of $25,899,838 (2014: $14,443,973) and had cash outflows from operations of $15,518,107 (2014: $6,254,396) predominantly due to the cessation of production and sales whilst the Group’s manufacturing equipment was being relocated from Tasmania to Victoria.
• As at 31 December 2015 the Group’s current assets exceeded its current liabilities by $3,992,627 (31 December 2014: current liabilities exceed its current assets by $9,473,012). The significant improvement in the working capital position is due to the Group successfully raising $36,500,000 of new equity from existing shareholders and new investors to allow it to:
o repay the Group’s debt obligations with Rabobank; o repay a short-term loan facility with a significant shareholder, Washington H. Soul Pattinson and Group Limited; o meet costs associated with the relocation of its manufacturing facility to Victoria; o purchase a manufacturing facility in Portugal; and o meet ongoing working capital requirements.
• Subsequent to balance date, the Group has continued to record operating losses after income tax. Management are also forecasting a working capital deficiency during the 2016 calendar year due to the cyclical nature of the Group’s business with increasing farmer payments and further operating expenses being recorded prior to the positive impact of customer receipts.
• To facilitate the Group’s immediate working capital requirements, the Group has a standby debt facility in place with Washington H. Soul Pattinson Company Ltd, a substantial shareholder. The Directors expect that this standby debt facility will provide the Group with sufficient funds to be able to meet its obligations for a period of at least 12 months from the date that these financial statements are approved. The facility has a limit of $20,000,000 and expires on 31 March 2017. The Directors acknowledge that the facility expires approximately 12 months after the expected signing date of the financial statements and prima facie that an apparent refinancing risk exists at 31 March 2017.
• The Directors’ confidence in the continuing support from existing shareholders and ability to attract new investors and debt providers to fund the Group’s future finance requirements, if required, as demonstrated by previous capital and debt raisings.
• The Directors’ confidence over the plans, cash flow and profit and loss forecasts prepared by management to achieve its 2016 calendar year forecast and ultimately lead to a positive EBITDA position and achieve profitability and positive operating cash flows in the medium-term. These plans, which are advancing, involve: - ongoing production at the new facility with sales increasing as the new facility is validated by existing and potential
customers following the commencement of production and sales in December 2015; - access to a more definite supply of raw material through geographic diversification (i.e. the growing of raw material in more
Australian states and territories as well as in Portugal with potentially some importation of raw material from other regulated countries) to enable it to increase raw material volumes and accordingly production volumes in order to achieve profitable operations;
- the expansion of the Group’s product range and customer base; and - the realisation of the cost optimisation programs following the commencement of manufacturing operations in Victoria.
After considering the above factors, the Directors have concluded that the use of the going concern assumption is appropriate.
For
per
sona
l use
onl
y

TPI ENTERPRISES LTD ACN 107 872 453 NOTES TO THE FINANCIAL STATEMENTS FOR THE YEAR ENDED 31 DECEMBER 2015
TPI ENTERPRISES LTD – 2015 ANNUAL REPORT 22
NOTE 3: SIGNIFICANT ACCOUNTING POLICIES The accounting policies set out below have been applied consistently to all periods presented in these consolidated financial statements. (a) Foreign currency Transactions in foreign currencies are translated to the functional currency of the Group at exchange rates at the dates of the transactions. Monetary assets and liabilities denominated in foreign currencies at the reporting date are retranslated to the functional currency at the exchange rate at that date. The foreign currency gain or loss on monetary items is the difference between amortised cost in the functional currency at the beginning of the period, adjusted for effective interest and payments during the period, and the amortised cost in foreign currency translated at the exchange rate at the end of the year. Non-monetary assets and liabilities denominated in foreign currencies that are measured at fair value are retranslated to the functional currency at the exchange rate at the date that the fair value was determined. Non-monetary items in a foreign currency that are measured in terms of historical cost are translated using the exchange rate at the date of the transaction. Foreign currency differences arising on retranslation are recognised in statement of comprehensive income as either finance income or finance cost (see Note 3(n)). (b) Financial instruments Non-derivative financial assets The Group initially recognises loans and receivables on the date that they are originated. All other financial assets (including assets designated at fair value through profit or loss) are recognised initially on the trade date at which the Group becomes a party to the contractual provisions of the instrument. The Group derecognises a financial asset when the contractual rights to the cash flows from the asset expire, or it transfers the rights to receive the contractual cash flows on the financial asset in a transaction in which substantially all the risks and rewards of ownership of the financial asset are transferred. Any interest in transferred financial assets that is created or retained by the Group is recognised as a separate asset or liability. Financial assets and liabilities are offset and the net amount presented in the statement of financial position when, and only when, the Group has a legal right to offset the amounts and intends either to settle on a net basis or to realise the asset and settle the liability simultaneously. Loans and receivables Loans and receivables are financial assets with fixed or determinable payments that are not quoted in an active market. Such assets are recognised initially at fair value plus any directly attributable transaction costs. Subsequent to initial recognition loans and receivables are measured at amortised cost using the effective interest method, less any impairment losses (see Note 3(i)). Cash and cash equivalents Cash and cash equivalents comprise cash balances and call deposits with original maturities of three months or less from the acquisition date that are subject to an insignificant risk of changes in their fair value, and are used by the Group in the management of its short-term commitments. Non-derivative financial liabilities The Group initially recognised debt securities issued and subordinated liabilities on the date that they are originated. All other financial liabilities (including liabilities designated at fair value through profit or loss) are recognised initially on the trade date at which the Group becomes a party to the contractual provisions of the instrument. The Group derecognises a financial liability when its contractual obligations are discharged or cancelled or expire. The Group classifies non-derivative financial liabilities into the other financial liabilities category. Such financial liabilities are recognised initially at fair value less any directly attributable transaction costs. Subsequent to initial recognition, these financial liabilities are measured at amortised cost using the effective interest rate method. Other financial liabilities comprise loans and borrowings and trade and other payables. Compound financial instruments Compound financial instruments issued by the Group comprise convertible debt that can be converted to share capital at the option of the holder and the number of shares to be issued is fixed. The liability component of a compound financial instrument is recognised initially at the fair value of a similar liability that does not have an equity conversion option using a market interest rate. The equity component is recognised initially at the difference between the fair value of the compound financial instrument as a whole and the fair value of the liability component. Any directly attributable transaction costs are allocated to the liability and equity components in proportion to their initial carrying amounts. Subsequent to initial recognition, the liability component of a compound financial instrument is measured at amortised cost using the effective interest method. The equity component of a compound financial instrument is not remeasured subsequent to initial recognition. Interest related to the financial liability is recognised in profit or loss. On conversion the financial liability is reclassified to equity and no gain or loss is recognised. Share capital - Ordinary shares Ordinary shares are classified as equity. Incremental costs directly attributable to the issue of ordinary shares and share options are recognised as a deduction from equity, net of any tax effects.
For
per
sona
l use
onl
y

TPI ENTERPRISES LTD ACN 107 872 453 NOTES TO THE FINANCIAL STATEMENTS FOR THE YEAR ENDED 31 DECEMBER 2015
TPI ENTERPRISES LTD – 2015 ANNUAL REPORT 23
(c) Biological assets Biological assets primarily comprise poppy crops planted by the Group which have yet to be harvested and are recorded at cost. Crops are not measured at fair value, reflecting the absence of an active market. Certain types of plants are expected to provide crop yields in more than one season or reporting period. In these cases, the cost of planting and establishment of the plants is amortised on a straight line basis over the expected productive life of the plants. (d) Inventories Inventories are measured at the lower of cost and net realisable value. The cost of inventories is based on the first-in first-out principle, and includes expenditure incurred in acquiring the inventories, production or conversion costs and other costs incurred in bringing them to their existing location and condition. In the case of manufactured inventories and work in progress, cost includes an appropriate share of production overheads based on normal operating capacity. Net realisable value is the estimated selling price in the ordinary course of business, less the estimated costs of completion and selling expenses. The cost of poppy crops is transferred from biological assets at cost at point of harvest. (e) Assets held for sale Non-current assets, or disposal groups comprising assets and liabilities, are classified as held-for-sale if it is highly probable that they will be recovered primarily through sale rather than through continuing use. Such assets, or disposals group, are generally measured at lower of their carrying amount and fair value less costs to sell. Any impairment loss on a disposal group is allocated first to goodwill and then the remaining assets and liabilities on a pro rata basis, except that no loss is allocated to inventories, financial assets, employee benefit assets, investment property or biological assets, which continue to be measured in accordance with the Group’s other accounting policies. Impairment losses on initial classification as held-for-sale or held-for-distribution and subsequent gains and losses on remeasurement are recognised in profit or loss. Once classified as held-for-sale, intangible assets and property, plant and equipment are no longer amortised or depreciated, and any equity-accounted investee is no longer equity accounted. (f) Property, plant and equipment Recognition and measurement Items of property, plant and equipment are measured at cost less accumulated depreciation and accumulated impairment losses. Cost includes expenditure that is directly attributable to the acquisition of the asset. The cost of self-constructed assets includes the following:
• the cost of materials and direct labour, • any other costs directly attributable to bringing the assets to a working condition for their intended use, • when the Group has an obligation to remove the assets or restore the site, an estimate of the costs of dismantling and removing
the items and restoring the site on which they are located, and • capitalised borrowing costs.
Purchased software that is integral to the functionality of the related equipment is capitalised as part of that equipment. When parts of an item of property, plant and equipment have different useful lives, they are accounted for as separate items (major components) of property, plant and equipment. Any gains and losses on disposal of an item of property, plant and equipment (calculated as the difference between the net proceeds from disposal and the carrying amount of the item) is recognised in profit or loss. Subsequent costs Subsequent expenditure is capitalised only when it is probable that the future economic benefits associated with the expenditure will flow to the Group. Ongoing repairs and maintenance is expensed as incurred. Depreciation Items of property, plant and equipment are depreciated on a straight-line basis in profit or loss over the estimated useful lives of each component. Leased assets are depreciated over the shorter of the lease term and their useful lives unless it is reasonably certain that the Group will obtain ownership by the end of the lease term. Land is not depreciated. Items of property, plant and equipment are depreciated from the date that they are installed and are ready for use, or in respect of internally constructed assets, from the date that the asset is completed and ready for use. The estimated useful lives for the current and comparative years of significant items of property, plant and equipment are as follows:
• land and buildings 40 years • farming plant and equipment 5 – 20 years • manufacturing plant and equipment 3 – 25 years • motor vehicles 8 years • office equipment 2 – 7 years
Depreciation methods, useful lives and residual values are reviewed at each financial year-end and adjusted if appropriate.
For
per
sona
l use
onl
y

TPI ENTERPRISES LTD ACN 107 872 453 NOTES TO THE FINANCIAL STATEMENTS FOR THE YEAR ENDED 31 DECEMBER 2015
TPI ENTERPRISES LTD – 2015 ANNUAL REPORT 24
(g) Investments Details of shares in controlled entities are disclosed at Note 26(a). Controlled entities are accounted for in the consolidated accounts as set out in the Note 2(e). (h) Intangible assets Research and development Expenditure on research activities, undertaken with the prospect of gaining new scientific or technical knowledge and understanding, is recognised in profit or loss as incurred. Development activities involve a plan or design for the production of new or substantially improved products and processes. Development expenditure is capitalised only if development costs can be measured reliably, the product or process is technically and commercially feasible, future economic benefits are probable, and the Group intends to and has sufficient resources to complete development and to use or sell the asset. The expenditure capitalised includes the cost of materials, direct labour, overhead costs and external costs that are directly attributable to preparing the asset for its intended use, and capitalised borrowing costs. Other development expenditure is recognised in profit or loss as incurred. Capitalised development expenditure is measured at cost less accumulated amortisation and accumulated impairment losses. Patents and trademarks Other intangible assets that are acquired by the Group and have finite useful lives are measured at cost less accumulated amortisation and accumulated impairment losses. Irrigation rights Irrigation rights and payments for similar entitlements to draw on natural resources are initially recorded at cost. Where the rights are granted in perpetuity, it is deemed that the asset has an indefinite life, and accordingly, no amortisation is recorded against the asset. Intangible assets not amortised are subject to annual impairment testing. Subsequent expenditure Subsequent expenditure is capitalised only when it increases the future economic benefits embodied in the specific asset to which it relates. All other expenditure, including expenditure on internally generated goodwill and brands, is recognised in profit or loss as incurred. Amortisation Intangible assets are amortised on a straight-line basis in profit or loss over their estimated useful lives, from the date that they are available for use. The estimated useful lives for the current and comparative years are as follows:
• patents and trademarks 3 – 5 years • capitalised development costs 2 – 5 years
Amortisation methods, useful lives and residual values are reviewed at each financial year-end and adjusted if appropriate. (i) Impairment Non-derivative financial assets A financial asset not carried at fair value through profit or loss is assessed at each reporting date to determine whether there is objective evidence that it is impaired. A financial asset is impaired if there is objective evidence of impairment as a result of one or more events that occurred after the initial recognition of the asset, and that the loss event(s) had an impact on the estimated future cash flows of that asset that can be estimated reliably. Objective evidence that financial assets are impaired includes default or delinquency by a debtor, restructuring of an amount due to the Group on terms that the Group would not consider otherwise, indications that a debtor or issuer will enter bankruptcy, the disappearance of an active market for a security. In addition, for an investment in an equity security, a significant or prolonged decline in its fair value below its cost is objective evidence of impairment. Non-financial assets The carrying amounts of the Group’s non-financial assets, other than biological assets, inventories and deferred tax assets, are reviewed at each reporting date to determine whether there is any indication of impairment. If any such indication exists, then the asset’s recoverable amount is estimated. Indefinite life intangible assets are tested annually for impairment. An impairment loss is recognised if the carrying amount of an asset or its related cash-generating unit (CGU) exceeds its recoverable amount. The recoverable amount of an asset or CGU unit is the greater of its value in use and its fair value less costs to sell. In assessing value in use, the estimated future cash flows are discounted to their present value using a pre-tax discount rate that reflects current market assessments of the time value of money and the risks specific to the asset. For the purpose of impairment testing, assets that cannot be tested individually are grouped together into the smallest group of assets that generates cash inflows from continuing use that are largely independent of the cash inflows of other assets or CGUs. Subject to an operating segment ceiling test, CGUs to which goodwill has been allocated are aggregated so that the level at which impairment is tested reflects the lowest level at which goodwill is monitored for internal reporting purposes. Impairment losses are recognised in profit or loss. Impairment losses recognised in respect of CGUs are allocated first to reduce the carrying amount of any goodwill allocated to the CGU (or group of CGUs), and then to reduce the carrying amounts of the other assets in the CGU (or group of CGUs) on a pro rata basis.
For
per
sona
l use
onl
y
TPI ENTERPRISES LTD ACN 107 872 453 NOTES TO THE FINANCIAL STATEMENTS FOR THE YEAR ENDED 31 DECEMBER 2015
TPI ENTERPRISES LTD – 2015 ANNUAL REPORT 25
An impairment loss is reversed only to the extent that the asset’s carrying amount does not exceed the carrying amount that would have been determined, net of depreciation or amortisation, if no impairment loss had been recognised. (j) Employee benefits Defined contribution plans A defined contribution plan is a post-employment benefit plan under which an entity pays fixed contributions into a separate entity and will have no legal or constructive obligation to pay further amounts. Obligations for contributions to defined contribution plans are recognised as an employee benefit expense in profit or loss in the periods during which services are rendered by employees. Prepaid contributions are recognised as an asset to the extent that a cash refund or a reduction in future payments is available. Contributions to a defined contribution plan that are due more than 12 months after the end of the period in which the employees render the service are discounted to their present value. Short-term employee benefits Short-term employee benefit obligations including salaries and wages, annual leave and long service leave expected to be settled within 12 months of the reporting date are measured on an undiscounted basis and are expensed as the related service is provided. A liability is recognised for the amount expected to be paid under short-term cash bonus or profit-sharing plans if the Group has a present legal or constructive obligation to pay this amount as a result of past service provided by the employee and the obligation can be estimated reliably. Long term obligations The Group’s obligation in respect of long service leave is the amount of future benefit that employees have earned in return for their service in the current and prior periods. That liability is measured as the present value of expected future payments to be made in respect of the services provided by employees up to the end of the reporting period. Consideration is given to expected future wage and salary levels, experience of employee departures and periods of service. Expected future payments are discounted using market yields at the end of the reporting period on national government bonds with terms to maturity that match, as closely as possible, the estimated future cash outflows. The obligations are presented as a current liability in the balance sheet if the Group does not have an unconditional right to defer settlement for at least twelve months after the reporting date, regardless of when the actual settlement is expected to occur. (k) Provisions A provision is recognised if, as a result of a past event, the Group has a present legal or constructive obligation that can be estimated reliably, and it is probable that an outflow of economic benefits will be required to settle the obligation. Provisions are determined by discounting the expected future cash flows at a pre-tax rate that reflects current market assessments of the time value of money and the risks specific to the liability. The unwinding of the discount is recognised as a finance cost. (l) Leases Determining whether an arrangement contains a lease At inception of an arrangement, the Group determines whether the arrangement is or contains a lease. At inception or on reassessment of an arrangement that contains a lease, the Group separates payments and other consideration required by the arrangement into those for the lease and those for other elements on the basis of their relative fair values. If the Group concludes for a finance lease that it is impracticable to separate the payments reliably, then an asset and a liability are recognised at an amount equal to the fair value of the underlying asset; subsequently, the liability is reduced as payments are made and an imputed finance cost on the liability is recognised using the Group’s incremental borrowing rate. Leased assets Assets held by the Group under leases that transfer to the Group substantially all of the risks and rewards of ownership are classified as finance leases. The leased assets are measured initially at an amount equal to the lower of their fair value and the present value of the minimum lease payments. Subsequent to initial recognition, the assets are accounted for in accordance with the accounting policy applicable to that asset. Assets held under other leases are classified as operating leases and are not recognised in the Group’s statement of financial position. Lease payments Payments made under operating leases are recognised in profit or loss on a straight-line basis over the term of the lease. Lease incentives received are recognised as an integral part of the total lease expense, over the term of the lease. Minimum lease payments made under finance leases are apportioned between the finance expense and the reduction of the outstanding liability. The finance expense is allocated to each period during the lease term so as to produce a constant periodic rate of interest on the remaining balance of the liability. (m) Revenue Goods sold Revenue from the sale of goods in the course of ordinary activities is measured at the fair value of the consideration received or receivable, net of returns, trade discounts and volume rebates. Revenue is recognised when persuasive evidence exists, usually in the form of an executed sales agreement, that the significant risks and rewards of ownership have been transferred to the buyer, recovery of the consideration is probable, the associated costs and possible return of goods can be estimated reliably, there is no continuing management involvement with the goods, and the amount of revenue can be measured reliably. If it is probable that discounts will be granted and the amount can be measured reliably, then the discount is recognised as a reduction of revenue as the sales are recognised.
For
per
sona
l use
onl
y

TPI ENTERPRISES LTD ACN 107 872 453 NOTES TO THE FINANCIAL STATEMENTS FOR THE YEAR ENDED 31 DECEMBER 2015
TPI ENTERPRISES LTD – 2015 ANNUAL REPORT 26
The timing of the transfers of risks and rewards varies depending on the individual terms of the contract of sale. For sales of alkaloid and seed products, transfer usually occurs when the product is received at the customer’s warehouse. Where cash consideration has been received but revenue recognition criteria have not been met, such amounts have been recorded on the statement of financial position as deferred income. Government grants An unconditional government grant is recognised in profit or loss as other income when the grant becomes receivable. (n) Finance income and finance costs Finance income comprises interest income on funds invested. Interest income is recognised as it accrues in profit or loss, using the effective interest method. Finance costs comprise interest expense on borrowings. Borrowing costs that are not directly attributable to the acquisition, construction or production of a qualifying asset are recognised in profit or loss using the effective interest method. Foreign currency gains and losses are reported on a net basis as either finance income or finance cost depending on whether foreign currency movements are in a net gain or net loss position. (o) Tax Tax expense comprises current and deferred tax. Current and deferred taxes are recognised in profit or loss except to the extent that it relates to a business combination, or items recognised directly in equity or in other comprehensive income. Current tax is the expected tax payable or receivable on the taxable income or loss for the year, using tax rates enacted or substantively enacted at the reporting date, and any adjustment to tax payable in respect of previous years. Current tax payable also includes any tax liability arising from the declaration of dividends. Deferred tax is recognised in respect of temporary differences between the carrying amounts of assets and liabilities for financial reporting purposes and the amounts used for taxation purposes. Deferred tax is not recognised for:
• temporary differences on the initial recognition of assets or liabilities in a transaction that is not a business combination and that affects neither accounting nor taxable profit or loss,
• temporary differences related to investments in subsidiaries and associates and jointly controlled entities to the extent that it is probable that they will not reverse in the foreseeable future, and
• taxable temporary differences arising on the initial recognition of goodwill.
Deferred tax is measured at the tax rates that are expected to be applied to temporary differences when they reverse, using tax rates enacted or substantively enacted at the reporting date. In determining the amount of current and deferred tax the Group takes into account the impact of uncertain tax positions and whether additional taxes and interest may be due. The Group believes that its accruals for tax liabilities are adequate for all open tax years based on its assessment of many factors, including interpretations of tax law and prior experience. This assessment relies on estimates and assumptions and may involve a series of judgements about future events. New information may become available that causes the Group to change its judgement regarding the adequacy of existing tax liabilities; such changes to tax liabilities will impact tax expense in the period that such a determination is made. Deferred tax assets and liabilities are offset if there is a legally enforceable right to offset current tax liabilities and assets, and they relate to income taxes levied by the same tax authority on the same taxable entity, or on different tax entities, but they intend to settle current tax liabilities and assets on a net basis or their tax assets and liabilities will be realised simultaneously. A deferred tax asset is recognised for unused tax losses, tax credits and deductible temporary differences, to the extent that it is probable that future taxable profits will be available against which they can be utilised. Deferred tax assets are reviewed at each reporting date and are reduced to the extent that it is no longer probable that the related tax benefit will be realised. Additional income tax expenses that arise from the distribution of cash dividends are recognised at the same time that the liability to pay the related dividend is recognised. The Group does not distribute non-cash assets as dividends to its shareholders. (p) Goods and services tax Revenue, expenses and assets are recognised net of the amount of goods and services tax (GST), except where the amount of GST incurred is not recoverable from the taxation authority. In these circumstances, the GST is recognised as part of the cost of acquisition of the asset or as part of the expense. Receivables and payables are stated with the amount of GST included. The net amount of GST recoverable from, or payable to, the Taxation Authority is included as a current asset or liability in the balance sheet. Cash flows are included in the statement of cash flows on a gross basis. The GST components of cash flows arising from investing and financing activities which are recoverable from, or payable to, the ATO are classified as operating cash flows.
For
per
sona
l use
onl
y

TPI ENTERPRISES LTD ACN 107 872 453 NOTES TO THE FINANCIAL STATEMENTS FOR THE YEAR ENDED 31 DECEMBER 2015
TPI ENTERPRISES LTD – 2015 ANNUAL REPORT 27
(q) New accounting standards for application in future periods A number of new standards and amendments to standards are effective for annual periods beginning after 1 January 2015 and earlier application is permitted; however, the Group has not applied to early adopt the following new or amended standards in preparing these consolidated financial statements. IFRS 9 Financial Instruments, published in July 2014, replaces the existing guidance in IAS 39 Financial Instruments: Recognition and Measurement. IFRS 9 includes revised guidance on the classification and measurement of financial instruments, including a new expected credit loss model for calculating impairment on financial assets, and the new general hedge accounting requirements. It also carries forward the guidance on recognition and derecognition of financial instruments from IAS 39. IFRS 9 is effective for annual reporting periods beginning on or after 1 January 2018, with early adoption permitted. The Group is assessing the potential impact on its consolidated financial statements resulting from the application of IFRS 9 IFRS 15 Revenue Contracts with Customers establishes a comprehensive framework for determining whether, how much and when revenue is recognised. It replaces existing revenue recognition guidance, including IAS 18 Revenue, IAS 11 Construction Contracts and IFRIC 13 Customer Loyalty Programmes. IFRS 15 is effective for annual reporting periods beginning on or after 1 January 2017, with early adoption permitted. The Group is assessing the potential impact on its consolidated financial statements resulting from the application of IFRS 15 Agriculture: Bearer Plants (Amendments to IAS 16 and IAS 41). These amendments require a bearer plant, defined as a living plant, to be accounted for as property, plant and equipment and included in the scope of IAS 16 Property, Plant and Equipment, instead of IAS 41 Agriculture. The amendments are effective for annual reporting periods beginning on or after 1 January 2016, with early adoption permitted. The Group does not have any bearer plants The following new or amended standards are not expected to have a significant impact of the Group’s consolidated financial statements.
• IFRS 14 Regulatory Deferral Accounts; • Accounting for Acquisitions of Interests in Joint Operations (Amendments to IFRS 11); • Clarification of Acceptable Methods of Depreciation and Amortisation (Amendments to IAS 16 and IAS 38); • Equity Method in Separate Financial Statements (Amendments to IAS 27); • Sale or Contribution of Assets between an Investor and its Associate or Joint Venture (Amendments to IFRS 10 and IAS 28); • Annual Improvements to IFRSs 2012-2014 Cycle – various standards; • Investment Entities: Applying the Consolidation Exception (Amendments to IFRS 10, IFRS 12 and IAS 28); and • Disclosure Initiative (Amendments to IAS 1).
(r) Earnings per share Basic earnings per share Basic earnings per share is calculated by dividing the profit/(loss) attributable to equity holders of the Company, excluding any costs of servicing equity other than ordinary shares, by the weighted average number of ordinary shares outstanding during the financial year, adjusted for bonus elements in ordinary shares issued during the year. Refer to Note 7 for further details. Diluted earnings per share Diluted earnings per share adjusts the figures used in the determination of basic earnings per share to take into account the after income tax effect of interest and other financing costs associated with dilutive potential ordinary shares and the weighted average number of additional ordinary shares that would have been outstanding assuming the conversion of all dilutive potential ordinary shares. Refer to Note 7 for further details. (s) Operating segments Operating segments are presented using the 'management approach', where the information presented is on the same basis as the internal reports provided to the Chief Operating Decision Makers ('CODM'). The CODM is responsible for the allocation of resources to operating segments and assessing their performance.
For
per
sona
l use
onl
y

TPI ENTERPRISES LTD ACN 107 872 453 NOTES TO THE FINANCIAL STATEMENTS FOR THE YEAR ENDED 31 DECEMBER 2015
TPI ENTERPRISES LTD – 2015 ANNUAL REPORT 28
(t) Comparative figures Certain comparative amounts in the financial statements have been reclassified to conform with the current year's financial statement presentation. The key changes include: Consolidated statement of profit or loss and comprehensive income During the period, the analysis of expenses has changed to provide further detail, as the Group considers that this change provides information that is more reliable and relevant.
Previously Reported Currently Reported 2014 2014
$ $ Revenue Sale of goods 7,567,242 7,567,242 Other income 823,153 823,153 8,390,395 8,390,395 Expenses Production expenses (5,169,892) (5,169,892) Changes in inventory of finished goods (449,035) (449,035) Impairment of inventory to net realisable value (4,742,482) (4,742,482) Impairment of other assets (3,153,714) (3,153,714) Employee benefits expenses (2,829,630) (2,918,081) Depreciation and amortisation expense (1,998,551) (1,998,551) Legal and listing expenses (386,096) (429,663) Travel expenses (741,418) (741,418) Relocation expenses (1,627,540) (869,841) Occupancy expenses - (671,992) Other expenses (1,011,706) (965,395) (22,110,064) (22,110,064) Loss from operating activities
(13,719,669)
(13,719,669)
NOTE 4: SEGMENT INFORMATION The Group operates through one segment to supply narcotic raw materials (predominately morphine and thebaine) to the active pharmaceutical ingredient sector. The financial results from this segment are consistent with the financial statements for the Group as a whole. Geographic information The geographic information below analyses the Group’s revenue and non-current assets by the Company’s country of domicile and other countries. In presenting the geographic information, segment revenue has been based on the geographic location of customers and segment assets were based on the geographic location of the assets.
Revenue Consolidated 2015
$ 2014
$ Europe 1,868,912 4,260,928 Other regions 195,666 3,306,314 2,064,578 7,567,242
Non-current assets Consolidated 2015
$ 2014
$ Australia 27,750,876 29,062,293 Europe 2,982,134 650,716 30,733,010 29,713,009
For
per
sona
l use
onl
y

TPI ENTERPRISES LTD ACN 107 872 453 NOTES TO THE FINANCIAL STATEMENTS FOR THE YEAR ENDED 31 DECEMBER 2015
TPI ENTERPRISES LTD – 2015 ANNUAL REPORT 29
NOTE 5: REVENUE AND EXPENSES FROM CONTINUING OPERATIONS Consolidated
2015 $
2014 $
(a) Revenue Sale of goods 2,064,578 7,567,242 Government grants 1,047,034 267,573 Other 567,451 555,580 Total revenue from continuing operations 3,679,063 8,390,395
(b) Expenses Employee salary and benefit expenses: Salaries and wages 4,465,153 2,344,948 Other associated personnel expenses 515,211 279,952 Defined contribution superannuation expenses 234,982 180,520 Increase in liability for long service leave 111,561 41,182 Increase in liability for annual leave 165,349 71,479 Total employee salary and benefit expenses 5,492,256 2,918,081
Other personnel expenses relating to employees involved in the production process have been included in ‘production expenses’ and ‘relocation expenses’ in the consolidated statement of profit or loss and other comprehensive income.
Depreciation expense Buildings 267,450 186,120 Farm equipment 87,365 87,960 Manufacturing plant and equipment 1,679,493 981,410 Office equipment 24,517 14,710 Motor vehicles 93,011 49,800 Total depreciation expense 2,151,836 1,320,000 Amortisation expense Patents 298,017 60,308 Development costs 1,106,443 618,243 Total amortisation expense 1,404,460 678,551 Total depreciation and amortisation expense 3,556,296 1,998,551 Impairment loss on write down of assets to recoverable amount Assets held for sale - 93,520 Land and buildings 4,088,512 1,250,000 Development costs 190,799 1,778,194 Manufacturing plant and equipment 2,847,702 - Office equipment - 32,000 Total impairment of other assets 7,127,013 3,153,714 (c) Finance income and costs Interest income 101,098 38,533 Net foreign exchange 313,984 248,908 Finance income 415,082 287,441 Interest expense on financial liabilities measured at amortised cost (1,194,344) (1,092,325) Finance costs (1,194,344) (1,092,325) Net finance costs recognised in profit or loss (779,262) (804,884)
For
per
sona
l use
onl
y

TPI ENTERPRISES LTD ACN 107 872 453 NOTES TO THE FINANCIAL STATEMENTS FOR THE YEAR ENDED 31 DECEMBER 2015
TPI ENTERPRISES LTD – 2015 ANNUAL REPORT 30
NOTE 6: INCOME TAXES Consolidated
2015 $
2014 $
Tax recognises in profit or loss Income tax benefit Current year - - Deferred tax benefit Current year - 80,580 Total tax benefit - 80,580 The income tax benefit for the prior year relates to the reversal of a previously recognised deferred tax liability
The prima facie income tax expense on the loss from continuing operations before tax reconciles to the income tax expense in the financial statements as follows:
Loss from continuing operations before tax (25,899,838) (14,524,553) Income tax calculated at 30% (7,769,951) (4,357,366) Effect of different tax rates of subsidiaries operating in other jurisdictions 162,196 - Change in recognised taxable temporary differences - 80,580 Deferred tax assets not brought into account 7,607,755 4,357,366 Income tax expense - 80,580 Current tax liabilities Income tax payable attributable to subsidiaries - - Unrecognised deferred tax assets The following deferred tax assets have not been brought to account as assets:
Deductible temporary differences 3,047,010 2,680,022 Tax losses – revenue 21,500,484 16,465,784 24,547,494 19,145,806
These deductible temporary differences and tax losses do not expire under current tax legislation in Australia but do expire after 12 years for those related to the Portugal activities. Deferred tax assets have not been recognised in respect of these items because, given the stage of business, it is not probable that future taxable profit will be available against which the Group can utilise the benefits therefrom. NOTE 7: EARNINGS PER SHARE
Consolidated 2015
$ 2014
$ Net loss used in calculating basic earnings per share: 25,899,838 14,443,973 Net loss used in calculating diluted earnings per share: 25,899,838 14,443,973 No. of Shares No. of Shares Weighted average number of ordinary shares used in calculating basic earnings per share 49,744,177 43,364,630
Dilutive potential ordinary shares - - Weighted average number of ordinary shares and potential ordinary shares used in calculating diluted earnings per share 49,744,177 43,364,630
Information concerning the classification of securities Fully paid ordinary shares carry the right to participate in dividends and the proceeds on winding up of the Company in equal proportion to the number of shares held. At shareholder meetings each ordinary share is entitled to one vote when a poll is called, otherwise each shareholder has one vote on a show of hands. Fully paid ordinary shares are included as ordinary shares in the determination of basic earnings per share. No other securities are currently on issue.
For
per
sona
l use
onl
y
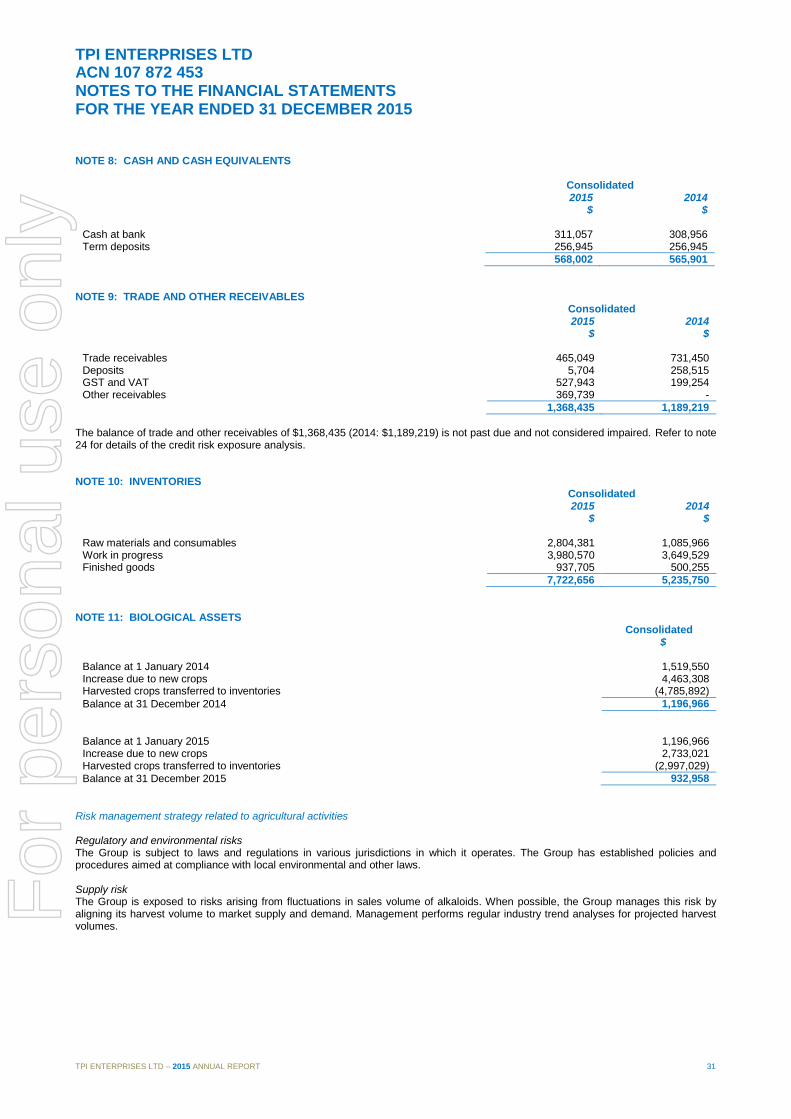
TPI ENTERPRISES LTD ACN 107 872 453 NOTES TO THE FINANCIAL STATEMENTS FOR THE YEAR ENDED 31 DECEMBER 2015
TPI ENTERPRISES LTD – 2015 ANNUAL REPORT 31
NOTE 8: CASH AND CASH EQUIVALENTS
Consolidated 2015
$ 2014
$ Cash at bank 311,057 308,956 Term deposits 256,945 256,945 568,002 565,901
NOTE 9: TRADE AND OTHER RECEIVABLES
Consolidated 2015
$ 2014
$ Trade receivables 465,049 731,450 Deposits 5,704 258,515 GST and VAT 527,943 199,254 Other receivables 369,739 -
1,368,435 1,189,219 The balance of trade and other receivables of $1,368,435 (2014: $1,189,219) is not past due and not considered impaired. Refer to note 24 for details of the credit risk exposure analysis. NOTE 10: INVENTORIES
Consolidated 2015
$ 2014
$ Raw materials and consumables 2,804,381 1,085,966 Work in progress 3,980,570 3,649,529 Finished goods 937,705 500,255
7,722,656 5,235,750 NOTE 11: BIOLOGICAL ASSETS
Consolidated $ Balance at 1 January 2014 1,519,550 Increase due to new crops 4,463,308 Harvested crops transferred to inventories (4,785,892) Balance at 31 December 2014 1,196,966 Balance at 1 January 2015 1,196,966 Increase due to new crops 2,733,021 Harvested crops transferred to inventories (2,997,029) Balance at 31 December 2015 932,958
Risk management strategy related to agricultural activities Regulatory and environmental risks The Group is subject to laws and regulations in various jurisdictions in which it operates. The Group has established policies and procedures aimed at compliance with local environmental and other laws. Supply risk The Group is exposed to risks arising from fluctuations in sales volume of alkaloids. When possible, the Group manages this risk by aligning its harvest volume to market supply and demand. Management performs regular industry trend analyses for projected harvest volumes.
For
per
sona
l use
onl
y

TPI ENTERPRISES LTD ACN 107 872 453 NOTES TO THE FINANCIAL STATEMENTS FOR THE YEAR ENDED 31 DECEMBER 2015
TPI ENTERPRISES LTD – 2015 ANNUAL REPORT 32
NOTE 12: ASSETS HELD FOR SALE
Consolidated 2015
$ 2014
$ Assets held for sale - 2,231,480
During the year ended 31 December 2014, management committed to a plan to sell the two farming properties in Tasmania. Accordingly, these properties were classified as assets held for sale as at 31 December 2014. Management entered into contracts for sale of these properties and settlement was completed for both during the half-year ended 30 June 2015. NOTE 13: PROPERTY, PLANT AND EQUIPMENT
Land and buildings
Farm plant and
equipment
Manufacturing plant and
equipment
Office equipment
Motor vehicles
Total
Cost $ $ $ $ $ $ At 1 January 2015 17,304,660 1,815,973 16,050,819 549,468 596,666 36,317,586 Additions 2,323,782 161,522 8,319,171 516,889 103,000 11,424,364 Transfer between asset classes (1,045,776) (139,124) 513,840 377 - (670,683) At 31 December 2015 18,582,666 1,838,371 24,883,830 1,066,734 699,666 47,071,267 Depreciation and impairment losses At 1 January 2015 (2,090,598) (481,073) (6,738,553) (370,953) (359,316) (10,040,493) Depreciation for the year (267,450) (87,365) (1,679,493) (24,517) (93,011) (2,151,836) Impairment loss (4,088,512) - (2,847,702) - (6,936,214) Disposals - - - (619) - (619) Transfer between asset classes (77,204) (522,207) 1,377,466 (85,380) (21,992) 670,683 At 31 December 2015 (6,523,764) (1,090,645) (9,888,282) (481,469) (474,319) (18,458,479) Effect of foreign currency movements 15,804 Carrying amount at 31 December 2015 28,628,592
Impairment testing During the year ended 31 December 2015, the Group continued to record operating losses and accordingly this triggered a requirement to perform impairment testing in respect of the carrying value of its property, plant and equipment and intangible assets. The recoverable amount of the CGU (being the Group as a whole at this stage in the Group’s lifecycle) was estimated based on the value in use of the Group as a whole, determined by discounting the future cash flows to be generated from the continuing use of the Group’s assets. Value in use as at 31 December 2015 was based on the following key assumptions:
• Cash flows were forecast based on the five-year business plan. The terminal value of the Group was based on the fifth-year cash flow and a long-term growth rate of 3%, which is consistent with the long-term inflation target for Australia of between 2% and 3%.
• Revenue was forecast based on forecast hectares to be sown for the years 2016 to 2020 and past yield experience. Revenue forecasts are based on the anticipated ramp up of the Victorian production facility to at least 100 tonnes of narcotic raw materials by 2019.
• Management has not factored in price growth in the cash flow forecast as contracts entered into are relatively long-term (three to five years) with a set price for inventory.
• An after tax discount rate of 15% was applied in determining the recoverable amount. The discount rate was estimated based on an industry average weighted-average cost of capital and applying a premium to the industry average due to the Group being in its growth phase and risks inherent in the cash flow forecast.
The recoverable amount of the CGU was determined to be higher than its carrying amount and as such no apparent impairment is evident. In addition, the market capitalisation of the Group also exceeds the net tangible asset backing indicating no apparent impairment is evident. However, following management’s decision to relocate the Group’s manufacturing facility to Victoria in the prior year, management conducted a detailed review of the carrying value of certain assets. As a result of the significant improvement in the manufacturing process it was determined that plant and equipment that had been integral to the process in the Tasmania was no longer required and certain other assets were also considered to be of no ongoing value resulting in an impairment loss of $2,847,702 with respect to specific plant and equipment. In addition, it was also considered prudent to review the value of the Cressy facility which is now predominately being used for the storage of straw from the Tasmanian harvest and other inventory. This resulted in a further impairment loss of $4,088,512.
For
per
sona
l use
onl
y

TPI ENTERPRISES LTD ACN 107 872 453 NOTES TO THE FINANCIAL STATEMENTS FOR THE YEAR ENDED 31 DECEMBER 2015
TPI ENTERPRISES LTD – 2015 ANNUAL REPORT 33
NOTE 13: PROPERTY, PLANT AND EQUIPMENT (CONT.) Leased land and buildings The Group acquired the Melbourne facility site through a finance lease during the year ended 31 December 2014. At 31 December 2015, the net carrying amount of this site is $8,150,000 (2014: $8,150,000). NOTE 14: INVESTMENTS
Consolidated 2015
$ 2014
$ Non-current Macquarie River Pipeline Partnership 100,673 297,659
The Company sold two-thirds of its water right entitlements in the Macquarie River Pipeline Partnership during the year. NOTE 15: INTANGIBLE ASSETS
Patents Development
Costs Irrigation
Rights Total
Cost $ $ $ $ At 1 January 2015 592,388 5,679,108 1,100,000 7,371,496 Additions 15,493 442,152 - 457,645 Fully amortised intangibles - (2,597,741) - (2,597,741) At 31 December 2015 607,881 3,523,519 1,100,000 5,231,400 Amortisation At 1 January 2015 (276,940) (3,956,299) - (4,233,239) Amortisation for the year (298,017) (1,106,443) - (1,404,460) Impairment loss - (190,799) - (190,799) Fully amortised intangibles - 2,596,584 - 2,596,584 At 31 December 2015 (574,957) (2,656,957) - (3,231,914) Effect of foreign currency movements 4,259 Carrying amount at 31 December 2015 2,003,745
Impairment testing The Group reviewed the carrying value of certain development costs at the year end and determined it was prudent to write down the value of certain assets. As such an impairment loss of $190,799 was recognised. Refer to Note 13 for further details of the Group’s impairment testing for the year ended 31 December 2015. Irrigation rights In addition to the Group wide impairment testing, management specifically performed impairment testing with respect to its irrigation rights which relate to entitlements to draw on natural resources for the South Esk and Arthur River catchments across Northern Tasmania. These are renewable annually if the Group complies with relevant legislative requirements. The entitlements may be renewed indefinitely and at little cost. The Group intends to renew the entitlements indefinitely and evidence supports its ability to do so. Therefore, the irrigation rights have been treated as having an indefinite useful life because it is expected to contribute to the Group’s net cash inflows indefinitely. The recoverable amount of irrigation rights was based on fair value less costs of disposal. The fair value measurement was categorised as a Level 2 fair value based on the sales price of similar irrigation rights in Tasmania. The carrying value of irrigation rights are recognised at cost. Management has not recorded an impairment charge against the irrigation rights as the fair value less costs of disposal is higher than the carrying value of the irrigation rights.
For
per
sona
l use
onl
y

TPI ENTERPRISES LTD ACN 107 872 453 NOTES TO THE FINANCIAL STATEMENTS FOR THE YEAR ENDED 31 DECEMBER 2015
TPI ENTERPRISES LTD – 2015 ANNUAL REPORT 34
NOTE 16: TRADE AND OTHER PAYABLES Consolidated 2015
$ 2014
$ Trade payables 4,556,767 897,862 Other payables 701,639 315,589 5,258,406 1,213,451
NOTE 17: LOANS AND BORROWINGS This note provides information about the contractual terms of the Group’s interest-bearing loans and borrowings, which are measured at amortised cost.
Consolidated 2015
$ 2014
$ Current Secured bank loans - 15,359,000 Short term loan facility - 1,967,244 Convertible debt accrued interest - 55,205 Irrigation rights fixed repayment plan 133,570 123,276 Other 11,127 56,424 144,697 17,561,149 Non-current Finance lease liabilities 8,150,000 8,150,000 Irrigation rights fixed repayment plan 221,552 355,122 Shareholder loan facility 5,500,000 - 13,871,552 8,505,122
Movements during the year
Currency Nominal
Interest Rate Year of Maturity
Face Value Carrying Amount
At 1 January 2015 26,066,271 New Issues Shareholder loan facility AUD 12% Variable 5,138,028 5,138,028 Shareholder loan facility AUD 11% 2017 5,500,000 5,500,000 Repayments Secured bank loan AUD 5.16-9.91% 2016 (15,390,010) (15,390,010) Conversion of shareholder loan to equity AUD 12% Variable (7,077,500) (7,077,500) Irrigation rights fixed repayment plan AUD 8.1% 2018 355,122 (123,276) Other (97,264) Carrying amount at 31 December 2015 14,016,249
The Banking facilities provided by Rabobank and the shareholder loan provided by Washington H. Soul Pattinson Company Ltd were fully repaid in March 2015, from the proceeds of the capital raising.
In October 2015, Washington H. Soul Pattinson Company Ltd, a substantial shareholder provided the Group with a standby facility to meet short term working capital needs. The facility was increased in January 2016 and now provides access to funds of up to $20,000,000 which is secured against the Australian assets of the Group and has a maturity date of 31 March 2017. At 31 December 2015 the Group had drawn down $5,500,000 of this facility.
In addition, as at 31 December 2015, external debt included a vendor loan provided by the Meander Valley Water Scheme, secured by the water rights provided by the scheme, and the finance lease (deferred purchase arrangement) for the Melbourne factory site. Both these facilities are within terms.
For
per
sona
l use
onl
y

TPI ENTERPRISES LTD ACN 107 872 453 NOTES TO THE FINANCIAL STATEMENTS FOR THE YEAR ENDED 31 DECEMBER 2015
TPI ENTERPRISES LTD – 2015 ANNUAL REPORT 35
NOTE 17: LOANS AND BORROWINGS (CONT.) Terms and debt repayment schedule
Terms and conditions of outstanding loans were as follows:
31 December 2015 31 December 2014
Currency Nominal Interest
Rate
Year of Maturity
Face Value
Carrying Amount
Face Value
Carrying Amount
Secured bank loans AUD 5.16-
9.91% 2016 - - 15,359,000 15,359,000
Short term loan facility AUD 12.00% Variable - - 1,967,244 1,967,244 Convertible debt accrued interest AUD 2014 - 55,205 55,205 Irrigation rights fixed repayment plan AUD 8.10% 2018 395,862 355,122 554,207 478,398
Finance lease liabilities AUD 9.04% 2018 10,342,456 8,150,000 11,045,258 8,150,000 Shareholder loan facility AUD 11% 2017 5,500,000 5,500,000 - - Other AUD 2016 11,127 11,127 56,424 56,424
Total Interest bearing liabilities 16,249,445 14,016,249 29,037,338 26,066,271
Finance lease liabilities
Future minimum lease
payments Interest Present value of minimum
lease payments
2015
$ 2014
$ 2015
$ 2014
$ 2015
$ 2014
$ Less than one year 727,400 702,802 727,400 702,802 - - Between one and five years 9,615,056 10,342,456 1,465,056 2,192,456 8,150,000 8,150,000 10,342,456 11,045,258 2,192,456 2,895,258 8,150,000 8,150,000
NOTE 18: EMPLOYEE BENEFITS
Consolidated 2015
$ 2014
$ Current Annual leave 603,836 438,487 Long service leave 18,907 - 622,743 438,487
Non-current Long service leave 226,472 133,818 226,472 133,818
For
per
sona
l use
onl
y

TPI ENTERPRISES LTD ACN 107 872 453 NOTES TO THE FINANCIAL STATEMENTS FOR THE YEAR ENDED 31 DECEMBER 2015
TPI ENTERPRISES LTD – 2015 ANNUAL REPORT 36
NOTE 19: ISSUED CAPITAL Movements in issued capital during the year were as follows:
2015 2014 2015 2014 No. No. $ $ Issued shares: At the beginning of the reporting period 43,765,229 39,587,549 83,151,883 71,796,038
Shares issued for cash 6,194,211 3,785,523 29,422,500 9,855,845 Conversion of convertible debt into equity - 392,157 - 1,500,000 Conversion of shareholder loan into equity 1,490,000 - 7,077,500 - Transaction costs arising on issue of shares - - (1,461,220) - At end of the reporting period 51,449,440 43,765,229 118,190,663 83,151,883
Ordinary shares The Group does not have authorised capital or par value in respect of its issued shares. All issued shares are fully paid. All shares rank equally with regard to the Group’s residual assets. The holders of ordinary shares are entitled to receive dividends as declared from time to time, and are entitled to one vote per share at meetings of the Group. In respect of the Group’s shares that are held by the Group, all rights are suspended until those shares are reissued. NOTE 20: RESERVES Foreign currency translation reserve Exchange differences relating to translation from functional currencies of the Group’s foreign controlled entities into Australian Dollars are bought to account by entries made directly to the foreign currency translation reserve. Other reserves Other reserves comprise a convertible notes reserve and a share-based payment reserve. The reserve for convertible notes comprises the amounts allocated to the equity component for the convertible notes issued by the Group to shareholders. Upon conversion of convertible notes, the amounts allocated to the equity component are credited to share capital. The share-based payment reserve comprises the fair value of options recognised as an expense. Upon exercise of options, any proceeds received are credited to share capital. The share-based payment reserve remains as a separate component of equity. NOTE 21: REMUNERATION OF AUDITORS Auditors of the Group - KPMG
Consolidated 2015
$ 2014
$ Audit services Audit and review of financial reports and other audit work under the Corporations Act 2001 132,000 62,000 Audit and review of financial reports and other audit work for Portugal subsidiaries 18,437 11,749 Total remuneration for audit services 150,437 73,749 Other advisory services Compilation of financial statements: - 8,000 Advice on taxation and other matters and review and lodgement of corporate tax returns – Portugal subsidiaries 47,094 128,617 Total remuneration 197,531 210,366
For
per
sona
l use
onl
y

TPI ENTERPRISES LTD ACN 107 872 453 NOTES TO THE FINANCIAL STATEMENTS FOR THE YEAR ENDED 31 DECEMBER 2015
TPI ENTERPRISES LTD – 2015 ANNUAL REPORT 37
NOTE 22: CASH FLOW INFORMATION
Consolidated
2015 $
2014 $
Loss for the year (25,899,838) (14,443,973) Adjustments for: Depreciation expense 2,151,836 1,320,000 Impairment of other assets 7,127,013 3,153,714 Amortisation of intangible assets 1,404,460 678,551 Interest income (101,098) (38,533) Interest expense 1,194,344 1,092,325 Unrealised foreign exchange gain (313,208) (188,876) Other (113,442) 14,749 (14,549,933) (8,412,043) Change in inventories (2,486,719) 2,640,067 Change in biological assets 264,008 322,584 Change in trade and other receivables (179,216) 1,984,378 Change in investments - (1,785) Change in deferred tax liability - (80,580) Change in prepayments (105,663) (25,044) Change in trade and other payables 2,545,781 (1,930,871) Change in employee provisions 276,910 112,661 Cash used in operating activities (14,234,832) (5,390,633) Interest received 101,098 38,533 Interest paid (1,384,373) (902,296) Net cash used in operating activities (15,518,107) (6,254,396)
NOTE 23: COMMITMENTS AND CONTINGENCIES Capital commitments As at 31 December 2015 the Group had capital commitments for equipment of $70,044 (2014: $480,868). Lease commitments On 1 December 2014, the Group entered into a 4-year lease with an unrelated party in respect of its Victorian manufacturing facility. On the same date, the Group entered into a contract to purchase the same property with a settlement date at the end of the lease term for an amount of $8.15 million. Refer to Note 17 for further details. Other commitments As at 31 December 2015 the Group had commitments for operating expenditure of $43,032 (2014: $Nil). During the year the year the Group entered into a rental arrangement in respect of a piece of office equipment. The rental is for 36 months. The outstanding commitment at 31 December 2015 was $10,849 of which $4,489 is payable during the 2016 financial year. Contingencies The Group currently has in place written agreements with its customers for the supply of licit narcotics. The agreements are on commercial terms and contain standard representations and warranties, indemnities and termination provisions. Under one of the agreements, TPI may be subject to penalties for late delivery including discounting the price otherwise payable to it and/or paying pre-agreed liquidated damages. The Group is currently in dispute with Poppy Growers Tasmania in respect of a defamation issue. The parties are currently attempting to settle the dispute out of court.
For
per
sona
l use
onl
y

TPI ENTERPRISES LTD ACN 107 872 453 NOTES TO THE FINANCIAL STATEMENTS FOR THE YEAR ENDED 31 DECEMBER 2015
TPI ENTERPRISES LTD – 2015 ANNUAL REPORT 38
NOTE 24: FINANCIAL INSTRUMENTS Overview The Group’s activities expose it to the following risks arising from their use of financial instruments:
• credit risk; • liquidity risk; and • market risk (including currency and interest rate risks).
This note presents information about the Group’s exposure to each of the above risks, the Group’s objectives, policies and processes for measuring and managing risk and the Group’s management of capital. Risk management framework The Directors have overall responsibility for the establishment and oversight of the risk management framework. The Board of Directors seek to maintain a balance between the higher returns that might be possible with higher levels of borrowings and the advantages and security afforded by a sound capital position. Capital requirements have been principally funded by equity in the form of share capital from investors. As the Group consolidates its operating position, it is anticipated any further expansion will be funded predominantly through debt in the form of bank loans and convertible debt; and equity in the form of placements and rights issues. Credit risk Credit risk is the risk of financial loss to the Group if a customer or counterparty to a financial instrument fails to meet its contractual obligations, and arises principally from the Group’s receivables from customers. Management have established a credit policy under which each new customer is analysed individually for creditworthiness before the Group's standard payment and delivery terms and conditions are offered. The Group's review includes external ratings, when available, and in some cases bank references. Purchase limits are established for each customer, which represents the maximum open amount without requiring approval from the Board; these limits are reviewed regularly. Customers that fail to meet the Group's benchmark creditworthiness may transact with the Group only on a prepayment basis. Goods are sold subject to retention of title clauses, so that in the event of non-payment the Group may have a secured claim. The Group does not require collateral in respect of trade and other receivables. The maximum exposure to credit risk, excluding the value of any collateral or other security, at balance date for recognised financial assets, is the carrying amount, net of any provisions for impairment of those assets. The Group does not have any material credit risk exposure to any single receivable or group of receivables under financial instruments entered into by the Group. Exposure to credit risk The carrying amount of the Group’s financial assets represents the maximum credit exposure. The maximum exposure to credit risk at reporting date was:
Note Consolidated 2015
$ 2014
$ Trade receivables 9 465,049 731,450 Other receivables 9 903,386 457,769 Cash and cash equivalents 8 568,002 565,901 1,936,437 1,755,120
The maximum exposure to credit risk for loans and receivables at the reporting date by geographic region was:
Consolidated 2015
$ 2014
$ Americas - 438,260 Europe 465,049 - Other regions - 293,190 465,049 731,450
F
or p
erso
nal u
se o
nly

TPI ENTERPRISES LTD ACN 107 872 453 NOTES TO THE FINANCIAL STATEMENTS FOR THE YEAR ENDED 31 DECEMBER 2015
TPI ENTERPRISES LTD – 2015 ANNUAL REPORT 39
NOTE 24: FINANCIAL INSTRUMENTS (CONT.) The maximum exposure to credit risk for receivables at the reporting date by type of counter party was:
Consolidated 2015
$ 2014
$ End-user customers 465,049 731,450
The Group’s exposure to credit risk is influenced mainly by the individual characteristics of each customer. In monitoring customer credit risk, customers are grouped by their ageing profile. Monitoring of receivable balances on an ongoing basis minimises the exposure of bad debts. A provision for impairment is recognised when there is objective evidence that an individual trade receivable in impaired. The aging of the Group’s trade receivables at the reporting date was:
Consolidated 2015
$ 2014
$ Not past due 465,049 534,222 1-30 days - - 31-60 days - - 60 days and over - 197,228 465,049 731,450
The trade receivable balances are reviewed monthly and an allowance is raised where an indication of impairment exists such as customer insolvency or slow payment record without due cause. Where the Group considers that recovery of the amount owing is not possible, the amounts considered irrecoverable are written off against the financial asset directly. As at 31 December 2015, there was no provision for impairment in relation to trade receivable balances (2014: nil). Cash and cash equivalents The Group held cash and cash equivalents of $568,002 at 31 December 2015 (2014: $565,901), which represents its maximum credit exposure on these assets. The cash and cash equivalents are held with financial institution counterparties with strong credit ratings. Liquidity risk Liquidity risk is the risk that the Group will not be able to meet its financial obligations as they fall due. The Group's approach to managing liquidity is to ensure, as far as possible, that it will always have sufficient liquidity to meet its liabilities when due, under both normal and stressed conditions, without incurring unacceptable losses or risking damage to the Group's reputation. The following are the contractual maturities of financial liabilities, including estimated interest payments and excluding the impact of netting agreements:
31 December 2015
Non-derivative financial liabilities
Carrying amount
Contractual cash flows
6 months or less
6-12 months
1-2 years 2-5 years More than 5 years
Shareholder loan facility 5,500,000 (5,500,000) - - (5,500,000) - - Irrigation rights fixed repayment plan
355,122 (395,862) (79,172) (79,172) (158,345) (79,173) -
Financial lease liabilities 8,150,000 (10,342,456) (362,642) (364,758) (752,859) (8,862,197) - Trade and other payables 5,258,406 (5,258,406) (5,258,406) - - - - Other 11,127 (11,127) (11,127) - - - -
19,274,655 (21,507,851) (5,711,347) (443,930) (6,411,204) (8,941,370) - F
or p
erso
nal u
se o
nly

TPI ENTERPRISES LTD ACN 107 872 453 NOTES TO THE FINANCIAL STATEMENTS FOR THE YEAR ENDED 31 DECEMBER 2015
TPI ENTERPRISES LTD – 2015 ANNUAL REPORT 40
NOTE 24: FINANCIAL INSTRUMENTS (CONT.)
31 December 2014
Non-derivative financial liabilities
Carrying amount
Contractual cash flows
6 months or less
6-12 months
1-2 years 2-5 years More than 5 years
Secured bank loans 15,359,000 (15,359,000) (15,359,000) - - - - Interest payable 55,205 (55,205) (55,205) - - - - Irrigation rights fixed repayment plan
478,398 (560,231) (45,611) (112,734) (322,714) (79,172) -
Financial lease liabilities 8,150,000 (11,045,258) (350,379) (352,423) (727,400) (9,615,056) - Trade and other payables 1,213,451 (1,213,451) (1,213,451) - - - - Convertible debt and accrued interest
1,967,244 (1,967,244) (1,967,244) - - - -
Other 56,424 (56,424) (56,424) - - - -
27,279,722 (30,256,813) (19,047,304) (465,157) (1,050,114) (9,694,228) - Market risk Market risk is the risk that changes in market prices, such as commodity prices, foreign exchange rates, interest rates and equity prices will affect the Group's income or the value of its holdings of financial instruments. The objective of market risk management is to manage and control market risk exposures within acceptable parameters, while optimising the return. Currency risk The Group undertakes certain transactions denominated in foreign currencies, hence exposures to exchange rate fluctuation arise. Exchange rate exposures are managed within approved policy parameters. The Group manages the currency risk by monitoring the trend of the US dollar and Euro. The Group maintains US dollar and Euro bank accounts to cover a portion of its anticipated expenditures in the respective foreign currencies. The consolidated entity’s foreign currency risk denominated financial assets and financial liabilities at the reporting date are as follows:
31 December 2015 31 December 2014 Consolidated USD Euro USD Euro Financial Assets Cash and cash equivalents 127,047 80,615 4,050 75,048 Trade and other receivables 339,766 147,106 379,753 - Financial Liabilities Trade and other payables - 81,602 5,340 -
The following sensitivity analysis is based on the foreign currency risk exposures in existence at the statement of financial position date. A 10 percent increase or decrease in the foreign exchange rate is used and represents management’s assessment of the possible change in foreign exchange rates and historically is within a range of rate movements. A positive number indicates an increase in result and other equity. A negative number indicates a decrease in result and other equity. At 31 December 2015, if foreign exchange rates had moved, as illustrated in the table below, with all other variables held constant, pre-tax result and equity would have been affected as follows:
For
per
sona
l use
onl
y

TPI ENTERPRISES LTD ACN 107 872 453 NOTES TO THE FINANCIAL STATEMENTS FOR THE YEAR ENDED 31 DECEMBER 2015
TPI ENTERPRISES LTD – 2015 ANNUAL REPORT 41
NOTE 24: FINANCIAL INSTRUMENTS (CONT.)
- 10% + 10%
Profit $
Equity $
Profit $
Equity $
31 December 2015 Financial Assets
Cash and cash equivalents 32,727 32,727 (26,776) (26,776) Trade and other receivables 76,134 76,134 (62,291) (62,291) Financial Liabilities Trade and other payables (13,569) (13,569) 11,102 11,102 95,292 95,292 (77,965) (77,965) 31 December 2014 Financial Assets
Cash and cash equivalents 13,095 13,095 (10,714) (10,714) Trade and other receivables 57,754 57,754 (47,253) (47,253) Financial Liabilities Trade and other payables (812) (812) 664 664 70,037 70,037 (57,303) (57,303)
Interest rate risk The Group is exposed to interest rate risk arising from changes in market interest rate on its variable rate investments. The Group's policy is to manage its finance costs using a mix of fixed and variable rate debt. Management periodically reviews its interest rate exposure and consideration is given to potential renewals of existing positions, alternative financing and the mix of fixed and variable interest rates. Profile At the reporting date the interest rate profile of the Group’s interest-bearing financial instruments was as follows:
Carrying Amounts 2015
$ 2014
$ Fixed rate instruments Financial assets 256,945 256,945 Financial liabilities 14,005,122 10,707,271 Variable rate instruments Financial liabilities - 15,359,000
Fair value sensitivity analysis for fixed rate instruments The Group does not account for any fixed rate financial assets and liabilities at fair value through profit and loss. Therefore a change in interest rate at the reporting date would not affect the profit and loss or equity. Cash flow sensitivity analysis for variable rate instruments A change of 100 basis points in interest rates would have increased or decreased the Group’s equity by $5,741 (2014: $153,590). This analysis assumes that all other variables, in particular foreign currency rates remain constant. Other market risk The Group's operations result in exposure to fluctuations in commodity prices, primarily those relating to poppy crops and alkaloids. Management monitors commodity prices and initiates instruments to manage exposure to these risks when it deems it appropriate. Currently, the Group has not initiated any such instruments. The Group also seeks wherever possible to obtain fixed price contracts with both suppliers and customers in order to minimise potential commodity price fluctuation exposures. Financial instruments held by the Group do not give rise to any material direct exposures to equity price risk.
For
per
sona
l use
onl
y
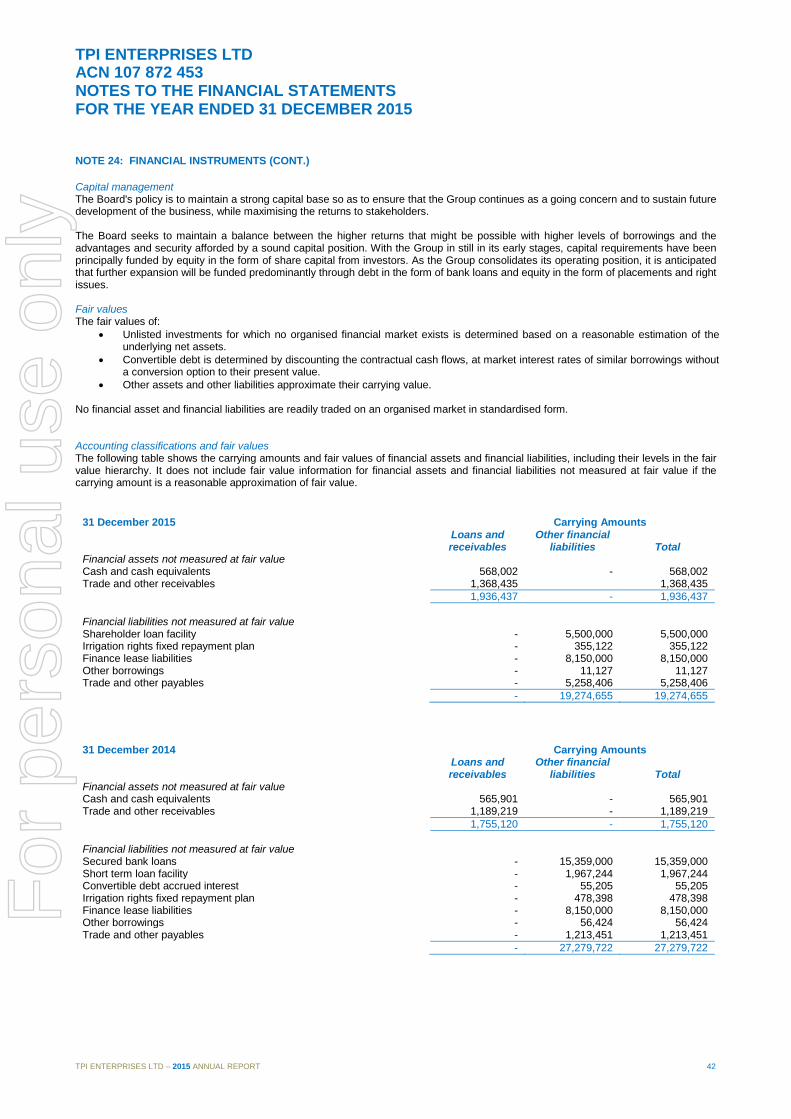
TPI ENTERPRISES LTD ACN 107 872 453 NOTES TO THE FINANCIAL STATEMENTS FOR THE YEAR ENDED 31 DECEMBER 2015
TPI ENTERPRISES LTD – 2015 ANNUAL REPORT 42
NOTE 24: FINANCIAL INSTRUMENTS (CONT.) Capital management The Board's policy is to maintain a strong capital base so as to ensure that the Group continues as a going concern and to sustain future development of the business, while maximising the returns to stakeholders. The Board seeks to maintain a balance between the higher returns that might be possible with higher levels of borrowings and the advantages and security afforded by a sound capital position. With the Group in still in its early stages, capital requirements have been principally funded by equity in the form of share capital from investors. As the Group consolidates its operating position, it is anticipated that further expansion will be funded predominantly through debt in the form of bank loans and equity in the form of placements and right issues. Fair values The fair values of:
• Unlisted investments for which no organised financial market exists is determined based on a reasonable estimation of the underlying net assets.
• Convertible debt is determined by discounting the contractual cash flows, at market interest rates of similar borrowings without a conversion option to their present value.
• Other assets and other liabilities approximate their carrying value.
No financial asset and financial liabilities are readily traded on an organised market in standardised form. Accounting classifications and fair values The following table shows the carrying amounts and fair values of financial assets and financial liabilities, including their levels in the fair value hierarchy. It does not include fair value information for financial assets and financial liabilities not measured at fair value if the carrying amount is a reasonable approximation of fair value.
31 December 2015 Carrying Amounts Loans and
receivables Other financial
liabilities Total Financial assets not measured at fair value Cash and cash equivalents 568,002 - 568,002 Trade and other receivables 1,368,435 1,368,435 1,936,437 - 1,936,437 Financial liabilities not measured at fair value Shareholder loan facility - 5,500,000 5,500,000 Irrigation rights fixed repayment plan - 355,122 355,122 Finance lease liabilities - 8,150,000 8,150,000 Other borrowings - 11,127 11,127 Trade and other payables - 5,258,406 5,258,406 - 19,274,655 19,274,655
31 December 2014 Carrying Amounts Loans and
receivables Other financial
liabilities Total Financial assets not measured at fair value Cash and cash equivalents 565,901 - 565,901 Trade and other receivables 1,189,219 - 1,189,219 1,755,120 - 1,755,120 Financial liabilities not measured at fair value Secured bank loans - 15,359,000 15,359,000 Short term loan facility - 1,967,244 1,967,244 Convertible debt accrued interest - 55,205 55,205 Irrigation rights fixed repayment plan - 478,398 478,398 Finance lease liabilities - 8,150,000 8,150,000 Other borrowings - 56,424 56,424 Trade and other payables - 1,213,451 1,213,451 - 27,279,722 27,279,722
For
per
sona
l use
onl
y

TPI ENTERPRISES LTD ACN 107 872 453 NOTES TO THE FINANCIAL STATEMENTS FOR THE YEAR ENDED 31 DECEMBER 2015
TPI ENTERPRISES LTD – 2015 ANNUAL REPORT 43
NOTE 25: KEY MANAGEMENT PERSONNEL (a) Details of key management personnel The Directors and other members of key management personnel of the Company during the year were:
Name Position Mr. Peter Robinson Non-Executive Chairman Mr. Todd Barlow Non-Executive Director (Appointed 18 June 2015) Mr. Jarrod Ritchie Managing Director and Chief Executive Officer Mr. Ross Dobinson Non-Executive Director (Retired 18 June 2015) Mr. Roger McPherson Chief Financial Officer and Company Secretary (Appointed 9 October 2015)
(b) Key management personnel compensation The aggregate compensation made to Directors and other members of key management personnel of the Company is set out below:
2015 $
2014 $
Short term employee benefits 908,016 1,032,448 Post-employment benefits 46,285 23,474 Equity based payments - - 954,301 1,055,922
Further disclosures regarding key management personnel compensation are contained within the Remuneration Report. NOTE 26: RELATED PARTY TRANSACTIONS (a) Equity interests in related parties
Country of Incorporation Class of share Percentage Owned
Consolidated 2015 2014 Parent Entity:
TPI Enterprises Ltd Australia Controlled Entities: TPIH Holding Portugal, Serviços de Agricultura Lda Portugal Ordinary 100% 100% TPIH – API Portugal, S.A Portugal Ordinary 100% 100% TPIH – Poppygrowing (Portugal) S.A. Portugal Ordinary 100% 100% Purplebay Proprietary Limited Australia Ordinary 100% 100%
The consolidated financial statements incorporate the assets, liabilities and results of these subsidiaries in accordance with the accounting policy described in Note 2(e). (b) Transactions with controlled entities The parent entity has advanced funds to each of the Portugal based subsidiaries. These loans are non-interest bearing and unsecured with no fixed due date of repayment. The total advances made were €4,797,120 ($7,179,168). There were no intercompany loan balances at 31 December 2014. (c) Transactions with key management personnel Details of key management personnel compensation are disclosed in note 25 and the Remuneration Report. (d) Amounts owing to related parties Refer to note 17 for details of loans from shareholders. F
or p
erso
nal u
se o
nly

TPI ENTERPRISES LTD ACN 107 872 453 NOTES TO THE FINANCIAL STATEMENTS FOR THE YEAR ENDED 31 DECEMBER 2015
TPI ENTERPRISES LTD – 2015 ANNUAL REPORT 44
NOTE 27: PARENT ENTITY INFORMATION Information relating to TPI Enterprises Ltd:
31 December 2015 $
31 December 2014 $
Current assets 13,656,543 12,500,702 Total assets 41,407,419 41,562,995 Current liabilities 6,908,253 20,124,964 Total liabilities 20,779,806 28,630,086 Net assets 20,627,613 12,932,909 Issued capital 118,190,663 83,151,883 Accumulated Losses (99,484,979) (72,140,903) Reserves 1,921,929 1,921,929 Total shareholders’ equity 20,627,613 12,932,909 Profit or (loss) of the parent entity (27,344,076) (13,112,121) Total comprehensive income of the parent entity (27,344,076) (13,112,121) Details of any guarantees entered into by the parent entity in relation to the debts of its subsidiaries
NIL
NIL
Details of any contingent liabilities of the parent entity
Refer Note 23
Refer Note 23
Details of any contractual commitments by the parent entity for the acquisition of property, plant or equipment.
Refer Note 23
Refer Note 23 NOTE 28: SUBSEQUENT EVENTS Material events subsequent to the end of the year that have not been recognised in the financial statements: In January 2016, the Company extended the facility with Washington H. Soul Pattinson Company Ltd, a substantial shareholder to $20,000,000 to meet working capital needs predominantly associated with the seasonal nature of the purchase of raw materials (poppy crop) which is mainly harvested in the first quarter each year.
For
per
sona
l use
onl
y

DECLARATION BY DIRECTORS
TPI ENTERPRISES LTD – 2015 ANNUAL REPORT 45
1. In the opinion of the Directors of TPI Enterprises Limited (the “Company”):
(a) the consolidated financial statements and notes that are set out on pages 3 to 44 and the Remuneration report that is set out on pages 9 to 12 in the Directors’ report, are in accordance with the Corporations Act 2001, including:
(i) giving a true and fair view of the Group’s financial position as at 31 December 2015 and of its performance for the financial year ended on that date; and
(ii) complying with Australian Accounting Standards and the Corporations Regulations 2001; and
(b) there are reasonable grounds to believe that the Company will be able to pay its debts as and when they become due and payable.
2. The Directors have been given the declarations required by Section 295A of the Corporations Act 2001 from the Chief Executive Officer and Chief Financial Officer for the financial year ended 31 December 2015.
3. The Directors draw attention to Note 2(a) to the consolidated financial statements, which includes a statement of compliance with International Financial Reporting Standards.
Signed in accordance with a resolution of the Directors:
Peter Robinson Director Sydney 29 March 2016
For
per
sona
l use
onl
y

ABCD
© 2016 KPMG, an Australian partnership and a member firm of the KPMG network of independent member firms affiliated with KPMG International Cooperative (“KPMG International”), a Swiss legal entity.
Liability limited by a scheme approved under Professional Standards Legislation.
INDEPENDENT AUDITOR’S REPORT TO THE MEMBERS OF TPI ENTERPRISES LIMITED
46
Report on the financial report We have audited the accompanying financial report of TPI Enterprises Limited (the Company), which comprises the consolidated statement of financial position as at 31 December 2015, and consolidated statement of profit and loss and other comprehensive income, consolidated statement of changes in equity and consolidated statement of cash flows for the year ended on that date, Notes 1 to 28 comprising a summary of significant accounting policies and other explanatory information and the Directors’ declaration of the Group comprising the Company and the entities it controlled at the year’s end or from time to time during the financial year. Directors’ responsibility for the financial report The directors of the Company are responsible for the preparation of the financial report that gives a true and fair view in accordance with Australian Accounting Standards and the Corporations Act 2001 and for such internal control as the directors determine is necessary to enable the preparation of the financial report that is free from material misstatement whether due to fraud or error. In Note 2(a), the directors also state, in accordance with Australian Accounting Standard AASB 101 Presentation of Financial Statements, that the financial statements of the Group comply with International Financial Reporting Standards. Auditor’s responsibility Our responsibility is to express an opinion on the financial report based on our audit. We conducted our audit in accordance with Australian Auditing Standards. These Auditing Standards require that we comply with relevant ethical requirements relating to audit engagements and plan and perform the audit to obtain reasonable assurance whether the financial report is free from material misstatement. An audit involves performing procedures to obtain audit evidence about the amounts and disclosures in the financial report. The procedures selected depend on the auditor’s judgement, including the assessment of the risks of material misstatement of the financial report, whether due to fraud or error. In making those risk assessments, the auditor considers internal control relevant to the entity’s preparation of the financial report that gives a true and fair view in order to design audit procedures that are appropriate in the circumstances, but not for the purpose of expressing an opinion on the effectiveness of the entity’s internal control. An audit also includes evaluating the appropriateness of accounting policies used and the reasonableness of accounting estimates made by the directors, as well as evaluating the overall presentation of the financial report. We performed the procedures to assess whether in all material respects the financial report presents fairly, in accordance with the Corporations Act 2001 and Australian Accounting Standards, a true and fair view which is consistent with our understanding of the Group’s financial position and of its performance. We believe that the audit evidence we have obtained is sufficient and appropriate to provide a basis for our audit opinion. Independence In conducting our audit, we have complied with the independence requirements of the Corporations Act 2001. Auditor’s opinion In our opinion: (a) the financial report of the Group is in accordance with the Corporations Act 2001, including:
(i) giving a true and fair view of the Group’s financial position as at 31 December 2015 and of its performance for the year ended on that date; and
(ii) complying with Australian Accounting Standards and the Corporations Regulations 2001. (b) the financial report also complies with International Financial Reporting Standards as disclosed in Note 2(a). Report on the remuneration report We have audited the Remuneration Report included in pages 9 to 12 of the directors’ report for the year ended 31 December 2015. The directors of the Company are responsible for the preparation and presentation of the remuneration report in accordance with Section 300A of the Corporations Act 2001. Our responsibility is to express an opinion on the remuneration report, based on our audit conducted in accordance with auditing standards. Auditor’s opinion In our opinion, the remuneration report of TPI Enterprises Limited for the year ended 31 December 2015, complies with Section 300A of the Corporations Act 2001.
KPMG
Tony Nimac Partner
Sydney
29 March 2016
For
per
sona
l use
onl
y

SHAREHOLDER INFORMATION
TPI ENTERPRISES LTD – 2015 ANNUAL REPORT 47
A. Substantial shareholders The Company’s Holders of Relevant Interests as notified by ASX Substantial Shareholders and the number of shares in which they have an interest as disclosed by notices received under Part 6.7 of the Corporations Act 2001 as at 23 March 2015 are:
Name Ordinary Shares Washington H. Soul Pattinson Co Ltd 9,964,750 Sico Holdings Pty Ltd 6,285,665 TIGA Trading Pty Ltd 3,049,320 Jarrod Ritchie 3,003,273
B. Number of holders of equity securities and voting rights
Ordinary Shares Number of holdings as at 23 March 2015 910
The voting rights attaching to each class of equity securities are:
Ordinary shares On a show of hands, every member present at a meeting, in person or by proxy, shall have one vote and upon a poll each share shall have one vote.
C. Distribution of equity securities Distribution of holders of equity securities as at 23 March 2015:
No. of holders Ordinary Shares 1 - 1,000 149 1,001 - 5,000 340 5,001 - 10,000 136 10,001 - 100,000 227 100,001 and over 58 910 Number of holders of less than a marketable parcel of shares
Nil
D. 20 largest holders of quoted securities The names of the 20 largest shareholders of each class of equity security as at 23 March 2015 are listed below:
No. Name No. of shares held % of total shares 1 Washington H. Soul Pattinson Co Ltd 9,964,750 19.37 2 UBS Nominees Pty Ltd 4,342,075 8.44 3 Optimist International Investments Limited 2,775,833 5.40 4 National Nominees Limited 2,389,861 4.65 5 Jarrod Ritchie 2,016,718 3.92 6 Sico Holdings Pty Ltd 1,957,672 3.81 7 HSBC Custody Nominees (Australia) Limited 1,952,921 3.80 8 Sky Lights Pty Ltd 1,552,160 3.02 9 Gaspard Boot 1,014,001 1.97 10 Sidney J Jansma Jr 1,000,000 1.94 11 Jarrod Ritchie & Catrina Ritchie 986,555 1.92 12 HSBC Custody Nominees (Australia) Limited 947,758 1.84 13 Langburgh Pty Ltd 723,173 1.41 14 Gowing Bros Limited 666,667 1.30 15 Espasia Pty Ltd 631,962 1.23 16 Espasia Pty Ltd 597,784 1.16 17 Mark Feldschuh Superannuation Pty Ltd 484,001 0.94 18 Contract Control Services Pty Ltd 333,333 0.65 19 Radiata Investments Pty Ltd 317,996 0.62 20 Rubi Holdings Pty Ltd 316,000 0.61
34,971,220 68.00 E. Shares subject to restriction arrangements The total number of shares subject to restriction arrangements is 5,996,504 shares. These shares were all escrowed for a period of two years from the date of official quotation on the ASX 13 August 2015. These shares will be released from escrow on 13 August 2017.
For
per
sona
l use
onl
y

BOARD OF DIRECTORS AND COMPANY PARTICULARS
TPI ENTERPRISES LTD – 2015 ANNUAL REPORT 48
Directors Auditors Peter Robinson Jarrod Ritchie Todd Barlow
KPMG 10 Shelley Street Sydney NSW 2000
Secretary Australian Company Number Roger McPherson
107 872 453
Registered Office Share Registry Link Market Services Limited Level 1 333 Collins Street Melbourne Vic 3000 Tel: +61 3 9301 0800 Fax: +61 3 9301 0899
Link Market Services Limited Level 1 333 Collins Street Melbourne Vic 3000
Mailing Address Stock Exchange Listing PO Box 2139 Melbourne VIC 3001
Australian Securities Exchange (ASX Code: TPE)
Website www.tpienterprises.com
For
per
sona
l use
onl
y