Re- Imagine the way How HR is reshaped for Start up community

5/23/2017
1
1
Disclaimer
2
• The information in this presentation about the WorleyParsons Group and its activities is current as at 30 April 2017 and should be read in conjunction with the Company’s Appendix 4D and Interim Financial Report for the half year ended 31 December 2016. It is in summary form and is not necessarily complete. The financial information contained in the Interim Financial Report for the half year ended 31 December 2016 has been reviewed, but not audited by the Group's external auditors. The financial information presented to YTD March 2015 and the Third Quarter financial information has not been reviewed or audited by the Group’s external auditors.
• This presentation contains forward looking statements. These forward looking statements should not be relied upon as a representation or warranty, express or implied, as to future matters. Prospective financial information has been based on current expectations about future events and is, however, subject to risks, uncertainties, contingencies and assumptions that could cause actual results to differ materially from the expectations described in such prospective financial information. The WorleyParsons Group undertakes no obligation to update any forward-looking statement to reflect events or circumstances after the date of the release of this presentation, subject to disclosure requirements applicable to the Group.
• Nothing in this presentation should be construed as either an offer to sell or solicitation of an offer to buy or sell WorleyParsons Limited securities in any jurisdiction. The information in this presentation is not intended to be relied upon as advice to investors or potential investors and does not take into account your financial objectives, situation or needs. Investors should consult with their own legal, tax, business and/or financial advisors in connection with any investment decision. F
or p
erso
nal u
se o
nly
5/23/2017
2
Registration
Welcome and Context
OneWay Moment
Financial Update
Strategy Update
Q&A
Morning Tea
Saudi Arabia Belt & Road InitiativeHeavy Oil New EnergyOffshore Integrated Solutions / RefiningOnshore Conventional Chemicals
Q&A
Wrap Up
Lunch
3
Agenda
Biggest energy industry transition in 50 years, for which we are well positioned
Disproportionate growth in emerging markets, where we have an enviable track record for impact
Digital disruption of engineering putting a premium on innovative people with real world know how
4
Context: market inflexion point
Energy and resources consumption
continues to increase while investment is not keeping pace.
• We are almost through one of the biggest energy and resource industry transitions in 40 years.
• Consumption continues to grow while investment in supply to meet that demand is not keeping pace
• Our customers are indicating returns to capex and opex growth
• There is a disproportionate growth in emerging markets
• Digital disruption of engineering is putting a premium on innovative people with real world know how
For
per
sona
l use
onl
y

5/23/2017
3
Context: our business is reshaped and resized
• We have reshaped the business into four business lines reflecting our customers’ structures
• We have significantly reduced overhead
• We are prepared for the continued change in the energy and resource markets
Reshaping the business over the last
3 years has us well positioned for a market return
5
6
For
per
sona
l use
onl
y

5/23/2017
4
7
Tom Honan
Group Managing Director, Finance / CFO
Financial Update
8
For
per
sona
l use
onl
y

5/23/2017
5
Introduction• Market inflexion - backlog is increasing
• Highly confident in meeting cost reduction targets
• Staff numbers stabilised and utilisation on target
• Cash collection measures starting to have an impactOur business is leaner, with lower overhead,
more focused on delivering
customer value
9
Business consolidated
108offices
42countriesPeople
23,100
10
For
per
sona
l use
onl
y

5/23/2017
6
Headcount stabilized
11
Staff Utilization – on target Staff Numbers - stabilised
On track to meet increased cost reduction target of $450 million
1,450
1,000
1,3301,250
1,030
120
80
220
30
12
For
per
sona
l use
onl
y

5/23/2017
7
Focus on ensuring key overhead savings remain sustained as the business grows
13
Focus on ensuring key overhead cost areas remain right sized as the business grows
Business Development
• Investment in improved BD effectiveness
• Global Sales and Marketing group operating to ensure focus on priority opportunities and best practice sharing
Bench / Project Support
• Sustainable improvements in utilization of billable staff through
• Increased transparency and active management of performance vs targets
• Adoption of flexible work models
Property• Optimized property portfolio
• Capacity retained where future expansion and growth is targeted
IT
• Transformation of IT function with significant benefits
• New optimized global/regional operating model
• On-going simplification and standardization
Functional
• Regional model established with pooled resources offering efficiencies in leadership and ability to scale up at reduced cost
• On-going standardization of key functional processes to enable additional resource aggregation and a leaner structure
Management• Streamlined management structure which removes duplication and increase focus on client
service delivery
14
For
per
sona
l use
onl
y

5/23/2017
8
Working Capital Update
• Update on $230m from four SOE• Cash received $17m• In transit $33m• Additional $32m expected next week • The balance is continuing in process
• DSO improvements on underlying business• DSO reduced by 7 days from December 31 to April 30• 16/28 businesses have improved from December 31
• Competitor review shows collections have slowed in past 24 months
15
Industry DSO has been rising over last 2 years
16
DSO for 11 Major Oil & Gas Services Peers
For
per
sona
l use
onl
y
5/23/2017
9
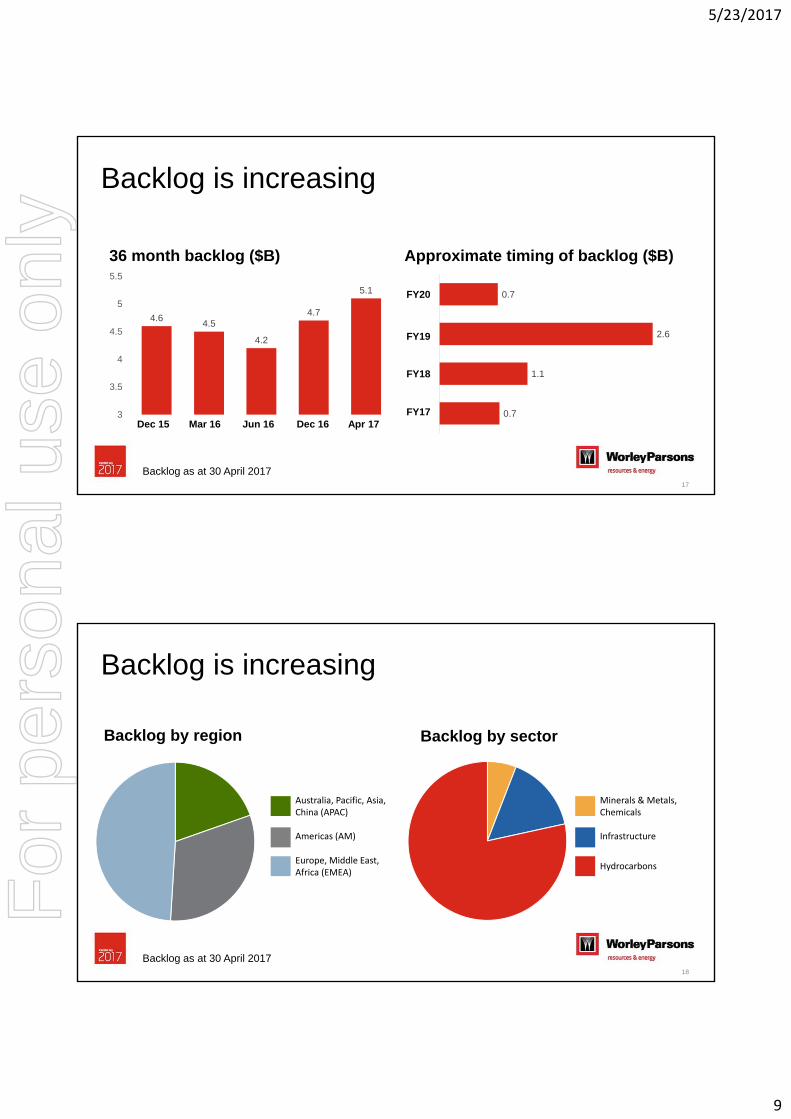
Backlog is increasing
36 month backlog ($B)
4.64.5
4.2
4.7
5.1
3
3.5
4
4.5
5
5.5
Approximate timing of backlog ($B)
0.7
1.1
2.6
0.7
17
Dec 15 Mar 16 Jun 16 Dec 16 Apr 17
FY20
FY19
FY18
FY17
Backlog as at 30 April 2017
Backlog is increasing
Backlog by region Backlog by sector
18
Backlog as at 30 April 2017
Australia, Pacific, Asia, China (APAC)
Americas (AM)
Europe, Middle East, Africa (EMEA)
Minerals & Metals, Chemicals
Infrastructure
Hydrocarbons
For
per
sona
l use
onl
y

5/23/2017
10
Backlog growth
4.25.1
0.0 0.1 0.7
-
1.0
2.0
3.0
4.0
5.0
6.0
A$'B
4.25.1
0.00.1 0.8
-
1.0
2.0
3.0
4.0
5.0
6.0
A$'B
Backlog by region Backlog by sector
19
• Highly confident of achieving overhead reduction
• Staff numbers stabilized
• Chargeability on target
• Winning more work and backlog increasing
• Cash collection measures starting to have an impact
Business Metrics Update Summary
20
Summary
For
per
sona
l use
onl
y

5/23/2017
11
Andrew Wood - CEO
Strategy and Market Update
21
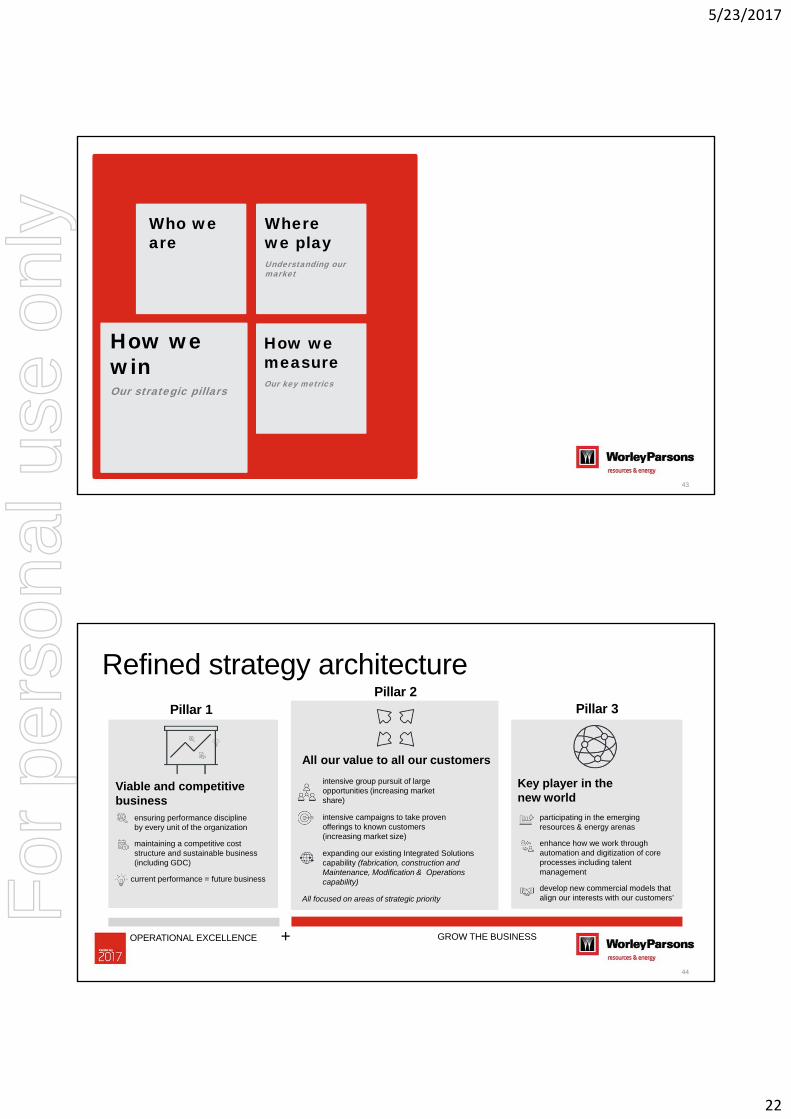
Who we are
How we win
How we measure
Where we playUnderstanding our market
Our key metricsOur strategic pillars
22
For
per
sona
l use
onl
y

5/23/2017
12
Who we are
How we win
How we measure
Where we playUnderstanding our market
Our key metricsOur strategic pillars
23
24
For
per
sona
l use
onl
y
5/23/2017
13
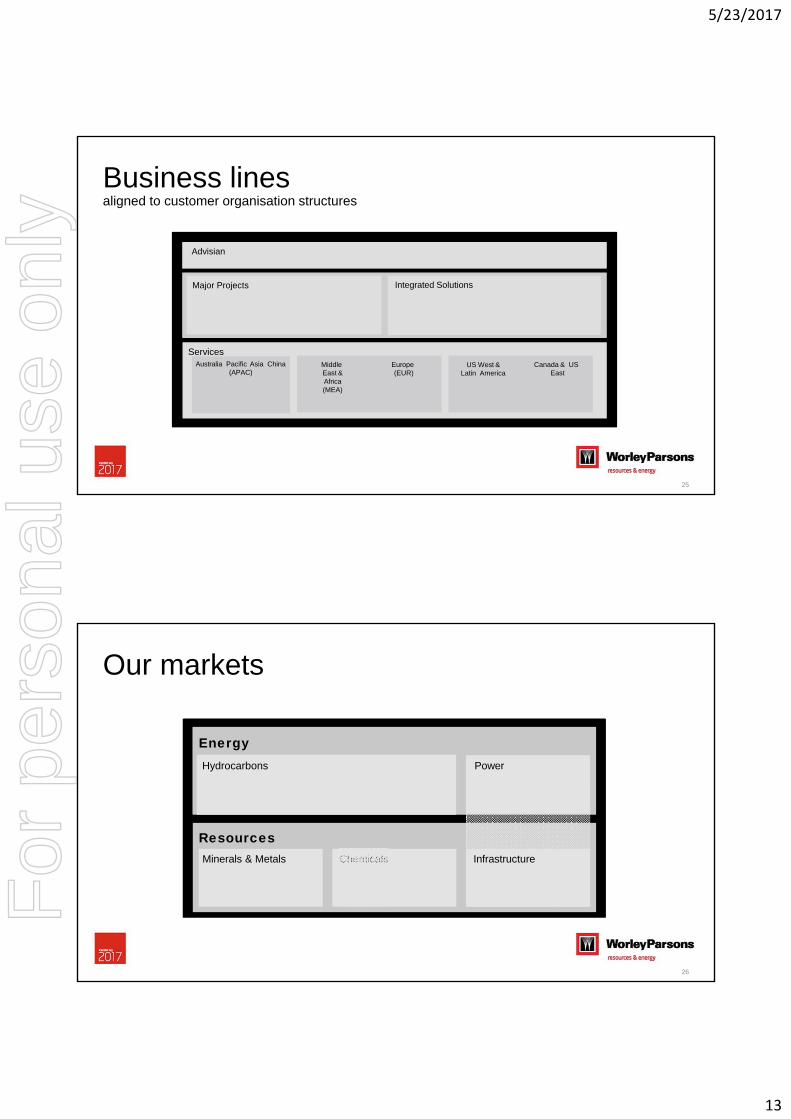
Advisian
ServicesMiddle East & Africa(MEA)
Europe (EUR)
US West & Latin America
Canada & USEast
Australia Pacific Asia China (APAC)
Major Projects Integrated Solutions
Business linesaligned to customer organisation structures
25
Resources
Hydrocarbons
EnergyPower
InfrastructureChemicalsMinerals & Metals
Our markets
26
For
per
sona
l use
onl
y

5/23/2017
14
Bulk of our business is small projects and asset services
27
Typical project duration
< 12 months
Typical order book visibility
6 – 36 months
Understanding the business – typical profile
23
69
85
10
34
21
15
81
43
10
9
Region
Sector
Commercial model
CAPEX VS OPEX
Hydrocarbons MMCInfrastructure
Reimbursable
Major Projects Opex
APAC EMEA Americas
Modification, Sustaining and small capex
Fixed price/Lump Sum
key messagesabout our business
We are focused on projects of all sizes • 90% of our revenue comes from smaller
projects and opex contracts
We have a significant infrastructure business• Infrastructure has grown to >20% of revenue
Competitor consolidation and diversification has heightened our ability to compete • 8 major competitors will become 6
3
28
For
per
sona
l use
onl
y

5/23/2017
15
How we win
How we measure
Where we playUnderstanding our market
Our key metricsOur strategic pillars
Who we are
29
Biggest energy industry transition in 40 years, for which we are well positioned
Disproportionate growth in emerging markets, where we have an enviable track record
Digital disruption of engineering putting a premium on innovative people with real world know how
30
We help our customers meet the world’s changing resources and energy needs.
For
per
sona
l use
onl
y

5/23/2017
16
• Onshore Conventional
• Offshore
• Heavy Oil & Oil Sands
• Chemicals & Petrochemicals (Europe)
• Minerals & Metals
• Power–Fossil (MENA&SEA)
• Saudi Arabia
• Maintenance, Modificationsand Operations (MMO)
• New Energy
• Digital (internal capability & external products)
• Belt & Road Initiative
Strategic prioritiesActing concurrently on priorities across three horizons
Horizon 1Core growth
Horizon 2Growth Potential
Horizon 3Emerging markets & products
31
IEA: International Energy AgencyEIA: US Energy Information AdministrationMIT: MIT Joint Program on the Science and Policy of Global ChangeIEEJ: Institute of Energy Economics JapanIHS: IHS EnergyPIRA: PIRA Energy GroupXOM: ExxonMobilCNPC: CNPC Economics & Technology Research Institute
Our core market remains attractive into the future
32
• Multiple long-term energy outlooks with varying predictions
• All outlooks indicate a modest growth in oil, with gas growing more rapidly than oil
• The rapid expansion of LNG is likely to lead to a globally integrated gas market
• Oil demand grows, but the pace of demand slows with the increasing penetration of electric cars
Energy mix projections to 2035-40
For
per
sona
l use
onl
y

5/23/2017
17
Under investment is creating a supply demand gap
• Three years of suppressed investment leads to a potential supply demand gap without significant increase in investment
• To fill the gap, future annual approvals must exceed 21 billion barrels, greater than any average level seen since the 1970s
Source: IEA World Energy Outlook 2016; Rystad Energy for historic levels
33
Worldwide oil production is declining at an increasing rate
• Existing fields decline on an average 5-7% p.a., equivalent to around 4.5-6 mbd of lost production every year
• By 2040 the world needs to replace over four times the current crude oil output of Saudi Arabia (>40mbd), just to keep output flat
Source: IEA World Energy Outlook 2016, HSBC Peak Oil Reps
34
For
per
sona
l use
onl
y
5/23/2017
18
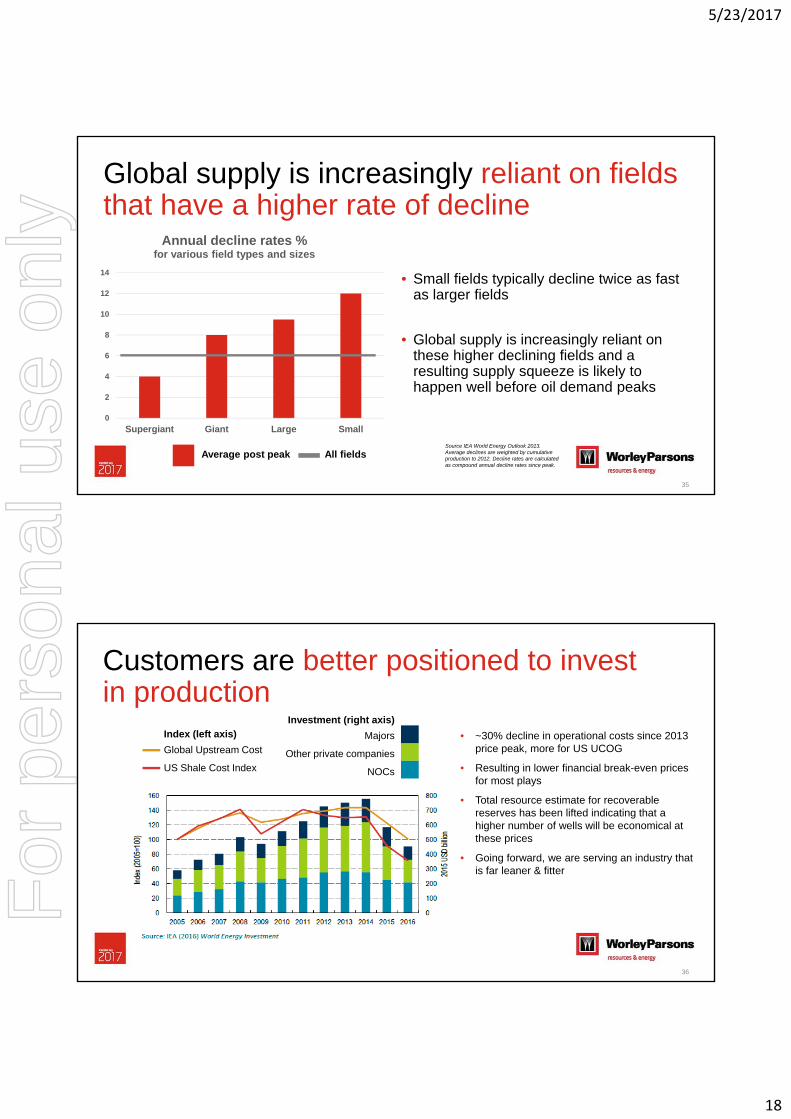
Global supply is increasingly reliant on fields that have a higher rate of decline
0
2
4
6
8
10
12
14
Supergiant Giant Large Small
Annual decline rates % for various field types and sizes
• Small fields typically decline twice as fast as larger fields
• Global supply is increasingly reliant on these higher declining fields and a resulting supply squeeze is likely to happen well before oil demand peaks
35
Average post peak All fieldsSource IEA World Energy Outlook 2013. Average declines are weighted by cumulative production to 2012. Decline rates are calculated as compound annual decline rates since peak.
Customers are better positioned to invest in production
36
• ~30% decline in operational costs since 2013 price peak, more for US UCOG
• Resulting in lower financial break-even prices for most plays
• Total resource estimate for recoverable reserves has been lifted indicating that a higher number of wells will be economical at these prices
• Going forward, we are serving an industry that is far leaner & fitter
Investment (right axis)
Majors
Other private companies
NOCs
Index (left axis)
Global Upstream Cost
US Shale Cost Index
For
per
sona
l use
onl
y

5/23/2017
19
Strengthening Customer Capex Budgets
37
Source: Source: Factset. Broker consensus capex estimates for Anadarko Petroleum, BP, Canadian Natural Resources, Chevron, China Petroleum & Chemical, CNOOC, ConocoPhillips, Devon Energy, Eni, EOG Resources, ExxonMobil, Gazprom, Occidental Petroleum, Oil & Natural Gas Corp, PetroChina, Repsol, Rosneft, Royal Dutch Shell, Statoil, Suncor Energy, Surgutneftegas and Totalas at May 2017.
• Trend indicates continued strengthening
WorleyParsons is positioned in low cost markets with onshore conventionals our core business
38
Percentage of WorleyParsons hydrocarbons business
WorleyParsons FY17 H1F
Comparative oil & gas market project cost
BP Energy Outlook 2017
Large field onshore
DeepwaterShallow water
US tight oil
Other tight oilOil sands
Source: BP Energy Outlook 2017, WorleyParsons Revenue
For
per
sona
l use
onl
y

5/23/2017
20
Top Global Operator Spend: 3-year CAPEX & OPEX Spend (US$B): 2017-2019 at $50bbl/oil price
Long term relationships with top spending customers
• Existing long-term service agreements with 8 of the top 15 global operators
• Recently secured 5-year enterprise framework agreement with Shell
• Strategic focus on National Oil Companies (NOCs) increasingly important
Source Rystad Energy: Exploration & Production services group spend, $50bbl/oil sensitivity, includes spend upstream only, excludes ‘other partner(s) US’ category, as at 16th May 2017
‐
20
40
60
80
100
120
140
160
SaudiAramco
PetroChina Petrobras Shell ExxonMobil Gazprom Rosneft BP Statoil Chevron Total Pemex Eni PDVSA Lukoil
Existing long‐term framework agreements
39
Impact of electric vehicles not a game changer yet
with electric vehicles (EVs) comprising less than 1% of global fleet
Global car fleet currently consumes 1/5th total oil production
by 2035, global fleet is expected to double with electric vehicles comprising less than 6%
900 million 1.2 million 1.8 billion 100 million
2016 2035
• There is a great deal of uncertainty in electric vehicle (EV) targets
• Assuming a range of EV targets, the impact to oil demand to 2035 is moderate and overall oil demand remains in its growth trajectory
Source: International Energy Agency (IEA), BP Energy Outlook 2017
40
For
per
sona
l use
onl
y

5/23/2017
21
key messagesabout our markets
North American Shale is only one part of meeting global energy need• Significant investment required in all regions• Onshore and Offshore• Greenfield and Brownfield• Conventional and Unconventional
The hydrocarbons development activity will continue to grow at the current oil price• Oil & Gas companies can spend and develop at
current oil prices
New Energy investment will be supplementary to long term growth in investment in oil & gas • There is no short term material impact on oil & gas
demand• We are well placed for the significant investment in
infrastructure for new energy
3
41
42
• Demand is growing • Supply balanced • CAPEX returning
• We are well positioned for future growth• Right Capability• Geographically
Summary
Demand is growing1
Supply balanced2
CAPEX returning3
No
w
No
w
No
w
For
per
sona
l use
onl
y
5/23/2017
22
How we winOur strategic pillars
Who we are
Where we playUnderstanding our market
How we measureOur key metrics
43
Refined strategy architecture
GROW THE BUSINESSOPERATIONAL EXCELLENCE
Viable and competitivebusiness
• ensuring performance discipline by every unit of the organization
• maintaining a competitive cost structure and sustainable business (including GDC)
• current performance = future business
All our value to all our customers
• intensive group pursuit of large opportunities (increasing market share)
• intensive campaigns to take proven offerings to known customers(increasing market size)
• expanding our existing Integrated Solutions capability (fabrication, construction and Maintenance, Modification & Operationscapability)
All focused on areas of strategic priority
Key player in the new world
• participating in the emerging resources & energy arenas
• enhance how we work through automation and digitization of core processes including talentmanagement
• develop new commercial models that align our interests with our customers’
+
44
Pillar 1Pillar 2
Pillar 3
For
per
sona
l use
onl
y

5/23/2017
23
Pillar 1
45
OPERATIONAL EXCELLENCE
Viable andcompetitive business• ensuring performance discipline
by every unit of the organization
• maintaining a competitive cost structure and sustainable business (including GDC)
• current performance = future business
46
GROW THE BUSINESS
All our value to all ourcustomers
• intensive group pursuit of global large opportunities(Swarm)
• intensive campaigns to take proven offerings to known customers (Sprint)
• expanding our existing Integrated Solutions capability
All focused on areas of strategic priority
Pillar 2• Global Sales & Marketing group
consolidated in FY17H1
• Win rate for major contracts increased to ~40% from ~20% 12 months ago
• To Improve market share
For
per
sona
l use
onl
y

5/23/2017
24
47
GROW THE BUSINESS
All our value to all ourcustomers
• intensive group pursuit of global large opportunities(Swarm)
• intensive campaigns to take proven offerings to known customers (Sprint)
• expanding our existing Integrated Solutions capability
All focused on areas of strategic priority
Pillar 2
Measurable Performance
• Sprint programs focused on key priority areas
• Co-ordinated by GSM / run by the businesses
• Scorecard reports
• To increase market size
GROW THE BUSINESS
All our value to all ourcustomers
• intensive group pursuit of global large opportunities(Swarm)
• intensive campaigns to take proven offerings to known customers (Sprint)
• expanding our existing Integrated Solutions capability
All focused on areas of strategic priority
Pillar 2
Integrated Solutions Expansion
• Take our differentiated EPC and fabrication solutions from Canada, Norway and New Zealand to other markets
• Continue expansion of MMO across sectors and geographies
• By importing knowledge and capability or through partnering or acquisition
48
For
per
sona
l use
onl
y
5/23/2017
25
49
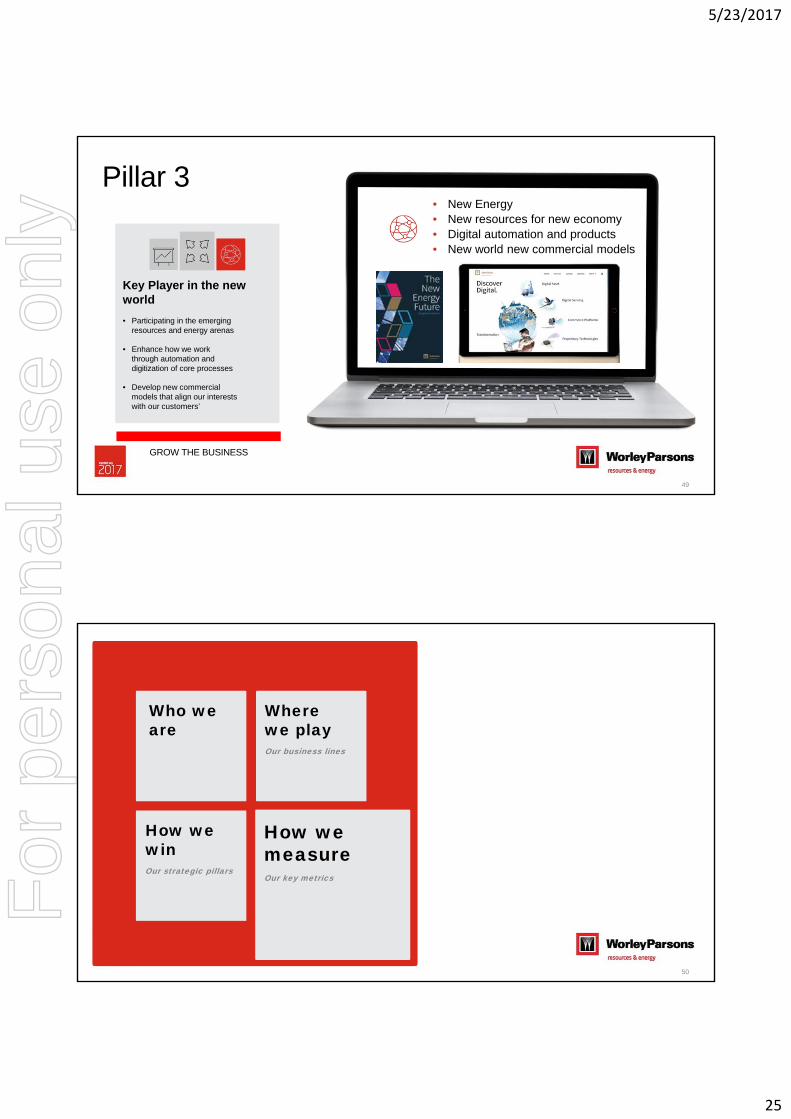
GROW THE BUSINESS
Key Player in the new world
• Participating in the emerging resources and energy arenas
• Enhance how we work through automation and digitization of core processes
• Develop new commercial models that align our interests with our customers’
Pillar 3• New Energy• New resources for new economy• Digital automation and products• New world new commercial models
How we win
How we measureOur key metrics
Our strategic pillars
Who we are
Where we playOur business lines
50
For
per
sona
l use
onl
y

5/23/2017
26
• Backlog• Customer satisfaction
• TSR• EPS Growth
Metrics
• Balance Sheet / DSO• Margin
Viable and competitivebusiness
All our valueto all our customers
Key player in the newworld
Results link to shareholder value
51
• Backlog• Customer satisfaction• Backlog• Customer satisfaction
• TSR• EPS
Growth
• TSR• EPS
Growth
Metrics
• Balance Sheet / DSO• Margin
Metrics
• Balance Sheet / DSO• Margin
Viable and competitivebusiness
Viable and competitivebusiness
All our valueto all our customersAll our valueto all our customers
Key player inthe newworld
Key player inthe newworld
• Backlog• Customer satisfaction
• TSR• EPS
Growth
Metrics
• Balance Sheet / DSO• Margin
Viable and competitivebusiness
All our valueto all our customers
Key player inthe newworld
52
Executive Scorecard
Results link to shareholder value and Executive Remuneration
For
per
sona
l use
onl
y

5/23/2017
27
53
Biggest energy industry transition in 40 years, for which we are well positioned
Disproportionate growth in emerging markets, where we have an enviable track record for impact
Digital disruption of engineering putting a premium on innovative people with real world know how
Q&A
54
For
per
sona
l use
onl
y

5/23/2017
28
Strategy in action
55
• Onshore Conventional
• Offshore
• Heavy Oil & Oil Sands
• Chemicals & Petrochemicals (Europe)
• Minerals & Metals
• Power–Fossil (MENA&SEA)
• Saudi Arabia
• Maintenance, Modificationsand Operations (MMO)
• New Energy
• Digital (internal capability & external products)
• Belt & Road Initiative
Horizon 1Core growth
Horizon 2Growth Potential
Horizon 3Emerging markets & products
56
Strategic prioritiesActing concurrently on priorities across three horizons
For
per
sona
l use
onl
y

5/23/2017
29
Strategy in action
Krishnaswamy (Krish) Iyer
Regional Managing Director -Services, Middle East and Africa
Saudi Arabia
Belt & Road Initiative
Karen Sobel
Regional Managing Director -Services, Canada and US East
Heavy Oil and Oil Sands New Energy
Neil Robertson
Regional Managing Director -Services, US West and LatinAmerica
Offshore
Integrated Solutions
Alan Gordon
Regional Managing Director -Services, Europe
Chemicals and Petrochemicals Onshore Conventional
57
For
per
sona
l use
onl
y

5/23/2017
30
• Onshore Conventional
• Offshore
• Heavy Oil & Oil Sands
• Chemicals & Petrochemicals (Europe)
• Minerals & Metals
• Power–Fossil (MENA&SEA)
• Saudi Arabia
• Maintenance, Modificationsand Operations (MMO)
• New Energy
• Digital (internal capability & external products)
• Belt & Road Initiative
Horizon 1Core growth
Horizon 2Growth Potential
Horizon 3Emerging markets & products
59
Strategic prioritiesActing concurrently on priorities across three horizons
Al Khobar
RiyadhYanbu
WorleyParsons is a trusted name in Saudi Arabia.
3 offices, 1500 staff: Al Khobar, Riyadh and Yanbu
PANEL CONTRACTS
• 35 years of General Engineering Services (GES/ GES+) services
• 13 years of offshore Maintain Potential Program (MPP)
• 4 years of Master Services Agreement (MSA) for Saudi Electric
MEGA PROGRAMS
17 multibillion dollar programs delivered including:
• JCP & NCP Petrochemical complex
• SAMREF Clean Fuels program
• Ma’aden Alumina, Phosphate and Infrastructure programs
• Riyadh metro
Master Planning – ArriyadhDevelopment Authority
Master Planning – ArriyadhDevelopment Authority
Master Planning – ArriyadhDevelopment Authority
Saudi Electric Company –PP14 EPCM
Saudi Electric Company –PP14 EPCM
Saudi Electric Company –PP14 EPCM
Saudi Aramco –GES+ ContractSaudi Aramco –GES+ ContractSaudi Aramco –GES+ Contract
Saudi Aramco – Southern Area Portfolio FEED and PMC
Saudi Aramco – Southern Area Portfolio FEED and PMC
Saudi Aramco – Southern Area Portfolio FEED and PMC
60
Saudi Arabia – A robust platform has been built
For
per
sona
l use
onl
y

5/23/2017
31
2014 Now
Saudi Arabia – Growing together in our core marketsSuccessfully capturing the growth in
spend across Saudi ArabiaSaudi Arabia Upstream Exploration and Production
CAPEX & OPEX (US$ Billions) at $50/bbl oil price sensitivity
>60% growth in revenue in Saudi Arabia since 2014
Upstream Oil & Gas
Midstream & Downstream
Growing capital and operational expenditure across all Sectors
Key drivers for growth:• 2030 Vision - Target to become the second largest
exporter of refined oil products by 2018• Saudi Aramco plans to spend $334bn across the oil
and gas value chain by 2025
Sources: MEED Middle East Business Intelligence; Rystad Energy, Global Data
Saudi Arabia Midstream & Downstream CAPEX only(US$ Billions) Refining, LNG regas, gas processing, pipelines, storage
0
10
20
30
40
2017 2018 2019 2020 2021 2022
Offshore
Onshore
Source: Rystad Energy
1
2
3
4
5
6
2017 2018 2019 2020 2021 2022
Source: Global Data
61
Saudi Arabia – Beyond Oil
Chemicals & Petrochemicals
• Petrochemicals growing at 6% p.a.• Market size: US$64 in 2020• Comprises 60% of non-oil investment
SECTOR OUTLOOK
Mining & Metals• Forecast to triple in size in the next decade to
become the 3rd economic pillar• Market size: US$70B in 2030
OUR DIFFERENTIATED POSITION
Power & Water• EPCM services for PP-13 & PP-14 CCGT Power • Integrated team with SEC (Panel Contract)• Jazan Power Project, 4000MW IGCC
Transport• 8% y-o-y growth to 2020• US$180B billion projects underway• US$450B transport infrastructure planned
• IPMT Riyadh Metro Project• US$5B King Abdullah Port (Detailed Design)• Master Planning Services for Arriyadh
• Both power & water demand growing at 8%• ~US$135B to meet power demand to 2026 • ~US$25B planned for desalination to 2020
Sources: Jeddah Chamber of Commerce & Industry “Saudi Arabia – Industrial Sector Overview Report, 2016”; Oxford Economics ; Gulf Base
• US$4.5B Phosphate and Infrastructure Project• US$10.8B Bauxite Mine and Alumina refinery• Early studies for Mansourah and Massarah Gold
• Global master service agreement with SABIC• FEED for SABIC ethylene project• Supporting outbound Aramco and SABIC spend
62
For
per
sona
l use
onl
y

5/23/2017
32
Saudi Arabia - Investing in national transformation through the WorleyParsons Academy
• In support of Vision 2030 KSA has released the National Transformation Program 2020 (NTP) aimed at diversifying from oil and creating employment by remodelling supply chains
• For Aramco this is reflected in the In Kingdom Total Value Add (IKTVA) program.
Investing in national transformation through the WorleyParsons Academy
1. Major commitment and investment in recruiting and training Saudi nationals
2. Strategic partnerships with universities, technology providers and accreditation agencies
3. Developing and elevating Saudi nationals to project leadership, technical leadership and executive management roles
OUR DIFFERENTIATED POSITION
Insert Academy Photos as per previous revision
63
• Connecting China with countries and establishing trade corridors
• $150+ billion in funding recently pledged by China
• Chinese companies have set up 56 economic cooperation zones in over 20 countries
Belt & Road (B & R) Initiative
Sources: Business Monitor International (BMI), PwC
Belt & Road
Transport Networks
Mining Projects
Industrial & Manufacturing
Facilities
Telecoms Infrastructure
and TMT Services
Power Plants &
Transmission Grids
Energy Infrastructure
64
For
per
sona
l use
onl
y

5/23/2017
33
Belt & Road – Positioning for cross-sector investment
Infrastructure
SECTOR OUTLOOK
Power• Power generation and networks represent
40% of planned B&R spend• Coal and hydropower sectors primarily
OUR DIFFERENTIATED POSITION
Oil & Gas• Mtwara to Dar es Salaam Pipeline in Tanzania
with CPTDC• Multiple gas projects with CNOOC in Asia
Minerals & Metals• Focus is mainly on Central Asian states such
as Kazakhstan, where rich deposits of copper, gold and uranium
• Established offices in Kazakhstan• Centre of excellence in South Africa
• Natural gas and LNG sectors in South and South East Asia
• Central Asia to remain key energy exporters
Sources: Business Monitor International (BMI), Engineering News
• Cradle to grave coal-fired power capability• Global partnership with Siemens• Delivering projects with major Chinese EPCs
• Proven MOU with China Harbors (CHEC)• Low-cost Ports GDC in Chennai • Global leaders in heavy haul rail
• Asia accounts for 60% of B&R investment• Large focus on transport (ports and rail)• Trade routes enhancement and new routes
65
Belt & Road - Supporting Chinese investors and EPCs to succeed in overseas market
OUR DIFFERENTIATED POSITION
• Largest international EPCM company in China
• Established strategic partnership with 10+
leading Chinese investors and EPCs across all
sectors
• Complete geographic coverage
• Strong relations with government entities and
potential in Belt & Road countries
KSA – Halfaya Gas Processing Plant
Venezuela –El Vigia CCGT Power Plant
KSA – Jazan Power Project, 4000MW IGCC
Actively pursuing US$10B+ in Belt & Road projects across Russia, Central Asia, Middle
East & South East Asia
Nigeria - Total Egina FPSO Project
66
For
per
sona
l use
onl
y

5/23/2017
34
• Significant China presence and strategic partnership with Chinese investors and EPC
• Local presence, delivery track record across sectors in the Belt & Road countries
• Well-positioned to capitalize on the investment in the Belt & Road countries
Belt & Road Initiative
Saudi Arabia• Robust and diversified business built on strong delivery record
• Significant investment across oil & gas, infrastructure, power & minerals & metal sectors in the next 5-10 years and well positioned to increase our market share
• Leading the way in localization through the WorleyParsons Academy
67
Summary
For
per
sona
l use
onl
y

5/23/2017
35
• Onshore Conventional
• Offshore
• Heavy Oil & Oil Sands
• Chemicals & Petrochemicals (Europe)
• Minerals & Metals
• Power–Fossil (MENA&SEA)
• Saudi Arabia
• Maintenance, Modificationsand Operations (MMO)
• New Energy
• Digital (internal capability & external products)
• Belt & Road Initiative
Horizon 1Core growth
Horizon 2Growth Potential
Horizon 3Emerging markets & products
69
Strategic prioritiesActing concurrently on priorities across three horizons
doingmore
with less
70
For
per
sona
l use
onl
y

5/23/2017
36
CPC well pad video here
71
72
For
per
sona
l use
onl
y

5/23/2017
37
73
74
Canadian Oil Industryopen for business
billions of dollars45.6
Sector M&A –Last 12 Months
SU
Source: Canadian Media
SU CNB CVE PEM EMB 7GENS HF
For
per
sona
l use
onl
y

5/23/2017
38
75
Canadian Oil Industryopen for business
Q1 2017
Q1 2016Cenovus
IOLEncana
Vermilion
millions of dollars
Industry Comparisons –Q1 2017 vs. Q1 2016
Source: Quarterly Results Release
201616B 2017 (F)
37B
Source:
Canadian Oil Industryopen for business
Canadian Oil & Gas capital spending
76
For
per
sona
l use
onl
y

5/23/2017
39
77
New Energy – A Different Business Paradigm
78
For
per
sona
l use
onl
y

5/23/2017
40
WorleyParsons in New Energy
Lake Turkana Wind Project
• One of the largest, most difficult logistically in the world
• Deep PMC & OE role
• 365 Turbines over 160km2
• 600km from Nairobi, Kenya
• 7M man-hours with an excellent safety record
79
WorleyParsons in New Energy
ESCRI Battery Storage Project
• Renewable integration issues in South Australia emerging
• All grids will face similar issues
• First attempt to overcome using large scale batteries
• Project initiated and directed by WorleyParsons – now in delivery phase
80
For
per
sona
l use
onl
y

5/23/2017
41
Bottom Line
• WorleyParsons executes small projects AND major projects
• Opportunity in Canadian heavy oil improving• Our innovative solutions are recognized
• We see the New Energy future
• WorleyParsons is well placed to capture
81
For
per
sona
l use
onl
y

5/23/2017
42
• Onshore Conventional
• Offshore
• Heavy Oil & Oil Sands
• Chemicals & Petrochemicals (Europe)
• Minerals & Metals
• Power–Fossil (MENA&SEA)
• Saudi Arabia
• Maintenance, Modificationsand Operations (MMO)
• New Energy
• Digital (internal capability & external products)
• Belt & Road Initiative
Horizon 1Core growth
Horizon 2Growth Potential
Horizon 3Emerging markets & products
83
Strategic prioritiesActing concurrently on priorities across three horizons
ExxonMobil HebronUnderpinning organizational performance
• World class safety performance: ExxonMobil President’s SSH&E award
• World’s largest transverse loadout
• Disciplined execution
• Current performance = future work
For
per
sona
l use
onl
y

5/23/2017
43
Offshore E&P Growth on the Horizon
Offshore E&P Expenditure Growth, 2018 –2023 Australia: 58%
Middle East: 45%
South America: 31%
Western Europe: 17%
South Asia 10%
Source: Rystad EnergyProjected spend based on assumption of $50/bbl
0
100
200
300
400
500
600
2014 2015 2016 2017 2018 2019 2020 2021 2022 2023 2024 2025
Offshore E&P Expenditure (BUSD)
Statoil: 35%
Petrobras: 33%
ConocoPhillips: 19%
Saudi Aramco: 16%
Chevron: 10%
85
Offshore DifferentiatorsFirst in Class from Front-End through Installation
Diverse Expertise
All Scopes In-House
Integrated Solutions
Phases: Advisory Front End Design Construction Integration Installation
Geographies: Gulf of Mexico, Caribbean, Asia, North Sea, Middle East, Canada, Australia, Russia
Subsea
Topsides
Decomissioning Joint Industry Project
Asset Life Cycle: Greenfield Brownfield/Asset Management Decommissioning
Conditions: Shallow Deep; Mild Harsh
FlexIQ/Flexas Flexible Riser Integrity Management
Reservoir to Market (R2M) Concept Selection Model
Pipeline
Hull
World-class portfolio-based asset management
BP Gulf of Mexico Portfolio EPC
Focused on maximizing value of customers’ existing assets
Creates project backlog regardless of market conditions
INTECSEA-Mexssub Pipeline Integrity ManagementTechnology
Low-Motion FPSO
86
For
per
sona
l use
onl
y

5/23/2017
44
Offshore DifferentiatorsFirst in Class: Front-End through Installation & Beyond
Diverse Expertise
All Scopes In-House
Technology
Phases: Advisory Front End Design Construction Integration Installation
Geographies: Gulf of Mexico, Caribbean, Asia, North Sea, Middle East, Canada, Australia, Russia
Subsea
Topsides
Low-Motion FPSO
Decomissioning Joint Industry Project
Asset Life Cycle: Greenfield Brownfield/Asset Management Decommissioning
Conditions: Shallow Deep; Mild Harsh
FlexIQ/Flexas Flexible Riser Integrity Management
Reservoir to Market (R2M) Concept Selection Model
Pipeline
Hull
World-class portfolio-based asset management
Focuses on maximizing value of customers’ existing assets
Creates backlog regardless of market conditions
INTECSEA-Mexssub Pipeline Integrity Management
BP Gulf of Mexico Portfolio EPC
Integrated Solutions
88
For
per
sona
l use
onl
y

5/23/2017
45
BP Gulf of MexicoPortfolio Delivering Sustainable Value in a Long-Term Relationship
• Upgrades and maintenance for BP’s full fleet of deepwater assets in GoM
• 2009-2017: Provider of engineering and procurement
• February 2017: Awarded 5-year EPC contract in JV with Grand Isle Shipyard
• Commercial model translatable to other customers and regions
NaKika
Thunder Horse
AtlantisMad Dog
Houston
89
• Safer, cleaner, more efficient technology
• Eliminates hydrofluoric acid (HF)
• Greenfield and retrofit applications
• Executing “Serial #1” in the USA
• Modular solution with Cord
• Established relationship with licensor
ISOALKYNext Generation Alkylation Technology
TM
SPRINT Campaign Targeting 51 US Refineries Using HF
90
For
per
sona
l use
onl
y

5/23/2017
46
Summary
• Technical and Commercial model that is attractive to customers
• Integrated Solutions helping to maintain backlog of all project sizes
Integrated Solutions
Offshore
Hebron• Reputation of offshore excellence further established
• Strong relationship with ExxonMobil reinforced
• Well-positioned to capitalize on imminent growth in E&P spend
• Deployable technology such as LM-FPSO enables greater market share
91
For
per
sona
l use
onl
y

5/23/2017
47
• Onshore Conventional
• Offshore
• Heavy Oil & Oil Sands
• Chemicals & Petrochemicals (Europe)
• Minerals & Metals
• Power–Fossil(MENA&SEA)
• Saudi Arabia
• Maintenance, Modification s and Operations (MMO)
• New Energy
• Digital (internal capability & external products)
• Belt & Road Initiative
Strategic prioritiesActing concurrently on priorities across three horizons
Horizon 1Core growth
Horizon 2Growth Potential
Horizon 3Emerging markets & products
93
Onshore Conventional Oil & Gas:unstoppable trends that will drive demand
94
For
per
sona
l use
onl
y
5/23/2017
48
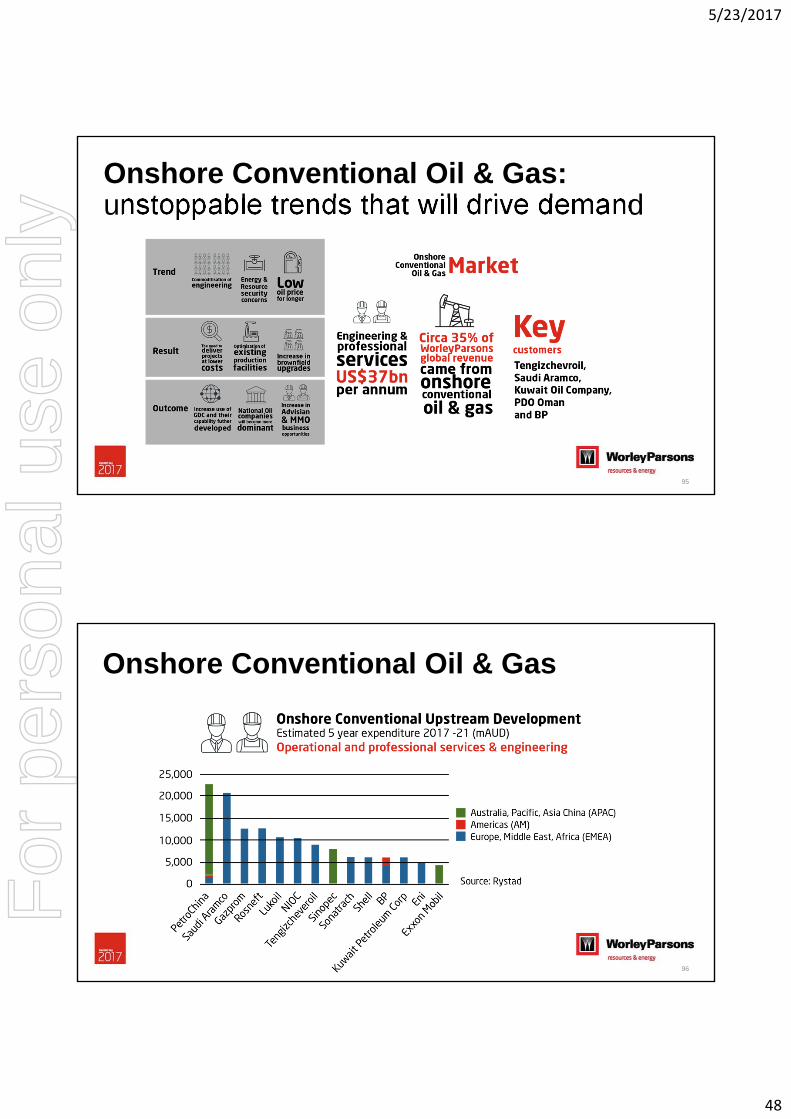
Onshore Conventional Oil & Gas:unstoppable trends that will drive demand
95
Onshore Conventional Oil & Gas
96
For
per
sona
l use
onl
y

5/23/2017
49
Onshore Conventional Oil & GasOpportunities for growth
3.8 4.14.6
5.2
97
Onshore Conventional Oil & GasKazakhstan
3.8 4.14.6
5.2
98
For
per
sona
l use
onl
y

5/23/2017
50
Chemicals:unstoppable trends that will drive demand
99
Chemicals:unstoppable trends that will drive demand
For
per
sona
l use
onl
y
5/23/2017
51
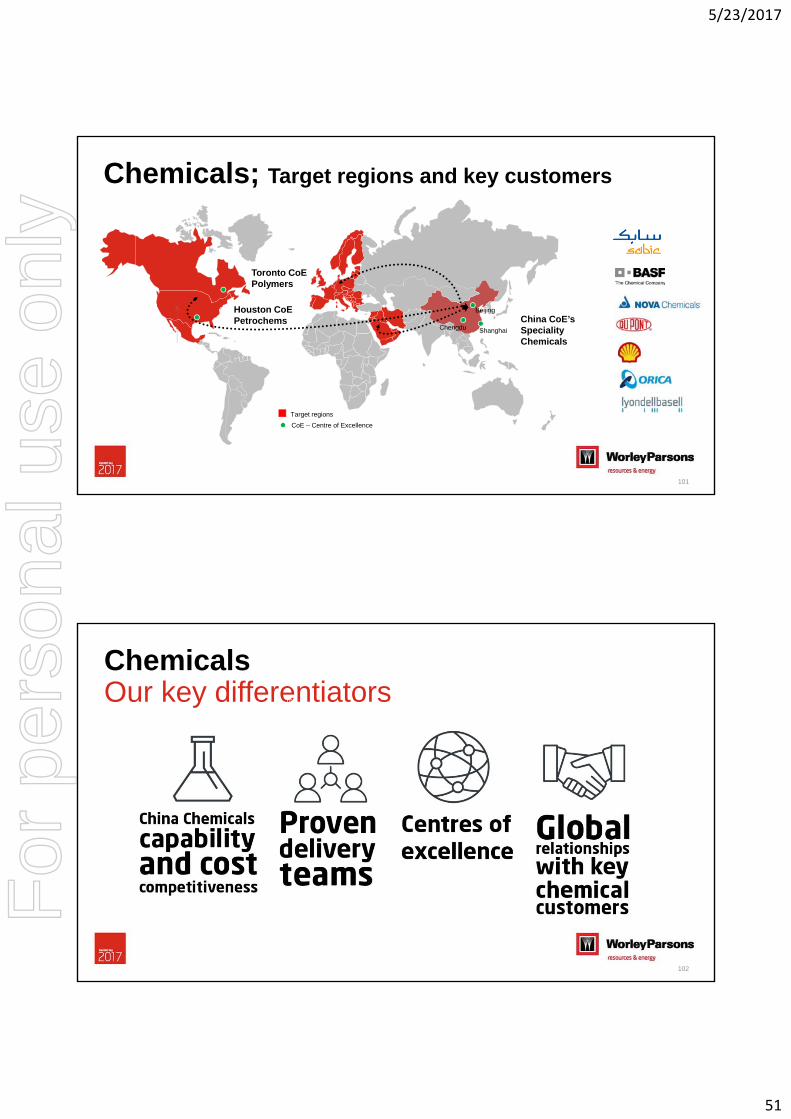
Chemicals; Target regions and key customers
Chengdu Shanghai
Beijing
Target regions
Toronto CoEPolymers
Houston CoEPetrochems
CoE – Centre of Excellence
China CoE’sSpeciality Chemicals
101
ChemicalsOur key differentiatorsThis
102
For
per
sona
l use
onl
y
5/23/2017
52
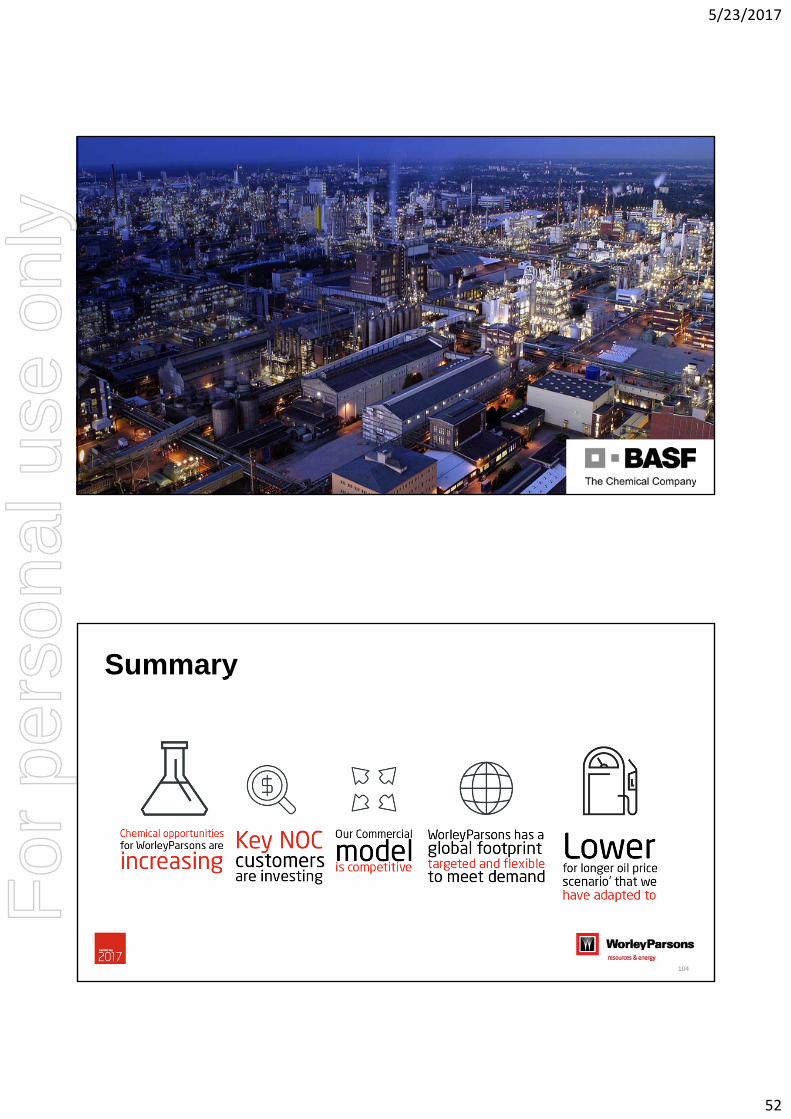
Summary
104
For
per
sona
l use
onl
y

5/23/2017
53
Q&A
105
Andrew Wood – CEO
Closing Remarks
106
For
per
sona
l use
onl
y

5/23/2017
54
Who we are
How we win
How we measure
Where we playUnderstanding our market
Our key metricsOur strategic pillars
107
• WorleyParsons has been reshaped and resized
o Our staff numbers have stabilized, our utilization rates are on target and our overheads are significantly reduced
o We are winning more work, our backlog has increased
• Our markets are at an inflexion point –improving outlook for resources and energy
• Have clear set of strategic priorities and a transparent, disciplined process to implement that strategy
Concluding Remarks
For
per
sona
l use
onl
y