For personal use only - ASX Boulder Mines Ltd Annual General Meeting ASX:STB Paul Donaldson Managing...
46
South Boulder Mines Ltd Annual General Meeting ASX:STB Paul Donaldson Managing Director and CEO 29 th May 2015 For personal use only
Transcript of For personal use only - ASX Boulder Mines Ltd Annual General Meeting ASX:STB Paul Donaldson Managing...
South Boulder Mines Ltd Annual General Meeting
ASX:STB
Paul Donaldson Managing Director and CEO 29th May 2015
For
per
sona
l use
onl
y
Forward Looking Statements and Disclaimer
The information in this presentation is published to inform you about South Boulder Mines (the “Company” or “STB”) and its activities. STB has endeavoured to ensure that the information in this presentation is accurate at the time of release, and that it accurately reflects the Company’s intentions. All statements in this presentation, other than statements of historical facts, that address future production, project development, reserve or resource potential, exploration drilling, exploitation activities, corporate transactions and events or developments that the ‘Company expects to occur, are forward-looking statements. Although the Company believes the expectations expressed in such statements are based on reasonable assumptions, such statements are not guarantees of future performance and actual results or developments may differ materially from those in forward-looking statements.
Factors that could cause actual results to differ materially from those in forward-looking statements include market prices of potash and, exploitation and exploration successes, capital and operating costs, changes in project parameters as plans continue to be evaluated, continued availability of capital and financing and general economic, market or business conditions, as well as those factors disclosed in the Company's filed documents.
There can be no assurance that the development of the Colluli Project will proceed as planned. Accordingly, readers should not place undue reliance on forward looking information. Mineral Resources have been estimated using the Australian JORC (2012) Code (‘JORC 2012’). To the extent permitted by law, the Company accepts no responsibility or liability for any losses or damages of any kind arising out of the use of any information contained in this presentation. Recipients should make their own enquiries in relation to any investment decisions.
Material resource and financial assumptions made in this presentation are consistent with assumptions detailed in the Company’s ASX announcements dated 25 February 2015 and 4 March 2015, which continue to apply and have not materially changed. The Company is not aware of any new information or data that materially affects assumptions made.
Slide 2
For
per
sona
l use
onl
y
Investment drivers
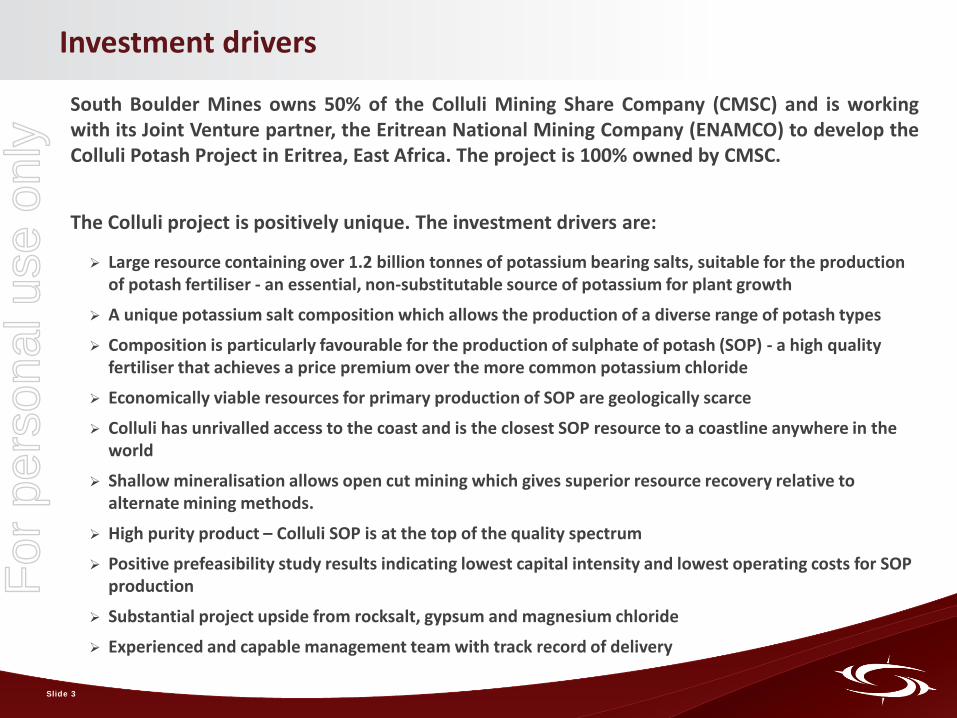
South Boulder Mines owns 50% of the Colluli Mining Share Company (CMSC) and is working with its Joint Venture partner, the Eritrean National Mining Company (ENAMCO) to develop the Colluli Potash Project in Eritrea, East Africa. The project is 100% owned by CMSC. The Colluli project is positively unique. The investment drivers are:
Large resource containing over 1.2 billion tonnes of potassium bearing salts, suitable for the production of potash fertiliser - an essential, non-substitutable source of potassium for plant growth
A unique potassium salt composition which allows the production of a diverse range of potash types
Composition is particularly favourable for the production of sulphate of potash (SOP) - a high quality fertiliser that achieves a price premium over the more common potassium chloride
Economically viable resources for primary production of SOP are geologically scarce
Colluli has unrivalled access to the coast and is the closest SOP resource to a coastline anywhere in the world
Shallow mineralisation allows open cut mining which gives superior resource recovery relative to alternate mining methods.
High purity product – Colluli SOP is at the top of the quality spectrum
Positive prefeasibility study results indicating lowest capital intensity and lowest operating costs for SOP production
Substantial project upside from rocksalt, gypsum and magnesium chloride
Experienced and capable management team with track record of delivery
Slide 3
For
per
sona
l use
onl
y
Our Vision
To bring the Colluli project into production adopting the principles of risk management, resource utilisation and modularity, using the
starting module as a growth platform to develop the resource to its full potential.
Development focus
Slide 4
For
per
sona
l use
onl
y
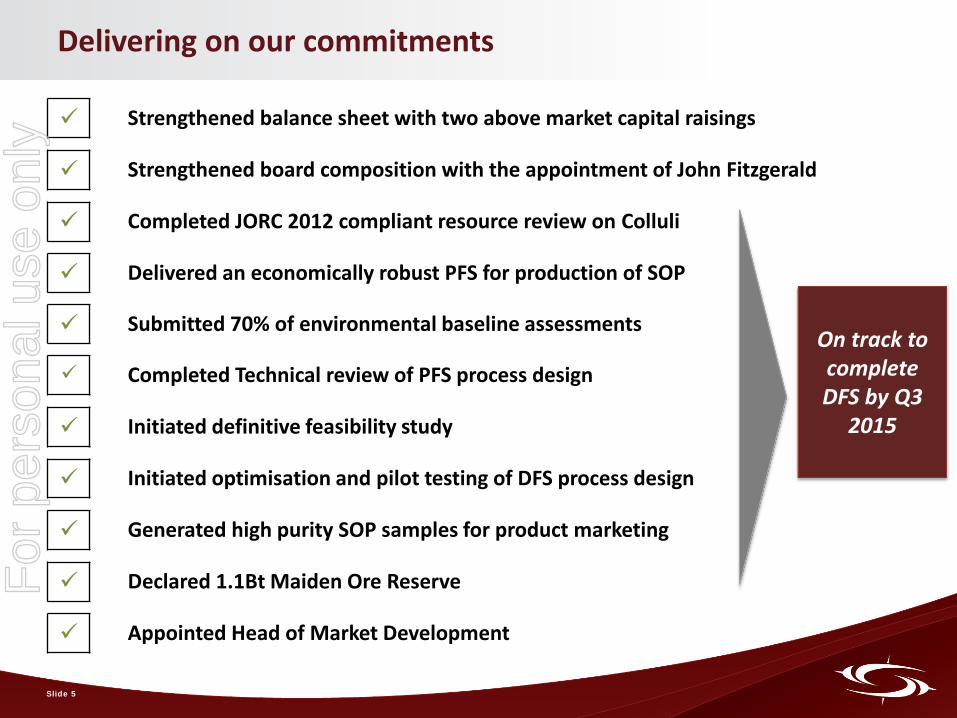
Delivering on our commitments
On track to complete DFS by Q3
2015
Strengthened balance sheet with two above market capital raisings
Strengthened board composition with the appointment of John Fitzgerald
Completed JORC 2012 compliant resource review on Colluli
Delivered an economically robust PFS for production of SOP
Submitted 70% of environmental baseline assessments
Completed Technical review of PFS process design
Initiated definitive feasibility study
Initiated optimisation and pilot testing of DFS process design
Generated high purity SOP samples for product marketing
Declared 1.1Bt Maiden Ore Reserve
Appointed Head of Market Development
Slide 5
For
per
sona
l use
onl
y
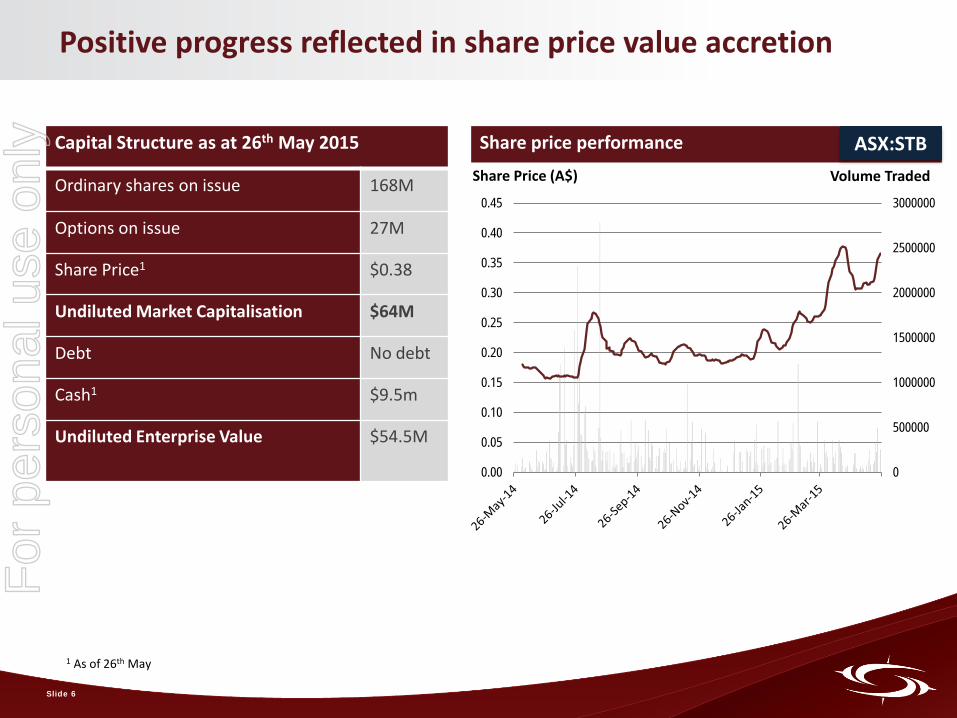
Positive progress reflected in share price value accretion
Capital Structure as at 26th May 2015
Ordinary shares on issue 168M
Options on issue 27M
Share Price1 $0.38
Undiluted Market Capitalisation $64M
Debt No debt
Cash1 $9.5m
Undiluted Enterprise Value $54.5M
Share price performance
1 As of 26th May
0
500000
1000000
1500000
2000000
2500000
3000000
0.00
0.05
0.10
0.15
0.20
0.25
0.30
0.35
0.40
0.45
ASX:STB Share Price (A$) Volume Traded
Slide 6
For
per
sona
l use
onl
y
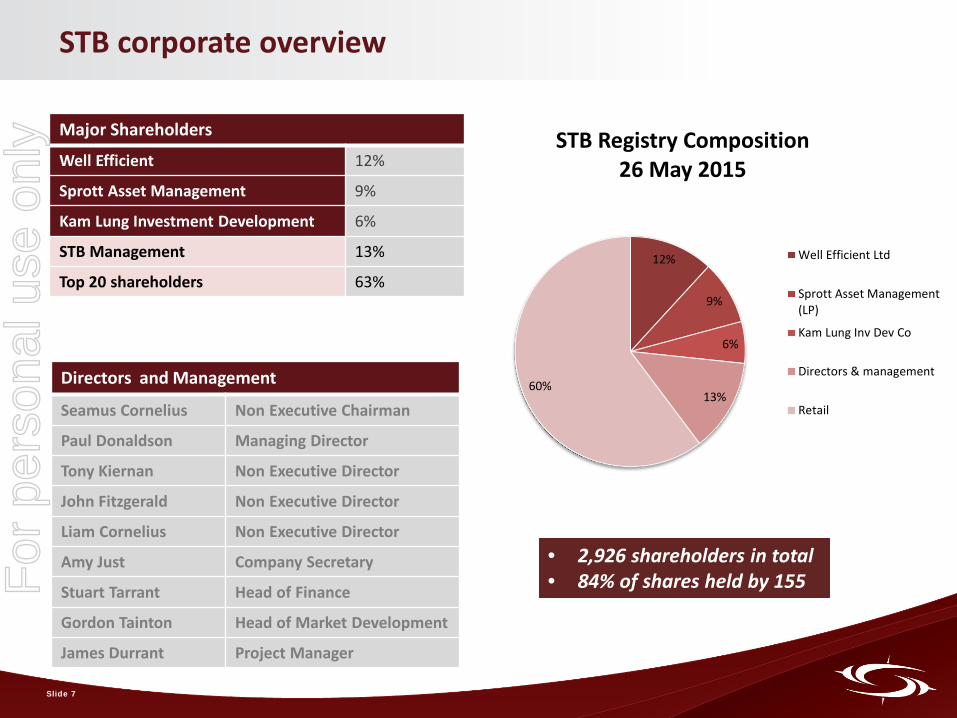
Major Shareholders
Well Efficient 12%
Sprott Asset Management 9%
Kam Lung Investment Development 6%
STB Management 13%
Top 20 shareholders 63%
STB corporate overview
Directors and Management
Seamus Cornelius Non Executive Chairman
Paul Donaldson Managing Director
Tony Kiernan Non Executive Director
John Fitzgerald Non Executive Director
Liam Cornelius Non Executive Director
Amy Just Company Secretary
Stuart Tarrant Head of Finance
Gordon Tainton Head of Market Development
James Durrant Project Manager
• 2,926 shareholders in total • 84% of shares held by 155
Slide 7
12%
9%
6%
13% 60%
STB Registry Composition 26 May 2015
Well Efficient Ltd
Sprott Asset Management(LP)
Kam Lung Inv Dev Co
Directors & management
Retail
For
per
sona
l use
onl
y
Strengthening our board
John Fitzgerald – Non Executive Director
17th February, 2015
• Experienced mining and finance industry executive
• Previously held senior positions at NM Rothschild and Sons, Investec Bank Australia, Commonwealth Bank and HSBC Precious Metals
• Non Executive Director of Northern Star Resources Ltd. And Chairman of Mungana Goldmines Ltd.
Slide 8
For
per
sona
l use
onl
y
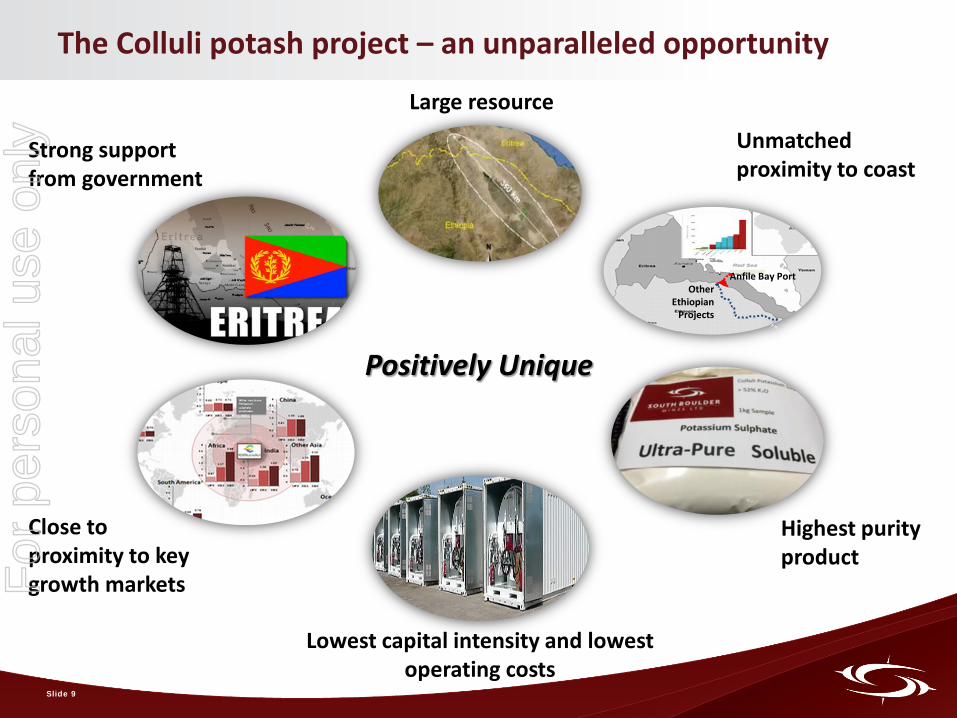
The Colluli potash project – an unparalleled opportunity
Positively Unique
Anfile Bay Port Other
Ethiopian Projects
Large resource
Unmatched proximity to coast
Highest purity product
Lowest capital intensity and lowest operating costs
Close to proximity to key growth markets
Strong support from government
Slide 9
For
per
sona
l use
onl
y
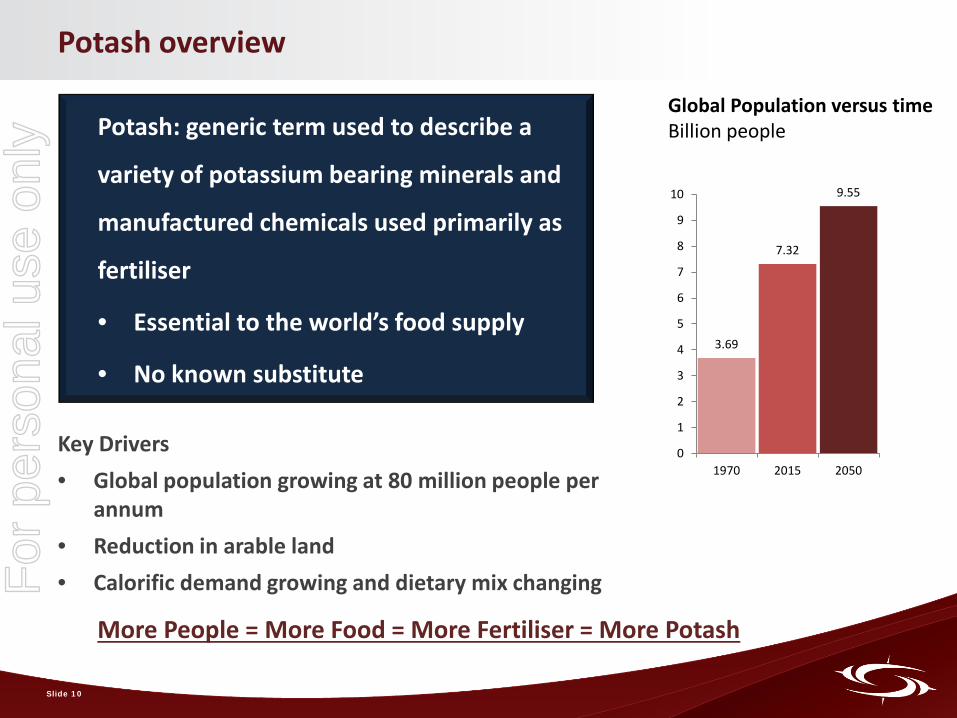
Potash: generic term used to describe a
variety of potassium bearing minerals and
manufactured chemicals used primarily as
fertiliser
• Essential to the world’s food supply
• No known substitute
Potash overview
Key Drivers • Global population growing at 80 million people per
annum • Reduction in arable land • Calorific demand growing and dietary mix changing
More People = More Food = More Fertiliser = More Potash
3.69
7.32
9.55
0
1
2
3
4
5
6
7
8
9
10
1970 2015 2050
Global Population versus time Billion people
Slide 10
For
per
sona
l use
onl
y
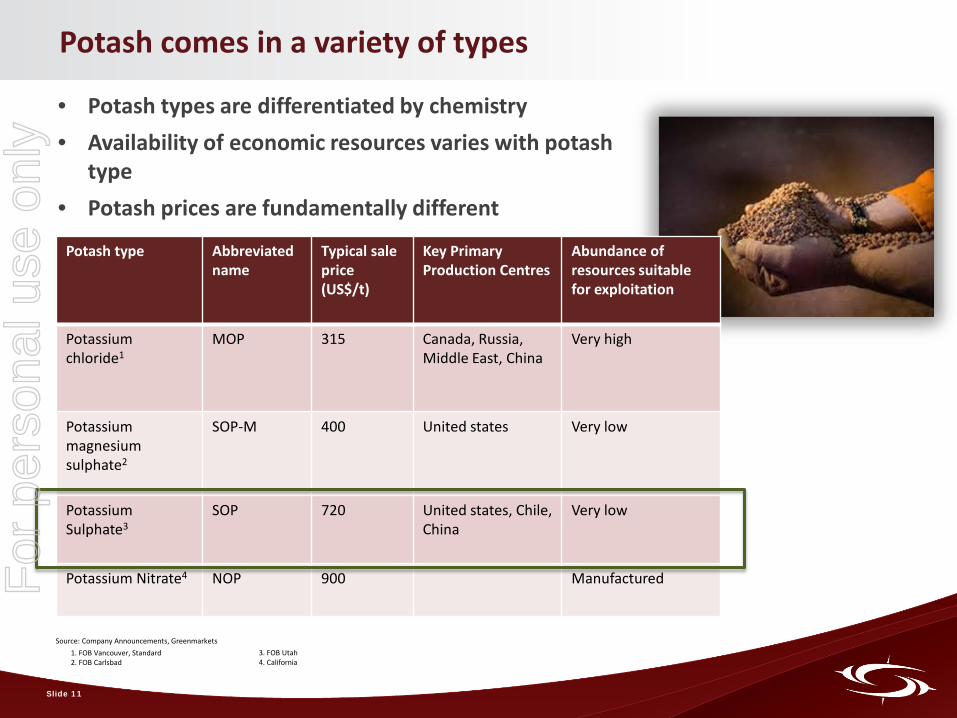
Potash comes in a variety of types
Potash type Abbreviated name
Typical sale price (US$/t)
Key Primary Production Centres
Abundance of resources suitable for exploitation
Potassium chloride1
MOP 315 Canada, Russia, Middle East, China
Very high
Potassium magnesium sulphate2
SOP-M 400 United states Very low
Potassium Sulphate3
SOP 720 United states, Chile, China
Very low
Potassium Nitrate4 NOP 900 Manufactured
• Potash types are differentiated by chemistry • Availability of economic resources varies with potash
type • Potash prices are fundamentally different
Source: Company Announcements, Greenmarkets 3. FOB Utah 4. California
1. FOB Vancouver, Standard 2. FOB Carlsbad
Slide 11
For
per
sona
l use
onl
y
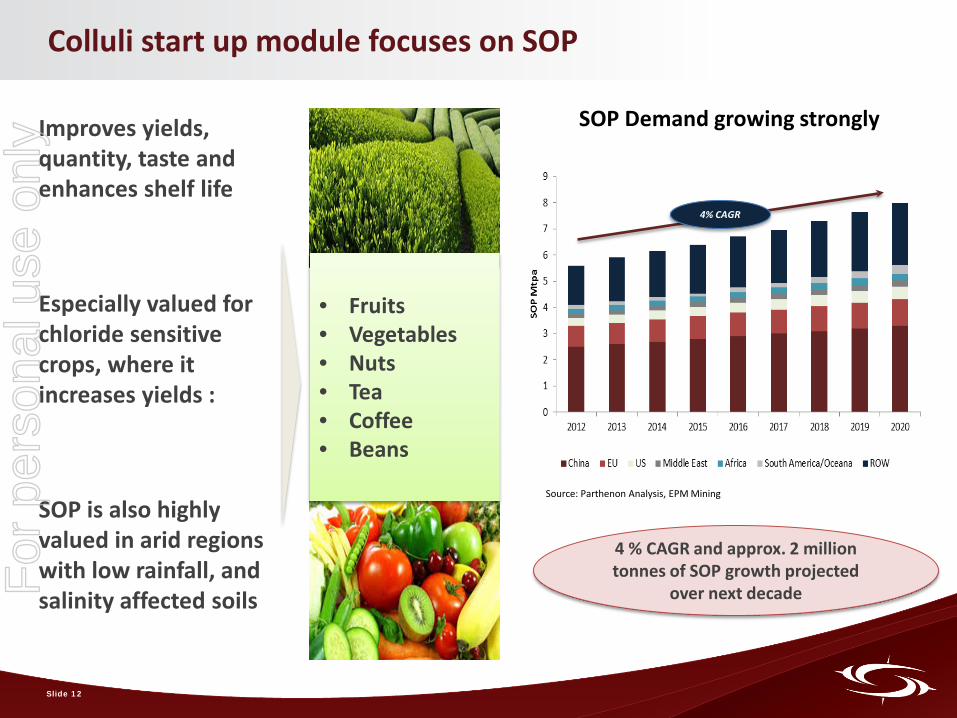
Colluli start up module focuses on SOP
Improves yields, quantity, taste and enhances shelf life Especially valued for chloride sensitive crops, where it increases yields : SOP is also highly valued in arid regions with low rainfall, and salinity affected soils
Source: Parthenon Analysis, EPM Mining
SOP Demand growing strongly
4 % CAGR and approx. 2 million tonnes of SOP growth projected
over next decade
• Fruits • Vegetables • Nuts • Tea • Coffee • Beans
4% CAGR
Slide 12
For
per
sona
l use
onl
y
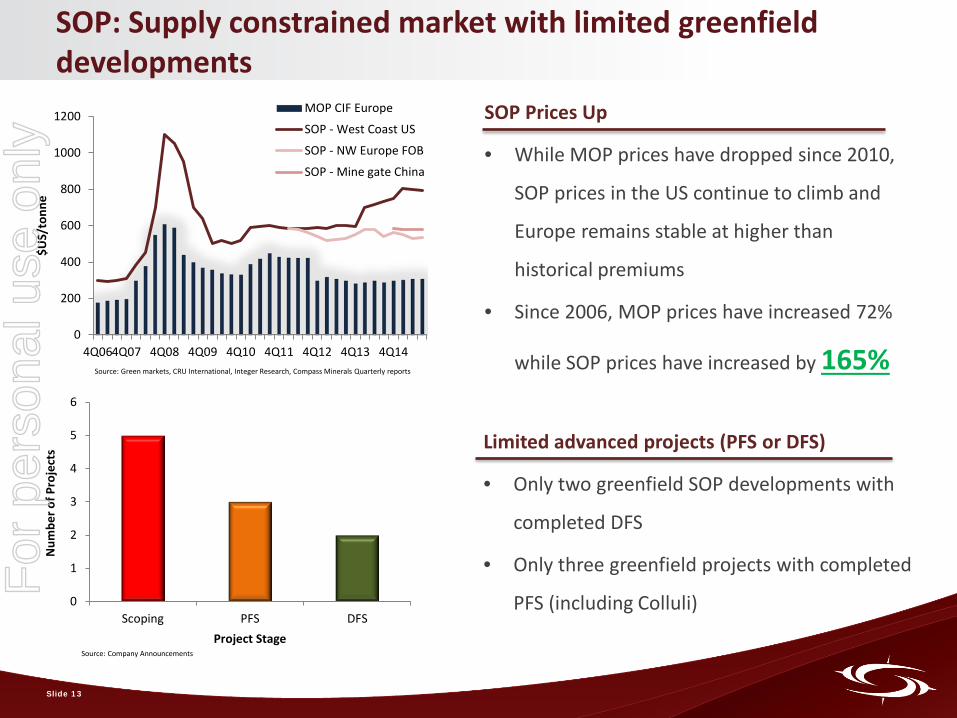
SOP: Supply constrained market with limited greenfield developments
0
200
400
600
800
1000
1200
4Q064Q07 4Q08 4Q09 4Q10 4Q11 4Q12 4Q13 4Q14
$US/
tonn
e
MOP CIF Europe
SOP - West Coast US
SOP - NW Europe FOB
SOP - Mine gate China
0
1
2
3
4
5
6
Scoping PFS DFS
Num
ber o
f Pro
ject
s
Project Stage
SOP Prices Up
• While MOP prices have dropped since 2010,
SOP prices in the US continue to climb and
Europe remains stable at higher than
historical premiums
• Since 2006, MOP prices have increased 72%
while SOP prices have increased by 165%
Limited advanced projects (PFS or DFS)
• Only two greenfield SOP developments with
completed DFS
• Only three greenfield projects with completed
PFS (including Colluli)
Source: Green markets, CRU International, Integer Research, Compass Minerals Quarterly reports
Source: Company Announcements
Slide 13
For
per
sona
l use
onl
y
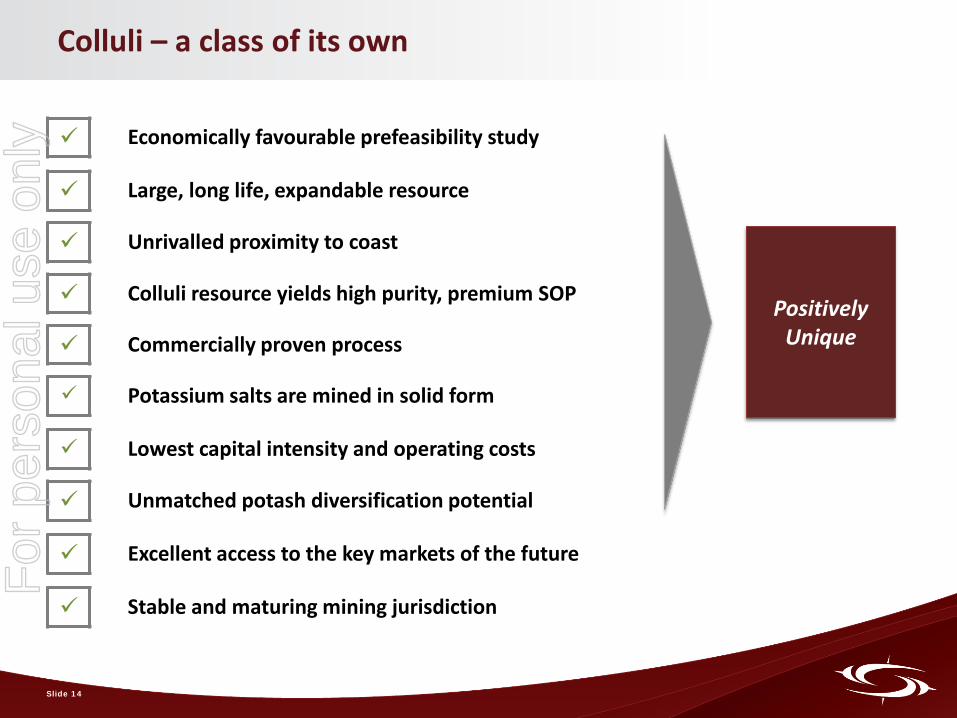
Colluli – a class of its own
Positively Unique
Economically favourable prefeasibility study
Large, long life, expandable resource
Unrivalled proximity to coast
Colluli resource yields high purity, premium SOP
Commercially proven process
Potassium salts are mined in solid form
Lowest capital intensity and operating costs
Unmatched potash diversification potential
Excellent access to the key markets of the future
Stable and maturing mining jurisdiction
Slide 14
For
per
sona
l use
onl
y
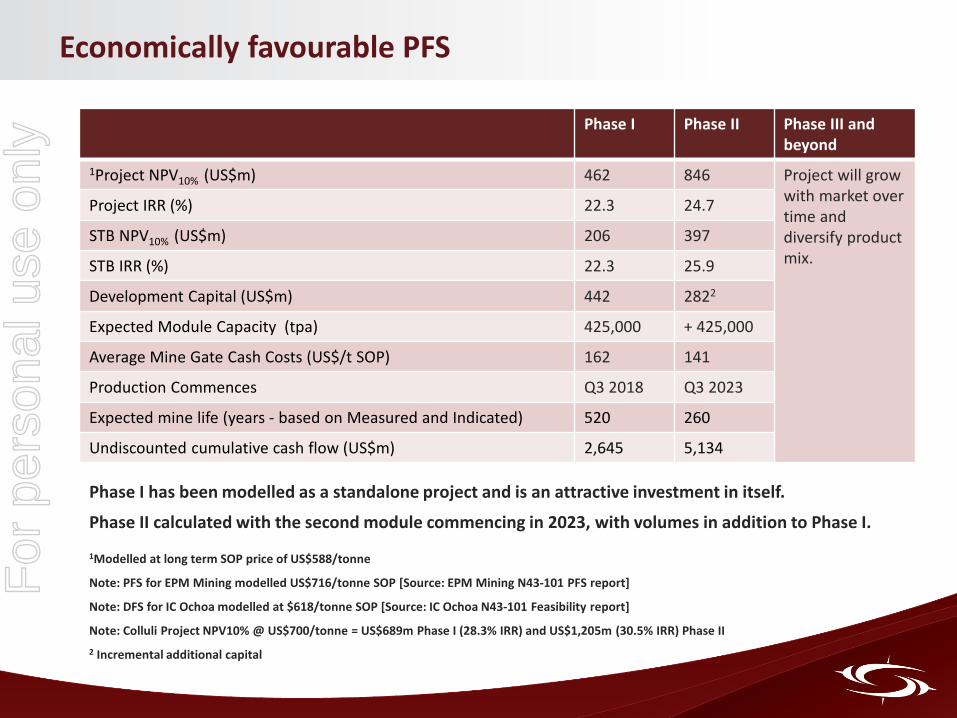
Economically favourable PFS
Phase I Phase II Phase III and beyond
1Project NPV10% (US$m) 462 846 Project will grow with market over time and diversify product mix.
Project IRR (%) 22.3 24.7
STB NPV10% (US$m) 206 397
STB IRR (%) 22.3 25.9
Development Capital (US$m) 442 2822
Expected Module Capacity (tpa) 425,000 + 425,000
Average Mine Gate Cash Costs (US$/t SOP) 162 141
Production Commences Q3 2018 Q3 2023
Expected mine life (years - based on Measured and Indicated) 520 260
Undiscounted cumulative cash flow (US$m) 2,645 5,134
Phase I has been modelled as a standalone project and is an attractive investment in itself.
Phase II calculated with the second module commencing in 2023, with volumes in addition to Phase I.
1Modelled at long term SOP price of US$588/tonne
Note: PFS for EPM Mining modelled US$716/tonne SOP [Source: EPM Mining N43-101 PFS report]
Note: DFS for IC Ochoa modelled at $618/tonne SOP [Source: IC Ochoa N43-101 Feasibility report]
Note: Colluli Project NPV10% @ US$700/tonne = US$689m Phase I (28.3% IRR) and US$1,205m (30.5% IRR) Phase II 2 Incremental additional capital
For
per
sona
l use
onl
y
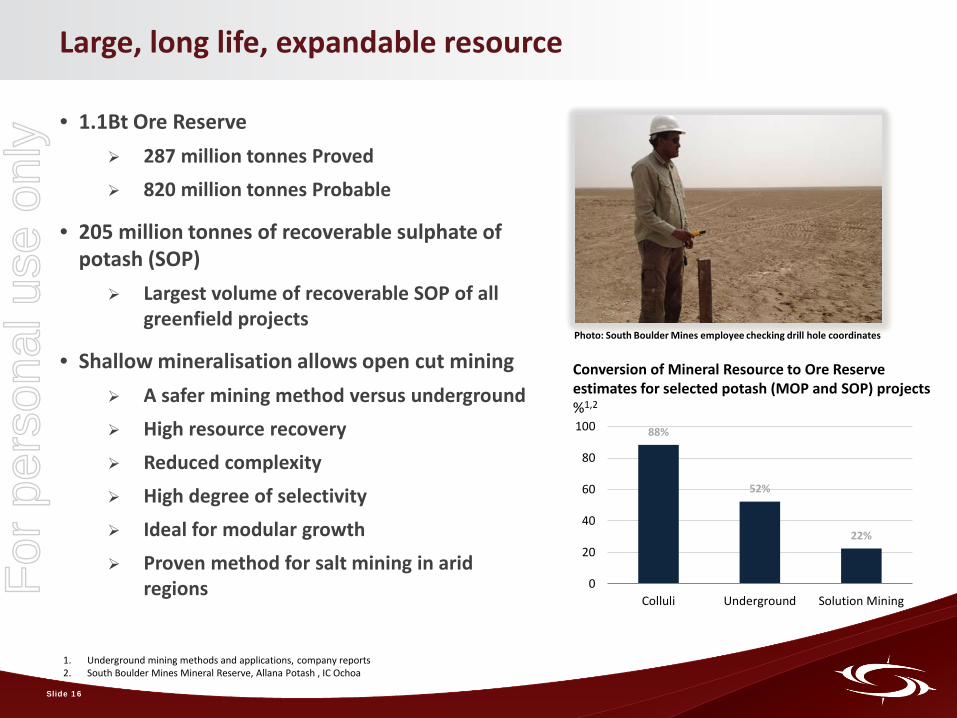
Large, long life, expandable resource
• 1.1Bt Ore Reserve 287 million tonnes Proved 820 million tonnes Probable
• 205 million tonnes of recoverable sulphate of potash (SOP)
Largest volume of recoverable SOP of all greenfield projects
• Shallow mineralisation allows open cut mining A safer mining method versus underground High resource recovery Reduced complexity High degree of selectivity Ideal for modular growth Proven method for salt mining in arid
regions
Slide 16
Conversion of Mineral Resource to Ore Reserve estimates for selected potash (MOP and SOP) projects %1,2
88%
52%
22%
0
20
40
60
80
100
Colluli Underground Solution Mining
Photo: South Boulder Mines employee checking drill hole coordinates
1. Underground mining methods and applications, company reports 2. South Boulder Mines Mineral Reserve, Allana Potash , IC Ochoa
For
per
sona
l use
onl
y
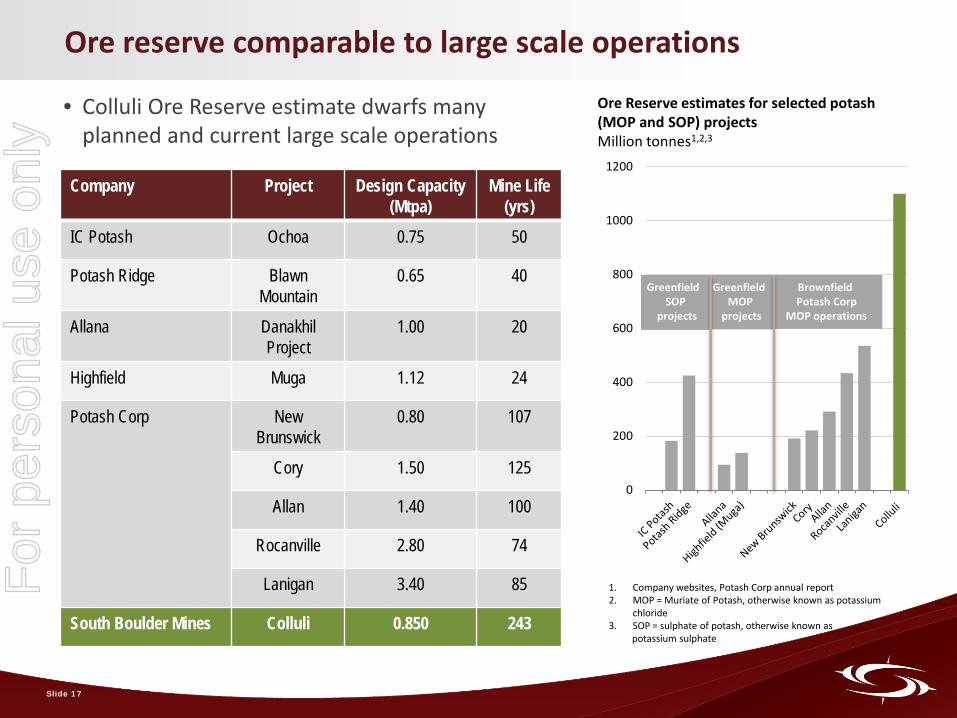
Ore reserve comparable to large scale operations
0
200
400
600
800
1000
1200
Brownfield Potash Corp
MOP operations
Greenfield MOP
projects
Greenfield SOP
projects
Ore Reserve estimates for selected potash (MOP and SOP) projects Million tonnes1,2,3
• Colluli Ore Reserve estimate dwarfs many planned and current large scale operations
Company Project Design Capacity (Mtpa)
Mine Life (yrs)
IC Potash Ochoa 0.75 50
Potash Ridge Blawn Mountain
0.65 40
Allana Danakhil Project
1.00 20
Highfield Muga 1.12 24
Potash Corp New Brunswick
0.80 107
Cory 1.50 125
Allan 1.40 100
Rocanville 2.80 74
Lanigan 3.40 85
South Boulder Mines Colluli 0.850 243
1. Company websites, Potash Corp annual report 2. MOP = Muriate of Potash, otherwise known as potassium
chloride 3. SOP = sulphate of potash, otherwise known as potassium sulphate
Slide 17
For
per
sona
l use
onl
y
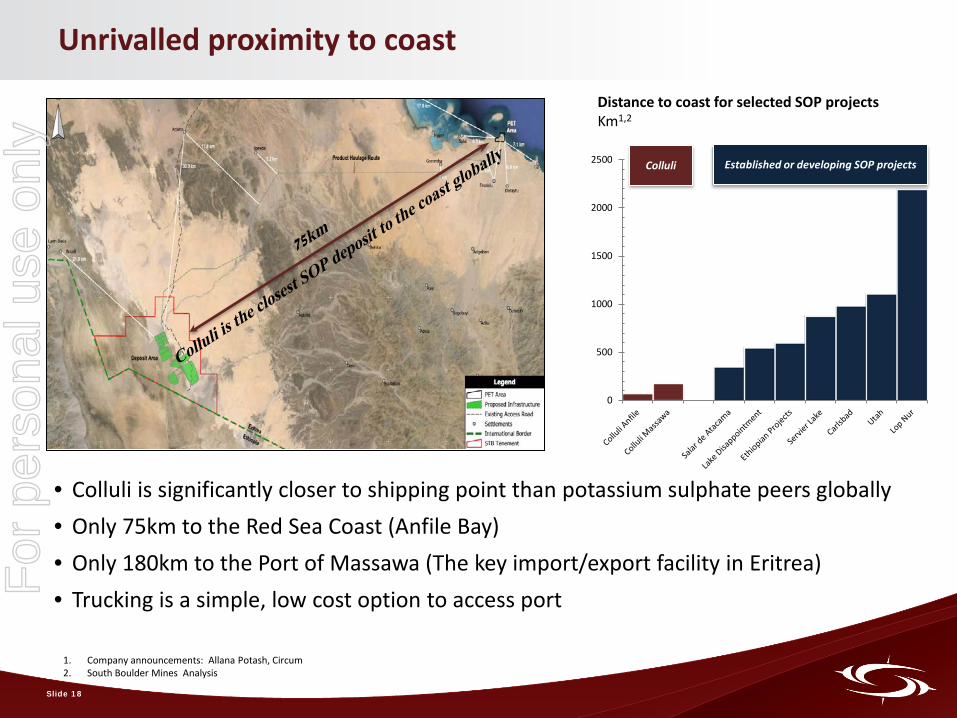
Unrivalled proximity to coast
• Colluli is significantly closer to shipping point than potassium sulphate peers globally • Only 75km to the Red Sea Coast (Anfile Bay) • Only 180km to the Port of Massawa (The key import/export facility in Eritrea) • Trucking is a simple, low cost option to access port
0
500
1000
1500
2000
2500 Established or developing SOP projects Colluli
Distance to coast for selected SOP projects Km1,2
Slide 18
1. Company announcements: Allana Potash, Circum 2. South Boulder Mines Analysis
For
per
sona
l use
onl
y
49.5
50.0
50.5
51.0
51.5
52.0
52.5
53.0
53.5
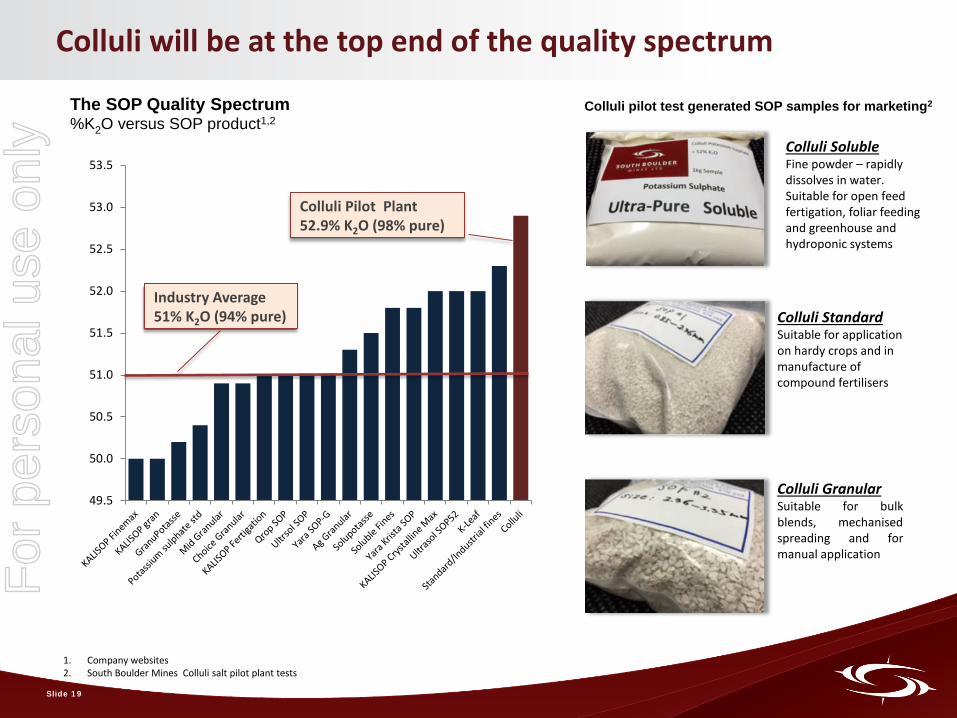
Colluli will be at the top end of the quality spectrum
The SOP Quality Spectrum %K2O versus SOP product1,2
Colluli pilot test generated SOP samples for marketing2
Colluli Pilot Plant 52.9% K2O (98% pure)
Industry Average 51% K2O (94% pure)
Colluli Soluble Fine powder – rapidly dissolves in water. Suitable for open feed fertigation, foliar feeding and greenhouse and hydroponic systems
Colluli Standard Suitable for application on hardy crops and in manufacture of compound fertilisers
Colluli Granular Suitable for bulk blends, mechanised spreading and for manual application
1. Company websites 2. South Boulder Mines Colluli salt pilot plant tests
Slide 19
For
per
sona
l use
onl
y
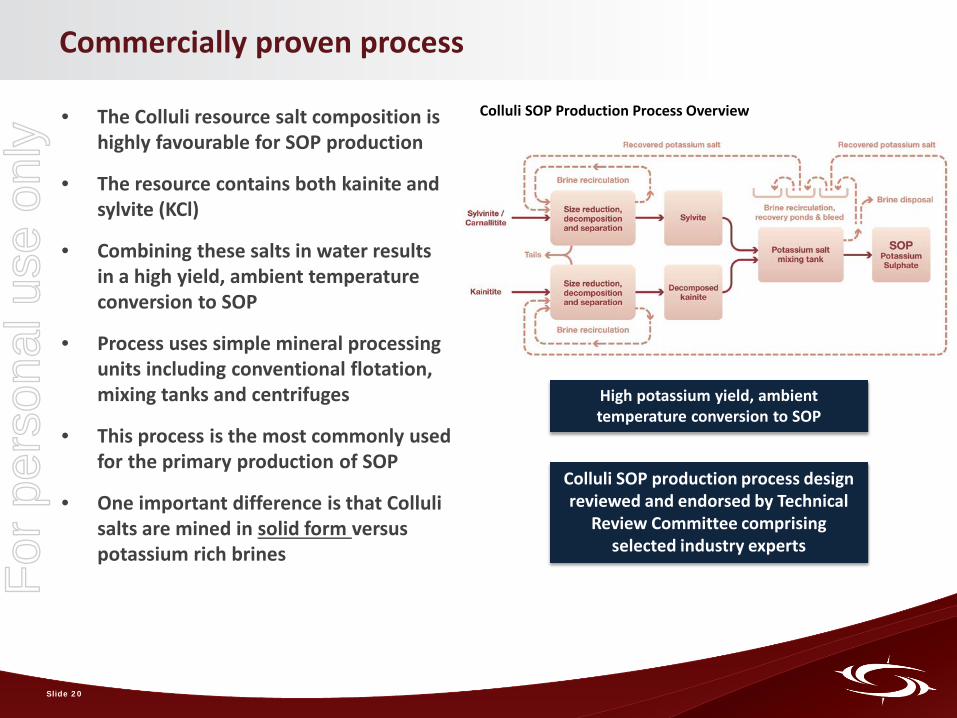
Commercially proven process
• The Colluli resource salt composition is highly favourable for SOP production
• The resource contains both kainite and sylvite (KCl)
• Combining these salts in water results in a high yield, ambient temperature conversion to SOP
• Process uses simple mineral processing units including conventional flotation, mixing tanks and centrifuges
• This process is the most commonly used for the primary production of SOP
• One important difference is that Colluli salts are mined in solid form versus potassium rich brines
High potassium yield, ambient temperature conversion to SOP
Colluli SOP Production Process Overview
Colluli SOP production process design reviewed and endorsed by Technical
Review Committee comprising selected industry experts
Slide 20
For
per
sona
l use
onl
y
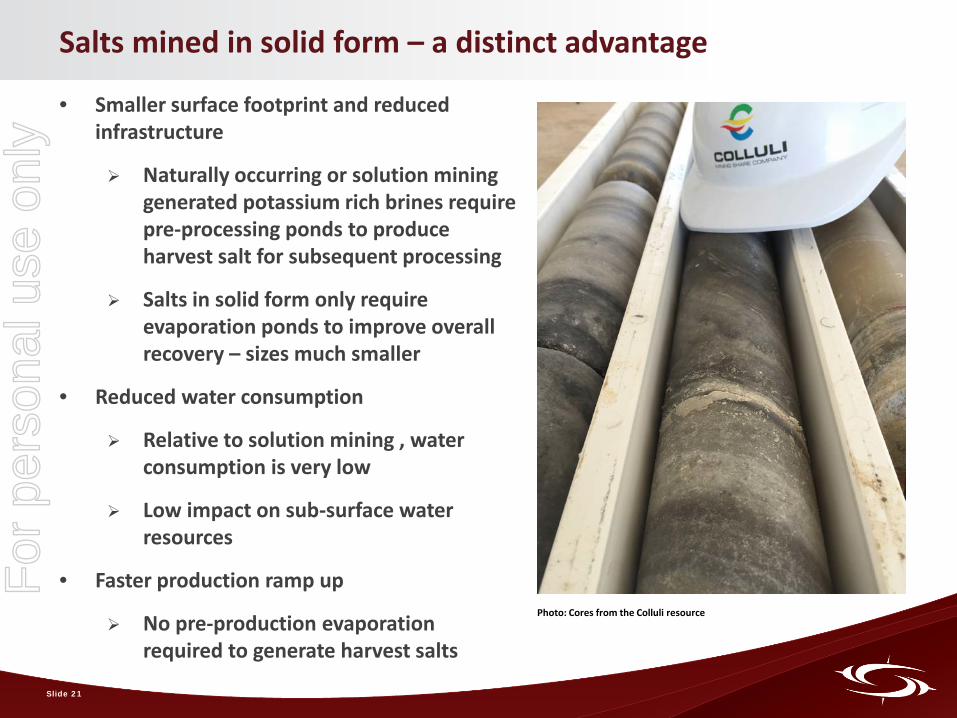
Salts mined in solid form – a distinct advantage
• Smaller surface footprint and reduced infrastructure
Naturally occurring or solution mining generated potassium rich brines require pre-processing ponds to produce harvest salt for subsequent processing
Salts in solid form only require evaporation ponds to improve overall recovery – sizes much smaller
• Reduced water consumption
Relative to solution mining , water consumption is very low
Low impact on sub-surface water resources
• Faster production ramp up
No pre-production evaporation required to generate harvest salts
Slide 21
Photo: Cores from the Colluli resource
For
per
sona
l use
onl
y
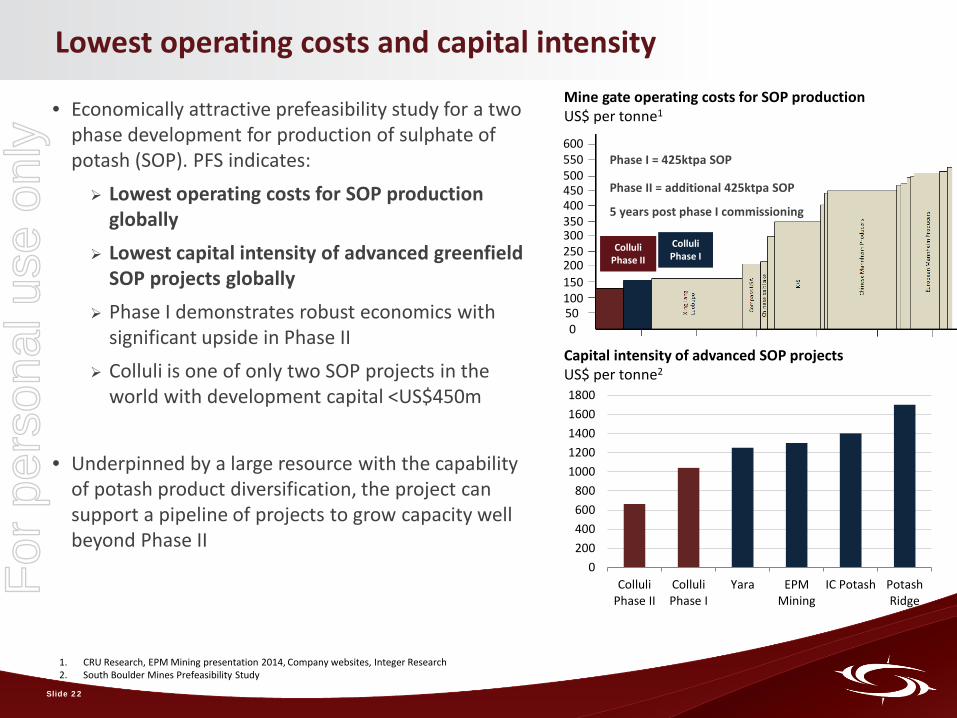
Lowest operating costs and capital intensity
• Economically attractive prefeasibility study for a two phase development for production of sulphate of potash (SOP). PFS indicates: Lowest operating costs for SOP production
globally Lowest capital intensity of advanced greenfield
SOP projects globally Phase I demonstrates robust economics with
significant upside in Phase II Colluli is one of only two SOP projects in the
world with development capital <US$450m
• Underpinned by a large resource with the capability of potash product diversification, the project can support a pipeline of projects to grow capacity well beyond Phase II
0200400600800
10001200140016001800
ColluliPhase II
ColluliPhase I
Yara EPMMining
IC Potash PotashRidge
Capital intensity of advanced SOP projects US$ per tonne2
Mine gate operating costs for SOP production US$ per tonne1
0 50 100 150 200 250 300 350 400 450 500 550 600
Colluli Phase I
Colluli Phase II
Phase I = 425ktpa SOP
Phase II = additional 425ktpa SOP
5 years post phase I commissioning
1. CRU Research, EPM Mining presentation 2014, Company websites, Integer Research 2. South Boulder Mines Prefeasibility Study
Slide 22
For
per
sona
l use
onl
y
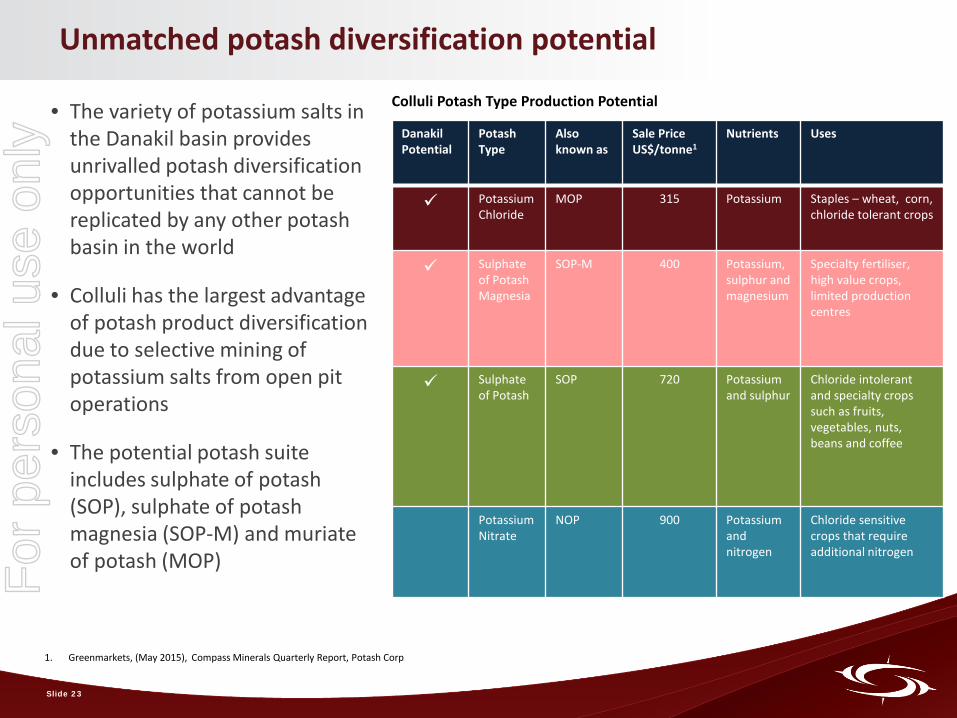
Colluli Potash Type Production Potential
1. Greenmarkets, (May 2015), Compass Minerals Quarterly Report, Potash Corp
Unmatched potash diversification potential
Danakil Potential
Potash Type
Also known as
Sale Price US$/tonne1
Nutrients Uses
Potassium Chloride
MOP 315 Potassium Staples – wheat, corn, chloride tolerant crops
Sulphate of Potash Magnesia
SOP-M 400 Potassium, sulphur and magnesium
Specialty fertiliser, high value crops, limited production centres
Sulphate of Potash
SOP 720 Potassium and sulphur
Chloride intolerant and specialty crops such as fruits, vegetables, nuts, beans and coffee
Potassium Nitrate
NOP 900 Potassium and nitrogen
Chloride sensitive crops that require additional nitrogen
• The variety of potassium salts in the Danakil basin provides unrivalled potash diversification opportunities that cannot be replicated by any other potash basin in the world
• Colluli has the largest advantage of potash product diversification due to selective mining of potassium salts from open pit operations
• The potential potash suite includes sulphate of potash (SOP), sulphate of potash magnesia (SOP-M) and muriate of potash (MOP)
Slide 23
For
per
sona
l use
onl
y
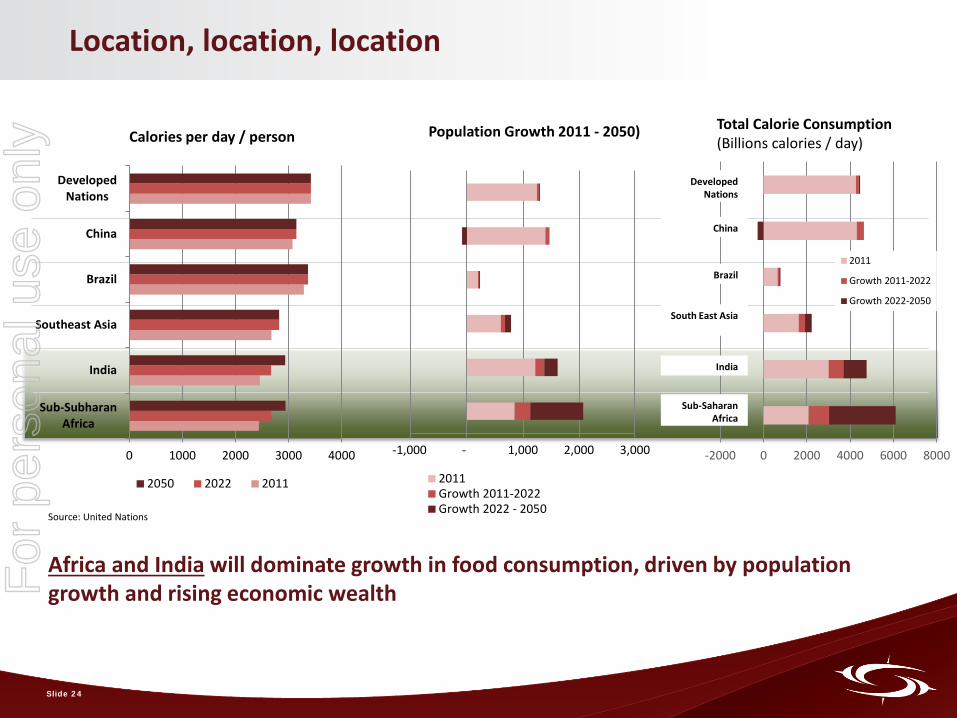
Location, location, location
Source: United Nations
-1,000 - 1,000 2,000 3,000
Population Growth 2011 - 2050)
2011Growth 2011-2022Growth 2022 - 2050
0 1000 2000 3000 4000
Sub-SubharanAfrica
India
Southeast Asia
Brazil
China
DevelopedNations
Calories per day / person
2050 2022 2011
-2000 0 2000 4000 6000 8000
2011
Growth 2011-2022
Growth 2022-2050
Sub-Saharan Africa
India
South East Asia
Brazil
China
Developed Nations
Total Calorie Consumption (Billions calories / day)
Africa and India will dominate growth in food consumption, driven by population growth and rising economic wealth
Slide 24
For
per
sona
l use
onl
y
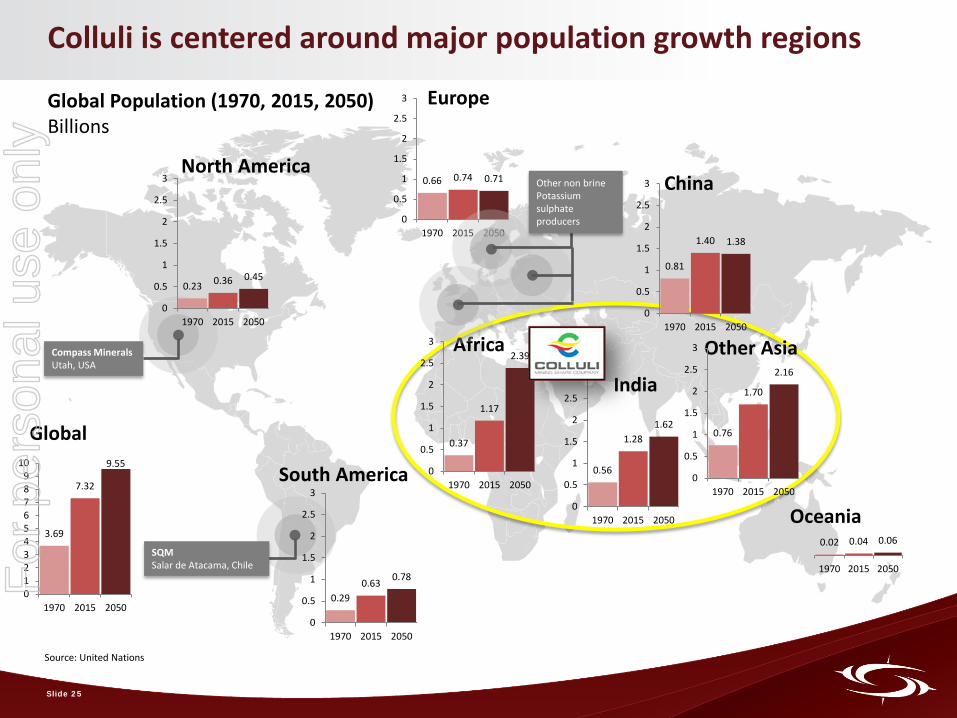
Colluli is centered around major population growth regions
0.37
1.17
2.39
0
0.5
1
1.5
2
2.5
3
1970 2015 2050
Africa
South America
North America
Europe
China
India
Other Asia
Oceania
0.56
1.28 1.62
0
0.5
1
1.5
2
2.5
3
1970 2015 2050
0.76
1.70
2.16
0
0.5
1
1.5
2
2.5
3
1970 2015 2050
0.81
1.40 1.38
0
0.5
1
1.5
2
2.5
3
1970 2015 2050
0.02 0.04 0.06
1970 2015 2050
0.66 0.74 0.71
0
0.5
1
1.5
2
2.5
3
1970 2015 2050
0.23 0.36 0.45
0
0.5
1
1.5
2
2.5
3
1970 2015 2050
Global Population (1970, 2015, 2050) Billions
3.69
7.32
9.55
0123456789
10
1970 2015 2050
Global
Compass Minerals Utah, USA
0.29 0.63 0.78
0
0.5
1
1.5
2
2.5
3
1970 2015 2050
Other non brine Potassium sulphate producers
SQM Salar de Atacama, Chile
Slide 25
Source: United Nations
For
per
sona
l use
onl
y
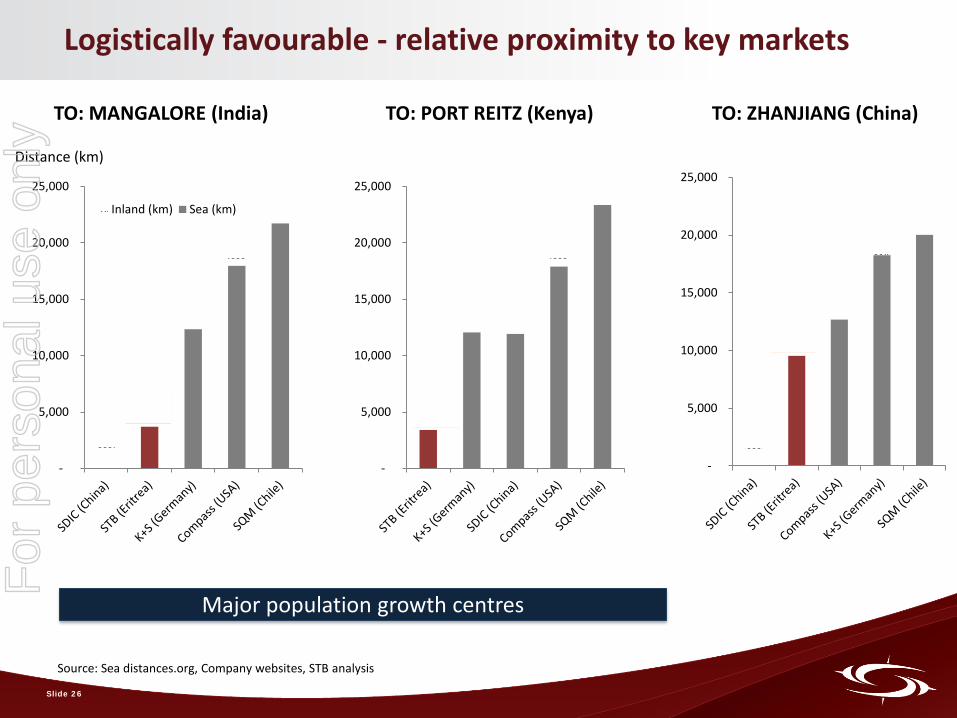
Logistically favourable - relative proximity to key markets
Source: Sea distances.org, Company websites, STB analysis
-
5,000
10,000
15,000
20,000
25,000
Inland (km) Sea (km)
-
5,000
10,000
15,000
20,000
25,000
-
5,000
10,000
15,000
20,000
25,000
TO: MANGALORE (India) TO: ZHANJIANG (China) TO: PORT REITZ (Kenya)
Distance (km)
Major population growth centres
Slide 26
For
per
sona
l use
onl
y
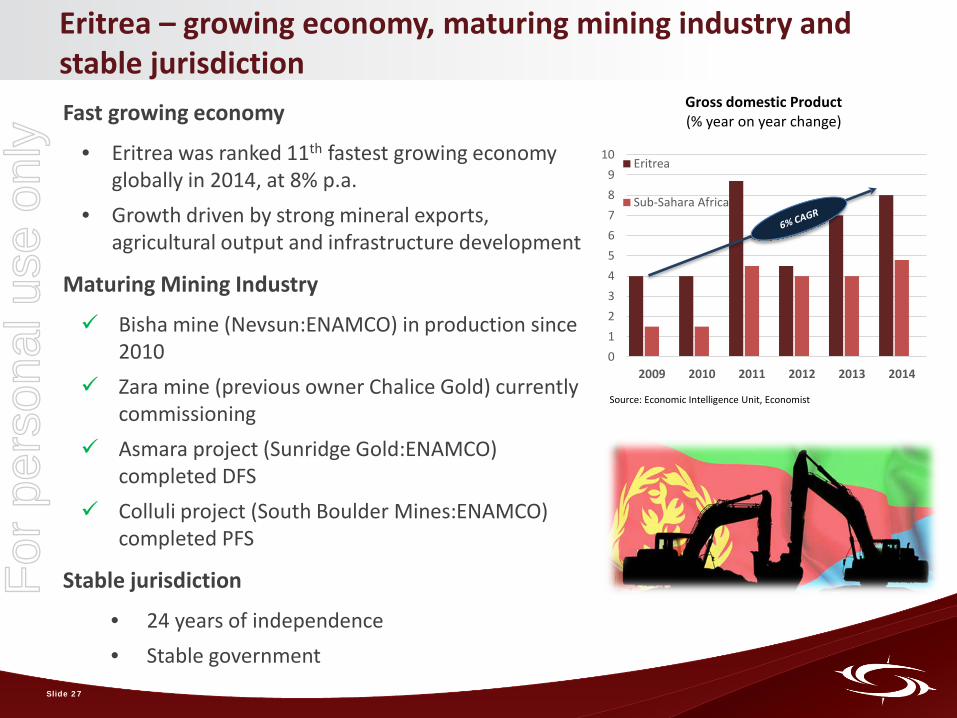
Eritrea – growing economy, maturing mining industry and stable jurisdiction Fast growing economy
• Eritrea was ranked 11th fastest growing economy globally in 2014, at 8% p.a.
• Growth driven by strong mineral exports, agricultural output and infrastructure development
Maturing Mining Industry
Bisha mine (Nevsun:ENAMCO) in production since 2010
Zara mine (previous owner Chalice Gold) currently commissioning
Asmara project (Sunridge Gold:ENAMCO) completed DFS
Colluli project (South Boulder Mines:ENAMCO) completed PFS
Stable jurisdiction
• 24 years of independence • Stable government
0123456789
10
2009 2010 2011 2012 2013 2014
Gross domestic Product (% year on year change)
Eritrea
Sub-Sahara Africa
Source: Economic Intelligence Unit, Economist
Slide 27
For
per
sona
l use
onl
y
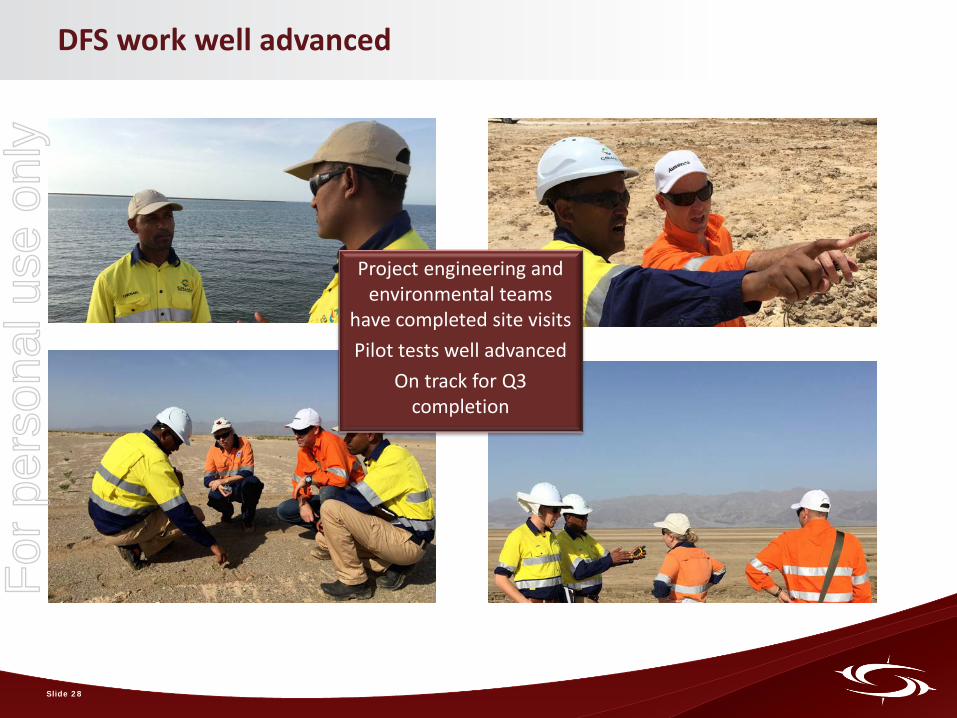
DFS work well advanced
Project engineering and environmental teams
have completed site visits Pilot tests well advanced
On track for Q3 completion
Slide 28
For
per
sona
l use
onl
y
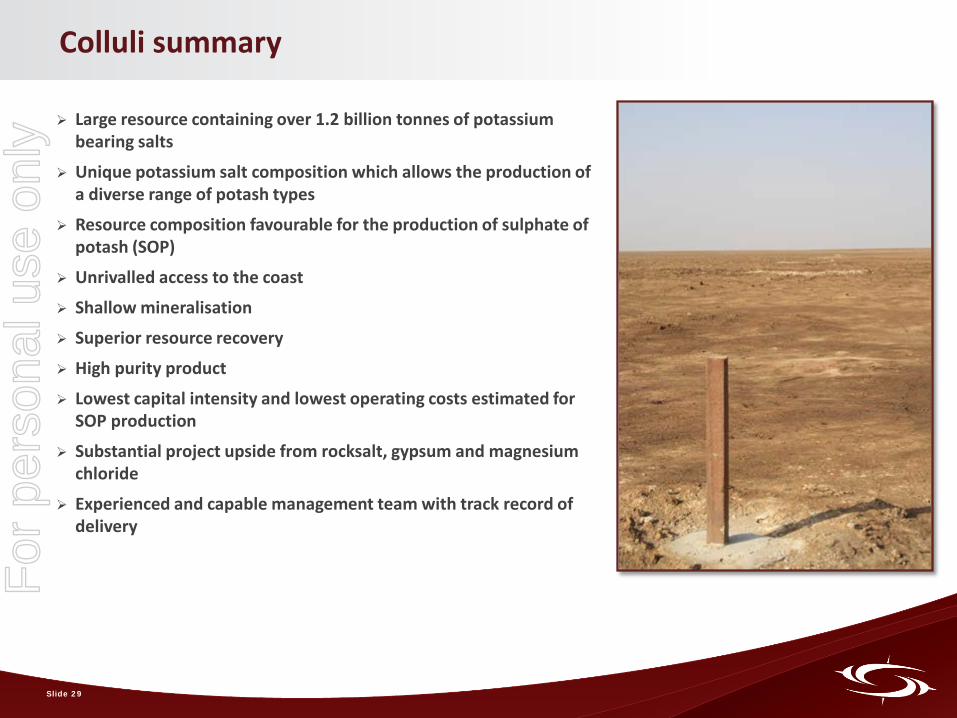
Colluli summary
Large resource containing over 1.2 billion tonnes of potassium bearing salts
Unique potassium salt composition which allows the production of a diverse range of potash types
Resource composition favourable for the production of sulphate of potash (SOP)
Unrivalled access to the coast
Shallow mineralisation
Superior resource recovery
High purity product
Lowest capital intensity and lowest operating costs estimated for SOP production
Substantial project upside from rocksalt, gypsum and magnesium chloride
Experienced and capable management team with track record of delivery
Slide 29
For
per
sona
l use
onl
y
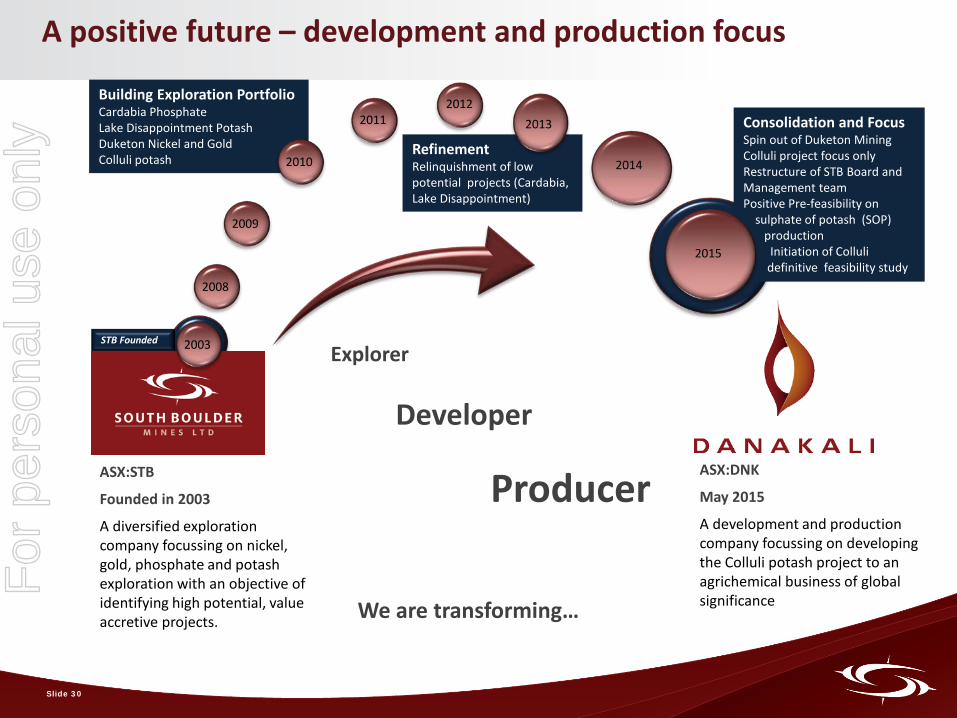
Building Exploration Portfolio Cardabia Phosphate Lake Disappointment Potash Duketon Nickel and Gold Colluli potash
Refinement Relinquishment of low potential projects (Cardabia, Lake Disappointment)
Consolidation and Focus Spin out of Duketon Mining Colluli project focus only Restructure of STB Board and Management team Positive Pre-feasibility on sulphate of potash (SOP) production Initiation of Colluli definitive feasibility study
Slide 30
A positive future – development and production focus
We are transforming…
ASX:STB
Founded in 2003
A diversified exploration company focussing on nickel, gold, phosphate and potash exploration with an objective of identifying high potential, value accretive projects.
ASX:DNK
May 2015
A development and production company focussing on developing the Colluli potash project to an agrichemical business of global significance
2008
2009
2010
2011 2012
2013
2015
2014
STB Founded
Explorer
Developer
Producer
2003
For
per
sona
l use
onl
y
Slide 31 Paul Donaldson, Chief Executive Officer, 29th May 2015
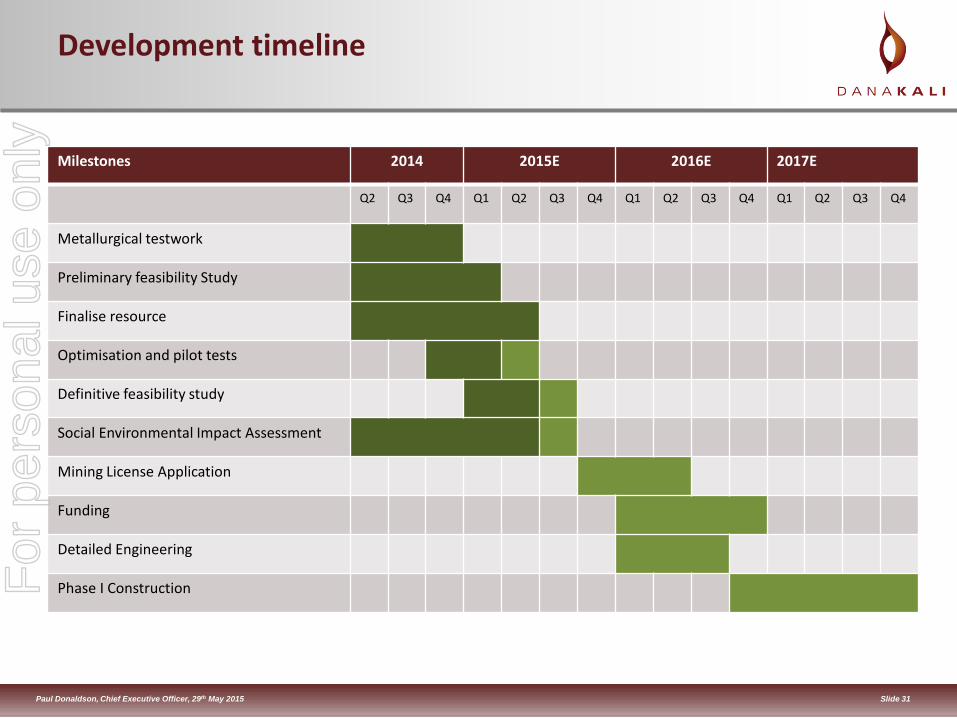
Development timeline
Milestones 2014 2015E 2016E 2017E
Q2 Q3 Q4 Q1 Q2 Q3 Q4 Q1 Q2 Q3 Q4 Q1 Q2 Q3 Q4
Metallurgical testwork
Preliminary feasibility Study
Finalise resource
Optimisation and pilot tests
Definitive feasibility study
Social Environmental Impact Assessment
Mining License Application
Funding
Detailed Engineering
Phase I Construction For
per
sona
l use
onl
y
32
Colluli: Positively Unique
Thank you Colluli: Positively Unique
For
per
sona
l use
onl
y
Slide 33 Paul Donaldson, Chief Executive Officer, 29th May 2015
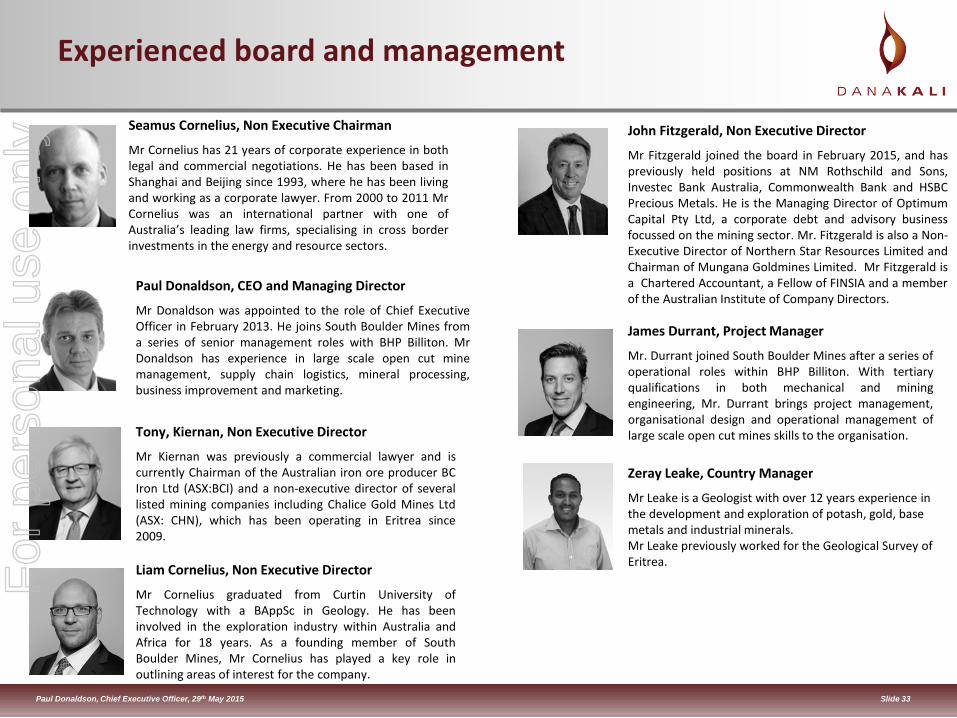
Paul Donaldson, CEO and Managing Director
Mr Donaldson was appointed to the role of Chief Executive Officer in February 2013. He joins South Boulder Mines from a series of senior management roles with BHP Billiton. Mr Donaldson has experience in large scale open cut mine management, supply chain logistics, mineral processing, business improvement and marketing.
Seamus Cornelius, Non Executive Chairman
Mr Cornelius has 21 years of corporate experience in both legal and commercial negotiations. He has been based in Shanghai and Beijing since 1993, where he has been living and working as a corporate lawyer. From 2000 to 2011 Mr Cornelius was an international partner with one of Australia’s leading law firms, specialising in cross border investments in the energy and resource sectors.
Liam Cornelius, Non Executive Director
Mr Cornelius graduated from Curtin University of Technology with a BAppSc in Geology. He has been involved in the exploration industry within Australia and Africa for 18 years. As a founding member of South Boulder Mines, Mr Cornelius has played a key role in outlining areas of interest for the company.
Tony, Kiernan, Non Executive Director
Mr Kiernan was previously a commercial lawyer and is currently Chairman of the Australian iron ore producer BC Iron Ltd (ASX:BCI) and a non-executive director of several listed mining companies including Chalice Gold Mines Ltd (ASX: CHN), which has been operating in Eritrea since 2009.
Experienced board and management
James Durrant, Project Manager
Mr. Durrant joined South Boulder Mines after a series of operational roles within BHP Billiton. With tertiary qualifications in both mechanical and mining engineering, Mr. Durrant brings project management, organisational design and operational management of large scale open cut mines skills to the organisation.
Zeray Leake, Country Manager
Mr Leake is a Geologist with over 12 years experience in the development and exploration of potash, gold, base metals and industrial minerals. Mr Leake previously worked for the Geological Survey of Eritrea.
John Fitzgerald, Non Executive Director
Mr Fitzgerald joined the board in February 2015, and has previously held positions at NM Rothschild and Sons, Investec Bank Australia, Commonwealth Bank and HSBC Precious Metals. He is the Managing Director of Optimum Capital Pty Ltd, a corporate debt and advisory business focussed on the mining sector. Mr. Fitzgerald is also a Non-Executive Director of Northern Star Resources Limited and Chairman of Mungana Goldmines Limited. Mr Fitzgerald is a Chartered Accountant, a Fellow of FINSIA and a member of the Australian Institute of Company Directors.
For
per
sona
l use
onl
y
Slide 34 Paul Donaldson, Chief Executive Officer, 29th May 2015
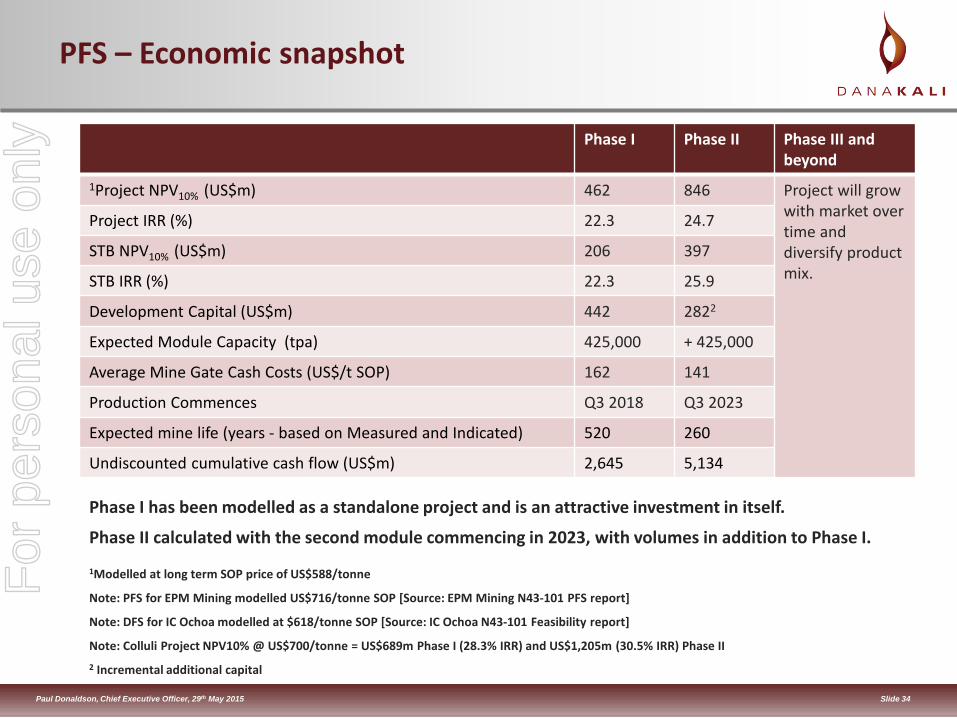
PFS – Economic snapshot
Phase I Phase II Phase III and beyond
1Project NPV10% (US$m) 462 846 Project will grow with market over time and diversify product mix.
Project IRR (%) 22.3 24.7
STB NPV10% (US$m) 206 397
STB IRR (%) 22.3 25.9
Development Capital (US$m) 442 2822
Expected Module Capacity (tpa) 425,000 + 425,000
Average Mine Gate Cash Costs (US$/t SOP) 162 141
Production Commences Q3 2018 Q3 2023
Expected mine life (years - based on Measured and Indicated) 520 260
Undiscounted cumulative cash flow (US$m) 2,645 5,134
Phase I has been modelled as a standalone project and is an attractive investment in itself.
Phase II calculated with the second module commencing in 2023, with volumes in addition to Phase I.
1Modelled at long term SOP price of US$588/tonne
Note: PFS for EPM Mining modelled US$716/tonne SOP [Source: EPM Mining N43-101 PFS report]
Note: DFS for IC Ochoa modelled at $618/tonne SOP [Source: IC Ochoa N43-101 Feasibility report]
Note: Colluli Project NPV10% @ US$700/tonne = US$689m Phase I (28.3% IRR) and US$1,205m (30.5% IRR) Phase II 2 Incremental additional capital
For
per
sona
l use
onl
y
Slide 35 Paul Donaldson, Chief Executive Officer, 29th May 2015
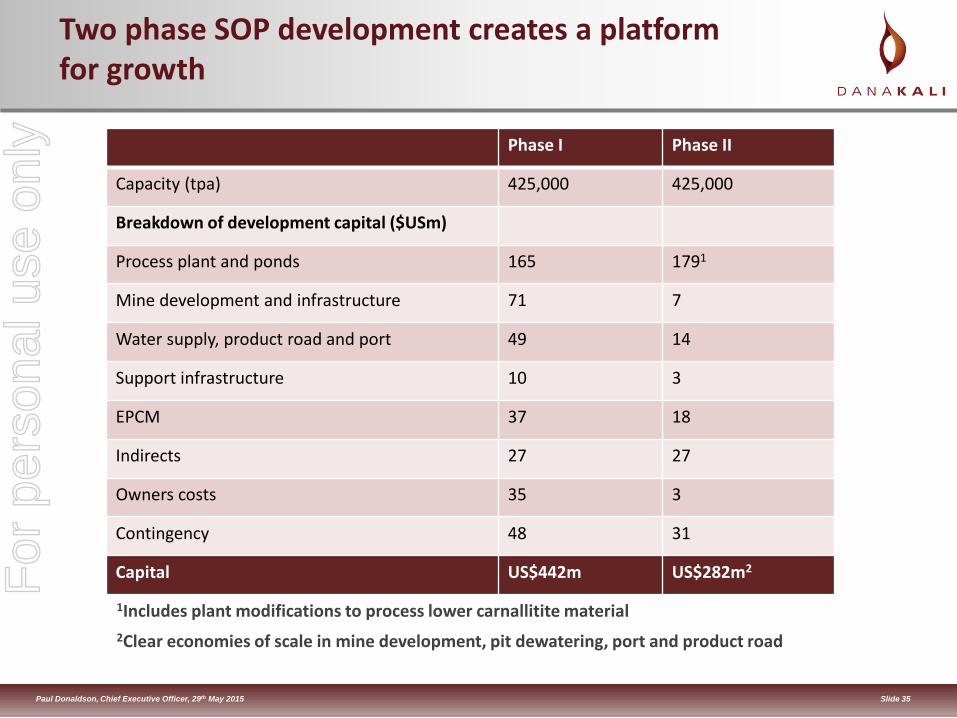
Two phase SOP development creates a platform for growth
Phase I Phase II
Capacity (tpa) 425,000 425,000
Breakdown of development capital ($USm)
Process plant and ponds 165 1791
Mine development and infrastructure 71 7
Water supply, product road and port 49 14
Support infrastructure 10 3
EPCM 37 18
Indirects 27 27
Owners costs 35 3
Contingency 48 31
Capital US$442m US$282m2
1Includes plant modifications to process lower carnallitite material 2Clear economies of scale in mine development, pit dewatering, port and product road
For
per
sona
l use
onl
y
Slide 36 Paul Donaldson, Chief Executive Officer, 29th May 2015
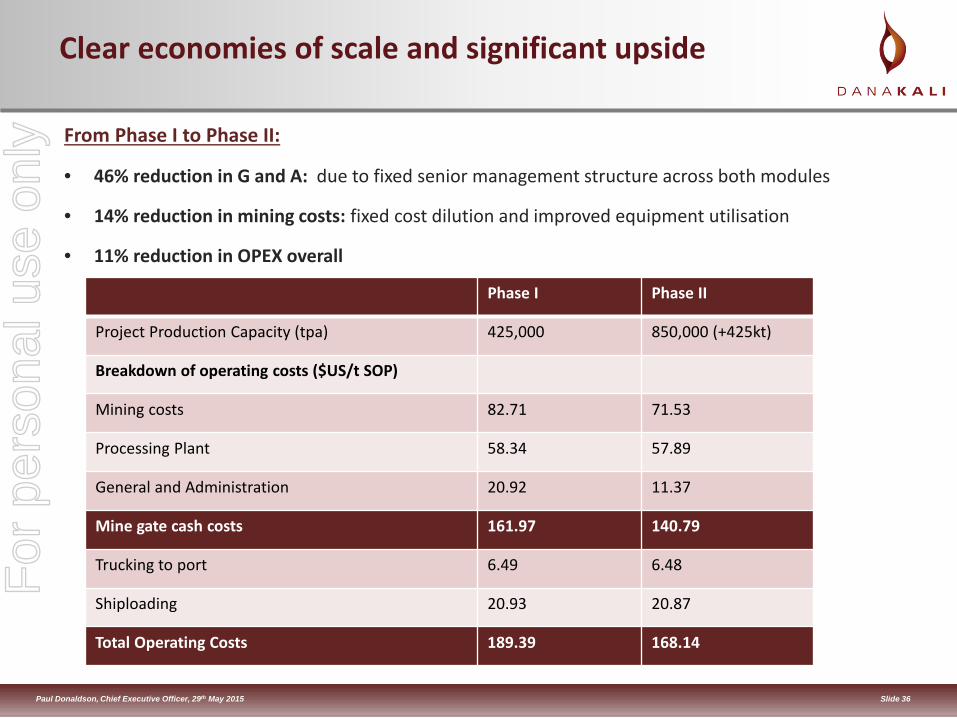
Clear economies of scale and significant upside
From Phase I to Phase II:
• 46% reduction in G and A: due to fixed senior management structure across both modules
• 14% reduction in mining costs: fixed cost dilution and improved equipment utilisation
• 11% reduction in OPEX overall
Phase I Phase II
Project Production Capacity (tpa) 425,000 850,000 (+425kt)
Breakdown of operating costs ($US/t SOP)
Mining costs 82.71 71.53
Processing Plant 58.34 57.89
General and Administration 20.92 11.37
Mine gate cash costs 161.97 140.79
Trucking to port 6.49 6.48
Shiploading 20.93 20.87
Total Operating Costs 189.39 168.14
For
per
sona
l use
onl
y
Slide 37 Paul Donaldson, Chief Executive Officer, 29th May 2015
0
50
100
150
200
250
300
Colluli Underground Solution Mining
In situ product in Mineral Resource
In situ product in Ore Reserveestimate
82%
52% 25%
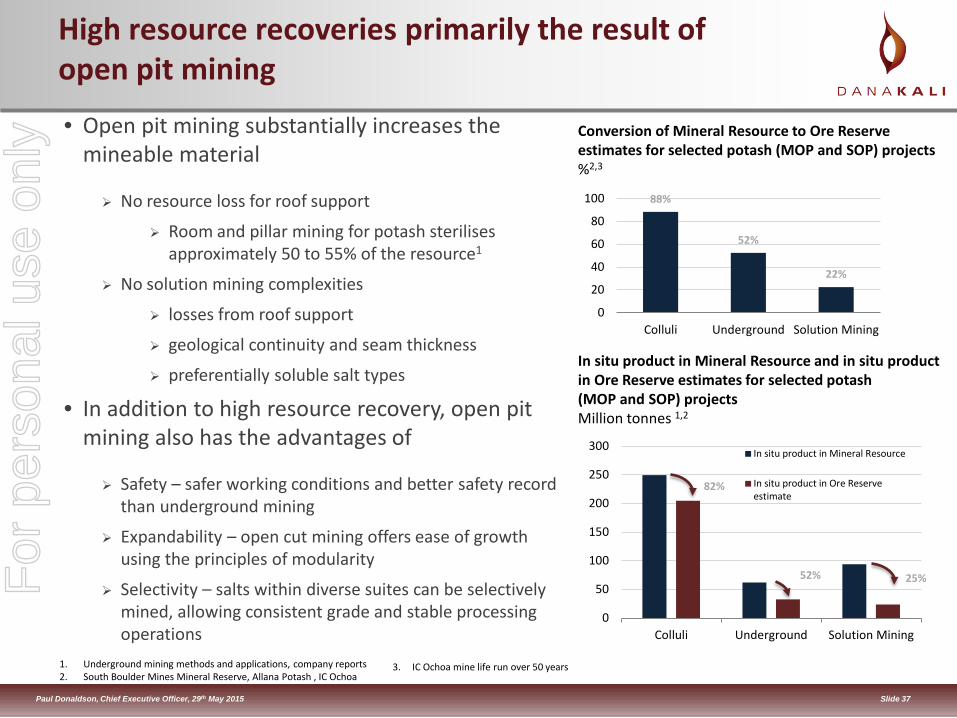
High resource recoveries primarily the result of open pit mining
Conversion of Mineral Resource to Ore Reserve estimates for selected potash (MOP and SOP) projects %2,3
In situ product in Mineral Resource and in situ product in Ore Reserve estimates for selected potash (MOP and SOP) projects Million tonnes 1,2
1. Underground mining methods and applications, company reports 2. South Boulder Mines Mineral Reserve, Allana Potash , IC Ochoa
3. IC Ochoa mine life run over 50 years
88%
52%
22%
0
20
40
60
80
100
Colluli Underground Solution Mining
• Open pit mining substantially increases the mineable material
No resource loss for roof support
Room and pillar mining for potash sterilises approximately 50 to 55% of the resource1
No solution mining complexities
losses from roof support
geological continuity and seam thickness
preferentially soluble salt types
• In addition to high resource recovery, open pit mining also has the advantages of
Safety – safer working conditions and better safety record than underground mining
Expandability – open cut mining offers ease of growth using the principles of modularity
Selectivity – salts within diverse suites can be selectively mined, allowing consistent grade and stable processing operations
For
per
sona
l use
onl
y
Slide 38 Paul Donaldson, Chief Executive Officer, 29th May 2015
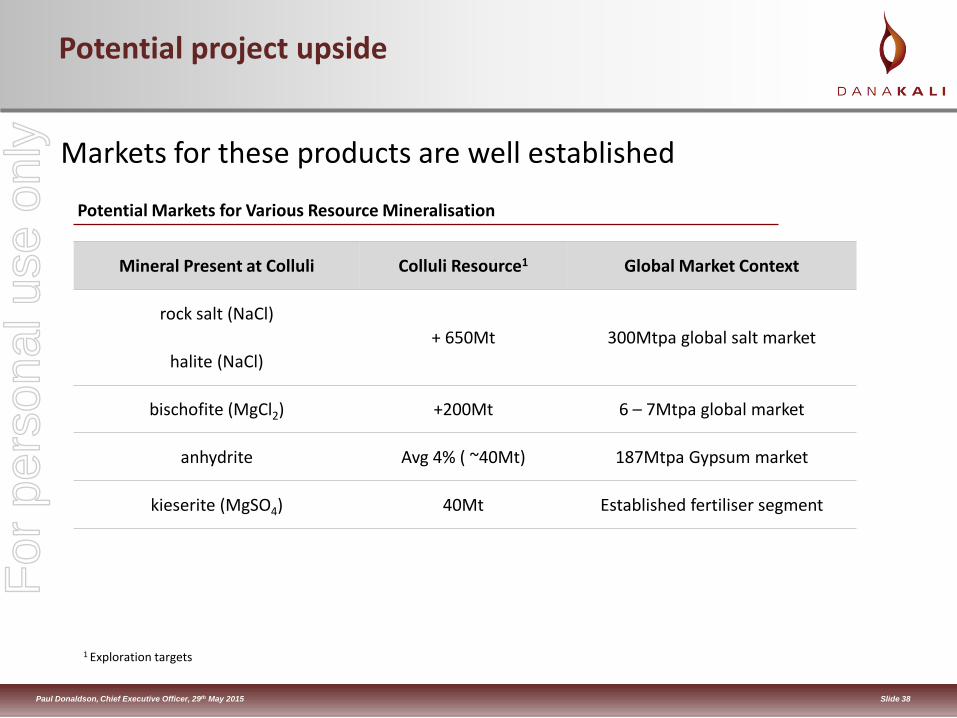
Potential project upside
Mineral Present at Colluli Colluli Resource1 Global Market Context
rock salt (NaCl) + 650Mt 300Mtpa global salt market
halite (NaCl)
bischofite (MgCl2) +200Mt 6 – 7Mtpa global market
anhydrite Avg 4% ( ~40Mt) 187Mtpa Gypsum market
kieserite (MgSO4) 40Mt Established fertiliser segment
Potential Markets for Various Resource Mineralisation
Markets for these products are well established
1 Exploration targets
For
per
sona
l use
onl
y
Slide 39 Paul Donaldson, Chief Executive Officer, 29th May 2015
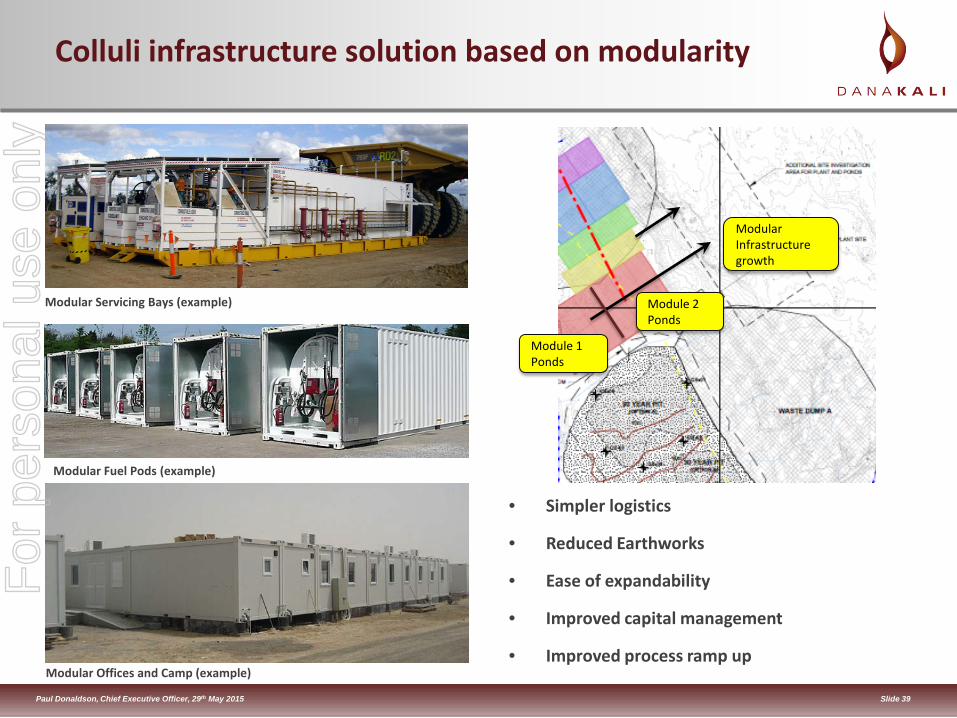
Colluli infrastructure solution based on modularity
• Simpler logistics
• Reduced Earthworks
• Ease of expandability
• Improved capital management
• Improved process ramp up
Modular Servicing Bays (example)
Modular Fuel Pods (example)
Modular Offices and Camp (example)
Module 1 Ponds
Module 2 Ponds
Modular Infrastructure growth
For
per
sona
l use
onl
y
Slide 40 Paul Donaldson, Chief Executive Officer, 29th May 2015
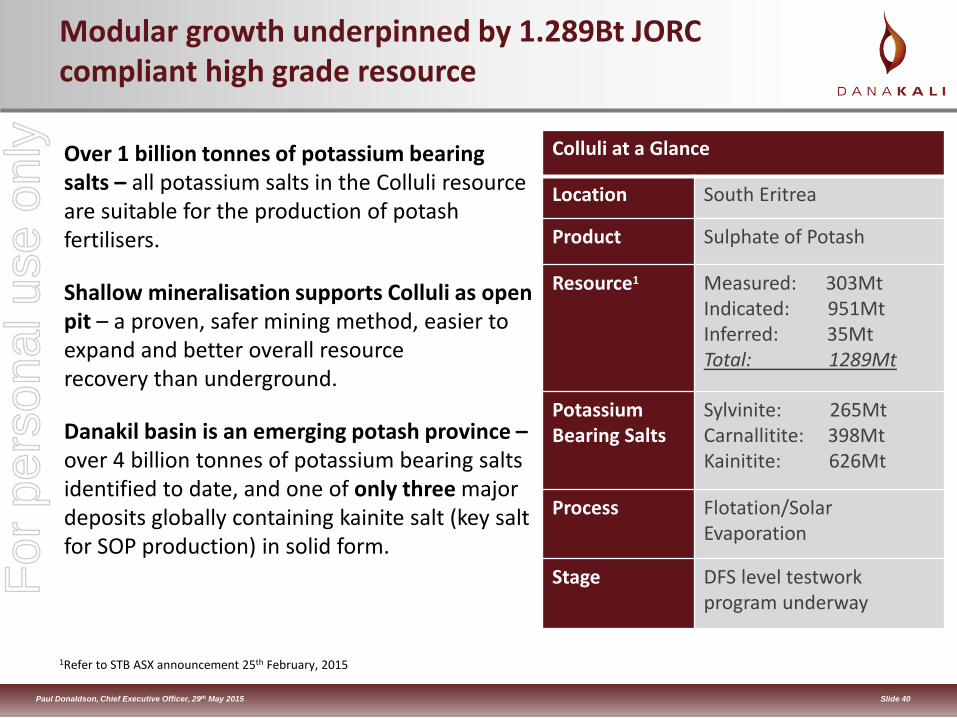
Modular growth underpinned by 1.289Bt JORC compliant high grade resource
Colluli at a Glance
Location South Eritrea
Product Sulphate of Potash
Resource1 Measured: 303Mt Indicated: 951Mt Inferred: 35Mt Total: 1289Mt
Potassium Bearing Salts
Sylvinite: 265Mt Carnallitite: 398Mt Kainitite: 626Mt
Process Flotation/Solar Evaporation
Stage DFS level testwork program underway
Over 1 billion tonnes of potassium bearing salts – all potassium salts in the Colluli resource are suitable for the production of potash fertilisers.
Shallow mineralisation supports Colluli as open pit – a proven, safer mining method, easier to expand and better overall resource recovery than underground.
Danakil basin is an emerging potash province –over 4 billion tonnes of potassium bearing salts identified to date, and one of only three major deposits globally containing kainite salt (key salt for SOP production) in solid form.
1Refer to STB ASX announcement 25th February, 2015
For
per
sona
l use
onl
y
Slide 41 Paul Donaldson, Chief Executive Officer, 29th May 2015
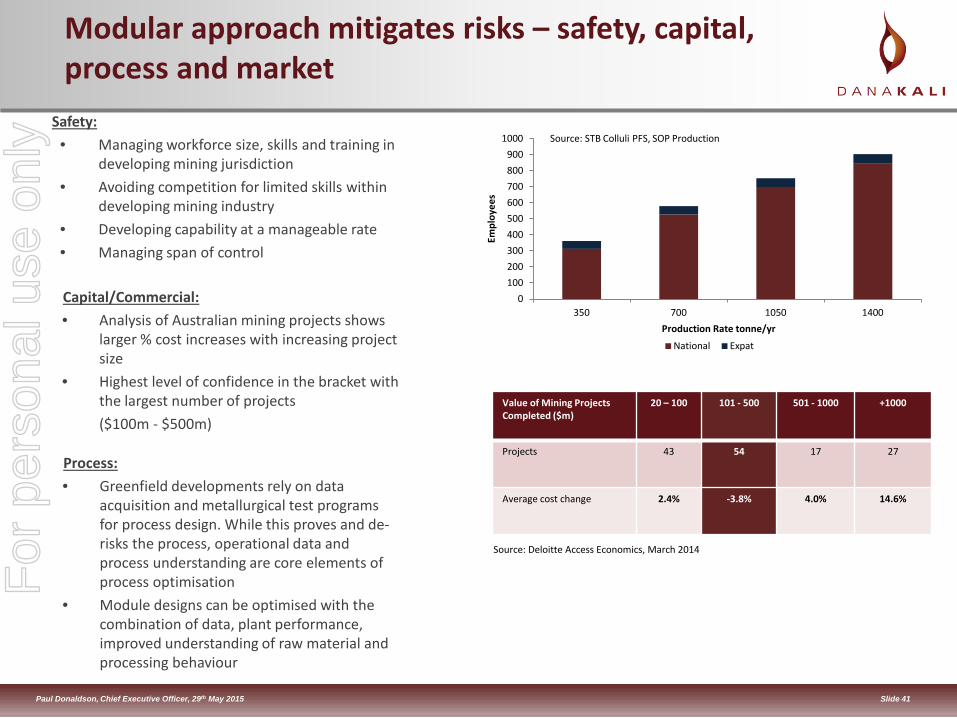
Modular approach mitigates risks – safety, capital, process and market
Safety: • Managing workforce size, skills and training in
developing mining jurisdiction • Avoiding competition for limited skills within
developing mining industry • Developing capability at a manageable rate • Managing span of control
0100200300400500600700800900
1000
350 700 1050 1400
Empl
oyee
s
Production Rate tonne/yr
National Expat
Capital/Commercial: • Analysis of Australian mining projects shows
larger % cost increases with increasing project size
• Highest level of confidence in the bracket with the largest number of projects ($100m - $500m)
Value of Mining Projects Completed ($m)
20 – 100 101 - 500 501 - 1000 +1000
Projects 43 54 17 27
Average cost change 2.4% -3.8% 4.0% 14.6%
Source: Deloitte Access Economics, March 2014
Source: STB Colluli PFS, SOP Production
Process: • Greenfield developments rely on data
acquisition and metallurgical test programs for process design. While this proves and de-risks the process, operational data and process understanding are core elements of process optimisation
• Module designs can be optimised with the combination of data, plant performance, improved understanding of raw material and processing behaviour
For
per
sona
l use
onl
y
Slide 42 Paul Donaldson, Chief Executive Officer, 29th May 2015
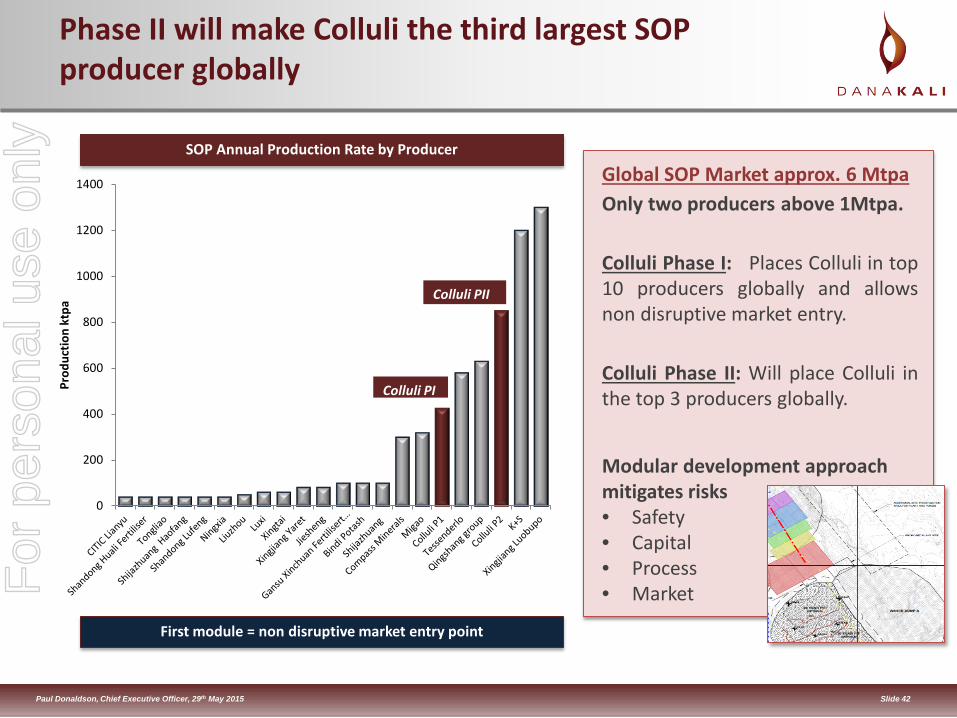
Phase II will make Colluli the third largest SOP producer globally
0
200
400
600
800
1000
1200
1400
Prod
uctio
n kt
pa
Colluli PI
Colluli PII
Global SOP Market approx. 6 Mtpa Only two producers above 1Mtpa. Colluli Phase I: Places Colluli in top 10 producers globally and allows non disruptive market entry. Colluli Phase II: Will place Colluli in the top 3 producers globally.
SOP Annual Production Rate by Producer
First module = non disruptive market entry point
Modular development approach mitigates risks • Safety • Capital • Process • Market
For
per
sona
l use
onl
y
Slide 43 Paul Donaldson, Chief Executive Officer, 29th May 2015
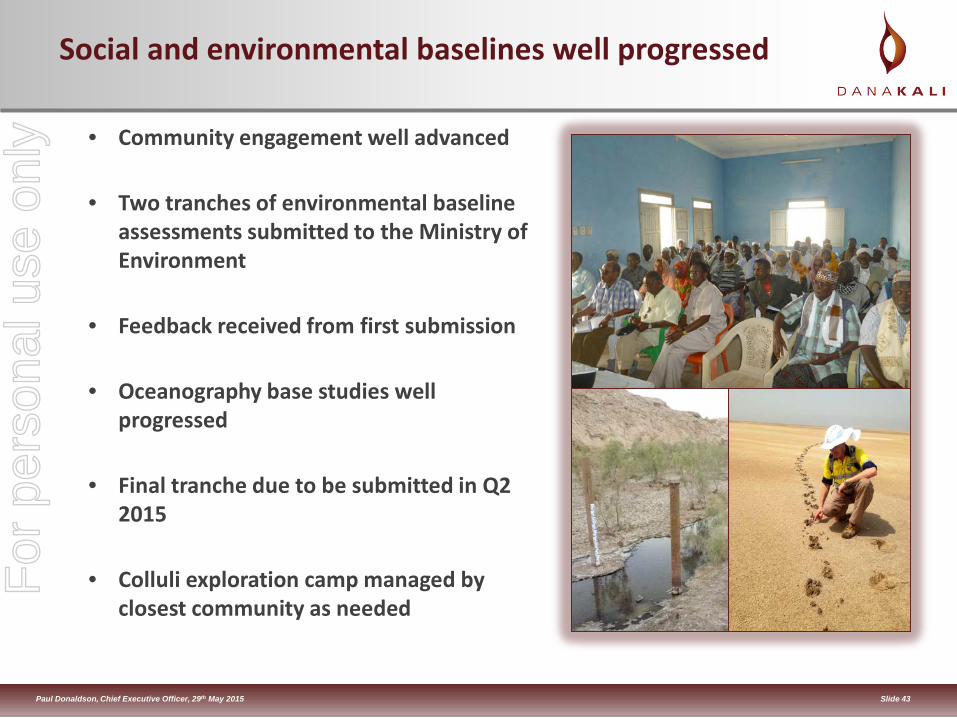
Social and environmental baselines well progressed
• Community engagement well advanced
• Two tranches of environmental baseline assessments submitted to the Ministry of Environment
• Feedback received from first submission
• Oceanography base studies well progressed
• Final tranche due to be submitted in Q2 2015
• Colluli exploration camp managed by closest community as needed
For
per
sona
l use
onl
y
Slide 44 Paul Donaldson, Chief Executive Officer, 29th May 2015
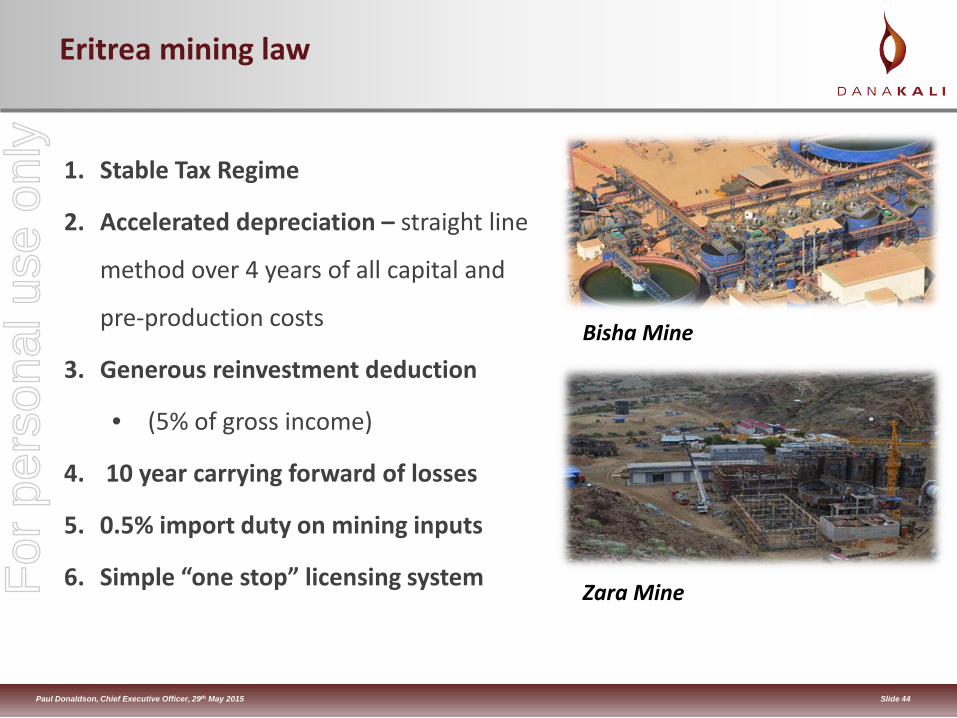
Eritrea mining law
1. Stable Tax Regime
2. Accelerated depreciation – straight line
method over 4 years of all capital and
pre-production costs
3. Generous reinvestment deduction
• (5% of gross income)
4. 10 year carrying forward of losses
5. 0.5% import duty on mining inputs
6. Simple “one stop” licensing system
Bisha Mine
Zara Mine For
per
sona
l use
onl
y
Slide 45 Paul Donaldson, Chief Executive Officer, 29th May 2015
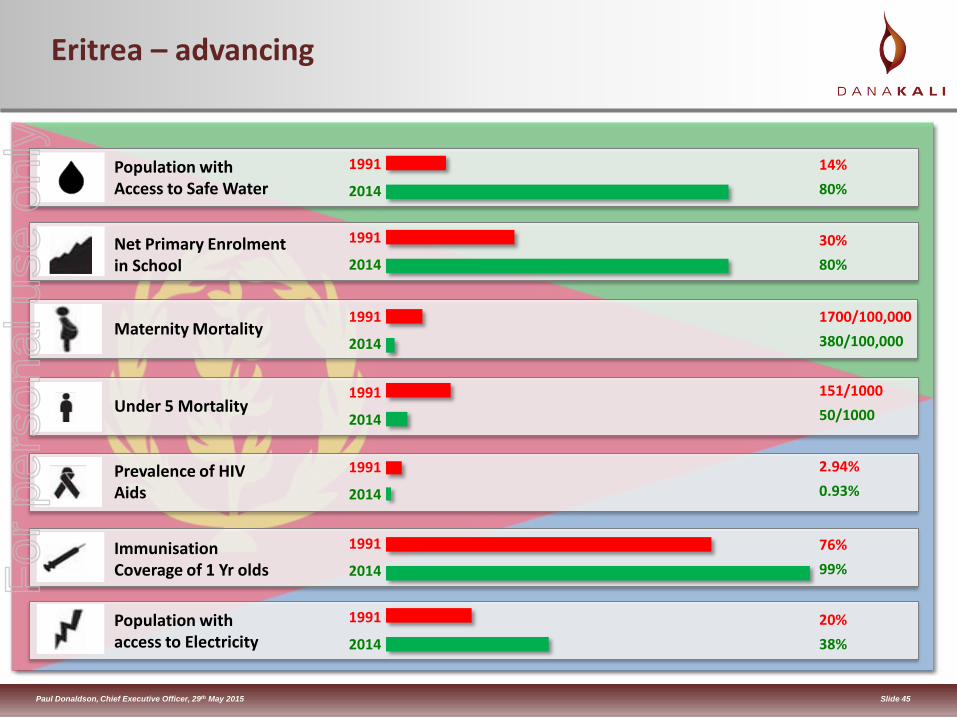
Eritrea – advancing
Population with Access to Safe Water
14% 80%
Net Primary Enrolment in School
30% 80%
1991
2014
Maternity Mortality 1700/100,000 380/100,000
Under 5 Mortality 151/1000 50/1000
Prevalence of HIV Aids
2.94% 0.93%
Immunisation Coverage of 1 Yr olds
76% 99%
Population with access to Electricity
20% 38%
1991
2014
1991
2014
1991
2014
1991
2014
1991
2014
1991
2014
For
per
sona
l use
onl
y
Slide 46 Paul Donaldson, Chief Executive Officer, 29th May 2015
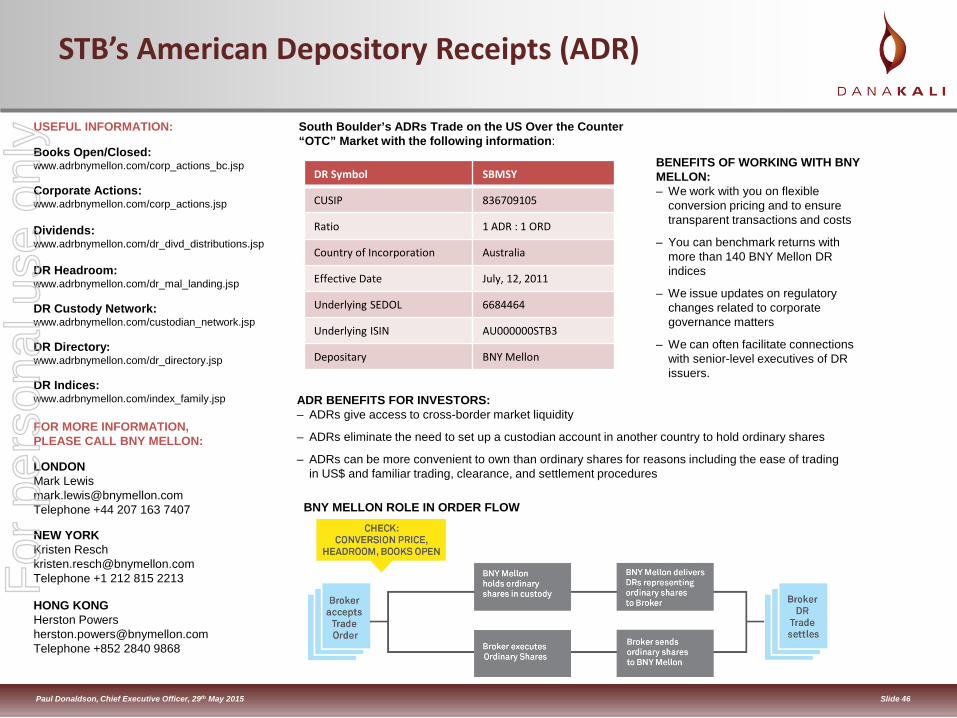
STB’s American Depository Receipts (ADR)
USEFUL INFORMATION: Books Open/Closed: www.adrbnymellon.com/corp_actions_bc.jsp Corporate Actions: www.adrbnymellon.com/corp_actions.jsp Dividends: www.adrbnymellon.com/dr_divd_distributions.jsp DR Headroom: www.adrbnymellon.com/dr_mal_landing.jsp DR Custody Network: www.adrbnymellon.com/custodian_network.jsp DR Directory: www.adrbnymellon.com/dr_directory.jsp DR Indices: www.adrbnymellon.com/index_family.jsp FOR MORE INFORMATION, PLEASE CALL BNY MELLON: LONDON Mark Lewis [email protected] Telephone +44 207 163 7407 NEW YORK Kristen Resch [email protected] Telephone +1 212 815 2213 HONG KONG Herston Powers [email protected] Telephone +852 2840 9868
South Boulder’s ADRs Trade on the US Over the Counter “OTC” Market with the following information:
DR Symbol SBMSY
CUSIP 836709105
Ratio 1 ADR : 1 ORD
Country of Incorporation Australia
Effective Date July, 12, 2011
Underlying SEDOL 6684464
Underlying ISIN AU000000STB3
Depositary BNY Mellon
ADR BENEFITS FOR INVESTORS: – ADRs give access to cross-border market liquidity
– ADRs eliminate the need to set up a custodian account in another country to hold ordinary shares
– ADRs can be more convenient to own than ordinary shares for reasons including the ease of trading in US$ and familiar trading, clearance, and settlement procedures
BENEFITS OF WORKING WITH BNY MELLON: – We work with you on flexible
conversion pricing and to ensure transparent transactions and costs
– You can benchmark returns with more than 140 BNY Mellon DR indices
– We issue updates on regulatory changes related to corporate governance matters
– We can often facilitate connections with senior-level executives of DR issuers.
BNY MELLON ROLE IN ORDER FLOW
For
per
sona
l use
onl
y