For personal use only Together · “As our customers succeed in business, so will we. Our future...
72
DWS Limited Annual Report 2012 Excellence Together For personal use only
Transcript of For personal use only Together · “As our customers succeed in business, so will we. Our future...

DWS Limited Annual Report 2012
Excellence Together
For
per
sona
l use
onl
y

Contents
01 Business Profile
02 Chairman’s Report
03 Year in Review
04 Chief Executive Officer’s Report
06 Improve, Extend, Grow
08 National Practice Report – iSolutions
09 National Practice Report – Insight Analytics
11 Regional Report – Brisbane
12 Regional Report – Sydney
13 Regional Report – Canberra
14 Regional Report – Melbourne
15 Case Study – OSCAR/NDT Program
16 Regional Report – Geelong
17 Regional Report – Adelaide
18 People and Culture Strategy
20 Executive Management Team
22 Practice and Regional Management Team
24 Board of Directors
26 Financial Statements
69 Corporate Directory
ABN 93 085 656 088
For
per
sona
l use
onl
y
Business Profile
DWS Limited is a leading Australian IT services company, providing services to blue-chip organisations since 1991. DWS has grown to now have in excess of 620 employees with offices in Melbourne, Perth, Sydney, Adelaide, Canberra, Brisbane and Geelong.
Focused on being the leader in the provision of end-to-end IT solutions, DWS designs, develops, manages and maintains software solutions and IT environments for clients. DWS is able to deliver these services to clients with a competitive advantage based on our unique culture and engagement model.
DWS Limited – Annual Report 2012 01
For
per
sona
l use
onl
y

Chairman’s Report
“ As our customers succeed in business, so will we. Our future (as it always has been) is based around building an enduring business relationship with our clients.”
Harvey Parker Chairman
Dear shareholder,
The continuing uncertainty regarding the performance of the global economy is a theme that has been presented in Annual Reports of most companies over the past few years. It is quite depressing, and we face another year of uncertainty as we move into the 2012/13 financial year. But it is a fact of life that we must live with.
DWS has proven to be quite adept at coping in these difficult times. DWS has delivered a solid financial performance, growing all financial metrics against the preceding year; revenue up 11 per cent to $109.5 million, EBITDA up 6 per cent to $26.4 million and earnings up 5 per cent to $18.2 million.
The Melbourne Office remains a key to our overall performance, but our reliance on Melbourne is diminishing as each year passes. We are experiencing solid demand for our IT services and solutions business in Brisbane, Adelaide and Sydney, and our regional office at Geelong is proving to be a sustainable and rewarding initiative, as is our presence in the National Capital, Canberra. Adding to this are the expanding operations of our two specialist practices, Insight Analytics and iSolutions, both of which delivered very pleasing earnings growth during the year.
In past Annual Reports I have mentioned the focus we place on recruiting and retaining the highest quality IT consultants. This focus remains, and it ensures that our clients benefit through their engagement of DWS as their IT solutions partner. The deliverables DWS promise are met on time and on budget. This focus on quality and timeliness, coupled with the simplicity of our engagement model, means that our client base grows, rather than diminishes.
At DWS we also remain committed to the basic business fundamentals of tight cash management, maintenance of a strong balance sheet with no debt, and ensuring that our shareholders benefit from this prudence via our progressive dividend policy. Since DWS listed as a Public Company in June 2006, the Directors, together with the Executive Management Team, have continued to ensure a dividend policy that has returned all surplus free cash to shareholders, resulting in strong income yields each year. This is again the case in the 2012 financial year.
As in previous Annual Reports, I want to acknowledge the efforts of all of the staff at DWS. It is their dedicated work ethic and commitment to excellence that drives customer satisfaction, client retention and
the acquisition of new clients. Well done to all and the sincere thanks of the Board for your efforts.
Our head office and Regional Management Teams so ably led by Mr Danny Wallis need a special mention. Their single minded focus on success for our clients ensures that DWS also succeeds. I can assure shareholders that this focus on excellence and client satisfaction will remain preeminent in the year ahead. As our customers succeed in business, so will we. Our future (as it always has been) is based around building an enduring business relationship with our clients.
Finally, I would like to thank my fellow Directors for their contribution in the year past. We all now look forward to a successful year ahead.
Harvey Parker Chairman
18 September 2012
02
For
per
sona
l use
onl
y

Revenues
UP 11%to $109M
EBITDA
UP 6%to $26.4M
NPAT
UP 5%to $18.2M
Cash at Bank
UP 39%to $15.21M
Total Earnings Per Share
14Dividends Per Share
12.50
Year in Review
YearsDWS celebrates 21 years of providing clients with high quality IT services during 2012. This milestone is underpinned by 21 years of continued revenue growth demonstrating a resilient business model based on putting clients’ interests first, and providing a great place to work for our people.
The EnvironmentThe operating environment has been challenging and this has required strong management to ensure our business has remained ‘right-sized’ to cater for changes in client demand. While prime margins have come under pressure, the Company’s balance sheet has never been stronger and DWS remains well positioned for the year ahead.
Moving ForwardDWS’ Improve, Extend, Grow four year plan is providing clear direction to the management group during difficult market conditions. The expansion of our business during these challenging times demonstrates the validity of our strategy and we will continue to invest in the diversification of our operation to ensure this growth trajectory is maintained. This will involve new operating regions (including Western Australia and potentially offshore), and new service lines via our specialist practice model.
Financial Highlights
2008 2009 2010 2011 2012
NPAT ($ million) $17.96 $16.02 $18.52 $17.39 $18.22
Operating cash flow (before interest and tax)($ million) $25.18 $25.36 $25.54 $21.65 $30.39
Earnings per share 14 12 14 13 14
Cash balance ($ million) $7.57 $12.16 $13.66 $10.98 $15.21
Net tangible assets per share 18 20 23 23 24
Total dividend attributable to the year 11 9.50 11.25 12 12.50
20
40
60
80
100
120
$M $M
5
10
15
20
25
30
2008 2009 2010 2011 2012 2008 2009 2010 2011 2012
Total Revenue EBITDA
DWS Limited – Annual Report 2012 03
For
per
sona
l use
onl
y

Chief Executive Officer’s Report
“ We have continued to attract very competent senior management and now boast one of the strongest management teams in the industry.”
Danny Wallis Chief Executive Officer and Managing Director
To my fellow shareholders,
In a tough trading environment DWS has delivered a very pleasing result. A total dividend of 12.5 cents per share was achieved, with an increase in both revenue and NPAT. The trading outlook for the year ahead looks to be just as difficult, however for the reasons explained below I am hopeful that we will be delivering earnings growth which will translate into a strong dividend return for shareholders.
DWS will continue to execute its strategy of finding new sources of revenue through the continued investment in specialist business units. Over the past two years we have started two specialist units and both are positively contributing to our revenues and earnings. These specialist units allow us to differentiate ourselves from our competitors, and importantly in the case of our cloud solutions practice (named ‘iSolutions’) we can leverage some of our strong IP to benefit our clients.
One of the challenges of the past year was managing pressures on our prime margins which ultimately impact on our ability to improve our earnings per share. There are several reasons why margins are being pressured, some of which include:
1. Price competition at the delivery end of market from offshore suppliers.
2. Difficulty placing graduate level consultants onto client engagements.
3. The macroeconomic environment is making it difficult to manage utilisation.
4. We are investing into new lines of business which generate lower margins than our core business.
5. We are continuing to invest in new geographies which require time to build momentum.
6. Limited ability to raise rates in the current environment.
While margin management is a major focus for the management team, it is a complex issue for which we have developed a multi- faceted long term plan, which includes the expansion of our existing two tiered rate structure to allow us to compete effectively and regain some of the junior work that we have lost to the offshore companies over the past four years.
We will also be continuing to develop our existing regional operations with the aim of increasing consulting staff numbers which ultimately provide more flexibility and more choice when placing staff on assignments. In addition to this, utilisation will be closely managed to ensure that we achieve the highest rates possible.
We are also in the process of investigating setting up our own offshore capability. The purpose of this would be to enable us to offer cheaper blended rates to clients whilst maintaining or increasing margin. We clearly do not want to cannibalise our existing onshore work however we do feel it’s time to complement our onshore capability with an offshore offering.
DWS has not been in a position to increase rates since the GFC, and this has also had an impact on margins. We would expect over the course of the next two years to increase rates at least to cover for the inflationary conditions over recent years, but this needs to be balanced with conditions and competitive forces.
In 2009 we outlined our strategy to strengthen the management of DWS by attracting the best possible management team. We have continued to attract very competent senior management and now boast one of the strongest management teams in the industry. I remain grateful to my Executive Team and Regional Management Group for their dedication over the previous year.
I would also like to take the opportunity to thank our staff for the sensational work they do every day in representing the company at the front line. I also would like to thank our Board for their support and guidance over the past year. I look forward to working with each and every one of you over the next year to ensure that DWS continues to outperform.
Finally I thank our shareholders for your ongoing support.
Danny Wallis Chief Executive Officer and Managing Director
18 September 2012
04
For
per
sona
l use
onl
y

DWS Limited – Annual Report 2012 05
For
per
sona
l use
onl
y

Improve, Extend, Grow
‘Improve, Extend, Grow’ is the four year organisational development strategy of DWS that was introduced last financial year to maximise the DWS value proposition for all stakeholders – clients, staff and shareholders.
Improve‘Improve’ is DWS’ ongoing commitment to its own standard of excellence. The Company has continued to develop its internal 1-ONE-14 Excellence Together program aimed at making DWS the best possible place to work. A national consultant panel was elected by the DWS community in September last year to represent consultants in the changes at DWS. The panel has successfully implemented a number of initiatives and given all employees a well-defined ‘voice’ at DWS. Other recent initiatives as part of the 1-ONE-14 program include the introduction of a revised Career Management system, a robust internal communications plan as well as ongoing enhancements to its industry leading training framework. The success of this program was demonstrated by the results of the DWS Annual Employee Engagement Survey.
DWS has continued to raise its industry awareness following a brand refresh that occurred in September last year. A sustained branding program is ensuring that DWS is well positioned in the minds of clients and prospective employees alike. A social media component has been added to the DWS external communication mix as well as a series of industry sponsorships and these are contributing to the growing awareness of DWS.
There have also been a number of internal system upgrades at DWS improving the operational efficiency of the business.
Extend‘Extend’ is the extension of the DWS product and solution offering to meet client needs and to offer an enhanced career path for DWS employees.
iSolutions, the companies cloud-based automation and data-capture technology practice, has been received strongly by clients across a broad range of industries. Similarly, the rebranded Insight Analytics Practice (formerly Business Analytics and Information Management Practice) continues to seek out and deliver on opportunities from both current and existing clients.
DWS is currently investigating the opportunity for a third specialist practice based on an offshore capability. DWS has existing client demand and this represents an opportunity to extend DWS’ existing onshore services to both new and existing clients.
GrowDWS remains committed to its growth strategy and FY12 saw the acquisition of Groundhog Pty Ltd which has added new clients to its South Australian business. A Perth office has also been established in response to client demand in the government sector and business development efforts are uncovering further opportunities for DWS in that region. DWS’ joint venture with Borealis, announced last year, has positioned the Company to leverage the growing resource sectors in Asia Pacific and an increasing sales and marketing effort is expected to ensure future growth in this area.
06
For
per
sona
l use
onl
y

DWS Limited – Annual Report 2012 07
For
per
sona
l use
onl
y

NATIONAL PRACTICE REPORT
iSolutions
iSolutions is a DWS specialist practice with the purpose of delivering internet applications via the cloud. Cloud computing can best be summarised as an ‘application-centric operations model’ where iSolutions provisions its product utilities via software-as- a-service to our clients.
The revenue model in iSolutions is unique to DWS. The intellectual property of the product utilities is owned by iSolutions, which licenses the applications as product subscriptions to our clients. The iSolutions licensing creates a recurrent revenue stream that provides exponential EBITDA growth.
The strategic focus of the practice in our first year of operation at DWS has been on the iApply utility. iApply is a cloud form automation solution, an elastic process of creating data capture forms, that can describe any form intentions directly into a convenient online experience.
The aim of iApply is to deliver organisational efficiency and improvement. iApply encourages smarter decision making with online data capture and creates an auditable process improvement. Paper-based processes are removed improving service delivery and reducing processing costs.
It has been really exciting demonstrating the innovations of iApply to new and existing DWS clients. Clients immediately understand the value proposition and how iApply can solve their data capture problems. iSolutions has successfully taken iApply into multiple market sectors, starting with financial services and expanding into consumer, energy and government.
iApply is so attractive as a process automation solution that it can execute application forms, procurement management, voice of the customer feedback, client and internal surveys, asset management, human resource management, payroll processes and workflow automation.
iApply was recently implemented in a major energy organisation in Australia. Here they had a highly manual process of data collection. All communications were email based, collation and reporting was problematic and many versions of the form existed (static and complicated).
The solution was to replace the manual data process with iApply. Contact Management was integrated into the form experience, external stakeholders were assigned to data collection tasks per automated workflow events and the user experience improved the data collection exercise. iApply reporting supported advanced customised what-if analysis.
The benefits to the client were increased data accuracy and security, greater flexibility and availability of information and a clear return on investment with iApply.
Due to the size and scope of these opportunities iSolutions established a dedicated business development capability to execute the sales pipeline and collaborate in all DWS regions with iSolutions’ new business development. New business development will continue to target education, health, utilities and financial services sectors.
iSolutions invests in its own research and systematic experimentation to further develop the product catalogue. The research and development plan for the next year is to enrich the core capabilities of iApply, provide a best-of-breed business solution platform and deliver iApply into mobile experiences.
“ iSolutions is set for an exciting year ahead. We have a great pipeline of work and are continuing to be very well received by new and existing clients.”
Robert Finlayson Practice Lead iSolutions
08
For
per
sona
l use
onl
y
NATIONAL PRACTICE REPORT
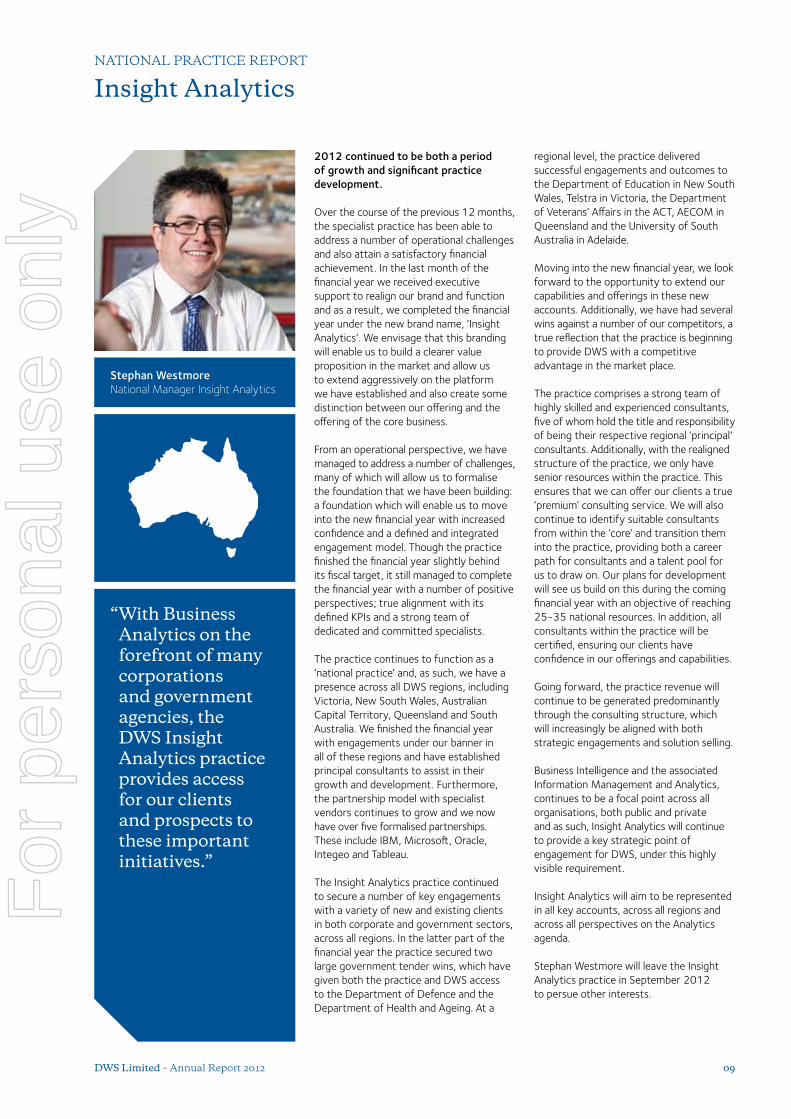
Insight Analytics
2012 continued to be both a period of growth and significant practice development.
Over the course of the previous 12 months, the specialist practice has been able to address a number of operational challenges and also attain a satisfactory financial achievement. In the last month of the financial year we received executive support to realign our brand and function and as a result, we completed the financial year under the new brand name, ‘Insight Analytics’. We envisage that this branding will enable us to build a clearer value proposition in the market and allow us to extend aggressively on the platform we have established and also create some distinction between our offering and the offering of the core business.
From an operational perspective, we have managed to address a number of challenges, many of which will allow us to formalise the foundation that we have been building: a foundation which will enable us to move into the new financial year with increased confidence and a defined and integrated engagement model. Though the practice finished the financial year slightly behind its fiscal target, it still managed to complete the financial year with a number of positive perspectives; true alignment with its defined KPIs and a strong team of dedicated and committed specialists.
The practice continues to function as a ‘national practice’ and, as such, we have a presence across all DWS regions, including Victoria, New South Wales, Australian Capital Territory, Queensland and South Australia. We finished the financial year with engagements under our banner in all of these regions and have established principal consultants to assist in their growth and development. Furthermore, the partnership model with specialist vendors continues to grow and we now have over five formalised partnerships. These include IBM, Microsoft, Oracle, Integeo and Tableau.
The Insight Analytics practice continued to secure a number of key engagements with a variety of new and existing clients in both corporate and government sectors, across all regions. In the latter part of the financial year the practice secured two large government tender wins, which have given both the practice and DWS access to the Department of Defence and the Department of Health and Ageing. At a
regional level, the practice delivered successful engagements and outcomes to the Department of Education in New South Wales, Telstra in Victoria, the Department of Veterans’ Affairs in the ACT, AECOM in Queensland and the University of South Australia in Adelaide.
Moving into the new financial year, we look forward to the opportunity to extend our capabilities and offerings in these new accounts. Additionally, we have had several wins against a number of our competitors, a true reflection that the practice is beginning to provide DWS with a competitive advantage in the market place.
The practice comprises a strong team of highly skilled and experienced consultants, five of whom hold the title and responsibility of being their respective regional ‘principal’ consultants. Additionally, with the realigned structure of the practice, we only have senior resources within the practice. This ensures that we can offer our clients a true ‘premium’ consulting service. We will also continue to identify suitable consultants from within the ‘core’ and transition them into the practice, providing both a career path for consultants and a talent pool for us to draw on. Our plans for development will see us build on this during the coming financial year with an objective of reaching 25-35 national resources. In addition, all consultants within the practice will be certified, ensuring our clients have confidence in our offerings and capabilities.
Going forward, the practice revenue will continue to be generated predominantly through the consulting structure, which will increasingly be aligned with both strategic engagements and solution selling.
Business Intelligence and the associated Information Management and Analytics, continues to be a focal point across all organisations, both public and private and as such, Insight Analytics will continue to provide a key strategic point of engagement for DWS, under this highly visible requirement.
Insight Analytics will aim to be represented in all key accounts, across all regions and across all perspectives on the Analytics agenda.
Stephan Westmore will leave the Insight Analytics practice in September 2012 to persue other interests.
“ With Business Analytics on the forefront of many corporations and government agencies, the DWS Insight Analytics practice provides access for our clients and prospects to these important initiatives.”
Stephan Westmore National Manager Insight Analytics
DWS Limited – Annual Report 2012 09
For
per
sona
l use
onl
y

DWS’ regional management model enables each office to develop its identity and culture while still having a strong affiliation with the broader DWS business. This approach facilitates strong client relationships while also enabling efficient and effective management and governance.
10
For
per
sona
l use
onl
y

REGIONAL REPORT
Brisbane
DWS Brisbane continued to deliver against its growth strategy over the year achieving a 58 per cent lift in revenue from last year and exceeding its full year forecast.
Our drive to become the technology delivery partner of choice for Brisbane was buoyed by our contribution to commercially strategic projects such as the launch of the new Virgin Australia website and the establishment of the Data Alignment project at Telstra. The delivery of these important projects was in addition to the exceptional service delivery we achieved for our existing client base.
By the end of the year, the office had a team of over 70, an increase of 22 from the previous year. This increase in our consulting base further adds to the depth of skills and experience we can offer clients across the range of industries operating in the Brisbane region.
Over the course of the year, DWS delivered services to new strategically important clients in the engineering, government and energy sectors. As part of our ongoing drive to extend both our client base and the services we offer them, DWS Brisbane formed an important relationship with Boreal-Information Strategies (Borealis), global leaders in Corporate Social Responsibility (CSR) solutions for the mining and oil and gas sectors. The success of this relationship was formalised with the establishment of a new Australian company for the delivery of Borealis solutions – BDCS. BDCS is responding to the strong growth of Borealis solutions in the Australian oil and gas sectors which, in FY12 were predominantly Queensland based.
The above investment in a new technology and business relationship reflects our unapologetic drive to increase the range of services we can offer our clients.
FY12 saw the Brisbane office increase its Applications Development and Integration footprint with significant investments made in both the IBM and Microsoft technology domains. This investment, however, only makes sense when done in conjunction with the development of a high calibre team. DWS consultants in the Brisbane office continue to represent the very best of Brisbane’s IT talent pool.
Our unique recruitment process ensures alignment to a proven set of values as well as the selection of people totally committed to best practice delivery and customer satisfaction.
A key driver for DWS in FY13 will be to strengthen and extend our brand in the market to ensure that all potential clients are aware of the significant capabilities that exist within our business. In addition to the depth and breadth of our capability, we will continue to trade on the fact that DWS is totally client centric and so prides itself on being nimble and easy to do business with. As the competitive environment within the Brisbane market increases, as we anticipate it will, it will be companies like DWS that not only survive but prosper.
Our dedication to only hiring the best people in the market, our commitment to remaining lean and our willingness to invest in our staff will further highlight the unique value proposition that we offer the market.
“ Our Brisbane office continues to extend its capability and capacity through controlled organic growth and the establishment of innovative solutions which add significant value to our clients.”
Jason Simms General Manager Brisbane
DWS Limited – Annual Report 2012 11
For
per
sona
l use
onl
y

Peter Turnbull General Manager Sydney
REGIONAL REPORT
Sydney
FY12 was a transitional year with internal and external challenges impacting the growth of the Sydney business. Peter Turnbull joined DWS just over six months ago and has undertaken a deep-dive into the heart of the Sydney business to learn about its people, service offerings, capabilities and client relationships.
The result of the deep-dive was the realisation that the Sydney business has a solid foundation to ignite growth and deliver value over the coming 12 months, but to date has not been able to tap into its full potential. To address this, Peter has established an experienced local management team, which is supported by an enthusiastic sales team, focused on the single goal of transforming the Sydney office and tapping into its potential in FY13. This transformation is being delivered across four key perspectives:
1. Establishing stronger, more focused relationships with existing clients.
2. Rewriting internal processes for sales, account management and account planning.
3. Fostering a culture of innovation and excellence which provides each team member with career building opportunities.
4. Identifying new opportunities, partnerships and ideas for sustainable revenue growth and improved value.
FY13 will bring its owns challenges and opportunities. Predominantly, over the past six months, the Sydney business has invested in extending the consulting team, improving the internal processes and building client relationships to leverage each opportunity and fortify the business for the challenges ahead. Limitations have been identified and strengths are being kindled. Value will come from the conversion of client relationships to trusted partnerships. Growth will be ignited from the ability of the team to think and act differently to onshore and offshore competitors in the traditional resource augmentation service provided by DWS.
Secondary growth will be generated through the introduction of a stepped approach to delivering next-gen based solutions to the existing client base. This will include strengthening the capabilities of the business in mobile platform development and system integration (SI) work for on-premises and cloud based platforms. The Sydney business will leverage the experience of our Insight Analytics practice to deliver business intelligence (BI), enterprise data warehousing (EDW) and ETL solutions to its clients and continue to utilise the excellent capabilities of the iApply technology suite. The Sydney business will continue to invest in the development of the consulting team and foster a culture though initiatives such as investing in agile methodologies to meet the evolving needs of our clients. The Sydney business will benchmark itself using techniques including Net Promoter Score (NPS) and will harness the collective ideas and thoughts of the talented Sydney team by augmenting a wisdom of crowds process into the key operational processes of the business. Opportunities in FY13 will be generated from the long term client relationships which are transitioned to partnerships. Investments in improving brand awareness in Sydney will be key to position the business as a partner, not just a supplier of resources. The Sydney Management Team is well supported by the DWS Executive Team and, through this partnership, the Sydney business will transition to its vision of being ‘an innovate partner of next-gen IT consulting; a career building employer of choice’.
“ FY13 success for the Sydney business will be driven by continuous improvements delivered via perpetual small wins across the financial, client, internal process and people perspectives of our business.”
12
For
per
sona
l use
onl
y

John Kennedy General Manager Canberra
REGIONAL REPORT
Canberra
Throughout the year DWS Australian Capital Territory (ACT) has continued to deepen its relationship with flagship clients and diversify into new large Federal Government agencies. Our continued focus to recruit only the best and brightest without compromise has greatly contributed to our ability to build and maintain IT systems with increasingly complex legislative requirements.
We continue to be trusted by government to deliver and maintain systems across its most critical program areas including the politically sensitive clean energy legislation and new taxation law. A strong core team of talented consultants are building the reputation of DWS in the Canberra market. The DWS training framework has strengthened our consulting base as many consultants gain critical certifications aligned with client demand.
Our government clients continue to respond to our value proposition around the provision of consistent high quality consultants, a guarantee to deliver and being easy to do business with.
There were many achievements throughout the year including the maintenance of strong EBITDA margins in an increasingly competitive marketplace. Specific achievements included:
• Successful delivery of large multi-million dollar Managed Services engagements within a dynamic legislative environment.
• Successful admission to several critical government panels.
• Our clients benefiting from the introduction of our DWS national practice lines, including Insight Analytics and iSolutions.
• Becoming a key partner to large international systems integrators, thereby providing access into otherwise closed clients.
• Increasing our footprint of more diversified offerings including business intelligence solutions and customer relationship management solutions.
DWS Canberra continues to serve the largest Federal Government agencies with significant change programs including:
• Australian Taxation office;
• Clean Energy Regulator;
• Department of Human Services;
• Department of Health and Services;
• Department of Veterans’ Affairs;
• Department of Defence; and
• Department of Immigration & Citizenship.
Our strategy to consolidate and focus on the Microsoft platform has helped build a very capable and experienced team in what is the most widely used technology platform in Federal Government. Due to whole of government software agreements, there continues to be high demand for our core service offerings. Our market positioning is expected to continue to pay dividends as clients reap the benefit of engaging a large Australian Professional Services provider with deep capability in the technology stack that matters to them most. Our partnerships with global technology companies continue to provide access to deep intellectual capital and facilitate introductions into new clients.
Solid growth is expected to continue into 2013 despite challenging market conditions as the Federal Government chases a budget surplus. This itself has created opportunities for DWS as our clients seek to work more closely with trusted, nimble and innovative service providers who have the depth and capability to deliver. Due to an increasing focus on value for money and an insatiable drive for efficiencies, new opportunities are opening for our iSolutions business and cloud offerings. High demand is emerging for citizen facing forms and workflow capability offered by the DWS iApply solution, which offers a low entry cost yet delivers highly configurable, scalable and capable solutions.
In the year ahead, DWS will continue to build brand awareness and increase panel access into a greater number of Federal Government agencies. We will continue to leverage DWS’ broader national capabilities in the Canberra market in order to diversify our client base and increase value for existing clients.
“ DWS in Canberra continues to build its reputation as Microsoft development specialists. We continue to attract the best and brightest ICT professionals allowing us to tap into the growing Microsoft footprint in Canberra.”
DWS Limited – Annual Report 2012 13
For
per
sona
l use
onl
y

REGIONAL REPORT
Melbourne
Melbourne continues to represent the single largest core of DWS’ Australian operations. DWS Melbourne has continued to grow since its inception in 1991 and supports a team of 320 consulting staff and includes clients from a range of sectors.
The 2011/12 year was one mixed in both demand and opportunity. DWS Melbourne experienced consistent demand across a broad range of technical competencies and services from core clientele, and further emerging opportunity identified through marketing, strengthening of relationships and a mature approach to services and delivery.
Through 2011/12 DWS Melbourne has consolidated its presence and relationships with core clients across a range of industries including telecommunications, Victorian Government, financial services, banking, transportation and logistics, health, utilities and manufacturing.
With a long standing reputation as a reliable and highly capable premium IT services provider, DWS Melbourne has strengthened its market position and client presence into an expanded group of market segments including financial Investment, superannuation, education, retail, FMCG and gaming and entertainment.
As DWS Melbourne has continued to successfully design, develop and implement a variety of innovative projects, as well as providing valuable independent specialist capability for a diverse cross section of clients, the market continues to re-engage and retain services from DWS for extended periods of time.
DWS Melbourne has successfully positioned its capability across emerging technologies and techniques throughout the year including establishing a highly competent mobile solutions capability addressing emerging market needs for fully functional and integrated mobile device and mobile web solutions. These solutions have met the requirements of a number of clients across retail, entertainment and financial services.
DWS Melbourne has also demonstrated capability to embrace emerging trends, in particular, the Agile methodology for applications development as a preferred approach with many clients. This rapid
iterative development methodology aligns very well with the core technical skills and development experience within DWS and, supported by an investment in training of a large number of consultants to an industry recognised level, DWS has successfully delivered a range of projects for our clients.
DWS Melbourne also invested heavily in training the consulting teams in other technical and non-technical disciplines to ensure the skills and services are at an industry recognised level and current. This training includes project management (e.g. Prince 2) and analytical certifications (BABOK), and technical solutions across established technical solutions (Microsoft, IBM, Oracle). DWS also invested in cross skilling consultants in ‘like’ products to complement existing knowledge and further abilities to remain product and vendor agnostic when providing consulting services.
DWS Melbourne was also successful throughout the year in delivering fully functional applications into client businesses. These types of engagements see DWS demonstrate its full capability to specify, design and develop applications to meet the needs of our client’s business. The appropriate complement of DWS’ technical and management resources are appointed to the project and, by engaging with formal project management methodologies, a best practices development approach and quality assured testing, DWS has successfully developed solutions for many businesses across our clientele this year including telecommunications, financial services, banking, health, utilities, retail, FMCG and gaming and entertainment.
In a number of cases DWS has been retained to provide further development and enhancement activities as well as ongoing applications support. These support services are provided on a renewable basis (mostly annual) and ensure the client’s core business applications are fully functional and supported across business and after hours as required.
“ DWS Melbourne is viewed as a trusted partner by our clients, and continues to build upon the deep relationships which have been developed over the past 21 years.”
Michael Smith General Manager Melbourne
14
For
per
sona
l use
onl
y

CASE STUDY
OSCAR/NDT Program
ClientClean Energy Regulator (CER) Previously Department of Climate Change & Energy Efficiency (DCCEE)
Business IssueThe Online System for Comprehensive Activity Reporting (OSCAR) is a web-based data tool for business to record energy and emissions data for reporting to government under the National Greenhouse Energy Reporting (NGER) Act 2007. OSCAR allows users to gain a clear picture of an organisation’s emissions, and can automatically calculate greenhouse emissions based on their energy and emissions data.
The NGER Disclosure Tool (NDT) is an internal system used by Clean Energy Regulator staff to analyse, validate and report NGER data across multiple years and versions (including resubmitted reports) using OLAP cubes. Security roles have been established in NDT for different stakeholder groups to limit access to defined data sets in line with legislated requirements. NDT extracts greenhouse and energy information from OSCAR and delivers it electronically to authorised data users, including Australian Government and State and Territory Government agencies.
The SolutionDWS provides CER with program management, project management and a skilled team to undertake development and enhancement work in response to legislative and other changes, as well as providing ongoing support for production instances of OSCAR and NDT.
DWS has worked with on the OSCAR/NDT Program since 2009 (the original contract was signed by SDM with DCCEE). Our current engagement is under an Enhancement, Maintenance and Support Service contract.
Day to day activity is focused on system enhancements, largely driven by legislative changes, identified application improvements, new reporting requirements and year-on-year data modelling.
DWS provides a team of specialists including business analysts, developers, testers and project managers. The size of the team fluctuates from 16-22 consultants.
DWS Limited – Annual Report 2012 15DWS Limited – Annual Report 2012
For
per
sona
l use
onl
y

REGIONAL REPORT
Geelong
The 2011/12 financial year was the first full year of operation for DWS Geelong and by all metrics, this has been a very successful year.
In FY12 we:
• established a strong local brand;
• developed strong relationships with key organisations and personnel;
• built a loyal team with very high retention;
• worked with a diverse range of local organisations;
• increased our staff numbers to 17; and
• delivered a very solid financial set of results.
This year saw us quickly build our reputation in Geelong and, with the backing of the Melbourne team, we worked hard to develop our local presence. Brand awareness and development was a critical element of the successful establishment of a local office with efforts centred on local events, partnerships and focused marketing. With this in mind, DWS Geelong continues to be a very active member of the local business and IT communities. We have developed a strong association with the Committee for Geelong and ICT Cluster Geelong, enabling us to regularly assist and associate with relevant individuals and organisations.
Whilst we assisted our clients deliver a range of solutions, there was a primary theme of providing business analysis, advisory and management services. These types of engagements were a strategic focus for DWS Geelong as it provided a point of differentiation against some competitors, enabling us to work with senior managers within client organisations, giving us a greater insight into their organisations. We will continue to focus on engagements of this nature with the goal of being seen as a true strategic partner.
On the delivery front, we continued our ongoing engagement with a large local university with the completion of a number of projects; most notably, our assistance in their web improvement program. This project is progressing well and has attracted some very positive feedback both internally and externally. There have been a number of successful rollouts to date with the program due to complete in FY13.
The latter half of the financial year saw DWS Geelong begin to engage more deeply with a major local retailer. In the last few months, we have extended our relationship from that of a niche provider to now be a significant contributor of wide-ranging expert IT resources. We strengthened our relationship through a combination of resource augmentation and delivering end-to-end solutions. The skill and expertise of our local consultants, along with our ability to respond quickly and be flexible, has enabled us to grow in this account and we have established a strong partnership that is expected to grow next year.
The 2013 financial year looks very positive for DWS Geelong. We will continue to leverage our extensive local contacts and success stories to push into new accounts and to solidify and strengthen our current client base.
There is a real need amongst local organisations to establish or enhance their Business Intelligence and Analytical capabilities and this will be a focus for the forthcoming year. We also intend to extend our reach into the current accounts by becoming more active in Development and Testing spaces. Managed Services are the other major area of focus, where DWS Geelong expects we can add significant value to local organisations.
“ DWS Geelong had a successful first full year of operation. We are excited by the year ahead and look forward to further developing on our local reputation and assisting our clients to deliver success.”
Brett King General Manager Geelong
16
For
per
sona
l use
onl
y

REGIONAL REPORT
Adelaide
DWS Adelaide had a very solid year, having finished strongly the previous year and continuing the momentum. We have strengthened our reputation in the market as a key delivery partner to our strategic clients, and have been able to leverage these relationships to win key engagements with new clients in health, defence, utilities, resources and government sectors.
The Adelaide office was able to exceed its full revenue target on the back of this growth. Our consulting numbers grew to 62, an increase of 20 from the previous year.
The quality of our DWS consultants continues to be a key differentiator in the market, feedback from clients is always positive around the calibre of the team, and the outcomes delivered by them enhance our reputation. This points back to the DWS recruitment process, ensuring that we are hiring the cream of the crop which is augmented by our internal specialist groups, where our consultants share war stories and work through industry certifications.
At the beginning of the year we relocated our office from the city fringe at Mile End to the CBD in Pirie Street, which has been a resounding success. With easy access to many clients and key vendors alike, the central location has even enabled several clients to make use of our substantial boardroom. This move reflected the confidence that DWS has in the local Adelaide market, and this will assist us in our further growth in Adelaide.
One key message to our existing and potential clients is the depth and breadth of our offering. DWS in Adelaide has grown significantly not just in consulting numbers, but also in breadth of capability. Many still default to thinking of us as a strong development house, and while that is a strength across various technology platforms, our Business Intelligence, Business Analysis, Project and Program Management, and SOA skills are also first class. We have had the good fortune to showcase these skills in many tier one clients, and see significant growth opportunities in these allied spheres.
As a direct result of our success in SA and NT Health, DWS was selected to perform a significant piece of work with WA Health. This has provided the catalyst to establish an office in Perth, where DWS will get the opportunity to engage with more clients in that buoyant economy. Our quality and commitment to our staff and clients will ensure growth in this market.
“ South Australia is building on its reputation for technically excellent consulting. By deepening our business skill set we are able to align our core technology with client business outcomes.”
Alan Thomas General Manager Adelaide
DWS Limited – Annual Report 2012 17
For
per
sona
l use
onl
y

The DWS culture of client centricity and delivering excellence in everything we do is consistently recognised by our clients as a key factor in why we have successful long term relationships.
Under Improve, Extend, Grow there is a strong People and Culture strategy stream which is focused on further strengthening our unique culture and our employee engagement. This strategy has a number of key initiatives; employee engagement survey, communication, training and career management.
Engagement of our employees is critical to the success of this strategy and DWS undertakes an annual employee engagement survey to gain feedback on what is working well and where opportunities exist to improve our employee engagement. Our response rates to these surveys are statistically some of the highest in the industry and last year was no exception. Our people look forward to these surveys to have their ‘say’ in which they provide clear feedback on which initiatives are enhancing the employee value proposition and in which direction they should be taken. The two overwhelming results of the last survey were that we continue to have high levels of employee engagement and as an organisation we have taken our professionalism to the next level.
To improve our communication with our employees we appointed 14 employee advocates, with every office represented. The DWS advocates meet with the Executive Team monthly and act as a conduit to provide feedback from all consultants about what is working well and where we can make improvements.
Many successful initiatives launched throughout the year were as a direct result of our employee advocate program. This structure ensures we focus on the initiatives that tangibly strengthen our employee value proposition.
Current skills are critical to remain at the forefront of the Information Technology industry. Early last year we established an enterprise training framework for our consultants to enable them to gain access to the latest training content. The consultant adoption of the training framework was very successful and has been expanded to include more content and courses. Since the expansion of this training framework, over 65 per cent of our consulting staff have undertaken additional training in order to gain further certifications in their chosen disciplines. These high levels of IT certified staff further enhance our client value proposition.
With the People and Culture strategy and supporting initiatives well embedded in our organsation we have embarked on a national graduate program. We are actively engaging universities across the country to identify talented and passionate IT graduates to join DWS. The early signs of this program are very positive, with great feedback received from our clients and our employees.
The capability of our consultants and strength of our culture is recognised by our clients as leading the industry. The strategies and actions we are actively driving across DWS are delivering deeper employee engagement, strengthening our industry leading culture and further positioning DWS for future success.
PEOPLE AND CULTURE STRATEGY
Excellence Together
Under Improve, Extend, Grow there is a strong People and Culture strategy stream which is focused on further strengthening our unique culture and our employee engagement.
18
For
per
sona
l use
onl
y

DWS Limited – Annual Report 2012 19DWS Limited – Annual Report 2012
For
per
sona
l use
onl
y

Danny Wallis Chief Executive Officer and Managing Director
As CEO/Managing Director of DWS, Danny Wallis ensures the tenets the company was built on flow through to every aspect of the business across all states. Committed to providing the highest quality consultants and delivering the best, total solution to all DWS clients, Danny has been the catalyst in building DWS to the premium position it holds today within the market.
20 years of experience in the information technology sector have given Danny the knowledge and understanding to be able to position DWS as the IT solutions provider of choice for some of Australia’s most recognised and successful blue-chip organisations and Federal and State Government departments.
Executive Management Team
Lachlan Armstrong Chief Financial Officer and Company Secretary
Lachlan Armstrong joined DWS in 2005 as National Commercial Manager and has been DWS’ Chief Financial Officer since August 2008. Lachlan is responsible for a broad range of operational and support functions within the DWS Group and as a member of DWS’ Executive Management Team, Lachlan also plays a key role in the development and execution of DWS’ strategic agenda. Prior to joining DWS, Lachlan worked in Chartered Accounting, and International Finance. Lachlan holds a Bachelor of Banking and Finance, Bachelor of Accounting, Masters in Applied Finance, and is a member of CPA Australia and the Australia Institute of Company Directors. Lachlan is also the Company Secretary of the DWS Group.
Dougall McBurnie Director Strategic Operations
Dougall McBurnie is Director of Strategic Operations for DWS. Prior to joining DWS Dougall was the Chief Information Officer for Healthscope, a $2 billion Asia Pacific private health care provider, for over four years where he successfully delivered the transformation of their information technology organisational capability, business platforms and infrastructure.
Prior to joining Healthscope he was the General Manager – eBusiness at Coles Myer, Director of Technology for PBL Gaming and Chief Architect at Crown Casino. He holds a Bachelor of Science from Deakin, a Master of Business from RMIT and is the holder of numerous international patents.
20
For
per
sona
l use
onl
y

DWS Limited – Annual Report 2012 21
For
per
sona
l use
onl
y

Practice and Regional Management Team
Robert Finlayson Practice Lead iSolutions
Robert Finlayson is the Practice Lead of iSolutions, joining DWS with the acquisition of Taten’s business assets. Robert started at Taten in 1998 as a software developer, prototyping the first version of NAB’s internet banking product and designing and architecting many major financial services internet projects. Robert led the teams that created the innovative my2ic and security framework products, later moving into research and development and business development roles.
Robert spent three years working from Vancouver Canada as Technical Lead and returned to Australia as Chief Technology Officer, later as Chief Executive Officer. Robert’s passion is delivering ground-breaking software products to market and helping businesses reduce costs through cloud services.
John Kennedy General Manager Canberra
John recently joined DWS following 14 years in the ICT Professional Services Industry where he worked in senior Business Development and Client Executive roles, and prior to that as a Practice Manager, and as a Principal Consultant in Enterprise Architecture.
John brings to DWS extensive knowledge of the Canberra market and an in-depth understanding of the needs of government clients and of the machinations of federal government. He is well connected across Canberra and highly respected within the IT consulting community and with senior executives.
John has a Masters of Business Administration, a Graduate Diploma of Management and an Associate Diploma of Business (Applied Computing). John is an ambitious and driven professional who sees great potential to grow DWS in the Canberra market.
Jason Simms General Manager Brisbane
Jason’s strong engineering heritage, coupled with the practical application of project management, general management and significant business development experience, provides Jason with a unique insight into client needs, and ensures he delivers customer focused solutions matched to customer expectations.
Jason has supplemented his engineering and project experience with formal education in management, having achieved well regarded qualifications at the Post Graduate and Masters levels. In addition to his multi-disciplinary expertise, Jason possesses a high level of emotional intelligence, a strong work ethic, pragmatism and high ethical standards thereby presenting Jason as an asset to DWS and a critical member of the leadership team.
Peter Turnbull General Manager Sydney
Peter has held a number of senior positions throughout his career including the Chief Information Officer at BOQ Finance and Head of Information Technology at IAG Asset Management. At BOQ, Peter led the design and implementation of a new technology environment during the incorporation of the BOQ Finance subsidiary.
Peter holds a Bachelor of Information Technology, Bachelor of Business Management and a Graduate Diploma in Applied Finance and Investment.
Peter joined DWS in early 2012 and has spent the past six months establishing solid foundations across the financial, client, internal process and people perspectives of the Sydney business to position it for improved growth and value in FY13.
22
For
per
sona
l use
onl
y

Michael Smith Business Development Manager Melbourne
Commencing his IT Services career in 1990, Michael has spent the majority of this time working with national IT recruitment services providers.
Through his career, Michael has been responsible for the development and delivery of professional IT recruitment services across a range of corporate and SME businesses across industry sectors including telecommunications, banking and finance, commercial and technical vendors. His experience includes management of functional business development teams and the ongoing improvement of service delivery and client relationships.
Brett King General Manager Geelong
Brett’s background in IT consultancy and management were seen as the ideal preparation for this new venture.
Brett has worked in the UK and Australia in a wide range of industries with the common theme of delivering systems and processes capable of empowering organisations to make quicker, smarter and better decisions. The General Manager role in Geelong fits perfectly with his expertise and he looks forward to establishing DWS Geelong as the leading provider of IT solutions in the region.
Alan Thomas General Manager Adelaide
Alan has held a range of senior positions throughout his career, working in a variety of diverse organisations including Telstra, Logical, Marconi, Alphawest and Oracle.
Combining his practical experience with continued tertiary education Alan has earned the following qualifications: Telecommunications Technical Officer, Associate Diploma in Business (Management), and Master of Business Administration (MBA). He is currently enrolled in a Bachelor of Laws Degree at the University of South Australia.
Born in Bordertown, SA and now living in Adelaide, Alan has an understanding of and familiarity with the South Australian business environment that is second to none.
DWS Limited – Annual Report 2012 23
For
per
sona
l use
onl
y

Board of Directors
Danny Wallis Chief Executive Officer and Managing Director
Danny founded DWS in 1992 and is the current Chief Executive Officer and Managing Director. He identified the market opportunity for a high quality, professional, client-focused IT services organisation and in true entrepreneurial spirit, from that vision, set about building DWS into the success story it has become today.
From humble beginnings in a one room operation in Melbourne, DWS now has facilities in Melbourne, Geelong, Perth, Sydney, Adelaide, Brisbane and Canberra and employs over 620 staff. Danny continues to oversee all aspects of DWS’ operations and provides the leadership and direction to ensure the DWS philosophy of honesty, ethics and transparency is at all times adhered to and that all staff have a thorough appreciation of the importance of the client-centric focus of the business model.
Harvey Parker Chairman and Non-Executive Director
Harvey brings a wealth of experience in business management and corporate governance from both the public and private sectors to his role as Chairman of the Board of DWS.
A stellar business career has seen Harvey hold positions as CEO of companies such as New Zealand Post, United Energy and as Group Managing Director, Commercial and Consumer at Telstra. He has also been Director General, Department of Youth, Sport and Recreation for the Victorian Government and Chairman of Pelroz NL, Datacom Investments Australia, Moore Australia, D&B Australia, Intermoco and Emergency Communications Victoria. Harvey was also a Non-Executive Director of the ASX listed technology services company Volante Group Limited and Animal Health Australia.
In addition to being Chairman of DWS, Harvey also currently holds this position at Pacific Turbine Brisbane and is a former Director of the Riding for the Disabled Association Victoria.
Ken Barry Non-Executive Director
With over 40 years of corporate, commercial, legal and compliance experience with listed and unlisted companies, Ken provides valuable insights to the DWS Board.
Ken previously held positions as Chairman of national law firm Deacons (now called Norton Rose Australia), Director of the National Electricity Market Management Company Limited , Yallourn Energy Limited and Chairman of Ausdoc Group Limited and Freightway Express Limited (NZ).
In addition to being a Non-Executive Director of DWS, Ken is currently the Chairman of IOOF Holdings Trustee Pty Ltd, Doxa Youth Foundation, Next Generation Australia Pty Ltd and MAP Capital Pty Ltd. Ken is also Chairman of the advisory Board of leading thoroughbred stud Coolmore Australia, and a Director of Thoroughbred Breeders Australia Ltd.
24
For
per
sona
l use
onl
y

Martin Ralston Non-Executive Director
A veteran of the information technology sector, Martin has been involved in the IT industry since 1970. Over the span of his career, he worked in various roles with BHP Billiton, Computer Accounting Services and Accenture (previously Andersen Consulting) where he became a Partner in 1985.
Filling a number of senior management positions during his tenure with Accenture, Martin held roles of Managing Partner – Technology Competence, Managing Partner – Government Services and Managing Partner – Business Outsourcing and retired from Accenture in August 2001.
Martin holds a Bachelor of Economics from Monash University and is currently Vice Chairman of the Moonee Valley Racing Club, Non-Executive Chairman of Transol Corporation Limited and a Board Member of Hawthorn Football Club.
Gary Ebeyan Non-Executive Director
Gary has more than 25 years’ experience in the IT industry following his graduation from the University of Melbourne with a Bachelor of Science degree. He established his first IT business at the age of 23 developing software products for the building industry. The business gained reputable customers such as Jennings Industries, Pioneer Group, BP Australia and BHP Melbourne Research Laboratories.
After eight years of success, Gary established Expert Information Services to focus on the growing IT services market. Gary’s focus on business excellence was recognised by ‘The Age/D&B Awards’ with Expert Information Services being awarded ‘Best Victorian IT Business’ in 2001 and 2002, and ‘Best Overall Victorian Business’ in 2001. In recognition of his achievements and personal contribution to Australian business, Gary was awarded the Centenary Medal for services to business by the Prime Minister and the Governor General. He also became a finalist in the 2003 Victorian region Entrepreneur of the Year Award.
Under Gary’s leadership until he decided to pursue other interests at the end of 2008, Infosys Australia grew to over 2,500 staff servicing the Australian market with consolidated revenues reaching well over $250 million.
DWS Limited – Annual Report 2012 25
For
per
sona
l use
onl
y

Financial Statements
27 Directors’ Report
42 Auditor’s Independence Declaration
43 Consolidated Statement of Comprehensive Income
44 Consolidated Statement of Financial Position
45 Consolidated Statement of Cash Flows
46 Consolidated Statement of Changes in Equity
47 Notes to the Financial Statements
65 Directors’ Declaration
66 Independent Audit Report
68 Shareholder Information
26
For
per
sona
l use
onl
y

The Directors present their report together with the financial report of DWS Limited (the Company) and of the consolidated entity (the Group or DWS), being the Company and the entities it controlled during the year ended 30 June 2012 and the auditor’s report thereon.
DirectorsThe names of the Directors of the Company at any time during or since the end of the financial year are:
Name, Qualifications and Independence Status Experience, Special Responsibilities, and Other Directorships
Harvey Parker, BA, MBA ChairpersonIndependent Non-Executive Director
Elected 9th May 2006Re-elected 29th October 2007Re-elected 3rd November 2010
Former Chairman of Emergency Communications Victoria, Datacom Services Pty Ltd, Dun & Bradstreet, Intermoco Ltd and former Director of Volante Group Ltd. Current Chairman of Pacific Turbine Brisbane Ltd, Agline Pastoral Pty Ltd, Riding for Disabled Association Victoria and Director of Jumbuck Entertainment Ltd. Mr Parker is also Chairman of the Remuneration and Nominations Committee.
Ken Barry, LLBIndependent Non-Executive Director
Elected 9th May 2006Re-elected 4th November 2009
Mr Barry is a lawyer who was the Chairman of national law firm Deacons (now called Norton Rose Australia) from 2004-2009, is the Chairman of IOOF Holdings Trustee Pty Ltd, Doxa Youth Foundation, Next Generation Australia Pty Ltd, MAP Capital Pty Ltd and the Advisory Board of Coolmore Australia. Mr Barry is Chairman of the Audit, Risk and Compliance Committee and a member of the Remuneration and Nominations Committee.
Gary Ebeyan, B. SciIndependent Non-Executive Director
Elected 8th November 2010
Mr Ebeyan is a seasoned professional with over 25 years’ experience in the IT industry. Mr Ebeyan has built several successful businesses within the IT industry including Expert Information Services with which Mr Ebeyan was recognised by ‘The Age/D&B Awards’ for ‘Best Victorian IT Business’ in 2001 and 2002, and ‘Best Overall Victorian Business’ in 2001. In 2004, Mr Ebeyan became the CEO of Infosys Australia following the acquisition of Expert Information Services by the global offshore outsourcing Company, Infosys Technologies Limited. Under Gary’s leadership, Infosys Australia grew to over 2,500 staff servicing the Australian market with consolidated revenues reaching well over $250 million. Mr Ebeyan is a member of the Audit, Risk and Compliance Committee.
Martin Ralston B. EconomicsIndependent Non-Executive Director
Elected 5th November 2008Re-elected 8th November 2011
Mr Ralston has over 30 years’ experience in the IT sector and has held senior roles at BHP Billiton, Computer Accounting Services and Accenture (previously Andersen Consulting), where he was the Managing Partner of numerous business divisions until his retirement in 2001. Mr Ralston is currently the joint Vice-Chairman of the Moonee Valley Racing Club, a Director of the Hawthorn Football Club and Non-Executive Chairman of Transol Corporation Limited. Mr Ralston is a member of the Remuneration and Nominations Committee.
Danny Wallis, BCSChief Executive Officer (CEO) Managing Director
Elected 28th December 1998Re-elected 24th October 2006
Mr Wallis founded DWS in 1992, and has held the positions of both Managing Director and CEO at various stages since that time. Mr Wallis has over 25 years’ experience in the Information Technology industry, and has led the Company through its various growth and development initiatives, including its Improve, Extend, Grow organisational enhancement program. Immediately prior to forming DWS, Mr Wallis worked with ANZ Bank. Mr Wallis is also a member of the Audit, Risk and Compliance Committee.
Company SecretaryMr Lachlan Armstrong, B. Accounting, B. Banking & Finance, M. Applied Finance, CPA, MAICD, was appointed to the position of Company Secretary on 2 June 2010. Mr Armstrong is also the Chief Financial Officer of the DWS Group, a position he has held since 2008.
Officers who were previously partners of the audit firmThere are no officers of the Company who were previously partners/Directors of the current audit firm, Grant Thornton Audit Pty Ltd.
Directors’ ReportFor the year ended 30 June 2012
DWS Limited – Annual Report 2012 27
For
per
sona
l use
onl
y

Directors’ Report continued
For the year ended 30 June 2012
Directors’ meetingsThe number of meetings of the Company’s Directors (including meetings of formally constituted committees of Directors) and number of meetings attended by each of the Directors of the Company during the financial year are:
Director
Board of Directors Audit, Risk and
Compliance Remuneration
and Nomination
Held Attended Held Attended Held Attended
Harvey Parker 11 10 - - 1 1
Ken Barry 11 11 6 6 1 1
Danny Wallis 11 11 6 6 - -
Gary Ebeyan 11 11 6 6 - -
Martin Ralston 11 11 - - 1 1
Election of DirectorsClause 15.3 of the Company’s Constitution requires that at each Annual General Meeting one-third of the Directors must retire from office. Therefore, Mr Ken Barry retires by rotation and is eligible for re-election.
Corporate governance statementThe Company supports the Australian Securities Exchange’s (ASX) Corporate Governance Council’s Corporate Governance Principles and Recommendations (ASX Principles). The Company complies with all of the ASX Principles.
Further information on the Company’s corporate governance policies and practices can be found on the Company’s website at www.dws.com.au
Principle : Lay solid foundations for management and oversightThe Board has adopted a charter that sets out, among other things, its specific powers and responsibilities and the matters delegated to the Chief Executive Officer (CEO) and those reserved to the Board. A copy of the charter is available on the Company’s website. As part of the Board’s oversight of senior management, all Company executives are subject to annual performance reviews and planning. Each executive is assessed against a range of criteria including financial goals, completion of key performance measures and adherence to the Company’s values.
Principle : Structure the Board to add valueThe Board is structured to bring a range of skills, experience, expertise and diversity to the Company. Page 27 of this report sets out the qualifications, expertise and experience of each Director in office as at the date of this Directors’ Report. As required under the Board Charter and the ASX Principles, the Board comprises a majority of independent Non-Executive Directors. In determining whether a Director is independent or otherwise, the Board considers the matters set out in the charter. The Board carries out a number of its duties and responsibilities through the Remuneration and Nominations Committee and the Audit, Risk and Compliance Committee. Details of the Remuneration and Nominations Committee are set out on page 31 to 34 and the Audit, Risk and Compliance Committee on pages 34 to 37 of this report.
Principle 3: Promote ethical and responsible decision makingThe Company considers its reputation one of its most valuable assets, founded largely on the ethical behaviour of its people. The Board has approved a Code of Conduct that sets out principles of ethical behaviour for key management personnel. Information relating to this policy is available on the Company’s website. In addition, the Board has established a Share Trading Policy which governs dealing in the Company’s shares. Information relating to this policy is available on the Company’s website.
Principle 4: Safeguard integrity in financial reportingThe Board has established an Audit, Risk and Compliance Committee which assists the Board in the effective discharge of its responsibilities for financial reporting, internal controls, risk management, internal audit, external audit and insurance (with the exception of Directors’ and officers’ insurance). Details of the Committee are set out on the Company’s website.
The composition and structure of the Audit, Risk and Compliance Committee comply with the ASX Principles. The members of the Audit, Risk and Compliance Committee are set out on page 35 of this report and their attendance at meetings of the Committee are set out on page 28 of this report.
28
For
per
sona
l use
onl
y

Principle 5: Making timely and balanced disclosureThe Company is subject to continuous disclosure obligations under the ASX Listing Rules and Australian Corporations legislation. Subject to limited exceptions, the Company must immediately notify the market, through the ASX, of any information that a reasonable person would expect to have a material effect on the price or value of its securities. To this end, the Company has a Disclosure Policy, details of which can be found on its website.
Principle 6: Respect the rights of shareholdersRespecting the rights of shareholders is of fundamental importance to the Company and a key element of this is how the Company communicates with its shareholders. To this end, the Company recognises that shareholders must receive relevant information in a timely manner in order to be able to properly and effectively exercise their rights as shareholders. Information regarding the Company’s Communications Policy is available on its website.
Principle 7: Recognise and manage riskThe Board has required management to design and implement a risk management and internal control system to manage the Company’s material business risks and management has reported that those risks are being managed effectively. For the annual and half year results, the CEO and the CFO have provided a written declaration to the Board that the Company’s financial records have been properly maintained, and that the Company’s financial statements and notes give a true and fair view and comply with Australian Accounting Standards.
Principle 8: Remunerate fairly and responsiblyThe Remuneration Report (on pages 31 to 34 of this report) sets out details of the Company’s policy and practices for remunerating Directors, key management personnel and senior executives. The members of the Remuneration and Nominations Committee are set out on page 31 of this report, and their attendance at meetings of the Committee are set out on page 28 of this report. Information relating to the Remuneration and Nominations Committee and the Company’s policy on share trading in relation to shares or equity based products are available on the Company’s website. All information referred to in this Corporate Governance Statement as being on the Company’s website is included under the ‘Investors’ – ‘Corporate Governance’ section of the website.
Board of DirectorsRole of the BoardThe principal role of the Board is to ensure the protection and enhancement of long term shareholder value.
To fulfil this role, the Board is responsible for the overall corporate governance of the Group including formulating its strategic direction, approving and monitoring capital expenditure, setting remuneration, appointing, removing and creating succession policies for Directors and senior executives, establishing and monitoring the achievement of management’s goals and ensuring the integrity of risk management, internal control, legal compliance and management information systems.
It is also responsible for approving and monitoring financial and other reporting. Details of the Board’s charter is located on the Company’s website at www.dws.com.au
The Board has delegated responsibility for the operation and administration of the Company to the CEO and Executive Management. responsibilities are delineated by formal authority delegations. This delegated authority is reviewed regularly and updated to reflect changes to the business operations and the operating environment.
Board processesTo assist in the execution of its responsibilities, the Board has established two Committees. These are the Remuneration and Nominations Committee and the Audit, Risk and Compliance Committee. Both of these Committees have written charters.
The full Board currently holds approximately 11 meetings each year with an agenda for meetings prepared in conjunction with the Chairperson, CEO and Company Secretary. Standing items include the CEO report, Chief Financial Officer (CFO) report, human resources (HR) report, governance and compliance. Board papers are circulated in advance. Executives are regularly involved in Board discussions and Directors have other opportunities to have contact with a wider group of employees to discuss matters as required.
The Board has not conducted a formal review of the business risk systems, but has concentrated on the surrounding controls within the system to ensure that there are adequate safeguards within processes to mitigate the risks to the business. This includes a strengthening of delegations of authority at all levels in the business as well as ensuring that the work taken on by the Company meets certain internal criteria. The risks associated with the business of DWS are concentrated in these two areas. Further, the Company’s auditors regularly review various aspects of the company’s financial and other controls as part of their fieldwork and provide recommendations to the Board thereon.
DWS Limited – Annual Report 2012 29
For
per
sona
l use
onl
y
Director and executive educationThe Company has a formal process to educate new Directors about the nature of the business. Directors also have the opportunity to visit consolidated entity offices and meet with management to gain a better understanding of business operations. Directors are given access to continuing education opportunities to update and enhance their skills and knowledge. Directors are also encouraged to participate in regular management strategy and planning sessions to enable them to gain a better understanding of the operations of the business.
The Company also has a formal process to educate new senior executives upon taking such positions. The induction program includes reviewing the Group’s structure, strategy, operations, financial position and risk management policies. It also familiarises the individual with the rights, duties, responsibilities and roles of the individual and the Board.
Independent professional advice and access to Company informationEach Director has the right, subject to prior consultation with the Chairperson, to seek independent professional advice from a suitably qualified adviser at the Company’s expense concerning any aspect of the Company’s operations or undertaking in order to fulfil their duties.
A copy of all such advice is made available to all the Board members.
Composition of the BoardThe names of the Directors of the Company in office at the date of this statement are set out on page 27 of the Directors’ Report.
The composition of the Board is determined using the following principles:
• a minimum of three Directors, with a broad range of expertise;
• a majority of Non-Executive Directors;
• a Non-Executive Independent Director is appointed as Chairperson;
• a majority of Directors having extensive knowledge of the Company’s industry, and those who do not, have extensive expertise in significant aspects of auditing and financial reporting, or legal and risk management of companies;
• enough Directors to serve on various committees without overburdening the Directors or making it difficult for them to fully discharge their responsibilities;
• one third of all Directors, except the Managing Director, will retire by rotation each year but may offer themselves for re-election for a further three year period; and
• no Director may hold office for a period in excess of three years without offering themselves for re-election.
An independent Director is a Director who is not a member of management (a Non-Executive Director) and who:
• holds less than five per cent of the voting shares of the Company and is not an officer of, or otherwise associated, directly or indirectly, with a shareholder of more than five per cent of the voting shares of the Company;
• has not within the last three years been employed in an executive capacity by the Company or another group member, or been a Director after ceasing to hold any such employment;
• within the last three years has not been a principal or employee of a material* professional adviser or a material* consultant to the Company or another group member;
• is not a material* supplier or customer of the Company or another group member, or an officer of or otherwise associated, directly or indirectly, with a material* supplier or customer;
• has no material* contractual relationship with the Company or another group member other than as a Director of the Company; and
• is free from any interest and any business or other relationship which could, or could reasonably be perceived to, materially* interfere with the Director’s ability to act in the best interests of the Company.
* The Board considers ‘material’ in this context to mean where any Director-related business relationship has represented, or is likely in the future to represent, the lesser of at least 10 per cent of the relevant segments or the Director-related businesses revenue. The Board considers the nature of the relevant industries’ competition, and the size and nature of each Director-related business relationship, in arriving at this threshold.
Directors’ Report continued
For the year ended 30 June 2012
30
For
per
sona
l use
onl
y

Remuneration and Nominations CommitteeThe Remuneration and Nominations Committee (Committee) comprises one Committee but deals with both Board Remuneration and Nomination policies and processes. There are separate charters for the Committees as detailed below. The Committee met once during the financial year. The Board policy is that the Committee will comprise a majority of independent Non-Executive Directors.
The members of the Committee are:
Harvey Parker (Chairperson) Independent Non-ExecutiveKen Barry Independent Non-Executive Martin Ralston Independent Non-Executive
Nominations CommitteeThe Nominations Committee oversees the appointment and induction process for Directors and Committee members, and the selection, appointment and succession planning process of the Company’s CEO. The Committee makes recommendations to the Board on the appropriate skill mix, personal qualities, expertise and diversity of each position. When a vacancy exists or there is a need for particular skills, the Committee in consultation with the Board determines the selection criteria based on the skills deemed necessary. The Board will then appoint the most suitable candidate. A Board appointment must stand for election at the next general meeting of shareholders.
The terms and conditions of the appointment and retirement of Non-Executive Directors are set out in a letter of appointment, including expectations for attendance and preparation for all Board meetings, minimum hourly commitment, appointments to other Boards, the procedures for dealing with conflicts of interest, and the availability of independent professional advice. The Nominations Committee’s charter is available on the Company’s website.
Remuneration CommitteeThe Remuneration Committee reviews and makes recommendations to the Board on remuneration packages and policies applicable to the CEO and senior executives. It is also responsible for share and option schemes, incentive performance packages, retirement and termination entitlements, fringe benefits policies and professional indemnity and liability insurance policies.
The Remuneration Committee meets once per year and such other times as required. The Committee met once during the year and the Committee members’ attendance recorded is disclosed in the table of Directors’ meetings on page 28. The Remuneration Committee’s charter is available on the Company’s website.
Remuneration report (audited)This remuneration report outlines the Director and Executive remuneration arrangements of the Company and the Group in accordance with the requirements of the Corporations Act 2001 and its Regulations. For the purposes of this report, key management personnel (KMP) of the Group are defined as those persons having authority and responsibility for planning, directing and controlling the major activities of the Company, directly or indirectly, including any Director (whether executive or otherwise) of the parent company.
Remuneration policies The remuneration structures explained below are designed to attract suitably qualified candidates, reward the achievement of strategic objectives, and achieve the broader outcome of creation of value for the Company. The remuneration structures take into account:
• the capability and experience of the Directors and senior executives;
• the Directors’ and senior executives’ ability to control the relevant performance of the Company; and
• the Company’s performance.
Remuneration packages include a fixed and variable component for executives and Executive Directors.
Fixed remuneration
Fixed remuneration consists of base remuneration (which is calculated on a total cost basis and includes any Fringe Benefits Tax charges related to employee benefits including motor vehicles), as well as employer contributions to superannuation funds.
Compensation levels are reviewed annually by the Remuneration Committee through a process that considers individual, segment and Group performance. They have been competitively set to be in line with listed entities of a similar size and operating within similar industries. A senior executive’s compensation is also reviewed on promotion and on the acceptance of other roles within the Group.
DWS Limited – Annual Report 2012 31
For
per
sona
l use
onl
y

Remuneration and Nominations Committee continued
Remuneration policies continuedPerformance-linked remuneration
Performance-linked remuneration includes both short term and long term incentives, and is designed to reward management personnel for meeting or exceeding their financial and personal performance objectives.
The short term incentive (STI) is an ‘at risk’ bonus provided in the form of a cash benefit payable upon key performance indicators being met by relevant management personnel. These KPIs are set annually in consultation with relevant management staff and are typically based on a combination of qualitative and quantitative measures.
The long term incentive (LTI) is an ‘at risk’ deferred bonus provided in the form of a cash benefit payable upon the successful completion of relevant tenure based conditions.
Short term incentive bonus
Each year the Remuneration and Nominations Committee sets the key performance indicators (KPIs) for the senior executives. The KPIs generally include measures relating to the Group, the relevant region, and the individual. They include financial, people, customer, strategy and risk measures. The measurements are chosen as they directly align the individual’s reward to the KPIs of the Group and to its strategy and performance. The non-financial objectives vary with position and responsibility and include measures such as achieving strategic outcomes and staff development. Consideration is also given as to the executive’s ability to influence certain factors which may have affected performance during the period.
The financial performance objectives are based on the outperformance earnings before interest, tax, depreciation and amortisation (EBITDA), compared to budgeted amounts and/or prior year comparatives.
At the end of the financial year the Remuneration and Nominations Committee assesses the actual performance of the Group and the individual in meeting the Group’s quantitative and qualitative performance objectives. A percentage of a pre-determined maximum bonus amount is then awarded depending on results, between 20 per cent for minimum performance and 100 per cent for stretch performance. No bonus is awarded if the minimum is not achieved. The performance evaluation in respect of the year ended 30 June 2012 has taken place in accordance with this process.
The Remuneration and Nominations Committee recommends the quantum of the short term cash incentive bonus to be paid to the individuals for approval by the Board. These assessment methods have been chosen as they provide the Committee with an objective assessment of each individual’s performance.
Long term incentive deferred bonus
In 2012, the Company introduced a long term incentive (LTI) structure for senior executives. The Remuneration and Nominations Committee has assessed KPIs for the senior executives relevant to the qualitative and quantitative performance of the Company over the previous 18 months and likely resultant outcomes over the next 18 months. These KPIs relate to the Group’s financial performance, people programs, customer focus, implementation of the Company’s strategic plan and various risk mitigation and environmental control initiatives.
The non-financial objectives vary with position and responsibility. Consideration is also given as to the executive’s ability to influence certain factors which may have affected performance of the Group during the period.
At the end of the financial year the Remuneration and Nominations Committee assesses the actual performance of the Group and the individual in meeting the Group’s quantitative and qualitative performance objectives. A bonus amount is then awarded with a deferred payment date of 15 months from the end of the financial year. Should the executive leave the employment of the Company prior to the vesting conditions being met, then the executive forfeits any entitlement to any outstanding LTI amounts.
The Remuneration and Nominations Committee recommends the quantum of the long term deferred cash incentive bonus to be paid to the individuals for approval by the Board. These assessment methods have been chosen as they provide the Committee with an objective assessment of each individual’s performance.
Other benefits
There are no other benefits received by the Directors or executives of the Company that relate to performance.
Directors’ Report continued
For the year ended 30 June 2012
32
For
per
sona
l use
onl
y

Service agreements and contract details
It is the consolidated entity’s policy that contracts of employment for Executive Directors and senior executives be for a term of three years but capable of termination within a notice period.
• Mr Danny Wallis’ contract allows for 12 months notice of termination.
• Mr Lachlan Armstrong’s contract allows for six months notice of termination.
• Mr Dougall McBurnie’s contract allows for four months notice of termination.
Non-Executive Directors
Base remuneration for all the Non-Executive Directors was determined at a general meeting of the Company shareholders on 11 May 2006 and is not to exceed $350,000 per annum. Directors’ base fees are set out in the table under Directors and executive officers’ remuneration.
On appointment each of the Non-Executive Directors were granted options over shares in the Company, some of which have been exercised and balance of which have expired. There are no other performance incentives for Non-Executive Directors.
Elements of remuneration
Details of the nature and amount of each major element of remuneration of each Director of the Company and each of the named KMP of the consolidated entity are detailed in the table of Directors and executive officers’ remuneration.
Analysis of STI included in remuneration
Details of the percentage of the available bonus that was expensed in the 2012 financial year to the named KMP and the percentage that was forfeited because the person did not meet the performance criteria is set out below. Non-Executive Directors do not participate in the short term bonus scheme.
Short Term Incentive
Included in Remuneration
$
Vested in Year
%
Forfeited in Year
%
Danny Wallis (CEO)# - - 100
Lachlan Armstrong (CFO)^ 75,000 100 -
Dougall McBurnie (Director Strategic Ops)^ 60,000 100 -
# Danny Wallis elected to forfeit bonus entitlements payable to him for the year.^ The STI bonus payments to Mr Lachlan Armstrong and Mr Dougall McBurnie were in respect of performance for the year ended 30 June 2012. They were
granted on 09 August 2012 and are payable on 4 October 2012.
Consequences of performance on shareholders’ wealth
In considering the Group’s performance and benefit for shareholders’ wealth, the Remuneration and Nominations Committee has regard to the following measures in respect of the current financial year and the previous four financial years:
Measure2012
$’0002011
$’0002010
$’0002009
$’0002008
$’000
EBITDA 26,399 24,810 26,845 23,554 26,122
Net profit after tax 18,221 17,389 18,516 16,023 17,961
Cents Cents Cents Cents Cents
Dividend 12.5 12.0 11.25 9.5 11.0
Change in share price 15.0 (12.0) 61.0 (0.20) (147.0)
Share price close 147.0 132.0 144.0 84.0 103.0
EBITDA (along with a variety of qualitative measures) is considered in setting the STI. The Remuneration and Nominations Committee considers that the above performance-linked remuneration structure is generating the desired outcomes.
DWS Limited – Annual Report 2012 33
For
per
sona
l use
onl
y

Remuneration and Nominations Committee continued
Remuneration policies continuedConsequences of performance on shareholders’ wealth continued
Primary
Total $
Proportion of Remuneration Performance
Related %Year
Base Remuneration
$
STI Cash Bonus
$
LTI Deferred Cash Bonus
$
Non-Cash Benefits
$*
Superannuation/ Pension Benefits
$
DirectorNon-Executive Harvey Parker 2012 110,094 - - - 9,908 120,002 -
2011 112,212 - - - 10,099 122,311 -
Ken Barry 2012 64,220 - - - 5,780 70,000 -
2011 65,466 - - - 5,892 71,358 -
Martin Ralston 2012 22,682 - - - 47,318 70,000 -
2011 17,447 - - - 53,898 71,345 -
Gary Ebeyan1,2 2012 64,220 - - - 5,780 70,000 -
2011 41,990 - - - 3,779 45,769 -
Trevor O’Hoy5 2012 - - - - - - -
2011 15,879 - - - 1,429 17,308 -
ExecutiveDanny Wallis CEO 2012 258,028 - - 286,741 23,222 567,991 -
2011 262,990 - - 174,808 23,669 461,467 -
Total all specified Directors 2012 519,244 - - 286,741 92,008 897,993 -
2011 515,984 - - 174,808 98,766 789,558 -
Other specified officers Lachlan Armstrong (CFO/Company Secretary) 2012 333,071 75,000 50,000 - 15,774 473,845 26
2011 301,836 75,000 - - 21,626 398,462 19
Dougall McBurnie (Director Strategic Operations)3,4 2012 337,657 60,000 40,000 - 15,775 453,432 22
2011 141,646 31,250 - - 6,430 179,326 17
Total all specified individuals 2012 1,189,972 135,000 90,000 286,741 123,557 1,825,270 -
2011 959,466 106,250 - 174,808 126,822 1,367,346 - 1. Mr Ebeyan was appointed effective 8 November 2010. 2. Mr Ebeyan received an additional $96,433 for the provision of consultancy services to the DWS Group during the period. 3. Mr McBurnie was appointed effective 1 February 2011. 4. Mr McBurnie’s wife, Trish McBurnie provides Event Management services to DWS. In 2012, total fees paid to Mrs McBurnie were $60,057.5. Mr O’Hoy resigned 1 September 2010. * Executive Directors may elect to have a combination of benefits provided out of their fixed annual remuneration. The value of any non-cash benefits
provided includes the cost of any fringe benefits tax payable by the Group as a result of providing the benefit.
Audit, Risk and Compliance Committee The Audit, Risk and Compliance Committee (Committee) has a documented charter, approved by the Board. The Committee comprises a majority of independent Non-Executive Directors. The Chairperson may not be the Chairperson of the Board. The Committee advises on the establishment and maintenance of a framework of internal controls and appropriate ethical standards for the management of the consolidated entity.
Directors’ Report continued
For the year ended 30 June 2012
34
For
per
sona
l use
onl
y

The members of the Committee during the period were:
Ken Barry Chair and Independent Non-Executive Director Gary Ebeyan Independent Non-Executive DirectorDanny Wallis Executive Director
The external auditors and CFO are invited to the Committee meetings at the discretion of the Committee. The Committee met six times during the year. The CEO and the CFO declared in writing to the Board that the financial records of the Group for the financial year have been properly maintained, the Group’s financial reports for the year ended 30 June 2012 comply with the accounting standards and present a true and fair view of the Group’s financial condition and operational results. This statement is updated annually.
The Audit, Risk and Compliance Committee’s charter is available on the Group’s website along with information on procedures for the selection and appointment of the external auditor, and for the rotation of the external audit engagement partner.
The responsibilities of the Audit, Risk and Compliance Committee include reporting to the Board on:• reviewing the annual, half-year and other financial information distributed externally. This includes approving new accounting policies
to ensure compliance with Australian Accounting Standards and generally accepted accounting principles, and assessing whether the financial information is adequate for shareholder needs;
• assessing corporate risk assessment processes;
• assessing whether non-audit services provided by the external auditor are consistent with maintaining the external auditor’s independence. The external auditor provides an annual declaration of independence which is in accordance with Corporations Act 2001;
• reviewing the nomination and performance of the external auditor. The external auditors were appointed in 2006;
• assessing the adequacy of the internal control framework and the Group’s code of ethical standards;
• monitoring the procedures to ensure compliance with the Corporations Act 2001 and the ASX Listing Rules and all other regulatory requirements; and
• addressing any matters outstanding with auditors, Australian Taxation Office, Australian Securities and Investments Commission and ASX.
The Committee review the performance of the external auditors on an annual basis to:
• discuss the external audit, identifying any significant changes in structure, operations, internal controls or accounting policies likely to impact the financial statements and to review the fees proposed for the audit work to be performed;
• review the half-year and preliminary final report prior to lodgement with the ASX, and any significant adjustments required as a result of the auditor’s findings, and to recommend Board approval of these documents, prior to announcement of results;
• review the draft financial report and recommend Board approval of the financial report;
• review the results and findings of the auditor, the adequacy of accounting and financial controls, and to monitor the implementation of any recommendations made; and
• as required, to organise, review and report on any special reviews or investigations deemed necessary by the Board.
Risk managementThe Board oversees the establishment, implementation, and review of the Group’s risk management system. Management have established a risk management system for assessing, monitoring and managing operational, financial reporting, and compliance risks for the consolidated entity. Material risks are directed to the Audit, Risk and Compliance Committee as appropriate. The CEO and CFO have reported to the Board that that the financial risk management and associated compliance and controls have been assessed and found to be operating effectively. The operational and other risk management compliance and controls have also been assessed and found to be operating effectively.
Risk management and compliance and control
The consolidated entity strives to ensure that its services are of the highest standard. The entity has accreditation AS/NZS ISO 9001:2000 Quality Management Systems with the Spinnaker One methodology.
The Group has been a disclosing entity since listing on the ASX on 15 June 2006. A review of the internal controls and compliance has been undertaken. The Board being responsible for the overall internal control framework is committed to this review but recognises that no cost-effective internal control system will preclude all errors and irregularities.
DWS Limited – Annual Report 2012 35
For
per
sona
l use
onl
y

Audit, Risk and Compliance Committee continued
Risk management continuedQuality and integrity of personnel
Formal appraisals are conducted annually of all employees as well as a comprehensive induction process for all new employees. Training and development at a group and individual level are offered. This together with appropriate remuneration and incentives creates an environment of co-operation and constructive dialogue with employees and senior management. A formal succession plan is being put in place to ensure competent and knowledgeable employees fill senior positions when retirements or resignations occur.
Financial reporting
The CEO and the CFO have declared in writing to the Board that the Group’s financial reports are founded on a sound system of risk management and internal compliance and control which implements the policies adopted by the Board. Monthly actual results are reported against budgets approved by the Directors and revised forecasts for the year are prepared periodically.
Ethical standardsAll Directors, managers and employees are expected to act with the utmost integrity and objectivity, striving at all times to enhance the reputation and performance of the consolidated entity. There is a dedicated Human Resources section where staff may refer any issues arising from their employment.
Conflict of interest
Directors must keep the Board advised, on an ongoing basis, of any interest that could potentially conflict with those of the Group. The Board has and will continue to develop procedures to assist Directors to disclose potential conflicts of interest.
Where the Board believes that a significant conflict exists for a Director on a Board matter, the Director concerned does not receive the relevant Board papers and is not present at the meeting whilst the item is considered. Details of Director related entity transactions with the Group and consolidated entity are set out in Note 23 of the financial statements.
Code of conduct
The consolidated entity has advised each Director, manager and employee that they must comply with the Code of Conduct (Code). The Code together with a Deed of Confidentiality forms part of the employment contract with all employees and covers the following:
• aligning the behaviour of the Board and management with the Code of Conduct by maintaining appropriate core Group values and objectives;
• fulfilling responsibilities to shareholders by delivering shareholder value;
• fulfilling responsibilities to clients by maintaining high standards of product quality, service standards and commitments to fair value;
• employment practices such as occupational health and safety, employment opportunity, the level and structure of remuneration, and conflict resolution;
• responsibilities to the individual, such as privacy, use of privileged or confidential information, and conflict resolution;
• compliance with legislation including policies on legal compliance in countries where the legal systems and protocols are significantly lower than Australia’s;
• conflicts of interest;
• corporate opportunities such as preventing Directors and key executives from taking advantage of property, information or position for personal gain;
• confidentiality of corporate information;
• fair dealing;
• protection and proper use of the Group’s assets; and
• reporting of unethical behaviour.
More information on the Company’s Code of Conduct can be found on the Company’s website at www.dws.com.au
Directors’ Report continued
For the year ended 30 June 2012
36
For
per
sona
l use
onl
y

Trading in general company securities by Directors and employees
The key elements of the Trading in Company Shares Policy by Directors and senior executives are:
• identification of those restricted from trading, who may acquire shares in the Company, but are prohibited from dealing in company shares or exercising options:
(i) except between thirty days after either the release of the Group’s half-year and annual results to the ASX, the Annual General Meeting or any major announcement; and
(ii) whilst in possession of price sensitive information not yet released to the market;
• raising the awareness of legal prohibitions including transactions with colleagues and external advisers;
• requiring details to be provided of intended trading in the Company’s shares; and
• requiring details to be provided of the subsequent confirmation of the trade.
The policy also details the insider trading provisions of the Corporations Act 2001 and is reproduced in full on the Company’s website.
Diversity
The DWS Board adopted a policy on diversity in October 2011. DWS is committed to:
• attracting, developing and retaining our employees to ensure business growth and performance;
• ensuring that every employee is treated fairly and with respect;
• valuing differences and the contribution of all employees to business success;
• creating an environment where people can excel without encountering bias or being hampered by race, age, gender, lifestyle choices, religion, culture or disability; and
• ensuring all employees and applicants are treated and evaluated according to their job-related skills, qualifications, abilities and aptitudes only.
The Executive Team, under the direction of the MD/CEO, drives diversity and inclusivity within our business. We are proud of our culturally and ethnically diverse workforce. We will continue to focus on all aspects of diversity, with our initial focus to improve our gender diversity.
The DWS Diversity Statement can be found on our website at www.dws.com.au
Communication with shareholdersThe Board provides shareholders with information using a comprehensive Continuous Disclosure Policy which includes identifying matters that may have a material effect on the price of the Company’s securities, notifying them to the ASX, posting them on the Company’s website, and issuing media releases. More details of the policy are available on the Company’s website.
In summary, the continuous disclosure policy operates as follows:• the CEO, the CFO and Company Secretary are responsible for interpreting the Company’s policy and where necessary informing the
Board. The Company Secretary is responsible for all communications with the ASX. Matters required to be disclosed to the ASX are disclosed on the day they are discovered;
• the full annual financial report is made available to all shareholders via the Company’s website. Where a shareholder has specifically requested one, a physical hardcopy of this report is mailed to them also;
• the half-yearly report will contain summarised financial information and a review of the operations of the consolidated entity during the period. The half-year reviewed financial report will be lodged with the Australian Securities and Investments Commission and the ASX, and sent to any shareholder who requests it;
• proposed major changes in the consolidated entity which may impact on share ownership rights are submitted to a vote of shareholders;
• all announcements made to the market, and related information (including information provided to analysts or the media during briefings), are placed on the Company’s website after they are released to the ASX;
• the full texts of notices of meetings and associated explanatory material are placed on the Company’s website; and
• the external auditor attends the Annual General Meetings to answer any questions concerning the conduct of the audit, the preparation of the auditor’s report, accounting policies adopted by the Company and the independence of the auditor in relation to the conduct of the audit.
DWS Limited – Annual Report 2012 37
For
per
sona
l use
onl
y

Communication with shareholders continued
All relevent information is made available to shareholders on the consolidated entity’s website within one day of public release. Shareholder requests for financial report information are handled by the Company share registry, Computershare Investor Services Limited (Computershare).
The Board encourages full participation of shareholders at the Annual General Meeting, to ensure a high level of accountability and identification with the consolidated entity’s strategy and goals. Important issues are presented to the shareholders as single resolutions.
The shareholders are requested to vote on the appointment and aggregate remuneration of Directors, the granting of options and shares to Directors and changes to the Constitution. A copy of the Constitution is available to any shareholder who requests it.
Principal activities and operations reviewActivitiesDWS Ltd (DWS) provides information technology services to a number of S&P/ASX 50 corporations and government bodies. Established in 1992 with three employees, DWS has grown to in excess of 620 staff with operations in Melbourne, Sydney, Brisbane, Adelaide, Geelong, Canberra and Perth and is listed on the Australian Securities Exchange (ASX).
DWS designs, develops, manages and maintains software solutions and information technology environments for large corporate entities and government agencies. DWS’ quality certified methodology focuses on the quality and timeliness of delivery, and it also has a deep client focus assisting the establishment of long term client partnerships.
DWS has a sound market reputation in the provision of high end technical services and solutions including:
• custom software development for micro to mid range platforms;
• maintenance and customisation of large, enterprise resource and core business applications;
• designing, developing, implementing and maintaining data warehousing, reporting and business intelligence systems; and
• integration, enterprise architecture and a multitude of business to business solutions.
DWS’ business model has allowed the Group to consistently grow. This growth has been aided substantially by the execution of well structured and disciplined corporate objectives to facilitate controlled and sustainable growth.
Directors’ Report continued
For the year ended 30 June 2012
38
For
per
sona
l use
onl
y

Operations reviewA summary of the 2012 financial year results is presented below.
H1 2012 $’000
H2 2012 $’000
Total 2012 $’000
2011 $’000
Increase/ (decrease)
$’000
Percentage Change
%
Revenue from continuing operations 55,306 54,358 109,664 98,386 11,279 11
Other revenue (excl interest) 199 26 225 103 122 119
Employee benefits expense (39,224) (39,802) (79,026) (69,055) 9,971 14
Selling, general and admin expense (2,260) (2,205) (4,465) (4,624) (159) -3
EBITDA 14,021 12,378 26,399 24,810 1,589 6
EBITDA margin % 25% 23% 24% 25%
Depreciation and amortisation (612) (174) (786) (287) 499 174
Interest 321 321 642 572 70 12
Profit before tax 13,730 12,525 26,255 25,095 1,160 5
Income tax expense (4,210) (3,824) (8,033) (7,706) 327 4
Net profit after tax 9,520 8,701 18,221 17,389 832 5
Revenue from operations increased by $11.28 million (or 11 per cent) over the previous financial year, billable staff grew by 28 to be 568 at 30 June 2012, and the Group achieved growth in the majority of its geographic regions and expanded its blue-chip client base. The Group also delivered earnings growth of 5 per cent over the previous financial year to $18.22 million.
Profitability was affected by soft trading conditions in Victoria and NSW during the second half of the financial year, however operations in Brisbane, SA, and the Group’s specialist practices remained strong throughout the year.
DWS also opened a new office in Perth in Western Australia during the year, which will focus on providing services to clients in the Western Australian Government initially, and corporate clients as the pipeline develops.
The Group’s balance sheet remains strong with over $15 million in cash, and zero debt. This, along with the positive outlook for 2012, saw the Board declare a final fully franked dividend of 6.25 cents per ordinary share which takes total return to shareholders for the year to 12.5 cents (fully franked).
DWS is continuing the execution of a strategic transformation initiative which is designed to underpin the future growth of the organisation. This is a multi-faceted project (named ‘Improve, Extend, Grow’) and is designed to improve our employee value proposition and drive further efficiencies into DWS’ operations, extend DWS product and solution offerings, and assist the growth and development of our regional operations.
The Directors believe the Group is in a strong and stable financial position to expand and grow its current operations. There have been no significant changes in the state of affairs of the consolidated group or parent entity during the financial year.
Environmental regulationThe consolidated group is not subject to any significant environmental regulation under the law of the Commonwealth or a State or Territory of Australia.
Dividends 2012 Cents Per
ShareTotal Amount
$’000Franked/
UnfrankedPayment
Date
Dividends paid during the year
Final 2011 ordinary 6.00 7,942 Franked at 30% 4-Oct-11
Interim 2012 ordinary 6.25 8,273 Franked at 30% 4-Apr-12
DWS Limited – Annual Report 2012 39
For
per
sona
l use
onl
y

Dividends continued
Declared final dividend2012
$’0002011
$’000
Declared final fully franked ordinary dividend of 6.25 cents (2011 6.0 cents) per share at the tax rate of 30% 8,273 7,942
All franked dividends paid and declared by the Company since the end of the previous financial year were fully franked at 30 per cent.
Directors’ interestsThe relevant interests of each Director in the shares, rights or options over such instruments issued by the companies within the consolidated entity, as notified by the Directors to the Australian Stock Exchange in accordance with S205G(1) of the Corporations Act 2001, at the date of this report are as follows:
Ordinary Shares Number
Options Over Ordinary Shares
Harvey Parker1 108,333 -
Ken Barry1 103,333 -
Danny Wallis2 56,305,283 -
Martin Ralston1 18,000 -
Gary Ebeyan1 16,130 -
1. Interest held in related entities.2. Interests held directly and in related entities.
Indemnification and insurance of officers and auditors During the financial year, DWS paid a premium to insure officers of the Company and related bodies. The officers of the Company covered by the insurance policy included the Directors and Company Secretary.
The Directors have not included the details of the nature of the liabilities covered or the amount of the premium paid in respect of the Directors’ and officers’ liability and legal expenses’ insurance contracts, as such is prohibited under the terms of the contracts.
The liabilities insured include costs and expenses that may be incurred in defending civil or criminal proceedings that may be brought against the officers in their capacity as officers of the Company or a related body corporate.
No insurance premiums are paid by the Group in regard to insurance cover provided to the Auditor of the Group.
Proceedings on behalf of the CompanyNo person has applied for leave of a Court to bring proceedings on behalf of the Company or intervene in any proceedings to which the Company is a party for the purpose of taking responsibility on behalf of the Company for all or any part of those proceedings. The Company was not a party to any such proceedings during the year.
Non audit servicesDuring the year Grant Thornton Audit Pty Ltd, the Company’s auditor and its related entities, have not performed any other services in addition to their statutory audit duties.
Events subsequent to reporting dateNo other matter or circumstance has arisen since 30 June 2012 that has significantly affected, or may significantly affect:
(a) the consolidated entity’s operations in future financial years;
(b) the results of those operations in future financial years; and
(c) the consolidated entity’s state of affairs in future financial years.
Directors’ Report continued
For the year ended 30 June 2012
40
For
per
sona
l use
onl
y

Lead auditor’s independence declaration under Section 307C of the Corporations Act 00The lead auditor’s independence declaration is set out on page 42 and forms part of the Directors’ Report for the year ended 30 June 2012.
Rounding offThe Company is of a kind referred to in Class Order, 98/100 dated 10 July 1998 issued by the Australian Securities and Investments Commission, relating to the ‘rounding off’ of amounts in the Directors’ Report and financial report. Amounts have been rounded off in the Directors’ Report and financial report in accordance with that Class Order to the nearest thousand dollars.
This report is made in accordance with a resolution of the Directors.
Harvey ParkerDirector
Danny WallisDirector
Signed at Melbourne this day 21 September 2012
DWS Limited – Annual Report 2012 41
For
per
sona
l use
onl
y

Auditor’s Independence Declaration
Grant Thornton Audit Pty LtdACN 130 913 594
Level 2215 Spring StreetMelbourne Victoria 3000GPO Box 4984Melbourne Victoria 3001
T +61 3 8663 6000F +61 3 8663 6333E [email protected] www.grantthornton.com.au
Auditor’s Independence Declaration To the Directors of DWS LimitedIn accordance with the requirements of section 307C of the Corporations Act 2001, as lead auditor for the audit of DWS Limited for the year ended 30 June 2012, I declare that, to the best of my knowledge and belief, there have been:
(a) no contraventions of the auditor independence requirements of the Corporations Act 2001 in relation to the audit; and
(b) no contraventions of any applicable code of professional conduct in relation to the audit.
Grant Thornton Audit Pty LtdChartered Accountants
Brad TaylorPartner – Audit & Assurance
Melbourne, 21 September 2012
Grant Thornton Australia Limited is a member firm within Grant Thornton International Ltd. Grant Thornton International Ltd and the member firms are not a worldwide partnership. Grant Thornton Australia Limited, together with its subsidiaries and related entities, delivers its services independently in Australia.
Liability limited by a scheme approved under Professional Standards Legislation.
42
For
per
sona
l use
onl
y

Consolidated Statement of Comprehensive Income For the Year Ended 30 June 2012
Consolidated
Notes2012
$’0002011
$’000
Revenue from continuing operations 5 109,664 98,386
Other revenue 5 867 675
Employee benefit expense 6 (79,026) (69,055)
Occupancy expense 6 (1,008) (1,191)
Depreciation and amortisation expense 6 (786) (287)
Other expenses (3,457) (3,433)
Profit before tax 26,254 25,095
Income tax expense 7 (8,033) (7,706)
Profit for the year 18,221 17,389
Total comprehensive income for the year 18,221 17,389
Notes Cents Cents
Basic earnings per share 8 14 13
Diluted earnings per share 8 14 13
The above statement should be read in conjunction with the accompanying notes
DWS Limited – Annual Report 2012 43
For
per
sona
l use
onl
y

Consolidated Statement of Financial Position As at 30 June 2012
Consolidated
Notes2012
$’0002011
$’000
Current assets
Cash and cash equivalents 10 15,206 10,977
Trade and other receivables 11 23,568 23,945
Other 12 3,559 2,608
Total current assets 42,333 37,530
Non-current assets
Property, plant and equipment 13 1,564 1,361
Intangible assets 14 27,105 26,610
Deferred tax assets 7 2,205 1,749
Total non-current assets 30,874 29,720
Total assets 73,207 67,250
Current liabilities
Trade and other payables 16 6,039 2,912
Current tax liabilities 1,526 2,156
Provisions 15 5,258 4,156
Other 16 611 220
Total current liabilities 13,434 9,444
Non-current liabilities
Provisions 15 380 420
Total non-current liabilities 380 420
Total liabilities 13,814 9,864
Net assets 59,393 57,386
Equity
Issued capital 17 34,757 34,757
Retained earnings 24,636 22,629
Total equity 59,393 57,386
The above statement should be read in conjunction with the accompanying notes
44
For
per
sona
l use
onl
y

Consolidated Statement of Cash Flows For the Year Ended 30 June 2012
Consolidated
Notes2012
$’0002011
$’000
Cash flows from operating activities
Cash receipts from customers 120,575 104,591
Cash payments to suppliers and employees (90,182) (82,938)
Income taxes paid (9,120) (8,155)
Interest received 642 572
Net cash provided used in operating activities 22 21,915 14,070
Cash flows from investing activities
Payments for plant and equipment (1,120) (235)
Payments for intangibles (352) (300)
Net cash used in investing activities (1,472) (535)
Cash flows from financing activities
Dividends paid (16,214) (16,214)
Net cash provided by financing activities (16,214) (16,214)
Net (decrease)/increase in cash and cash equivalents held 4,229 (2,679)
Cash at the beginning of the financial year 10,977 13,656
Cash at the end of the financial year 10 15,206 10,977
The above statement should be read in conjunction with the accompanying notes
DWS Limited – Annual Report 2012 45
For
per
sona
l use
onl
y

Consolidated Statement of Changes in Equity For the Year Ended 30 June 2012
Share Capital $’000
Retained Earnings $’000
Total Equity $’000
Balance at 1 July 2011 34,757 22,629 57,386
Total comprehensive income
Profit - 18,221 18,221
Other comprehensive income - - -
Total transactions with owners
Dividends paid - (16,214) (16,214)
Total at 30 June 2012 34,757 24,636 59,393
Balance at 1 July 2010 34,757 21,454 56,211
Total comprehensive income
Profit - 17,389 17,389
Other comprehensive income - - -
Total transactions with owners
Dividends paid - (16,214) (16,214)
Total at 30 June 2011 34,757 22,629 57,386
Number of shares on issue 2012 2011
Fully paid ordinary shares with no par value 132,362,763 132,362,763
The above statement should be read in conjunction with the accompanying notes
46
For
per
sona
l use
onl
y

Notes to the Financial Statements
Note . Reporting entityDWS Ltd and controlled entities (DWS, the consolidated entity or the Group) is a group of companies domiciled in Australia. The address of the consolidated entity’s registered office is Level 4, 500 Collins Street, Melbourne, Victoria, Australia. The Group is primarily involved in the provision of information technology consultancy services.
Note . Basis of preparation(a) Statement of complianceThe financial report is a general purpose report which has been prepared in accordance with Australian Accounting Standards (AASBs) (including Australian interpretations) issued by the Australian Accounting Standards Board (AASB) and the Corporations Act 2001. The consolidated financial report of the Group complies with International Financial Reporting Standards (IFRSs) issued by the International Accounting Standards Board (IASB). The consolidated entity is a for-profit entity for the purpose of preparing the financial statements.
The financial statements were approved by the Board of Directors on 21 September 2012.
(b) Basis of measurementThe financial report has been prepared on an accruals basis and is based on historical costs modified by the revaluation of selected non-current assets, and financial assets and financial liabilities for which the fair value basis of accounting has been applied.
(c) Functional and presentation currencyThe consolidated financial statements are presented in Australian dollars, which is the consolidated entity’s functional and presentation currency. The consolidated entity is of a kind referred to in ASIC Class Order 98/100 dated 10 July 1998 and in accordance with that Class Order, all financial information presented in Australian dollars has been rounded to the nearest thousand unless otherwise stated.
The accounting policies set out below have been consistently applied to all years presented.
(d) Use of judgements and estimatesThe preparation of the financial statements requires management to make judgements, estimates and assumptions that affect the application of accounting policies and the reported amounts of assets, liabilities, income and expenses. Actual results may differ from these estimates. Estimates and underlying assumptions are reviewed on an ongoing basis. Revisions to accounting estimates are recognised in the period in which the estimates are revised and in any future periods affected.
The Group assesses impairment at each reporting date by evaluating conditions specific to the Group that may lead to impairment of assets. Where an impairment trigger exists, the recoverable amount of the asset is determined. Value-in-use calculations performed in assessing recoverable amounts incorporate a number of key estimates.
No impairment has been recognised in respect of goodwill or other assets for the year ended 30 June 2012. Should the projected turnover figures be 10 per cent below the budgeted figures that have been incorporated in value-in-use calculations, no impairment loss would need to be recognised.
Note 3. Significant accounting policies The financial report covers the consolidated group of DWS Ltd (DWS) and controlled entities. DWS is a listed public company, incorporated and domiciled in Australia.
The following is a summary of the material accounting policies adopted by the consolidated group in the preparation of the preliminary financial report. The accounting policies have been consistently applied, unless otherwise stated.
(a) Principles of consolidationA controlled entity is any entity where DWS Ltd has the power to control the financial and operating policies so as to obtain benefits from its activities.
The controlled entities are Wallis Nominees (Computing) Pty Ltd, DWS (NSW) Pty Ltd, GV Jones & Associates Pty Ltd (formerly GlobalSoft Australia Pty Ltd), Equest Consulting Pty Ltd, Strategic Data Management Pty Ltd, SDM Sales Pty Ltd, and Borealis Australia Pty Ltd (50 per cent). All controlled entities have a June financial year end.
All inter-company balances and transactions between entities in the consolidated entity, including any unrealised profits or losses, have been eliminated on consolidation. Accounting policies of subsidiaries have been changed where necessary to ensure consistency with those policies applied by the parent entity.
DWS Limited – Annual Report 2012 47
For
per
sona
l use
onl
y

Note 3. Significant accounting policies continued
(a) Principles of consolidation continuedWhere controlled entities have entered or left the economic entity during the year, their operating results have been included/excluded from the date control was obtained or until the date control ceased.
Non-controlling interests in the entity and results of the entities that are controlled are shown as a separate item in the consolidated financial report.
(b) Income taxThe charge for current income tax expense is based on the profit for the year adjusted for any non-assessable or disallowed items. It is calculated using the tax rates that have been enacted or are substantially enacted by the reporting date.
Deferred tax is accounted for using the liability method in respect of temporary differences arising between the tax bases of assets and liabilities and their carrying amounts in the financial statements. No deferred income tax will be recognised from the initial recognition of an asset or liability, excluding a business combination, where there is no effect on accounting or taxable profit or loss.
Deferred tax is calculated at the tax rates that are expected to apply to the period when the asset is realised or liability is settled. Deferred tax is credited in the statement of comprehensive income except where it relates to items that may be credited directly to equity, in which case the deferred tax is adjusted directly against equity.
Deferred income tax assets are recognised to the extent that it is probable that future tax profits will be available against which deductible temporary differences can be utilised.
The amount of benefits brought to account or which may be realised in the future is based on the assumption that no adverse change will occur in income taxation legislation and the anticipation that the Group will derive sufficient future assessable income to enable the benefit to be realised and comply with the conditions of deductibility imposed by the law.
DWS has not entered into an income tax consolidated group under the tax consolidation regime. DWS Ltd and each of its subsidiaries are responsible for their own recognition of current and deferred tax assets and liabilities.
(c) Revenue recognitionRevenues are recognised at fair value of the consideration received net of the amount of goods and services tax (GST) payable to the taxation authority.
The Group recognises revenue when the amount of revenue can be reliably measured, it is probable that future economic benefits will flow to the entity and specific criteria have been met for each of the Group’s principal business activities as described below: 1. Consulting services
Consulting services revenue is recognised on a billing entitlement basis and is matched against related costs incurred. Where fixed price contracts are used, revenue recognition is based on stage of completion. The stage of completion is measured by reference to labour hours incurred to date as a percentage of estimated total labour hours per the detailed project plan derived for each project pursuant to the Group’s quality methodology. Where the outcome cannot be estimated reliably, revenue is recognised only to the extent that related expenditure is recoverable.
2. Interest
Interest revenue is recognised as it accrues, taking into account the interest rates applicable to the financial assets.
3. Sale of non-current assets
The gain or loss on disposal is calculated as the difference between the carrying amount of the asset at the time of disposal and the net proceeds on disposal (including incidental costs).
4. Dividends
Dividend revenue is recognised net of any franking credits.
(d) Goods and services taxRevenues, expenses and assets are recognised net of the amount of goods and services tax (GST), except where the amount of GST incurred is not recoverable from the taxation authority. In these circumstances, the GST is recognised as part of the cost of acquisition of the asset or as part of the expense. Receivables and payables are stated with the amount of GST included. The net amount of GST recoverable from, or payable to, the Australian Taxation Office (ATO) is included as a current asset or liability in the statement of financial position.
Notes to the Financial Statements continued
48
For
per
sona
l use
onl
y

Cash flows are presented in the statement of cash flows on a gross basis, except for the GST component of investing and financing activities, which are disclosed as operating cash flows.
(e) Borrowing costsBorrowing costs include interest, amortisation of discounts or premiums relating to borrowings, amortisation of ancillary costs incurred in connection with arrangement of borrowings and foreign exchange including trade creditors and lease finance charges.
Ancillary costs incurred in connection with the arrangement of borrowings are capitalised and amortised over the life of the borrowings. Other borrowing costs are expensed. (f) Work in progressWork in progress represents the gross unbilled amount expected to be collected from clients for work performed to date. Where the work has been delivered on a time and materials basis, work in progress is measured using the Group’s various selling rates on a per hour basis (including relevant disbursements) to date. Where projects have been delivered on a fixed price basis, work in progress is measured using the percentage of completion method.
(g) LeasesLeases of fixed assets where substantially all the risks and benefits incidental to the ownership of the asset, but not the legal ownership, are transferred to entities in the consolidated entity are classified as finance leases.
Finance leases are capitalised by recording an asset and a liability at the lower of the amounts equal to the fair value of the leased property or the present value of the minimum lease payments, including any guaranteed residual values. Lease payments are allocated between the reduction of the lease liability and the lease interest expense for the period.
Lease payments for operating leases, where substantially all the risks and benefits remain with the lessor, are charged as expenses in the periods in which they are incurred.
Lease incentives under operating leases are recognised as a liability and amortised on a straight-line basis over the life of the lease term.
(h) Financial instrumentsClassification
The Group classifies its financial assets in the following categories: financial assets at fair value through profit or loss, loans and receivables, held-to-maturity investments and available-for-sale financial assets. The classification depends on the purpose for which the investments were acquired. Management determines the classification of its investments at initial recognition and, in the case of assets classified as held-to-maturity, re-evaluates this designation at each reporting date.
Recognition
Financial instruments are initially measured at cost on trade date, which includes transaction costs, when the related contractual rights or obligations exist. Subsequent to initial recognition these instruments are measured as set out below.
Financial assets at fair value through profit and loss
A financial asset is classified in this category if acquired principally for the purpose of selling in the short term or if so designated by management and within the requirements of AASB 139: Financial Instruments: Recognition and Measurement.
Derivatives are also categorised as held for trading unless they are designated as hedges. Realised and unrealised gains and losses arising from changes in the fair value of these assets are included in the statement of comprehensive income in the period in which they arise.
Loans and receivables
Loans and receivables are non-derivative financial assets with fixed or determinable payments that are not quoted in an active market. They are included in current assets, except for those with maturities greater than 12 months after the reporting date which are classified as non-current assets. Loans and receivables are included in trade and other receivables (Note 11). They are measured at amortised cost less accumulated impairment losses.
Held-to-maturity investments
Held-to-maturity investments are non-derivative financial assets with fixed or determinable payments and fixed maturities that the Group’s management has the positive intention and ability to hold to maturity. If the Group were to sell other than an insignificant amount of held-to-maturity financial assets, the whole category would be tainted and reclassified as available-for-sale. Held-to-maturity financial assets are included in non-current assets, except for those with maturities less than 12 months from the reporting date, which are classified as current assets. Held-to-maturity investments are measured at amortised cost.
DWS Limited – Annual Report 2012 49
For
per
sona
l use
onl
y

Note 3. Significant accounting policies continued
(h) Financial instruments continuedAvailable-for-sale financial assets
Available-for-sale financial assets include any financial assets not included in the above categories. Available-for-sale financial assets are reflected at fair value. Unrealised gains and losses arising from changes in fair value are taken directly to equity.
Financial liabilities
Non-derivative financial liabilities are recognised at amortised cost, comprising original debt less principal payments and amortisation.
Derivative instruments
Derivative instruments are measured at fair value. Gains and losses arising from changes in fair value are taken to the statement of comprehensive income unless they are designated as hedges.
Fair value
Fair value is determined based on current bid prices for all quoted investments. Valuation techniques are applied to determine the fair value for all unlisted securities, including recent arm’s length transactions reference to similar instruments and option pricing models.
Impairment of financial assets
At each reporting date, the Group assesses whether there is objective evidence that a financial instrument has been impaired. In the case of available-for-sale financial instruments, a significant or prolonged decline in the value of the instrument is considered to determine whether an impairment has arisen. Impairment losses are recognised in the statement of comprehensive income.
Repurchase of share capital (treasury capital)
When share capital recognised as equity is repurchased, the amount of consideration paid, which includes directly attributable costs, is recognised as a deduction from equity, net of any tax effects. Repurchased shares are classified as treasury shares and are presented as a deduction from total equity.
(i) Business combinations The consideration transferred by the Group to obtain control of a subsidiary is calculated as the sum of the acquisition-date fair values of assets transferred, liabilities incurred and the equity interests issued by the Group, which includes the fair value of any asset or liability arising from a contingent consideration arrangement. Acquisition costs are expensed as incurred.
The Group recognises identifiable assets acquired and liabilities assumed in a business combination regardless of whether they have been previously recognised in the acquiree’s financial statements prior to the acquisition. Assets acquired and liabilities assumed are generally measured at their acquisition-date fair values.
Goodwill is stated after separate recognition of identifiable intangible assets. It is calculated as the excess of the sum of a) fair value of consideration transferred, b) the recognised amount of any noncontrolling interest in the acquiree and c) acquisition-date fair value of any existing equity interest in the acquiree, over the acquisition-date fair values of identifiable net assets. If the fair values of identifiable net assets exceed the sum calculated above, the excess amount (i.e. gain on a bargain purchase) is recognised in profit or loss immediately.
(j) IntangiblesGoodwill
Goodwill represents the excess of the cost of an acquisition over the fair value of the Group’s share of the net identifiable assets of the acquired subsidiary at the date of acquisition. Goodwill on acquisitions of subsidiaries is included in intangible assets. Goodwill is not amortised. Instead, goodwill is tested for impairment annually, or more frequently if events or changes in circumstances indicate that it might be impaired, and is carried at cost less accumulated impairment losses.
Gains and losses on the disposal of an entity include the carrying amount of goodwill relating to the entity sold.
Software products and intellectual property
Internally developed software products have been acquired through business combinations and are carried at cost less any accumulated amortisation and impairment losses. These intangible assets have been assessed as having a finite life and are amortised as appropriate over the period of their useful lives. All amortisation is recognised in the statement of comprehensive income. If an impairment indication arises, the recoverable amount is estimated and an impairment loss is recognised to the extent that the recoverable amount is lower than the carrying amount.
Notes to the Financial Statements continued
50
For
per
sona
l use
onl
y

The amortisation rates used in the current and the comparative period are:
Software 25-40%Intellectual Property 10%
(k) Impairment of non-financial assetsAt each reporting date, the Group reviews the carrying values of its tangible and intangible assets to determine whether there is any indication that those assets have been impaired. If such an indication exists, the recoverable amount of the asset, being the higher of the asset’s fair value less costs to sell and value in use, is compared to the asset’s carrying value. Value in use is determined by management estimating expected future cash flows from each asset/cash-generating unit and determining a suitable interest rate in order to calculate the present value of those cash flows. Any excess of the asset’s carrying value over its recoverable amount is expensed to the statement of comprehensive income. Impairment testing is performed annually for goodwill and intangible assets with indefinite lives. Where it is not possible to estimate the recoverable amount of an individual asset, the Group estimates the recoverable amount of the cash-generating unit to which the asset belongs.
(l) Property, plant and equipmentEach class of property, plant and equipment is carried at cost or fair value less, where applicable, any accumulated depreciation and impairment losses.
The cost of fixed assets constructed within the consolidated entity includes the cost of materials, direct labour, borrowing costs and an appropriate proportion of fixed and variable overheads.
Subsequent costs are included in the asset’s carrying amount or recognised as a separate asset, as appropriate, only when it is probable that future economic benefits associated with the item will flow to the Group and the cost of the item can be measured reliably. All other repairs and maintenance are charged to the statement of comprehensive income during the financial period in which they are incurred.
Depreciation
The depreciable amount of all fixed assets including building and capitalised lease assets, but excluding freehold land, is depreciated on a reducing balance basis over their useful lives to the Group commencing from the time the asset is held ready for use. Leasehold improvements are depreciated over the shorter of either the unexpired period of the lease or the estimated useful lives of the improvements.
The depreciation rates used in the current and the comparative period are:
Plant and equipment 7.5-40%Motor vehicles 18.75-25%Leasehold improvements 2.5%
The assets’ residual values and useful lives are reviewed, and adjusted if appropriate, at each reporting date.
An asset’s carrying amount is written down immediately to its recoverable amount if the asset’s carrying amount is greater than its estimated recoverable amount.
(m) Employee benefitsProvision is made for the group liability for employee benefits arising from services rendered by employees to reporting date. Employee benefits that are expected to be settled within one year have been measured at the amounts expected to be paid when the liability is settled, plus related on-costs. Employee benefits payable later than one year have been measured at the present value of the estimated future cash outflows to be made for those benefits using discount rates appropriate to the payment dates.
Share-based payments
The Group has an employee share scheme and a Director option scheme. Employee or executive services rendered in exchange for the grant of shares and options are recognised as an expense in the statement of comprehensive income. The total amount to be expensed over the vesting period is determined by reference to the fair value of the shares or the options granted.
Superannuation
There are no persons employed by the Group or any of its subsidiaries who are members of a defined benefit superannuation plan. Contributions to employee superannuation funds are recognised as an expense as they are made.
(n) Provisions Provisions are recognised when the Group has a legal or constructive obligation, as a result of past events, for which it is probable that an outflow of economic benefits will result and that outflow can be reliably measured.
DWS Limited – Annual Report 2012 51
For
per
sona
l use
onl
y

Note 3. Significant accounting policies continued
(o) ReceivablesTrade and other receivables represent the principal amounts due at reporting date plus accrued interest and less, where applicable, any unearned income and allowance for doubtful debts.
(p) Cash and cash equivalentsCash and cash equivalents include cash on hand, deposits held at call with banks and other short term highly liquid investments such as term deposits with original maturities of three months or less. These investments are subject to insignificant levels of risk and changes in value.
(q) DividendsA provision for dividends payable is recognised in the reporting period in which the dividends are declared, for the entire undistributed amount, regardless of the extent to which they will be paid in cash.
(r) Comparative figuresWhen required by Accounting Standards, comparative figures have been adjusted to conform to changes in presentation for the current financial year.
Note 4. Financial risk management(a) OverviewThe Group has exposure to certain types of risk as part of its day to day operations. This Note presents an overview as to each type of risk and how the Group goes about identifying, measuring and managing these risks. The Board of Directors in conjunction with the Audit, Risk and Compliance Committee and executive management have overall responsibility for the establishment and oversight of the risk management framework.
Risk management procedures are established to identify and analyse the risks faced by the Group, to set appropriate risk limits and controls, and monitor risks and ensure adherence to policies. Risk management procedures and systems are reviewed regularly to reflect changes in market conditions and the Group’s activities. The Group, through its training and management standards and procedures, aims to develop a disciplined and constructive control environment in which all employees understand their roles and obligations.
The Group Audit, Risk and Compliance Committee oversees how management monitors risk and assesses the adequacy of the risk management procedures in place.
(b) Credit risk exposuresCredit risk is the risk of financial loss to the Group if a customer fails to meet its contractual obligations and arises principally from the Group’s receivables from customers.
(i) Trade and other receivables
The Group’s exposure to credit risk is influenced mainly by the individual characteristics of each customer. The consolidated entity minimises concentrations of credit risk by undertaking transactions with a number of clients and customers in various companies and performing due diligence procedures on major new customers.
The Group’s long standing relationships with the majority of clients further protects against credit risk, and historically the Group has experienced only minor losses from customer defaults. As at 30 June 2012, trade receivables of $9,273,679 (2011: $18,098,692) were past due but not impaired. These relate to a number of independent customers for whom there is no recent history of default. Trade receivables that are not past due do not contain any impaired assets. Based on the credit history of the relevant counterparties, it is expected that these amounts will be received when due.
Notes to the Financial Statements continued
52
For
per
sona
l use
onl
y

The following table shows the consolidated entity’s aged trade and other receivables which were tested and deemed not to be impaired:
Consolidated
2012 $’000
2011 $’000
Not past due 14,294 14,274
Past due 0-60 days 4,410 3,055
60-90 days 3,419 2,698
90-120 days 261 1,395
120 days + 1,222 2,523
23,606 23,945
The operating entities within the Group invoice clients on a monthly basis. Different entities within the Group operating in different regional areas have varying invoice terms, including 14 days, 30 days and ‘Due on Receipt’ (by the client entity). NOTE: where invoice terms are ‘Due’ upon the receipt by the client, it is necessary to allow for a reasonable period of time for the client’s administrative department to authorise and subsequently pay the invoice before it can be classified as ‘Past Due’. For the purposes of this Note, ‘Not Past Due’ is defined as being any period less than 30 days from the date of invoice generation.
(c) Interest rate riskThe consolidated entity has minimal exposure to interest rate risk. The consolidated entity’s current exposure to interest rate risk and the effective weighted average interest rate was attributable to cash and cash equivalents only. The average interest rate on cash and cash equivalents for 2012 was 4.25 per cent (2011: 4.75 per cent).
The following table illustrates sensitivities to the Group’s exposures to changes in interest rates. The table indicates the impact on how profit and equity values reported at balance date would have been affected by changes in interest rates that management considers to be reasonably possible.
Consolidated
Profit $’000
Equity $’000
Year ended 30 June 2012
+/- 2% in interest rates +/- 302 +/- 302
Year ended 30 June 2011
+/- 2% in interest rates +/- 241 +/- 241
* 2 per cent sensitivity has been used as interest rates have been relatively stable over the previous 12 months and are not expected to change by more than 2 per cent in the next 12 months.
No other financial assets and liabilities are exposed to interest rate risk.
DWS Limited – Annual Report 2012 53
For
per
sona
l use
onl
y

Notes to the Financial Statements continued
Note 3. Significant accounting policies continued
(d) Liquidity riskLiquidity risk is the risk the Group will not be able to meet its financial obligations as they fall due. The Group’s approach to managing liquidity is to ensure, as far as possible, that it will always have sufficient liquidity to meet its liabilities when due, both under normal and stressed conditions, without incurring unacceptable losses or risking damage to the Group’s reputation. The following table details the Group’s maturity for its financial liabilities:
Consolidated Entity
Carrying Amount
$’000
Contractual Cash Fows
$’000
Less Than 1 Month
$’000
1 to 3 Months
$’000
3 Months to 1 Year
$’000
Greater than 1 Year $’000
2012
Trade payables 2,432 2,432 2,432 - - -
Accruals 1,397 1,397 1,397 - - -
Other financial liabilities 2,821 2,821 1,917 904 - -
6,650 6,650 5,746 904 - -
2011
Trade payables 267 267 267 - - -
Accruals 1,005 1,005 1,005 - - -
Other financial liabilities 1,860 1,860 1,334 526 - -
3,132 3,132 2,606 526 - -
(e) Capital managementThe Board’s policy is to maintain a strong capital base so as to maintain investor, creditor and market confidence and to sustain the future development of the business. The Board of Directors also monitors the level of dividends to ordinary shareholders.
From time to time the Group may purchase its own shares on the market; the timing of these purchases depends on market prices. These repurchase decisions are made by the executive management of the Group in conjunction with the Board of Directors.
There were no changes in the Group’s capital management approach during the year.
Neither the Company nor any of its subsidiaries are subject to externally imposed capital requirements.
(f) Fair valuesFair values of financial assets and liabilities are materially the same as the carrying amounts shown in the consolidated statement of financial position.
Note 5. Revenue Consolidated
2012 $’000
2011 $’000
Revenue from continuing operations
Services revenue 109,664 98,386
Total revenue from continuing operations 109,664 98,386
Other revenue
Interest received 642 572
Other 225 103
Total other revenue 867 675
54
For
per
sona
l use
onl
y

Note 6. Profit for the year
Consolidated
2012 $’000
2011 $’000
Profit from ordinary activites before income tax expense has been determined after the following specific expenses:
Depreciation and amortisation of:
Plant and equipment 786 287
Intangible assets - 71
786 358
Employee benefit expense
Salary and other benefits 73,501 64,180
Superannuation 5,525 4,875
79,026 69,055
Occupancy expenses
Rental expense on operating leases – minimum lease rentals 1,008 1,191
1,008 1,191
Auditors remuneration
Payments to Grant Thornton Audit Pty Ltd 80 80
80 80
Impairment of intangible assets
Impairment of internally developed software - 48
- 48
Note 7. Income tax Consolidated
2012 $’000
2011 $’000
The components of income tax expense comprise:
Current tax expenses 8,489 7,462
Deferred tax expense (456) 244
8,033 7,706
Profit/loss before income tax 26,254 25,095
Prima facie tax on profit from ordinary activities before income tax at 30% (2011 30%) 7,876 7,529
Increase in income tax expense due to:
Non-deductible entertainment 156 172
Other items 1 5
Adjusted income tax 8,033 7,706
Income tax expense 8,033 7,706
Applicable weighted average effective tax rate 30.60% 30.71%
DWS Limited – Annual Report 2012 55
For
per
sona
l use
onl
y

Note 7. Income tax continued
Recognised deferred tax assets and liabilities
Deferred tax assets and liabilities are attributable to the following:
Assets Liabilities Net
2012 $’000
2011 $’000
2012 $’000
2011 $’000
2012 $’000
2011 $’000
Consolidated
Employee benefits 138 72 - - 138 72
Provisions 1,577 1,373 - - 1,577 1,373
Other 490 304 - - 490 304
Net tax (assets)/liabilities 2,205 1,749 - - 2,205 1,749
Consolidated
2012 $’000
2011 $’000
Movements in temporary differences
The overall movement in the deferred tax account is as follows:
Opening balance 1,749 1,993
Charge to income statement 456 (244)
2,205 1,749
Deferred tax asset movement
Employee benefits
Opening balance 72 389
Charged 66 (317)
Closing balance 138 72
Provisions
Opening balance 1,373 1,275
Charged 204 98
Closing balance 1,577 1,373
Other
Opening balance 304 329
Charged 186 (25)
Closing balance 490 304
Total closing balance 2,205 1,749
Notes to the Financial Statements continued
56
For
per
sona
l use
onl
y
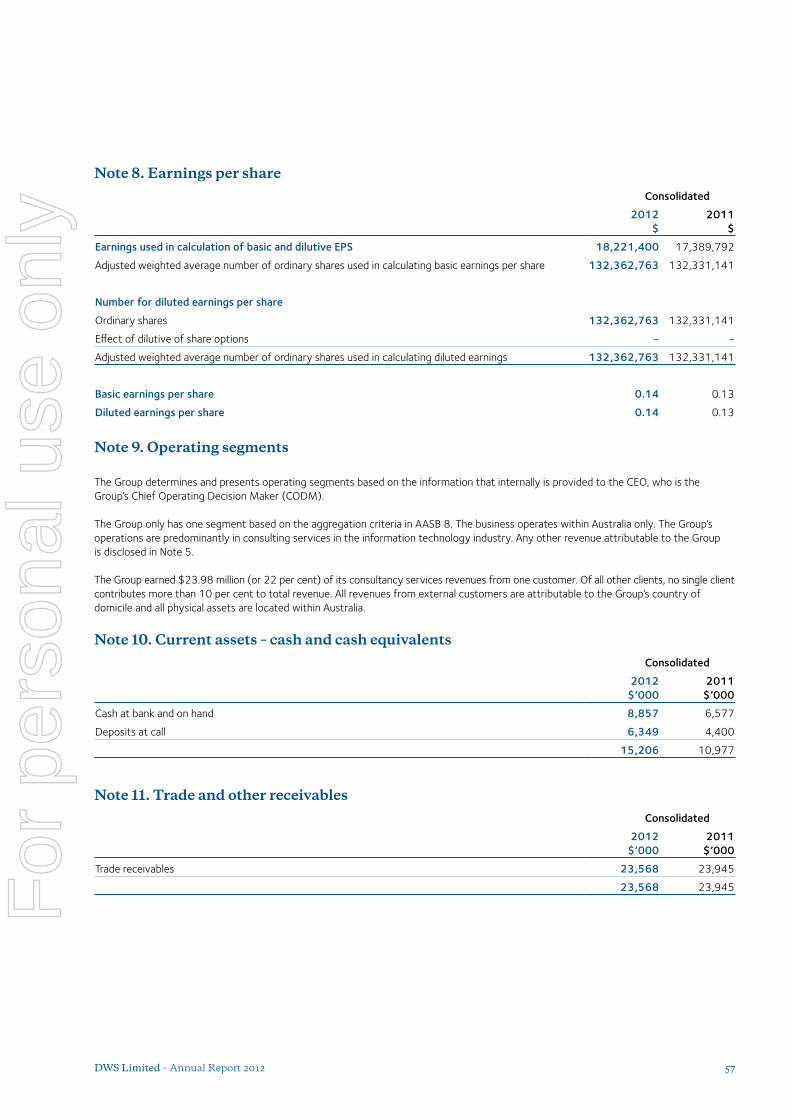
Note 8. Earnings per share Consolidated
2012 $
2011 $
Earnings used in calculation of basic and dilutive EPS 18,221,400 17,389,792
Adjusted weighted average number of ordinary shares used in calculating basic earnings per share 132,362,763 132,331,141
Number for diluted earnings per share
Ordinary shares 132,362,763 132,331,141
Effect of dilutive of share options - -
Adjusted weighted average number of ordinary shares used in calculating diluted earnings 132,362,763 132,331,141
Basic earnings per share 0.14 0.13
Diluted earnings per share 0.14 0.13
Note 9. Operating segments
The Group determines and presents operating segments based on the information that internally is provided to the CEO, who is the Group’s Chief Operating Decision Maker (CODM).
The Group only has one segment based on the aggregation criteria in AASB 8. The business operates within Australia only. The Group’s operations are predominantly in consulting services in the information technology industry. Any other revenue attributable to the Group is disclosed in Note 5.
The Group earned $23.98 million (or 22 per cent) of its consultancy services revenues from one customer. Of all other clients, no single client contributes more than 10 per cent to total revenue. All revenues from external customers are attributable to the Group’s country of domicile and all physical assets are located within Australia.
Note 0. Current assets – cash and cash equivalents Consolidated
2012 $’000
2011 $’000
Cash at bank and on hand 8,857 6,577
Deposits at call 6,349 4,400
15,206 10,977
Note . Trade and other receivables Consolidated
2012 $’000
2011 $’000
Trade receivables 23,568 23,945
23,568 23,945
DWS Limited – Annual Report 2012 57
For
per
sona
l use
onl
y
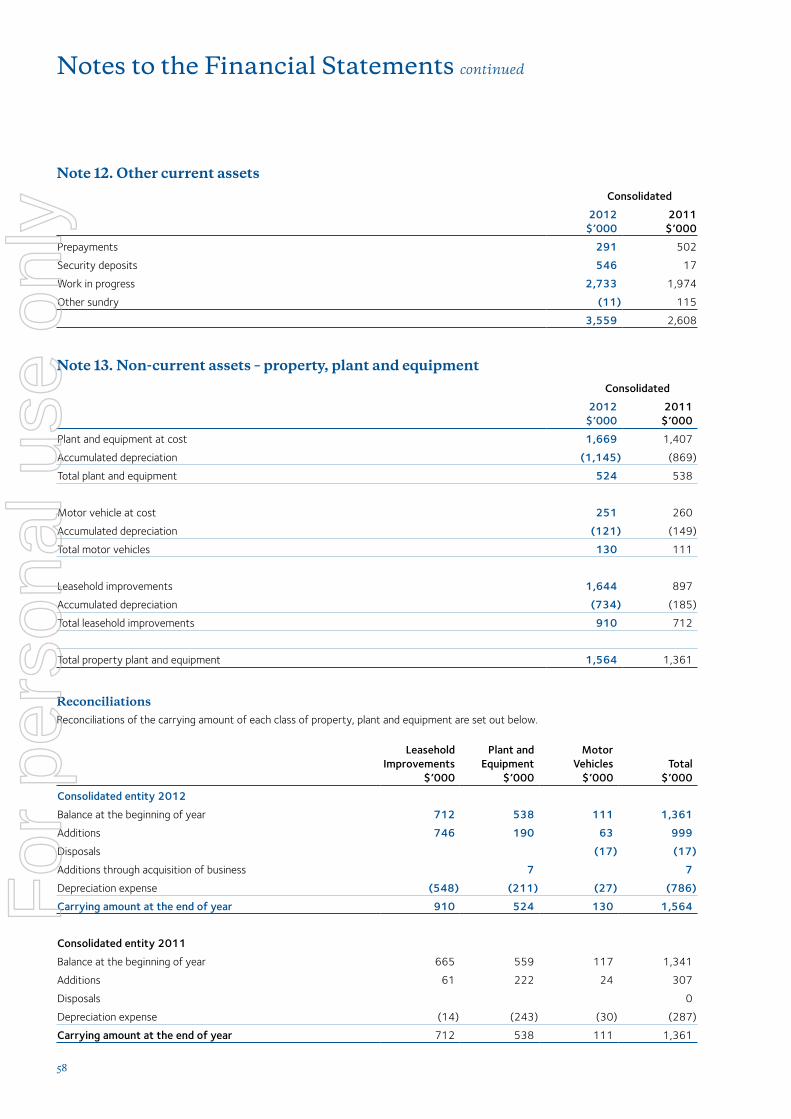
Note . Other current assets Consolidated
2012 $’000
2011 $’000
Prepayments 291 502
Security deposits 546 17
Work in progress 2,733 1,974
Other sundry (11) 115
3,559 2,608
Note 3. Non-current assets – property, plant and equipment Consolidated
2012 $’000
2011 $’000
Plant and equipment at cost 1,669 1,407
Accumulated depreciation (1,145) (869)
Total plant and equipment 524 538
Motor vehicle at cost 251 260
Accumulated depreciation (121) (149)
Total motor vehicles 130 111
Leasehold improvements 1,644 897
Accumulated depreciation (734) (185)
Total leasehold improvements 910 712
Total property plant and equipment 1,564 1,361
ReconciliationsReconciliations of the carrying amount of each class of property, plant and equipment are set out below.
Leasehold Improvements
$’000
Plant and Equipment
$’000
Motor Vehicles
$’000Total
$’000
Consolidated entity 2012
Balance at the beginning of year 712 538 111 1,361
Additions 746 190 63 999
Disposals (17) (17)
Additions through acquisition of business 7 7
Depreciation expense (548) (211) (27) (786)
Carrying amount at the end of year 910 524 130 1,564
Consolidated entity 2011
Balance at the beginning of year 665 559 117 1,341
Additions 61 222 24 307
Disposals 0
Depreciation expense (14) (243) (30) (287)
Carrying amount at the end of year 712 538 111 1,361
Notes to the Financial Statements continued
58
For
per
sona
l use
onl
y

Note 4. Intangible assets Consolidated
2012 $’000
2011 $’000
Goodwill
Opening balance 26,090 26,090
Acquisition of business of combination 300 -
Closing balance 26,390 26,090
Other intangible assets
Capitalised software
Opening balance 520 339
Additions 132 300
Amortisation of software expense (16) (71)
Impairment of software expense* - (48)
Closing balance 636 520
Internally generated intellectual property
Research and development 54 -
Acquisition of intellectual property rights
Brand mark 25 -
Total non-current intangible assets 27,105 26,610
* Impairment of software expense relates to internally generated intellectual property acquired as part of the Group’s acquisition of Strategic Data Management in 2008. This software was assessed during the period as having a market value less than the carrying book value and an impairment expense was recognised to reduce the carrying book value to the assessed market valuation.
There has been no impairment of the goodwill valuation as at 30 June 2012 or subsequent to that date. Goodwill is allocated to one cash-generating unit.
Impairment disclosures – goodwillThe recoverable value of goodwill is based on value in use. Value in use calculations based on the present value of cash flow projections over a five year period for the Group as a whole on the basis that the independent cash-generating unit is not readily identifiable based on the Group’s operating and reporting structure. The cash flows were discounted using a rate of 15 per cent with an assumed revenue growth figure of 5 per cent per annum.
Note 5. Provisions Consolidated
2012 $’000
2011 $’000
Current liabilities – provisions
Employee benefits 5,258 4,156
Total current provisions 5,258 4,156
Non-current liabilities - provisions
Employee benefits 380 420
Total current and non-current provisions 5,638 4,576
DWS Limited – Annual Report 2012 59
For
per
sona
l use
onl
y

Note 6. Current liabilities – other Consolidated
2012 $’000
2011 $’000
Current liabilities
Trade payables 2,432 267
Other payables 3,607 2,645
6,039 2,912
Current liabilities – other
Unearned revenue 611 220
Total current liabilities – other 6,650 3,132
Note 7. Contributed equity Consolidated
2012 $’000
2011 $’000
Opening share capital 34,757 34,757
Share based payments - -
Closing share capital 34,757 34,757
Number of shares on issue Number Number
Fully paid ordinary shares with no par value 132,362,763 132,362,763
Ordinary shares participate in dividends and the proceeds on winding up of the parent entity in proportion to the number of shares held. At the shareholders’ meetings each ordinary share is entitled to vote when a poll is called; otherwise each shareholder has one vote on a show of hands.
Note 8. Dividends(a) Dividends paid during the year
Cents Per Share
Total Amount $’000
Franked/ Unfranked
Payment Date
2012
Final 2011 ordinary 6.00 7,942 Franked at 30% 4-Oct-11
Interim 2012 ordinary 6.25 8,273 Franked at 30% 4-Apr-12
2011
Final 2010 ordinary 6.25 8,273 Franked at 30% 4-Oct-10
Interim 2011 ordinary 5.00 6,618 Franked at 30% 4-Apr-11
Special ordinary 1.00 1,323 Franked at 30% 4-Apr-11
Notes to the Financial Statements continued
60
For
per
sona
l use
onl
y

(b) Dividends declared
2012 $’000
2011 $’000
Declared final fully franked ordinary dividend of 6.25 cents (2011 6.0 cents) per share at the tax rate of 30% 8,273 7,942
(c) Dividend franking account
30% franking credits available to shareholders of DWS Limited for subsequent financial years 24,132 22,031
The franking credit amount is based on the balance of the franking account at year end. The ability to utilise the franking credits is dependent upon there being sufficient available profits to declare dividends. The impact on the dividend franking account of dividends proposed after the reporting date but not recognised as a liability is to reduce it by $3,619,558 (2011: $3,392,016).
Note 9. CommitmentsOperating leasesThe consolidated entity leases two business premises under operating leases. The leases run typically for a three year period with options to renew after that date.
Consolidated
2012 $’000
2011 $’000
Lease commitments
Commitments for minimum lease payments in relation to non-cancellable operating leases are payable as follows:
Within one year 1,020 640
Later than one year but not later than five years 1,560 680
Total commitments 2,580 1,320
Finance leasesThe consolidated entity has not entered into any finance leases for plant and equipment.
Capital and other commitmentsThere are no commitments for capital expenditure as at the date of this report. The consolidated entity will however undertake a review of the financial and risk operating systems during financial year ending 30 June 2013.
Note 0. Contingent liabilitiesDetails of contingent liabilities are as follows:
Bank guaranteesBank guarantees of $740,174 have been provided as security for performance of property rental covenants. The bank guarantees are secured by a Standard Authority to Appropriate and Set-Off Term Deposits to the equivalent guarantee value.
DWS Limited – Annual Report 2012 61
For
per
sona
l use
onl
y

Note . Investment in controlled entities Equity Holding
Country of Incorporation
Class of Shares
2012 %
2011 %
Name of entity
Wallis Nominees (Computing) Pty Ltd Australia Ordinary 100 100
DWS (NSW) Pty Ltd Australia Ordinary 100 100
G V Jones & Assoc Pty Ltd (formerly named GlobalSoft Australia Pty Ltd) Australia Ordinary 100 100
Equest Consulting Pty Ltd Australia Ordinary 100 100
Strategic Data Management Pty Ltd Australia Ordinary 100 100
SDM Sales Pty Ltd Australia Ordinary 100 100
Borealis Australia Pty Ltd Australia Ordinary 50 0
Note . Reconciliation of cash flows from operations with profit after tax Consolidated
2012 $’000
2011 $’000
Profit for the year 18,221 17,389
Depreciation and amortisation of non-current assets 786 287
Equity settled share based payment - -
Increase/(decrease) in current tax liability (630) (693)
(Increase)/decrease in deferred tax assets (456) 244
Changes in net assets and liabilities net of effects from acquisitions and disposal of businesses:
(Increase)/decrease in assets:
Trade and other receivables (18) (3,184)
Other current assets (279) (484)
Increase/(decrease) in liabilities:
Trade and other payables 2,858 702
Other current liabilities - -
Short term provisions 1,433 (191)
Long term provisions - -
Net cashflow from operating activities 21,915 14,070
Note 3. Key management personnelCompensation by category
Consolidated
2012 $
2011 $
Base remuneration 1,189,972 942,019
STI cash bonus 135,000 106,250
LTI deferred cash bonus 90,000 -
Non-cash benefits 286,741 174,808
Superannuation/pension benefits 172,935 142,924
1,874,648 1,366,001
There are no other compensation benefits paid.
Notes to the Financial Statements continued
62
For
per
sona
l use
onl
y

Information and disclosures of Directors’ and Executive’s compensation and some equity instrument disclosures are included in the remuneration report on pages 31 to 34.
Equity holding and transactionsThe movement during the reporting period in the number of ordinary shares of DWS Limited held, directly, indirectly or beneficially, by each Director and executive, including their personally related entities is as follows:
Held at 30 June 2011
Purchases/(Disposals)
Held at 30 June 2012
Specified Directors
Harvey Parker1 108,333 - 108,333
Ken Barry1 103,333 - 103,333
Danny Wallis2 56,305,283 56,305,283
Martin Ralston1 18,000 - 18,000
Gary Ebeyan1 - 16,130 16,130
Specified Executives
Lachlan Armstrong2 343,913 343,913
1. Held indirectly through a related entity.2. Held both directly and indirectly through a related entity.
Loans and other transactions with Directors and key management personnelLoans
There were no loans to or from Directors or executives during the reporting period.
Other transactions with the Company or its controlled entities
There were no transactions with Directors and other key management personnel during the reporting period, except as follows:
• Mr Gary Ebeyan provided management consultancy services to the Company over the course of the year. These services were provided by Mr Ebeyan via his company Expert Consulting Australia Pty Ltd, for total consideration of $96,433 (excluding GST).
• Leasing of the Canberra Office premises from an entity owned by Mr Danny Wallis. The yearly rental of the premises is $188,000 (excluding GST).
• Leasing of the Melbourne office until 31 December 2011 from an entity owned by Mr Danny Wallis. The rental paid for this property during the year was $81,080.
• Mr Dougall McBurnie’s wife, Patricia McBurnie, provided event management services to the Company over the course of the year. These services were provided directly to the Company by Mrs McBurnie for a total consideration of $60,057.
Note 4. Related partiesThe wholly-owned group consists of DWS Limited and its controlled entities as set out in Note 21. The ultimate parent entity in the owned group is DWS Limited.
All transactions with Non-Director related parties are on normal terms and conditions. These transactions consisted of the provision of services on normal commercial terms and conditions and at market rates..
Note 5. Events occurring after balance date No other matter or circumstance has arisen since 30 June 2012 that has significantly affected, or may significantly affect:
(a) the consolidated entity’s operations in future financial years;
(b) the results of those operations in future financial years; or
(c) the consolidated entity’s state of affairs in future financial years
DWS Limited – Annual Report 2012 63
For
per
sona
l use
onl
y

Note 6. Parent entity disclosures
As at, and throughout the financial year ended 30 June 2012, the parent entity of the Group was DWS Ltd:
Parent entity abridged financial statements
2012 $’000
2011 $’000
Summarised statement of financial position
Assets
Current assets 7,178 7,389
Non-current assets 25,265 25,251
Total assets 32,443 32,640
Liabilities
Current liabilities 1 3
Non-current liabilities 2,135 2,331
Total liabilities 2,136 2,334
Net assets 30,307 30,306
Equity
Issued capital 34,757 34,757
Retained earnings (4,450) (4,451)
Total equity 30,307 30,306
Summarised statement of comprehensive income
Profit for the year 1 8
Other comprehensive income - -
Total comprehensive income 1 8
Notes to the Financial Statements continued
64
For
per
sona
l use
onl
y

Directors’ Declaration
1. In the opinion of the Directors of DWS Limited (the Company):
(a) the financial statements and Notes, set out on pages 43 to 64 are in accordance with the Corporations Act 2001, including:
(i) giving a true and fair view of the financial position of the Group and consolidated entity as at 30 June 2012 and of its performance, as represented by its results of the operations and its cash flows, for the year ended on that date;
(ii) complying with Accounting Standards in Australia and the Corporations Regulations 2001;
(iii) complying with International Reporting Standards as disclosed in Note 2; and
(b) there are reasonable grounds to believe that the Company will be able to pay its debts as and when they become due and payable.
2. There are reasonable grounds to believe that the Company and the controlled entities identified in Note 21 will be able to meet any obligations or liabilities to which they are or may become subject.
3. The Directors have been given the declarations required by Section 295A of the Corporations Act 2001 from the Chief Executive Officer and Chief Financial Officer for the year ended 30 June 2012.
This declaration is made in accordance with a resolution of the Directors.
Harvey ParkerDirector
Danny WallisDirector
Signed at Melbourne this day 21 September 2012
DWS Limited – Annual Report 2012 65
For
per
sona
l use
onl
y

Independent Auditor’s Report To the Members of DWS LimitedReport on the financial reportWe have audited the accompanying financial report of DWS Limited (the Company), which comprises the consolidated statement of financial position as at 30 June 2012, the consolidated statement of comprehensive income, consolidated statement of changes inequity and consolidated statement of cash flows for the year then ended, notes comprising a summary of significant accounting policies and other explanatory information and the directors’ declaration of the consolidated entity comprising the Company and the entities itcontrolled at the year’s end or from time to time during the financial year.
Directors responsibility for the financial reportThe Directors of the Company are responsible for the preparation of the financial report that gives a true and fair view of the financial report in accordance with Australian Accounting Standards and the Corporations Act 2001. This responsibility includes such internal controls as the Directors determine are necessary to enable the preparation of the financial report to be free from material misstatement, whether due to fraud or error. The Directors also state, in the notes to the financial report, in accordance with Accounting Standard AASB 101 Presentation of Financial Statements, that compliance with the Australian equivalents to International Financial Reporting Standards ensures that the financial report, comprising the financial statements and notes, complies with International Financial Reporting Standards.
Auditor’s responsibilityOur responsibility is to express an opinion on the financial report based on our audit. We conducted our audit in accordance with Australian Auditing Standards which require us to comply with relevant ethical requirements relating to audit engagements and plan and perform the audit to obtain reasonable assurance whether the financial report is free from material misstatement.
Independent Audit Report
Grant Thornton Audit Pty LtdACN 130 913 594
Level 2215 Spring StreetMelbourne Victoria 3000GPO Box 4984Melbourne Victoria 3001
T +61 3 8663 6000F +61 3 8663 6333E [email protected] www.grantthornton.com.au
Grant Thornton Australia Limited is a member firm within Grant Thornton International Ltd. Grant Thornton International Ltd and the member firms are not a worldwide partnership. Grant Thornton Australia Limited, together with its subsidiaries and related entities, delivers its services independently in Australia.
Liability limited by a scheme approved under Professional Standards Legislation.
66
For
per
sona
l use
onl
y

An audit involves performing procedures to obtain audit evidence about the amounts and disclosures in the financial report. The procedures selected depend on the auditor’s judgement, including the assessment of the risks of material misstatement of the financial report, whether due to fraud or error.
In making those risk assessments, the auditor considers internal control relevant to the Company’s preparation and fair presentation of the financial report in order to design audit procedures that are appropriate in the circumstances, but not for the purpose of expressing an opinion on the effectiveness of the Company’s internal control. An audit also includes evaluating the appropriateness of accounting policies used and the reasonableness of accounting estimates made by the Directors, as well as evaluating the overall presentation of the financial report.
We believe that the audit evidence we have obtained is sufficient and appropriate to provide a basis for our audit opinion.
IndependenceIn conducting our audit, we have complied with the independence requirements of the Corporations Act 2001.
Auditor’s opinionIn our opinion:
(a) the financial report of DWS Limited is in accordance with the Corporations Act 2001, including:
(i) giving a true and fair view of the consolidated entity’s financial position as at 30 June 2012 and of its performance for the year ended on that date; and
(ii) complying with Australian Accounting Standards and the Corporations Regulations 2001; and
(b) the financial report also complies with International Financial Reporting Standards as disclosed in the notes to the financial statements.
Report on the remuneration reportWe have audited the remuneration report included in pages 31 to 34 of the directors’ report for the year ended 30 June 2012. The Directors of the Company are responsible for the preparation and presentation of the remuneration report in accordance with section 300A of the Corporations Act 2001. Our responsibility is to express an opinion on the remuneration report, based on our audit conducted in accordance with Australian Auditing Standards.
Auditor’s opinion on the remuneration reportIn our opinion, the remuneration report of DWS Limited for the year ended 30 June 2012, complies with section 300A of the Corporations Act 2001.
Grant Thornton Audit Pty LtdChartered Accountants
Brad TaylorPartner – Audit & Assurance
Melbourne, 21 September 2012
DWS Limited – Annual Report 2012 67
For
per
sona
l use
onl
y

Shareholder Information
DWS LimitedAnalysis of Holdings as at 3 September 0
Security ClassesFully paid ordinary shares
Holdings Ranges Holders Total Units %
1-1,000 572 417,305 0.315
1,001-5,000 1,558 4,799,764 3.626
5,001-10,000 913 7,259,879 5.485
10,001-100,000 1,055 28,299,917 21.381
100,001-99,999,999,999 84 91,585,898 69.193
Totals 4,182 132,362,763 100.000
Number of Shareholders with an Unmarketable Holding = 76
Fully paid ordinary sharesTop 20 Holdings as at 13 September 2012
Top holders snapshot Units % of Units
1. Mr Daniel Benedict Wallis 56,305,283 42.539
2. Aust Executor Trustees Sa Ltd <Tea Custodians Limited> 9,551,873 7.216
3. National Nominees Limited 4,945,077 3.736
4. Fielding Johnstone Pty Ltd <Glennfield Family No 2 A/C> 1,503,214 1.136
5. Mr Stephen Charles Williams 1,097,750 0.829
6. Citicorp Nominees Pty Limited 954,211 0.721
7. J P Morgan Nominees Australia Limited 886,026 0.669
8. Mr John Ornsby 756,601 0.572
9. G Harvey Nominees Pty Limited <Harvey 1995 Discretion A/C> 740,000 0.559
10. HSBC Custody Nominees (Australia) Limited 670,953 0.507
11. Navigator Australia Ltd <Mlc Investment Sett A/C> 648,923 0.490
12. Mr Glenn Mafodda 580,487 0.439
13. Sandhurst Trustees Ltd <Lma A/C> 468,339 0.354
14. Wd Ritchie Developments Pty Ltd <Wd Ritchie Family A/C> 411,624 0.311
15. C Barbanti Pty Ltd <Super Fund Account> 400,666 0.303
16. Mr Geoffrey Roy Bowles 390,000 0.295
17. David Mcbride 361,924 0.273
18. Lachlan Armstrong 343,913 0.260
19. Bowles Consulting Aust Pty Ltd <Bowles Super Fund A/C> 331,200 0.250
20. Mr Jim Agelopoulos 328,000 0.248
81,676,064 61.71
Total Issued Capital 132,362,763
68
For
per
sona
l use
onl
y

Corporate Directory
Registered Office/Head Office (Melbourne)DWS Limited Level 4, 500 Collins Street Melbourne VIC 3000 Australia
ABN 93 085 656 088
T +61 3 9650 9777 F +61 3 9650 9444 www.dws.com.au
Sydney OfficeLevel 7, 90 Arthur Street North Sydney NSW 2060 Australia
T +61 2 9448 7300 F +61 2 9475 0417
Brisbane OfficePodium 1, 32 Turbot Street Brisbane QLD 4000 Australia
T +61 7 3211 2858 F +61 7 3211 3812
Geelong OfficeLevel 2, 10 Moorabool Street Geelong VIC 3220 Australia
T +61 3 5221 4094
Adelaide OfficeLevel 1, 12 Pirie Street Adelaide SA 5000 Australia
T +61 8 8238 0900 F +61 8 8234 5966
Canberra OfficeLevel 1, 161 London Circuit Canberra ACT 2601 Australia
T +61 2 6230 7374F +61 2 6230 7374
Perth OfficeLevel 3, 1060 Hay Street West Perth WA 6005 Australia
T +61 8 9480 0447F +61 8 9480 0447
Share RegistryBoardroom Pty Ltd Level 7, 207 Kent St Sydney NSW 2000 Australia
T 1300 737 760F 1300 653 459
LawyersGadens Lawyers Level 25, Bourke Place 600 Bourke Street Melbourne VIC 3000 Australia
T +61 3 9252 2555
AuditorsGrant Thornton Audit Pty Ltd Level 2, 215 Spring Street Melbourne VIC 3000 Australia
T +61 3 8663 6000
DWS Limited – Annual Report 2012 69
For
per
sona
l use
onl
y

For
per
sona
l use
onl
y