For personal use only 28 August 2008 - Coffey€¦ · Net cash (outflow) inflow from operating...
36
COFFEY INTERNATIONAL LIMITED Results - 12 months ended 30 June 2008 28 August 2008 For personal use only
Transcript of For personal use only 28 August 2008 - Coffey€¦ · Net cash (outflow) inflow from operating...
COFFEY INTERNATIONAL LIMITED Results - 12 months ended 30 June 2008
28 August 2008
For
per
sona
l use
onl
y

Agenda
• Key highlights• Financial performance• Operational review• Strategy & outlook
2
• Q&A
For
per
sona
l use
onl
y

Key highlights
Roger Olds, Managing DirectorRoger Olds, Managing Director
For
per
sona
l use
onl
y
Business highlights
• Strong organic and acquisition growth• Strong operating cash flow• Grown our specialist business model – size, geographies, markets,
client base– successfully acquired & integrated businesses in Brazil
(Geoexplore), USA (MSI) and Canada (Shaheen & Peaker)
4
(Geoexplore), USA (MSI) and Canada (Shaheen & Peaker)– expanded into rail, infrastructure transaction advisory, sporting
infrastructure and mining• Finance system and controls resolved• Strong balance sheet and new debt facility• Current operating performance in line with 3 year plan from 2005
For
per
sona
l use
onl
y

Results highlights
• Total revenue up 54.0% to $558.6m
• Fee revenue up 33.6% to $376.6m
• Operating EBITA* up 70.1% to $43.2m
• NPAT* up 59.0% to $22.9m
• EPS* up 30.0% to 20.8 cents per share
5
• EPS* up 30.0% to 20.8 cents per share
• DPS up from 15cps to 16cps fully franked
• Operating cashflow up from $6.2m to $58.6m
* Pre vendor earn-out & share-based payment expense (“pre VEO & SBP”)For
per
sona
l use
onl
y

Financial performance
Debbie Goodin, Acting Chief Financial OfficerDebbie Goodin, Acting Chief Financial Officer
For
per
sona
l use
onl
y

Financial management overview
• Finance system and controls resolved• The accounts are fully reconciled
– FY07 and 1HFY08 accounts restated as outlined in appendix• Improved financial management
– Working capital improvement– Strengthened finance team; corporate and in businesses
7
– Strengthened finance team; corporate and in businesses– Continued finance training in the businesses
• New auditor appointed:– Tender process to appoint auditor undertaken September 2007– KPMG appointed in November 2007– Extended audit scope this year to increase level of assurance
For
per
sona
l use
onl
y

Financial results overview
12 months to 30 June($m)
2008 2007 change
Revenue from continuing operations 558.6 362.7 ↑ 54.0%
Fee revenue 376.6 281.9 ↑ 33.6%
Operating EBITA (pre VEO & SBP) 43.2 25.4 ↑ 70.1%
Vendor earn-out & share-based payment expense 4.9 3.8 ↑ 28.9%
Operating EBITA (post VEO & SBP) 38.3 21.6 ↑ 78.6%
8
Operating EBITA (post VEO & SBP) 38.3 21.6 ↑ 78.6%
Net interest 7.9 4.9 ↑ 61.2%
Amortisation 3.3 3.2 ↑ 3.1%
PBT 27.2 13.5 ↑ 101.5%
Income tax expense & minority interests 11.9 5.1 ↑ 133.3%
NPAT (post VEO & SBP) 15.3 8.4 ↑ 82.1%
NPAT (pre VEO & SBP) 22.9 14.4 ↑ 59.0%
Earnings per share (basic) (NPAT (pre Amort, VEO & SBP)) 20.8 16.0 ↑ 30.0%
For
per
sona
l use
onl
y
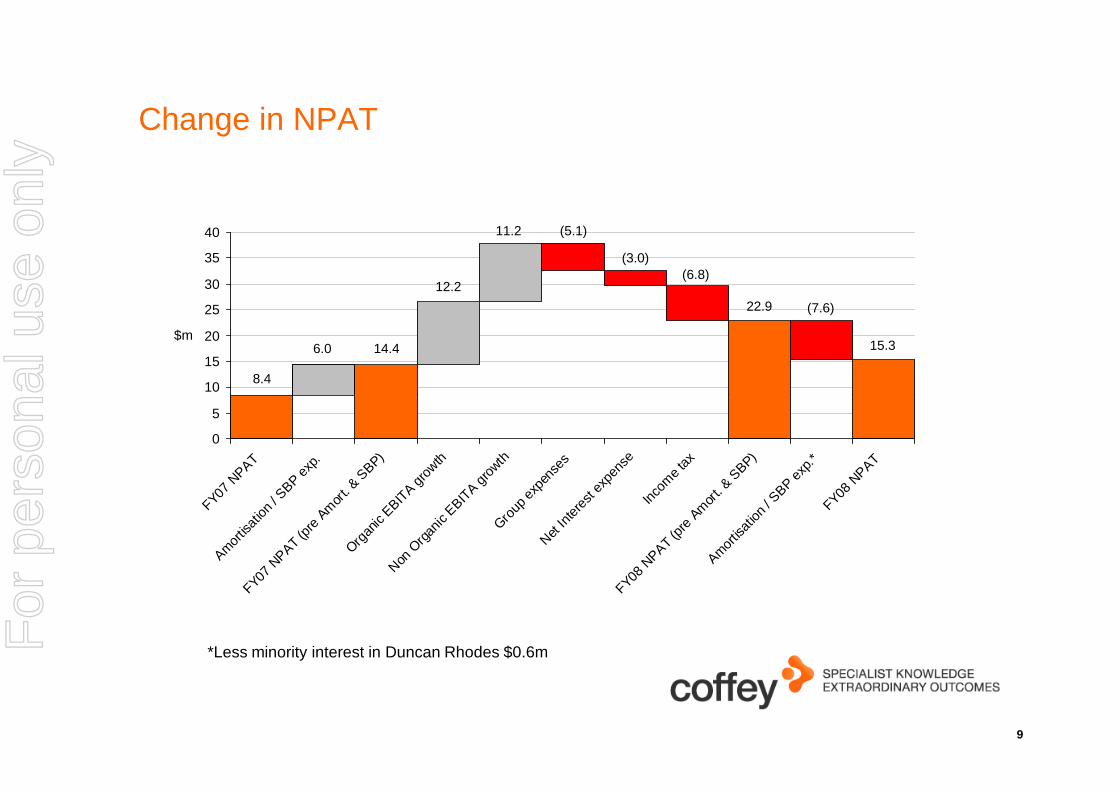
Change in NPAT
10
15
20
25
30
35
40
$m
8.4
6.0 14.4
12.2
(5.1)
(3.0)(6.8)
22.9 (7.6)
15.3
11.2
9
0
5
FY07 N
PAT
Amortis
ation
/ SBP e
xp.
FY07 N
PAT (p
re A
mor
t. & S
BP)
Organ
ic EBIT
A grow
th
Non O
rgan
ic EBIT
A gro
wthGro
up e
xpen
ses
Net In
teres
t exp
ense
Incom
e tax
FY08 N
PAT (p
re A
mor
t. & S
BP)
Amortis
ation
/ SBP e
xp.*
FY08 N
PAT
*Less minority interest in Duncan Rhodes $0.6mFor
per
sona
l use
onl
y
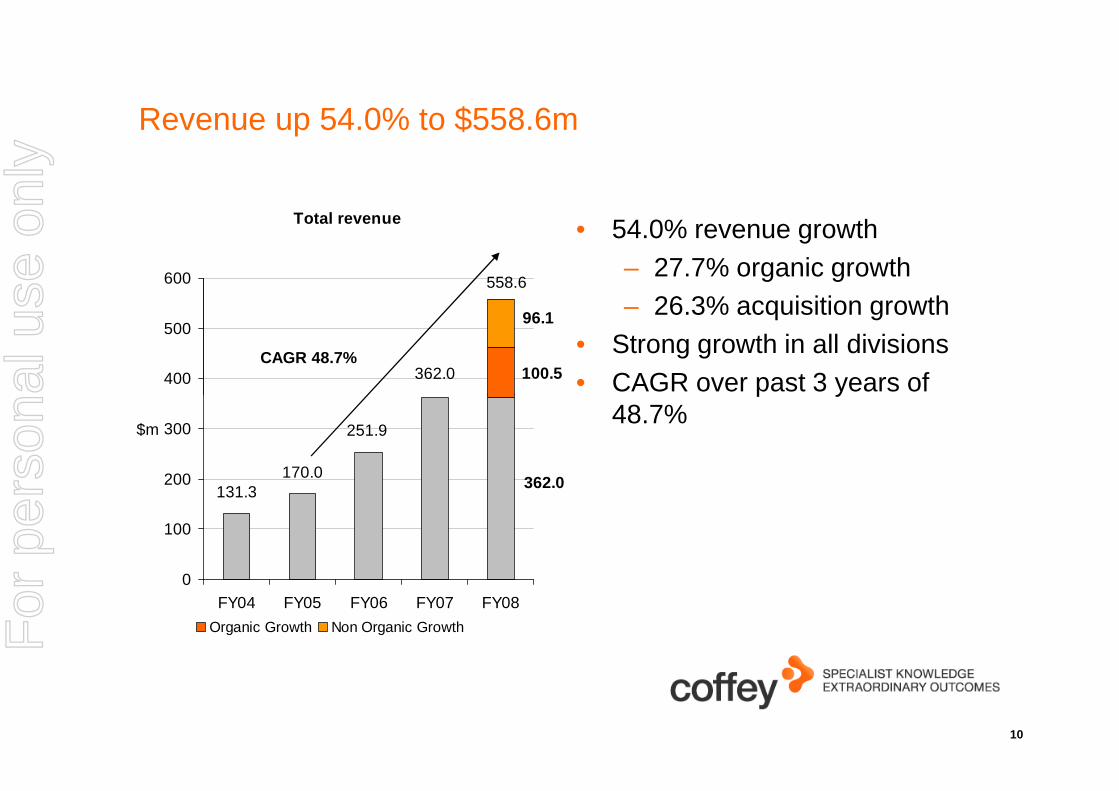
Revenue up 54.0% to $558.6m
• 54.0% revenue growth– 27.7% organic growth– 26.3% acquisition growth
• Strong growth in all divisions• CAGR over past 3 years of
Total revenue
362.0 100.5
96.1
400
500
600
CAGR 48.7%
558.6
10
• CAGR over past 3 years of 48.7%
251.9
170.0131.3 362.0
0
100
200
300
FY04 FY05 FY06 FY07 FY08
$m
Organic Growth Non Organic GrowthFor
per
sona
l use
onl
y
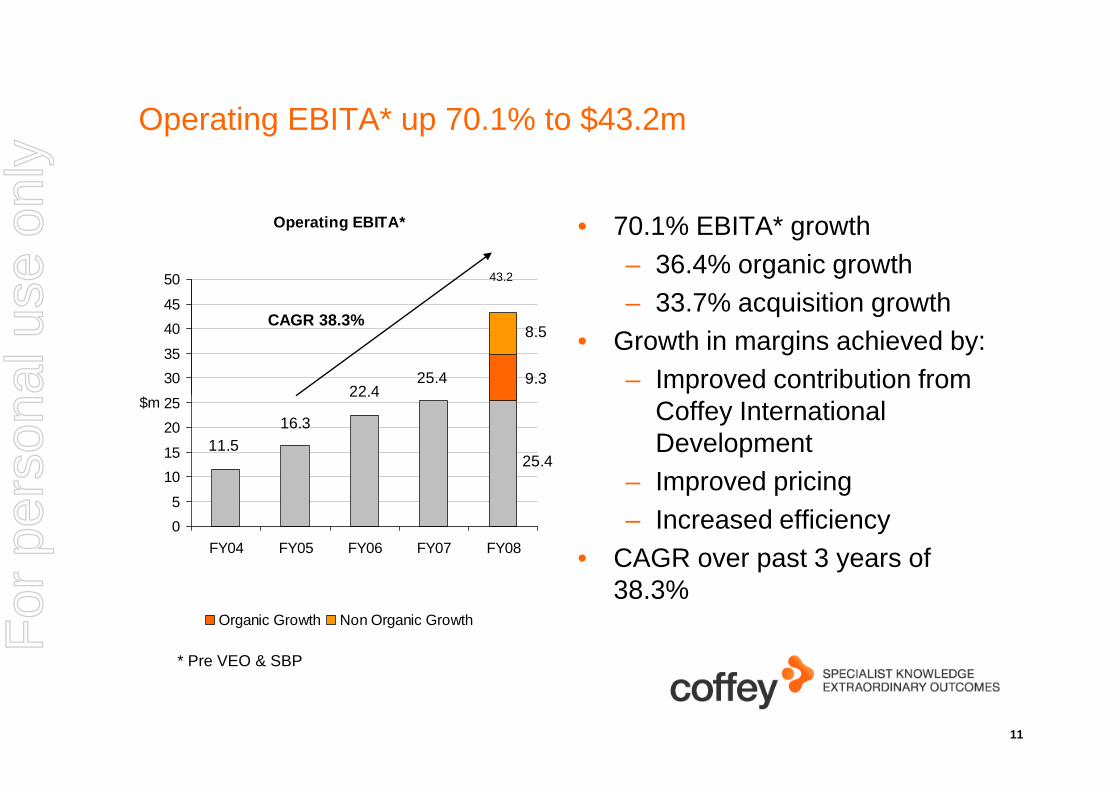
Operating EBITA* up 70.1% to $43.2m
• 70.1% EBITA* growth– 36.4% organic growth– 33.7% acquisition growth
• Growth in margins achieved by:– Improved contribution from
Operating EBITA*
25.422.4
9.3
8.5
25
30
35
40
45
50
$m
CAGR 38.3%
43.2
11
Coffey International Development
– Improved pricing– Increased efficiency
• CAGR over past 3 years of 38.3%
22.4
16.311.5
25.4
0
5
10
15
20
25
FY04 FY05 FY06 FY07 FY08
$m
Organic Growth Non Organic Growth
* Pre VEO & SBP
For
per
sona
l use
onl
y

Operating EBITA to cash flow reconciliation
4050
607080
90100
$m 43.29.6 0.9
29.87.2 (4.6) (27.5)
58.6
12
010
203040
OperatingEBITA
IncreasedCreditors from
$100.5morganicrevenue
growth @34.9days
Improvementin creditor
days 34.9 to35.8 days
WIP + Debtorimprovement
exacquisitions
from 100 to 79days (Jun 07 -
Jun 08)
IncreasedCreditors from
acquisitions
IncreasedWIP+Debtors
fromacquisiitons
IncreasedWIP+Debtorsfrom $100.5m
organicrevenue
growth at 100days (Jun 07)
Operatingcash flow
For
per
sona
l use
onl
y
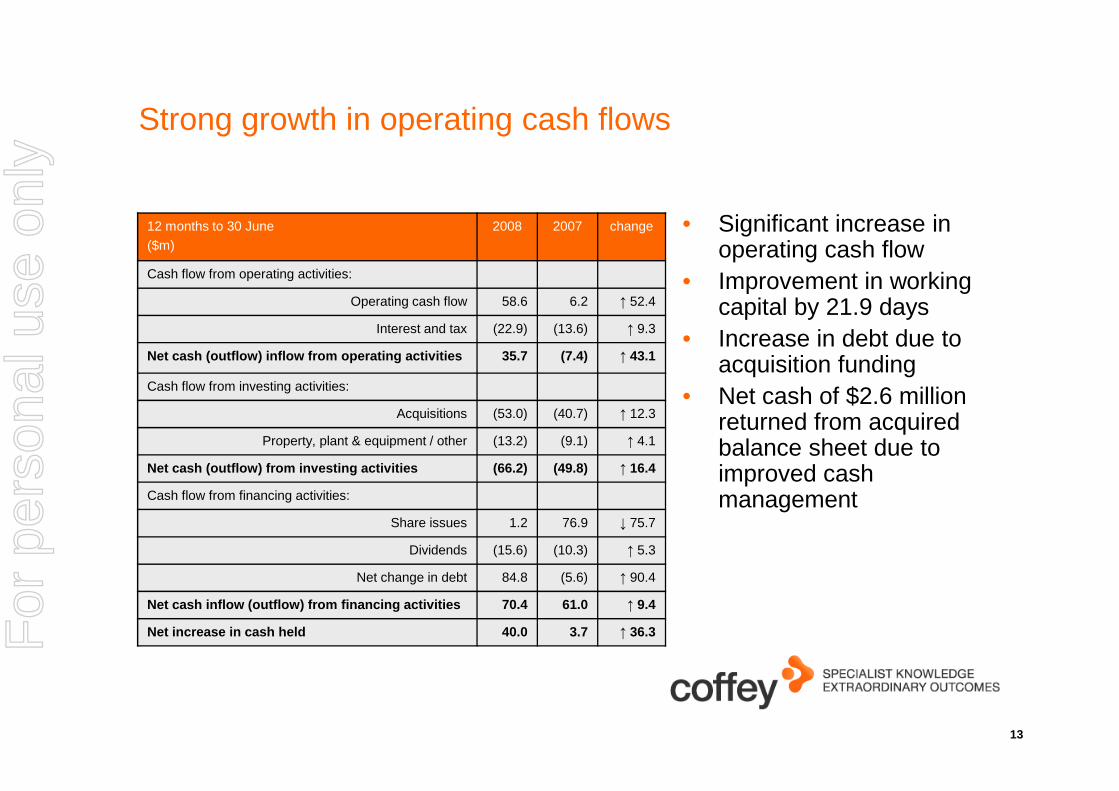
Strong growth in operating cash flows
• Significant increase in operating cash flow
• Improvement in working capital by 21.9 days
• Increase in debt due to acquisition funding
• Net cash of $2.6 million
12 months to 30 June
($m)
2008 2007 change
Cash flow from operating activities:
Operating cash flow 58.6 6.2 ↑ 52.4
Interest and tax (22.9) (13.6) ↑ 9.3
Net cash (outflow) inflow from operating activities 35.7 (7.4) ↑ 43.1
Cash flow from investing activities:
13
• Net cash of $2.6 million returned from acquired balance sheet due to improved cash management
Acquisitions (53.0) (40.7) ↑ 12.3
Property, plant & equipment / other (13.2) (9.1) ↑ 4.1
Net cash (outflow) from investing activities (66.2) (49.8) ↑ 16.4
Cash flow from financing activities:
Share issues 1.2 76.9 ↓ 75.7
Dividends (15.6) (10.3) ↑ 5.3
Net change in debt 84.8 (5.6) ↑ 90.4
Net cash inflow (outflow) from financing activities 70.4 61.0 ↑ 9.4
Net increase in cash held 40.0 3.7 ↑ 36.3For
per
sona
l use
onl
y

Strong balance sheet
• Gearing remains at conservative levels
• New debt facilities put in place in February 2008 increased facility size from $115m to $200m
As at 30 June
($m)
2008 2007
Total Cash 52.4 14.6
Foreign currency denominated debt (A$ equivalent)
35.2 -
A$ denominated debt 111.1 60.7
Total Debt 146.3 60.7
Net Debt 93.9 46.1
14
Net Debt 93.9 46.1
Debt Facilities undrawn 44.5 54.3
Equity 196.1 177.6
Debt Facilities:
% of debt at fixed rate 70% -
% of debt at floating rate 30% 100%
Net Debt to Equity 47.9% 26.0%
Net Debt to Capital 32.4% 20.6%
Interest Cover (EBITA pre VEO & SBP) 5.5 5.2
For
per
sona
l use
onl
y

Dividends
Dividends per share
2.63.5
5.0
7.0 7.06.2
7.0
8.0
8.09.0
0
2
4
6
8
10
12
14
16
18
FY
04
FY
05
FY
06
FY
07
FY
08
cps
• Total dividend paid has consistently grown over the past 5 years to $19.1m
• Average dividend payout ratio FY07 to FY08 – 85.3%
• Average dividend payout ratio FY04 to FY06 – 65.3%
8.810.5
13.015.0 16.0
15
FY
04
FY
05
FY
06
FY
07
FY
08
Interim Dividend Final Dividend
FY04 FY05 FY06 FY07 FY08
Total annual dividend paid ($m)*** 9.0 9.0 9.9 16.5 19.1
Dividend payout ratio* (interim + final)** 67.2% 60.5% 68.3% 93.7% 77.0%
Average payout ratio or period 65.3% 85.3%
*60-80% of NPAT (pre amortisation, vendor earn-out and share-based payment expense)
**Special dividends which have not been included in the above were paid in FY04 (6 cps) & FY05 (2 cps)
*** The dividend reinvestment plan was activated for FY04, FY05, FY06 & FY07
FY04 to FY06 – 65.3%
For
per
sona
l use
onl
y
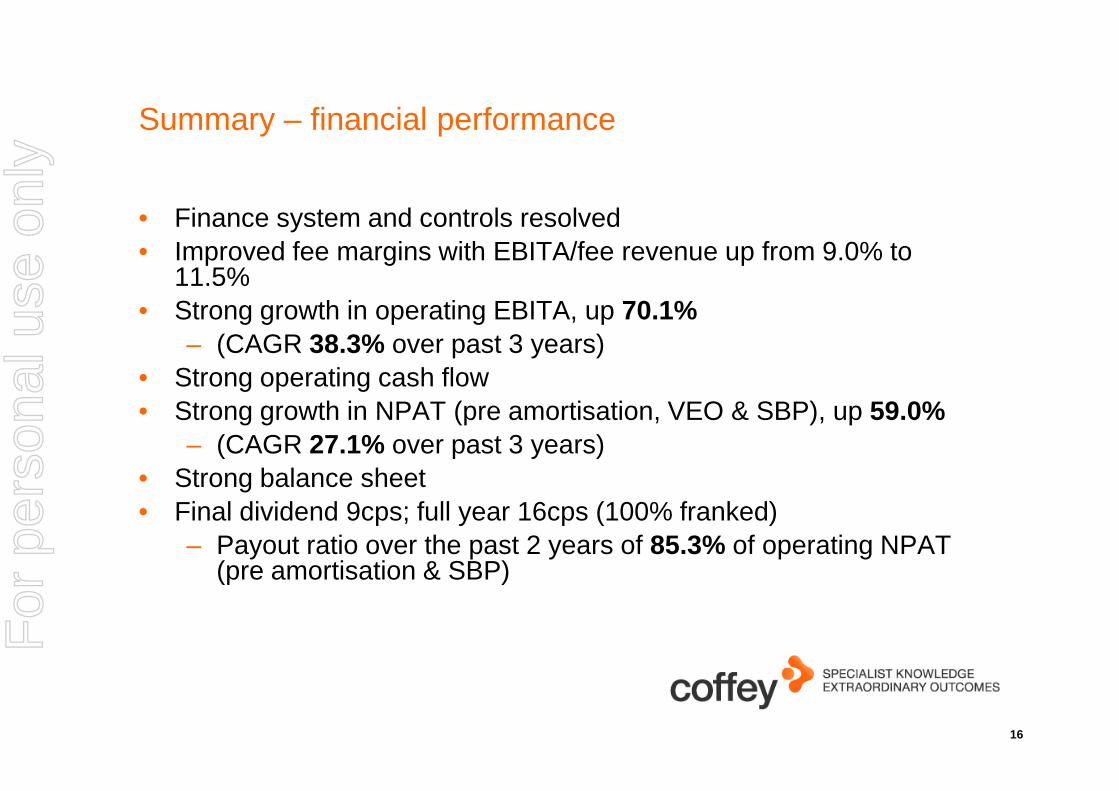
Summary – financial performance
• Finance system and controls resolved• Improved fee margins with EBITA/fee revenue up from 9.0% to
11.5%• Strong growth in operating EBITA, up 70.1%
– (CAGR 38.3% over past 3 years)• Strong operating cash flow
59.0%
16
• Strong growth in NPAT (pre amortisation, VEO & SBP), up 59.0%– (CAGR 27.1% over past 3 years)
• Strong balance sheet• Final dividend 9cps; full year 16cps (100% franked)
– Payout ratio over the past 2 years of 85.3% of operating NPAT (pre amortisation & SBP)
For
per
sona
l use
onl
y
Operational review
Roger Olds, Managing DirectorRoger Olds, Managing Director
For
per
sona
l use
onl
y
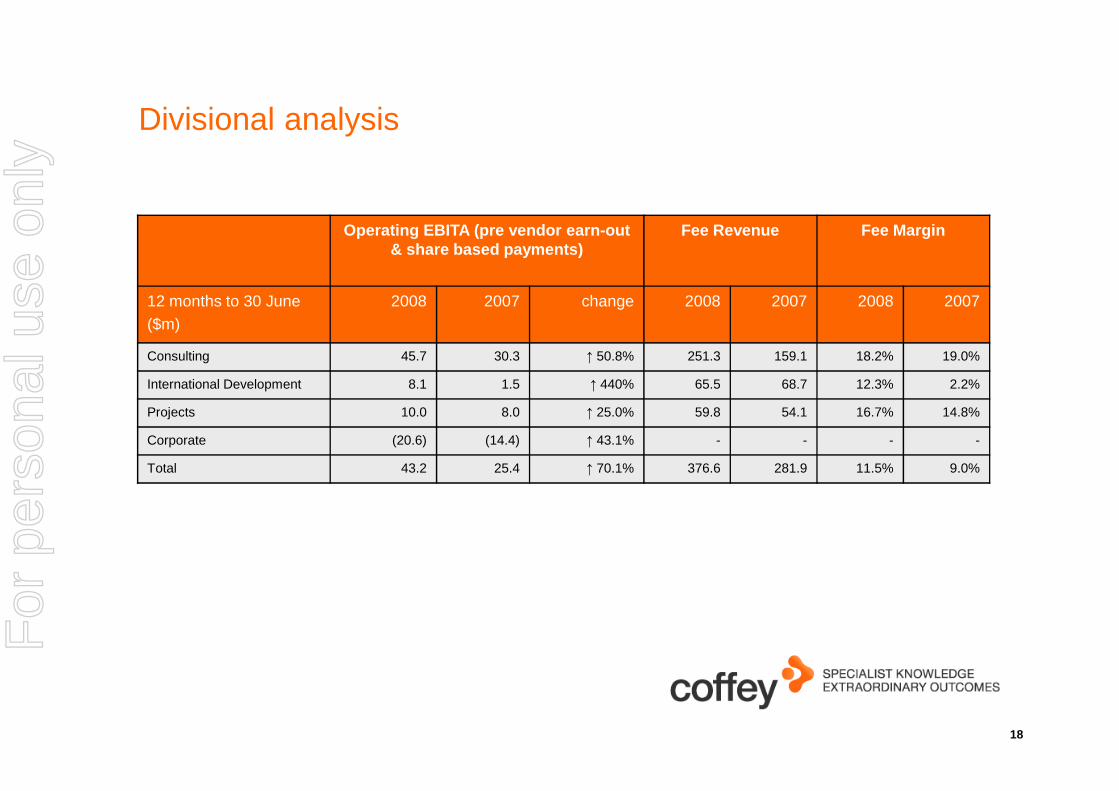
Divisional analysis
Operating EBITA (pre vendor earn-out & share based payments)
Fee Revenue Fee Margin
12 months to 30 June($m)
2008 2007 change 2008 2007 2008 2007
Consulting 45.7 30.3 ↑ 50.8% 251.3 159.1 18.2% 19.0%
International Development 8.1 1.5 ↑ 440% 65.5 68.7 12.3% 2.2%
18
Projects 10.0 8.0 ↑ 25.0% 59.8 54.1 16.7% 14.8%
Corporate (20.6) (14.4) ↑ 43.1% - - - -
Total 43.2 25.4 ↑ 70.1% 376.6 281.9 11.5% 9.0%
For
per
sona
l use
onl
y

Consulting – key highlights
• Coffey Environments– Expansion of capabilities across waste
management, hazardous material services, US remediation engineering, energy and greenhouse gas management
• Coffey Natural Systems– Became a national company in February
2008– Significant projects from clients including
Tarong Energy, Exxon Mobil, Teck Cominco,
Operating EBITA*
20.8
30.2
45.7
25
30
35
40
45
50
$m
Another year of strong growth. Consulting EBITA up 50.8% to $45.7m
CAGR 47.3%
19
Tarong Energy, Exxon Mobil, Teck Cominco, Atlas Iron, Marengo Mining
• Coffey Geotechnics– Key wins across land & marine geotechnical
and hydrogeological studies (Rio Tinto –Weipa & Hunter Valley), testing (Ballina bypass) and geotechnical design (M80 -Glasgow, UK)
– Acquisition in Canada (Shaheen & Peaker)• Coffey Mining
– Acquisition in Brazil (Geoexplore)– Significant projects from clients including BHP
Billiton, Newcrest and Votorantim
9.5
14.3
20.8
0
5
10
15
20
FY04 FY05 FY06 FY07 FY08
* Pre VEO & SBP
For
per
sona
l use
onl
y
Consulting – key highlights (cont.)
• APR– VicTrack level crossings upgrade– Recruitment of new staff to extend and broaden capabilities
• Stratcorp– Further growth and long-term contracts with the AFL & clubs, A-league,
AJC, NSW & Vic Govt.’s
20
AJC, NSW & Vic Govt.’s• Peron
– Major projects work with Vic & QLD Govt.’s
For
per
sona
l use
onl
y

International development – key highlights
• Key wins in FY08 include:– Asia /Pacific: Enterprise challenge
fund, USAID– Europe / Africa / Middle East: Iraq
technical support initiative and UAE challenge fund
– Americas: CIMIENTOS (Columbia), USAID (Sudan)
• Acquisition of MSI in USA advanced our
Operating EBITA*
4.63.8
8.1
4
5
6
7
8
9
$m
An exceptional year. International development EBITA up 440% to $8.1m
CAGR 28.5%
21
• Acquisition of MSI in USA advanced our globalisation and added to EBITA growth
• All geographies have increased profit contribution over the past year
• New 5 year training contracts in the Middle East will be cash positive from the start
• Future growth in Coffey International Development EBITA to be supported by Middle East contracts and a full year of MSI
3.83.0
1.5
0
1
2
3
4
FY04 FY05 FY06 FY07 FY08
$m
* Pre VEO & SBP
For
per
sona
l use
onl
y
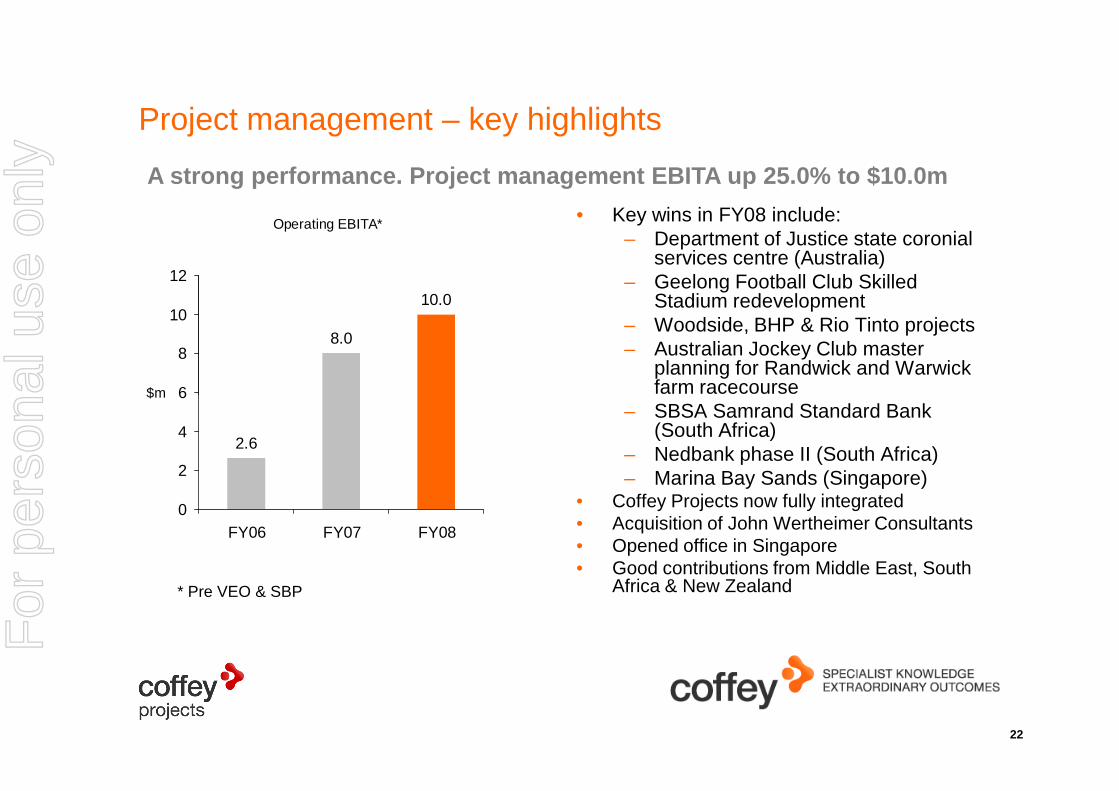
Project management – key highlights
• Key wins in FY08 include:– Department of Justice state coronial
services centre (Australia)– Geelong Football Club Skilled
Stadium redevelopment– Woodside, BHP & Rio Tinto projects– Australian Jockey Club master
planning for Randwick and Warwick farm racecourse
Operating EBITA*
8.0
10.0
6
8
10
12
$m
A strong performance. Project management EBITA up 25.0% to $10.0m
22
farm racecourse– SBSA Samrand Standard Bank
(South Africa)– Nedbank phase II (South Africa)– Marina Bay Sands (Singapore)
• Coffey Projects now fully integrated• Acquisition of John Wertheimer Consultants• Opened office in Singapore • Good contributions from Middle East, South
Africa & New Zealand
2.6
0
2
4
6
FY06 FY07 FY08
$m
* Pre VEO & SBP
For
per
sona
l use
onl
y

Strategy & outlook
Roger OldsRoger OldsManaging Director
For
per
sona
l use
onl
y

Global presence
Europeemployees 110
North Americaemployees 680
24
Africa / Middle Eastemployees 160
Asia / Pacificemployees 2,800
South Americaemployees 440
Note: Our people as at 30 June 08 Total 4,200 (2,500 in 07)
For
per
sona
l use
onl
y

We operate in high demand sectors
• Group revenue split in FY08 approximately:
– Infrastructure (45%)– Resources (30%)– International development (15%)– Property (10%)
• The acquisitions during FY08 increased our exposures in:
Coffey group revenue by sector
45%
15%
10%Infrastructure
Resources
Internationaldevelopment
25
increased our exposures in:– Infrastructure (APR, Stratcorp,
Peron, Teal Management Services, Shaheen & Peaker)
– Resources (Geoexplore, NS Consultancy)
– International Development (MSI)– Property (JWC)
30%
developmentProperty
For
per
sona
l use
onl
y
We operate in markets with attractive fundamentals
• Our specialist sectors are seeing continued strong investment
• Recessionary pressures impacting consumer spending patterns, but not impacting our sectors
• Resources expenditure is still being driven by high demand
• Increased infrastructure spend globally
26
• Increased infrastructure spend globally
• International development sector experiencing increased expenditure
For
per
sona
l use
onl
y

We have excellent growth prospects
• Organic– Increasing demand for our specialist services– Staff attracted to the specialist model– Expanding clients and staff numbers with global spread– Increasing focus on servicing clients with our multi-specialist services
• Acquisition– Strategic acquisitions will continue to support expansion and diversification– Pipeline of acquisitions in place– Cautious of the cost of equity and supply of debt
• Transformational – One Coffey: aligning our global culture & capabilities
27
• Transformational – One Coffey: aligning our global culture & capabilities– Platform for Growth; a global transformation strategy
• Aligning vision, strategy, culture and operational excellence through all of Coffey
• 7 programmes designed to drive short-term performance and long-term growth
– Coffey Institute launched: an advanced education provider to our industries– Financial excellence program: training our people– Leadership program: embedding the Coffey way– One Coffey Safe and Healthy programme launchedFor
per
sona
l use
onl
y

Looking forward• A new global management structure – 6 new executive positions• Continued strong growth in revenues
– Leveraging global footprint, resources and clients– Full year from FY08 acquisitions– Cross selling opportunities for larger clients
• Further fee margin improvements– Cost efficiencies; eg insurance; travel; purchasing– Prices increase with salary increases– Larger clients and larger projects improve utilisations
28
– Larger clients and larger projects improve utilisations– Financial management and controls and common systems – Less integration compared to past years
• Continued investment to support sustainable growth• 3 year goal set in June 05 met in Q4 FY08
– Operating EBITA (pre VEO & SBP) of $6m per month– Challenge to now deliver over full 12 months, given historical seasonality– July 08 is significantly better than past few years
• Strong cashflow will support ongoing growth plansFor
per
sona
l use
onl
y
Summary
• FY08 has delivered strong growth• The key markets we operate in have very attractive fundamentals• Our multi-specialist model is a key differentiator – for clients and
staff• Our diversification strategy–geography, sector and service–positions
us for strong growth whilst reducing risk
29
us for strong growth whilst reducing risk• Our strong balance sheet allows us to pursue attractive acquisition
opportunities as they arise (10 in FY08 and 27 over the past 3 years)
• We are well positioned to grow shareholder value
For
per
sona
l use
onl
y

Questions and answers
For
per
sona
l use
onl
y

Appendix
For
per
sona
l use
onl
y

Restatement of FY07 earnings
• Adjustment to Consulting relates to the Australian environments (80%), geotechnics (15%) and mining (5%) businesses
• International development adjustment due to non recovery under a sale agreement
12 months to 30 June
$m
2007 (Restated)
2007 (Previous)
change
Revenue
Consulting 213.7 219.3 ↓5.6
Projects 55.6 55.6 -
International Development 92.9 92.9 -
Inter Segment Eliminations 0.5 0.5 -
32
under a sale agreement • Cause of adjustment was:
– Not related to projects or overseas businesses
– Concurrent integration of acquired businesses & finance systems
Inter Segment Eliminations 0.5 0.5 -
Total 362.7 368.3 ↓6.3
EBITA (pre SBP)
Consulting 30.2 36.3 ↓6.1
Projects 8.1 8.1 -
International Development 1.5 2.0 ↓0.5
Corporate (14.4) (14.4) -
Total 25.4 32.0 ↓6.6
For
per
sona
l use
onl
y
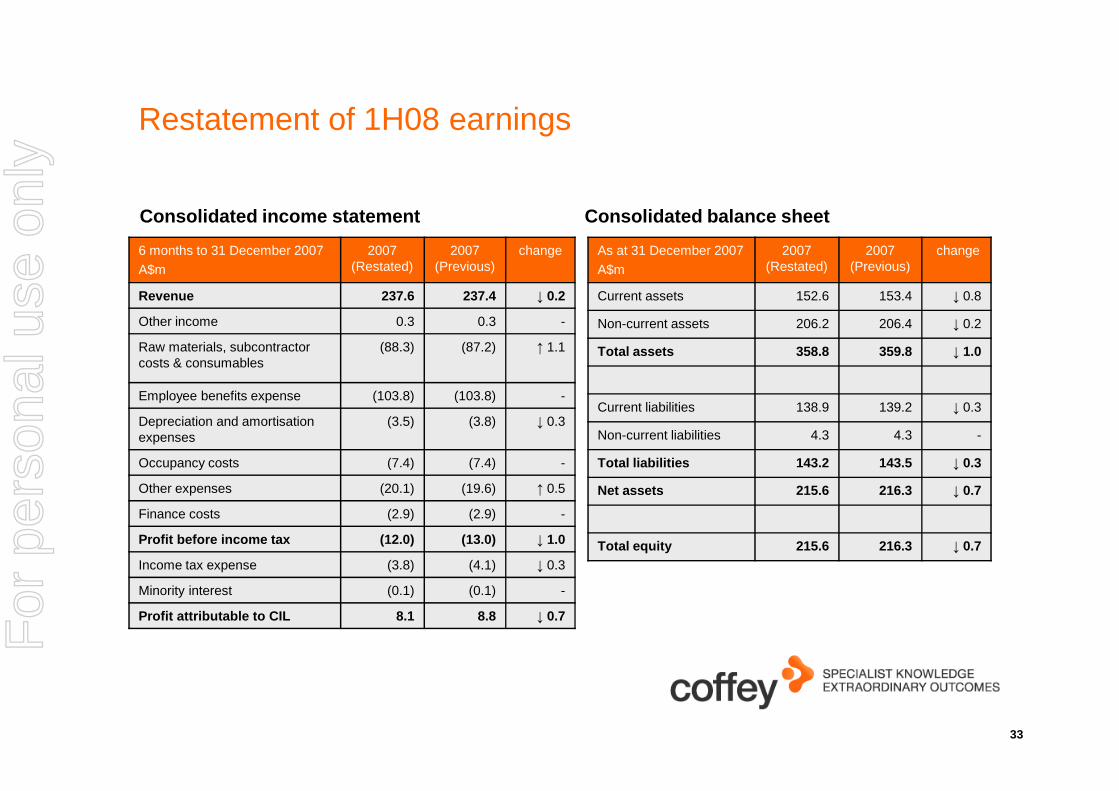
Restatement of 1H08 earnings
As at 31 December 2007
A$m
2007 (Restated)
2007 (Previous)
change
Current assets 152.6 153.4 ↓ 0.8
Non-current assets 206.2 206.4 ↓ 0.2
Total assets 358.8 359.8 ↓ 1.0
6 months to 31 December 2007
A$m
2007 (Restated)
2007 (Previous)
change
Revenue 237.6 237.4 ↓ 0.2
Other income 0.3 0.3 -
Raw materials, subcontractor costs & consumables
(88.3) (87.2) ↑ 1.1
Employee benefits expense (103.8) (103.8) -
Consolidated income statement Consolidated balance sheet
33
Current liabilities 138.9 139.2 ↓ 0.3
Non-current liabilities 4.3 4.3 -
Total liabilities 143.2 143.5 ↓ 0.3
Net assets 215.6 216.3 ↓ 0.7
Total equity 215.6 216.3 ↓ 0.7
Employee benefits expense (103.8) (103.8) -
Depreciation and amortisation expenses
(3.5) (3.8) ↓ 0.3
Occupancy costs (7.4) (7.4) -
Other expenses (20.1) (19.6) ↑ 0.5
Finance costs (2.9) (2.9) -
Profit before income tax (12.0) (13.0) ↓ 1.0
Income tax expense (3.8) (4.1) ↓ 0.3
Minority interest (0.1) (0.1) -
Profit attributable to CIL 8.1 8.8 ↓ 0.7
For
per
sona
l use
onl
y
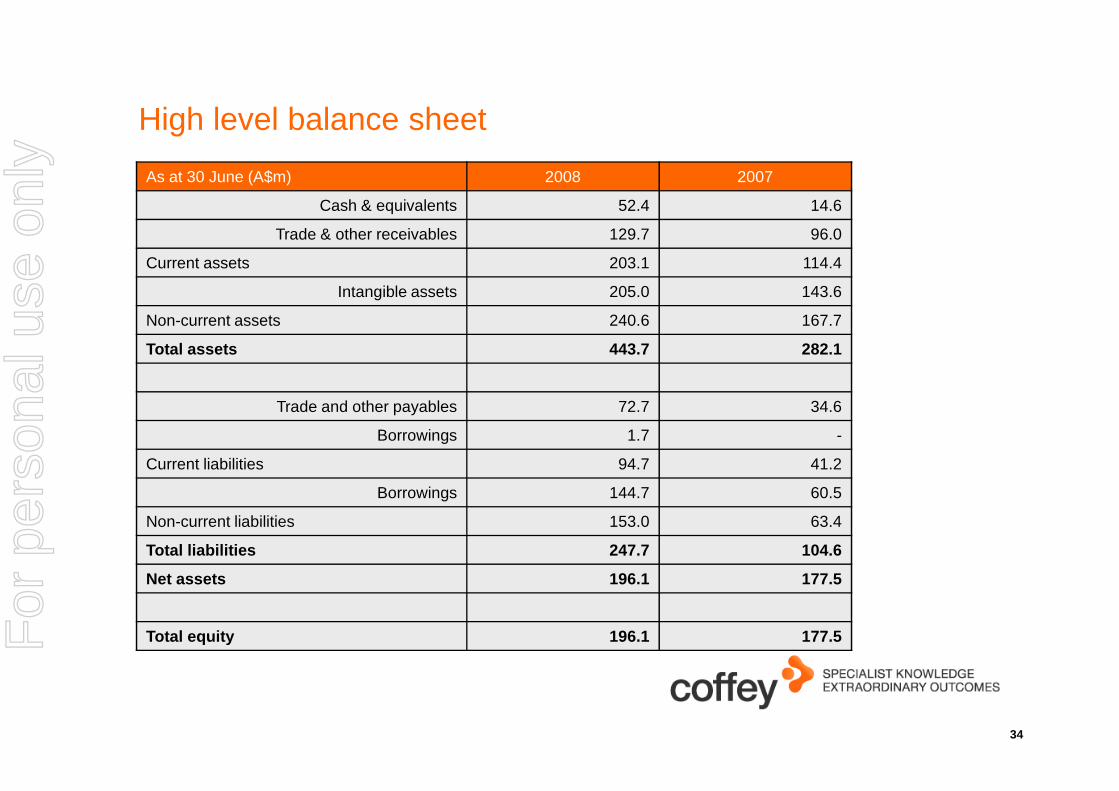
High level balance sheet
As at 30 June (A$m) 2008 2007
Cash & equivalents 52.4 14.6
Trade & other receivables 129.7 96.0
Current assets 203.1 114.4
Intangible assets 205.0 143.6
Non-current assets 240.6 167.7
Total assets 443.7 282.1
34
Trade and other payables 72.7 34.6
Borrowings 1.7 -
Current liabilities 94.7 41.2
Borrowings 144.7 60.5
Non-current liabilities 153.0 63.4
Total liabilities 247.7 104.6
Net assets 196.1 177.5
Total equity 196.1 177.5For
per
sona
l use
onl
y
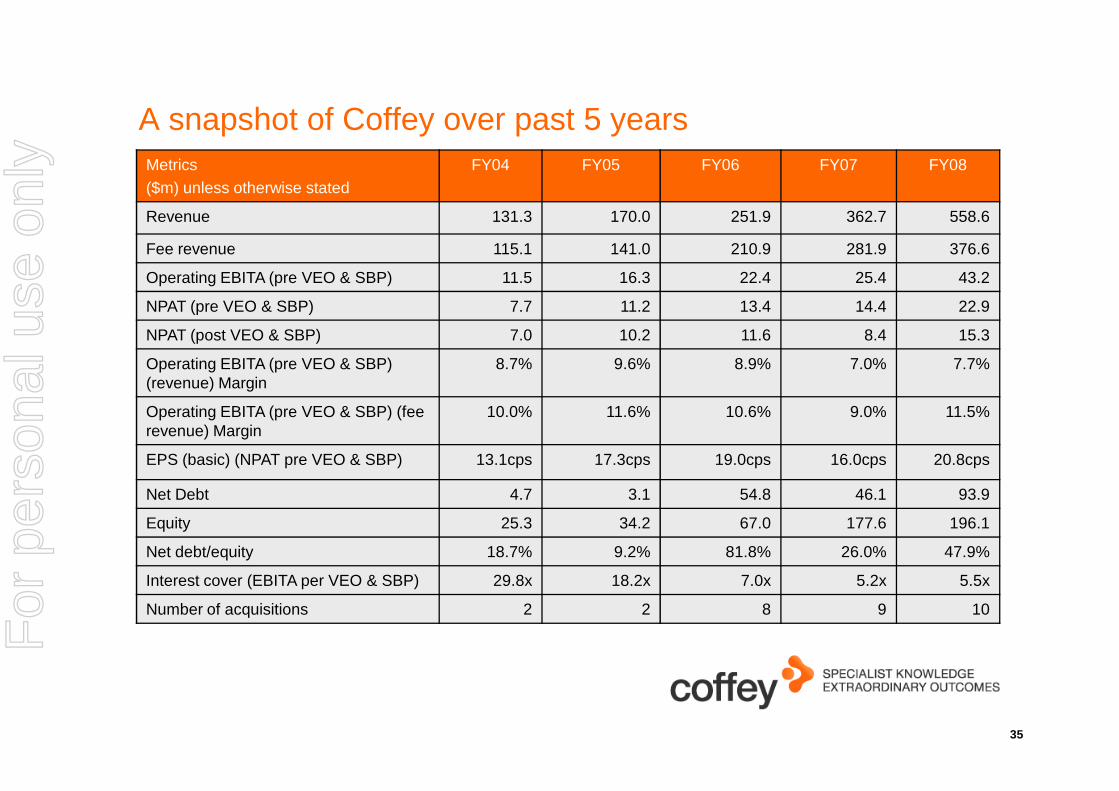
A snapshot of Coffey over past 5 yearsMetrics($m) unless otherwise stated
FY04 FY05 FY06 FY07 FY08
Revenue 131.3 170.0 251.9 362.7 558.6
Fee revenue 115.1 141.0 210.9 281.9 376.6
Operating EBITA (pre VEO & SBP) 11.5 16.3 22.4 25.4 43.2
NPAT (pre VEO & SBP) 7.7 11.2 13.4 14.4 22.9
NPAT (post VEO & SBP) 7.0 10.2 11.6 8.4 15.3
Operating EBITA (pre VEO & SBP) (revenue) Margin
8.7% 9.6% 8.9% 7.0% 7.7%
35
Operating EBITA (pre VEO & SBP) (fee revenue) Margin
10.0% 11.6% 10.6% 9.0% 11.5%
EPS (basic) (NPAT pre VEO & SBP) 13.1cps 17.3cps 19.0cps 16.0cps 20.8cps
Net Debt 4.7 3.1 54.8 46.1 93.9
Equity 25.3 34.2 67.0 177.6 196.1
Net debt/equity 18.7% 9.2% 81.8% 26.0% 47.9%
Interest cover (EBITA per VEO & SBP) 29.8x 18.2x 7.0x 5.2x 5.5x
Number of acquisitions 2 2 8 9 10
For
per
sona
l use
onl
y

Disclaimer
The material in this presentation is a summary of the results of Coffey International Limited (Coffey) for the 12 months ended 30 June 2008 and an update on Coffey’s activities and is current at the date of preparation, 28 August 2008. Further details are provided in the Company’s full year accounts and results announcement released on 28 August 2008.
No representation, express or implied, is made as to the fairness, accuracy, completeness or correctness of information contained in this presentation, including the accuracy, likelihood of achievement or reasonableness of any forecasts, prospects, returns or statements in relation to future matters contained in the presentation (“forward-looking statements”). Such forward-looking statements are by their nature subject to significant uncertainties and contingencies and are based on a number of estimates and assumptions that are subject to change (and in many cases are outside the control of Coffey and its Directors) which may cause the actual results or performance of Coffey to be materially different from any future results or performance expressed or implied by such forward-looking statements.
36
different from any future results or performance expressed or implied by such forward-looking statements.
This presentation provides information in summary form only and is not intended to be complete. It is not intended to be relied upon as advice to investors or potential investors and does not take into account the investment objectives, financial situation or needs of any particular investor.
Due care and consideration should be undertaken when considering and analysing Coffey’s financial performance. All references to dollars are to Australian Dollars unless otherwise stated.
To the maximum extent permitted by law, neither Coffey nor its related corporations, Directors, employees or agents, nor any other person, accepts any liability, including, without limitation, any liability arising from fault or negligence, for any loss arising from the use of this presentation or its contents or otherwise arising in connection with it. This presentation should be read in conjunction with other publicly available material. Further information including historical results and a description of the activities of Coffey is available on our website, www.coffey.com
For
per
sona
l use
onl
y