For personal use only - ASX2014/09/26 · sell Lions Square, located in Saitama prefecture, Greater...
76
ANNUAL REPORT 2014 GALILEO JAPAN TRUST (ARSN 122 465 990) For personal use only
Transcript of For personal use only - ASX2014/09/26 · sell Lions Square, located in Saitama prefecture, Greater...
ANNUAL REPORT 2014 GALILEO JAPAN TRUST (ARSN 122 465 990)
For
per
sona
l use
onl
y

HIE
I KU
DA
N
For
per
sona
l use
onl
y

Galileo Japan Trust (the Trust) is listed
on the Australian Securities Exchange,
with an indirect interest in a portfolio
of 21 Japanese real estate investments
valued at approximately ¥58.5 billion
(approximately $613 million1).
The portfolio is diversified by
both sector and geography,
with a bias towards office and
the Greater Tokyo region.
Galileo Japan Funds Management
Limited (GJFML) is the responsible
entity of the Trust. Asset management
services in Japan are undertaken by
Galileo Japan K.K. and Tokyo Capital
Management Co. Ltd (a wholly owned
subsidiary of Nippon Kanzai Co. Ltd).
CONTENTS
MANAGERS’ REPORT 2
PORTFOLIO OVERVIEW 5
PORTFOLIO DETAIL 10
MANAGEMENT TEAM 18
CORPORATE GOVERNANCE 21
INVESTOR RELATIONS 27
GALILEO JAPAN TRUST
1 Based on a ¥/A$ exchange rate of 95.43 on 30 June 2014.
1
GALILEO JAPAN TRUST
For
per
sona
l use
onl
y

MA
NA
GER
S’RE
PORT
SEIS
HIN
2
For
per
sona
l use
onl
y

ANNUAL RESULTS FY14MANAGERS REPORT
On 10 October 2013 a recapitalisation was completed
which raised $147.5 million (“Recapitalisation”) with
distributions to unitholders reinstated from that date.
The Japanese TK Business and Galileo Japan Trust (“GJT”
or “Trust”) refinanced all existing loans as part of the
Recapitalisation which resulted in:
i. A reduction in gearing from 81.9% to 58.2%
ii. A reduction in the weighted average cost of debt
from 4.5% to 2.7%; and
iii. An increase in the average loan maturity profile from
0.7 years to 5.3 year
FINANCIAL PERFORMANCE
Funds from operations (“FFO”)1 of $14.3 million for the
year ended 30 June 2014, vs the prior corresponding
period (“pcp”) of $8.8 million reflects the reduction in
overall borrowing costs as a result of the Recapitalisation.
Following the Recapitalisation, distributions were reinstated
to GJT unitholders. An interim distribution of 3.5 cents
per unit (“cpu”) was paid on 28 February 2014. A final
distribution of 7.0 cpu paid on or about 29 August 2014,
bringing the total distribution to 10.5 cpu, which is 100%
tax deferred. This equates to an annualised yield of 9.7%
for the period from the Recapitalisation to 30 June 2014
on the issue price of $1.50 per unit. The EM had forecast a
distribution of 10.9 cpu. The lower $A distribution was due
to an adverse movement in the AUDJPY exchange rate.
Chief Operating Officer, Mr Peter Murphy said, “We are
pleased that post the recapitalisation in October 2013
GJT has performed in line with forecast. The annualised
total return to new investors who participated in the
recapitalisation has been 15.7% to 30 June 2014 and
23.0% if calculated to 27 August 2014. The Japanese real
estate market continues to show signs of improvement in
terms of vacancy, rent growth and lending conditions.”
BALANCE SHEET
The Trust’s Net Asset Value (“NAV”) at 30 June 2014 was
$2.19 per unit vs $2.15 per unit at 31 December 2013.
The increase in NAV compared to 31 December 2013 is
due to the property revaluation uplift, partly offset by an
adverse movement in the AUDJPY exchange rate as at 30
June 2014. A comparison with 30 June 2013 is of less
relevance due to the Recapitalisation.
GJT’s gearing (debt/total assets) was 56.4% at 30 June 2014,
lower than 31 December 2013 (57.5%) due to the property
revaluation uplift. The Japanese TK Business has two sources
of debt, being a senior loan facility and Eurobonds on issue.
Neither debt instrument has any loan to value covenant tests.
The senior loan has a debt service coverage ratio (DSCR) test
of 1.7 times, which is tested on a quarterly basis. For the June
2014 quarter the DSCR was 2.3 times.
PROPERTY REVALUATIONS
The value of the portfolio was ¥58.50 billion at 30 June
2014, an increase of 1.9% vs 30 June 2013 (¥57.38
billion). The 30 June 2014 value includes independent
valuations for nine properties, representing approximately
36% of the portfolio by value, with Directors’ valuations
for the remainder. In aggregate, the independent
appraisals completed at 30 June 2014 represent a value of
¥20.84 billion, 1.46% higher than the 31 December 2013
book value for the same nine assets (¥20.54 billion).
The weighted average capitalisation rate for the portfolio
was 5.9% at 30 June 2014 compared to 6.1% at 30 June
2013. Over the last year capitalisation rates have firmed,
most noticeably for the central Tokyo office and residential
properties.
PORTFOLIO PERFORMANCE
At 30 June 2014 portfolio occupancy was 98.8% (99.0%
at June 2013). Portfolio occupancy has averaged 97.7%
since GJT listed in December 2006.
FY14 Net Property Income (“ NOI”) was 5.8% lower
than FY13 on a like for like basis. This reduction in NOI
was included in the EM forecast and outlined in the
Recapitalisation presentation dated 9 September 2013 (slide
7). The key drivers for the reduction in portfolio NOI were:
i. Lease renegotiation for the major tenant (Don
Quijote) at La Park Kishiwada including:
a. Cancellation of Level 2 (12,437 square metres),
effective 1 July 2013. This area has now been
re-leased however NOI is lower primarily due
to operating expenses previously paid directly
by Don Quijote now being paid directly by the
owner; and
b. A reduction in rentable floor space after Level 2
was re-leased to multiple tenancies.
ii. Vacancies in two office assets during FY14
(Takadanobaba and Hiei Kudan). Both these assets
were 100% leased by 30 June 2014.
1 FFO represents net profit attributable to unitholders adjusted for unrealised gains and losses, asset sales, debt forgiveness and amortisation expense
2 37% at 30 June 2013
3 11.9 years at 30 June 2013
3
GALILEO JAPAN TRUST
For
per
sona
l use
onl
y
The proportion of the portfolio represented by “non-
cancellable” leases is currently 39%2 (by income) with
the weighted average lease term to maturity on these
leases being approximately 10.9 years3. The balance of the
portfolio (61% by income) is subject to standard Japanese
leases which can be terminated with six months’ notice.
ASSET SALE
The Japanese TK Business entered into a contract to
sell Lions Square, located in Saitama prefecture, Greater
Tokyo for ¥2.385 billion on 25 June 2014. The sale price
represented a 32.5% premium to the previous reported
book value (¥1.80 billion at 31 December 2013). Financial
close occurred on 23 July 2014 with the net proceeds
released to GJT being approximately $6.2 million.
GJT ON-MARKET BUYBACK
On 22 August 2014 Galileo Japan Funds Management
Limited (“GJFML”, “the Responsible Entity”), GJFML
announced its intention to undertake an on-market
buyback of GJT units. The buyback will be funded through
the net proceeds released from the recent sale of Lions
Square.
Should market conditions permit, GJT intends to buy-back
up to the lesser of $5 million worth of units, and 10% of
the Trust’s current issued capital (refer ASX announcement
dated 22 August 2014). GJFML reserves the right to
amend, suspend or terminate the buy-back at any time,
and there is no guarantee that GJFML will repurchase the
full value of, or any of, the units referred to above.
OUTLOOK
The Recapitalisation of the Trust and Japanese TK Business
significantly reduced gearing and stabilised the Trust’s
capital structure.
The Japanese TK Business continues to explore
opportunities to enhance value through:
i. Potential sale of non-core assets where an
opportunity exists to recycle capital to enhance
portfolio characteristics or to facilitate other capital
management initiatives; and
ii. Increasing portfolio NOI as market conditions
improve.
As the Trust has no foreign currency hedges in place it’s A$
earnings are sensitive to changes in the AUDJPY exchange
rate. Since the Recapitalisation the A$ has strengthened.
The average exchange rate used for the conversion
of Japanese Yen earnings into A$ for the period from
Recapitalisation to 30 June 2014 was 93.58. The new
equity from the Recapitalisation was translated at a rate of
91.3. This adverse movement in currency was the primary
factor resulting in distributions from Recapitalisation to 30
June 2014 being 10.5 cpu (3.7% lower than EM forecast
of 10.9 cpu).
Looking forward, FY15 earnings will continue to be
sensitive to AUDJPY exchange rate movements and GJFML
notes that the A$ has continued to strengthen since
30 June 2014 with the total adverse movement since
Recapitalisation now in the order of 6.2% (91.3 vs 97.0).
GJFML believes the Japanese TK Business is well placed
to continue to deliver stable Japanese yen earnings. For
the year ending 30 June 2015, Japanese yen earnings are
expected to be broadly in line with the results reported for
the period from Recapitalisation to 30 June 2014 on an
annualised basis, adjusted for the sale of Lions Square in
July 2014. On a stand-alone basis the sale of Lions Square
is accretive to GJT’s NAV by approximately ¥585 million
(5.8 cpu), however, dilutes FY15 Japanese yen earnings by
approximately ¥85 million (0.8 cpu).
Assuming a fixed AUDJPY exchange rate of 95.4 being the
applicable rate at 30 June 2014 and adjusting for the sale
of Lions Square GJFML provides FY15 distribution guidance
of 13.5 cpu.
Future A$ distributions will continue to be subject to
movements in the AUDJPY exchange rate.
We would like to thank you for your continued support.
Neil Werrett
Managing Director & Chief Executive Officer
Galileo Japan Funds Management Limited
Peter Murphy
Chief Operating Officer
Galileo Japan Funds Management Limited
MA
NA
GER
S’
REPO
RT
GALILEO JAPAN TRUST
4
For
per
sona
l use
onl
y

PORT
FOLI
OO
VER
VIE
WGalileo Japan Trust has an indirect beneficial interest in 21 properties valued at approximately ¥58.5 billion ($613 million).
AZA
BU
AM
EREX
5
For
per
sona
l use
onl
y

Fukuoka
Kobe
Osaka
Tokyo
Shiga
Chiba
Sapporo
Saitama
14
11
121716
818
10
9
19
TOKYO15
2021
23
5
6
71
4
13
Kawaguchi-shi
Shinjuku-ku
Minato-ku
Taito-ku
Chiyoda-ku
Chuo-ku
Itabashi-ku
TOKYO BAY
SAITAMA
CHIBA
KANAGAWA
Funabashi-shi
Shiroi-shi
Shibuya-ku
Haneda Airport
NaritaAirport
SHINJUKU STATION
IKEBUKURO STATION
TOKYO STATION
SHINAGAWA STATION
UENO STATION
JAPAN
PORTFOLIO OVERVIEW
Our locationsGalileo Japan Trust has an indirect interest in 21 properties throughout Japan with a bias to Tokyo where 11 of the 21 assets are located.
21 PropertiesNRA – 209,166 sqmOccupancy by area 98.8%In summary
1 Greater Tokyo comprises of the metropolitan prefecture of Tokyo and the three neighbouring prefectures being Saitama, Kanagawa and Chiba.
GEOGRAPHICAL SPLIT BY VALUE
• Central and Greater Tokyo1 50%
• Osaka 18%
• Fukuoka 13%
• Kobe 3%
• Sapporo 2%
• Kumamoto 7%
• Shiga 7%
SECTOR SPLIT BY VALUE
• Of�ce 40%
• Residential 13%
• Industrial 4%
• Mixed Use 6%
• Retail/Leisure 37%
GALILEO JAPAN TRUST
6
For
per
sona
l use
onl
y

Fukuoka
Kobe
Osaka
Tokyo
Shiga
Chiba
Sapporo
Saitama
14
11
121716
818
10
9
19
TOKYO15
2021
23
5
6
71
4
13
Kawaguchi-shi
Shinjuku-ku
Minato-ku
Taito-ku
Chiyoda-ku
Chuo-ku
Itabashi-ku
TOKYO BAY
SAITAMA
CHIBA
KANAGAWA
Funabashi-shi
Shiroi-shi
Shibuya-ku
Haneda Airport
NaritaAirport
SHINJUKU STATION
IKEBUKURO STATION
TOKYO STATION
SHINAGAWA STATION
UENO STATION
JAPAN
Fukuoka
Kobe
Osaka
Tokyo
Shiga
Chiba
Sapporo
Saitama
14
11
121716
818
10
9
19
TOKYO15
2021
23
5
6
71
4
13
Kawaguchi-shi
Shinjuku-ku
Minato-ku
Taito-ku
Chiyoda-ku
Chuo-ku
Itabashi-ku
TOKYO BAY
SAITAMA
CHIBA
KANAGAWA
Funabashi-shi
Shiroi-shi
Shibuya-ku
Haneda Airport
NaritaAirport
SHINJUKU STATION
IKEBUKURO STATION
TOKYO STATION
SHINAGAWA STATION
UENO STATION
JAPAN
1 SEISHIN2 KANDA NK3 TSUKASACHO4 TAKADANOBABA ACCESS5 AZABU AMEREX6 SHIN-YOKOHAMA NARA7 HIEI KUDAN8 DOSHOUMACHI GOTO9 LA PARK KISHIWADA
SHOPPING CENTRE10 SUROY MALL, CHIKUSHINO11 SUROY MALL, NAGAMINE12 SEIYU MINAKUCHI13 LIONS SQUARE14 CONFOMALL15 SHIROI16 MATSUYA RESIDENCE SEKIME 17 ROYALHILL SANNOMIYA II 18 IMAZATO 19 PREJEAL UTSUBO PARK 20 FUNABASHI HIDAN21 FUNABASHI TESCO
GALILEO JAPAN TRUST
Office Portfolio
Retail/Mixed Use Portfolio
Residential Portfolio
Industrial Portfolio
8 properties 6 properties 5 properties 2 properties
NRA – 26,398 sqm
NRA – 130,996 sqm
NRA – 39,197 sqm
NRA – 12,575 sqm
40% of total portfolio by value
43% of total portfolio by value
13% of total portfolio by value
4% of total portfolio by value
34% of total portfolio by income
47% of total portfolio by income
14% of total portfolio by income
5% of total portfolio by income
Occupancy by area 99.1%
Occupancy by area 98.9%
Occupancy by area 97.7%
Occupancy by area 100.0%
7
For
per
sona
l use
onl
y

Portfolio SummaryNO. BUILDING NAME ADDRESS LOCATION
DATE ACQUIRED
AGE (YEARS)
NET RENTABLE AREA (TSUBO)
NET RENTABLE AREA (SQM)2
CARRYING VALUE AS AT
30 JUNE 20141 % OF
PORTFOLIO
LEASED AREA AT
30 JUNE 2013
LEASED AREA AT
30 JUNE 2014
GROSS PASSING RENT
(¥/MONTH/TSUBO)
GROSS MARKET RENT
(¥/MONTH/TSUBO)1
PROBABLE MAXIMUM
LOSS (PML)3
OFFICE1 Seishin 2-5-10 Shinjuku, Shinjuku-ku Tokyo Dec 2006 25 1,699 5,617 7.13 12.2% 100.0% 100.0% 19,253 21,069 11.4%
2 Kanda NK 2-7-2 Sudacho Kanda, Chiyoda-ku Tokyo Dec 2006 23 1,027 3,394 3.44 5.9% 100.0% 100.0% 17,808 17,944 10.5%
3 Tsukasacho 2-6 Kanda Tsukasa-Machi, Chiyoda-ku Tokyo Dec 2006 26 983 3,251 3.40 5.8% 100.0% 100.0% 17,049 17,500 11.3%
4 Takadanobaba Access 2-20-15 Nishiwaseda, Shinjuku-ku Tokyo Dec 2006 20 1,117 3,691 3.13 5.4% 100.0% 100.0% 12,924 15,042 7.9%
5 Azabu Amerex 3-5-7 Azabudai, Minato-ku Tokyo Dec 2006 26 676 2,233 1.88 3.2% 100.0% 89.5% 14,055 14,723 11.3%
6 Shin-Yokohama Nara 2-2-8 Shin Yokohama, Kouhoku-ku, Yokohama-shi Kanagawa Jan 2008 22 1,225 4,050 1.73 3.0% 94.7% 100.0% 9,427 9,174 11.1%
7 Hiei Kudan 3-8-11 Kudan-minami, Chiyoda-ku Tokyo Dec 2006 23 695 2,299 1.78 3.0% 100.0% 100.0% 15,129 17,000 10.1%
8 Doshoumachi 2-2-6 Doshoumachi, Chuo-ku Osaka Dec 2006 25 564 1,863 0.70 1.2% 91.8% 100.0% 8,667 9,000 11.5%
Total/Average Office3 24 7,986 26,398 23.19 39.7% 98.6% 99.1% 14,857 15,817
RETAIL/LEISURE9 La Park Kishiwada4 21-1 Harakiwakamatsu-cho, Kishiwada-shi Osaka Jul 2007 20 14,730 48,693 6.47 11.1% 99.7% 97.8% 4,128 4,128 11.1%
10 Suroy Mall, Chikushino 836-4 Oaza Harada, Chikushino-shi Fukuoka Jul 2007 7 9,728 32,160 7.38 12.6% 100.0% 100.0% 5,093 5,067 5.7%
11 Suroy Mall, Nagamine 1-5-1 Nagamine Nishi, Kumamoto-shi Kumamoto Sep 2007 7 3,811 12,598 3.98 6.8% 99.3% 99.5% 6,675 6,616 10.9%
12 Seiyu Minakuchi 6084-1 Minakuchi, Minakuchi-cho, Koga-shi Shiga Jul 2007 15 7,204 23,815 3.87 6.6% 100.0% 100.0% 2,863 2,863 8.5%
Total/Average Retail/Leisure3 12 35,473 117,266 21.70 37.1% 99.8% 99.0% 4,410 4,396
MIXED USE13 Lions Square 2-15-3 Motogo, Kawaguchi-shi, Saitama Dec 2006 15 2,356 7,790 2.39 4.1% 100.0% 100.0% 4,796 4,797 13.4%
14 Confomall 1005-4 Minami 4 jyo Nishi 10 Chome, Chuo-ku, Sapporo-shi Sapporo Dec 2006 10 1,797 5,940 1.35 2.3% 97.9% 95.8% 5,804 5,983 2.8%
Total/Average Mixed Use3 14 4,153 13,730 3.74 6.4% 99.1% 98.2% 5,232 5,310
RESIDENTIAL15 Shiroi 151-2 Fuji, Shiroi-shi Chiba Dec 2006 19 6,619 21,881 2.30 3.9% 99.0% 99.0% 3,470 3,400 10.6%
16 Matsuya Residence Sekime 6-6-24 Sekime, Jyoto-ku Osaka Dec 2006 25 2,350 7,767 2.06 3.5% 94.6% 95.4% 5,802 5,755 11.8%
17 Royalhill Sannomiya II Kobe 3-5-11 Kanoucho, Chuo-ku Kobe Dec 2006 10 977 3,231 1.49 2.5% 93.6% 92.3% 9,758 9,769 11.0%
18 Imazato 6-11-17 Shin-Imazato, ikuno-ku Osaka Dec 2006 23 1,411 4,663 0.97 1.7% 91.1% 100.0% 4,739 5,000 12.2%
19 Prejeal Utsubo Park 2-4-6 Utsubo Honsho, Nishi-ku Osaka Dec 2006 9 500 1,655 0.81 1.4% 97.0% 95.5% 9,860 9,763 13.9%
Total/Average Residential3 17 11,857 39,197 7.63 13.0% 96.7% 97.7% 4,871 4,851
INDUSTRIAL20 Funabashi Hidan 606-11 Suzumi-cho, Funabashi-shi Chiba Dec 2006 10 2,523 8,341 1.51 2.6% 100.0% 100.0% 4,056 3,900 5.9%
21 Funabashi Tesco 631-13 Toyotomi-cho, Funabashi-shi Chiba Dec 2006 12 1,281 4,234 0.73 1.2% 100.0% 100.0% 3,800 4,000 11.3%
Total/Average Industrial3 12 3,804 12,575 2.24 3.8% 100.0% 100.0% 3,970 3,934
TOTAL PORTFOLIO 18 63,273 209,166 58.50 100.0% 99.0% 98.8% 5,842 5,954
PORT
FOLI
O
OV
ERV
IEW
1 Market rents assessed by management or independent valuation where available as at 30 June 2014.
2 Real estate market utilises PML to evaluate the risk of damage to a building in the event of an earthquake.
3 Averages are weighted by area (except for occupancy).
GALILEO JAPAN TRUST
8
For
per
sona
l use
onl
y

NO. BUILDING NAME ADDRESS LOCATIONDATE
ACQUIREDAGE
(YEARS)NET RENTABLE AREA (TSUBO)
NET RENTABLE AREA (SQM)2
CARRYING VALUE AS AT
30 JUNE 20141 % OF
PORTFOLIO
LEASED AREA AT
30 JUNE 2013
LEASED AREA AT
30 JUNE 2014
GROSS PASSING RENT
(¥/MONTH/TSUBO)
GROSS MARKET RENT
(¥/MONTH/TSUBO)1
PROBABLE MAXIMUM
LOSS (PML)3
OFFICE1 Seishin 2-5-10 Shinjuku, Shinjuku-ku Tokyo Dec 2006 25 1,699 5,617 7.13 12.2% 100.0% 100.0% 19,253 21,069 11.4%
2 Kanda NK 2-7-2 Sudacho Kanda, Chiyoda-ku Tokyo Dec 2006 23 1,027 3,394 3.44 5.9% 100.0% 100.0% 17,808 17,944 10.5%
3 Tsukasacho 2-6 Kanda Tsukasa-Machi, Chiyoda-ku Tokyo Dec 2006 26 983 3,251 3.40 5.8% 100.0% 100.0% 17,049 17,500 11.3%
4 Takadanobaba Access 2-20-15 Nishiwaseda, Shinjuku-ku Tokyo Dec 2006 20 1,117 3,691 3.13 5.4% 100.0% 100.0% 12,924 15,042 7.9%
5 Azabu Amerex 3-5-7 Azabudai, Minato-ku Tokyo Dec 2006 26 676 2,233 1.88 3.2% 100.0% 89.5% 14,055 14,723 11.3%
6 Shin-Yokohama Nara 2-2-8 Shin Yokohama, Kouhoku-ku, Yokohama-shi Kanagawa Jan 2008 22 1,225 4,050 1.73 3.0% 94.7% 100.0% 9,427 9,174 11.1%
7 Hiei Kudan 3-8-11 Kudan-minami, Chiyoda-ku Tokyo Dec 2006 23 695 2,299 1.78 3.0% 100.0% 100.0% 15,129 17,000 10.1%
8 Doshoumachi 2-2-6 Doshoumachi, Chuo-ku Osaka Dec 2006 25 564 1,863 0.70 1.2% 91.8% 100.0% 8,667 9,000 11.5%
Total/Average Office3 24 7,986 26,398 23.19 39.7% 98.6% 99.1% 14,857 15,817
RETAIL/LEISURE9 La Park Kishiwada4 21-1 Harakiwakamatsu-cho, Kishiwada-shi Osaka Jul 2007 20 14,730 48,693 6.47 11.1% 99.7% 97.8% 4,128 4,128 11.1%
10 Suroy Mall, Chikushino 836-4 Oaza Harada, Chikushino-shi Fukuoka Jul 2007 7 9,728 32,160 7.38 12.6% 100.0% 100.0% 5,093 5,067 5.7%
11 Suroy Mall, Nagamine 1-5-1 Nagamine Nishi, Kumamoto-shi Kumamoto Sep 2007 7 3,811 12,598 3.98 6.8% 99.3% 99.5% 6,675 6,616 10.9%
12 Seiyu Minakuchi 6084-1 Minakuchi, Minakuchi-cho, Koga-shi Shiga Jul 2007 15 7,204 23,815 3.87 6.6% 100.0% 100.0% 2,863 2,863 8.5%
Total/Average Retail/Leisure3 12 35,473 117,266 21.70 37.1% 99.8% 99.0% 4,410 4,396
MIXED USE13 Lions Square 2-15-3 Motogo, Kawaguchi-shi, Saitama Dec 2006 15 2,356 7,790 2.39 4.1% 100.0% 100.0% 4,796 4,797 13.4%
14 Confomall 1005-4 Minami 4 jyo Nishi 10 Chome, Chuo-ku, Sapporo-shi Sapporo Dec 2006 10 1,797 5,940 1.35 2.3% 97.9% 95.8% 5,804 5,983 2.8%
Total/Average Mixed Use3 14 4,153 13,730 3.74 6.4% 99.1% 98.2% 5,232 5,310
RESIDENTIAL15 Shiroi 151-2 Fuji, Shiroi-shi Chiba Dec 2006 19 6,619 21,881 2.30 3.9% 99.0% 99.0% 3,470 3,400 10.6%
16 Matsuya Residence Sekime 6-6-24 Sekime, Jyoto-ku Osaka Dec 2006 25 2,350 7,767 2.06 3.5% 94.6% 95.4% 5,802 5,755 11.8%
17 Royalhill Sannomiya II Kobe 3-5-11 Kanoucho, Chuo-ku Kobe Dec 2006 10 977 3,231 1.49 2.5% 93.6% 92.3% 9,758 9,769 11.0%
18 Imazato 6-11-17 Shin-Imazato, ikuno-ku Osaka Dec 2006 23 1,411 4,663 0.97 1.7% 91.1% 100.0% 4,739 5,000 12.2%
19 Prejeal Utsubo Park 2-4-6 Utsubo Honsho, Nishi-ku Osaka Dec 2006 9 500 1,655 0.81 1.4% 97.0% 95.5% 9,860 9,763 13.9%
Total/Average Residential3 17 11,857 39,197 7.63 13.0% 96.7% 97.7% 4,871 4,851
INDUSTRIAL20 Funabashi Hidan 606-11 Suzumi-cho, Funabashi-shi Chiba Dec 2006 10 2,523 8,341 1.51 2.6% 100.0% 100.0% 4,056 3,900 5.9%
21 Funabashi Tesco 631-13 Toyotomi-cho, Funabashi-shi Chiba Dec 2006 12 1,281 4,234 0.73 1.2% 100.0% 100.0% 3,800 4,000 11.3%
Total/Average Industrial3 12 3,804 12,575 2.24 3.8% 100.0% 100.0% 3,970 3,934
TOTAL PORTFOLIO 18 63,273 209,166 58.50 100.0% 99.0% 98.8% 5,842 5,954
9
GALILEO JAPAN TRUST
For
per
sona
l use
onl
y
PORT
FOLI
O
DET
AIL
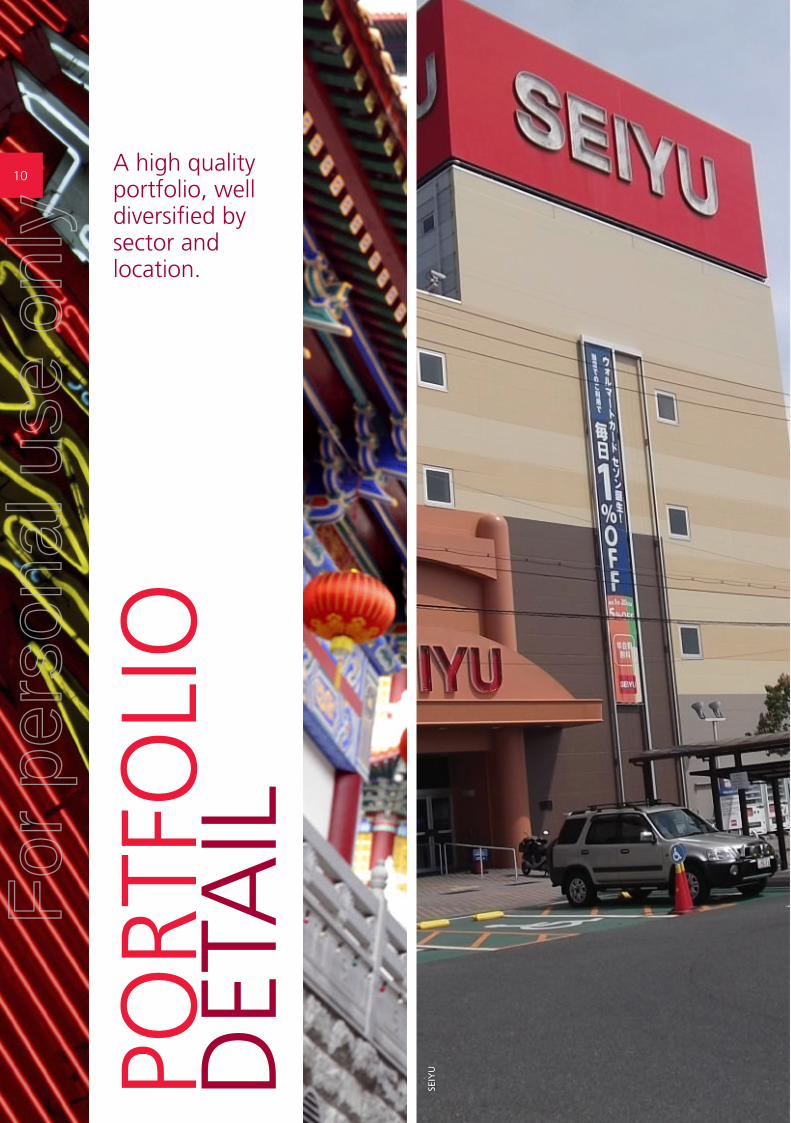
A high quality portfolio, well diversified by sector and location.
SEIY
U
10
For
per
sona
l use
onl
y
1 Represents 100% Interest.2 Carry value as at 30 June 2014.
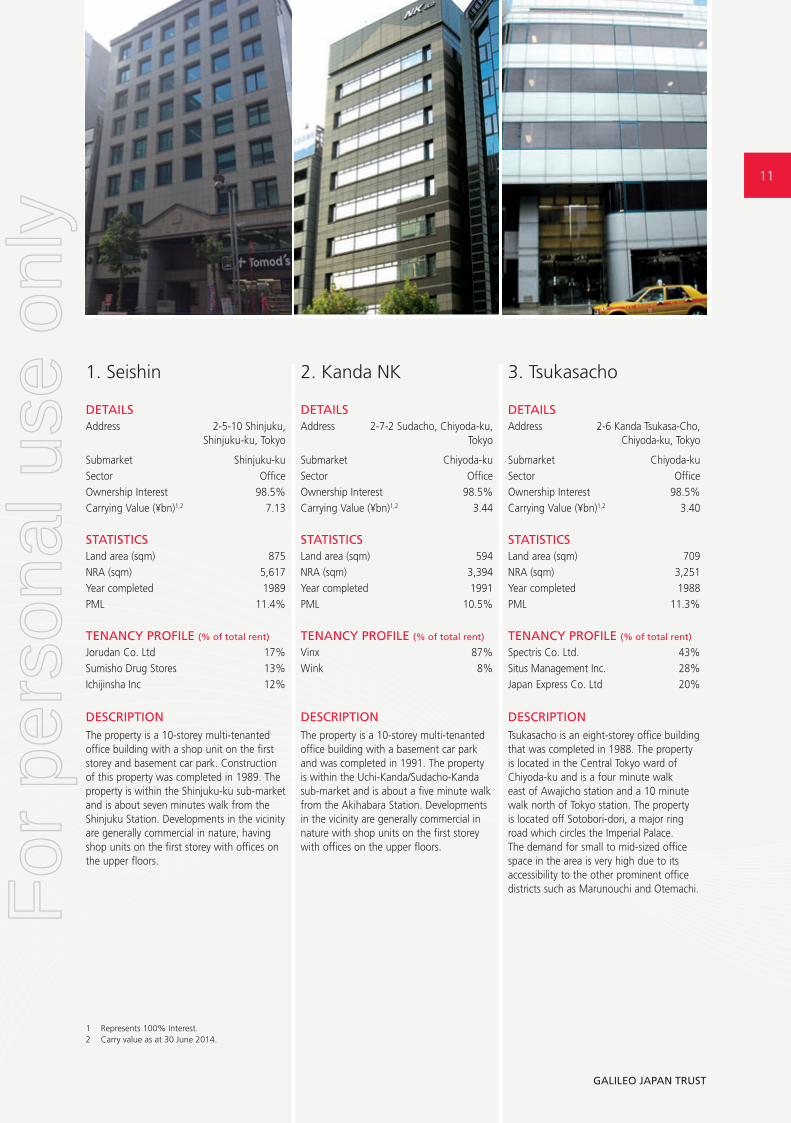
1. Seishin 2. Kanda NK 3. Tsukasacho
DETAILS DETAILS DETAILSAddress 2-5-10 Shinjuku,
Shinjuku-ku, TokyoAddress 2-7-2 Sudacho, Chiyoda-ku,
TokyoAddress 2-6 Kanda Tsukasa-Cho,
Chiyoda-ku, Tokyo
Submarket Shinjuku-ku Submarket Chiyoda-ku Submarket Chiyoda-kuSector Office Sector Office Sector OfficeOwnership Interest 98.5% Ownership Interest 98.5% Ownership Interest 98.5%Carrying Value (¥bn)1,2 7.13 Carrying Value (¥bn)1,2 3.44 Carrying Value (¥bn)1,2 3.40
STATISTICS STATISTICS STATISTICSLand area (sqm) 875 Land area (sqm) 594 Land area (sqm) 709NRA (sqm) 5,617 NRA (sqm) 3,394 NRA (sqm) 3,251Year completed 1989 Year completed 1991 Year completed 1988PML 11.4% PML 10.5% PML 11.3%
TENANCY PROFILE (% of total rent) TENANCY PROFILE (% of total rent) TENANCY PROFILE (% of total rent)
Jorudan Co. Ltd 17% Vinx 87% Spectris Co. Ltd. 43%Sumisho Drug Stores 13% Wink 8% Situs Management Inc. 28%Ichijinsha Inc 12% Japan Express Co. Ltd 20%
DESCRIPTIONThe property is a 10-storey multi-tenanted office building with a shop unit on the first storey and basement car park. Construction of this property was completed in 1989. The property is within the Shinjuku-ku sub-market and is about seven minutes walk from the Shinjuku Station. Developments in the vicinity are generally commercial in nature, having shop units on the first storey with offices on the upper floors.
DESCRIPTIONThe property is a 10-storey multi-tenanted office building with a basement car park and was completed in 1991. The property is within the Uchi-Kanda/Sudacho-Kanda sub-market and is about a five minute walk from the Akihabara Station. Developments in the vicinity are generally commercial in nature with shop units on the first storey with offices on the upper floors.
DESCRIPTIONTsukasacho is an eight-storey office building that was completed in 1988. The property is located in the Central Tokyo ward of Chiyoda-ku and is a four minute walk east of Awajicho station and a 10 minute walk north of Tokyo station. The property is located off Sotobori-dori, a major ring road which circles the Imperial Palace. The demand for small to mid-sized office space in the area is very high due to its accessibility to the other prominent office districts such as Marunouchi and Otemachi.
11
GALILEO JAPAN TRUST
For
per
sona
l use
onl
y

1 Represents 100% Interest.2 Carrying Value as at 30 June 2014.
PORT
FOLI
O
DET
AIL
4. Takadanobaba Access 5. Azabu Amerex 6. Shin-Yokohama Nara
DETAILS DETAILS DETAILSAddress 2-20-15 Nishiwaseda,
Shinjuku-ku, TokyoAddress 3-5-7 Azabudai,
Minato-ku, TokyoAddress 2-2-8 Shin Yokohama,
Kouhoku-ku, Yokohama-shi, Kanagawa
Submarket Shinjuku-ku Submarket Minato-ku Submarket Yokohama-shiSector Office Sector Office Sector OfficeOwnership Interest 98.5% Ownership Interest 98.5% Ownership Interest 98.5%Carrying Value(¥bn)1,2 3.13 Carrying Value(¥bn)1,2 1.88 Carrying Value(¥bn)1,2 1.73
STATISTICS STATISTICS STATISTICSLand area (sqm) 915 Land area (sqm) 606 Land area (sqm) 701NRA (sqm) 3,691 NRA (sqm) 2,233 NRA (sqm) 4,050Year completed 1994 Year completed 1988 Year completed 1992PML 7.9% PML 11.3% PML 11.1%
TENANCY PROFILE (% of total rent) TENANCY PROFILE (% of total rent) TENANCY PROFILE (% of total rent)
Moltobene, Inc. 36% Fiesta Co. Ltd 40% Amphenol Japan K.K. 14%Kaji Technology Corp. 12% Embassy of the Republic of Namibia 28% Infinicon Co. Ltd 12%Regulus Co. Ltd 9% Systems Go Corp 14% Heichinrou Co. Ltd 12%
Marino K.K. 11%
DESCRIPTIONTakadanobaba Access is a 14-storey multi-tenanted office building with a basement car park which was completed in 1994. The property is within the Takadanobaba sub-market and is about a nine minute walk from the Takadanobaba Station. Developments in the vicinity are generally commercial in nature; having shop units at street level with offices on the upper floors.
DESCRIPTIONThe property is an eight-storey multi-tenanted office building with a restaurant/karaoke on the first storey and a basement level used for car parking. Azabu Amerex was completed in 1988 and is located in a popular diplomat precinct.
DESCRIPTIONShin-Yokohama Nara is located in Yokohama City, Kanagawa Prefecture. Shin Yokohama is one of three major commercial centres in the Kanagawa Prefecture. The property is approximately 300 meters from Shin Yokohama station which is the only Shinkansen (bullet train) terminal in the Yokohama area.
GALILEO JAPAN TRUST
12
For
per
sona
l use
onl
y

7. Hiei Kudan 8. Doshoumachi Goto 9. La Park Kishiwada Shopping Centre
DETAILS DETAILS DETAILSAddress 2-5-10 Shinjuku,
Shinjuku-ku, TokyoAddress 2-2-6 Doshoumachi, Chuo-ku,
Osaka-shi, OsakaAddress 21-1Harakiwakamatsu-cho,
Kishiwada-shi, Osaka
Submarket Chiyoda-ku Submarket Osaka-shi Submarket Kishiwada-shiSector Office Sector Office Sector Retail/LeisureOwnership Interest 98.5% Ownership Interest 98.5% Ownership Interest 98.5%Carrying Value (¥bn)1,2 1.78 Carrying Value (¥bn)1,2 0.70 Carrying Value (¥bn)1,2 6.47
STATISTICS STATISTICS STATISTICSLand area (sqm) 633 Land area (sqm) 337 Land area (sqm) 39,789NRA (sqm) 2,299 NRA (sqm) 1,863 NRA (sqm) 48,693Year completed 1991 Year completed 1989 Year completed 1994PML 10.1% PML 11.5% PML 11.1%
TENANCY PROFILE (% of total rent) TENANCY PROFILE (% of total rent) TENANCY PROFILE (% of total rent)
Japan M. Machinery Association 16% Cosmo Medical System Co. Ltd 13% Nagasakiya 37%Guard Force Japan Ltd 14% Goto Sangyo Co. Ltd 11% Nobuta 19%Hunting World Japan KK 13% Daien Food Industry Co. Ltd 10% Sanki Co. Ltd 7%
Sun-A Tech KK 9%
DESCRIPTIONHiei Kudan was built in 1991 and is an 11-storey commercial building with nine parking spaces, ideally located in Central Tokyo. The property is located five minutes walk from Ichigaya Station on the JR Sobu Line. The proximity of Ichigaya Station has made this area popular among businesses that require accessibility to the major Shinjuku and Tokyo Stations. Hiei Kudan has excellent frontage along Yasukuni-dori and provides easy access to public transportation and an excellent view into the inner grounds of Yasukuni Shrine.
DESCRIPTIONThe property is a nine-storey multi-tenanted office building with two car park lots at the first storey frontage. The building was completed in 1989. The property is within the Kitahama sub-market, a three minutes walk from the Kitahama Subway Station. Developments in the vicinity are generally commercial in nature; having shop units on the first storey with offices on the upper floors. The main shopping district is about a six minute walk away.
DESCRIPTIONLa Park Kishiwada is a large shopping centre located 19 kilometres southwest of Osaka and 14 kilometres northeast of Kansai International Airport. The centre is anchored by Nagasakiya GMS (General Merchandise Store, a combined Department Store and Supermarket operation) and Mega Don Quijote (Discount Store). The centre also includes 30 speciality stores (known as ‘KISPA’), Ten Pin Bowling Centre, Karaoke Centre, Pachinko Hall, City Council Offices and a Community/Sports Centre. The property is located 200 metres from Haruki Station which is on the JR line, which connects directly to Numba Station in the centre of Osaka. Approximately 16,000 passengers pass through Haruki Station each day.
1 Represents 100% Interest.2 Carrying Value as at 30 June 2014.
13
GALILEO JAPAN TRUST
For
per
sona
l use
onl
y

1 Represents 100% Interest.2 Carrying value as at 30 June 2014.
PORT
FOLI
O
DET
AIL
10. Suroy Mall, Chikushino 11. Suroy Mall, Nagamine 12. Seiyu Minakuchi
DETAILS DETAILS DETAILSAddress 836-4 Oaza Harada,
Chikushino-shi, FukuokaAddress 1-5-1, Nagamine Nishi,
Kumamoto-shi KumamotoAddress 6084-1 Minakuchi,
Minakuchi-cho, Koga-shi, Shiga
Submarket Chikushino-shi Submarket Kumamoto-shi Submarket Koga-shiSector Retail/Leisure Sector Retail/Leisure Sector Retail/LeisureOwnership Interest 98.5% Ownership Interest 98.5% Ownership Interest 98.5%Carrying Value(¥bn)1,2 7.38 Carrying Value(¥bn)1,2 3.98 Carrying Value(¥bn)1,3 3.87
STATISTICS STATISTICS STATISTICSLand area (sqm) 121,423 Land area (sqm) 28,546 Land area (sqm) 19,918NRA (sqm) 32,160 NRA (sqm) 12,598 NRA (sqm) 23,815Year completed 2007 Year completed 2007 Year completed 1999PML 5.7% PML 10.9% PML 8.5%
TENANCY PROFILE (% of total rent) TENANCY PROFILE (% of total rent) TENANCY PROFILE (% of total rent)
Sakoda 24% To-sho Co. Ltd 21% Seiyu 100%Mr Max 21% Sanki 19%Edion West 14% Kumamoto Halloday 16%Red Cabbage 7% Arigato Service 13%
DESCRIPTIONSuroy Mall was purchased as part of a portfolio of three assets in July 2007. Suroy Mall is located approximately 20 kilometres southeast of Fukuoka. The property enjoys an excellent location on a major road, midway between the JR Harada and JR Keyakida Stations. The centre will accommodate a total of 25 tenants, and will operate as a Power Centre/Big Box retailing format, representing a new generation of retailing in the Japanese market.
DESCRIPTIONSuroy Mall was purchased in September 2007. The property occupies an “urban in-fill” location in an established neighbourhood surrounded by residential, commercial and industrial developments. The site is well positioned and accessible having frontage to three roads. Within the property there are 674 car parking spaces and 315 bicycle spaces.
DESCRIPTIONSeiyu Minakuchi was purchased as part of a portfolio of three assets in July 2007. Seiyu Minakuchi is a four storey department store/supermarket located in Minakuchi Town, which is part of the larger Shiga prefecture. The property is 100% leased to The Seiyu Corporation Co., Ltd (Seiyu), a well known GMS (General Merchandise Store) retailer in Japan which is majority owned by the Wal-Mart Corporation, the world’s largest retailer as measured by sales volume.
GALILEO JAPAN TRUST
14
For
per
sona
l use
onl
y

13. Lions Square 14. Confomall 15. Shiroi
DETAILS DETAILS DETAILSAddress 2-15-3 Motogo,
Kawaguchi-shi, SaitamaAddress 1005-4 Minami 4-jyo Nishi
10-chome, Chuo-ku Sapporo-shi, Hokkaido
Address 151-2 Fuji, Shiroi-shi, Chiba
Submarket Kawaguchi-sh Submarket Sapporo-shi Submarket Shiroi-shiSector Mixed Use Sector Mixed Use Sector ResidentialOwnership Interest 98.5% Ownership Interest 98.5% Ownership Interest 98.5%Carrying Value(¥bn)1,2 2.39 Carrying Value(¥bn)1,2 1.35 Carrying Value(¥bn)1,3 2.30
STATISTICS STATISTICS STATISTICSLand area (sqm) 9,533 Land area (sqm) 2,743 Land area (sqm) 12,951NRA (sqm) 7,790 NRA (sqm) 5,940 NRA (sqm) 21,881Year completed 1998 Year completed 2003 Year completed 1995PML 13.4% PML 2.8% PML 10.6%
TENANCY PROFILE (% of total rent) TENANCY PROFILE (% of total rent) TENANCY PROFILE (Total number of units occupied)
Summit 76% Central Sports 58% Residential – Units 296Ohizumi Swimming School 20% Lawson 6%
DESCRIPTIONLions Square contains 5,976 sqm of rentable retail space and parking for 641 cars. The building is located in Kawaguchi City and is south of Kawaguchi-Motogo Station (a five minutes walk) and also south-east of Kawaguchi Station (an 18 minute walk). The property is part of a large-scale mixed use project that also contains a high rise residential condominium named Elza Tower (not included in ownership).
DESCRIPTIONThe property is a 10-storey multi-tenanted retail and residential building. In addition, there is a basement level and a five-storey high mechanical car park station. The property is about seven minutes walk (500 metres) from the Nishi-II-chome railway station.
DESCRIPTIONShiroi is a 13-storey, 337 unit residential complex located in Chiba and within approximately 1.5 hours drive from Central Tokyo. The majority of units in the complex are three bedroom units. The Trust acquired 299 out of the total 337 units. Built in 1995, Shiroi offers individual parking spaces for each unit along with 340 parking spaces, 44 motorcycle parking spaces and 558 bicycle parking spaces. In addition, Shiroi includes a landscaped park and is adjacent to a large retail complex featuring a supermarket (Tobu Store) and a homewares store (Jumbo Encho).
1 Represents 100% Interest.2 Carrying value as at 30 June 2014.
15
GALILEO JAPAN TRUST
For
per
sona
l use
onl
y
1 Represents 100% Interest.2 Carrying value as at 30 June 2014.
PORT
FOLI
O
DET
AIL
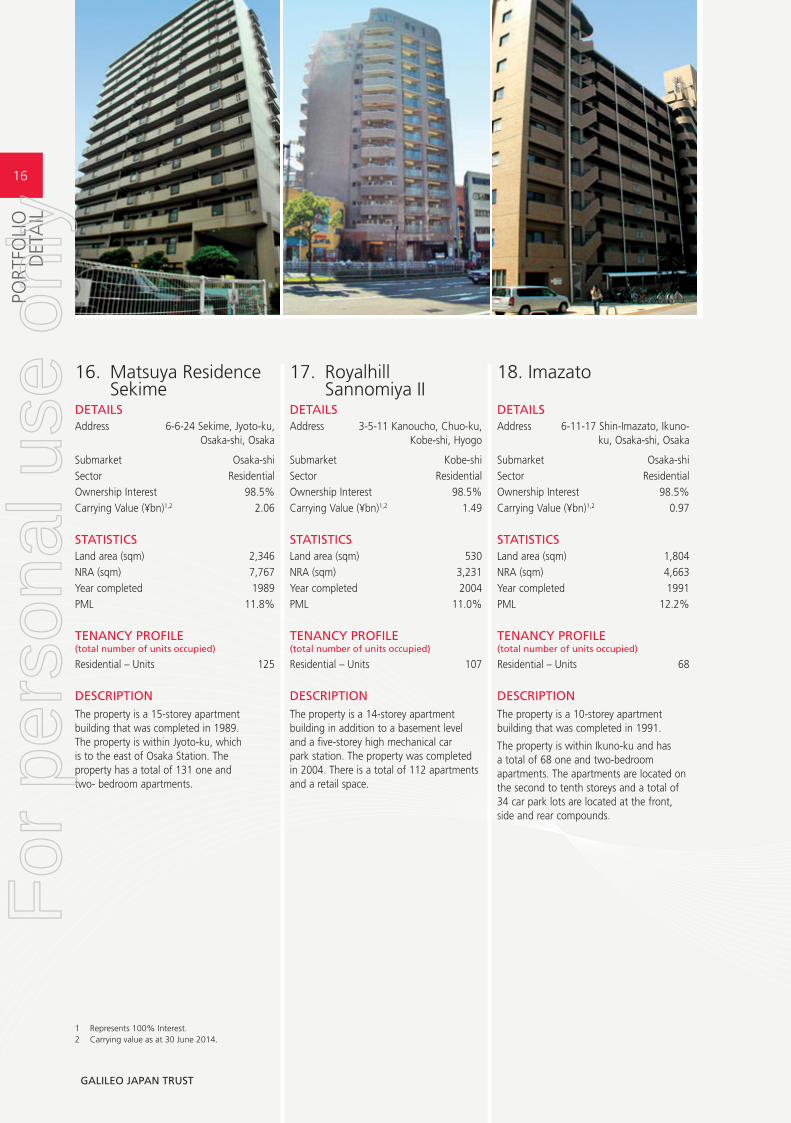
16. Matsuya Residence Sekime
17. Royalhill Sannomiya II
18. Imazato
DETAILS DETAILS DETAILSAddress 6-6-24 Sekime, Jyoto-ku,
Osaka-shi, OsakaAddress 3-5-11 Kanoucho, Chuo-ku,
Kobe-shi, HyogoAddress 6-11-17 Shin-Imazato, Ikuno-
ku, Osaka-shi, Osaka
Submarket Osaka-shi Submarket Kobe-shi Submarket Osaka-shiSector Residential Sector Residential Sector ResidentialOwnership Interest 98.5% Ownership Interest 98.5% Ownership Interest 98.5%Carrying Value (¥bn)1,2 2.06 Carrying Value (¥bn)1,2 1.49 Carrying Value (¥bn)1,2 0.97
STATISTICS STATISTICS STATISTICSLand area (sqm) 2,346 Land area (sqm) 530 Land area (sqm) 1,804NRA (sqm) 7,767 NRA (sqm) 3,231 NRA (sqm) 4,663Year completed 1989 Year completed 2004 Year completed 1991PML 11.8% PML 11.0% PML 12.2%
TENANCY PROFILE (total number of units occupied)
TENANCY PROFILE (total number of units occupied)
TENANCY PROFILE (total number of units occupied)
Residential – Units 125 Residential – Units 107 Residential – Units 68
DESCRIPTIONThe property is a 15-storey apartment building that was completed in 1989. The property is within Jyoto-ku, which is to the east of Osaka Station. The property has a total of 131 one and two- bedroom apartments.
DESCRIPTIONThe property is a 14-storey apartment building in addition to a basement level and a five-storey high mechanical car park station. The property was completed in 2004. There is a total of 112 apartments and a retail space.
DESCRIPTIONThe property is a 10-storey apartment building that was completed in 1991.
The property is within Ikuno-ku and has a total of 68 one and two-bedroom apartments. The apartments are located on the second to tenth storeys and a total of 34 car park lots are located at the front, side and rear compounds.
GALILEO JAPAN TRUST
16
For
per
sona
l use
onl
y

1 Represents 100% Interest.2 Carrying value as at 30 June 2014.
19. Prejeal Utsubo Park 20. Funabashi Hidan 21. Funabashi Tesco
DETAILS DETAILS DETAILSAddress 2-4-6 Utsubo Honcho,
Nishi-ku, Osaka-shi, OsakaAddress 606-11 Suzumi-cho,
Funabashi-shi, ChibaAddress 631-13 Toyotomi-cho,
Funabashi-shi, Chiba
Submarket Osaka-shi Submarket Funabashi-sh Submarket Funabashi-shSector Residential Sector Industrial Sector IndustrialOwnership Interest 98.5% Ownership Interest 98.5% Ownership Interest 98.5%Carrying Value (¥bn)1,2 0.81 Carrying Value (¥bn)1,2 1.51 Carrying Value (¥bn)1,2 0.73
STATISTICS STATISTICS STATISTICSLand area (sqm) 287 Land area (sqm) 13,420 Land area (sqm) 8,268NRA (sqm) 1,655 NRA (sqm) 8,341 NRA (sqm) 4,234Year completed 2005 Year completed 2003 Year completed 2001PML 13.9% PML 5.9% PML 11.3%
TENANCY PROFILE (Total number of units occupied)
TENANCY PROFILE (% of total rent) TENANCY PROFILE (% of total rent)
Residential – Units 63 Hidan 100% Aeonevery KK 100%
DESCRIPTIONThis modern 12-storey apartment building comprising 66 apartments was completed in November 2005. Utsubo Park is part of Central Osaka City and is immediately adjacent to Nishi-ku and Chuo-ku, which are the two fastest growing residential locations in Osaka. The property is close to several subway lines as well as Midosuji Boulevard which directly links this precinct with Osaka and Namba Stations.
DESCRIPTIONFunabashi Hidan is a two level single-tenanted factory and distribution facility with 23 parking bays that was completed in 2003. The property is located within an inland industrial area that was purpose built in Funabashi-city given its strategic location between Tokyo and Narita (the location of Tokyo’s main airport).
DESCRIPTIONFunabashi Tesco (previously named Funabashi Hi-Tech) is a two storey single tenanted factory. It was completed circa 2001. The property is within the Funabashi City sub market. Within the property there are approximately 58 car park bays.
17
GALILEO JAPAN TRUST
For
per
sona
l use
onl
y

Executive Team of Responsible Entity
NEIL WERRETT, MANAGING DIRECTOR AND CHIEF EXECUTIVE OFFICER
Neil is the Managing Director and Chief Executive Officer and
founder of the Trust.
Neil was previously Global Head, Corporate Transactions and
Product Development at AMP Henderson Global Investors
(now AMP Capital Investors), where he was employed for
24 years in various roles covering property and property funds
management. Neil’s roles at AMP included property acquisitions
and disposals, the establishment of the listed property trust
business, ongoing capital raisings and participation in the
management committee of the trusts.
Neil has been involved in the assessment of business and
real estate opportunities in Japan since 1998 and established
Galileo Japan Funds Management Limited in 2006.
PETER MURPHY, EXECUTIVE DIRECTOR AND CHIEF OPERATING OFFICER
Peter has more than 20 years experience in the property
industry in numerous capacities including valuations, as well
as asset and funds management. Over the past 15 years, he
has been directly involved in the management of various listed
property entities.
Peter was the CEO of Ronin Property Group which listed in
1996 as AMP Office Trust and had funds under management
of approximately $2 billion throughout Australia and
New Zealand prior to a merger with Multiplex Group
in November 2004.
During his employment with Multiplex, Peter was the Group
Manager, Marketing and Communications and more recently
Divisional Director, Institutional Funds responsible for in excess
of $3 billion in funds under management.
BRETT BRADLEY, CHIEF FINANCIAL OFFICER
Brett is the Chief Financial Officer and is responsible for
financial reporting and other financial matters of the Trust.
Brett was also the Chief Financial Officer of Galileo Funds
Management Limited and has been with Galileo since its
inception in 2003. Brett was previously a Principal in the
real estate group at Ernst & Young in Sydney, where he was
involved in the financial reporting and transaction support
components of several listed property trusts in Australia. Prior
to moving to Australia in 1996, Brett worked in the real estate
group at Ernst & Young in the US.
PAUL MARSHALL, SENIOR VICE PRESIDENT, PORTFOLIO MANAGEMENT
Paul brings over 18 years of diverse property experience
to the business encompassing valuation and analytical roles,
as well as asset management. Paul’s role entails development
and execution of portfolio strategy, acquisitions, reporting
and investor communication. Prior to joining the Responsible
Entity, Paul held the equivalent position with Galileo Shopping
America Trust (now part of Centro Retail Group), which
held interests in 136 retail properties and had total assets
of $2.6 billion.
GAVIN HOLMES, VICE PRESIDENT, FINANCE
Gavin joined the Galileo Group in November 2003 to assist
with finance matters, including transaction finance, reporting
and compliance. Gavin previously worked with Ernst & Young
and has over 15 years experience in finance roles.
MANAGEMENT TEAM
Galileo Japan Trust has access to a team of professionals with extensive experience in property and asset management, development, acquisitions and divestments, and institutional funds management.
GALILEO JAPAN TRUST
18
For
per
sona
l use
onl
y
MA
NA
GEM
ENT
TEA
M
CAMELIA TAN, FINANCIAL ANALYST
Camelia Tan is the financial analyst for the Trust. Camelia has
previously worked as a financial analyst in the investment
management division of the Multiplex Group. She was involved
in a range of responsibilities, including financial reporting
and transaction support. Prior to that, Camelia worked in an
audit role with KPMG. Camelia is a chartered accountant and
speaks Japanese.
DONNA DUGGAN, COMPANY SECRETARY AND COMPLIANCE OFFICER
Donna Duggan is company secretary and compliance officer for
Galileo Japan Funds Management Limited. Donna is a lawyer
and has over 15 years experience in predominantly property
related matters including compliance. Donna is a member of
Chartered Secretaries Australia.
Executive Team of Galileo JapanGalileo Japan provides asset management services to the TK
Operator under a 10 year agreement and plays a coordination
and management role with regard to the TK structure
as a whole. Galileo Japan in particular will liaise with its
Relationship Partner Nippon Kanzai, in the provision of its
asset management services.
ROBERT MORIKUNI, REPRESENTATIVE DIRECTOR
Mr. Morikuni holds a Degree in Architectural Studies from the
University of Illinois, Champaign-Urbana and an MBA from the
University of Hawai’i at Manoa. He has worked in Japan for
in total over 19 years. He brings a broad range of experience
to Galileo having a background which includes architectural
design, structural engineering, construction management with
Maeda Corporation and real estate brokerage and consultancy
with CB Richard Ellis. Prior to joining Galileo, Mr. Morikuni held
the position of Regional Director of Real Estate Investment for
the Japan entity of Manulife Financial where his role included
acquisitions, establishment of an asset management division
and management of Manulife’s Japan real estate portfolio.
MAKOTO MURANAKA, DIRECTOR FINANCE
Mr Muranaka has been engaged in finance, accounting
and tax working for Tomen Corporation (including 6 years
in Australia), Colony Capital Asia Pacific Tokyo Branch and
most recently Prudential Real Estate Investors (Japan) KK
as Senior Vice President, totalling more than 26 years and
accumulated experience in real estate acquisitions including
M&A and cross border tax structuring for recent 10 years.
He holds a money lender’s business license and a real estate
broker’s license (Takken).
RYUNOSUKE NAKAJIMA, SENIOR VICE PRESIDENT – INVESTMENTS
Mr Nakajima has over 10 years of real estate business
experience in Japan including 5 years in the securitization
field. He developed office buildings and condominiums at a
development firm for five years and subsequently joined the
funds business. His main roles with previous employers, DTZ
Japan and Unified Capital Japan were to source, analyze, close
and manage investment transactions. He holds a real estate
brokers licence (Takken) and Certified Building Administration
(CBA) qualifications and is fluent in English.
EDMOND COURTROUL, LEGAL COUNSEL AND COMPLIANCE OFFICER
Mr. Courtroul is a lawyer with over 10 years experience in
corporate and property related matters in Japan. Prior to
joining Galileo, Mr. Courtroul was Senior Legal Counsel for
Panasonic before taking on the role as Chief Legal Officer for
the Redwood Group. In addition to his role as legal counsel for
the company, Mr. Courtroul is responsible for compliance. He is
fluent in Japanese.
HIROFUMI KAMBAYASHI, ASST. SENIOR VICE PRESIDENT – ASSET MANAGEMENT
Mr Kambayashi has obtained tertiary qualifications from both
Japanese and American universities. He was a senior manager
at Capital Advisors Co Ltd where he specialised in hospitality
assets. He was responsible for all facets of asset management
including acquisition, disposition and due diligence. Prior to
that he was in a senior position in the asset management
division of Jones Lang LaSalle Tokyo. He holds a real estate
brokers licence (Takken) and Certified Building Administration
(CBA) qualifications.
SHUNSUKE YOSHIDA, ASST. SENIOR VICE PRESIDENT – ASSET MANAGEMENT
Mr Yoshida has over 8 years of real estate related business
experience in Japan. He was an asset manager at Macquarie
Real Estate Capital, K.K. where he was responsible for multiple
types of properties including office, retail and residential. Prior
to that he specialised in retail properties at Pacific Management
Corp. where his main focus was on acquisitions and leasing.
He holds a real estate brokers licence (Takken) and ARES
Certified Master (ACM) qualifications.
19
GALILEO JAPAN TRUST
For
per
sona
l use
onl
y

Japanese Relationship PartnerManagement services are provided to Galileo Japan by
Nippon Kanzai, a well credentialed Japanese property services
group. Nippon Kanzai focuses on the creation and execution
of value adding management strategies, portfolio level
reporting and oversee external property management service
providers. Galileo Japan works closely with Nippon Kanzai in
order to maximise returns for the TK Operator and indirectly
to Unitholders.
Nippon Kanzai is an experienced and well respected
real estate services provider, listed on the Tokyo Stock
Exchange, with over 40 years experience in the Japanese
market, having been founded in 1965. Nippon Kanzai
has principal offices in Tokyo and Osaka, in addition to
a branch office network throughout Japan and employs
approximately 7,000 people. Nippon Kanzai offers a
broad variety of property related services including asset
management, property management, risk management
and building maintenance
TOKYO CAPITAL MANAGEMENT
Tokyo Capital Management is a wholly owned subsidiary
of Nippon Kanzai.
Tokyo Capital Management provides management services
for the following properties:
• Seishin
• Kanda NK
• Takadanobaba Access
• Azabu Amerex
• Doshoumachi Goto
• Matsuya Residence
Sekime
• Royalhill Sannomiya II
• Imazato
• Prejeal Utsubo Park
• La Park Kishiwada
• Suroy Mall, Chikushino
• Seiyu Minakuchi
• Suroy Mall, Nagamine
• Shin-Yokohama Nara
The remaining properties are managed by
Galileo Japan K.K.
SHIR
OI
MA
NA
GEM
ENT
TEA
M
20
For
per
sona
l use
onl
y

The Board is responsible for the corporate governance of
the Trust and the determination of its strategic direction.
In accordance with the Corporations Act, the duties of the
directors to unitholders of the Trust take priority over the
duties of the directors to GJFML.
The Australian Securities Exchange (ASX) Corporate
Governance Council’s Principles and Recommendations
2nd edition (the Recommendations) are as follows:
Principle 1. Lay solid foundations for management
and oversight
Principle 2. Structure the board to add value
Principle 3. Promote ethical and responsible decision making
Principle 4. Safeguard integrity in financial reporting
Principle 5. Make timely and balanced disclosure
Principle 6. Respect the rights of shareholders
Principle 7. Recognise and manage risk
Principle 8. Remunerate fairly and responsibly
Under ASX Listing Rule 4.10.3, GJFML must disclose in
its annual report the extent to which it has followed the
Recommendations. Where there has been a departure
from the Recommendations, this fact must be disclosed,
together with the reasons for the departure.
GJFML’s corporate governance practices throughout the
period ending 30 June 2014 are compliant with the
Recommendations except to the extent that the functions
of a nomination and remuneration committee have been
discharged by the Board as a whole, as discussed below.
Recommendation 2.4 sets out that the Board
should establish a nomination committee and
recommendation 8.1 sets out that the Board should
establish a remuneration committee. During the period
ended 30 June 2014, nomination and remuneration
functions for GJFML were carried out by the full Board
of directors. The Board does not believe at this stage
that any marked efficiencies or enhancements would be
achieved by the creation of a separate nomination or
remuneration committee.
For further information on corporate governance
policies adopted by the Trust, refer to our website:
www.galileofunds.com.au
CORPORATE GOVERNANCE
The Board of Directors (the Board) of Galileo Japan Funds Management Limited (GJFML) is responsible for the corporate governance of the Trust and the determination of its strategic direction.
21
GALILEO JAPAN TRUST
For
per
sona
l use
onl
y

Structure of the BoardThe skills, experience and expertise relevant to the position
held by each director in office at the date of this report are
included below. Directors of GJFML are considered to be
independent when they are independent of management
and free from any business or other relationship that could
materially interfere with, or could be reasonably perceived
to interfere with, the exercise of their responsibilities
as directors.
In the context of director independence materiality is
considered from both the company and the individual
director perspective. The determination of materiality
requires consideration of both qualitative and quantative
factors. Qualitative factors include whether a relationship
is strategically important, the nature of the relationship
and the contractual and other arrangements that govern
that relationship. An item is considered to be quantitatively
material if it is equal to or greater than 10% of the
appropriate base amount and immaterial where it is equal
to or less than 5% of the appropriate base amount.
With respect to the Trust all five of the directors have been
in office for the period from 10 November 2006 (date the
Trust was registered with ASIC) to 30 June 2014 and as
at the date of this report. Of the five directors, the Board
considers the following three directors to be external and
independent directors:
NAME POSITION TERM IN OFFICE
Jack Ritch Non-executive Chairman 7 years,
10 months
Philip Redmond Non-executive Director 7 years,
10 months
Frank Zipfinger Non-executive Director 7 years,
10 months
The two executive directors in office at the date of this
report are:
NAME POSITION TERM IN OFFICE
Neil Werrett Managing Director and
Chief Executive Officer
7 years,
10 months
Peter Murphy Executive Director and
Chief Operating Officer
7 years,
10 months
The role of the Board includes:
• providing strategic direction and deciding upon the
Trust’s business strategies and objectives;
• monitoring the operational and financial position and
performance of the Trust;
• identifying the principal risks faced by the Trust and
monitoring the effectiveness of systems designed
to provide reasonable assurance that these risks are
being managed;
• taking steps to ensure that the Trust’s financial and
other reporting mechanisms result in adequate,
accurate and timely information being provided
to the Board; and
• taking steps to ensure that unitholders and the market
are fully informed of all material developments.
As part of an effective organisational structure, the Board
has delegated certain of its responsibilities to the Audit
Compliance and Risk Management Committee and day
to day management to senior executives. In order to aid
them in performing their duties the individual directors
are entitled to have access to all records relating to the
Trust, to the executive team and management and to seek
independent professional advice, at GJFML’s expense.
CO
RPO
RATE
G
OV
ERN
AN
CE
GALILEO JAPAN TRUST
22
For
per
sona
l use
onl
y

Board Profiles
JACK RITCH, NON-EXECUTIVE CHAIRMAN
Jack was non-executive chairman, AMP Capital Investors
Limited, from April 2004 to March 2009. Prior to that,
Jack was Managing Director and chairman of the
company from 1999 to April 2004. From 1987 to 1999,
Jack held the position of Director, Property, during which
time he was responsible for managing AMP’s $9 billion
property portfolio. Prior to 1987, he held a variety of
other positions within the AMP Group, which he joined
in 1958.
In April 2012, Jack retired as Chairman of Australia
Pacific Airports Corporation Limited (owner of Melbourne
and Launceston airports). His other activities include
Chairman of the Powerhouse Museum Foundation.
FRANK ZIPFINGER, NON-EXECUTIVE DIRECTOR
Frank has over 30 years experience in the property
industry. He was formerly a Partner in the Property,
Construction & Environment practice of the Sydney
office of Mallesons Stephen Jaques where he specialised
in property investment and development. Frank was
also the Chairman of Mallesons Stephen Jaques from
1 February 2005 until 30 June 2010. Prior to this
appointment, Frank completed over five years in various
roles as a Managing Partner with the firm.
Frank is non-executive chairman of Aspen Property Group
(ASX code APZ) and chairman of the Investor Representive
Committees of the AMP Capital Wholesale Office
Fund and the AMP Capital Wholesale Shopping Centre
Fund. Frank is a Member of the Australian Institute of
Company Directors. He is a member of the Executive
Committee of the St Joseph’s College Indigenous Fund, a
member of the board of Melbourne Business School and
President of the School’s Alumni Council, and a director
of the Australian Youth Orchestra.
PHILIP REDMOND, NON-EXECUTIVE DIRECTOR
Philip has over 30 years experience in the real estate
industry in Australia, including 12 years at UBS where he
held the position of Managing Director – Head of Real
Estate Australasia. Philip has played a leading role in the
development of the listed property trust sector within
Australia and has a comprehensive understanding of
financial markets. Philip is also a Non-Executive Director
with Shopping Centres Australasia Group and is a member
of the Australian Institute of Company Directors.
NEIL WERRETT, MANAGING DIRECTOR AND CHIEF EXECUTIVE OFFICER
Neil is the Managing Director and Chief Executive Officer
and founder of the Trust.
Neil was previously Global Head, Corporate Transactions and
Product Development at AMP Henderson Global Investors
(now AMP Capital Investors), where he was employed for
24 years in various roles covering property and property
funds management. Neil’s roles at AMP included property
acquisitions and disposals, the establishment of the listed
property trust business, ongoing capital raisings and
participation in the management committee of the trusts.
Neil has been involved in the assessment of business and
real estate opportunities in Japan since 1998 and established
Galileo Japan Funds Management Limited in 2006.
PETER MURPHY, EXECUTIVE DIRECTOR AND CHIEF OPERATING OFFICER
Peter has more than 25 years experience in the property
industry in numerous capacities including valuations,
as well as asset and funds management. Over the past
18 years, he has been directly involved in the management
of various listed property entities.
Peter was the CEO of Ronin Property Group which
listed in 1996 as AMP Office Trust and had funds under
management of approximately $2 billion throughout
Australia and New Zealand prior to a merger with
Multiplex Group in November 2004.
During his employment with Multiplex, Peter was Group
Manager, Marketing and Communications and Divisional
Director, Institutional Funds responsible for in excess of
$3 billion in funds under management.
23
GALILEO JAPAN TRUST
For
per
sona
l use
onl
y
Audit Compliance and Risk Management CommitteeThe board has established an Audit Compliance and Risk
Management Committee under a formal charter setting
out its composition, operation and responsibilities. All
members of this committee are independent, being:
• Frank Zipfinger (Chairman);
• Philip Redmond; and
• Jack Ritch.
For details of the qualifications of members of the audit
committee, refer to the board profiles included above.
The Committee’s responsibilities include:
• reviewing the integrity of the financial statements;
• reviewing external reporting procedures including
accounting policies, financial statements, analysts
briefings and continuous disclosure and seeking to
ensure that internal financial control systems, risk
management policies and risk management systems
are adequate to provide an effective assurance of the
integrity of financial statements;
• assessing the independence of the external auditor,
considering any request to provide non-audit services,
and making recommendations in respect of the
auditor’s engagement;
• reviewing the propriety of, and approval of, all related
party transactions;
• reviewing compliance with the Trust’s compliance plan
and the Corporations Act; and
• reviewing financial management, including
management of the Trust’s funding, hedging, liquidity
and insurance coverage.
The Audit Committee reports to the Board on the outcome
of its reviews and discussions with the external auditors
and its findings on matters which have or are likely to
have a material effect on the operating results or financial
position of the Trust.
The Audit Committee meets not less than four times a year
and at such other times as any member of the Committee
shall require.
During the period ended 30 June 2014 there were 4 audit
committee meetings held and all members of the audit
committee attended all meetings.
The external auditor is PricewaterhouseCoopers. The lead
engagement partner and review partner will each be
required to be rotated at least every five years, the latest
rotation occurred during the period ended 30 June 2012.
Any non-audit services that are to be provided by the
auditor will be subject to disclosure in the financial report.
Additionally, PricewaterhouseCoopers has been engaged
to audit the compliance plan. The compliance plan auditor
provides an audit opinion to the board which, together
with the Trust’s financial report, is lodged with ASIC.
CO
RPO
RATE
G
OV
ERN
AN
CE
GALILEO JAPAN TRUST
24
For
per
sona
l use
onl
y

PerformanceGJFML undertakes a formal review of the Board’s
performance each year in the March quarter, most recently
in March 2014.
Each March quarter the Chairman is required to complete
a board assessment questionnaire, based upon discussions
with Board members, which analyses their performance. The
questionnaire covers the following matters:
• Board contribution to developing strategy and policy as it
relates to the Trust;
• interaction between the Board and management,
and between Board members;
• Board processes to monitor Trust performance and
compliance, control risk and evaluate management;
• Board composition and structure; and
• operation of the Board, including the conduct of the
Board meetings and committee meetings.
RemunerationThe remuneration of GJFML in its capacity as Responsible
Entity is regulated by the Trust’s Constitution. Management
fees and expenses payable for the period ended 30 June
2014 are set out in the financial report.
The remuneration of directors is paid by GJFML, using its own
funds and any of the fees payable by the Trust to GJFML.
Accordingly, the Trust does not directly bear the costs of any
director. The Board of GJFML may consider the remuneration
payable to its independent directors from time to time.
Remuneration for independent directors is approved by the
Managing Direcor and is benchmarked to market rates.
The remuneration of executives is paid by a GJFML related
entity using its own funds, such that the Trust does not
directly bear the costs of any executive or employee.
Remuneration of executives is determined by the Managing
Director from time to time.
GJFML aims to ensure that its remuneration practices:
• are fair and reasonable;
• attract and retain high calibre staff;
• are managed to mitigate risk and be in line with corporate
governance and legal requirements;
• motivate management to pursue the long term goals of
the Trust; and
• demonstrate a relationship between executive
performance and remuneration.
25
GALILEO JAPAN TRUST
For
per
sona
l use
onl
y
Ethical StandardsGJFML is committed to ensuring that it acts responsibly and
with integrity in relation to its dealings with the Trust and
unitholders. Each director and employee is required to place
the interests of unitholders above that of GJFML and to act in
good faith, and with care and diligence. GJFML has a Code
of Conduct and Business Ethics which must be complied with
at all times. In addition, GJFML also has a Director’s Code of
Conduct which the directors of GJFML must also comply with
at all times.
Trading PolicyThe Board of GJFML has adopted a securities trading policy.
It provides that directors and employees of GJFML must
not buy or sell securities when they are in possession of
price sensitive information relating to the Trust which is
not generally available to the market. To avoid any adverse
inference being drawn of unfair dealing, directors and
employees must not deal in the Trust’s securities during the
four weeks before, and for one full trading day after, the
release of the half year and full year results announcements.
The Board may also impose additional non-trading periods at
any time by notice. Directors and employees must not buy or
sell the company’s securities until approval has been given by
the Chairman or Chief Executive Officer.
In accordance with ASX Listing Rule 12.9, a copy of the
securities trading policy has been released to the market.
Continuous Disclosure and CommunicationThe Trust is a disclosing entity for the purposes of the
Corporations Act and complies with the continuous
disclosure regime under the ASX Listing Rules and
Corporations Act. GJFML has a Continuous Disclosure Policy
which must be complied with at all times. In accordance
with ASX Listing Rule 4.10.19 the Trust has used cash and
assets that it had at the time of listing in a manner consistent
with its business objectives. GJFML has established internal
systems and procedures to ensure that timely disclosure is
made to the ASX to support an informed market. The Trust
also provides periodic reports to unitholders and places key
announcements on its website. Under the Corporations
Act, the Trust is not required to hold an annual meeting
with scheme members and we do not intend to have an
annual meeting with respect to the financial year ended
30 June 2014.
CO
RPO
RATE
G
OV
ERN
AN
CE
GALILEO JAPAN TRUST
26
For
per
sona
l use
onl
y

Key Dates
22 DECEMBER 2014
Ex Distribution date for half year distribution
31 DECEMBER 2014
Record date for half year distribution
26 FEBRUARY 2015
Interim results (indicative)
The Trust currently trades under the Australian
Securities Exchange (ASX) Code GJT.
Ordinary Units Ordinary units are the sole class of units on issue and
available for investment in the Trust. A distribution may
be paid every six months, in February and August.
Distribution PaymentsGJT remains primarily a capital return investment as no
cash distributions will be made to unitholders (other than
required for taxation purposes) until Forum and UBS
facilities have been fully repaid.
There are two ways in which future distribution payments
can be made:
1. a direct credit to your bank, building society or
credit union account; or
2. a cheque mailed to your postal address.
Direct crediting of distributions ensures same day receipt
and enables you to access your funds more quickly
than if you had received a cheque. Confirmation of the
direct credit is provided. A cheque will be forwarded if
you have not nominated an account for direct credit.
If any unitholder would like to take up the direct credit
option, please contact Link Market Services on freecall
1800 709 446 or +61 2 8280 7910 for overseas investors.
Taxation StatementsA taxation statement will be issued at the end of
each financial year when there is a distribution paid
to unitholders. This statement provides details of the
distributions made during the relevant financial year,
including any tax deferred component.
The Trust Website address is:
www.galileofunds.com.au
The site contains a variety of investor information including
unit price, announcements to the ASX, and the latest
financial reports.
The Trust’s freecall hotline number is: 1800 709 446
Link Market Services operates a freecall number on behalf
of the Responsible Entity. Please call if you have any
questions in relation to the following matters:
• change of address details of unitholder;
• request to have distributions paid by direct credit
to a bank account;
• request not to receive an Annual or Half Year Report; or
• provision of Tax File Numbers.
INVESTOR RELATIONS
27
GALILEO JAPAN TRUST
For
per
sona
l use
onl
y

This page has been intentionally left black
GALILEO JAPAN TRUST
28
For
per
sona
l use
onl
y

For
per
sona
l use
onl
y

For
per
sona
l use
onl
y

ANNUAL REPORT 2014 GALILEO JAPAN TRUST (ARSN 122 465 990)
FINANCIALREPORT
For
per
sona
l use
onl
y

For the year ended 30 June 2014
Contents
Directors’ Report 1
Auditor’s Independence Declaration 6
Income Statement 7
Statement of Comprehensive Income 8
Balance Sheet 9
Statement Changes in Equity 10
Statement of Cash Flows 11
Notes to the Financial Statements 12
Directors’ Declaration 37
Independent Auditor’s Report to Unitholders 38For
per
sona
l use
onl
y
FOR THE YEAR ENDED 30 JUNE 2014
Directors’ Report
ANNUAL REPORT 2014
The Directors of Galileo Japan Funds Management Limited, the responsible entity (Responsible Entity) of Galileo Japan Trust submit herewith
the financial report of Galileo Japan Trust (the ‘Trust’) for the year ended 30 June 2014.
All amounts in this report are in Australian dollars unless otherwise stated.
Corporate InformationThe Trust was registered with the Australian Securities and Investments Commission on 10 November 2006 and listed on the Australian
Securities Exchange (ASX) on 18 December 2006. The Responsible Entity of the Trust is incorporated and domiciled in Australia, with its
registered office located at Level 9, 1 Alfred Street, Sydney, NSW 2000.
DirectorsThe following persons have held office as directors of the Responsible Entity during the year ended 30 June 2014 and up to the date of this
report:
• Jack Ritch - Independent Non-Executive Chairman
• Philip Redmond - Independent Non-Executive Director
• Frank Zipfinger - Independent Non-Executive Director
• Neil Werrett - Managing Director and Chief Executive Officer
• Peter Murphy - Executive Director and Chief Operating Officer
During the year ended 30 June 2014 there were eight directors meetings held and all directors were present. During the year ended 30 June
2014 there were four meetings held by the Committee of Independent Directors relating to the recapitalisation transaction and all members
were present.
Details of directors
Jack Ritch, Non-Executive Chairman
Jack was non-executive Chairman of AMP Capital Investors Limited from April 2004 to March 2009. Prior to that, Jack was Managing
Director and Chairman of the company from 1999 to April 2004. From 1987 to 1999, Jack held the position of Director, Property, during
which time he was responsible for managing AMP’s $9 billion property portfolio. Prior to 1987, he held a variety of other positions within
the AMP Group which he joined in 1958. In April 2012 he retired as Chairman of Australia Pacific Airports Corporation Limited (owner of
Melbourne and Launceston airports). His other activities include Chairman of the Powerhouse Museum Foundation.
Philip Redmond, Non-Executive Director
Philip has over 30 years’ experience in the real estate industry in Australia, including 12 years at UBS where he held the position of Managing
Director – Head of Real Estate Australasia. Philip has played a leading role in the development of the listed property trust sector within
Australia and has a comprehensive understanding of financial markets. Philip is also a Non-Executive Director with Shopping Centres
Australasia Group and is a Member of the Australian Institute of Company Directors.
Frank Zipfinger, Non-Executive Director
Frank has over 30 years’ experience in the real estate industry. He was formerly a Partner in the Property, Construction & Environment
practice of the Sydney office of Mallesons Stephen Jaques where he specialised in property investment and development. Frank was also
the Chairman of Mallesons Stephen Jaques from 1 February 2005 until 30 June 2010. Prior to this appointment, Frank completed over five
years in various roles as a Managing Partner with the firm. Frank is the non-executive chairman of Aspen Property Group (ASX code APZ) and
chairman of the Investor Representative Committees of the AMP Capital Wholesale Office Fund and the AMP Capital Wholesale Shopping
Centre Fund. Frank is a Member of the Australian Institute of Company Directors. He is a member of the Executive Committee of the St
Joseph’s College Indigenous Fund, a member of the Board of Melbourne Business School and President of the school’s Alumni Council, and
a Director of the Australian Youth Orchestra.
1
For
per
sona
l use
onl
y

FOR THE YEAR ENDED 30 JUNE 2014
Directors’ Report (continued)
GALILEO JAPAN TRUST
Details of directors (continued)
Neil Werrett, Managing Director and Chief Executive Officer
Neil is the Managing Director and Chief Executive Officer and founder of the Trust. Neil was previously Global Head, Corporate Transactions
and Product Development at AMP Henderson Global Investors (now AMP Capital Investors), where he was employed for 24 years in various
roles covering property and property funds management. Neil’s roles at AMP included property acquisitions and disposals, the establishment
of the listed property trust business, ongoing capital raisings and participation in the management committee of the trusts. Until 2007, Neil
was also Managing Director and Chief Executive Officer of Galileo Shopping America Trust which he established in 2003. Neil has been
involved in the assessment of business and real estate opportunities in Japan since 1998 and was the founder of Galileo Japan Funds
Management Limited in 2006.
Peter Murphy, Executive Director and Chief Operating Officer
Peter has over 25 years’ experience in the property industry in numerous capacities including valuations, asset and funds management. Over
the past 18 years, he has been directly involved in the management of various listed property entities. Peter was the CEO of Ronin Property
Group which listed in 1996 as AMP Office Trust and had funds under management of approximately $2 billion throughout Australia and
New Zealand prior to a merger with Multiplex Group in November 2004. During his employment with Multiplex, Peter was Group Manager,
Marketing and Communications and Divisional Director, Institutional Funds responsible for in excess of $3 billion in funds under management.
Details of Company Secretary
Donna Duggan, Company Secretary and Compliance Officer
Donna Duggan is Compliance Officer and Company Secretary for Galileo Japan Funds Management Limited. Donna is a lawyer and has a
Chartered Secretaries Australia’s Graduate Diploma in Applied Corporate Governance.
Directors’ relevant Interests in the TrustThe number of units held, either directly or indirectly, by the directors of the Responsible Entity at balance date is outlined below along with
their entitlement to the estimated distribution for the six months ended 30 June 2014. There are no options to buy units in the Trust held by
any of the Directors of the Responsible Entity.
Distribution Due Units held 30 June 2014 Units held 30 June 2013
Jack Ritch $667 9,540 2,829
Philip Redmond $700 10,000 5,300
Frank Zipfinger $770 11,000 4,400
Neil Werrett* $269,385 3,848,364 515,031
Peter Murphy $1,176 16,803 16,803
* These units are owned by Galileo Japan Funds Management Limited and Galileo Investments Japan Pty Ltd. As part of the October 2013 recapitalisation, 3,333,333 units were acquired by Galileo Japan Funds Management Limited at the placement issue price of $1.50 per unit.
Principal Activity of the TrustThe principal activity of the Trust is to maximise the returns for unitholders via an indirect investment in a Japanese Tokumei Kumiai (‘TK
Business’) which owns a diverse portfolio of real estate assets in Japan.
2
For
per
sona
l use
onl
y

FOR THE YEAR ENDED 30 JUNE 2014
Directors’ Report (continued)
ANNUAL REPORT 2014
Operating and Financial Review
Recapitalisation undertaken during the year ended 30 June 2014As announced to the market in October 2013 the Trust successfully completed a recapitalisation that has resulted in a simplified capital
structure of the Trust and the TK Business, a reduction in gearing, an extension of the maturity of the senior loan facility and allowed for the
reinstatement of Trust distributions. The key components of the recapitalisation are outlined below.
i) Institutional book build
The Trust successfully completed an institutional book build which raised $147.5 million with 98,333,333 new units issued at $1.50 per
unit. The new units were allotted on 10 October 2013.
ii) Issue of new Eurobonds
The TK Business issued new Eurobonds with a par value of ¥6.12 billion ($67.0 million) at an issue price of ¥6.0 billion ($65.7 million). The
Eurobonds have a seven year term and a fixed interest rate of 8% per annum on the par value.
iii) Refinancing of the senior loan
The TK Business made a principal repayment of ¥6.45 billion ($70.6 million), including accrued interest thereon, and the senior loan was
refinanced on more favourable terms than those under the old facility, which include:
- extending the maturity date from March 2014 to October 2018;
- reducing the interest margin from 1.75% to 1.25%; and
- removing the principal amortisation requirement during the remaining term of the loan.
The above recapitalisation has simplified the capital structure of the Trust and the TK Business by:
i) refinancing and extending the maturity of the senior loan;
ii) repaying in full the mezzanine Eurobonds;
iii) repaying in full the convertible Eurobonds; and
iv) repaying in full the foreign currency loan at a discount to par of 68%.
Financial resultsThe adoption of AASB 2013-5 Amendments to Australian Accounting Standards – Investment Entities has resulted in significant presentation
and disclosure changes for the financial statements of the Trust. Refer to Note 2(b) Application of new and revised accounting standards for
further details of the change in accounting policy and its impact.
Through its indirect investment in the Japanese TK Business, the Trust holds a beneficial interest in 21 properties (30 June 2013: 21
properties). The fair value of investment property held by the TK Business is a significant component of the fair value of the Trust’s investment
in the TK Business. At 30 June 2014 the fair value of investment property equates to ¥58.5 billion ($613.0 million) which is up 1.9% (in ¥
terms) from 30 June 2013 (¥57.38 billion; $626.1 million) however, lower in Australian dollar terms as a result of the weaker Japanese yen.
The 30 June 2014 value has been determined using independent valuations for nine properties prepared by DTZ Debenham Tie Leung KK (DTZ).
Seven properties were also valued by DTZ at 31 December 2013. The balance of the portfolio is recorded at the Directors’ assessment of fair value.
Key points relating to the financial result for the year ended 30 June 2014 are summarised below.
• Fair value gain on financial assets held at fair value through profit or loss of $21.2 million (30 June 2013: loss of $2.5 million);
• Unrealised foreign exchange loss for the year of $9.9 million (30 June 2013: $11.9 million) as a result of the weaker Japanese yen ($1.00 =
¥95.43) compared to 30 June 2013 ($1.00 = ¥91.64);
• Net asset value of $2.19 per unit at 30 June 2014;
• The repayment in full of the foreign currency loan at a discount of 68% to its par value has resulted in debt forgiveness of $26.1 million
being recognised in the Income Statement for the year;
• There is a net current asset deficiency at balance date equal to $2.2 million. This is as a result of the provision for distribution of $7.5 million
which will be paid to unitholders on 29 August 2014. The funds from operations for the June 2014 quarter of $4.2 million that will partially
fund the distribution to unitholders were paid by the TK Business to the Trust in August 2014 per the normal cash waterfall process that
takes place after the end of each calendar quarter. These funds, together with the funds already received by the Trust for the March 2014
quarter, are available for the Trust to use for the distribution to unitholders.
3
For
per
sona
l use
onl
y

FOR THE YEAR ENDED 30 JUNE 2014
Directors’ Report (continued)
GALILEO JAPAN TRUST
DistributionsAs announced to the market on 20 June 2014 the Trust will pay a distribution for the six months ended 30 June 2014 equivalent to 7.0 cents
per unit on 29 August 2014. Together with the interim distribution paid in February 2014 of 3.5 cents per unit, the total distribution for the year
ended 30 June 2014 is 10.5 cents per unit. This equates to an annualised distribution yield of 9.7% on an issue price of $1.50 for new units
issued on 10 October 2013.
The Trust’s Distribution Reinvestment Plan (DRP) is not in operation.
Fees Paid by the Trust to the Responsible EntityFees paid or payable to the Responsible Entity for services provided during the year are determined in accordance with the Trust Constitution
and disclosed in Note 18 Related party disclosures of the financial statements. The Responsible Entity is entitled to receive a base responsible
entity fee up to 0.4% per annum of the Trust’s direct and indirect proportionate interest (i.e. 98.5%) in the properties and other assets held in
the TK Business. As the TK operator in Japan charges an asset management fee of 0.3% per annum, the Responsible Entity fee charged in
Australia is 0.1% per annum.
From September 2009 and up until the October 2013 refinance, the Responsible Entity agreed to waive its base fee (0.1% per annum) and
put in place an operating cost recovery arrangement. The Trust was liable to reimburse the Responsible Entity for operating costs of up to
$50,000 per month relating to costs for the ongoing management of the Trust. The payment of these costs was deferred until all outstanding
obligations to the Mezzanine and Convertible Eurobond holders and the foreign currency facility lender were repaid.
As discussed in Note 10 Borrowings and Note 15 Segment information, the mezzanine and convertible Eurobond noteholders and the lender
under the foreign currency loan facility were repaid as part of the Trust recapitalisation that occurred in October 2013. Subsequently, the
accumulated outstanding cost recovery charge at the date of the October 2013 recapitalisation of $2.4 million was paid by the Trust to the
Responsible Entity and the payment of the 0.1% per annum responsible entity fee commenced from that date.
Likely developments and expected results of operationsThe trust will continue to pursue strategies aimed at maximising the returns for unitholders and enhancing unitholder value via its indirect
investment in a Japanese TK Business. Information on likely developments and expected results of operations have not been included in this
annual financial report as the Directors believe it would be likely to result in unreasonable prejudice to the Trust.
Events subsequent to balance dateAs announced to the market on 24 July 2014, the Japanese TK business completed the sale of its beneficial interest in Lions Square, located
in Saitama prefecture, Greater Tokyo for ¥2.385 billion ($25.0 million). The Trust’s investment in the TK Business at 30 June 2014 includes this
property at the sale price.
On 22 August 2014, the Responsible Entity announced its intention to undertake an on-market buy-back of the Trust’s units. The buy-back
will be funded through the net proceeds released from the recent sale of Lions Square. Should market conditions permit, the Trust intends
to buy-back up to the lesser of $5.0 million worth of units, and 10% of the Trust’s present issued capital. Further details are set out in the
Appendix 3C released to the market on 22 August 2014.
The Directors are not aware of any other matter or circumstance occurring since 30 June 2014 not otherwise dealt with in the financial report
that has significantly or may significantly alter the operations of the Trust, the results of those operations or the state of affairs of the Trust in
subsequent financial periods.
Significant changes in the state of affairsIn the opinion of the Directors of the Responsible Entity, other than the matters discussed above, including the successful recapitalisation of
the Trust, there were no significant changes in the state of affairs of the Trust that occurred during the year ended 30 June 2014 and up to
the date of this report.
4
For
per
sona
l use
onl
y
FOR THE YEAR ENDED 30 JUNE 2014
Directors’ Report (continued)
ANNUAL REPORT 2014
Rounding of amountsThe Trust is a registered scheme of a kind referred to in Class Order 98/0100 issued by the Australian Securities & Investments Commission
relating to the ‘rounding off’ of amounts in the Directors’ report and financial report. Amounts in the Directors’ report and financial statements
have been rounded to the nearest thousand dollars in accordance with that Class Order, unless otherwise indicated.
Indemnification and insurance of directors, officers and auditorsThe Responsible Entity has insured the directors and officers against liabilities incurred in their role as directors and officers of the Responsible
Entity. The Trust reimburses the Responsible Entity based on the benefit it receives under the policy. The directors and officers are indemnified
out of the assets of the Trust as long as they act in accordance with the Trust Constitution and the Corporations Act 2001. The auditor of
the Trust is in no way indemnified out of the assets of the Trust, nor has the Trust indemnified or agreed to indemnify an auditor of the Trust
against a liability incurred as an auditor.
Corporate governanceIn recognising the need for the highest standards of corporate behaviour and accountability, the directors of the Responsible Entity support
the principles of corporate governance. The Responsible Entity’s corporate governance statement is contained in the Corporate Governance
section of the Annual Report.
Environmental regulationTo the best of the Directors’ knowledge the operations of the Trust have been undertaken in compliance with the applicable environmental
regulations in each jurisdiction in which the Trust operates.
Auditor’s independence declarationA copy of the auditor’s independence declaration as required under section 307C of the Corporations Act 2001 forms part of this report and
is set out on page 6.
This report is signed in accordance with a resolution of the Directors of the Responsible Entity.
Jack Ritch
Chairman
Sydney, 28 August 2014
5
For
per
sona
l use
onl
y
FOR THE YEAR ENDED 30 JUNE 2014
Auditor’s Independence Declaration
GALILEO JAPAN TRUST
PricewaterhouseCoopers, ABN 52 780 433 757 Darling Park Tower 2, 201 Sussex Street, GPO BOX 2650, SYDNEY NSW 1171T: +61 2 8266 0000, F: +61 2 8266 9999, www.pwc.com.au
Liability limited by a scheme approved under Professional Standards Legislation.
6
Auditor’s Independence Declaration
As lead auditor for the review of Galileo Japan Trust for the year ended 30 June 2014, I declare that to the best of my knowledge and belief, there have been:
a) no contraventions of the auditor independence requirements of the Corporations Act 2001 in relation to the audit; and
b) no contraventions of any applicable code of professional conduct in relation to the audit.
E A Barron SydneyPartner 28 August 2014PricewaterhouseCoopers
TO THE MEMBERS OF GALILEO JAPAN TRUST
Independent Auditor’s Report to Unitholders (continued)
GALILEO JAPAN TRUST
38
6
For
per
sona
l use
onl
y

FOR THE YEAR ENDED 30 JUNE 2014
Income Statement
ANNUAL REPORT 2014
2014 2013*
Note $’000 $’000
Revenue and other incomeFair value gain on financial assets held at fair value through profit or loss 8 21,178 - Debt forgivenes - foreign currency loan facility 10 26,061 - Interest income 18 - Total revenue and other income 47,257 -
ExpensesFair value loss on financial assets held at fair value through profit or loss 8 - (2,521) Finance costs - foreign currency loan facility (1,045) (3,807) Responsible ebtity fees and costs 18 (639) (600) Auditors remunderation 5 (308) (294) Professional fees (255) (615) Other expenses (407) (392) Unrealised foreign exchange loss (9,927) (11,898) Total expenses (12,581) (20,127)
Net profit/(loss) before tax for the year 34,676 (20,127)
Income tax credit 6 - 1,877
Net profit/(loss) after tax for the year 34,676 (18,250)
Basic and diluted earnings per unit (dollars) 14 0.44 (2.25)
* refer to Note 3 for restatement as a result of a change in accounting policy
The Income Statement should be read in conjunction with the accompanying notes.
7
For
per
sona
l use
onl
y

FOR THE YEAR ENDED 30 JUNE 2014
GALILEO JAPAN TRUST
Statement of Comprehensive Income
2014 2013*
$’000 $’000
Net profit/(loss) after tax for the year 34,676 (18,250) Other comprehensive income - - Total comprehensive income 34,676 (18,250)
* refer to Note 3 for restatement as a result of a change in accounting policy
The Statement of Comprehensive Income should be read in conjunction with the accompanying notes.
8
For
per
sona
l use
onl
y
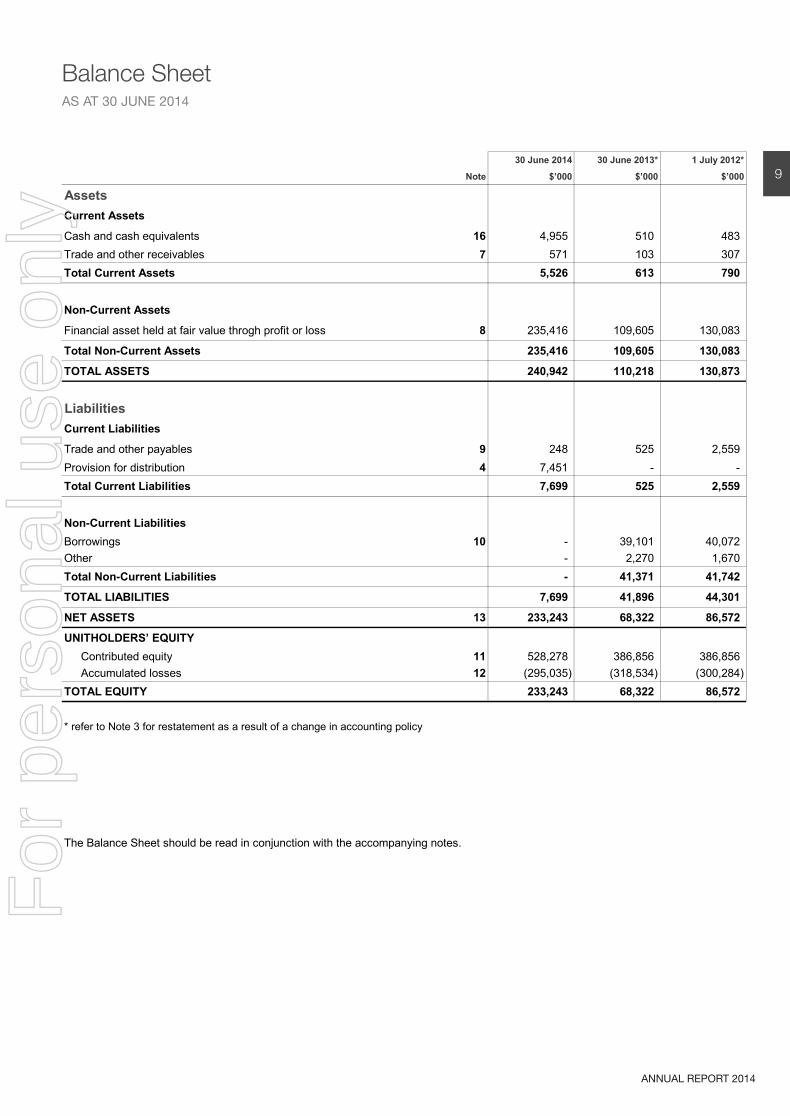
AS AT 30 JUNE 2014
Balance Sheet
ANNUAL REPORT 2014
30 June 2014 30 June 2013* 1 July 2012*
Note $’000 $’000 $’000
AssetsCurrent Assets
Cash and cash equivalents 16 4,955 510 483 Trade and other receivables 7 571 103 307 Total Current Assets 5,526 613 790
Non-Current Assets
Financial asset held at fair value throgh profit or loss 8 235,416 109,605 130,083
Total Non-Current Assets 235,416 109,605 130,083
TOTAL ASSETS 240,942 110,218 130,873
LiabilitiesCurrent Liabilities
Trade and other payables 9 248 525 2,559 Provision for distribution 4 7,451 - - Total Current Liabilities 7,699 525 2,559
Non-Current LiabilitiesBorrowings 10 - 39,101 40,072 Other - 2,270 1,670 Total Non-Current Liabilities - 41,371 41,742
TOTAL LIABILITIES 7,699 41,896 44,301
NET ASSETS 13 233,243 68,322 86,572
UNITHOLDERS’ EQUITYContributed equity 11 528,278 386,856 386,856 Accumulated losses 12 (295,035) (318,534) (300,284)
TOTAL EQUITY 233,243 68,322 86,572
* refer to Note 3 for restatement as a result of a change in accounting policy
The Balance Sheet should be read in conjunction with the accompanying notes.
9
For
per
sona
l use
onl
y

GALILEO JAPAN TRUST
FOR THE YEAR ENDED 30 JUNE 2014
Statement of Changes in Equity
Contributed Equity Reserves
Accumulated Losses Total
Non-controlling
interest Total equity$'000 $'000 $'000 $'000 $'000 $'000
Balance at 1 July 2013* 386,856 - (318,534) 68,322 - 68,322
Profit for the year - - 34,676 34,676 - 34,676
Transactions with Unitholders in theircapacity as unitholders:Issue of share capital 147,500 - - 147,500 - 147,500
Costs incurred in relation to equity issued (6,078) - - (6,078) - (6,078) Distribution paid or payable - - (11,177) (11,177) - (11,177) Balance at 30 June 2014 528,278 - (295,035) 233,243 - 233,243
Balance 1 July 2012 (as reported) 386,856 72,347 (372,631) 86,572 2,598 89,170
Adjustment due to change in accounting policy* - (72,347) 72,347 - (2,598) (2,598)
Restated total equity at the beginning of the year 386,856 - (300,284) 86,572 - 86,572 Loss for the year - - (18,250) (18,250) - (18,250)
- Transactions with Unitholders in theircapacity as unitholders:Issue of share capital - - - - - Distribution paid or payable - - - - - Balance 30 June 2013 (restated) 386,856 - (318,534) 68,322 - 68,322
* refer to Note 3 for restatement as a result of a change in accounting policy
The Statement of Changes in Equity should be read in conjunction with the accompanying notes.
10
For
per
sona
l use
onl
y

FOR THE YEAR ENDED 30 JUNE 2014
Statement of Cash Flows
ANNUAL REPORT 2014
2014 2013*
Note $’000 $’000
Cash flows from operating activitiesInterest received 18 - Operating costs paid (4,093) (1,389) GST received/(paid) (436) 22 Net cash outflow from operating activities 19 (4,511) (1,367)
Cash flows from investing activitiesInvestment in financial assets held at fair value through profit or loss 8 (123,359) -
Distributions received 8 8,714 1,394
Net cash inflow/(outflow) from investing activities (114,645) 1,394
Cash flows from financing activitiesProceeds from the issue of units 147,500 - Costs incurred in relation to the issue of units (6,078) - Distributions paid to unitholders (3,726) - Repayment of borrowings (14,086) - Net cash inflow from financing activities 123,610 -
Net decrease in cash and cash equivalents 4,454 27 Effect of foreign exchange movements on cash (9) -
Cash and cash equivalents at the beginning of the year 510 483
Cash and cash equivalents at the end of the year 16 4,955 510
* refer to Note 3 for restatement as a result of a change in accounting policy
The Statement of Cash Flows should be read in conjunction with the accompanying notes.
Consolidated11
For
per
sona
l use
onl
y

FOR THE YEAR ENDED 30 JUNE 2014
Notes to the Financial Statements
GALILEO JAPAN TRUST
Note 1. General Information
Note 2. Summary of significant accounting policies
(a) Basis of preparation
Critical accounting estimates
(b) Application of new and revised accounting standards
AASB 9 Financial Instruments, AASB 2009-11 Amendments to Australian Accounting Standards arising from AASB 9 and AASB 2010-7 Amendments to Australian Accounting Standards arising from AASB 9 (December 2010) (effective from 1 January 2018).
AASB 9 Financial Instruments addresses the classification, measurement and derecognition of financial assets and financial liabilities. The standard is not applicable until 1 January 2018 but is available for early adoption. When adopted, the standard will affect the classification and measurement of financial assets and liabilities. The Responsible Entity’s preliminary assessment shows that the new standard will not have a significant impact on the composition of the Financial Statements and the Trust does not expect to adopt the new standard before the operative date.
Galileo Japan Trust (the ‘Trust’) was established pursuant to the Trust Constitution and was registered as a managed investment scheme with the Australian Securities and Investments Commission on 10 November 2006. The Trust was listed on the Australian Securities Exchange on 18 December 2006.
The Trust’s aim is to maximise the returns for unitholders via an indirect investment in a Japanese Tokumei Kumiai (‘TK Business’) which owns a diverse portfolio of real estate assets in Japan.
These general purpose financial statements have been prepared in accordance with the requirements of the Trust Constitution, Australian Accounting Standards, other authoritative pronouncements of the Australian Accounting Standards Board, Urgent Issues Group Interpretations and the Corporations Act 2001. The financial statements also comply with International Financial Reporting Standards as issued by the International Accounting Standards Board. The Trust is a for-profit entity for the purpose of preparing the financial statements.
These financial statements have been prepared on a going concern basis and under the historical cost convention, as modified by the revaluation of financial assets and financial liabilities at fair value through profit or loss.
There is a net current asset deficiency at balance date equal to $2.2 million. This is as a result of the provision for distribution of $7.5 million which will be paid to unitholders on 29 August 2014. The funds from operations for the June 2014 quarter of $4.2 million that will partially fund the distribution to unitholders were paid by the TK Business to the Trust in August 2014 per the normal cash waterfall process that takes place after the end of each calendar quarter. These funds, together with the funds already received by the Trust for the March 2014 quarter, are available for the Trust to use for the distribution to unitholders. As a result, the Directors believe there are reasonable grounds that, at the date of this report, the Trust will be able to pay its debts as and when they become due and payable.
The financial report was approved by the Board of Directors on 28 August 2014.
The preparation of financial statements in conformity with generally accepted accounting principles requires the use of estimates and assumptions that affect the amounts of assets and liabilities reported at the end of the year and the amounts of revenues and expenses recognised during the year. Although the estimates are based on management's best knowledge, actual results may ultimately differ from these. Where any such judgements are made they are indicated within the relevant accounting policies and related note in the financial statements. The estimates and assumptions that have a significant risk of causing a material adjustment to the fair value of assets and liabilities within the financial statements of the Trust are described in Note 2(b) Application of new and revised accounting standards and Note 8 Financial assets at fair value through profit or loss.
The principal accounting policies adopted in the preparation of these financial statements are set out below. These policies have been consistently applied to the periods presented unless otherwise stated.
Certain new accounting standards and interpretations have been published, some of which are applicable for the current reporting period and some which are applicable in future reporting periods. The Responsible Entity’s assessment of the application and impact of these new standards and interpretations is set out below.
12
For
per
sona
l use
onl
y

FOR THE YEAR ENDED 30 JUNE 2014
Notes to the Financial Statements
ANNUAL REPORT 2014
13Note 2. Summary of significant accounting policies (continued)
Changes in accounting policy or disclosure as a result of new accounting standards adopted during the year
(b) Application of new and revised accounting standards
The Trust has applied the following standards and amendments for first time during the year:
(i) AASB 10 Consolidated Financial Statements and AASB 2013-5 Amendments to Australian Accounting Standards – Investment Entities (ii) AASB 12 Disclosure of Interests in Other Entities; (iii) AASB 2012-10 Amendments to Australian Accounting Standards – Transition Guidance and other Amendments which provides an exemption from the requirement to disclose the impact of the change in accounting policy in the current period;(iv) AASB 13 Fair Value Measurement and AASB 2011-8 Amendments to Australian Accounting Standards arising from AASB 13; and(v) AASB 2012-2 Amendments to Australian Accounting Standards – Disclosures – Offsetting Financial Assets and Financial Liabilities.
The adoption of the new standards and amendments outlined above has no material impact on the measurement or disclosures of the annual financial report with the exception of AASB10, AASB 12 and AASB 13 as set out below:
AASB 10 Consolidated Financial Statements and AASB 2013-5 Amendments to Australian Accounting Standards – Investment Entities
The objective of AASB 10 is to establish principles for the preparation and presentation of consolidated financial statements. It sets out how to apply the principle of control to identify whether, for Australian accounting purposes, an investor controls an investee. The Responsible Entity has determined that, while judgemental, given the structure of the investment in the TK Business (refer to Note 8), the Trust continues to control the TK Business as defined in Australian Accounting Standards.
The amendments made by AASB 2013-5 introduce an exemption from consolidation requirements for investment entities. This accounting standard is effective for annual reporting periods beginning on or after 1 January 2014, but can be adopted early. The Responsible Entity has elected to early adopt this accounting standard. It defines an investment entity and sets out the accounting treatment and measurement requirements of investments in other entities. The Responsible Entity has determined that the Trust meets the definition of an investment entity for the purpose of the application of this accounting standard and it has therefore changed its accounting policy with respect to its investments. The TK Business, which was previously consolidated, is now accounted for at fair value through profit or loss. The early adoption of this accounting standard has resulted in significant presentation and disclosure changes for the financial statements of the Trust, the impact of which is shown in Note 3 of the financial statements.
AASB 12 Disclosure of Interests in Other Entities
AASB 12 requires entities to disclose significant judgments and assumptions made in determining whether the entity controls, jointly controls, significantly influences or has some other interests in other entities. Entities are also required to provide more disclosures around certain ‘structured entities’.
The adoption of AASB 12 has impacted the Group’s level of disclosures in certain of the above noted areas, but has not impacted the Group’s financial position or results of operations. AASB 12 provides relief from disclosing comparative information in the first year of adopting the standard. As a result comparative information has not been disclosed for the new disclosure requirements of AASB 12.
AASB 13 Fair Value measurement
This accounting standard establishes a single source of guidance for determining the fair value of assets and liabilities. AASB 13 does not change when an entity is required to use fair value, rather, provides guidance on how to determine fair value when fair value is required or permitted. AASB 13 also expands the disclosure requirements for all assets and liabilities carried at fair value. This includes information about the assumptions made and the qualitative impact of those assumptions on the fair value determined. Additional disclosure for financial assets and liabilities is required for the first time in this financial report.
Consequential amendments were also made to other accounting standards via AASB 2011-8 which has resulted in additional disclosures regarding the fair value of financial instruments.
The adoption of other amendments and changes in accounting standards that were effective in this reporting period did not result in any material changes to the financial report.
For
per
sona
l use
onl
y

FOR THE YEAR ENDED 30 JUNE 2014
Notes to the Financial Statements
GALILEO JAPAN TRUST
14Note 2. Summary of significant accounting policies (continued)
(c) Significant accounting policies
(d) Cash and cash equivalents
(e) Trade and other receivables
(f) Financial assets at fair value through profit or loss
(g) Impairment of assets
Trade and other receivables are recognised initially at fair value and subsequently measured at amortised cost less any impairment losses (bad debts), which represents fair value for the Trust. An estimate of provision for doubtful debts is made when collection is no longer probable. Bad debts are written off to the Income Statement as incurred. Receivables from related parties are carried at the nominal amount due.
Cash and cash equivalents includes cash on hand, deposits at call with financial institutions and other short-term, highly liquid investments with original maturities of three months or less that are readily convertible into cash and are subject to an insignificant risk of change in value.
The accounting policies adopted are consistent with those of the previous financial year except for the accounting policies referred to in Note 2(b) above.
Foreign currency
Functional and presentation currencyItems included in the financial statements are measured using the currency of the primary economic environment in which the entity operates (‘the functional currency’). The financial statements are presented in Australian dollars, being the Trust’s functional and presentation currency.
Translation of foreign currency transactionsForeign currency transactions are initially translated into Australian dollars at the rate of exchange at the date of the transactions. At balance date, monetary assets and liabilities denominated in foreign currencies are translated to Australian dollars at rates of exchange current at that date. Non-monetary items measured at fair value in a foreign currency are translated using the exchange rates at the date when the fair value was determined.
Translation differences on assets and liabilities carried at fair value are reported separately in the Income Statement.
The foreign exchange rate at the balance date was A$1=¥95.43 (30 June 2013: A$1=¥91.64) while the average foreign exchange rate for the year ended 30 June 2014 was A$1=¥92.77 (30 June 2013: A$1=¥89.79). Foreign exchange differences arising on translation are recorded in the Income Statement.
The Trust classifies its investment in the TK Business as a financial asset at fair value through profit or loss. Assets in this category are classified as current assets if they are expected to be settled within 12 months, otherwise they are classified as non-current.
Purchases and sales of financial assets are recognised on trade date, the date on which the Trust commits to purchase or sell the asset. Financial assets are derecognised when the rights to receive cash flows from the financial assets have expired or have been transferred and the Trust has transferred substantially all the risks and rewards of ownership.
The directors of the Responsible Entity assess at each reporting date whether there is an indication that an asset may be impaired. If any such indication exists, an estimate is made of the asset’s recoverable amount. Recoverable amount is the higher of an asset’s fair value less costs to sell and value in use. For the purposes of determining impairment, assets are grouped at the lowest levels for which there are separately identifiable cash inflows which are largely independent of the cash inflows from other assets or groups of assets. When the carrying amount of an asset exceeds its recoverable amount the asset is considered impaired and is written down to its recoverable amount.
For
per
sona
l use
onl
y
FOR THE YEAR ENDED 30 JUNE 2014
Notes to the Financial Statements
ANNUAL REPORT 2014
15Note 2. Summary of significant accounting policies (continued)
(h) Trade and other payables
(i) Contributed equity
(j) Revenue
(k) Expenditure
(l) Finance costs
(m) Taxation
Issued and paid up units are recognised at the fair value of the consideration received or receivable. Any transaction costs arising directly from the issue of ordinary units are recognised directly in equity as a reduction of the proceeds received provided that they would not have been incurred had these instruments not been issued. The Trust has a perpetual life unless it is terminated.
Revenue is recognised at fair value of the consideration received net of the amounts of goods and services tax (GST) or consumption tax (CT) payable to taxation authorities. Interest revenue is recognised on an accruals basis using the effective interest rate method. Distribution revenue is recognised when there is a right to receive the distribution payment.
Expenditure is brought to account on an accruals basis. Fees paid to the Responsible Entity are brought to account on an accruals basis.
Finance costs incurred in establishing borrowing facilities are capitalised and amortised over the term of the facility. Finance costs incurred in drawing funds under a loan are transaction costs which are offset against the proceeds of the loan and other interest expenses are expensed as incurred. Where there is a deemed extinguishment of a loan due to a substantial modification of the terms of an existing financial liability, the pre-existing capitalised finance costs and any costs incurred in relation to that loan modification are expensed in the period of the extinguishment.
i) Australian income taxUnder current Australian income tax legislation, the Trust is not liable for income tax provided unitholders are presently entitled to all of the Trust’s taxable distributable income at 30 June each year and any taxable gain derived from the sale of an asset acquired after 19 September 1985 is fully distributed to unitholders. Rather, unitholders should be subject to tax on their proportionate share of the taxable income of the Trust. Distributions received by unitholders in excess of their proportionate share of the taxable income of the Trust for an income year will be in the form of tax deferred distributions, and should be applied to reduce unitholders capital gains tax cost base of their units. Tax deferred amounts are usually attributable to allowances for building, plant and equipment depreciation are distributed to unitholders in the form of tax deferred components of distributions.
ii) Japanese withholding taxEffective as of 1 January 2013, all foreign corporations and non-resident individuals that do not have permanent establishments in Japan are subject to 20.42% withholding tax on the distribution of profits under TK arrangements. The withholding tax is the final Japanese tax on such distributed TK profits and such profits are not subject to any other Japanese taxes (assuming that such investor is not a resident of/does not have permanent establishment in Japan). The amount of profit that is allocated to TK investors under a TK agreement is immediately deductible from the TK operator’s taxable income regardless of whether a distribution to any TK investor is actually made at that time. The withholding tax described above however, is only imposed on an actual distribution of profit to investors.
Trade and other payables are carried at cost, which is the fair value of consideration to be paid in the future for the goods and services provided, whether or not billed to the Trust. Payables to related parties are carried at the principal amount. The amounts are unsecured and are usually paid within 30 days of recognition.
For
per
sona
l use
onl
y

FOR THE YEAR ENDED 30 JUNE 2014
Notes to the Financial Statements
GALILEO JAPAN TRUST
16Note 2. Summary of significant accounting policies (continued)
(n) Goods and services tax and consumption tax
(o) Earnings per unit
(p) Segment reporting
(q) Distributions
(r) Comparative figures
(s) Rounding of amounts
The comparative figures represent the year ended 30 June 2013. Where applicable, certain comparative figures are restated in order to comply with the current year presentation of the financial statements, as outlined in Note 3 Changes in accounting policy.
Revenues, expenses and assets are recognised net of the amount of Goods and Services Tax (GST) or Japanese consumption tax (consumption tax), except where the amount of GST or consumption tax incurred is not recoverable from the Australian Tax Office (ATO) or Japanese tax authority (“tax authorities”). In these latter circumstances the GST or consumption tax is recognised as part of the cost of acquisition of the asset or as part of an item of the expense.
Receivables and payables are stated with the amount of GST or consumption tax included. The net amount of GST or consumption tax recoverable from, or payable to, the tax authorities is included as a current asset or liability in the statement of financial position. The GST or consumption tax components of cash flows arising from investing and financing activities which are recoverable from, or payable to, the tax authorities are classified as operating cash flows.
Basic and diluted earnings per unit are calculated as net profit after tax divided by the weighted average number of ordinary units.
Segment income, expenditure, assets and liabilities are those that are directly attributed to a segment and the relevant portion that can be allocated to the segment on a reasonable basis. Segment assets are assets used by segments and consist primarily of cash, receivables (net of allowances) and investments. While the Trust’s investment in the TK Business is carried at fair value through the profit or loss, the Directors believe that it is relevant to provide segment information on the underlying assets, liabilities and performance of the TK Business. Therefore, segment information is presented on the same basis as that used for internal reporting and analysis purposes, in a manner consistent with the internal reporting to the chief operating decision maker, being the Board of Directors.
A provision for distribution is recognised as a liability when it is declared, determined or made publicly available on or before the reporting date. Provisions are measured at the present value and management’s best estimate of the expenditure required to settle the present obligation at the balance date.
The Trust is a registered scheme of a kind referred to in Class Order 98/0100 issued by the Australian Securities & Investments Commission relating to the ‘rounding off’ of amounts in the directors’ report and the financial statements. Amounts in the directors’ report and the financial statements have been rounded to the nearest thousand dollars in accordance with that Class Order, unless otherwise indicated.
For
per
sona
l use
onl
y

FOR THE YEAR ENDED 30 JUNE 2014
Notes to the Financial Statements
ANNUAL REPORT 2014
17Note 3. Changes in accounting policy
Restated comparative income statement30 June 2013 Increase/ 30 June 2013
(as reported) (decrease) (restated)
$’000 $’000 $’000
Revenue and other incomeRental income 60,022 (60,022) - Gain on financial instruments 381 (381) - Interest and other income 9 (9) - Total revenue and other income 60,412 (60,412) -
ExpensesFair value loss on financial assets held at fair value through profit or loss - (2,521) (2,521) Property expenses (18,811) 18,811 - Finance costs - foreign currency loan (3,807) - (3,807) Finance costs - other borrowings (27,139) 27,139 - Loss on investment property revaluations (10,251) 10,251 - Loss on disposal of investment property (1,057) 1,057 - Unrealised foreign exchange loss - (11,898) (11,898) Other expenses (7,468) 5,567 (1,901) Total expenses (68,533) 48,406 (20,127)
Loss before tax for the year (8,121) (12,006) (20,127) Income tax credit 1,877 - 1,877 Loss after tax for the year (6,244) (12,006) (18,250)
Other comprehensive income:Foreign exchange translation adjustments (11,898) 11,898 - Total comprehensive loss for the year (18,142) (108) (18,250)
Net loss attributable to: - Unitholders of the Trust (6,352) (11,898) (18,250) - Non-controlling interest 108 (108) -
(6,244) (12,006) (18,250)
Total comprehensive income attributable to: - Unitholders of the Trust (18,250) 18,250 - - Non-controlling interest 108 (108) -
(18,142) 18,142 -
As disclosed in Note 2(b) the Trust has early adopted AASB 2013-5 Amendments to Australian Accounting Standards – Investment Entities. This accounting standard defines an investment entity and sets out the accounting treatment and measurement requirements of investments in other entities. As a consequence of adopting this accounting standard, the accounting treatment of the Trust’s investment in the TK Business is recorded at fair value as a single line item in the balance sheet with changes in value being recorded through the income statement.
Restated comparative information is provided in the table below to show the effect of early adopting this accounting standard.
For
per
sona
l use
onl
y
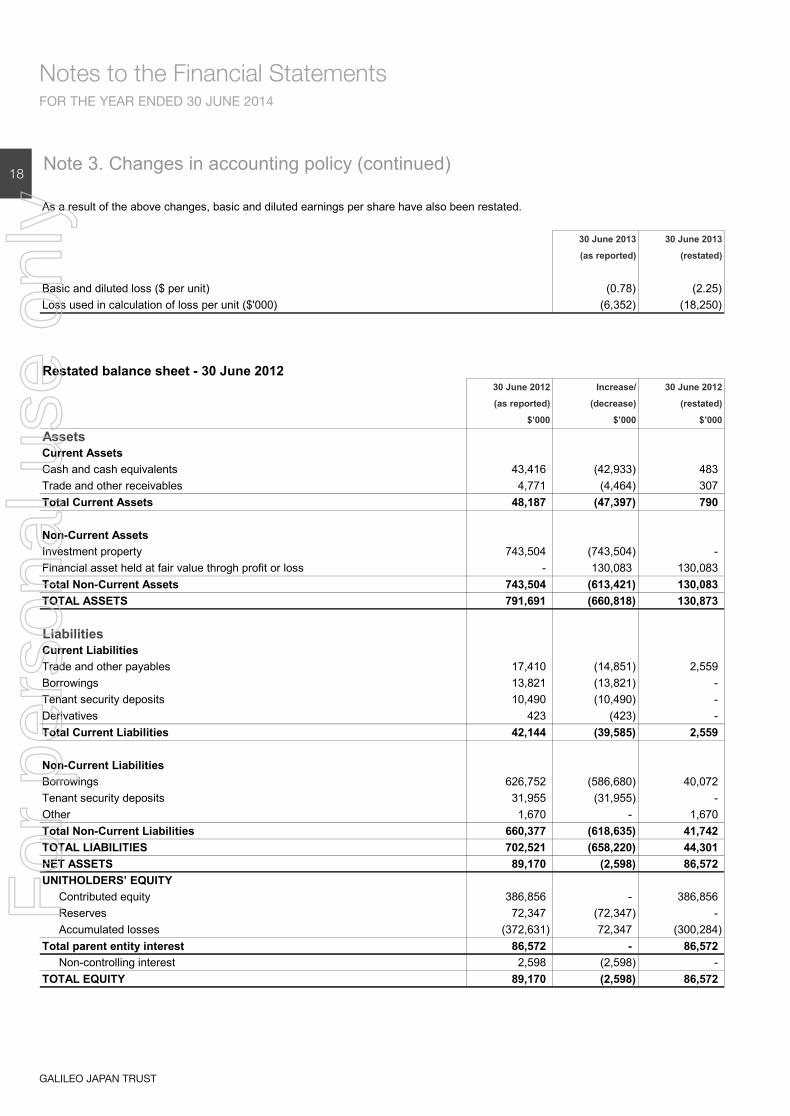
FOR THE YEAR ENDED 30 JUNE 2014
Notes to the Financial Statements
GALILEO JAPAN TRUST
18Note 3. Changes in accounting policy (continued)
30 June 2013 30 June 2013
(as reported) (restated)
Basic and diluted loss ($ per unit) (0.78) (2.25) Loss used in calculation of loss per unit ($'000) (6,352) (18,250)
Restated balance sheet - 30 June 201230 June 2012 Increase/ 30 June 2012
(as reported) (decrease) (restated)
$’000 $’000 $’000
AssetsCurrent AssetsCash and cash equivalents 43,416 (42,933) 483 Trade and other receivables 4,771 (4,464) 307 Total Current Assets 48,187 (47,397) 790
Non-Current AssetsInvestment property 743,504 (743,504) - Financial asset held at fair value throgh profit or loss - 130,083 130,083 Total Non-Current Assets 743,504 (613,421) 130,083 TOTAL ASSETS 791,691 (660,818) 130,873
LiabilitiesCurrent LiabilitiesTrade and other payables 17,410 (14,851) 2,559 Borrowings 13,821 (13,821) - Tenant security deposits 10,490 (10,490) - Derivatives 423 (423) - Total Current Liabilities 42,144 (39,585) 2,559
Non-Current LiabilitiesBorrowings 626,752 (586,680) 40,072 Tenant security deposits 31,955 (31,955) - Other 1,670 - 1,670 Total Non-Current Liabilities 660,377 (618,635) 41,742 TOTAL LIABILITIES 702,521 (658,220) 44,301 NET ASSETS 89,170 (2,598) 86,572 UNITHOLDERS’ EQUITY
Contributed equity 386,856 - 386,856 Reserves 72,347 (72,347) - Accumulated losses (372,631) 72,347 (300,284)
Total parent entity interest 86,572 - 86,572 Non-controlling interest 2,598 (2,598) -
TOTAL EQUITY 89,170 (2,598) 86,572
As a result of the above changes, basic and diluted earnings per share have also been restated.
For
per
sona
l use
onl
y
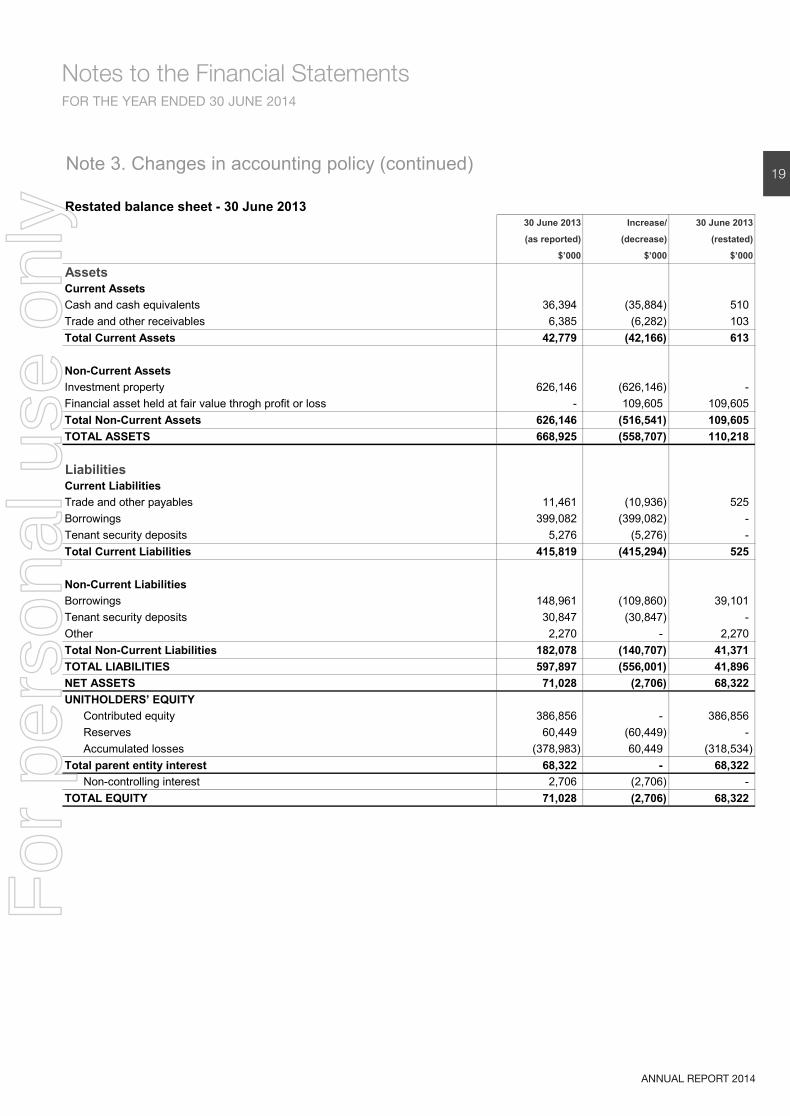
FOR THE YEAR ENDED 30 JUNE 2014
Notes to the Financial Statements
ANNUAL REPORT 2014
19Note 3. Changes in accounting policy (continued)
Restated balance sheet - 30 June 201330 June 2013 Increase/ 30 June 2013
(as reported) (decrease) (restated)
$’000 $’000 $’000
AssetsCurrent AssetsCash and cash equivalents 36,394 (35,884) 510 Trade and other receivables 6,385 (6,282) 103 Total Current Assets 42,779 (42,166) 613
Non-Current AssetsInvestment property 626,146 (626,146) - Financial asset held at fair value throgh profit or loss - 109,605 109,605 Total Non-Current Assets 626,146 (516,541) 109,605 TOTAL ASSETS 668,925 (558,707) 110,218
LiabilitiesCurrent LiabilitiesTrade and other payables 11,461 (10,936) 525 Borrowings 399,082 (399,082) - Tenant security deposits 5,276 (5,276) - Total Current Liabilities 415,819 (415,294) 525
Non-Current LiabilitiesBorrowings 148,961 (109,860) 39,101 Tenant security deposits 30,847 (30,847) - Other 2,270 - 2,270 Total Non-Current Liabilities 182,078 (140,707) 41,371 TOTAL LIABILITIES 597,897 (556,001) 41,896 NET ASSETS 71,028 (2,706) 68,322 UNITHOLDERS’ EQUITY
Contributed equity 386,856 - 386,856 Reserves 60,449 (60,449) - Accumulated losses (378,983) 60,449 (318,534)
Total parent entity interest 68,322 - 68,322 Non-controlling interest 2,706 (2,706) -
TOTAL EQUITY 71,028 (2,706) 68,322
For
per
sona
l use
onl
y

FOR THE YEAR ENDED 30 JUNE 2014
Notes to the Financial Statements
GALILEO JAPAN TRUST
20Note 3. Changes in accounting policy (continued)
Restated statement of cash flows30 June 2013 Increase/ 30 June 2013
(as reported) (decrease) (restated)
$’000 $’000 $’000
Cash flows from operating activitiesRental and other property income received 57,422 (57,422) - Property and other expenses paid (17,951) 17,951 - Interest and other income received 9 (9) - Borrowing costs and interest paid (14,023) 14,023 - Other operating costs paid to suppliers (7,581) 6,192 (1,389) Tenant security deposits (1,370) 1,370 - Consimption tax/GST received/(paid) (1,016) 1,038 22 Net cash inflow/(outflow) from operating activities 15,490 (16,857) (1,367)
Cash flows from investing activitiesAdditions to investment properties (2,845) 2,845 - Proceeds from the disposal of investment properties 19,621 (19,621) - Distributions received - 1,394 1,394 Net cash inflow from investing activities 16,776 (15,382) 1,394
Cash flows from financing activitiesRepayment of borrowings (33,828) 33,828 - Finance costs paid (1,991) 1,991 - Net cash outflow from financing activities (35,819) 35,819 -
Net increase/(decrease) in cash and cash equivalents (3,553) 3,580 27 Effect of foreign exchange movements on cash (3,469) 3,469 -
Cash and cash equivalents at the beginning of the year 43,416 (42,933) 483 Cash and cash equivalents at the end of the year 36,394 (35,884) 510
For
per
sona
l use
onl
y
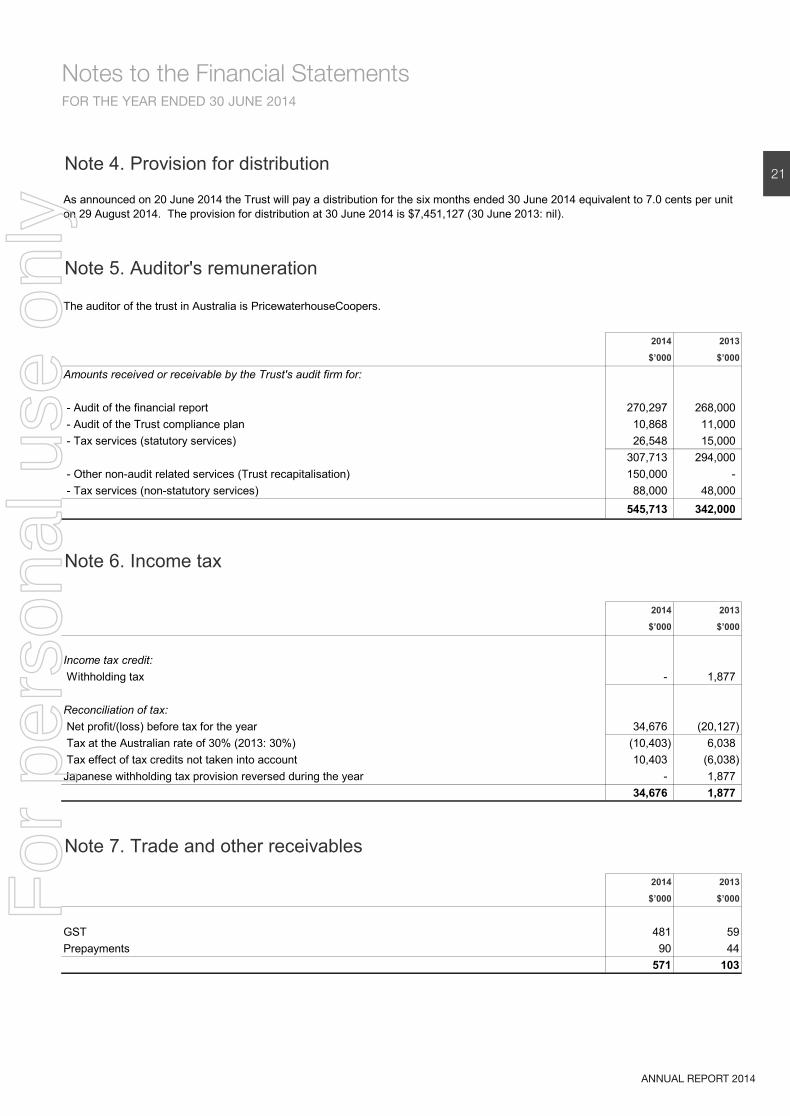
FOR THE YEAR ENDED 30 JUNE 2014
Notes to the Financial Statements
ANNUAL REPORT 2014
21Note 4. Provision for distribution
Note 5. Auditor's remuneration
The auditor of the trust in Australia is PricewaterhouseCoopers.
2014 2013
$’000 $’000
Amounts received or receivable by the Trust's audit firm for:
- Audit of the financial report 270,297 268,000 - Audit of the Trust compliance plan 10,868 11,000 - Tax services (statutory services) 26,548 15,000
307,713 294,000 - Other non-audit related services (Trust recapitalisation) 150,000 - - Tax services (non-statutory services) 88,000 48,000
545,713 342,000
Note 6. Income tax
2014 2013
$’000 $’000
Income tax credit: Withholding tax - 1,877
Reconciliation of tax: Net profit/(loss) before tax for the year 34,676 (20,127) Tax at the Australian rate of 30% (2013: 30%) (10,403) 6,038 Tax effect of tax credits not taken into account 10,403 (6,038) Japanese withholding tax provision reversed during the year - 1,877
34,676 1,877
Note 7. Trade and other receivables
2014 2013
$’000 $’000
GST 481 59Prepayments 90 44
571 103
As announced on 20 June 2014 the Trust will pay a distribution for the six months ended 30 June 2014 equivalent to 7.0 cents per unit on 29 August 2014. The provision for distribution at 30 June 2014 is $7,451,127 (30 June 2013: nil).
For
per
sona
l use
onl
y
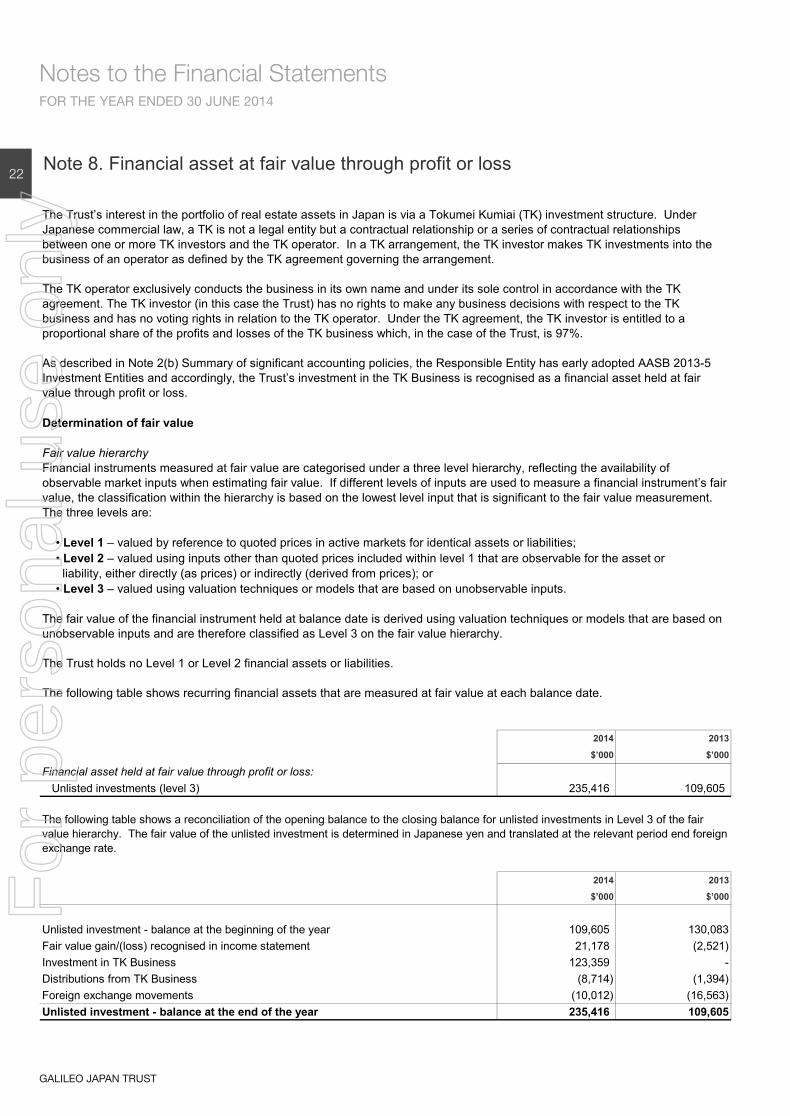
FOR THE YEAR ENDED 30 JUNE 2014
Notes to the Financial Statements
GALILEO JAPAN TRUST
22Note 8. Financial asset at fair value through profit or loss
2014 2013
$’000 $’000
Financial asset held at fair value through profit or loss: Unlisted investments (level 3) 235,416 109,605
2014 2013
$’000 $’000
Unlisted investment - balance at the beginning of the year 109,605 130,083Fair value gain/(loss) recognised in income statement 21,178 (2,521)Investment in TK Business 123,359 -Distributions from TK Business (8,714) (1,394)Foreign exchange movements (10,012) (16,563)Unlisted investment - balance at the end of the year 235,416 109,605
The Trust’s interest in the portfolio of real estate assets in Japan is via a Tokumei Kumiai (TK) investment structure. Under Japanese commercial law, a TK is not a legal entity but a contractual relationship or a series of contractual relationships between one or more TK investors and the TK operator. In a TK arrangement, the TK investor makes TK investments into the business of an operator as defined by the TK agreement governing the arrangement.
The TK operator exclusively conducts the business in its own name and under its sole control in accordance with the TK agreement. The TK investor (in this case the Trust) has no rights to make any business decisions with respect to the TK business and has no voting rights in relation to the TK operator. Under the TK agreement, the TK investor is entitled to a proportional share of the profits and losses of the TK business which, in the case of the Trust, is 97%.
As described in Note 2(b) Summary of significant accounting policies, the Responsible Entity has early adopted AASB 2013-5 Investment Entities and accordingly, the Trust’s investment in the TK Business is recognised as a financial asset held at fair value through profit or loss.
Determination of fair value
Fair value hierarchyFinancial instruments measured at fair value are categorised under a three level hierarchy, reflecting the availability of observable market inputs when estimating fair value. If different levels of inputs are used to measure a financial instrument’s fair value, the classification within the hierarchy is based on the lowest level input that is significant to the fair value measurement. The three levels are:
• Level 1 – valued by reference to quoted prices in active markets for identical assets or liabilities; • Level 2 – valued using inputs other than quoted prices included within level 1 that are observable for the asset or liability, either directly (as prices) or indirectly (derived from prices); or • Level 3 – valued using valuation techniques or models that are based on unobservable inputs.
The fair value of the financial instrument held at balance date is derived using valuation techniques or models that are based on unobservable inputs and are therefore classified as Level 3 on the fair value hierarchy.
The Trust holds no Level 1 or Level 2 financial assets or liabilities.
The following table shows recurring financial assets that are measured at fair value at each balance date.
The following table shows a reconciliation of the opening balance to the closing balance for unlisted investments in Level 3 of the fair value hierarchy. The fair value of the unlisted investment is determined in Japanese yen and translated at the relevant period end foreign exchange rate.
For
per
sona
l use
onl
y

FOR THE YEAR ENDED 30 JUNE 2014
Notes to the Financial Statements
ANNUAL REPORT 2014
23Note 8. Financial asset at fair value through profit or loss (continued)
The fair value gain/(loss) recognised in the income statement includes an unrealised gain of $8.4 million relating to investment property revaluations and an unrealised loss of $2.8 million relating to the mark-to-market of the interest rate swap (30 June 2013: unrealised loss $10.2 million relating to investment property revaluations and $0.4 million unrealised gain relating to the mark-to-market of the interest rate swap). Also see Note 15 Segment information for further details.
Fair value techniques using unobservable inputs
The fair value of the investment in the TK Business at balance date is determined by reference to the assets and liabilities of the underlying investment at balance date. The key components of the assets and liabilities of the TK Business are the investment properties and borrowings which are summarised in Note 15 Segment information.
(i) Investment property
At each reporting date the fair value of the Trusts indirect investment in the TK’s investment property portfolio is assessed by the Directors. Fair value is determined based on either an independent market valuation by professionally qualified valuers or an assessment by the Directors. Independent valuations of the investment properties are obtained at least every three years, whenever the Responsible Entity believes there may have been a significant change in fair value within the period or to confirm current market valuation benchmarks, such as capitalisation rates and market rents. Where a property has not been independently revalued during the reporting period the Directors make an assessment of fair value and if that assessment results in the fair value being greater than 5% of the previous carrying value, a valuation adjustment is recorded.
The fair value of property investments is primarily determined by reference to the capitalisation of income method and the discounted cashflow method. These methods require assumptions and judgement in relation to the future receipt of contractual rents, expected future market rents, rental void periods, maintenance requirements, property capitalisation rates or estimated yields and make reference to market evidence of transaction prices for similar properties. If such prices are not available then the fair value of investment properties is determined using assumptions that are mainly based on market conditions existing at each balance date.
Nine investment properties have been independently valued by DTZ Debenham Tie Leung KK (DTZ) at 30 June 2014. A further seven investment properties were independently valued by DTZ at 31 December 2013.
For
per
sona
l use
onl
y

FOR THE YEAR ENDED 30 JUNE 2014
Notes to the Financial Statements
GALILEO JAPAN TRUST
24Note 8. Financial asset at fair value through profit or loss (continued)
Retail/Leisure 227,392 Capitalisation rate 6.45%Vacancy rate 2.00%
(30 June 2013) 241,707 Discount rate 6.27%Terminal yield 6.52%Rental growth rate 0.00%
Office 243,110 Capitalisation rate 5.12%Vacancy rate 5.68%
(30 June 2013) 243,889 Discount rate 4.79%Terminal yield 4.82%Rental growth rate 0.60%
Residential 79,849 Capitalisation rate 6.34%Vacancy rate 4.98%
(30 June 2013) 81,187 Discount rate 6.01%Terminal yield 6.04%Rental growth rate 0.00%
Mixed Use (Confomall) 14,199 Capitalisation rate 6.67%Vacancy rate 5.01%
(30 June 2013) 14,732 Discount rate 6.40%Terminal yield 6.10%Rental growth rate 0.00%
Mixed Use (Lions Square) 24,992N/A - property carried
(30 June 2013) 19,642 at selling price (refer N/ANote 21)
Industrial 23,473 Capitalisation rate 6.71%Vacancy rate 3.29%
(30 June 2013) 24,989 Discount rate 6.87%Terminal yield 6.80%Rental growth rate 0.00%
Total 613,01530 June 2013 626,146
The table below summarises (by property segment) the quantitative information about the significant unobservable inputs used in determining the fair value of the TK Business investment properties:
Weighted average unobservable inputs
(30 June 2014)
Unobservable input used to measure
Fair Value
Fair value($ '000)
Property segment
Sensitivity information
Generally, a change in the assumption made for the capitalisation rate is accompanied by a directionally similar change in the adopted terminal yield. The adopted capitalisation rate forms part of the income capitalisation approach and the adopted terminal yield forms part of the discounted cash flow approach. An amount within the range of the two valuations is then adopted by the valuer.
The interrelationships of the unobservable inputs and fair value can be summarised as follows:
a) The higher the capitalisation rate and expected vacancy rate, the lower the fair value;b) The higher the discount rate and terminal yield, the lower the fair value; andc) The higher the rental growth rate, the higher the fair value.
For
per
sona
l use
onl
y
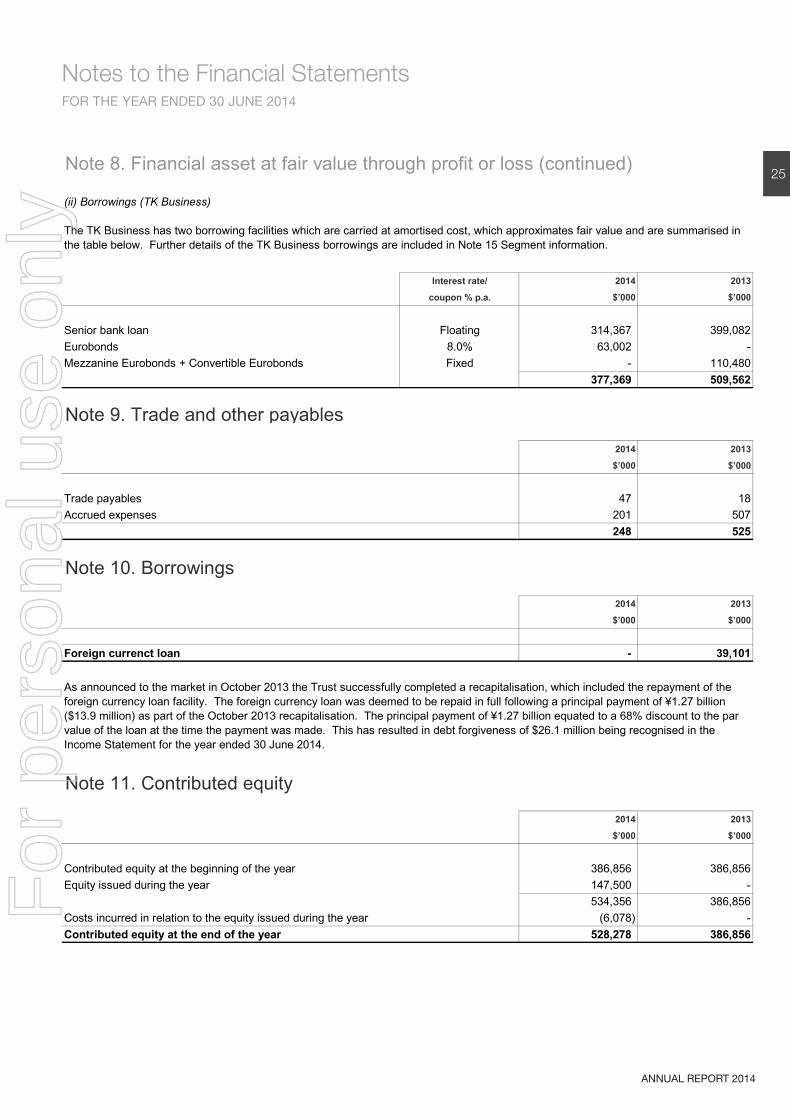
FOR THE YEAR ENDED 30 JUNE 2014
Notes to the Financial Statements
ANNUAL REPORT 2014
25Note 8. Financial asset at fair value through profit or loss (continued)
Interest rate/ 2014 2013
coupon % p.a. $’000 $’000
Senior bank loan Floating 314,367 399,082Eurobonds 8.0% 63,002 -Mezzanine Eurobonds + Convertible Eurobonds Fixed - 110,480
377,369 509,562
Note 9. Trade and other payables
2014 2013
$’000 $’000
Trade payables 47 18Accrued expenses 201 507
248 525
Note 10. Borrowings
2014 2013
$’000 $’000
Foreign currenct loan - 39,101
Note 11. Contributed equity
2014 2013
$’000 $’000
Contributed equity at the beginning of the year 386,856 386,856Equity issued during the year 147,500 -
534,356 386,856Costs incurred in relation to the equity issued during the year (6,078) -Contributed equity at the end of the year 528,278 386,856
As announced to the market in October 2013 the Trust successfully completed a recapitalisation, which included the repayment of the foreign currency loan facility. The foreign currency loan was deemed to be repaid in full following a principal payment of ¥1.27 billion ($13.9 million) as part of the October 2013 recapitalisation. The principal payment of ¥1.27 billion equated to a 68% discount to the par value of the loan at the time the payment was made. This has resulted in debt forgiveness of $26.1 million being recognised in the Income Statement for the year ended 30 June 2014.
(ii) Borrowings (TK Business)
The TK Business has two borrowing facilities which are carried at amortised cost, which approximates fair value and are summarised in the table below. Further details of the TK Business borrowings are included in Note 15 Segment information.
For
per
sona
l use
onl
y

FOR THE YEAR ENDED 30 JUNE 2014
Notes to the Financial Statements
GALILEO JAPAN TRUST
26Note 11. Contributed equity (continued)
2014 2013
(units) (units)
Number of units on issue at the beginning of the year 8,111,332 8,111,332Number of units issued during the year 98,333,333 -Number of units on issue at the end of the year 106,444,665 8,111,332
Note 12. Accumulated losses2014 2013
$’000 $’000
Balance at beginning of the year (318,534) (300,284)Net profit/(loss) after tax for the year 34,676 (18,250)Distributions paid/payable during the year (11,177) -Balance at the end of the year (295,035) (318,534)
Note 13. Net asset value2014 2013
$’000 $’000
Total assets 240,942 110,218Total liabilities (7,699) (41,896)Net assets 233,243 68,322
106,444,665 8,111,332 $2.19 $8.42
Note 14. Earnings per unit
2014 2013
Basic and diluted earnings/(loss) ($ per unit) 0.44 (2.25)Profit/(loss) used in the calculation of loss per unit ($ '000) 34,676 (18,250)
As stipulated in the Trust Constitution, each unit represents the right to an individual share in the Trust and does not extend to a right to the underlying assets of the Trust. There are no separate classes of units. Each unit issued ranks equally for the purpose of distributions, voting and in the event of termination of the Trust.
Total number of units on issueNet asset value per unit
The decline in net asset value per unit from $8.42 to $2.19 is primarily as a result of the October 2013 recapitalisation where 98,333,333 units were issued at $1.50 each.
There are no dilutive potential ordinary units, therefore diluted EPU is the same as basic EPU. The weighted average number of units used in determining basic and diluted loss per unit (EPU) is 79,234,619 (2013: 8,111,332).
For
per
sona
l use
onl
y

FOR THE YEAR ENDED 30 JUNE 2014
Notes to the Financial Statements
ANNUAL REPORT 2014
27Note 15. Segment information
TK Business assets and liabilities2014 2013
$’000 $’000
TK Business assetsCash and cash equivalents 10,216 2,241Restricted cash 34,658 33,642Other TK Business assets 5,888 6,903Investment property (refer Note 8 for details) 613,015 626,146Total TK Business assets 663,777 668,932
TK Business liabilitiesOther TK Business liabilities (10,384) (10,936)Tenant security deposits (34,566) (36,123)Interest rate swap liability (2,684) -Borrowings (refer below for details) (377,369) (509,562)Total TK Business liabilities (425,003) (556,621)TK Business net assets 238,774 112,311Non-controlling interest share of TK Business net assets (3,358) (2,706)Investment in TK Business 235,416 109,605Trust assets 5,526 613Total Trust assets 240,942 110,218
TK Business borrowingsMaturity 2014 2013
date $’000 $’000
CurrentSenior bank loan (i) - 399,082
- 399,082
Non-CurrentSenior bank loan (i) October 2018 314,367 -Eurobonds (ii) October 2020 63,002 -Mezzanine Eurobonds (iii) - 88,224Convertible Eurobonds (iv) - 22,256
377,369 110,480
Total TK Business borrowings 377,369 509,562
As disclosed in Note 8 Financial asset at fair value through profit or loss, the Trust has an indirect investment in a TK Business in Japan. The TK Business owns a diverse portfolio of real estate assets in Japan, has borrowings and other assets and liabilities. The TK Business is the key reporting segment that management analyse in assessing the underlying components of the Trust’s investment.
The figures in this segment note represent 100% of the operating results and net assets of the TK Business. The contractual arrangement between the Trust and the TK Business entitles the Trust to 97% of the profits and losses of the business of the TK and 98.5% of the TK net assets.
For
per
sona
l use
onl
y

FOR THE YEAR ENDED 30 JUNE 2014
Notes to the Financial Statements
GALILEO JAPAN TRUST
28Note 15. Segment information (continued)
As announced to the market in October 2013 the Trust successfully completed a recapitalisation that provided capital to the TK Business which allowed the TK Business to issue new Eurobonds, refinance the senior bank loan and to repay certain borrowings. Details are included below.
(i) Senior bank loan
This loan facility is denominated in Japanese yen and was refinanced in October 2013 after making a principal repayment of ¥6.45 billion, including accrued interest thereon.
Prior to being refinanced in October 2013 the loan facility had a maturity date of 31 March 2014, an interest rate margin of 1.75% above 3-month Japanese LIBOR, mandatory principal repayments equivalent to 3.0% per annum on the outstanding principal balance and a debt service coverage ratio (DSCR) covenant of 1.5x (as defined).
The loan balance at 30 June 2014 is ¥30.0 billion (June 2013: ¥36.6 billion), is secured by a mortgage over 21 investment properties and contains cross default provisions with the Eurobonds. The maturity date has been extended to 11 October 2018 and has an interest rate margin of 1.25% over 3-month Japanese LIBOR. There are no undrawn amounts for this facility and no loan to value (LTV) covenant test. There is a DSCR covenant test of 1.7x (as defined) and the actual DSCR for the June 2014 quarter was 2.3x.
As part of the October 2013 refinance, a five year interest rate swap was entered into equating to 80% of the senior loan principal balance to swap floating interest rate payments to fixed interest rate payments. The notional value of the interest rate swap is ¥24.0 billion and the fixed rate payable under the swap agreement is 0.4%. Through the use of this interest rate swap the effective interest rate per annum on this loan was 1.6%.
(ii) Eurobonds
As part of the October 2013 recapitalisation new Eurobonds with a par value of ¥6.12 billion ($64.1 million) and an issue price of $¥6.0 billion ($62.9 million) were issued by the TK Business on the following terms:• Fixed 8% interest coupon per annum on the par value for the term of the Eurobonds;• 7 year term;• No LTV or DSCR covenant;• Mandatory prepayment upon the sale of an asset at release price without penalty; and• Voluntary prepayment lock out in years 1 to 3. Voluntary prepayments between years 3 and 4 can be made at 104% of the principal amount being repaid. No penalty for voluntary prepayments after year 4.
(iii) Mezzanine Eurobonds
The outstanding balance of the mezzanine Eurobonds were repaid in full by the TK Business as part of the October 2013 recapitalisation.
(iv) Convertible Eurobonds
The outstanding balance of the convertible Eurobonds were repaid in full by the TK Business as part of the October 2013 recapitalisation.
For
per
sona
l use
onl
y

FOR THE YEAR ENDED 30 JUNE 2014
Notes to the Financial Statements
ANNUAL REPORT 2014
29Note 15. Segment information (continued)
TK Business operating result
2014 2013
$’000 $’000
TK Business operating performanceRental income 55,630 60,022Other income 16 8Property expenses (19,640) (18,811)Finance costs (15,138) (27,139)Unrealised gain/(loss) interest rate swap (2,761) 381Loss on sale of investment property - (1,057)Investment property revaluations 9,029 (10,251)Operating expenses (5,418) (5,566)Non-controlling interest (540) (108)Fair value gain/(loss) recognised in the income statement 21,178 (2,521)Trust operating income 26,079 -Trust operating expenses (12,581) (17,606)Net profit/(loss) before income tax for the year 34,676 (20,127)
Note 16. Cash and cash equivalents
2014 2013
$’000 $’000
Cash at bank 4,955 5104,955 510
Note 17. Capital and financial risk management
The Trust, either directly or via its investment in the TK Business, undertakes transactions in a range of financial instruments including:
> cash and cash equivalents> receivables> unlisted investments> payables> borrowings> derivatives
These activities expose the Trust to a variety of financial risks including capital risk, market risk (including currency risk, interest rate risk, real estate risk and refinancing risk), credit risk and liquidity risk.
The Trust uses different methods to measure different types of risk to which it is exposed. These methods include sensitivity analysis in the case of interest rates, foreign exchange and other price risks and aging analysis for credit risk.
Risk management is carried out by executive management under policies approved by the Board of Directors of the Responsible Entity. For
per
sona
l use
onl
y

FOR THE YEAR ENDED 30 JUNE 2014
Notes to the Financial Statements
GALILEO JAPAN TRUST
30Note 17. Capital and financial risk management (continued)
(a) Capital risk
The Trust’s objective when managing capital is to maintain an optimal capital structure to reduce the cost of capital and to safeguard its ability to continue as a going concern.
Capital management is monitored in two main ways:
(i) Balance sheet management – achieved by maintaining an appropriate mix of equity and debt capital and ensuring gearing levels remain in line with the board approved policies. When debt levels exceed certain thresholds distributions can be suspended to allow for cash to be used to repay debt.
The Trust protects its equity in the TK Business property portfolio (via its investment into the TK Business) by ensuring that the TK Business has insurance cover with credit worthy insurers. The current insurance policies do not include earthquake cover. (ii) Income statement management – the primary objective is to maintain a stabilised distributable earnings profile for unitholders in Australian dollars from the equity investment in foreign currency. The main source of income is from the investment property portfolio (held via the investment in the TK Business). The TK Business minimises risks associated with the investment properties by investing in a diverse portfolio of real estate, including sector, location and tenant diversification.
(b) Market risk
Market risk is separated into foreign exchange risk, being the effect of the movement in foreign currencies on the Trust’s operations, and interest rate risk, being the effect of the movement in interest rates on the Trust’s operations.
(i) Foreign exchange risk
Foreign exchange risk arises when future commercial transactions and recognised assets and liabilities are denominated in a currency that is not the Trust’s functional currency. The risk is measured using sensitivity analysis and cashflow forecasting.
The Trust’s foreign currency risk arises primarily from:
> net investments in foreign operations
> forecast transactions for receipt in foreign currencies and payment in Australian dollars
As disclosed to the market, there is currently no foreign currency hedging in place for the Trust’s investment in the TK Business or on the income the Trust earns from the TK Business. It is the current intention of the Responsible Entity to translate the Japanese Yen the Trust receives each quarter into Australian dollars within 10 business days of its receipt, subject to the Board of Directors deciding otherwise prior to the transaction.
A 5% increase in the average AUD:JPY exchange rate from 92.77 to 97.41 for the year ended 30 June 2014 would result in a reduction in net profit in the Income Statement of $0.6 million. A 5% decrease in the average exchange rate from 92.77 to 88.13 for the year ended 30 June 2014 would result in an increase in net profit in the Income Statement of $0.6 million.
A 5% increase in the spot AUD:JPY exchange rate from 95.43 to 100.20 as at 30 June 2014 would result in a decrease in net assets in the balance sheet of $11.4 million or $0.11 per unit. A 5% decrease in the spot AUD:JPY exchange rate from 95.43 to 90.66 as at 30 June 2014 would result in an increase in net assets in the balance sheet of $12.6 million or $0.12 per unit.
A sensitivity of 5% is considered reasonable given the current level of exchange rates and the volatility observed both on an historical basis and market expectations for future movement. Unitholders should note that the sensitivity analysis is stated to provide a guide only and variations in exchange rates may exceed the range shown above.
For
per
sona
l use
onl
y

FOR THE YEAR ENDED 30 JUNE 2014
Notes to the Financial Statements
ANNUAL REPORT 2014
31Note 17. Capital and financial risk management (continued)
As disclosed in Note 15: Segment information the TK Business has a senior bank loan with an interest rate margin of 1.25% over 3-month Japanese LIBOR. As part of the October 2013 refinance, the Trust entered into a five year interest rate swap equating to 80% of the principal balance outstanding to swap floating interest rate payments to fixed interest rate payments.
The notional value of the interest rate swap is ¥24.0 billion ($251.5 million) and the fixed rate payable under the swap agreement is 0.4%. Through the use of this interest rate swap the effective interest rate per annum on this loan was 1.6%.
An increase/(decrease) in the market rate of 0.05% for the 20% of the senior loan facility not subject to an interest rate swap would result in increased/(decreased) interest expense of approximately $32,000. A sensitivity of 0.05% is considered reasonable given the current level of interest rates and the volatility observed both on an historical basis and market expectations for future movement. Unitholders should note that the sensitivity analysis is stated to provide a guide only and variations in interest rates may exceed the amounts above.
(ii) Interest rate risk
The Trust is exposed to interest rate risk on its cash assets as well as the cash assets, borrowings and certain derivative financial instruments of the TK Business. The policy for the level of fixed rate borrowings is set by the board of directors of the Responsible Entity. This risk is managed by ensuring that the Trust and the TK Business maintain an appropriate mix of fixed and floating interest rate instruments and to enter into interest rate derivatives when considered necessary after careful analysis.
Cash flow interest rate risk can be managed by using floating to fixed interest rate swaps. Such interest rate swaps have the economic effect of converting borrowings from floating rates to fixed rates. Under the interest rate swaps it is agreed with other parties to exchange, at specified intervals, the difference between fixed contract rates and floating interest amounts calculated by reference to agreed notional principal amounts.
The use of interest rate swap contracts to hedge interest-bearing liabilities carries certain risks, including the risk that losses on a hedge position will reduce the funds available for payments to unitholders and that such losses may exceed the amount invested in such instruments. The profitability of the Trust may be adversely affected during any period as a result of changing interest rates.
Interest rate swap contracts to fix the interest rate on certain of its borrowings can be used by the Trust and the TK Business. The requirements for hedge accounting could not be met and therefore the interest rate swap contracts do not qualify for hedge accounting. As a result any movement in the fair market value of the interest rate swap derivatives held by the TK Business is recorded in the income statement as part of the fair value gain on financial assets. The fair market value of the interest rate swap contract is included in the carrying value of the financial asset in the balance sheet.
For
per
sona
l use
onl
y

FOR THE YEAR ENDED 30 JUNE 2014
Notes to the Financial Statements
GALILEO JAPAN TRUST
32Note 17. Capital and financial risk management (continued)
30 June 2014 Weighted Non-
Average interest
Interest < 1 Year 1 – 5 Years > 5 Years Bearing Total
Rate $'000 $'000 $'000 $'000 $'000
Financial assets:Cash – AUD 0.05% 4,955 - - - 4,955 Trade and other receivables - - - 571 571 Financial asset at FVTPL Note 8 - - - 235,416 235,416
Total financial assets 4,955 - - 235,987 240,942
Financial liabilities:Trade and other Payables 248 - - - 248
Total financial liabilities 248 - - - 248
30 June 2013 Weighted Non-
Average interest
Interest < 1 Year 1 – 5 Years > 5 Years Bearing Total
Rate $'000 $'000 $'000 $'000 $'000
Financial assets:Cash – AUD 0.10% 510 - - - 510 Trade and other receivables - - - 103 103 Financial asset at FVTPL Note 8 - - - 109,605 109,605
Total financial assets 510 - - 109,708 110,218
Financial liabilities:Borrowings Note 10 - 39,101 - - 39,101 Trade and other Payables - - - 525 525
Total financial liabilities - 39,101 - 525 39,626
The Trust's exposure to interest rate risk on its financial instruments at 30 June 2014 and 30 June 2013 are detailed below:
(c) Credit risk
Credit risk arises from the potential failure of counterparties to meet their obligations under a contract or arrangement. The Trust’s maximum exposure to credit risk at 30 June 2014 in relation to each class of recognised financial instruments is the carrying amount of those instruments in the statement of financial position. Derivative counterparties and cash transactions are limited to high credit quality financial institutions.
The TK Business has a credit policy for all tenants and rents are payable monthly in advance. In the event of default by an occupational tenant, the TK Business will suffer a rental shortfall and could incur additional related costs. TK Business management review external reports on the credit quality of tenants and monitors rental arrears on a monthly basis. Any rental arrears that are greater than 30 days old are provided for in the financial statements. Amounts that are less than 30 days old are assessed on a case by case basis. The TK Business has no significant concentration of credit risk as the exposure is spread over a large number of tenants.
With respect to credit risk arising from other financial assets, which comprise cash and cash equivalents, the Trust’s exposure to credit arises from default of the counterparty with a maximum exposure equal to the carrying value of these instruments. The credit risk on cash and cash equivalents is mitigated as all cash is placed with reputable banking institutions.
For
per
sona
l use
onl
y

FOR THE YEAR ENDED 30 JUNE 2014
Notes to the Financial Statements
ANNUAL REPORT 2014
33Note 17. Capital and financial risk management (continued)
(d) Liquidity risk
Liquidity risk is the risk that the Trust or the TK Business will encounter in realising assets or otherwise raising funds to meet its financial commitments. Investments in property are inherently difficult to value due to the individual nature of each property. As a result, valuations are subject to uncertainty. There is no assurance that the estimates resulting from the valuation process will reflect the actual sales price, even if sales should occur shortly after the valuation date.
Investments in property are illiquid, however, the Trust (via the TK Business) has tried to mitigate the associated risk by investing in desirable properties in prime locations. Prudent liquidity risk management implies maintaining sufficient cash, the availability of funding through an adequate amount of committed credit facilities, the ability to close out market positions, and the option to raise funds through the issue of new securities or via the distribution reinvestment plan.
(e) Investment property risk
The Trust is subject to investment property risk via its investment in the TK Business. Investment property and net operating income derived from such investments are subject to volatility and may be affected adversely by a number of factors. Factors include, national, regional and local economic conditions which may be adversely affected by industry slowdowns or continued weakness in specific industry segments, construction quality, age and design, demographic factors, retroactive changes to building or similar codes, and increases in operating expenses (such as energy costs). The TK Business minimises investment property risk by investing in a diverse portfolio of real estate, including sector, location and tenant diversification.
(f) Refinancing risk
Refinancing risk is the risk that unfavourable interest rate and credit market conditions result in an unacceptable increase in the Trust’s exposure to credit margins and interest cost. Refinancing risk arises when the Trust and/or the TK Business is required to obtain debt to fund existing and new debt positions. The Trust and the TK Business are exposed to refinancing risks arising from the availability of finance as well as the interest rates and credit margins at which financing is available. The Trust and the TK Business can manage this risk by spreading maturities of borrowings, using interest rate derivatives and reviewing potential transactions to understand the impact on the Trust and TK Business credit positions. As at 30 June 2014, the exposure to refinancing risk by the Trust and TK Business can be assessed by considering the maturity dates of its borrowings as disclosed in Note 15 Segment information.
(g) Offsetting financial assets and financial liabilities
There are no recognised financial instruments that are offset in the balance sheet.
For
per
sona
l use
onl
y

FOR THE YEAR ENDED 30 JUNE 2014
Notes to the Financial Statements
GALILEO JAPAN TRUST
34Note 18. Related party disclosures
Responsible entity fees2014 2013
$’000 $’000
Responsible entity fee 473 -Cost recovery charge 166 600Total amount paid/payable to the Responsible Entity 639 600
Distribution Units held Units held
Due 30 June 2014 30 June 2013
Jack Ritch $667 9,540 2,829 Philip Redmond $700 10,000 5,300 Frank Zipfinger $770 11,000 4,400 Neil Werrett * $269,385 3,848,364 515,031 Pater Murphy $1,176 16,803 16,803
* These units are owned by Galileo Japan Funds Management Limited and Galileo Investments Japan Pty Ltd. As part of the October 2013 recapitalisation, 3,333,333 units were acquired by Galileo Japan Funds Management Limited at the placement issue price of $1.50 per unit
Under the terms of the Trust Constitution, the Responsible Entity is entitled to receive a base responsible entity fee up to 0.4% per annum of the Trust’s direct and indirect proportionate interest (i.e. 98.5%) in the properties and other assets held in the TK Business. As the TK operator in Japan charges an asset management fee of 0.3% per annum, the Responsible Entity fee charged in Australia is 0.1% per annum.
From September 2009 and up until the October 2013 refinance, the Responsible Entity agreed to waive its base fee (0.1% per annum) and put in place an operating cost recovery arrangement. The Trust was liable to reimburse the Responsible Entity for operating costs of up to $50,000 per month relating to costs for the ongoing management of the Trust. The payment of these costs was deferred until all outstanding obligations to the Mezzanine and Convertible Eurobond holders and the foreign currency facility lender were repaid.
As discussed in Note10 Borrowings and Note 15 Segment information, the mezzanine and convertible Eurobond noteholders and the lender under the foreign currency loan facility were repaid as part of the Trust recapitalisation that occurred in October 2013. Subsequently, the accumulated outstanding cost recovery charge at the date of the October 2013 recapitalisation of $2.4 million was paid by the Trust to the Responsible Entity and the payment of the 0.1% per annum responsible entity fee commenced from that date.
Directors interest in the Trust
The number of units held, either directly or indirectly, by the directors of the Responsible Entity at balance date is outlined below along with their entitlement to the estimated distribution for the six months ended 30 June 2014. There are no options to buy units in the Trust held by any of the Directors of the Responsible Entity.
For
per
sona
l use
onl
y
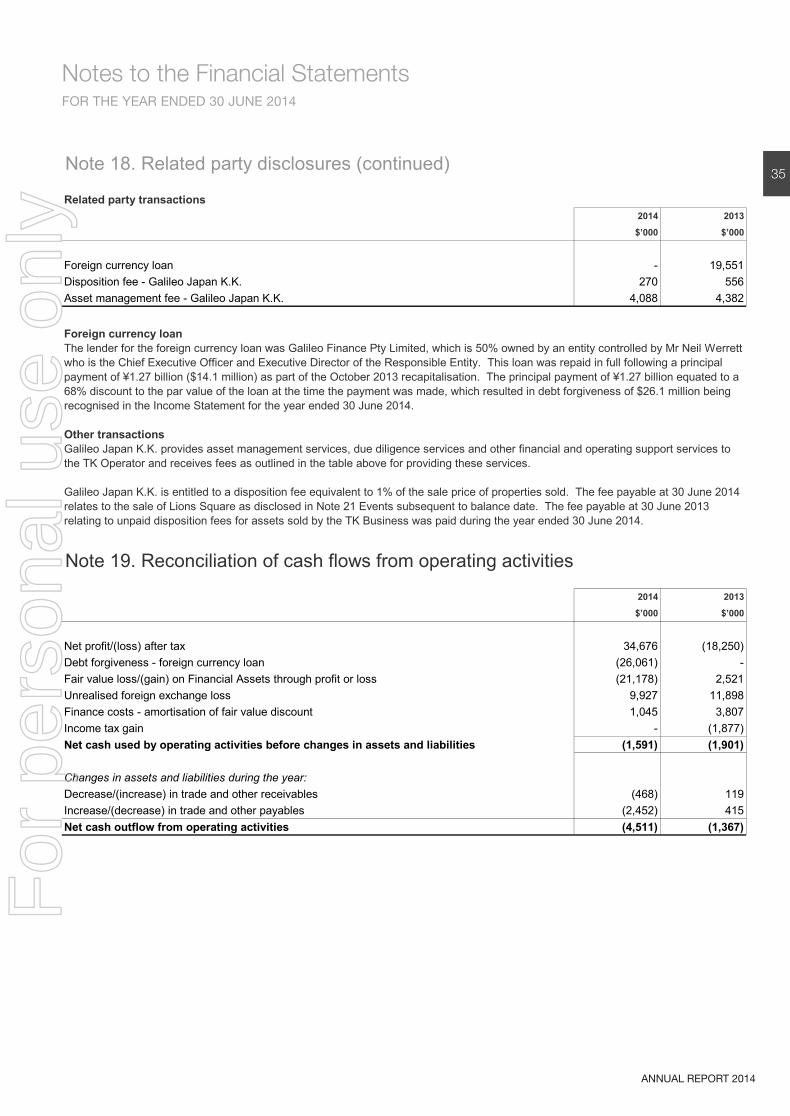
FOR THE YEAR ENDED 30 JUNE 2014
Notes to the Financial Statements
ANNUAL REPORT 2014
35Note 18. Related party disclosures (continued)
Related party transactions2014 2013
$’000 $’000
Foreign currency loan - 19,551Disposition fee - Galileo Japan K.K. 270 556Asset management fee - Galileo Japan K.K. 4,088 4,382
Note 19. Reconciliation of cash flows from operating activities
2014 2013
$’000 $’000
Net profit/(loss) after tax 34,676 (18,250)Debt forgiveness - foreign currency loan (26,061) -Fair value loss/(gain) on Financial Assets through profit or loss (21,178) 2,521Unrealised foreign exchange loss 9,927 11,898Finance costs - amortisation of fair value discount 1,045 3,807Income tax gain - (1,877)Net cash used by operating activities before changes in assets and liabilities (1,591) (1,901)
Changes in assets and liabilities during the year:Decrease/(increase) in trade and other receivables (468) 119Increase/(decrease) in trade and other payables (2,452) 415Net cash outflow from operating activities (4,511) (1,367)
Foreign currency loanThe lender for the foreign currency loan was Galileo Finance Pty Limited, which is 50% owned by an entity controlled by Mr Neil Werrett who is the Chief Executive Officer and Executive Director of the Responsible Entity. This loan was repaid in full following a principal payment of ¥1.27 billion ($14.1 million) as part of the October 2013 recapitalisation. The principal payment of ¥1.27 billion equated to a 68% discount to the par value of the loan at the time the payment was made, which resulted in debt forgiveness of $26.1 million being recognised in the Income Statement for the year ended 30 June 2014.
Other transactionsGalileo Japan K.K. provides asset management services, due diligence services and other financial and operating support services to the TK Operator and receives fees as outlined in the table above for providing these services.
Galileo Japan K.K. is entitled to a disposition fee equivalent to 1% of the sale price of properties sold. The fee payable at 30 June 2014 relates to the sale of Lions Square as disclosed in Note 21 Events subsequent to balance date. The fee payable at 30 June 2013 relating to unpaid disposition fees for assets sold by the TK Business was paid during the year ended 30 June 2014.
For
per
sona
l use
onl
y
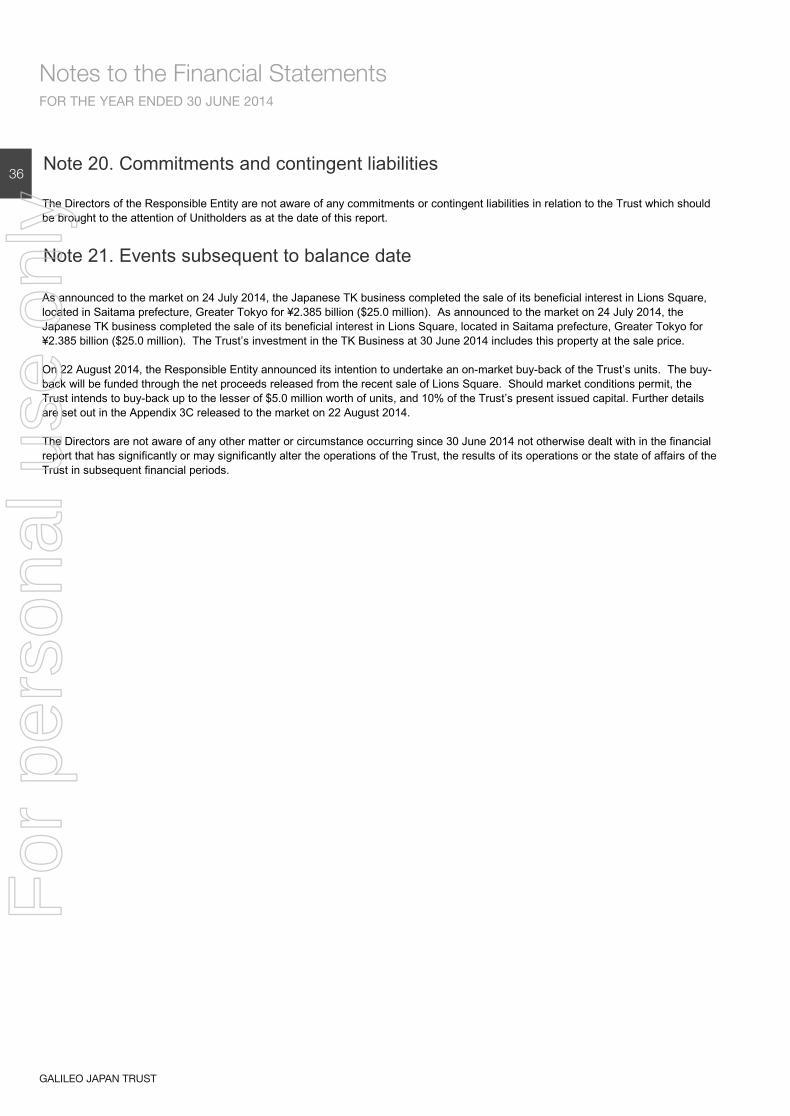
FOR THE YEAR ENDED 30 JUNE 2014
Notes to the Financial Statements
GALILEO JAPAN TRUST
36Note 20. Commitments and contingent liabilities
Note 21. Events subsequent to balance date
The Directors of the Responsible Entity are not aware of any commitments or contingent liabilities in relation to the Trust which should be brought to the attention of Unitholders as at the date of this report.
As announced to the market on 24 July 2014, the Japanese TK business completed the sale of its beneficial interest in Lions Square, located in Saitama prefecture, Greater Tokyo for ¥2.385 billion ($25.0 million). As announced to the market on 24 July 2014, the Japanese TK business completed the sale of its beneficial interest in Lions Square, located in Saitama prefecture, Greater Tokyo for ¥2.385 billion ($25.0 million). The Trust’s investment in the TK Business at 30 June 2014 includes this property at the sale price.
On 22 August 2014, the Responsible Entity announced its intention to undertake an on-market buy-back of the Trust’s units. The buy-back will be funded through the net proceeds released from the recent sale of Lions Square. Should market conditions permit, the Trust intends to buy-back up to the lesser of $5.0 million worth of units, and 10% of the Trust’s present issued capital. Further details are set out in the Appendix 3C released to the market on 22 August 2014.
The Directors are not aware of any other matter or circumstance occurring since 30 June 2014 not otherwise dealt with in the financial report that has significantly or may significantly alter the operations of the Trust, the results of its operations or the state of affairs of the Trust in subsequent financial periods.
For
per
sona
l use
onl
y
Directors’ DeclarationDirector's declarationGalileo Japan TrustFOR THE YEAR ENDED 30 JUNE 2014
1. In the opinion of the directors of Galileo Japan Funds Management Limited, the Responsible Entity for Galileo Japan Trust
(the "Trust"):
(a) the financial statements and notes set out on pages 7 to 36 are in accordance with the Corporations Act 2001,including:
(i)
(ii)
(b)
2.
3.
Signed in accordance with a resolution of the Directors.
Jack RitchChairman
Dated at Sydney this 28 August 2014
Note 2 (a) confirms that the financial statements also comply with International Financial Reporting Standards as issued by the International Accounting Standards Board.
The Directors of the Responsible Entity have been given the declarations by the chief executive officer and chief financial officer for the year ended 30 June 2013 required by section 295A of the Corporations Act 2001.
there are reasonable grounds to believe that the Trust will be able to pay its debts as and when they become due and payable.
complying with Accounting Standards, the Corporations Regulations 2001 and other mandatory professional reporting requirements; and
giving a true and fair view of the Trust's financial position as at 30 June 2014 and of its performance for the year ended on that date; and
FOR THE YEAR ENDED 30 JUNE 2014
ANNUAL REPORT 2014
37
For
per
sona
l use
onl
y

TO THE MEMBERS OF GALILEO JAPAN TRUST
Independent Auditor’s Report to Unitholders
GALILEO JAPAN TRUST
38
PricewaterhouseCoopers, ABN 52 780 433 757Darling Park Tower 2, 201 Sussex Street, GPO BOX 2650, SYDNEY NSW 1171T: 1300 799 615, F: 1300 799 618, www.pwc.com.au
Liability limited by a scheme approved under Professional Standards Legislation.
Independent auditor’s report to the members of Galileo Japan Trust
Report on the financial reportWe have audited the accompanying financial report of Galileo Japan Trust (the Trust), which comprises the balance sheet as at 30 June 2014, the income statement, statement of comprehensive income, statement of changes in equity and statement of cash flows for the year ended on that date, a summary of significant accounting policies, other explanatory notes and the directors’ declaration.
Directors’ responsibility for the financial reportThe directors of the Trust are responsible for the preparation of the financial report that gives a true and fair view in accordance with Australian Accounting Standards and the Corporations Act 2001 and for such internal control as the directors determine is necessary to enable the preparation of the financial report that is free from material misstatement, whether due to fraud or error.
Auditor’s responsibilityOur responsibility is to express an opinion on the financial report based on our audit. We conducted our audit in accordance with Australian Auditing Standards. Those standards require that we comply with relevant ethical requirements relating to audit engagements and plan and perform the audit to obtain reasonable assurance whether the financial report is free from material misstatement.
An audit involves performing procedures to obtain audit evidence about the amounts and disclosures in the financial report. The procedures selected depend on the auditor’s judgement, including the assessment of the risks of material misstatement of the financial report, whether due to fraud or error. In making those risk assessments, the auditor considers internal control relevant to the entity’s preparation and fair presentation of the financial report in order to design audit procedures that are appropriate in the circumstances, but not for the purpose of expressing an opinion on the effectiveness of the entity’s internal control. An audit also includes evaluating the appropriateness of accounting policies used and the reasonableness of accounting estimates made by the directors, as well as evaluating the overall presentation of the financial report.
We believe that the audit evidence we have obtained is sufficient and appropriate to provide a basis for our audit opinion.
Independence In conducting our audit, we have complied with the independence requirements of the Corporations Act 2001.
For
per
sona
l use
onl
y
TO THE MEMBERS OF GALILEO JAPAN TRUST
Independent Auditor’s Report to Unitholders (continued)
ANNUAL REPORT 2014
Auditor’s opinionIn our opinion, the financial report of Galileo Japan Trust is in accordance with the Corporations Act 2001, including:
(a) giving a true and fair view of the Trust's financial position as at 30 June 2014 and of its performance for the year ended on that date; and
(b) complying with Australian Accounting Standards including the Australian Accounting Interpretations and the Corporations Regulations 2001.
PricewaterhouseCoopers
E A Barron SydneyPartner 28 August 2014
TO THE MEMBERS OF GALILEO JAPAN TRUST
Independent Auditor’s Report to Unitholders (continued)
GALILEO JAPAN TRUST
38
TO THE MEMBERS OF GALILEO JAPAN TRUST
Independent Auditor’s Report to Unitholders (continued)
GALILEO JAPAN TRUST
38
39
For
per
sona
l use
onl
y
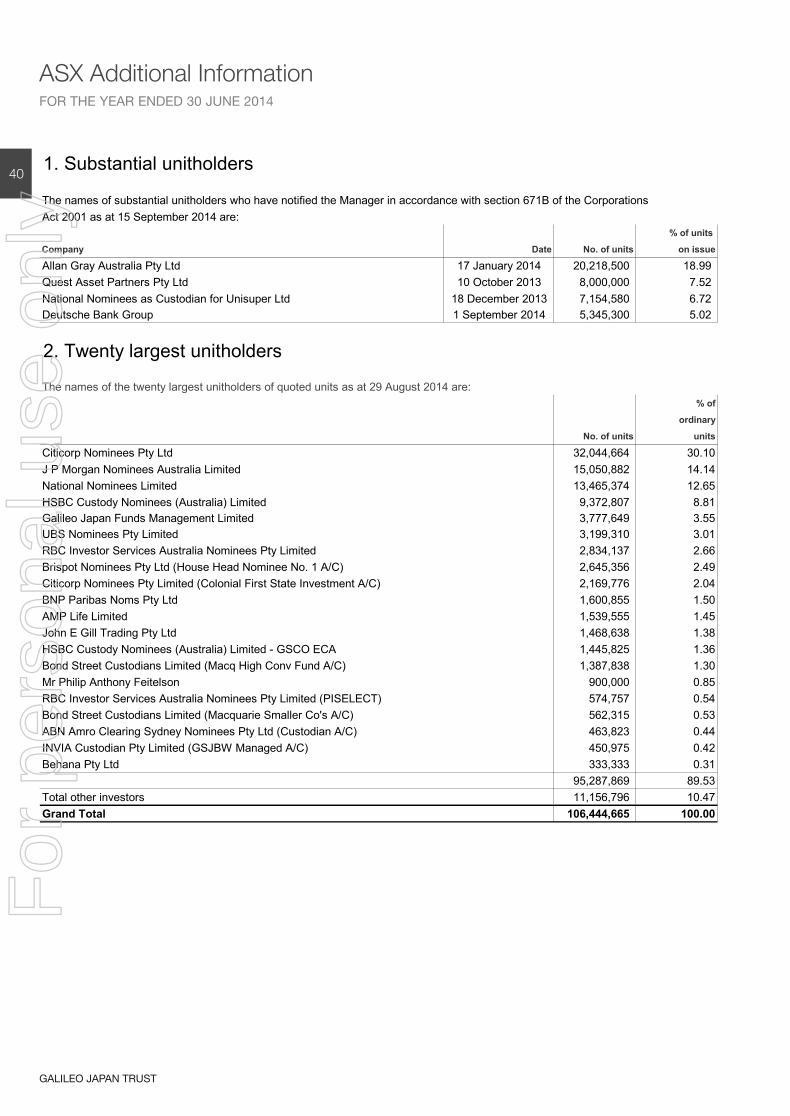
ASX Additional Information
GALILEO JAPAN TRUST
FOR THE YEAR ENDED 30 JUNE 2014
1. Substantial unitholders
The names of substantial unitholders who have notified the Manager in accordance with section 671B of the CorporationsAct 2001 as at 15 September 2014 are:
% of units
Company Date No. of units on issue
Allan Gray Australia Pty Ltd 17 January 2014 20,218,500 18.99 Quest Asset Partners Pty Ltd 10 October 2013 8,000,000 7.52 National Nominees as Custodian for Unisuper Ltd 18 December 2013 7,154,580 6.72 Deutsche Bank Group 1 September 2014 5,345,300 5.02
2. Twenty largest unitholders
The names of the twenty largest unitholders of quoted units as at 29 August 2014 are:% of
ordinary
No. of units units
Citicorp Nominees Pty Ltd 32,044,664 30.10J P Morgan Nominees Australia Limited 15,050,882 14.14National Nominees Limited 13,465,374 12.65HSBC Custody Nominees (Australia) Limited 9,372,807 8.81Galileo Japan Funds Management Limited 3,777,649 3.55UBS Nominees Pty Limited 3,199,310 3.01RBC Investor Services Australia Nominees Pty Limited 2,834,137 2.66Brispot Nominees Pty Ltd (House Head Nominee No. 1 A/C) 2,645,356 2.49Citicorp Nominees Pty Limited (Colonial First State Investment A/C) 2,169,776 2.04BNP Paribas Noms Pty Ltd 1,600,855 1.50AMP Life Limited 1,539,555 1.45John E Gill Trading Pty Ltd 1,468,638 1.38HSBC Custody Nominees (Australia) Limited - GSCO ECA 1,445,825 1.36Bond Street Custodians Limited (Macq High Conv Fund A/C) 1,387,838 1.30Mr Philip Anthony Feitelson 900,000 0.85RBC Investor Services Australia Nominees Pty Limited (PISELECT) 574,757 0.54Bond Street Custodians Limited (Macquarie Smaller Co's A/C) 562,315 0.53ABN Amro Clearing Sydney Nominees Pty Ltd (Custodian A/C) 463,823 0.44INVIA Custodian Pty Limited (GSJBW Managed A/C) 450,975 0.42Behana Pty Ltd 333,333 0.31
95,287,869 89.53Total other investors 11,156,796 10.47Grand Total 106,444,665 100.00
40
For
per
sona
l use
onl
y
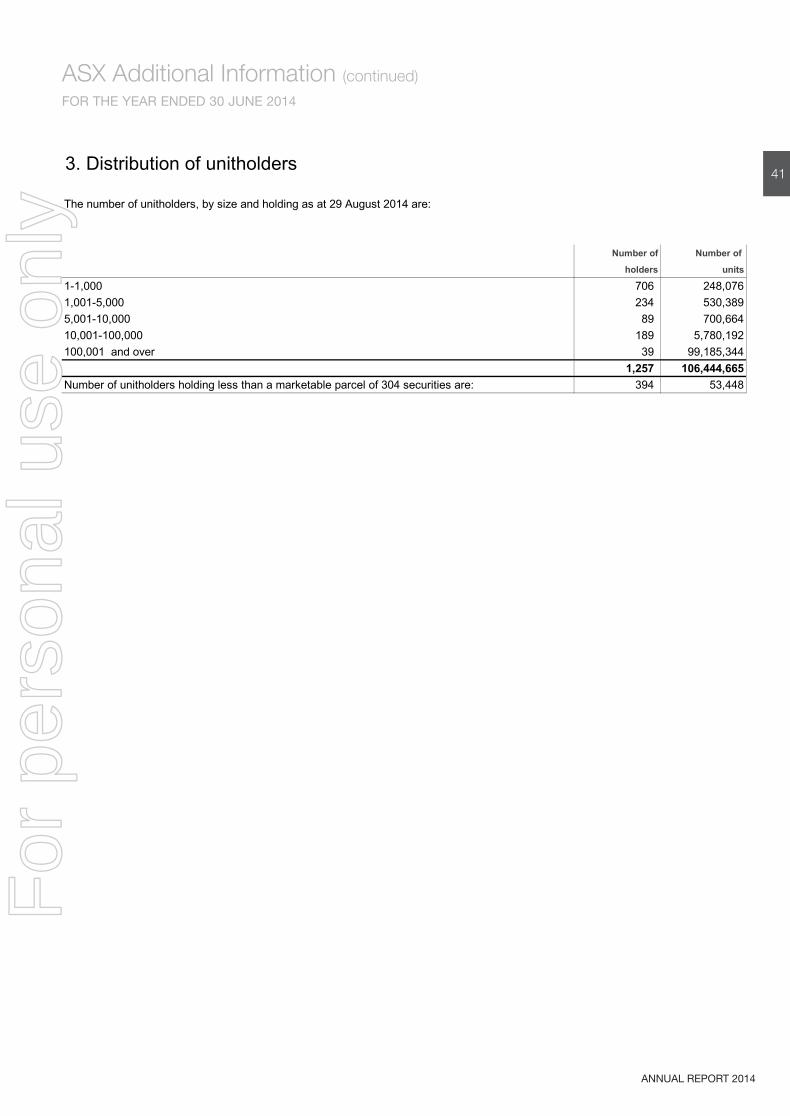
ASX Additional Information (continued)
ANNUAL REPORT 2014
FOR THE YEAR ENDED 30 JUNE 2014
3. Distribution of unitholders
The number of unitholders, by size and holding as at 29 August 2014 are:
Number of Number of
holders units
1-1,000 706 248,0761,001-5,000 234 530,3895,001-10,000 89 700,66410,001-100,000 189 5,780,192100,001 and over 39 99,185,344
1,257 106,444,665Number of unitholders holding less than a marketable parcel of 304 securities are: 394 53,448
41
For
per
sona
l use
onl
y

For
per
sona
l use
onl
y