For personal use only - ASX · 2009. 9. 25. · Chief Executive Officer S. Smith Company Secretary...
94
Cellnet Group Limited and its controlled entities Financial Report For the Year Ended 30 June 2009 For personal use only
Transcript of For personal use only - ASX · 2009. 9. 25. · Chief Executive Officer S. Smith Company Secretary...

Cellnet Group Limited and its controlled entities
Financial Report For the Year Ended
30 June 2009
For
per
sona
l use
onl
y
2
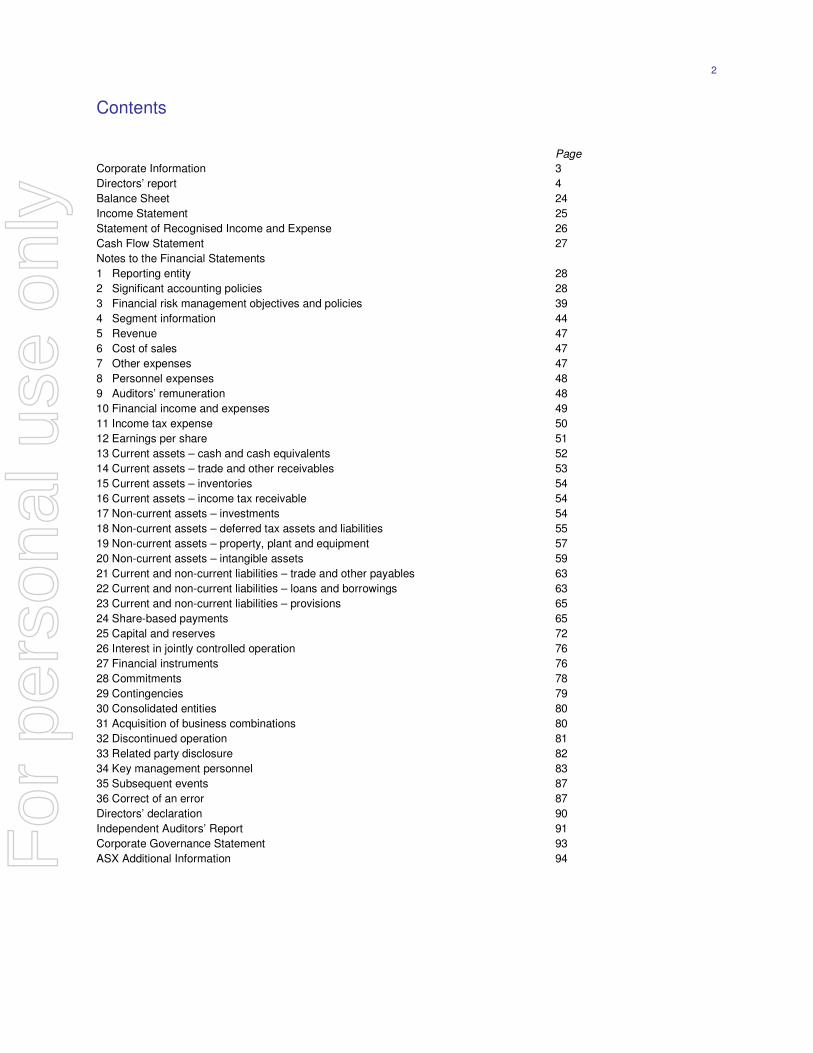
Contents
Page
Corporate Information 3
Directors’ report 4
Balance Sheet 24
Income Statement 25
Statement of Recognised Income and Expense 26
Cash Flow Statement 27
Notes to the Financial Statements
1 Reporting entity 28
2 Significant accounting policies 28
3 Financial risk management objectives and policies 39
4 Segment information 44
5 Revenue 47
6 Cost of sales 47
7 Other expenses 47
8 Personnel expenses 48
9 Auditors’ remuneration 48
10 Financial income and expenses 49
11 Income tax expense 50
12 Earnings per share 51
13 Current assets – cash and cash equivalents 52
14 Current assets – trade and other receivables 53
15 Current assets – inventories 54
16 Current assets – income tax receivable 54
17 Non-current assets – investments 54
18 Non-current assets – deferred tax assets and liabilities 55
19 Non-current assets – property, plant and equipment 57
20 Non-current assets – intangible assets 59
21 Current and non-current liabilities – trade and other payables 63
22 Current and non-current liabilities – loans and borrowings 63
23 Current and non-current liabilities – provisions 65
24 Share-based payments 65
25 Capital and reserves 72
26 Interest in jointly controlled operation 76
27 Financial instruments 76
28 Commitments 78
29 Contingencies 79
30 Consolidated entities 80
31 Acquisition of business combinations 80
32 Discontinued operation 81
33 Related party disclosure 82
34 Key management personnel 83
35 Subsequent events 87
36 Correct of an error 87
Directors’ declaration 90
Independent Auditors’ Report 91
Corporate Governance Statement 93
ASX Additional Information 94
For
per
sona
l use
onl
y
Cellnet Group Limited and its controlled entities Financial Report
3
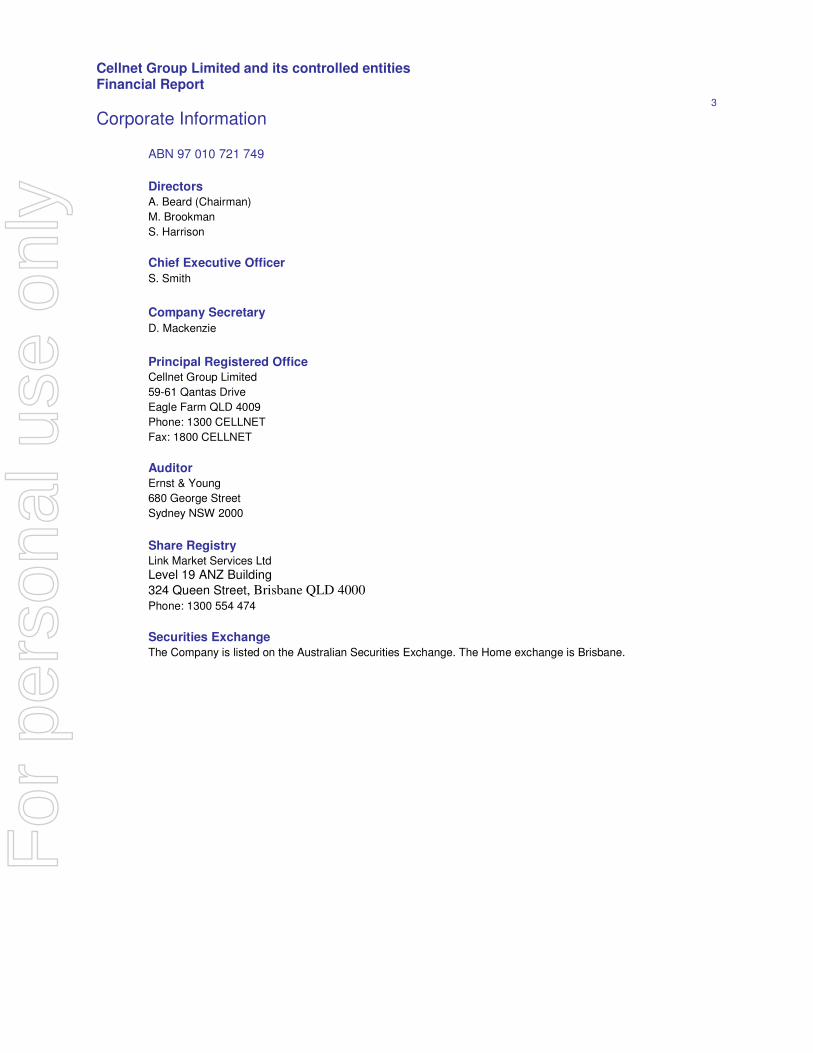
Corporate Information
ABN 97 010 721 749
Directors
A. Beard (Chairman)
M. Brookman
S. Harrison
Chief Executive Officer
S. Smith
Company Secretary
D. Mackenzie
Principal Registered Office Cellnet Group Limited
59-61 Qantas Drive
Eagle Farm QLD 4009
Phone: 1300 CELLNET
Fax: 1800 CELLNET
Auditor Ernst & Young
680 George Street
Sydney NSW 2000
Share Registry Link Market Services Ltd
Level 19 ANZ Building 324 Queen Street, Brisbane QLD 4000 Phone: 1300 554 474
Securities Exchange The Company is listed on the Australian Securities Exchange. The Home exchange is Brisbane.
For
per
sona
l use
onl
y
Cellnet Group Limited and its controlled entities Financial Report
4
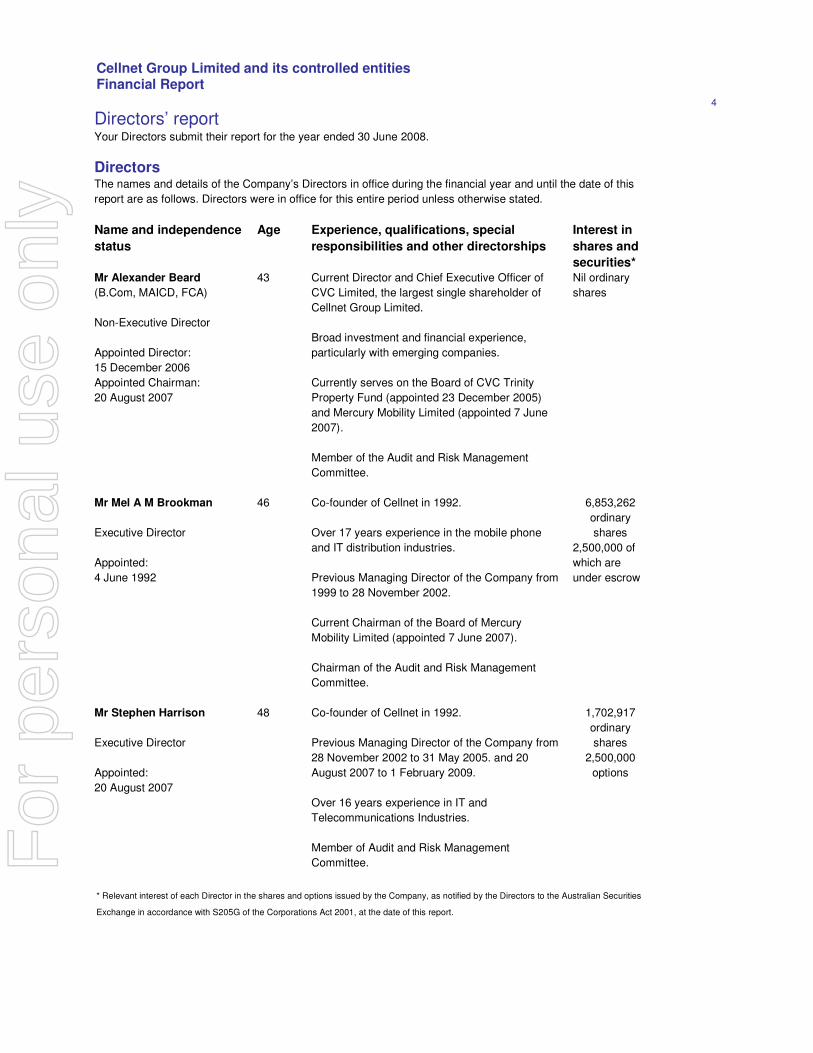
Directors’ report Your Directors submit their report for the year ended 30 June 2008.
Directors The names and details of the Company’s Directors in office during the financial year and until the date of this
report are as follows. Directors were in office for this entire period unless otherwise stated.
Name and independence
status
Age Experience, qualifications, special
responsibilities and other directorships
Interest in
shares and
securities* Mr Alexander Beard
(B.Com, MAICD, FCA)
Non-Executive Director
Appointed Director:
15 December 2006
Appointed Chairman:
20 August 2007
43 Current Director and Chief Executive Officer of
CVC Limited, the largest single shareholder of
Cellnet Group Limited.
Broad investment and financial experience,
particularly with emerging companies.
Currently serves on the Board of CVC Trinity
Property Fund (appointed 23 December 2005)
and Mercury Mobility Limited (appointed 7 June
2007).
Member of the Audit and Risk Management
Committee.
Nil ordinary
shares
Mr Mel A M Brookman
Executive Director
Appointed:
4 June 1992
46
Co-founder of Cellnet in 1992.
Over 17 years experience in the mobile phone
and IT distribution industries.
Previous Managing Director of the Company from
1999 to 28 November 2002.
Current Chairman of the Board of Mercury
Mobility Limited (appointed 7 June 2007).
Chairman of the Audit and Risk Management
Committee.
6,853,262
ordinary
shares
2,500,000 of
which are
under escrow
Mr Stephen Harrison
Executive Director
Appointed:
20 August 2007
48
Co-founder of Cellnet in 1992.
Previous Managing Director of the Company from
28 November 2002 to 31 May 2005. and 20
August 2007 to 1 February 2009.
Over 16 years experience in IT and
Telecommunications Industries.
Member of Audit and Risk Management
Committee.
1,702,917
ordinary
shares
2,500,000
options
* Relevant interest of each Director in the shares and options issued by the Company, as notified by the Directors to the Australian Securities
Exchange in accordance with S205G of the Corporations Act 2001, at the date of this report.
For
per
sona
l use
onl
y
Cellnet Group Limited and its controlled entities Financial Report
5
Directors’ report (continued)
Company Secretary Mr Don Mackenzie was appointed as Cellnet’s Company Secretary on 6 October 2005. He is a Fellow of the
Institute of Chartered Accountants. Mr Mackenzie has had experience in Chartered Accounting firms, held
senior positions with public companies involved in the rural and manufacturing industries and since 1993 he
has provided corporate services predominantly to public companies involved in manufacturing, mining,
information technology and rural operations.
Mr Mackenzie is a Director of Forest Place Group Limited (appointed March 2004) and Occupational &
Medical Innovation Limited (appointed November 2004), and an alternate Director of Silver Chef Limited
(appointed March 2005). He is 64 years of age.
For
per
sona
l use
onl
y
Cellnet Group Limited and its controlled entities Financial Report
6
Directors’ report (continued) Directors’ meetings
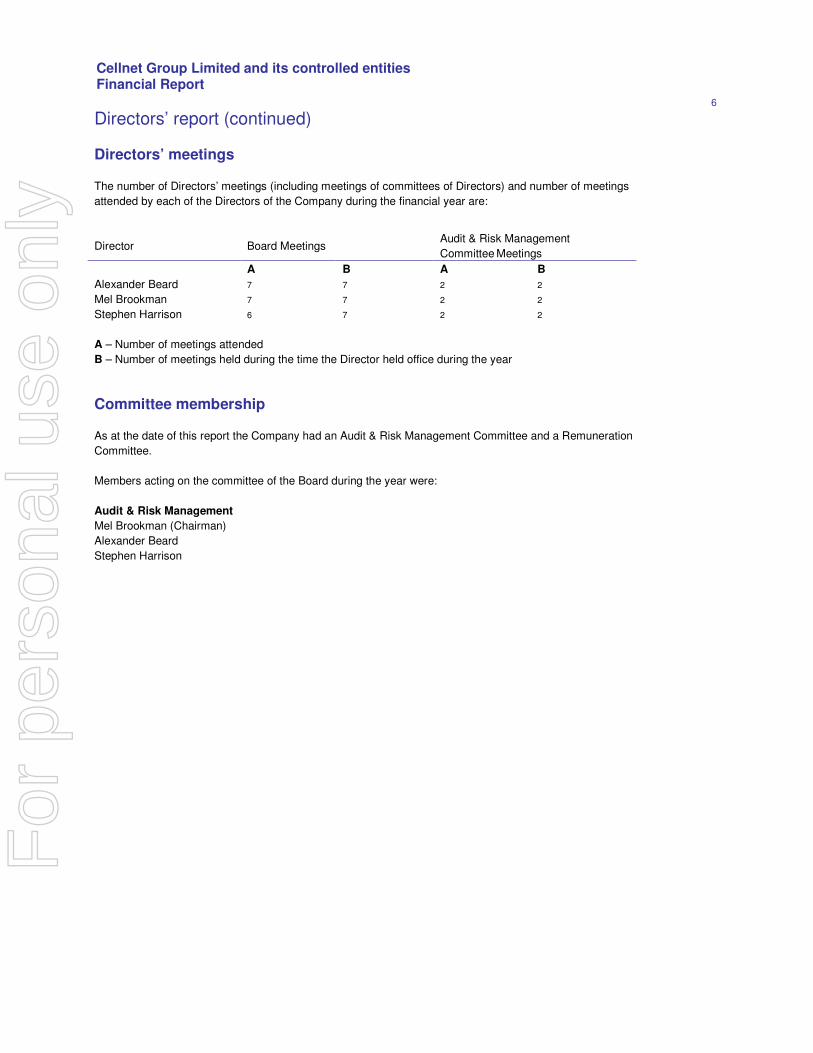
The number of Directors’ meetings (including meetings of committees of Directors) and number of meetings
attended by each of the Directors of the Company during the financial year are:
Director Board Meetings Audit & Risk Management
Committee Meetings
A B A B
Alexander Beard 7 7 2 2
Mel Brookman 7 7 2 2
Stephen Harrison 6 7 2 2
A – Number of meetings attended
B – Number of meetings held during the time the Director held office during the year
Committee membership
As at the date of this report the Company had an Audit & Risk Management Committee and a Remuneration
Committee.
Members acting on the committee of the Board during the year were:
Audit & Risk Management
Mel Brookman (Chairman)
Alexander Beard
Stephen Harrison
For
per
sona
l use
onl
y
Cellnet Group Limited and its controlled entities Financial Report
7
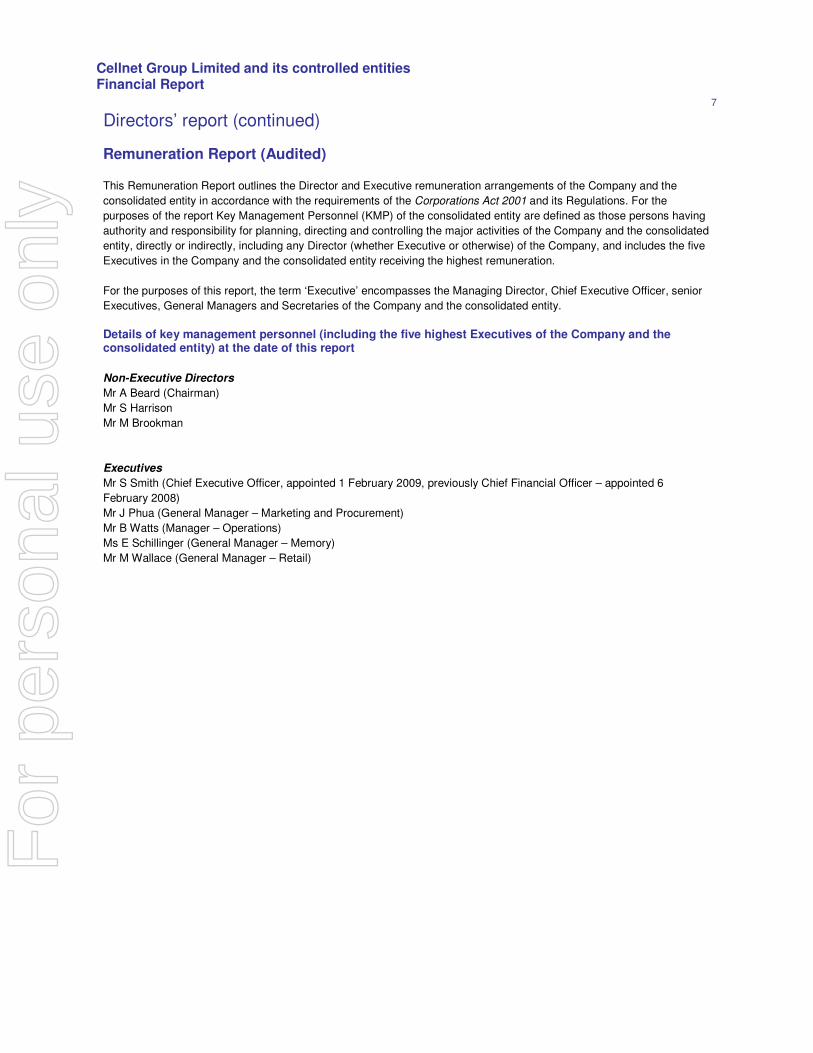
Remuneration Report (Audited)
This Remuneration Report outlines the Director and Executive remuneration arrangements of the Company and the
consolidated entity in accordance with the requirements of the Corporations Act 2001 and its Regulations. For the
purposes of the report Key Management Personnel (KMP) of the consolidated entity are defined as those persons having
authority and responsibility for planning, directing and controlling the major activities of the Company and the consolidated
entity, directly or indirectly, including any Director (whether Executive or otherwise) of the Company, and includes the five
Executives in the Company and the consolidated entity receiving the highest remuneration.
For the purposes of this report, the term ‘Executive’ encompasses the Managing Director, Chief Executive Officer, senior
Executives, General Managers and Secretaries of the Company and the consolidated entity.
Details of key management personnel (including the five highest Executives of the Company and the consolidated entity) at the date of this report
Non-Executive Directors
Mr A Beard (Chairman)
Mr S Harrison
Mr M Brookman
Executives
Mr S Smith (Chief Executive Officer, appointed 1 February 2009, previously Chief Financial Officer – appointed 6
February 2008)
Mr J Phua (General Manager – Marketing and Procurement)
Mr B Watts (Manager – Operations)
Ms E Schillinger (General Manager – Memory)
Mr M Wallace (General Manager – Retail)
Directors’ report (continued)
For
per
sona
l use
onl
y
Cellnet Group Limited and its controlled entities Financial Report
8
Directors’ report (continued) Remuneration Report (Audited)(continued)
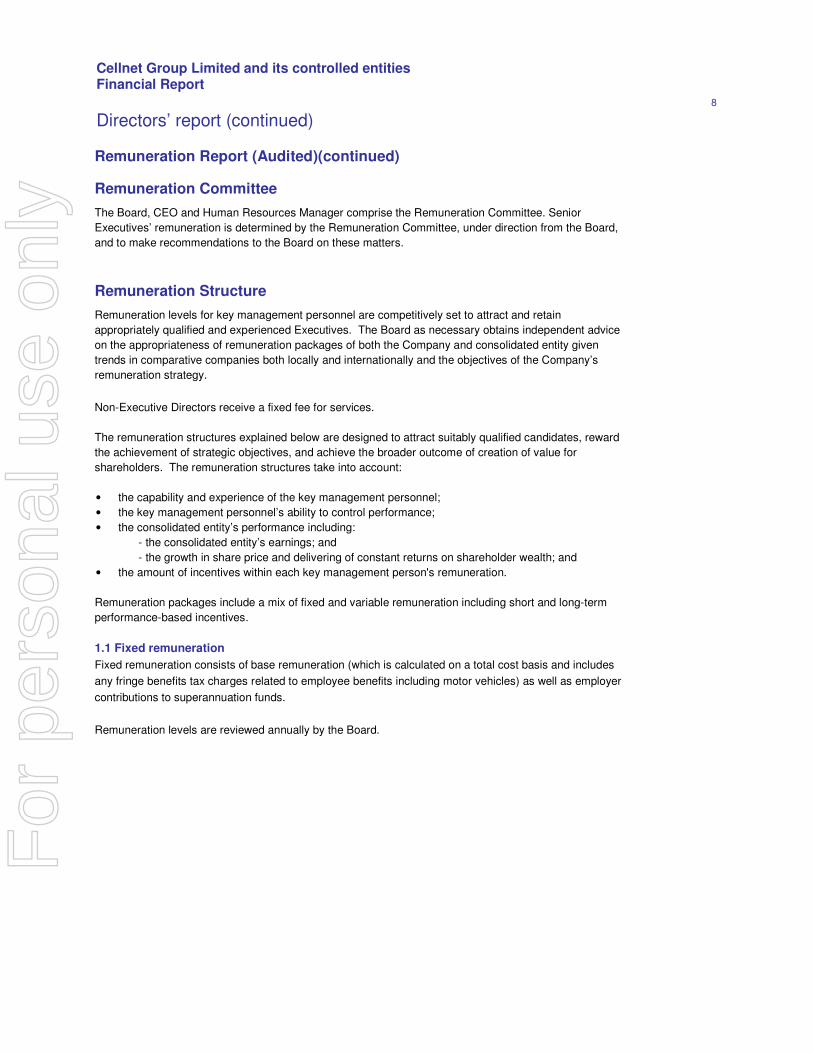
Remuneration Committee
The Board, CEO and Human Resources Manager comprise the Remuneration Committee. Senior
Executives’ remuneration is determined by the Remuneration Committee, under direction from the Board,
and to make recommendations to the Board on these matters.
Remuneration Structure
Remuneration levels for key management personnel are competitively set to attract and retain
appropriately qualified and experienced Executives. The Board as necessary obtains independent advice
on the appropriateness of remuneration packages of both the Company and consolidated entity given
trends in comparative companies both locally and internationally and the objectives of the Company’s
remuneration strategy.
Non-Executive Directors receive a fixed fee for services.
The remuneration structures explained below are designed to attract suitably qualified candidates, reward
the achievement of strategic objectives, and achieve the broader outcome of creation of value for
shareholders. The remuneration structures take into account:
• the capability and experience of the key management personnel;
• the key management personnel’s ability to control performance;
• the consolidated entity’s performance including:
- the consolidated entity’s earnings; and
- the growth in share price and delivering of constant returns on shareholder wealth; and
• the amount of incentives within each key management person's remuneration.
Remuneration packages include a mix of fixed and variable remuneration including short and long-term
performance-based incentives.
1.1 Fixed remuneration
Fixed remuneration consists of base remuneration (which is calculated on a total cost basis and includes
any fringe benefits tax charges related to employee benefits including motor vehicles) as well as employer
contributions to superannuation funds.
Remuneration levels are reviewed annually by the Board.
For
per
sona
l use
onl
y
Cellnet Group Limited and its controlled entities Financial Report
9
Directors’ report (continued) Remuneration Report (Audited)(continued) The processes adopted seek to consider performance across a wide spectrum of the business of the
consolidated entity. As necessary, reliance is placed on external sources to provide analysis and advice
to ensure the remuneration is competitive. Senior Executive’s remuneration is also reviewed on
promotion.
1.2 Performance-linked remuneration Performance-linked remuneration includes both short-term and long-term incentives and is designed to
reward key management personnel for meeting or exceeding their financial and personal objectives. The
short-term incentive (STI) is an ‘at risk’ bonus provided in the form of cash. A long-term incentive (LTI)
plan is in the process of being considered. In the past the LTI had been provided as shares or options
over ordinary shares of the Company under the rules of the Employee Share Option Plan (see Note 27(a)
to the financial statements).
1.3 Short-term incentive bonus Each year the Board and CEO set the key performance indicators (KPIs) for the key management
personnel and the Board sets the KPI’s for the CEO. The KPIs generally include measures relating to the
consolidated entity, and the individual, and include a combination of financial and project related targets.
The measures are chosen as they directly align the individual’s reward to the KPIs of the consolidated
entity and to its strategy and performance.
For the year ended 30 June 2009 the financial performance objectives primarily related to three main
categories covering: profitable segments of the business; balance sheet strengthening and realisation of
working capital from discontinued operations. The non-financial objectives vary with position and
responsibility and include measures such as achieving strategic outcomes.
At the end of the financial year the Board assesses the actual performance of the consolidated entity and
individual against the KPI’s set at the beginning of the financial year. A percentage of the pre-determined
maximum amount is awarded depending on results, between 0 and 100 % for reaching target performance
for non-financial objectives, and uncapped beyond 100% for stretch performance beyond the target in
respect of financial performance objectives. No bonus is awarded where performance falls below the
minimum.
In the current year, in respect of the financial performance objectives, the efficient realisation of working
capital from unprofitable segments of the business, operational restructuring, balance sheet strengthening
and the performance of the continuing operations were the key focus area and this target was achieved. In
respect of the other financial objectives, including profit after tax, the achievement levels were not achieved
and non-financial objectives were partially achieved.
The Board approves the cash incentive to be paid to senior managers. This method of assessment was
chosen as it provides the Board with an objective assessment of the individual’s performance.
1.4 Long-term incentives Performance Share Rights Plan
The Board had established a Performance Share Rights Plan which is designed to provide incentives to the
key management personnel of the consolidated entity. The plan was approved by shareholders at the 18
November 2005 Annual General Meeting. Under the plan, performance rights are issued to key
management personnel. The rights deliver ordinary shares to key management personnel (at no cost to the
Executive) only if the performance hurdle in relation to those performance rights is met. Where the
performance hurdle is met, the Company will acquire the necessary shares on the stock market and allocate
them to the key management person. Non-Executive Directors are not entitled to participate in the plan.
The number of performance rights to be granted to each Executive is set by taking a specified percentage of
the total fixed remuneration of each key management person, exclusive of any bonuses, and dividing that by
the five-day average Cellnet closing share price prior to the date of issue.
For
per
sona
l use
onl
y
Cellnet Group Limited and its controlled entities Financial Report
10
Directors’ report (continued) Remuneration Report (Audited)(continued)
No issues were made under this plan during the current year and no issues have been made under this plan
since 1 July 2006.
The number of performance rights that vest to key management personnel will be determined according to the
Company’s relative Total Share Return (TSR) performance over the relevant performance period compared
with a comparative group of companies.
TSR measures growth in shareholder value (essentially movement in share price plus dividends, assuming re-
investment) over the performance period. Under the relative TSR test:
• no performance rights will vest unless the Company’s TSR over the performance period is greater than or
equal to the TSR of the Company which is at the 50th percentile of the comparative group ranked by TSR
performance. If that threshold is attained 50% of the performance shares will vest and become the property
of the key management personnel;
• all of the performance rights will vest if the Company’s TSR over the performance period is equal to or
greater than the TSR of the Company which is at the 75th percentile of the comparative group, ranked by
TSR performance; and
• the percentage of the performance rights which will vest will increase progressively as the Company’s TSR
moves from the 50th
to 75th percentiles.
The comparative group for the relative TSR test will comprise a broad group of ASX-listed companies of
reasonably comparable size to the consolidated entity, as determined by the Board, but excluding listed
property trusts and similar entities. Companies that drop out of the comparative group during the performance
period because of mergers and delistings will not be replaced.
There are no unvested Performance Rights as these have either not satisfied the relevant criteria or they have
been forfeited through resignation.
Executive Share and Option Plan
The Board established an Executive Share and Option Plan which is designed to provide incentives to the
Executives of the consolidated entity. The plan was approved by shareholders at the 18 December 2007
Annual General Meeting.
Under the plan the Board has the discretion to issue options to Executives as long as the issue does not result
in the Executive owning or controlling the exercise of voting power attached to 5% or more of all shares then on
issue. Each option is convertible to one ordinary share. The exercise price of the options is determined by the
Board.
The rules governing the operation of the plan may be amended, waived or modified, at any time by resolution
of the Board provided there is no reduction of rights to Executives in the plan. If an amendment reduces the
rights of Executives in the plan, it requires written consent of three-quarters of affected Executives.
The plan may be terminated or suspended at any time by a resolution of the Board, provided the termination or
suspension does not materially adversely affect the rights of persons holding shares issued under the plan at
that time.
Nil options issued in current year. 2,500,000 options were issued under this plan during the previous year on
18 January 2008. For full details of the plan see Note 27(e) and 37 of the financial statements. No further
options have been issued over the share capital of the Company.
For
per
sona
l use
onl
y
Cellnet Group Limited and its controlled entities Financial Report
11
Directors’ report (continued) Remuneration Report (Audited)(continued)
Long Term Incentive Plan
The Board established a Long Term Incentive Plan which is designed to provide incentives to the Executives of the
consolidated entity. The plan was approved by shareholders at the 18 December 2007 Annual General Meeting.
The purpose and rules of the plan are the same as the Executive Share and Option Plan described above, except that
there is no prohibition on issuing shares or options if it would result in an Executive owning (legally or beneficially) or
controlling the exercise of voting power attached to 5% or more of all shares then on issue.
Nil options issued in current year. 2,500,000 shares were issued under this plan during the previous year on 18
January 2008. For full details of the plan see Note 27(f) and 37 of the financial statements.
1.5 Short-term and long-term incentive structure The Board considers that the above performance-linked remuneration structure is appropriate at this time. It provides
both short-term focus on operating performance and longer term focus on share price growth.
1.6 Consequences of performance on shareholder wealth In considering the consolidated entity’s performance and benefits for shareholder wealth, the Board has regard to the
following indices in respect of the current financial year and the previous four financial years.
2009 2008 2007 2006 2005
Net profit attributable to equity
holders of the Company ($15,772,000) ($4,702,000) $5,887,000 $1,568,000 $6,628,000
Dividends paid - - $1,031,000 - $6,064,000
Change in share price ($0.025) ($0.65) ($0.21)* ($0.15) $0.09
Working Capital days at year end** 18.0 43.3 60.8 66.3 104.6
Cash flow $10,435,000 $14,105,000 ($4,058,000) $33,105,000 ($29,157,000)
* Mercury Mobility Limited was demerged from the Consolidated entity during the 2007 year which resulted in a
reduction in Cellnet’s share price. Mercury Mobility Limited was subsequently listed and had a share price of 3.0 cents
at the date of this report.
** As disclosed in 2008 Annual Financial Report, the 2007 cash and trade receivables were corrected in the previous
reporting period. This had an impact on the trade receivables which have been restated to reflect the correct position.
The working capital days at year end have been recalculated accordingly to reflect the restated position.
Realisation of working capital employed in the unprofitable segments of the business, operational restructuring,
balance sheet strengthening and improving the performance of the continuing operations were the main financial
performance targets in setting the financial year 2009 short-term incentive. Net profit amounts for 2005 and
subsequent years have been calculated in accordance with Australian equivalents to IFRS (AIFRS). Cash flows have
been calculated in accordance with AIFRS.
For
per
sona
l use
onl
y
Cellnet Group Limited and its controlled entities Financial Report
12
Directors’ report (continued) Remuneration Report (Audited)(continued) 1.7 Other benefits During the current and prior year, there were no non-cash bonuses or benefits paid to key management
personnel.
1.8 Service contracts
It is the consolidated entity’s policy that service contracts for key management personnel (outlined in the
following table) are unlimited in term but capable of termination on no more than 6 months’ notice and that
the consolidated entity retains the right to terminate the contract immediately, by making payment of up to 6
months’ pay in lieu of notice.
The service contract outlines the components of remuneration paid to the key management person but
does not prescribe how remuneration levels are modified year to year. Remuneration levels are reviewed
each year to take into account cost-of-living changes, any change in the scope of the role performed by the
senior Executive and any changes required to meet the principles of the remuneration policy.
At 30 June 2009, Stuart Smith, the Chief Executive Officer, has a contract of employment 19 December
2007, as subsequently varied, with the Company that provides that: at any time the service contract can be
terminated by either party providing 2 months’ notice; that the Company is able make a payment in lieu of
notice equal to 2 months total earnings; and that the Chief Executive Officer has no entitlement to
termination payment in the event of removal for misconduct. Should his position become redundant he is
entitled to a payment of 6 months salary in addition to the notice period.
1.8.1 Non-Executive Directors
Total remuneration for all non-Executive Directors, last voted upon by shareholders at the 1999 AGM, is not
to exceed $300,000 per annum.
The Chairman’s base fee is $54,500 per annum and non-Executive Directors’ base fees are presently
$50,000 per annum. Non-Executive Directors do not receive performance related remuneration. Directors’
fees cover all main Board activities and membership of the Audit and Risk Management committee.
The Board does not have a retirement plan or scheme in place for Directors other than statutory
superannuation which is paid in addition to the above fees.
1.8.2 Executive Directors
Total base fees for all Executive Directors at 30 June 2009 are not to exceed $400,000 per annum.
Directors’ fees cover all main Board activities and membership of the Audit and Risk Management
committee.
For
per
sona
l use
onl
y
Cellnet Group Limited and its controlled entities Financial Report
13
Directors’ report (continued) Remuneration Report (Audited)(continued)
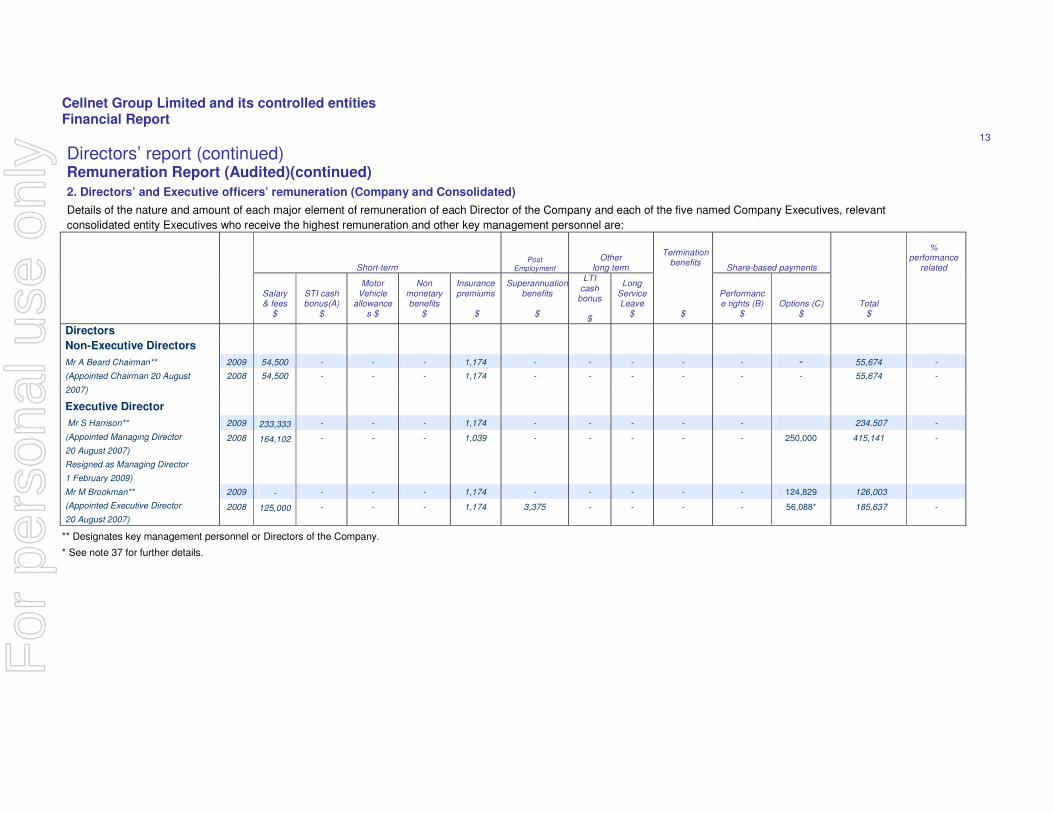
2. Directors’ and Executive officers’ remuneration (Company and Consolidated)
Details of the nature and amount of each major element of remuneration of each Director of the Company and each of the five named Company Executives, relevant
consolidated entity Executives who receive the highest remuneration and other key management personnel are:
Short-term Post
Employment
Other long term
Termination
benefits Share-based payments
%
performance related
Salary & fees
$
STI cash bonus(A)
$
Motor Vehicle
allowances $
Non monetary benefits
$
Insurance premiums
$
Superannuation benefits
$
LTI cash
bonus
$
Long Service Leave
$
$
Performance rights (B)
$
Options (C) $
Total $
Directors
Non-Executive Directors
2009 54,500 - - - 1,174 - - - - - - 55,674 -
2008 54,500 - - - 1,174 - - - - - - 55,674 -
Mr A Beard Chairman**
(Appointed Chairman 20 August
2007)
Executive Director
2009 233,333 - - - 1,174 - - - - - 234.507 - Mr S Harrison**
(Appointed Managing Director
20 August 2007)
Resigned as Managing Director
1 February 2009)
2008 164,102 - - - 1,039 - - - - - 250,000 415,141 -
2009 - - - - 1,174 - - - - - 124,829 126,003 Mr M Brookman**
(Appointed Executive Director
20 August 2007)
2008 125,000 - - - 1,174 3,375 - - - - 56,088* 185,637 -
** Designates key management personnel or Directors of the Company.
* See note 37 for further details.
For
per
sona
l use
onl
y
Cellnet Group Limited and its controlled entities Financial Report
14
Short-term Post Employment
Other long term
Termination
benefits Share-based payments
% performance
related
Salary &
fees $
STI cash bonus(A)
$
Motor Vehicle
allowances $
Non monetary benefits
$
Insurance premiums
$
Superannuation benefits
$
LTI cash bonus
$
Long Service Leave
$
$
Performance rights (B)
$
Options
(C) $
Total $
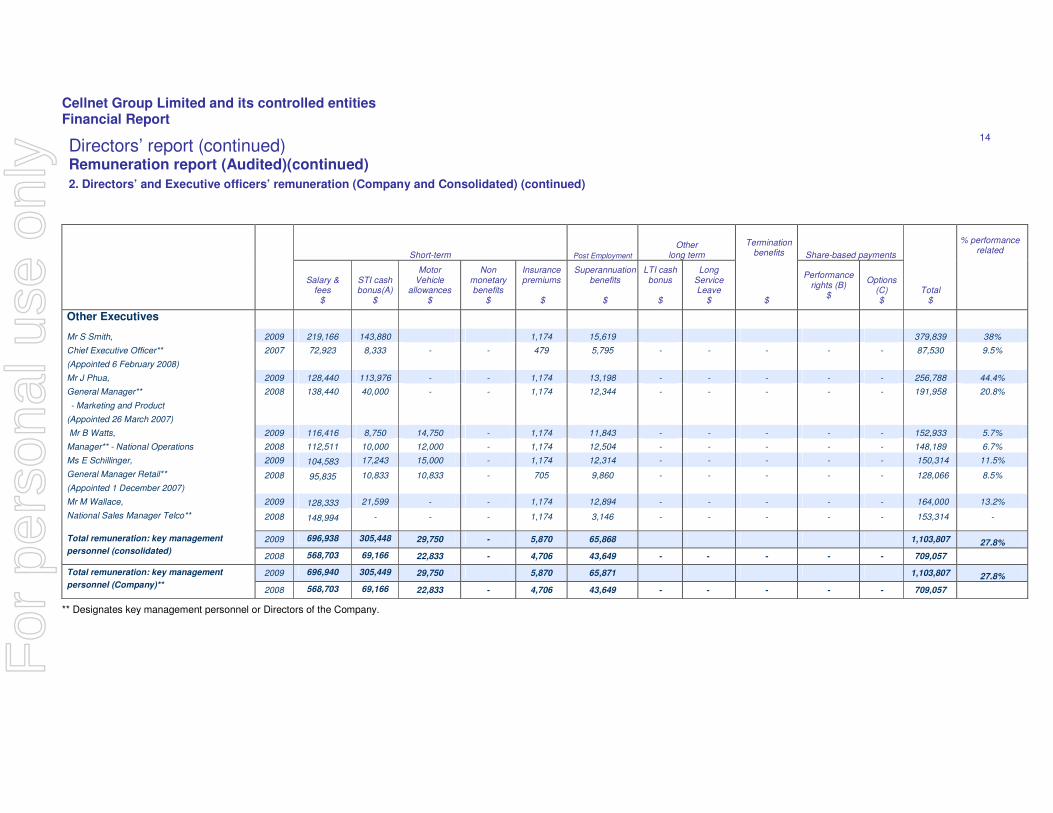
Other Executives
2009 219,166 143,880 1,174 15,619 379,839 38% Mr S Smith,
Chief Executive Officer**
(Appointed 6 February 2008)
2007 72,923 8,333 - - 479 5,795 - - - - - 87,530 9.5%
2009 128,440 113,976 - - 1,174 13,198 - - - - - 256,788 44.4% Mr J Phua,
General Manager**
- Marketing and Product
(Appointed 26 March 2007)
2008 138,440 40,000 - - 1,174 12,344 - - - - - 191,958 20.8%
2009 116,416 8,750 14,750 - 1,174 11,843 - - - - - 152,933 5.7% Mr B Watts,
Manager** - National Operations 2008 112,511 10,000 12,000 - 1,174 12,504 - - - - - 148,189 6.7%
2009 104,583 17,243 15,000 - 1,174 12,314 - - - - - 150,314 11.5% Ms E Schillinger,
General Manager Retail**
(Appointed 1 December 2007)
2008 95,835 10,833 10,833 - 705 9,860 - - - - - 128,066 8.5%
2009 128,333 21,599 - - 1,174 12,894 - - - - - 164,000 13.2% Mr M Wallace,
National Sales Manager Telco** 2008 148,994 - - - 1,174 3,146 - - - - - 153,314 -
2009 696,938 305,448 29,750 - 5,870 65,868 1,103,807 27.8% Total remuneration: key management
personnel (consolidated) 2008 568,703 69,166 22,833 - 4,706 43,649 - - - - - 709,057
2009 696,940 305,449 29,750 5,870 65,871 1,103,807 27.8% Total remuneration: key management
personnel (Company)**
2008 568,703 69,166 22,833 - 4,706 43,649 - - - - - 709,057
** Designates key management personnel or Directors of the Company.
Directors’ report (continued) Remuneration report (Audited)(continued)
2. Directors’ and Executive officers’ remuneration (Company and Consolidated) (continued)
For
per
sona
l use
onl
y
Cellnet Group Limited and its controlled entities Financial Report
15
Directors’ report (continued) Remuneration report (Audited)(continued)
Directors’ report (continued)
Remuneration Report (Audited)(continued)
2. Notes in relation to the table of Directors’ and Executive officers remuneration A. The short-term incentive bonus is for performance during the 30 June 2009 financial year using the
criteria set out on page 9.
B. Performance rights for the prior year were issued on 1 July 2006. The performance period for these
rights is three years with performance being tested on an annual basis and a certain proportion of the
rights being able to vest in each of the three years should the performance criteria be met (20% year 1,
30% year 2 and 50% year 3). Where the criteria is not met in a given year the rights “roll” into the next
year and are able to be tested again. The fair value of these performance rights were calculated as
being $0.83 for those able to vest on 30 June 2007, $0.77 for those able to vest on 30 June 2008, and
$0.70 cents for those able to vest on 30 June 2009. The performance for the year to 30 June 2009 did
not satisfy the performance criteria, and therefore these rights have been forfeited.
Details of the rights and shares issued under the Performance Share Rights Plan are provided in Note
27(b) to the Financial Report.
The assessed fair value at grant date of rights granted to individuals is allocated equally over the
period from grant date to vesting date, and the amount is included in the remuneration tables above.
Fair values at grant date are independently determined using a Monte Carlo simulation model utilising a
Black-Scholes option pricing model framework that takes into account the term of the rights, the vesting
and performance criteria, the non-tradeable nature of the rights, the share price at grant date and
expected price volatility of the underlying share, the expected dividend yield and the risk-free interest
rate for the term of the rights.
C. Options for the current year were issued on 18 January 2008. Details of the Executive Share and
Option Plan are provided in Note 27(e) to the Financial Report.
2.1 Details of performance related remuneration
Details of the consolidated entity’s policy in relation to the proportion of remuneration that is performance
related is discussed on page 9.
3. Equity instruments
All performance rights refer to rights that will deliver an ordinary Cellnet Group Limited share (at no cost) but only
if the performance hurdle in relation to that performance right is met. All options refer to options over ordinary
shares of Cellnet Group Limited, which are exercisable on a one-for-one basis under the Employee Share Option
Plan.
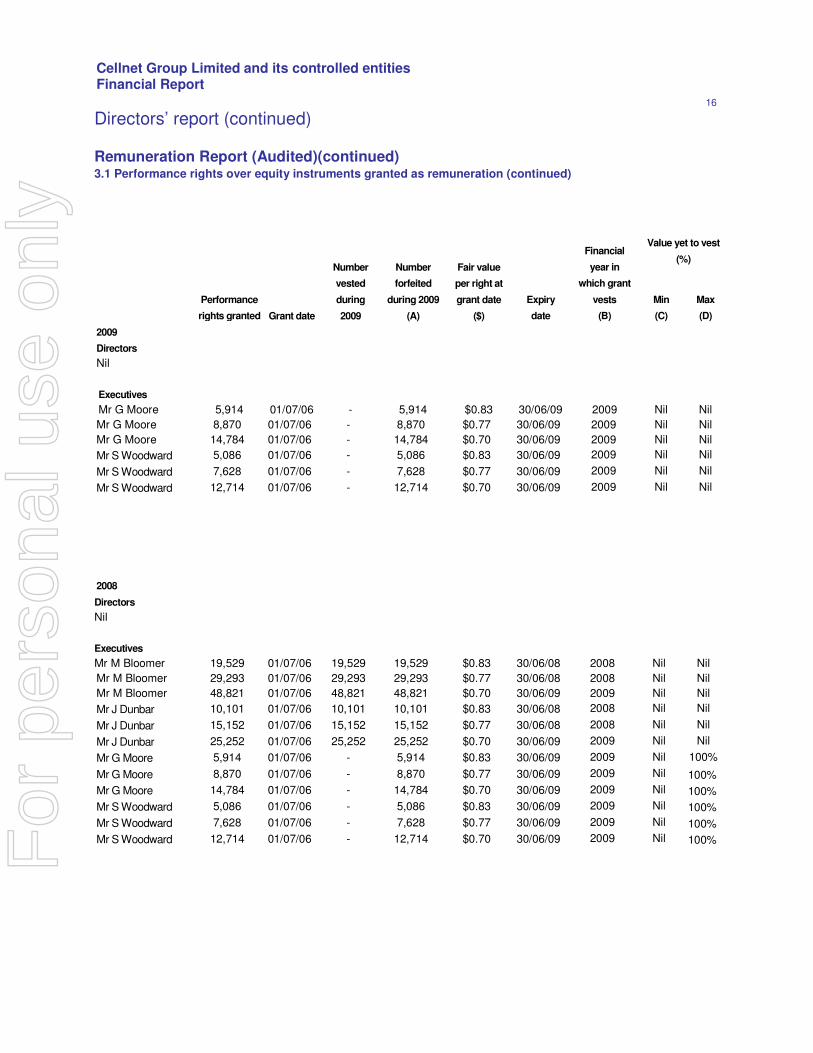
3.1 Performance rights over equity instruments granted as remuneration Details on performance rights to ordinary shares in the Company that were granted as remuneration to key
management personnel during the reporting period are as follows: For
per
sona
l use
onl
y
Cellnet Group Limited and its controlled entities Financial Report
16
Directors’ report (continued)
Remuneration Report (Audited)(continued) 3.1 Performance rights over equity instruments granted as remuneration (continued)
Directors Nil
Executives
Mr M Bloomer 19,529 01/07/06 19,529 19,529 $0.83 30/06/08 2008 Nil Nil
Mr M Bloomer 29,293 01/07/06 29,293 29,293 $0.77 30/06/08 2008 Nil Nil
Mr M Bloomer 48,821 01/07/06 48,821 48,821 $0.70 30/06/09 2009 Nil Nil
Mr J Dunbar 10,101 01/07/06 10,101 10,101 $0.83 30/06/08 2008 Nil Nil
Mr J Dunbar 15,152 01/07/06 15,152 15,152 $0.77 30/06/08 2008 Nil Nil
Mr J Dunbar 25,252 01/07/06 25,252 25,252 $0.70 30/06/09 2009 Nil Nil
Mr G Moore 5,914 01/07/06 - 5,914 $0.83 30/06/09 2009 Nil 100%
Mr G Moore 8,870 01/07/06 - 8,870 $0.77 30/06/09 2009 Nil 100%
Mr G Moore 14,784 01/07/06 - 14,784 $0.70 30/06/09 2009 Nil 100%
Mr S Woodward 5,086 01/07/06 - 5,086 $0.83 30/06/09 2009 Nil 100%
Mr S Woodward 7,628 01/07/06 - 7,628 $0.77 30/06/09 2009 Nil 100%
Mr S Woodward 12,714 01/07/06 - 12,714 $0.70 30/06/09 2009 Nil 100%
Value yet to vest
(%)
Performance
rights granted Grant date
Number
vested
during
2009
Number
forfeited
during 2009
(A)
Fair value
per right at
grant date
($)
Expiry
date
Financial
year in
which grant
vests
(B)
Min
(C)
Max
(D)
2009 Directors Nil
Executives
Mr G Moore 5,914 01/07/06 - 5,914 $0.83 30/06/09 2009 Nil Nil
Mr G Moore 8,870 01/07/06 - 8,870 $0.77 30/06/09 2009 Nil Nil
Mr G Moore 14,784 01/07/06 - 14,784 $0.70 30/06/09 2009 Nil Nil
Mr S Woodward 5,086 01/07/06 - 5,086 $0.83 30/06/09 2009 Nil Nil
Mr S Woodward 7,628 01/07/06 - 7,628 $0.77 30/06/09 2009 Nil Nil
Mr S Woodward 12,714 01/07/06 - 12,714 $0.70 30/06/09 2009 Nil Nil
2008
For
per
sona
l use
onl
y
Cellnet Group Limited and its controlled entities Financial Report
17
(A) The number forfeited in the year represents the reduction from the maximum number of rights available to vest due to the highest level performance criteria not being achieved, or due to the employee leaving the consolidated entity’s employment.
(B) For the 2008 allocation, where the performance criteria is not met during a year (and the rights were not forfeited
during the year) the rights “roll” into the following year and the performance criteria is retested in that following year. Further details for these rights are provided at page 9.
(C) The minimum value of rights yet to vest is $nil as the performance criteria may not be met and consequently the right
may not vest or the employee left the consolidated entity’s employment.
No Directors or Executives were granted performance rights during the year.
Performance rights in relation to which the performance hurdle was not met have lapsed. Performance rights lapsed
where the key management personnel cease employment with the consolidated entity other than on retirement,
redundancy, death or total and permanent disablement. However, at the discretion of the Board, performance rights may
vest on a pro-rata basis, subject to performance testing, in the event of retirement, redundancy, death or total and
permanent disablement prior to the end of the performance period.
All performance rights held by key management personnel and all shares held in the plan for key management personnel
after satisfaction of the performance hurdles will be forfeited if the Board determines that the key management person
acted fraudulently or dishonestly or is in serious breach of duty to the Company or in the Board’s reasonable opinion has
brought the Company into disrepute.
Details of the performance criteria are included in the long-term incentives discussion on page 9. Further details
regarding the Performance Share Rights Plan is provided in Note 27(b) to the financial statements.
Directors’ report (continued)
Remuneration Report (Audited)(continued) 3.1 Performance rights over equity instruments granted as remuneration (continued)
For
per
sona
l use
onl
y

Cellnet Group Limited and its controlled entities Financial Report
18
Directors’ report (continued) Remuneration Report (Audited)(continued) 3.2 Options over equity instruments granted as remuneration
No options were issued during the period.
In the previous year, on 18 January 2008 2,500,000 options were issued to the Managing Director as approved at the
Annual General Meeting of the Company held on 18 December 2007. These options were issued for nil consideration
with an exercise price of $0.70 per share. These options have a fair value of $0.10 per option and are exercisable for 2
years from the grant date. The options were not exercised during the current financial year.
All other options over shares issued under the Employee Share Option Plan have now expired.
Further details regarding options granted to key management personnel under the Employee Share Option Plan and
Executive Share and Option Plan are provided in Note 27(a) and 27(e) to the financial statements.
3.3 Exercise of options granted as remuneration During the reporting period, no shares were issued on the exercise of options previously granted as remuneration.
3.4 Modification of terms of equity-settled share-based payment transactions
No terms of equity-settled share-based payment transactions (including options and rights granted as remuneration to a
key management person) have been altered or modified by the issuing entity during the reporting period or the prior
period.
For
per
sona
l use
onl
y
Cellnet Group Limited and its controlled entities Financial Report
19
Directors’ report (continued)
Principal Activities
The principal activities of the consolidated entity are distribution and fulfilment services to the mobile
telecommunications and retail industries in Australia and New Zealand.
Apart from the sale and discontinuation of the distribution and fulfilment services of the IT segment of the business
during the year, there were no other significant changes in the nature of the operating activities of the consolidated
entity during the year.
Operating and Financial Review
Results for the period The net loss for the year was $15,772,000 (2008: loss $4,702,000). In comparing the loss for the current financial
year to the prior year results the current year includes the following components :
- a loss from discontinued operations of $9,613,000 which also included the write down of intangible assets
of $2,400,000
- a loss from continuing operations of $6,159,000 which included inventory write downs and provisions of
$2,500,000.
Revenue from continuing operations for the year was $85,726,000 compared to $223,625,000 for the prior year, a
reduction of $137,926,000. This reduction was largely due to the loss of the Telecom New Zealand handset logistics
and distribution business which was notified to the market on 22 April 2008 and which ceased on 30 September
2008. In addition, the exit from the notebook and desktop segment of the market in October 2008 reduced revenue
by approximately $54,000,000.
The past year has been a significant turning point for the Company and some significant decisions have been made
in order to focus the Company on where it adds value to both customers and shareholders. From having a diverse
non-synergistic approach and trying to source as many products and vendors as possible, the Company has reset
its path and direction which has resulted in the sale and closure of a segment of its operation, namely the IT
distribution services. This significant restructuring was vital but the costs associated with this restructuring have not
been small and although the majority of these costs were incurred in the first half of the financial year, further costs
were incurred in the second half when the decision was made to exit from the IT segment in its entirety.
The delayed exit was necessary in order to build up the Retail segment of the business and reduce some of the
corporate overheads which would not have been sustainable with the reduced operations. This took a 9 month
window to achieve and the sale and exit from the server and print segments in June 2009 was done when we were
confident the Retail segment was able to not only provide a profit but a return to shareholders commensurate with
the working capital invested in this segment.
The realisation of the working capital invested in the unprofitable IT distribution segment has been largely completed
and as a consequence the Company has cash reserves of $20 million which the Board is considering the best use of
these funds for shareholders.
Significant changes in the state of affairs
As mentioned above, the Company divested itself of the IT distribution segment of its operations which was done in
2 stages. The first stage commenced in October 2008 which saw the transactional notebook and desktop segments
of the business ceasing and the results of this cessation were noted in the half year accounts. The second stage
commenced in June 2009 which saw the Company sell and discontinue the remaining server and print segments of
the IT segment. The discontinuation of this segment has had the effect of reducing revenue by $54,000,000.
In the previous year, the Telecom New Zealand handset logistics and distribution business was terminated on 30
April 2008 with a transition period to 30 September 2008. This will have the affect of reducing annual revenue by
approximately $148,000,000 and profit after tax by $1,250,000.
For
per
sona
l use
onl
y
Cellnet Group Limited and its controlled entities Financial Report
20
Directors’ report (continued)
Strategy and future performance
The operating results of Cellnet are constantly monitored and reviewed and opportunities to improve performance
constantly evaluated. The Board believes the strategy set in place is the correct one and that the continuing
operations will provide a return on funds invested in line with peers in the industry.
The utilisation of cash realised from the discontinued segments of the business is under review and shareholders
will be updated as appropriate. As previously announced, the Board has been looking at various potential
investments and will continue to do so as well as other options available to the Company.
Events subsequent to reporting date
Since the year end, there has not arisen in the interval between the end of the financial year and the date of this
report any item, transaction or event of a material and unusual nature likely, in the opinion of the Directors of the
Company, to affect significantly the operations of the consolidated entity, the results of those operations, or the
state of affairs of the consolidated entity, in future financial years.
Likely developments As explained above in respect of strategy and future performance, the consolidated entity is constantly reviewing its
direction and strategic value inherent in the business. In conjunction with this, the consolidated entity will continue
to pursue its trading activities and the restructure initiatives to further improve on operational to produce the most
beneficial long-term results for the shareholders of the Company.
For
per
sona
l use
onl
y
Cellnet Group Limited and its controlled entities Financial Report
21
Directors’ report (continued) Indemnification and insurance of officers Indemnification The Company has also agreed to indemnify the current and former Directors and some officers of its
controlled entities for all liabilities to another person, other than the Company or a related body
corporate that may arise from their position, except where the liability arises out of conduct involving a
lack of good faith. The agreement stipulates that the Company will meet the full amount of any such
liabilities, including costs and expenses.
Consolidated
2009 $
2008 $
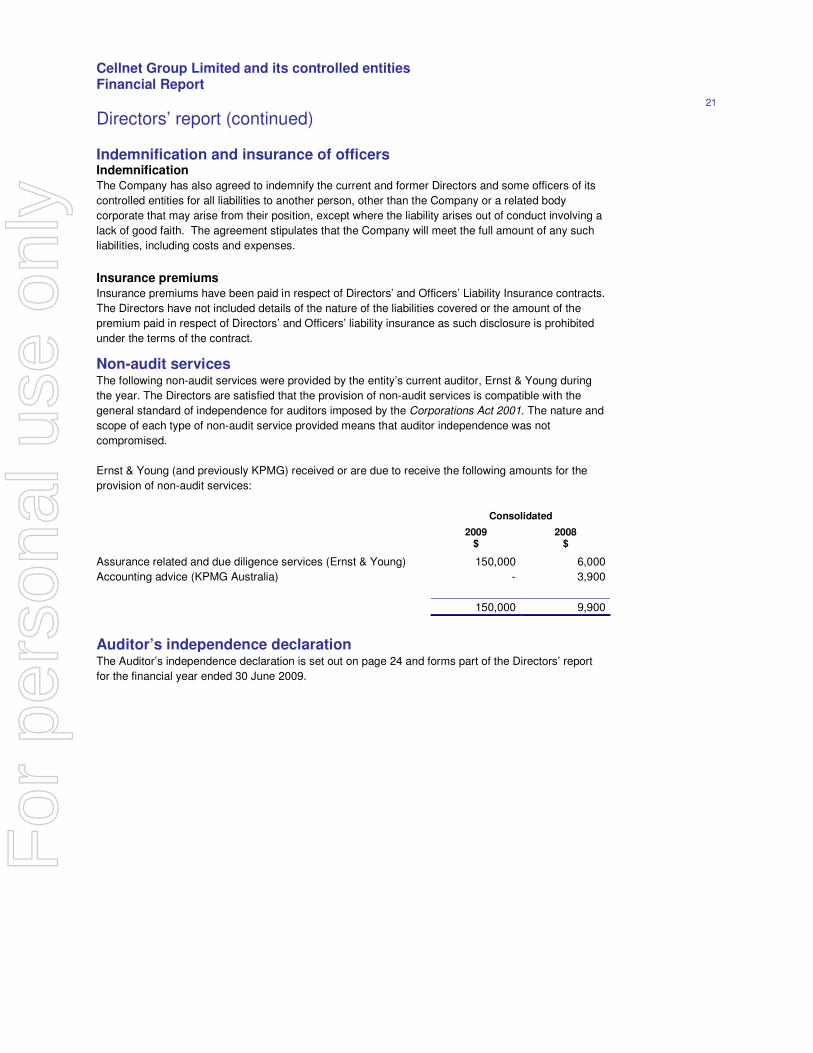
Assurance related and due diligence services (Ernst & Young) 150,000 6,000
Accounting advice (KPMG Australia) - 3,900
150,000 9,900
Insurance premiums Insurance premiums have been paid in respect of Directors’ and Officers’ Liability Insurance contracts.
The Directors have not included details of the nature of the liabilities covered or the amount of the
premium paid in respect of Directors’ and Officers’ liability insurance as such disclosure is prohibited
under the terms of the contract.
Non-audit services
The following non-audit services were provided by the entity’s current auditor, Ernst & Young during
the year. The Directors are satisfied that the provision of non-audit services is compatible with the
general standard of independence for auditors imposed by the Corporations Act 2001. The nature and
scope of each type of non-audit service provided means that auditor independence was not
compromised.
Ernst & Young (and previously KPMG) received or are due to receive the following amounts for the
provision of non-audit services:
Auditor’s independence declaration
The Auditor’s independence declaration is set out on page 24 and forms part of the Directors’ report
for the financial year ended 30 June 2009.
For
per
sona
l use
onl
y
Cellnet Group Limited and its controlled entities Financial Report
22
_____________________
Alexander Beard Chairman Signed at Brisbane on 28 August 2009
Directors’ report (continued) Rounding
The Company is of a kind referred to in ASIC Class Order 98/100 dated 10 July 1998 and in
accordance with that Class Order, amounts in the financial report and Directors’ report have been
rounded off to the nearest thousand dollars, unless otherwise stated.
This report is made with a resolution of the Directors:
For
per
sona
l use
onl
y
Cellnet Group Limited and its controlled entities Financial Report
23
For
per
sona
l use
onl
y
Cellnet Group Limited and its controlled entities Financial Report
24
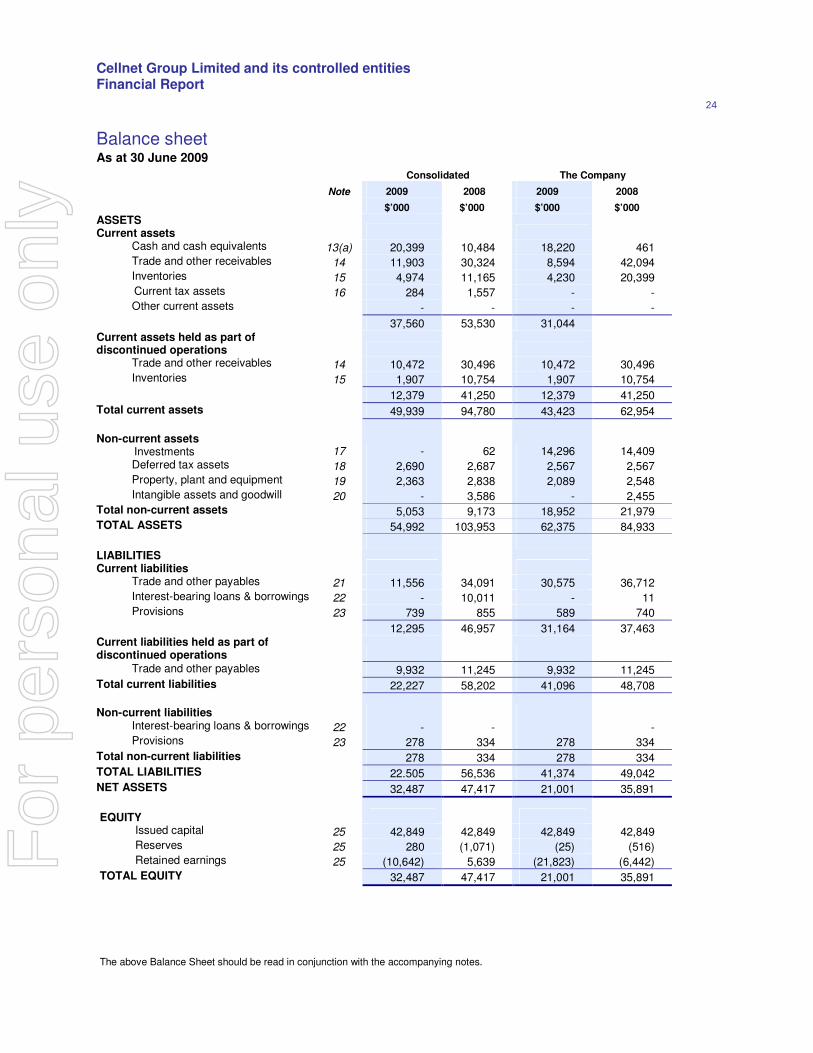
Balance sheet As at 30 June 2009 Consolidated The Company
Note 2009 2008 2009 2008
$’000 $’000 $’000 $’000
ASSETS Current assets
Cash and cash equivalents 13(a) 20,399 10,484 18,220 461 Trade and other receivables 14 11,903 30,324 8,594 42,094 Inventories 15 4,974 11,165 4,230 20,399 Current tax assets 16 284 1,557 - - Other current assets - - - -
37,560 53,530 31,044 Current assets held as part of discontinued operations Trade and other receivables 14 10,472 30,496 10,472 30,496 Inventories 15 1,907 10,754 1,907 10,754
12,379 41,250 12,379 41,250
Total current assets 49,939 94,780 43,423 62,954
Non-current assets Investments 17 - 62 14,296 14,409 Deferred tax assets 18 2,690 2,687 2,567 2,567 Property, plant and equipment 19 2,363 2,838 2,089 2,548 Intangible assets and goodwill 20 - 3,586 - 2,455 Total non-current assets 5,053 9,173 18,952 21,979 TOTAL ASSETS 54,992 103,953 62,375 84,933 LIABILITIES Current liabilities Trade and other payables 21 11,556 34,091 30,575 36,712 Interest-bearing loans & borrowings 22 - 10,011 - 11 Provisions 23 739 855 589 740
12,295 46,957 31,164 37,463 Current liabilities held as part of discontinued operations
Trade and other payables 9,932 11,245 9,932 11,245
Total current liabilities 22,227 58,202 41,096 48,708
Non-current liabilities Interest-bearing loans & borrowings 22 - - - Provisions 23 278 334 278 334 Total non-current liabilities 278 334 278 334
TOTAL LIABILITIES 22.505 56,536 41,374 49,042 NET ASSETS 32,487 47,417 21,001 35,891
EQUITY Issued capital 25 42,849 42,849 42,849 42,849 Reserves 25 280 (1,071) (25) (516) Retained earnings 25 (10,642) 5,639 (21,823) (6,442) TOTAL EQUITY 32,487 47,417 21,001 35,891
The above Balance Sheet should be read in conjunction with the accompanying notes.
For
per
sona
l use
onl
y
Cellnet Group Limited and its controlled entities Financial Report
25
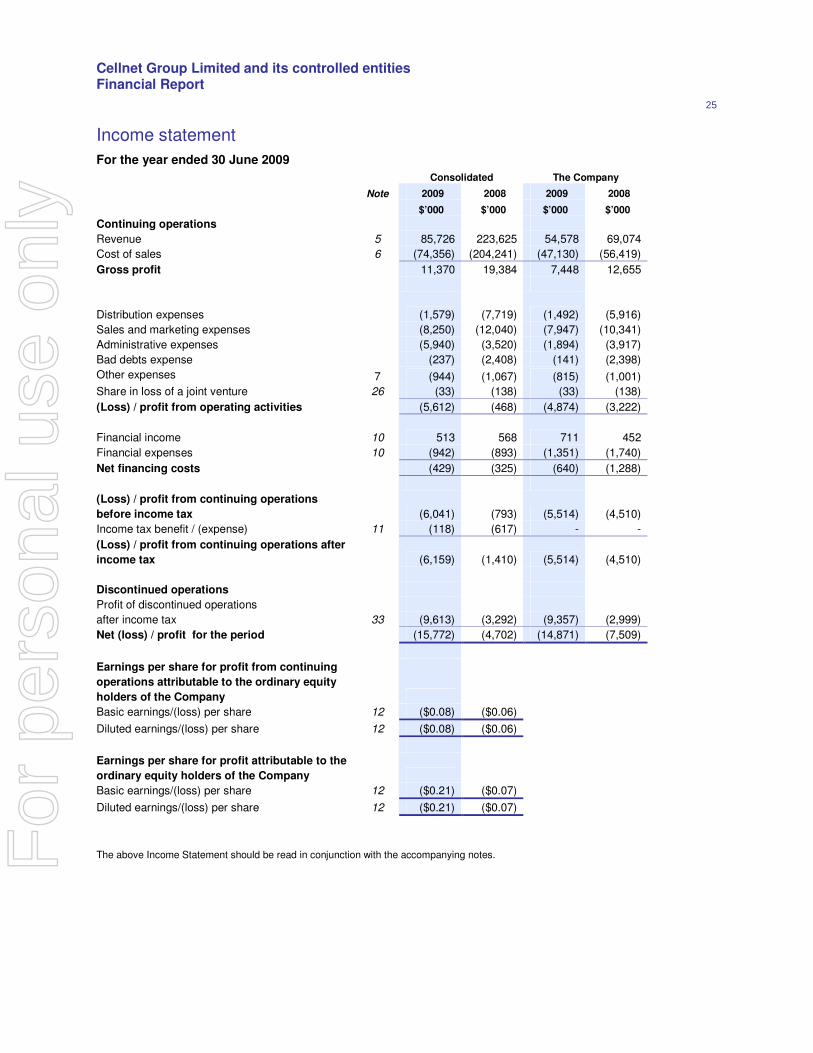
Income statement
For the year ended 30 June 2009 Consolidated The Company Note 2009 2008 2009 2008
$’000 $’000 $’000 $’000
Continuing operations
Revenue 5 85,726 223,625 54,578 69,074
Cost of sales 6 (74,356) (204,241) (47,130) (56,419)
Gross profit 11,370 19,384 7,448 12,655
Distribution expenses (1,579) (7,719) (1,492) (5,916)
Sales and marketing expenses (8,250) (12,040) (7,947) (10,341)
Administrative expenses (5,940) (3,520) (1,894) (3,917)
Bad debts expense (237) (2,408) (141) (2,398)
Other expenses 7 (944) (1,067) (815) (1,001)
Share in loss of a joint venture 26 (33) (138) (33) (138)
(Loss) / profit from operating activities (5,612) (468) (4,874) (3,222)
Financial income 10 513 568 711 452
Financial expenses 10 (942) (893) (1,351) (1,740)
Net financing costs (429) (325) (640) (1,288)
(Loss) / profit from continuing operations
before income tax (6,041) (793) (5,514) (4,510)
Income tax benefit / (expense) 11 (118) (617) - -
(Loss) / profit from continuing operations after
income tax (6,159) (1,410) (5,514) (4,510)
Discontinued operations
Profit of discontinued operations
after income tax 33 (9,613) (3,292) (9,357) (2,999)
Net (loss) / profit for the period (15,772) (4,702) (14,871) (7,509)
Earnings per share for profit from continuing
operations attributable to the ordinary equity
holders of the Company
Basic earnings/(loss) per share 12 ($0.08) ($0.06)
Diluted earnings/(loss) per share 12 ($0.08) ($0.06)
Earnings per share for profit attributable to the
ordinary equity holders of the Company
Basic earnings/(loss) per share 12 ($0.21) ($0.07)
Diluted earnings/(loss) per share 12 ($0.21) ($0.07)
The above Income Statement should be read in conjunction with the accompanying notes. For
per
sona
l use
onl
y
Cellnet Group Limited and its controlled entities Financial Report
26
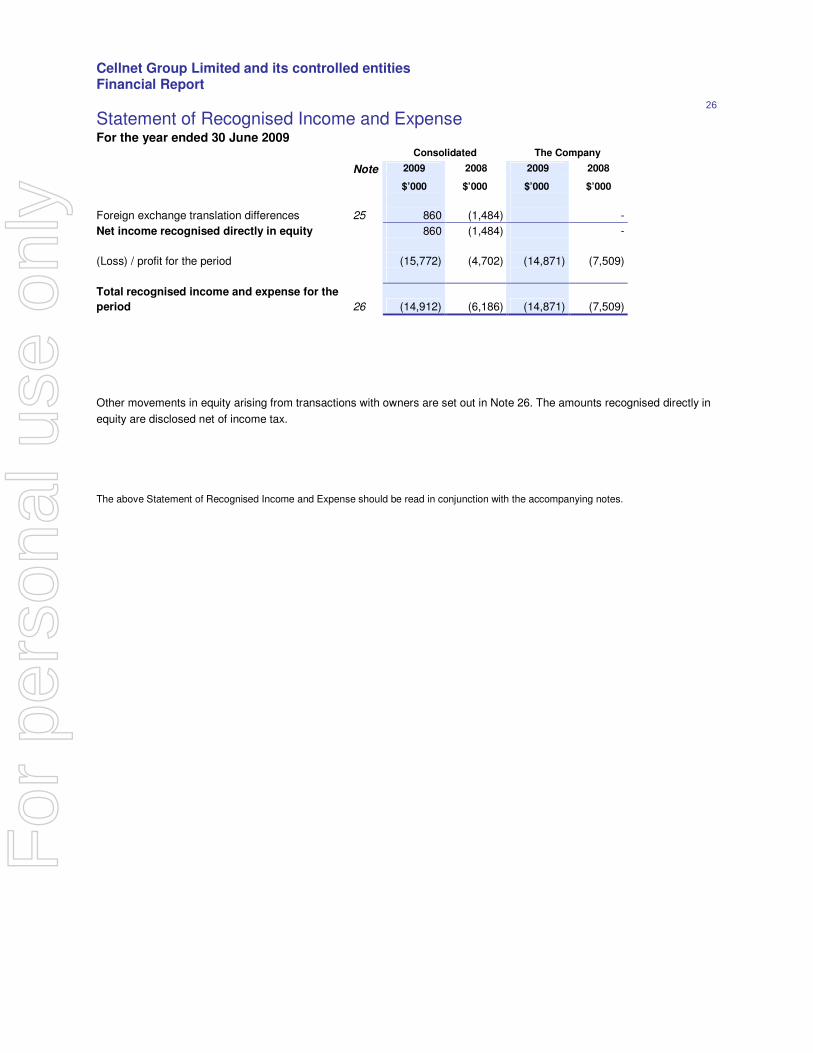
Statement of Recognised Income and Expense For the year ended 30 June 2009 Consolidated The Company
Note 2009 2008 2009 2008
$’000 $’000 $’000 $’000
Foreign exchange translation differences 25 860 (1,484) -
Net income recognised directly in equity 860 (1,484) -
(Loss) / profit for the period (15,772) (4,702) (14,871) (7,509)
Total recognised income and expense for the
period 26 (14,912) (6,186) (14,871) (7,509)
Other movements in equity arising from transactions with owners are set out in Note 26. The amounts recognised directly in
equity are disclosed net of income tax.
The above Statement of Recognised Income and Expense should be read in conjunction with the accompanying notes.
For
per
sona
l use
onl
y
Cellnet Group Limited and its controlled entities Financial Report
27
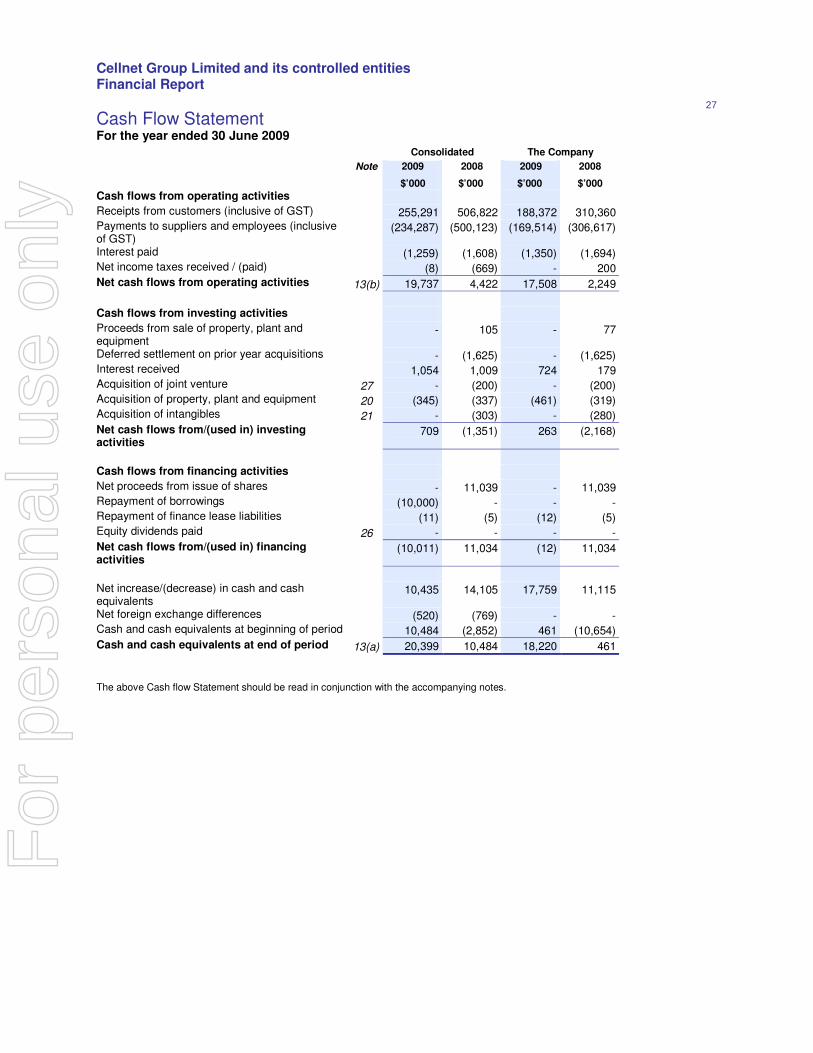
Cash Flow Statement For the year ended 30 June 2009 Consolidated The Company
Note 2009 2008 2009 2008
$’000 $’000 $’000 $’000
Cash flows from operating activities Receipts from customers (inclusive of GST) 255,291 506,822 188,372 310,360 Payments to suppliers and employees (inclusive of GST)
(234,287) (500,123) (169,514) (306,617)
Interest paid (1,259) (1,608) (1,350) (1,694) Net income taxes received / (paid) (8) (669) - 200 Net cash flows from operating activities 13(b) 19,737 4,422 17,508 2,249
Cash flows from investing activities Proceeds from sale of property, plant and equipment
- 105 - 77
Deferred settlement on prior year acquisitions - (1,625) - (1,625) Interest received 1,054 1,009 724 179 Acquisition of joint venture 27 - (200) - (200) Acquisition of property, plant and equipment 20 (345) (337) (461) (319) Acquisition of intangibles 21 - (303) - (280)
Net cash flows from/(used in) investing activities
709 (1,351) 263 (2,168)
Cash flows from financing activities Net proceeds from issue of shares - 11,039 - 11,039 Repayment of borrowings (10,000) - - - Repayment of finance lease liabilities (11) (5) (12) (5) Equity dividends paid 26 - - - -
Net cash flows from/(used in) financing activities
(10,011) 11,034 (12) 11,034
Net increase/(decrease) in cash and cash equivalents
10,435 14,105 17,759 11,115
Net foreign exchange differences (520) (769) - - Cash and cash equivalents at beginning of period 10,484 (2,852) 461 (10,654)
Cash and cash equivalents at end of period 13(a) 20,399 10,484 18,220 461
The above Cash flow Statement should be read in conjunction with the accompanying notes.
For
per
sona
l use
onl
y
Cellnet Group Limited and its controlled entities Financial Report
28
Notes to the Financial Statements For the year ended 30 June 2009
1. Reporting entity Cellnet Group Limited (the ‘Company’) is a company domiciled in Australia. The consolidated financial
report of the Company for the financial year ended 30 June 2008 comprises the Company and its
subsidiaries (together referred to as the ‘consolidated entity’). The financial statements of the
subsidiaries are prepared for the same reporting period as the parent company.
The financial report was authorised for issue by the Directors on 27th August 2009.
2. Significant accounting policies
(a) Statement of compliance The financial report is a general purpose financial report which has been prepared in accordance with
Australian Accounting Standards (‘AASBs’) (including Australian Accounting Interpretations) adopted by
the Australian Accounting Standards Board (‘AASB’) and the Corporations Act 2001. The financial
report of the consolidated entity also complies with the International Financial Reporting Standards and
interpretations adopted by the International Accounting Standards Board.
(b) Basis of preparation The financial report is presented in Australian dollars.
For
per
sona
l use
onl
y
Cellnet Group Limited and its controlled entities Financial Report
29
Notes to the Financial Statements (continued) For the year ended 30 June 2009
2. Significant accounting policies (continued)
(b) Basis of preparation (continued)
The financial report is prepared on the historical cost basis.
The Company is of a kind referred to in ASIC Class Order 98/100 dated 10 July 1998 (updated by CO
05/641 effective 28 July 2005 and CO 06/51 effective 31 January 2006) and in accordance with that
Class Order, amounts in the financial report and Directors’ Report have been rounded off to the nearest
thousand dollars, unless otherwise stated.
The preparation of a financial report in conformity with Australian Accounting Standards requires
management to make judgements, estimates and assumptions that affect the application of policies and
reported amounts of assets and liabilities, income and expenses. The estimates and associated
assumptions are based on historical experience and various other factors that are believed to be
reasonable under the circumstances, the results of which form the basis of making the judgements
about carrying values of assets and liabilities that are not readily apparent from other sources. Actual
results may differ from these estimates.
The estimates and underlying assumptions are reviewed on an ongoing basis. Revisions to accounting
estimates are recognised in the period in which the estimate is revised if the revision affects only that
period, or in the period of the revision and future periods if the revision affects both current and future
periods.
Judgements made by management in the application of Australian Accounting Standards that have a
significant effect on the financial report and estimates with a significant risk of material adjustment in the
next year are discussed in 2(v).
The accounting policies have been applied consistently by all entities in the consolidated entity.
(c) Basis of consolidation
(i) Subsidiaries Subsidiaries are entities controlled by the Company. Control exists when the Company has the power,
directly or indirectly, to govern the financial and operating policies of an entity so as to obtain benefits
from its activities. In assessing control, potential voting rights that presently are exercisable or
convertible are taken into account. The financial statements of subsidiaries are included in the
consolidated financial statements from the date that control commences until the date that control
ceases.
Investments in subsidiaries are carried at their cost of acquisition in the Company’s financial
statements.
(ii) Transactions eliminated on consolidation Intra-group balances and any unrealised gains and losses or income and expenses arising from intra-
group transactions, are eliminated in preparing the consolidated financial statements.
For
per
sona
l use
onl
y
Cellnet Group Limited and its controlled entities Financial Report
30
Notes to the Financial Statements (continued) For the year ended 30 June 2009 2. Significant accounting policies (continued)
(d) Foreign currency
(i) Functional and presentation currency
Both the functional and presentation currency of Cellnet Group Limited and its Australian subsidiaries is
Australian dollars ($). The New Zealand subsidiary’s functional currency is New Zealand dollars which
is translated to presentation currency.
(ii) Foreign currency transactions
Transactions in foreign currencies are translated at the foreign exchange rate ruling at the date of the
transaction. Monetary assets and liabilities denominated in foreign currencies at the balance sheet date
are translated to Australian dollars at the foreign exchange rate ruling at that date. Foreign exchange
differences arising on translation are recognised in the income statement. Non-monetary assets and
liabilities that are measured in terms of historical cost in a foreign currency are translated using the
exchange rate at the date of the transaction.
(iii) Financial statements of foreign operations The assets and liabilities of foreign operations are translated to Australian dollars at foreign exchange
rates ruling at the balance sheet date. The revenues and expenses of foreign operations are translated
to Australian dollars at rates approximating the foreign exchange rates ruling at the dates of the
transactions. Foreign exchange differences arising on retranslation are recognised directly in a
separate component of equity.
(e) Interest in a jointly controlled operation
The consolidated entity had an interest in a joint venture that is a jointly controlled operation. A joint
venture is a contractual arrangement whereby two or more parties undertake an economic activity that
is subject to joint control. A jointly controlled operation involves use of assets and other resources of the
venturers rather than establishment of a separate entity. The interest in the joint venture is accounted
for in the consolidated financial statements using the equity method of accounting and is carried at cost
by the Company. Under the equity method, the consolidated entity’s share of the results of the joint
venture entity is recognised in the income statement, and the share of movements in reserves is
recognised in the balance sheet.
For
per
sona
l use
onl
y
Cellnet Group Limited and its controlled entities Financial Report
31
Notes to the Financial Statements (continued) For the year ended 30 June 2009
2. Significant accounting policies (continued) (f) Property, plant and equipment
(i) Owned assets
Items of property, plant and equipment are stated at cost or deemed cost less accumulated depreciation (see below) and impairment losses (see accounting policy (m)).
Where parts of an item of property, plant and equipment have different useful lives, they are accounted
for as separate items of property, plant and equipment.
(ii) Leased assets
Leases in terms of which the consolidated entity assumes substantially all the risks and rewards of
ownership are classified as finance leases. Lease payments are accounted for as described in
accounting policy (s).
(iii) Depreciation With the exception of freehold land depreciation is charged to the income statement on a straight-line
basis over the estimated useful lives of each part of an item of property, plant and equipment. Land is
not depreciated. The estimated useful lives in the current and comparative periods are as follows:
• Buildings 40 years
• Leasehold improvements 3⅓ - 40 years
• Plant and equipment 2½ - 10 years
• Leased plant and equipment 4 - 5 years
The residual value, the useful life and the depreciation method applied to an asset are reassessed at
least annually.
(iv) Derecognition
An item of property, plant and equipment is derecognised upon disposal or when no further future
economic benefits are expected from its use or disposal.
(g) Intangible assets
(i) Goodwill
Business combinations
Business combinations prior to 1 July 2004
As part of its transition to AASBs, the consolidated entity elected to restate only those business
combinations that occurred on or after 1 July 2004. In respect of acquisitions prior to 1 July 2004,
goodwill represents that amount recognised under the consolidated entity’s previous accounting
framework, GAAP.
Business combinations since 1 July 2004
All business combinations are accounted for by applying the purchase method. Goodwill represents the
difference between the cost of the acquisition and the fair value of the net identifiable assets acquired.
Goodwill is stated at cost less any accumulated impairment losses.
Negative goodwill arising on an acquisition is recognised directly in profit or loss.
For
per
sona
l use
onl
y
Cellnet Group Limited and its controlled entities Financial Report
32
Notes to the Financial Statements (continued) For the year ended 30 June 2009 2. Significant accounting policies (continued)
(g) Intangible assets (continued)
(ii) Other intangible assets Other intangible assets that are acquired by the consolidated entity are stated at cost less accumulated
amortisation (see below) and impairment losses (see accounting policy (m)).
(iii) Subsequent expenditure Subsequent expenditure on capitalised intangible assets is capitalised only when it increases the future
economic benefits embodied in the specific asset to which it relates. All other expenditure is expensed
as incurred.
(iv) Amortisation Amortisation is charged to the income statement on a straight-line basis over the estimated
useful lives of intangible assets unless such lives are indefinite. Goodwill and intangible assets with an
indefinite useful life are systematically tested for impairment at each balance sheet date. Other
intangible assets are amortised from the date they are available for use over their estimated useful
lives. The estimated useful lives in the current and comparative periods for website and system
development costs is 3 years.
(h)
Trade, loans and other receivables Trade, loans and other receivables are stated at their amortised cost less impairment losses (see
accounting policy (m)).
(i) Inventories Inventories are stated at the lower of cost and net realisable value. Net realisable value is the
estimated selling price in the ordinary course of business, less the estimated costs of completion and
selling expenses. Cost is calculated using the average cost method and includes direct and allocated
costs incurred in acquiring the inventories and bringing them to their present location and condition.
Provision is made for slow moving and obsolete stock.
(j) Cash and cash equivalents Cash and cash equivalents comprise cash balances, short term bills and call deposits with an original
maturity of three months’. Bank overdrafts that are repayable on demand and form an integral part of
the consolidated entity’s cash management are included as a component of cash and cash equivalents
for the purpose of the statement of cash flows.
(k) Impairment The carrying amounts of the consolidated entity’s assets, other than inventories (see accounting policy (k))
and deferred tax assets (see accounting policy (t)), are reviewed at each balance sheet date to
determine whether there is any indication of impairment. If any such indication exists, the asset’s
recoverable amount is estimated (see accounting policy (m)(i)).
For goodwill, assets that have an indefinite useful life and intangible assets that are not yet available for
use, the recoverable amount is estimated at each balance sheet date.
For
per
sona
l use
onl
y
Cellnet Group Limited and its controlled entities Financial Report
33
Notes to the Financial Statements (continued) For the year ended 30 June 2009 2. Significant accounting policies (continued)
(k) Impairment (continued) An impairment loss is recognised whenever the carrying amount of an asset or its cash-generating unit
exceeds its recoverable amount. Impairment losses are recognised in the income statement, unless an
asset has previously been revalued, in which case the impairment loss is recognised as a reversal to
the extent of that previous revaluation with any excess recognised through the income statement.
Impairment losses recognised in respect of cash-generating units are allocated first to reduce the
carrying amount of any goodwill allocated to cash-generating units (group of units) and then, to reduce
the carrying amount of the other assets in the unit (group of units) on a pro-rata basis.
(i) Calculation of recoverable amount Impairment of receivables is not recognised until objective evidence is available that a loss event has
occurred. Receivables are individually assessed for impairment.
The recoverable amount of other assets is the greater of their fair value less costs to sell and value in
use. In assessing value in use, the estimated future cash flows are discounted to their present value
using a pre-tax discount rate that reflects current market assessments of the time value of money and
the risks specific to the asset. For an asset that does not generate largely independent cash inflows,
the recoverable amount is determined for the cash-generating unit to which the asset belongs.
(ii) Reversals of impairment Impairment losses, other than in respect of goodwill, are reversed when there is an indication that the
impairment loss may no longer exist and there has been a change in the estimate used to determine
the recoverable amount. An impairment loss in respect of goodwill is not reversed.
An impairment loss is reversed only to the extent that the asset’s carrying amount does not
exceed the carrying amount that would have been determined, net of depreciation or amortisation, if no
impairment loss had been recognised.
(iii) Derecognition of financial assets and liabilities
A financial asset (or, where applicable, a part of a financial asset or part of a group of similar financial
assets) is derecognised when:
• the rights to receive cash flows from the asset have expired;
• the consolidated entity retains the right to receive cash flows from the asset, but has assumed an
obligation to pay them in full without material delay to a third party; or
• the consolidated entity has transferred its rights to receive cash flows from the asset and either (a)
has transferred substantially all the risks and rewards of the asset, or (b) has neither transferred nor
retained substantially all the risks and rewards of the asset, but has transferred control of the asset.
A financial liability is derecognised when the obligation under the liability is discharged, cancelled or
expired. When an existing financial liability is replaced by another from the same lender on
substantially different terms, or the terms of an existing liability are substantially modified, such an
exchange or modification is treated as a derecognition of the original liability and the recognition of a
new liability. The difference in the respective carrying amounts is recognised in profit and loss. For
per
sona
l use
onl
y
Cellnet Group Limited and its controlled entities Financial Report
34
Notes to the Financial Statements (continued) For the year ended 30 June 2009 2. Significant accounting policies (continued)
(l) Share capital Dividends are recognised as a liability in the period in which they are declared.
Transaction costs of an equity transaction are accounted for as a deduction from equity, net of any
related income tax benefit.
(m)
Interest-bearing borrowings Interest-bearing borrowings are recognised initially at fair value less attributable transaction costs.
Subsequent to initial recognition, interest-bearing borrowings are stated at amortised cost with any
difference between cost and redemption value being recognised in the income statement over the
period of the borrowings on an effective interest basis.
(n) Provisions and employee benefits
Provisions are recognised when the consolidated entity has a present obligation (legal or constructive)
as a result of a past event, it is probable that an outflow of resources embodying economic benefits will
be required to settle the obligation and a reliable estimate can be made of the amount of the obligation.
When the consolidated entity expects some or all of a provision to be reimbursed, for example under an
insurance contract, the reimbursement is recognised as a separate asset but only when the
reimbursement is virtually certain. The expense relating to any provision is presented in the income
statement net of any reimbursement.
Provisions are measured at the present value of management’s best estimate of the expenditure
required to settle the present obligation at the balance sheet date using a discounted cash flow
methodology. The risks specific to the provision are factored into the cash flows and as such a risk-free
government bond rate relative to the expected life of the provision is used as a discount rate. If the
effect of the time value of money is material, provisions are discounted using a current pre-tax rate that
reflects the time value of money and the risks specific to the liability. The increase in the provision
resulting from the passage of time is recognised in finance costs.
Employee leave benefits
(i) Defined contribution superannuation funds Obligations for contributions to defined contribution superannuation funds are recognised as an
expense in the income statement as incurred.
(ii) Long-term service benefits
The consolidated entity’s net obligation in respect of long-term service benefits is the amount of future
benefit that employees have earned in return for their service in the current and prior periods. The
obligation is calculated using expected future increases in wage and salary rates including related on-
costs and expected settlement dates, and is discounted using the rates attached to the Commonwealth
Government bonds at the balance sheet date which have maturity dates approximating the terms of the
consolidated entity’s obligations.
(iii) Wages, salaries, annual leave
Liabilities for employee benefits for wages, salaries and annual leave that are expected to be settled
within 12 months of the reporting date represent present obligations resulting from employees’ services
provided to reporting date, and are calculated using undiscounted amounts based on remuneration
wage and salary rates that the consolidated entity expects to pay as at reporting date including related
on-costs, such as workers remuneration insurance and payroll tax.
For
per
sona
l use
onl
y
Cellnet Group Limited and its controlled entities Financial Report
35
Notes to the Financial Statements (continued) For the year ended 30 June 2009 2. Significant accounting policies (continued)
(n) Provisions and employee benefits (continued)
(iv) Share-based payment transactions The performance rights programme allows consolidated entity employees to acquire shares of the
Company. The fair value of rights granted is recognised as an employee expense with a corresponding
increase in equity. The fair value is measured at grant date and spread over the period during which
the employees become unconditionally entitled to rights over shares. The fair value of the rights
granted is measured using a Monte Carlo simulation model utilising a Black-Scholes option-pricing
model, taking into account the terms and conditions upon which the rights were granted. The amount
recognised as an expense is adjusted to reflect the actual number of rights that vest except where
forfeiture is only due to share prices not achieving the threshold for vesting. Performance rights
provided to employee are cash settled.
(o) Trade and other payables Trade and other payables are stated at their amortised cost. Trade payables are non-interest bearing
and are normally settled on average 45-day terms.
(p) Revenue
Goods sold and services rendered Revenue from the sale of goods is recognised in the income statement when the significant risks and
rewards of ownership have been transferred to the customer. This transfer generally occurs when the
goods are delivered to the customer.
Revenue from the provision of warehousing services to external parties is recognised as the service is
provided. Management fee income is recognised as it accrues.
No revenue is recognised if there are significant uncertainties regarding recovery of the consideration
due, the costs incurred or to be incurred cannot be measured reliably, there is a risk of return of goods
or there is continuing management involvement with the goods.
(q) Expenses
(i) Operating lease payments
Payments made under operating leases are recognised in the income statement on a straight-line basis
over the term of the lease. Lease incentives received are recognised in the income statement as an
integral part of the total lease expense and spread over the lease term.
(ii) Finance lease payments
Minimum lease payments are apportioned between the finance charge and the reduction of the
outstanding liability. The finance charge is allocated to each period during the lease term so as to
produce a constant periodic rate of interest on the remaining balance of the liability.
For
per
sona
l use
onl
y
Cellnet Group Limited and its controlled entities Financial Report
36
Notes to the Financial Statements (continued) For the year ended 30 June 2009 2. Significant accounting policies (continued)
(q) Expenses (continued)
(iii) Net financing costs Net financing costs comprise interest payable on borrowings calculated using the effective interest
method, interest receivable on funds invested, dividend income, discounts received, foreign exchange
gains and losses, and gains and losses on hedging instruments that are recognised in the income
statement (see accounting policy (e)). Borrowing costs are expensed as incurred and included in net
financing costs.
Interest income is recognised in the income statement as it accrues, using the effective interest method.
Dividend income is recognised in the income statement on the date the entity’s right to receive
payments is established. The interest expense component of finance lease payments is recognised in
the income statement using the effective interest method.
(r) Income tax Income tax on the profit or loss for the year comprises current and deferred tax. Income tax is
recognised in the income statement except to the extent that it relates to items recognised directly in
equity, in which case it is recognised in equity.
Current tax is the expected tax payable on the taxable income for the year, using tax rates enacted or
substantively enacted at the balance sheet date, and any adjustment to tax payable in respect of
previous years.
Deferred tax is provided using the balance sheet liability method, providing for temporary differences
between the carrying amounts of assets and liabilities for financial reporting purposes and the amounts
used for taxation purposes. The following temporary differences are not provided for: initial recognition
of goodwill, the initial recognition of assets or liabilities that affect neither accounting nor taxable profit,
and differences relating to investments in subsidiaries to the extent that they will probably not reverse in
the foreseeable future. The amount of deferred tax provided is based on the expected manner of
realisation or settlement of the carrying amount of assets and liabilities, using tax rates enacted or
substantively enacted at the balance sheet date.
A deferred tax asset is recognised only to the extent that it is probable that future taxable profits will be
available against which the asset can be utilised. Deferred tax assets are reduced to the extent that it is
no longer probable that the related tax benefit will be realised.
Deferred tax assets and deferred tax liabilities are offset only if a legally enforceable rights exists to set
off current tax assets against current tax liabilities and the deferred tax assets and liabilities relate to the
same taxable entity and the same taxation authority.
Additional income taxes that arise from the distribution of dividends are recognised at the same time as
the liability to pay the related dividend.
Capital gains tax, if applicable, is provided for in establishing period income tax expense when an asset
is sold.
Tax consolidation The Company and its wholly-owned Australian resident entities have formed a tax-consolidated group
with effect from 1 July 2003 and are therefore taxed as a single entity from that date. The head entity
within the tax-consolidated group is Cellnet Group Limited.
For
per
sona
l use
onl
y
Cellnet Group Limited and its controlled entities Financial Report
37
Notes to the Financial Statements (continued) For the year ended 30 June 2009 2. Significant accounting policies (continued)
(r) Income tax (continued) Current tax expense/income, deferred tax liabilities and deferred tax assets arising from temporary
differences of the members of the tax-consolidated group are recognised in the separate financial
statements of the members of the tax-consolidated group using the ‘group allocation’ approach.
Deferred tax assets and deferred tax liabilities are measured by reference to the carrying amounts in
the separate financial statements of each entity and the tax values applying under tax consolidation.
Any current tax liabilities (or assets) and deferred tax assets arising from unused tax losses or unused
tax credits of the subsidiaries are assumed by the head entity in the tax consolidated group and are
recognised as amounts payable (receivable) to (from) other entities in the tax-consolidated group in
conjunction with any tax funding arrangement amounts (refer below). Any difference between these
amounts is recognised by the Company as an equity contribution or distribution.
The Company recognises deferred tax assets arising from unused tax losses and unused tax credits of
the tax-consolidated group to the extent that it is probable that future taxable profits of the tax-
consolidated group will be available against which the asset can be utilised.
Any subsequent period adjustments to deferred tax assets arising from unused tax losses and unused
tax credits as a result of revised assessments of the probability of recoverability are recognised by the
head entity only.
Nature of tax funding arrangements The head entity, in conjunction with other members of the tax-consolidated group, has entered into a
tax funding arrangement which sets out the funding obligations of members of the tax-consolidated
group in respect of tax amounts. The tax funding arrangements require payments to/from the head
entity equal to the current tax liability (asset) assumed by the head entity and any tax-loss or tax credit
deferred tax asset assumed by the head entity, resulting in the head entity recognising an inter-entity
payable (receivable) equal in amount to the tax liability (asset) assumed. The inter-entity payable
(receivable) is at call.
Contributions to fund the current tax liabilities are payable as per the tax funding arrangement and
reflect the timing of the head entity’s obligation to make payments for tax liabilities to the relevant tax
authorities.
(s) Goods and services tax Revenue, expenses and assets are recognised net of the amount of goods and services tax (GST),
except where the amount of GST incurred is not recoverable from the taxation authority. In these
circumstances, the GST is recognised as part of the cost of acquisition of the asset or as part of the
expense.
Receivables and payables are stated with the amount of GST included. The net amount of GST
recoverable from, or payable to, the ATO is included as a current asset or liability in the balance sheet.
Cash flows are included in the statement of cash flows on a gross basis. The GST components of cash
flows arising from investing and financing activities which are recoverable from, or payable to, the ATO
are classified as operating cash flows.
For
per
sona
l use
onl
y
Cellnet Group Limited and its controlled entities Financial Report
38
Notes to the Financial Statements (continued) For the year ended 30 June 2009 2. Significant accounting policies (continued)
(t) Accounting estimates and judgements Management discussed with the Audit and Risk Management Committee the development, selection
and disclosure of the consolidated entity’s critical accounting policies and estimates and the application
of these policies and estimates. The estimates and judgements that have a significant risk of causing a
material adjustment to the carrying amounts of assets and liabilities within the next financial year are
discussed below.
Key sources of estimation uncertainty Note 22 contains information about the assumptions and the risk factors relating to goodwill impairment.
Impairment of goodwill
The consolidated entity assesses whether goodwill is impaired at least annually as disclosed in the
accounting policy in Note 20. These calculations involve an estimation of the recoverable amount of the
cash-generating units to which the goodwill is allocated.
Impairment losses for trade receivables and stock on hand
Note 14(a) contains information about the assumptions and their risk factors relating to trade receivable
impairment losses and Note 15 contains information about the stock on hand impairments losses and
changes in the way the estimate was calculated.
(u) Discontinued operations
A discontinued operation is a component of the consolidated entity’s business that represents a
separate major line of business or geographical area of operations that has been disposed of or is held
for sale, or is a subsidiary acquired exclusively with a view to resale. Classification as a discontinued
operation occurs upon disposal or when the operation meets the criteria to be classified as held for
sale, if earlier. When an operation is classified as a discontinued operation, the comparative income
statement is restated as if the operation had been discontinued from the start of the comparative period.
(v) Earnings per share
The consolidated entity presents basic and diluted earnings per share (EPS) data for its ordinary
shares. Basic EPS is calculated by dividing the profit or loss attributable to ordinary shareholders of the
Company by the weighted average number of ordinary shares outstanding during the period. Diluted
EPS is determined by adjusting the profit or loss attributable to ordinary shareholders and the weighted
average number of ordinary shares outstanding for the effects of all dilutive potential ordinary shares.
Potential ordinary shares shall be treated as dilutive when their conversion to ordinary shares would
decrease earnings per share or increase loss per share from continuing operations.
For
per
sona
l use
onl
y
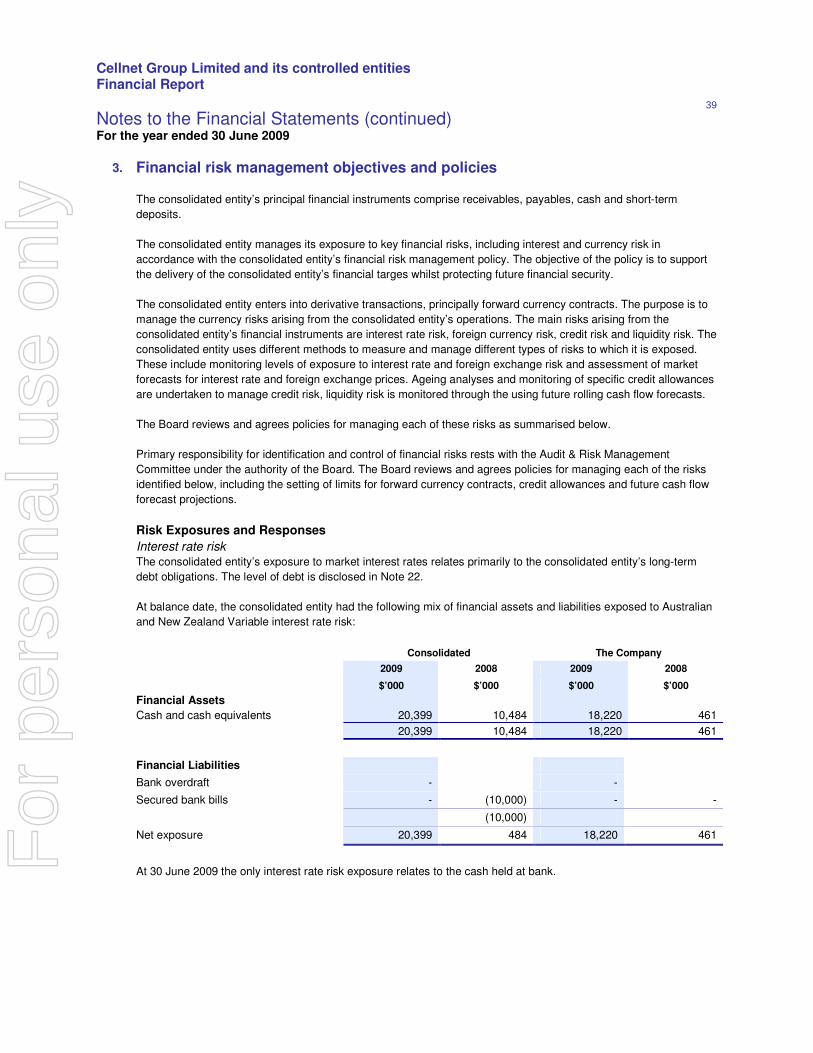
Cellnet Group Limited and its controlled entities Financial Report
39
Notes to the Financial Statements (continued) For the year ended 30 June 2009
3. Financial risk management objectives and policies
The consolidated entity’s principal financial instruments comprise receivables, payables, cash and short-term
deposits.
The consolidated entity manages its exposure to key financial risks, including interest and currency risk in
accordance with the consolidated entity’s financial risk management policy. The objective of the policy is to support
the delivery of the consolidated entity’s financial targes whilst protecting future financial security.
The consolidated entity enters into derivative transactions, principally forward currency contracts. The purpose is to
manage the currency risks arising from the consolidated entity’s operations. The main risks arising from the
consolidated entity’s financial instruments are interest rate risk, foreign currency risk, credit risk and liquidity risk. The
consolidated entity uses different methods to measure and manage different types of risks to which it is exposed.
These include monitoring levels of exposure to interest rate and foreign exchange risk and assessment of market
forecasts for interest rate and foreign exchange prices. Ageing analyses and monitoring of specific credit allowances
are undertaken to manage credit risk, liquidity risk is monitored through the using future rolling cash flow forecasts.
The Board reviews and agrees policies for managing each of these risks as summarised below.
Primary responsibility for identification and control of financial risks rests with the Audit & Risk Management
Committee under the authority of the Board. The Board reviews and agrees policies for managing each of the risks
identified below, including the setting of limits for forward currency contracts, credit allowances and future cash flow
forecast projections.
Risk Exposures and Responses
Interest rate risk The consolidated entity’s exposure to market interest rates relates primarily to the consolidated entity’s long-term
debt obligations. The level of debt is disclosed in Note 22.
At balance date, the consolidated entity had the following mix of financial assets and liabilities exposed to Australian
and New Zealand Variable interest rate risk:
Consolidated The Company
2009 2008 2009 2008
$’000 $’000 $’000 $’000
Financial Assets
Cash and cash equivalents 20,399 10,484 18,220 461
20,399 10,484 18,220 461
Financial Liabilities
Bank overdraft - -
Secured bank bills - (10,000) - -
(10,000)
Net exposure 20,399 484 18,220 461
At 30 June 2009 the only interest rate risk exposure relates to the cash held at bank.
For
per
sona
l use
onl
y
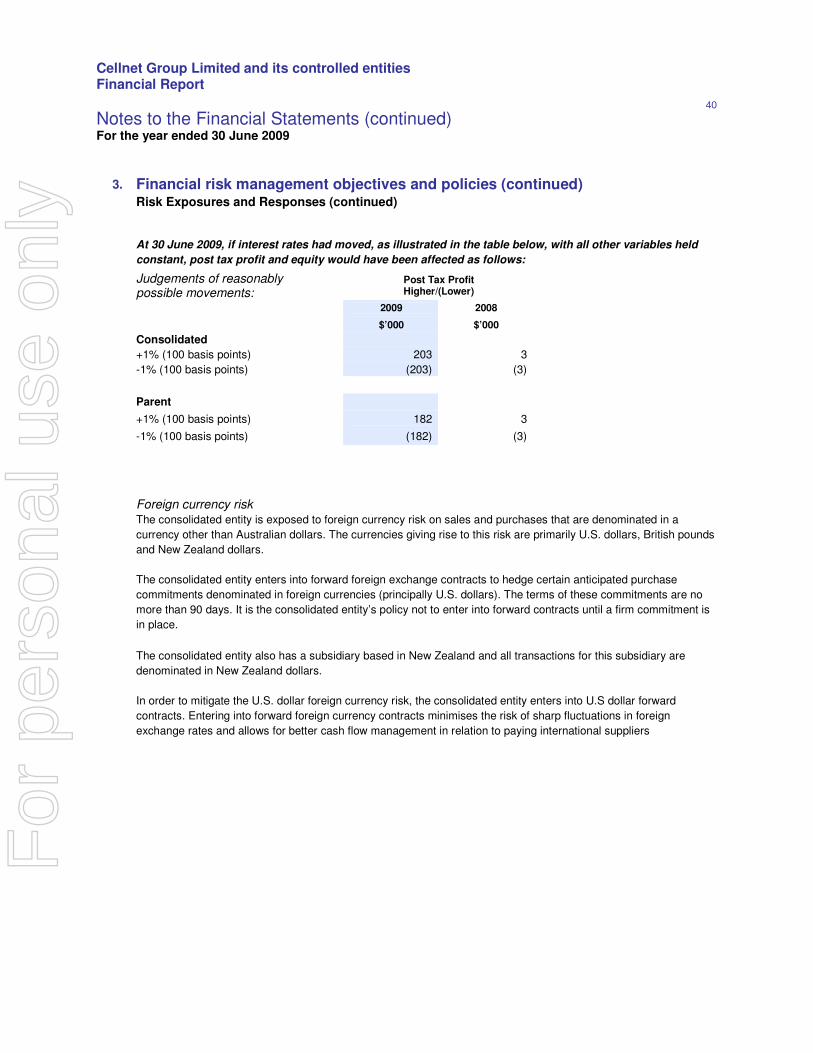
Cellnet Group Limited and its controlled entities Financial Report
40
Notes to the Financial Statements (continued) For the year ended 30 June 2009
3. Financial risk management objectives and policies (continued) Risk Exposures and Responses (continued)
At 30 June 2009, if interest rates had moved, as illustrated in the table below, with all other variables held
constant, post tax profit and equity would have been affected as follows:
Judgements of reasonably possible movements:
Post Tax Profit Higher/(Lower)
2009 2008
$’000 $’000
Consolidated
+1% (100 basis points) 203 3
-1% (100 basis points) (203) (3)
Parent
+1% (100 basis points) 182 3
-1% (100 basis points) (182) (3)
Foreign currency risk The consolidated entity is exposed to foreign currency risk on sales and purchases that are denominated in a
currency other than Australian dollars. The currencies giving rise to this risk are primarily U.S. dollars, British pounds
and New Zealand dollars.
The consolidated entity enters into forward foreign exchange contracts to hedge certain anticipated purchase
commitments denominated in foreign currencies (principally U.S. dollars). The terms of these commitments are no
more than 90 days. It is the consolidated entity’s policy not to enter into forward contracts until a firm commitment is
in place.
The consolidated entity also has a subsidiary based in New Zealand and all transactions for this subsidiary are
denominated in New Zealand dollars.
In order to mitigate the U.S. dollar foreign currency risk, the consolidated entity enters into U.S dollar forward
contracts. Entering into forward foreign currency contracts minimises the risk of sharp fluctuations in foreign
exchange rates and allows for better cash flow management in relation to paying international suppliers
For
per
sona
l use
onl
y
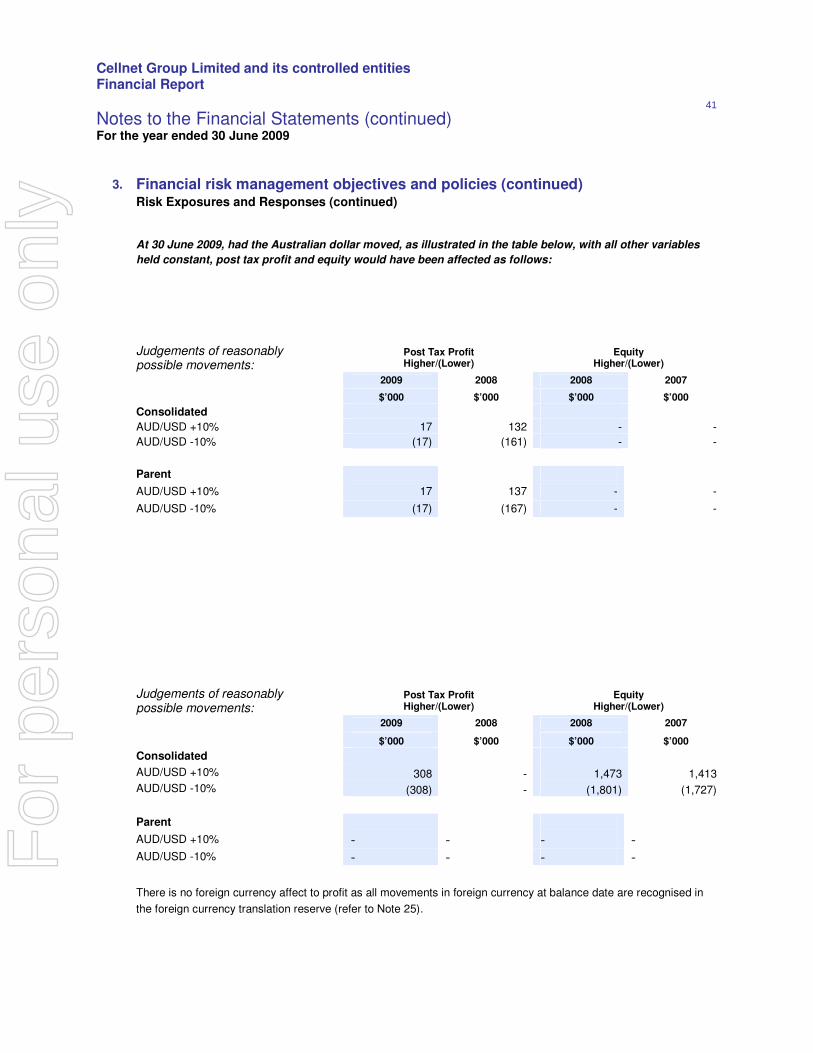
Cellnet Group Limited and its controlled entities Financial Report
41
Notes to the Financial Statements (continued) For the year ended 30 June 2009
3. Financial risk management objectives and policies (continued) Risk Exposures and Responses (continued)
At 30 June 2009, had the Australian dollar moved, as illustrated in the table below, with all other variables
held constant, post tax profit and equity would have been affected as follows:
Judgements of reasonably
possible movements: Post Tax Profit
Higher/(Lower) Equity
Higher/(Lower)
2009 2008 2008 2007
$’000 $’000 $’000 $’000
Consolidated
AUD/USD +10% 17 132 - -
AUD/USD -10% (17) (161) - -
Parent
AUD/USD +10% 17 137 - -
AUD/USD -10% (17) (167) - -
Judgements of reasonably possible movements:
Post Tax Profit Higher/(Lower)
Equity Higher/(Lower)
2009 2008 2008 2007
$’000 $’000 $’000 $’000
Consolidated AUD/USD +10% 308 - 1,473 1,413
AUD/USD -10% (308) - (1,801) (1,727)
Parent
AUD/USD +10% - - - -
AUD/USD -10% - - - -
There is no foreign currency affect to profit as all movements in foreign currency at balance date are recognised in
the foreign currency translation reserve (refer to Note 25).
For
per
sona
l use
onl
y

Cellnet Group Limited and its controlled entities Financial Report
42
Notes to the Financial Statements (continued) For the year ended 30 June 2009
Credit risk
Credit risk represents the loss that would be recognised if counterparties failed to perform as contracted.
The credit risk on financial assets of the consolidated entity is the carrying amount, net of any impairment losses.
The consolidated entity mitigates this risk by adopting procedures whereby they only deal with creditworthy
customers. Where there is evidence of credit risk, an impairment loss is recognised. The consolidated entity also
insures all debtors through trade finance insurance. The insurance excess payable by the consolidated entity for a
claim on the insurance is 15% of the insured value or $25,000, whichever is the greater.
Liquidity risk
The consolidated entity’s objective is to maintain a balance between continuity of funding and flexibility through the
use of bank overdrafts, bank loans and committed available credit lines.
The table on the next page reflects all contractually fixed receivables for settlement and repayments resulting from
recognised financial assets and liabilities as at 30 June 2009. Cash flows for financial assets and liabilities without
fixed amount or timing are based on the conditions existing at 30 June 2009.
3. Financial risk management objectives and policies (continued) Risk Exposures and Responses (continued)
For
per
sona
l use
onl
y
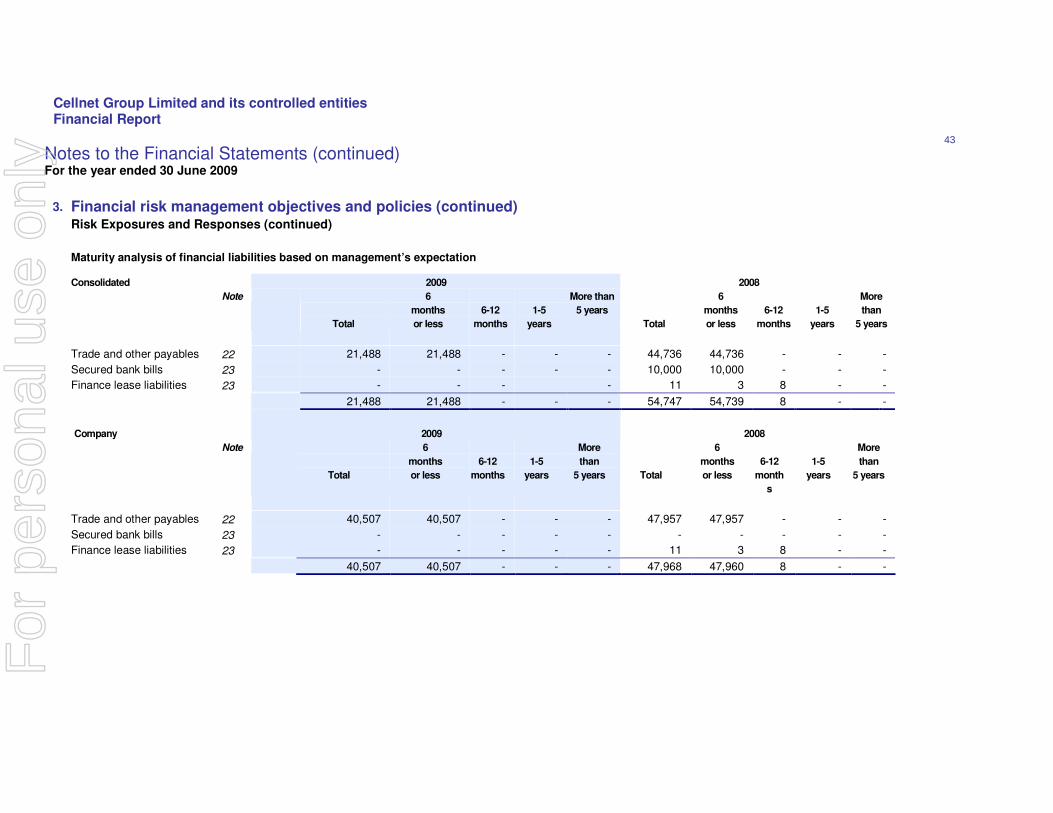
Cellnet Group Limited and its controlled entities Financial Report
43
Notes to the Financial Statements (continued) For the year ended 30 June 2009
3. Financial risk management objectives and policies (continued)
Risk Exposures and Responses (continued)
Maturity analysis of financial liabilities based on management’s expectation
Consolidated 2009 2008
Note
Total
6
months
or less
6-12
months
1-5
years
More than
5 years
Total
6
months
or less
6-12
months
1-5
years
More
than
5 years
Trade and other payables 22 21,488 21,488 - - - 44,736 44,736 - - -
Secured bank bills 23 - - - - - 10,000 10,000 - - -
Finance lease liabilities 23 - - - - 11 3 8 - - 21,488 21,488 - - - 54,747 54,739 8 - -
Company 2009 2008
Note
Total
6
months
or less
6-12
months
1-5
years
More
than
5 years
Total
6
months
or less
6-12
month
s
1-5
years
More
than
5 years
Trade and other payables 22 40,507 40,507 - - - 47,957 47,957 - - -
Secured bank bills 23 - - - - - - - - - -
Finance lease liabilities 23 - - - - - 11 3 8 - - 40,507 40,507 - - - 47,968 47,960 8 - -
For
per
sona
l use
onl
y

Cellnet Group Limited and its controlled entities Financial Report
44
Notes to the Financial Statements (continued) For the year ended 30 June 2009
4. Segment information
The consolidated entity’s primary segment reporting format is business segments as the consolidated
entity’s risks and returns are affected predominantly be differences in the products and services
produced.
The operating businesses are organised and managed separately according to the nature of the
products and services provided, with each segment representing a strategic business unit that offers
different products and serves different markets.
The IT segment is a distributor of IT products resellers. It offers products and services in the areas of IT
and IT accessories.
The Retail segment is a distributor of telecommunications and audio visual equipment and accessories
to retail stores and end customers.
Transfer prices between business segments are set on an arm’s length basis in a manner similar to
transactions with third parties. Segment revenue, segment expense and segment result include
transfers between business segments. Those transfers are eliminated on consolidation.
Business Segments The following tables present revenue and profit information and certain asset and liability information
regarding business segments for the years ended 30 June 2009 and 30 June 2008.
For
per
sona
l use
onl
y
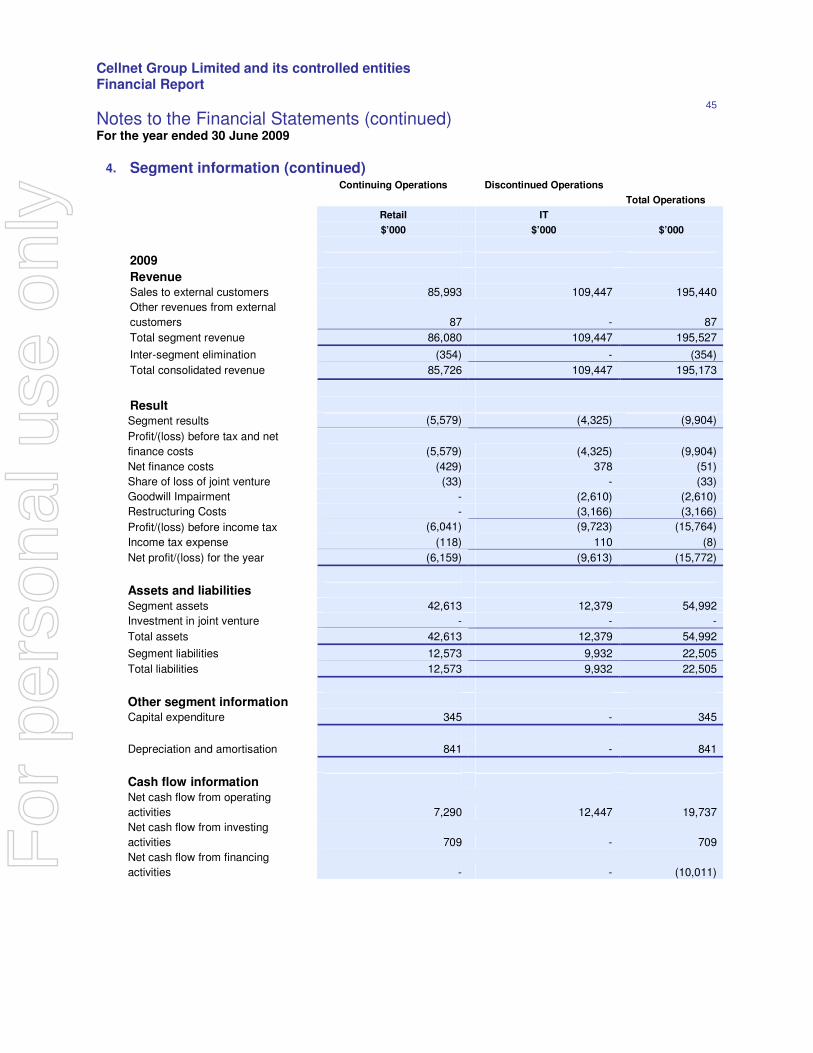
Cellnet Group Limited and its controlled entities Financial Report
45
Notes to the Financial Statements (continued) For the year ended 30 June 2009
4. Segment information (continued) Continuing Operations Discontinued Operations
Total Operations
Retail IT
$’000 $’000 $’000
2009
Revenue
Sales to external customers 85,993 109,447 195,440
Other revenues from external
customers 87 - 87
Total segment revenue 86,080 109,447 195,527
Inter-segment elimination (354) - (354)
Total consolidated revenue 85,726 109,447 195,173
Result
Segment results (5,579) (4,325) (9,904)
Profit/(loss) before tax and net
finance costs (5,579) (4,325) (9,904)
Net finance costs (429) 378 (51)
Share of loss of joint venture (33) - (33)
Goodwill Impairment - (2,610) (2,610)
Restructuring Costs - (3,166) (3,166)
Profit/(loss) before income tax (6,041) (9,723) (15,764)
Income tax expense (118) 110 (8)
Net profit/(loss) for the year (6,159) (9,613) (15,772)
Assets and liabilities
Segment assets 42,613 12,379 54,992
Investment in joint venture - - -
Total assets 42,613 12,379 54,992
Segment liabilities 12,573 9,932 22,505
Total liabilities 12,573 9,932 22,505
Other segment information
Capital expenditure 345 - 345
Depreciation and amortisation 841 - 841
Cash flow information
Net cash flow from operating
activities 7,290 12,447 19,737
Net cash flow from investing
activities 709 - 709
Net cash flow from financing
activities - - (10,011)
For
per
sona
l use
onl
y
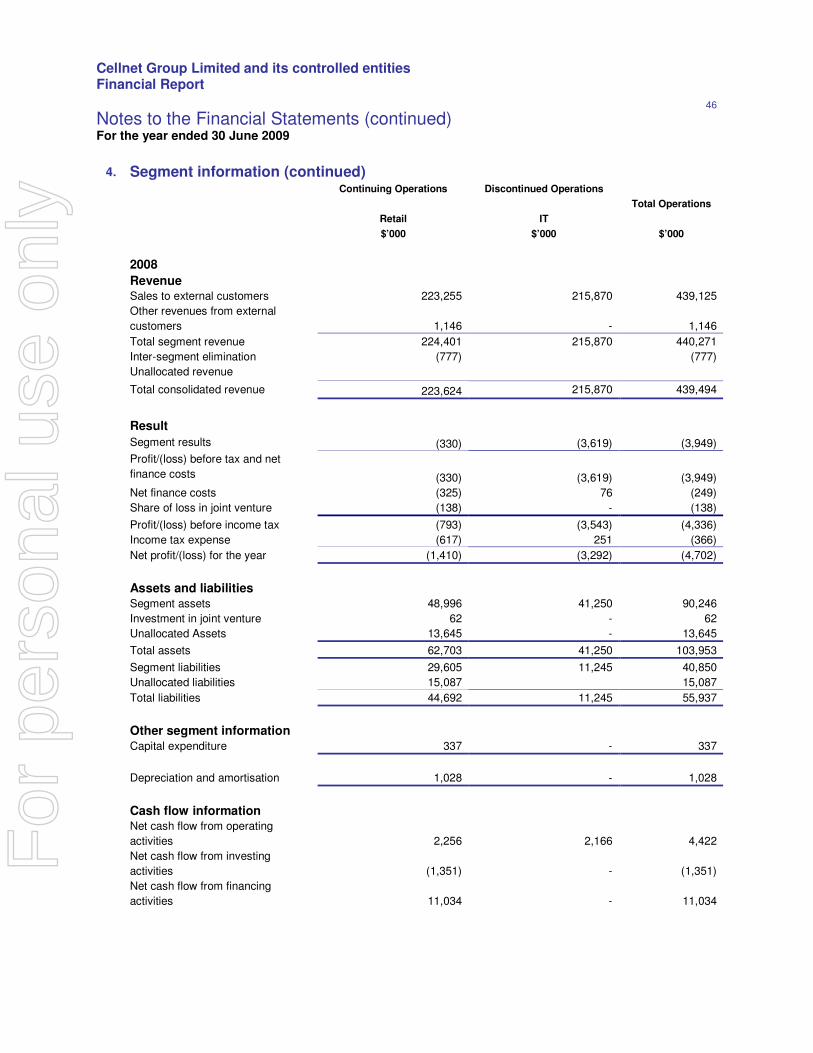
Cellnet Group Limited and its controlled entities Financial Report
46
Notes to the Financial Statements (continued) For the year ended 30 June 2009
4. Segment information (continued)
Continuing Operations Discontinued Operations
Total Operations
Retail IT
$’000 $’000 $’000
2008
Revenue
Sales to external customers 223,255 215,870 439,125
Other revenues from external
customers 1,146 - 1,146
Total segment revenue 224,401 215,870 440,271
Inter-segment elimination (777) (777)
Unallocated revenue
Total consolidated revenue 223,624 215,870 439,494
Result
Segment results (330) (3,619) (3,949)
Profit/(loss) before tax and net
finance costs (330) (3,619) (3,949)
Net finance costs (325) 76 (249)
Share of loss in joint venture (138) - (138)
Profit/(loss) before income tax (793) (3,543) (4,336)
Income tax expense (617) 251 (366)
Net profit/(loss) for the year (1,410) (3,292) (4,702)
Assets and liabilities
Segment assets 48,996 41,250 90,246
Investment in joint venture 62 - 62
Unallocated Assets 13,645 - 13,645
Total assets 62,703 41,250 103,953
Segment liabilities 29,605 11,245 40,850
Unallocated liabilities 15,087 15,087
Total liabilities 44,692 11,245 55,937
Other segment information
Capital expenditure 337 - 337
Depreciation and amortisation 1,028 - 1,028
Cash flow information
Net cash flow from operating
activities 2,256 2,166 4,422
Net cash flow from investing
activities (1,351) - (1,351)
Net cash flow from financing
activities 11,034 - 11,034
For
per
sona
l use
onl
y
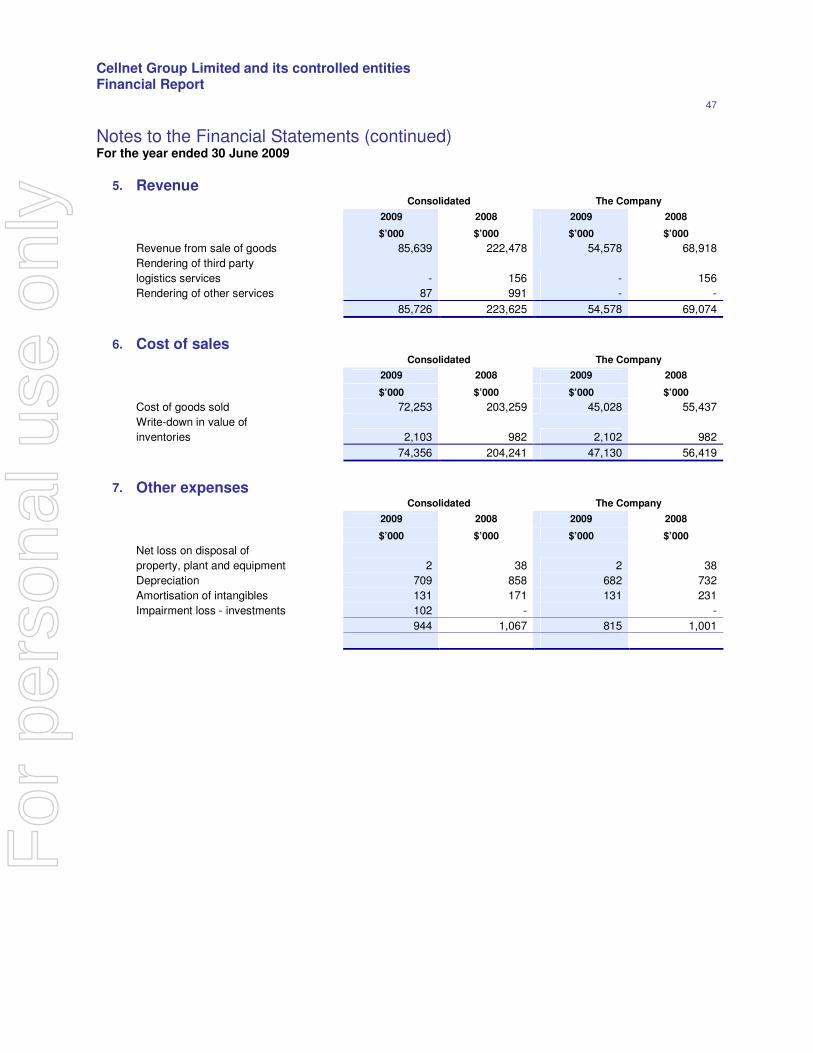
Cellnet Group Limited and its controlled entities Financial Report
47
Notes to the Financial Statements (continued) For the year ended 30 June 2009
5. Revenue Consolidated The Company
2009 2008 2009 2008
$’000 $’000 $’000 $’000
Revenue from sale of goods 85,639 222,478 54,578 68,918
Rendering of third party
logistics services - 156 - 156
Rendering of other services 87 991 - -
85,726 223,625 54,578 69,074
6. Cost of sales
Consolidated The Company
2009 2008 2009 2008
$’000 $’000 $’000 $’000
Cost of goods sold 72,253 203,259 45,028 55,437
Write-down in value of
inventories 2,103 982 2,102 982
74,356 204,241 47,130 56,419
7. Other expenses
Consolidated The Company
2009 2008 2009 2008
$’000 $’000 $’000 $’000
Net loss on disposal of
property, plant and equipment 2 38 2 38
Depreciation 709 858 682 732
Amortisation of intangibles 131 171 131 231
Impairment loss - investments 102 - -
944 1,067 815 1,001
For
per
sona
l use
onl
y
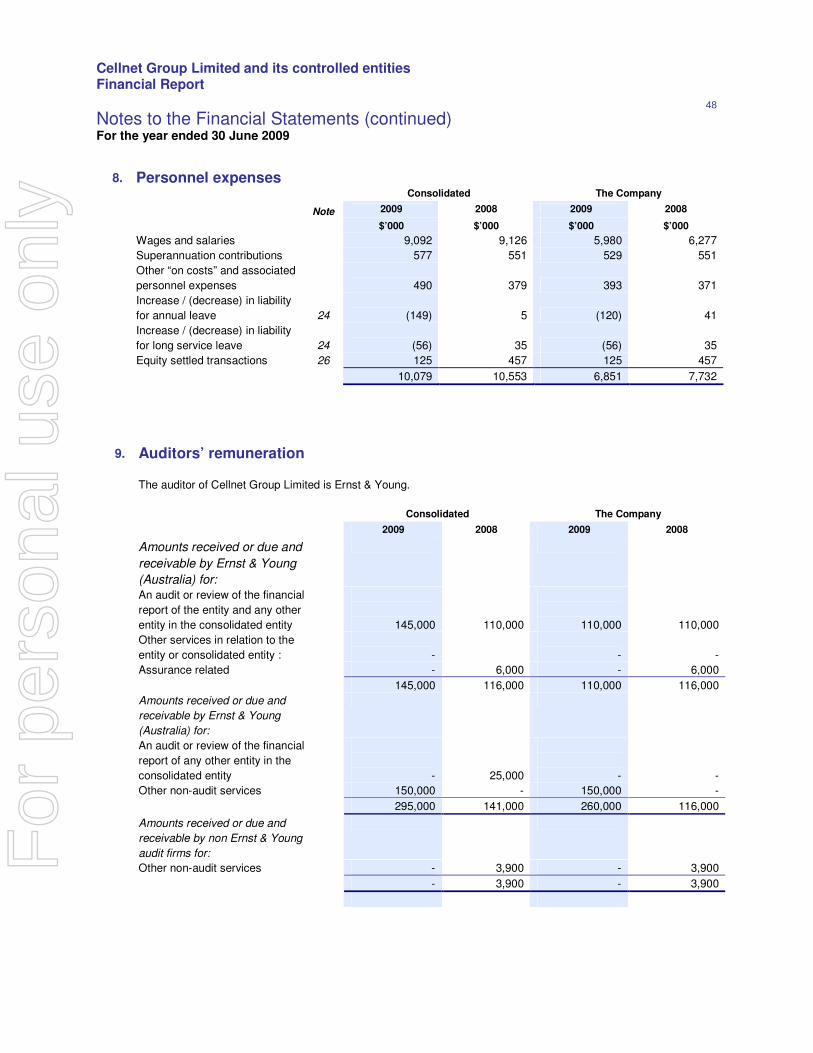
Cellnet Group Limited and its controlled entities Financial Report
48
Notes to the Financial Statements (continued) For the year ended 30 June 2009
8. Personnel expenses
Consolidated The Company
Note 2009 2008 2009 2008
$’000 $’000 $’000 $’000
Wages and salaries 9,092 9,126 5,980 6,277
Superannuation contributions 577 551 529 551
Other “on costs” and associated
personnel expenses 490 379 393 371
Increase / (decrease) in liability
for annual leave 24 (149) 5 (120) 41
Increase / (decrease) in liability
for long service leave 24 (56) 35 (56) 35
Equity settled transactions 26 125 457 125 457
10,079 10,553 6,851 7,732
9.
Auditors’ remuneration
The auditor of Cellnet Group Limited is Ernst & Young.
Consolidated The Company
2009 2008 2009 2008
Amounts received or due and
receivable by Ernst & Young
(Australia) for:
An audit or review of the financial
report of the entity and any other
entity in the consolidated entity
145,000
110,000
110,000
110,000
Other services in relation to the
entity or consolidated entity :
-
-
-
Assurance related - 6,000 - 6,000
145,000 116,000 110,000 116,000
Amounts received or due and
receivable by Ernst & Young
(Australia) for:
An audit or review of the financial
report of any other entity in the
consolidated entity
-
25,000
-
-
Other non-audit services 150,000 - 150,000 -
295,000 141,000 260,000 116,000
Amounts received or due and
receivable by non Ernst & Young
audit firms for:
Other non-audit services - 3,900 - 3,900
- 3,900 - 3,900
For
per
sona
l use
onl
y
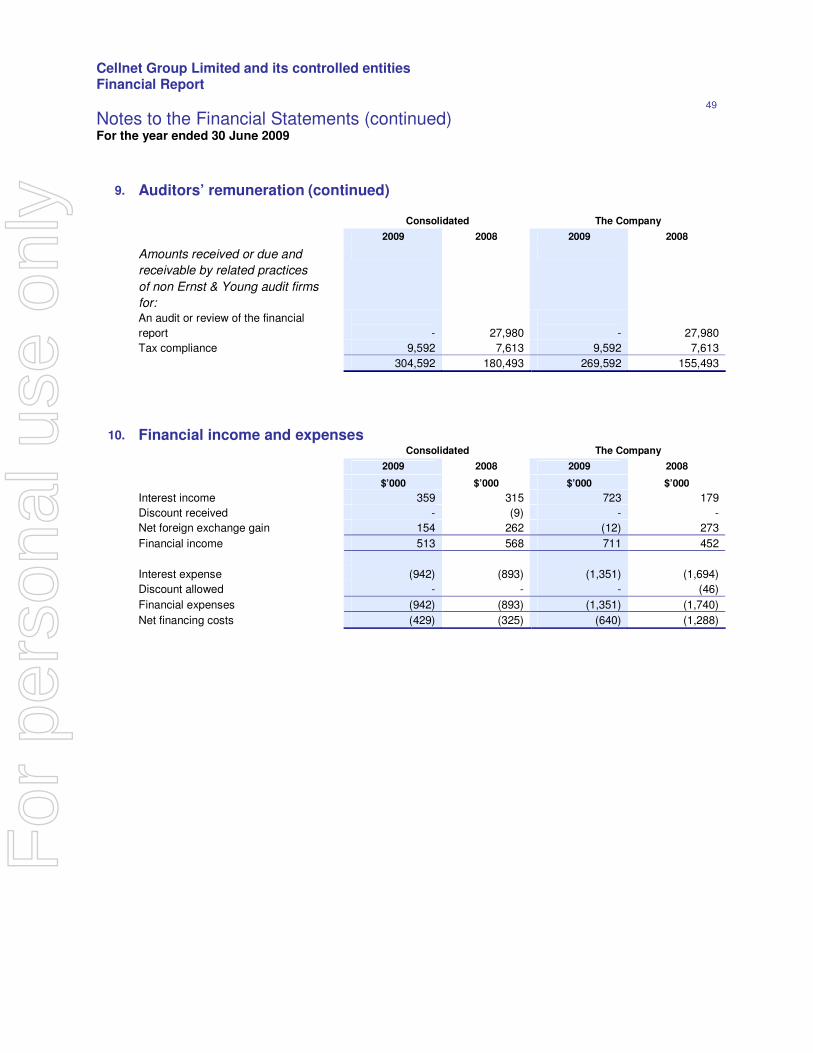
Cellnet Group Limited and its controlled entities Financial Report
49
Notes to the Financial Statements (continued) For the year ended 30 June 2009
9.
Auditors’ remuneration (continued)
Consolidated The Company
2009 2008 2009 2008
Amounts received or due and
receivable by related practices
of non Ernst & Young audit firms
for:
An audit or review of the financial
report
-
27,980
-
27,980
Tax compliance 9,592 7,613 9,592 7,613
304,592 180,493 269,592 155,493
10. Financial income and expenses
Consolidated The Company
2009 2008 2009 2008
$’000 $’000 $’000 $’000
Interest income 359 315 723 179
Discount received - (9) - -
Net foreign exchange gain 154 262 (12) 273
Financial income 513 568 711 452
Interest expense (942) (893) (1,351) (1,694)
Discount allowed - - - (46)
Financial expenses (942) (893) (1,351) (1,740)
Net financing costs (429) (325) (640) (1,288)
For
per
sona
l use
onl
y
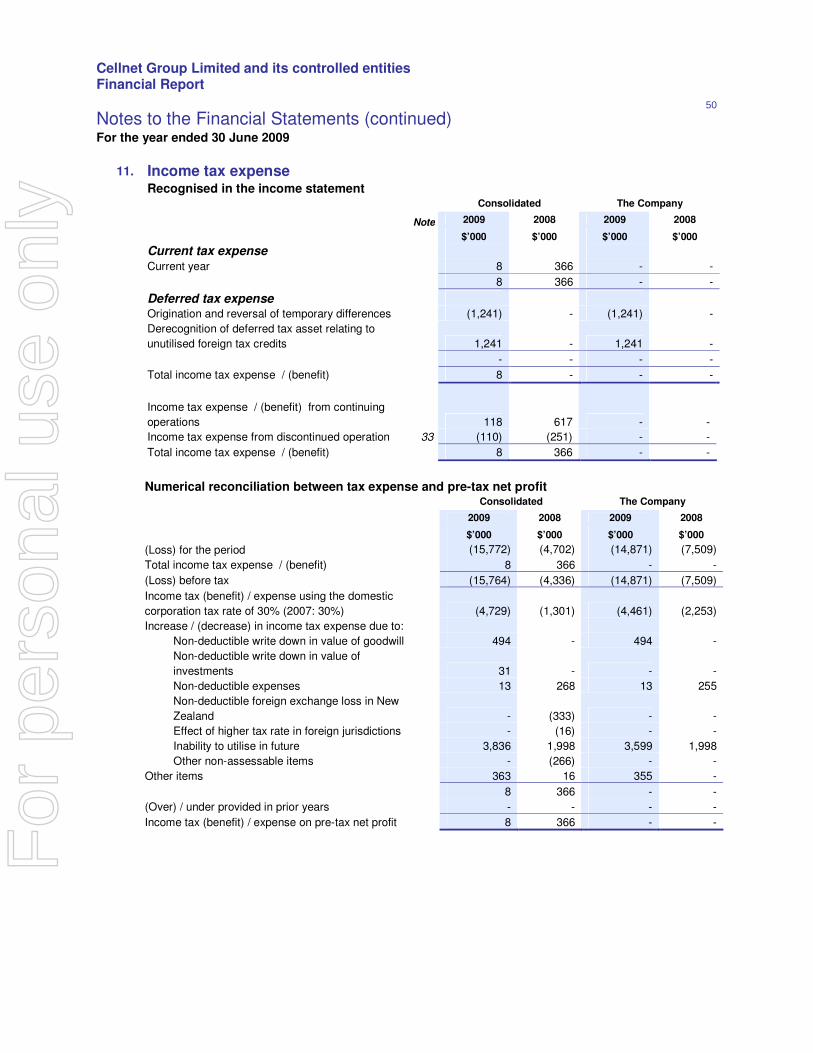
Cellnet Group Limited and its controlled entities Financial Report
50
Notes to the Financial Statements (continued) For the year ended 30 June 2009
11. Income tax expense
Recognised in the income statement Consolidated The Company
Note 2009 2008 2009 2008
$’000 $’000 $’000 $’000
Current tax expense
Current year 8 366 - -
8 366 - -
Deferred tax expense
Origination and reversal of temporary differences (1,241) - (1,241) -
Derecognition of deferred tax asset relating to
unutilised foreign tax credits 1,241 - 1,241 -
- - - -
Total income tax expense / (benefit) 8 - - -
Income tax expense / (benefit) from continuing
operations 118 617 - -
Income tax expense from discontinued operation 33 (110) (251) - -
Total income tax expense / (benefit) 8 366 - -
Numerical reconciliation between tax expense and pre-tax net profit Consolidated The Company
2009 2008 2009 2008
$’000 $’000 $’000 $’000
(Loss) for the period (15,772) (4,702) (14,871) (7,509)
Total income tax expense / (benefit) 8 366 - -
(Loss) before tax (15,764) (4,336) (14,871) (7,509)
Income tax (benefit) / expense using the domestic
corporation tax rate of 30% (2007: 30%) (4,729) (1,301) (4,461) (2,253)
Increase / (decrease) in income tax expense due to:
Non-deductible write down in value of goodwill 494 - 494 -
Non-deductible write down in value of
investments 31 - - -
Non-deductible expenses 13 268 13 255
Non-deductible foreign exchange loss in New
Zealand - (333) - -
Effect of higher tax rate in foreign jurisdictions - (16) - -
Inability to utilise in future 3,836 1,998 3,599 1,998
Other non-assessable items - (266) - -
Other items 363 16 355 -
8 366 - -
(Over) / under provided in prior years - - - -
Income tax (benefit) / expense on pre-tax net profit 8 366 - -
For
per
sona
l use
onl
y
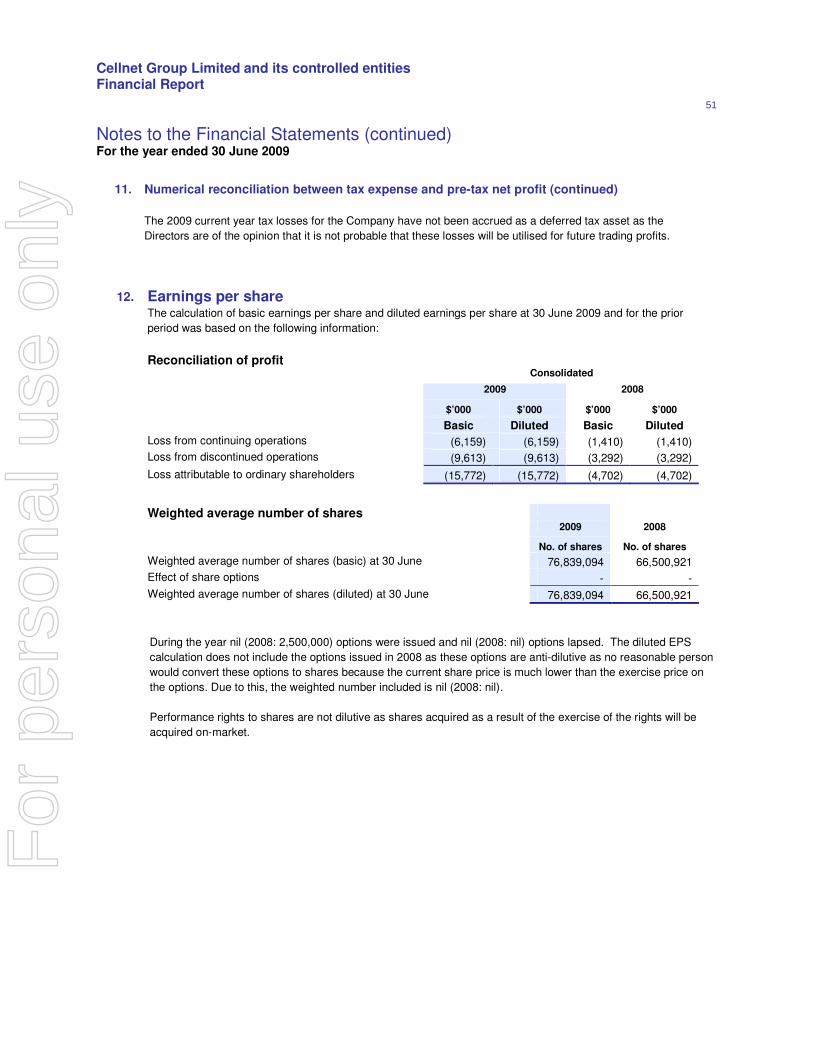
Cellnet Group Limited and its controlled entities Financial Report
51
During the year nil (2008: 2,500,000) options were issued and nil (2008: nil) options lapsed. The diluted EPS
calculation does not include the options issued in 2008 as these options are anti-dilutive as no reasonable person
would convert these options to shares because the current share price is much lower than the exercise price on
the options. Due to this, the weighted number included is nil (2008: nil).
Performance rights to shares are not dilutive as shares acquired as a result of the exercise of the rights will be
acquired on-market.
Notes to the Financial Statements (continued) For the year ended 30 June 2009
11. Numerical reconciliation between tax expense and pre-tax net profit (continued)
The 2009 current year tax losses for the Company have not been accrued as a deferred tax asset as the
Directors are of the opinion that it is not probable that these losses will be utilised for future trading profits.
12. Earnings per share
The calculation of basic earnings per share and diluted earnings per share at 30 June 2009 and for the prior
period was based on the following information:
Reconciliation of profit
Consolidated
2009 2008
$’000 $’000 $’000 $’000
Basic Diluted Basic Diluted
Loss from continuing operations (6,159) (6,159) (1,410) (1,410)
Loss from discontinued operations (9,613) (9,613) (3,292) (3,292)
Loss attributable to ordinary shareholders (15,772) (15,772) (4,702) (4,702)
Weighted average number of shares
2009 2008
No. of shares No. of shares
Weighted average number of shares (basic) at 30 June 76,839,094 66,500,921
Effect of share options - -
Weighted average number of shares (diluted) at 30 June 76,839,094 66,500,921
For
per
sona
l use
onl
y
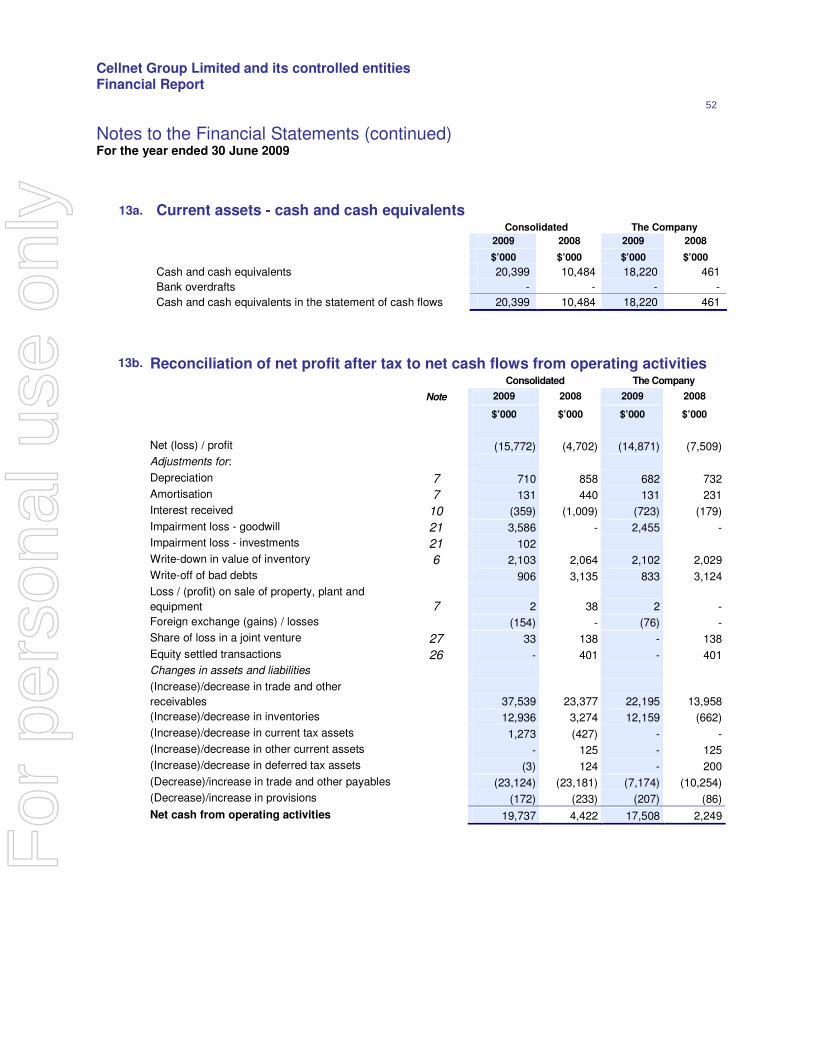
Cellnet Group Limited and its controlled entities Financial Report
52
Notes to the Financial Statements (continued) For the year ended 30 June 2009
13b.
Reconciliation of net profit after tax to net cash flows from operating activities
Consolidated The Company
Note 2009 2008 2009 2008
$’000 $’000 $’000 $’000
Net (loss) / profit (15,772) (4,702) (14,871) (7,509)
Adjustments for:
Depreciation 7 710 858 682 732
Amortisation 7 131 440 131 231
Interest received 10 (359) (1,009) (723) (179)
Impairment loss - goodwill 21 3,586 - 2,455 -
Impairment loss - investments 21 102
Write-down in value of inventory 6 2,103 2,064 2,102 2,029
Write-off of bad debts 906 3,135 833 3,124
Loss / (profit) on sale of property, plant and
equipment 7 2 38 2 -
Foreign exchange (gains) / losses (154) - (76) -
Share of loss in a joint venture 27 33 138 - 138
Equity settled transactions 26 - 401 - 401
Changes in assets and liabilities
(Increase)/decrease in trade and other
receivables 37,539 23,377 22,195 13,958
(Increase)/decrease in inventories 12,936 3,274 12,159 (662)
(Increase)/decrease in current tax assets 1,273 (427) - -
(Increase)/decrease in other current assets - 125 - 125
(Increase)/decrease in deferred tax assets (3) 124 - 200
(Decrease)/increase in trade and other payables (23,124) (23,181) (7,174) (10,254)
(Decrease)/increase in provisions (172) (233) (207) (86)
Net cash from operating activities 19,737 4,422 17,508 2,249
13a. Current assets - cash and cash equivalents
Consolidated The Company
2009 2008 2009 2008
$’000 $’000 $’000 $’000
Cash and cash equivalents 20,399 10,484 18,220 461
Bank overdrafts - - - -
Cash and cash equivalents in the statement of cash flows 20,399 10,484 18,220 461
For
per
sona
l use
onl
y
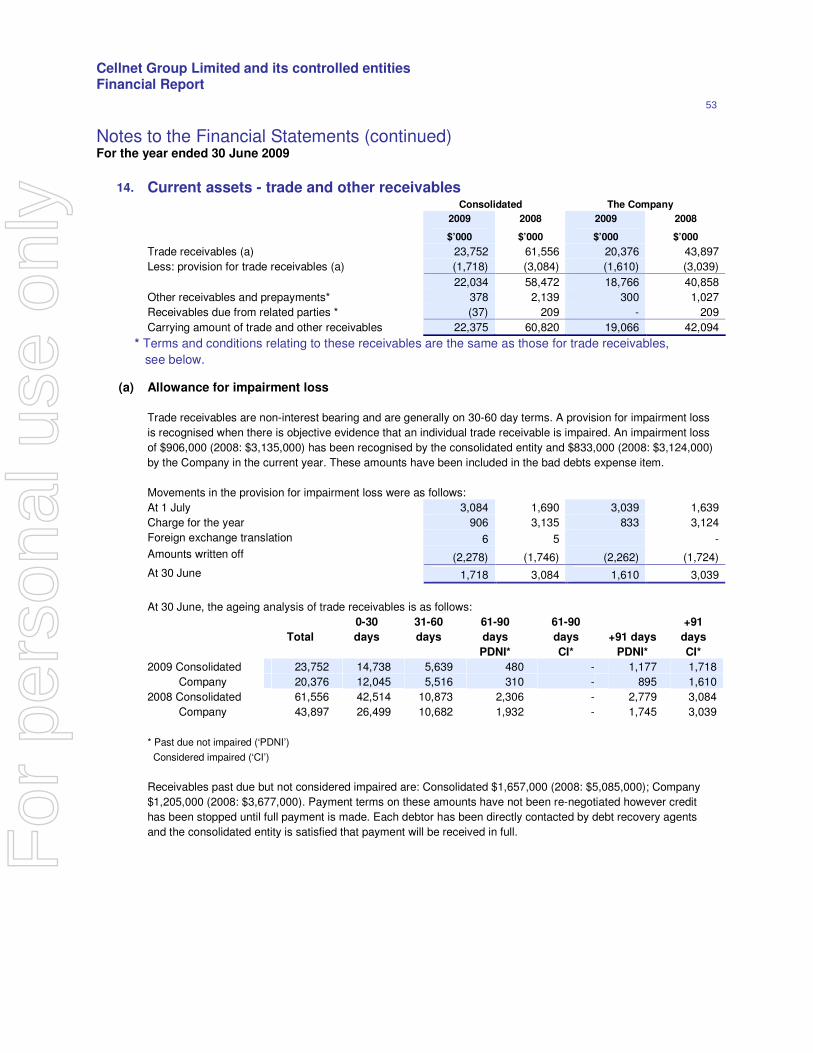
Cellnet Group Limited and its controlled entities Financial Report
53
Notes to the Financial Statements (continued) For the year ended 30 June 2009
* Terms and conditions relating to these receivables are the same as those for trade receivables,
see below.
14. Current assets - trade and other receivables
Consolidated The Company
2009 2008 2009 2008
$’000 $’000 $’000 $’000
Trade receivables (a) 23,752 61,556 20,376 43,897
Less: provision for trade receivables (a) (1,718) (3,084) (1,610) (3,039)
22,034 58,472 18,766 40,858
Other receivables and prepayments* 378 2,139 300 1,027
Receivables due from related parties * (37) 209 - 209
Carrying amount of trade and other receivables 22,375 60,820 19,066 42,094
(a) Allowance for impairment loss
Trade receivables are non-interest bearing and are generally on 30-60 day terms. A provision for impairment loss
is recognised when there is objective evidence that an individual trade receivable is impaired. An impairment loss
of $906,000 (2008: $3,135,000) has been recognised by the consolidated entity and $833,000 (2008: $3,124,000)
by the Company in the current year. These amounts have been included in the bad debts expense item.
Movements in the provision for impairment loss were as follows:
At 1 July 3,084 1,690 3,039 1,639
Charge for the year 906 3,135 833 3,124
Foreign exchange translation 6 5 -
Amounts written off (2,278) (1,746) (2,262) (1,724)
At 30 June 1,718 3,084 1,610 3,039
At 30 June, the ageing analysis of trade receivables is as follows:
Total
0-30
days
31-60
days
61-90
days
61-90
days +91 days
+91
days
PDNI* CI* PDNI* CI*
2009 Consolidated 23,752 14,738 5,639 480 - 1,177 1,718
Company 20,376 12,045 5,516 310 - 895 1,610
2008 Consolidated 61,556 42,514 10,873 2,306 - 2,779 3,084
Company 43,897 26,499 10,682 1,932 - 1,745 3,039
* Past due not impaired (‘PDNI’)
Considered impaired (‘CI’)
Receivables past due but not considered impaired are: Consolidated $1,657,000 (2008: $5,085,000); Company
$1,205,000 (2008: $3,677,000). Payment terms on these amounts have not been re-negotiated however credit
has been stopped until full payment is made. Each debtor has been directly contacted by debt recovery agents
and the consolidated entity is satisfied that payment will be received in full.
For
per
sona
l use
onl
y
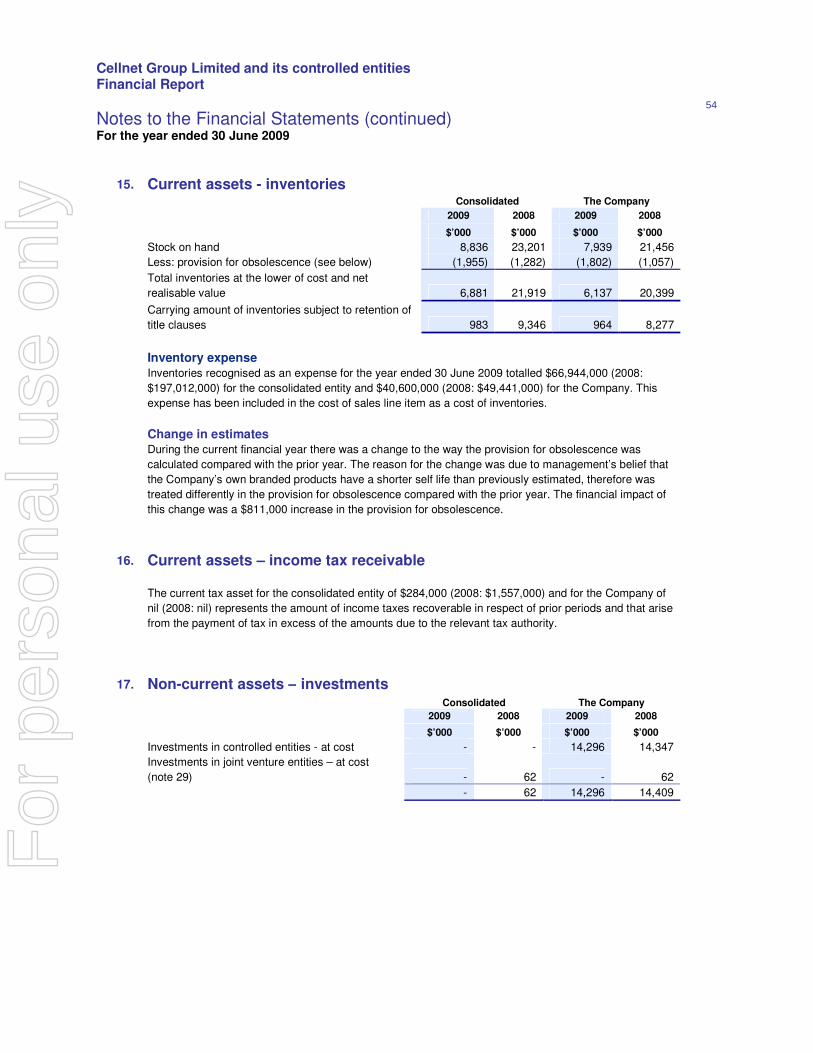
Cellnet Group Limited and its controlled entities Financial Report
54
Notes to the Financial Statements (continued) For the year ended 30 June 2009
15. Current assets - inventories Consolidated The Company
2009 2008 2009 2008
$’000 $’000 $’000 $’000
Stock on hand 8,836 23,201 7,939 21,456
Less: provision for obsolescence (see below) (1,955) (1,282) (1,802) (1,057)
Total inventories at the lower of cost and net
realisable value
6,881 21,919 6,137 20,399
Carrying amount of inventories subject to retention of
title clauses 983 9,346 964 8,277
Inventory expense
Inventories recognised as an expense for the year ended 30 June 2009 totalled $66,944,000 (2008:
$197,012,000) for the consolidated entity and $40,600,000 (2008: $49,441,000) for the Company. This
expense has been included in the cost of sales line item as a cost of inventories.
Change in estimates During the current financial year there was a change to the way the provision for obsolescence was
calculated compared with the prior year. The reason for the change was due to management’s belief that
the Company’s own branded products have a shorter self life than previously estimated, therefore was
treated differently in the provision for obsolescence compared with the prior year. The financial impact of
this change was a $811,000 increase in the provision for obsolescence.
16. Current assets – income tax receivable
The current tax asset for the consolidated entity of $284,000 (2008: $1,557,000) and for the Company of
nil (2008: nil) represents the amount of income taxes recoverable in respect of prior periods and that arise
from the payment of tax in excess of the amounts due to the relevant tax authority.
17. Non-current assets – investments Consolidated The Company
2009 2008 2009 2008
$’000 $’000 $’000 $’000
Investments in controlled entities - at cost - - 14,296 14,347
Investments in joint venture entities – at cost
(note 29) - 62 - 62
- 62 14,296 14,409
For
per
sona
l use
onl
y
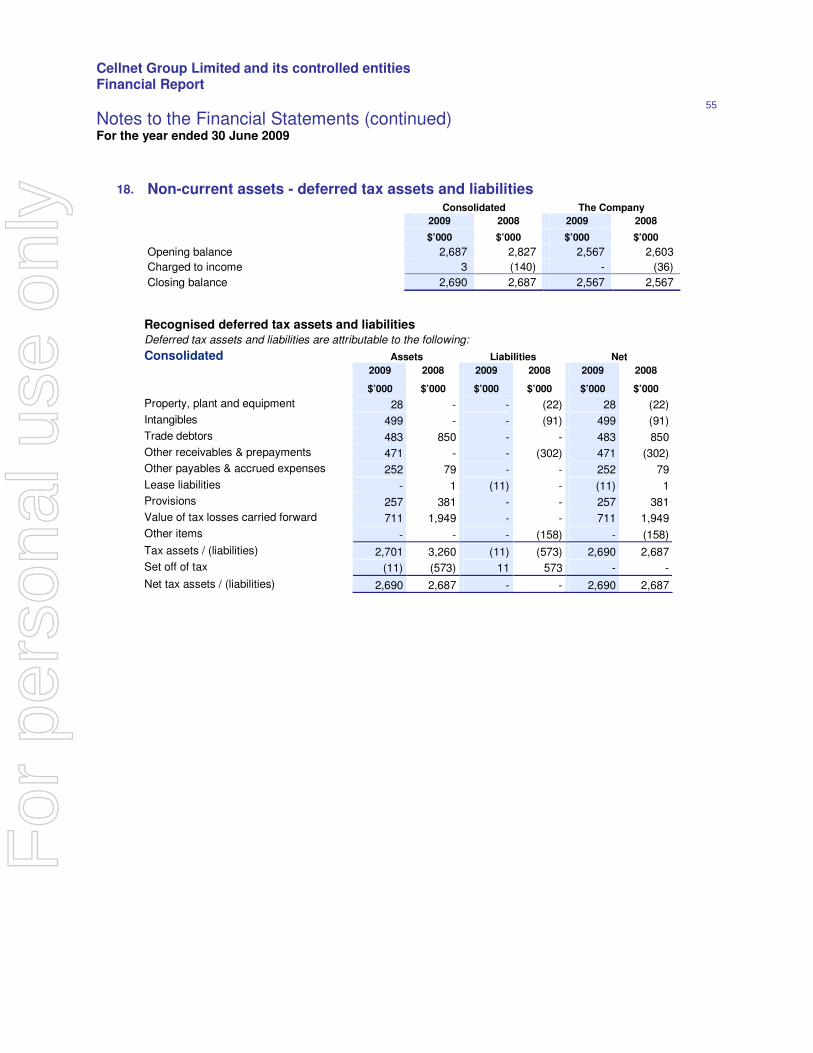
Cellnet Group Limited and its controlled entities Financial Report
55
Notes to the Financial Statements (continued) For the year ended 30 June 2009
18. Non-current assets - deferred tax assets and liabilities
Consolidated The Company
2009 2008 2009 2008
$’000 $’000 $’000 $’000
Opening balance 2,687 2,827 2,567 2,603
Charged to income 3 (140) - (36)
Closing balance 2,690 2,687 2,567 2,567
Recognised deferred tax assets and liabilities Deferred tax assets and liabilities are attributable to the following:
Consolidated Assets Liabilities Net
2009 2008 2009 2008 2009 2008
$’000 $’000 $’000 $’000 $’000 $’000
Property, plant and equipment 28 - - (22) 28 (22)
Intangibles 499 - - (91) 499 (91)
Trade debtors 483 850 - - 483 850
Other receivables & prepayments 471 - - (302) 471 (302)
Other payables & accrued expenses 252 79 - - 252 79
Lease liabilities - 1 (11) - (11) 1
Provisions 257 381 - - 257 381
Value of tax losses carried forward 711 1,949 - - 711 1,949
Other items - - - (158) - (158)
Tax assets / (liabilities) 2,701 3,260 (11) (573) 2,690 2,687
Set off of tax (11) (573) 11 573 - -
Net tax assets / (liabilities) 2,690 2,687 - - 2,690 2,687
For
per
sona
l use
onl
y
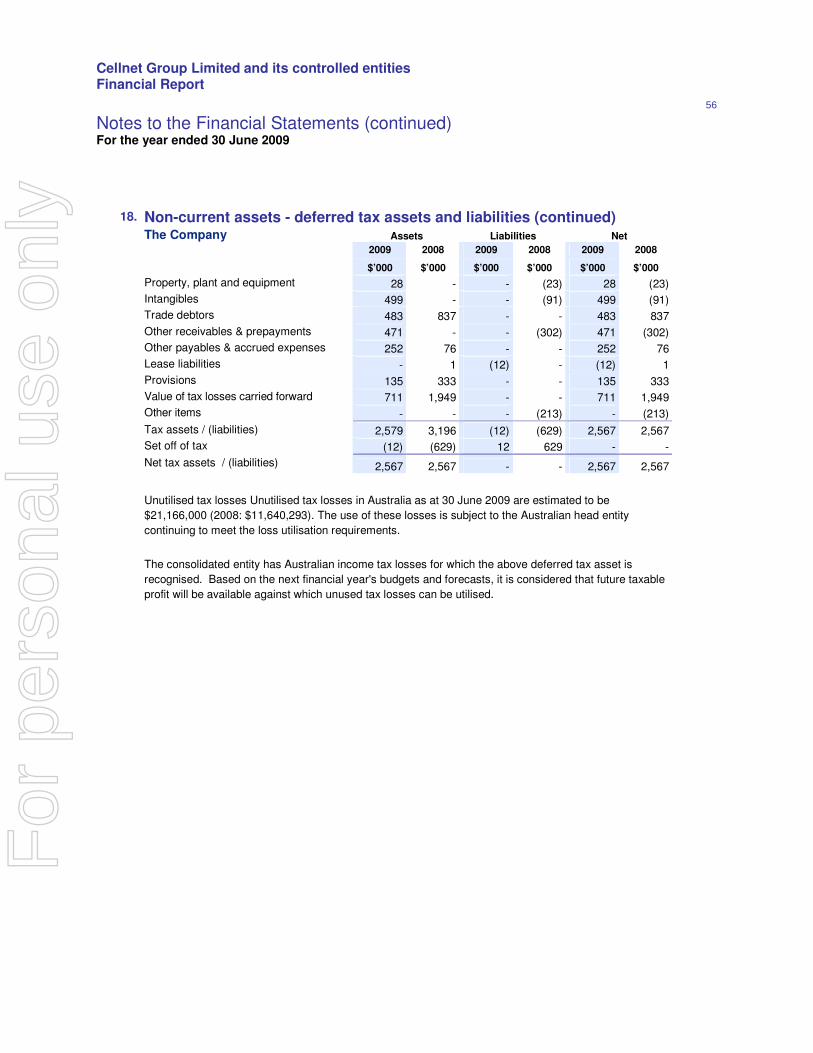
Cellnet Group Limited and its controlled entities Financial Report
56
18.
Non-current assets - deferred tax assets and liabilities (continued)
The Company Assets Liabilities Net
2009 2008 2009 2008 2009 2008
$’000 $’000 $’000 $’000 $’000 $’000
Property, plant and equipment 28 - - (23) 28 (23)
Intangibles 499 - - (91) 499 (91)
Trade debtors 483 837 - - 483 837
Other receivables & prepayments 471 - - (302) 471 (302)
Other payables & accrued expenses 252 76 - - 252 76
Lease liabilities - 1 (12) - (12) 1
Provisions 135 333 - - 135 333
Value of tax losses carried forward 711 1,949 - - 711 1,949
Other items - - - (213) - (213)
Tax assets / (liabilities) 2,579 3,196 (12) (629) 2,567 2,567
Set off of tax (12) (629) 12 629 - -
Net tax assets / (liabilities) 2,567 2,567 - - 2,567 2,567
Unutilised tax losses Unutilised tax losses in Australia as at 30 June 2009 are estimated to be
$21,166,000 (2008: $11,640,293). The use of these losses is subject to the Australian head entity
continuing to meet the loss utilisation requirements.
The consolidated entity has Australian income tax losses for which the above deferred tax asset is
recognised. Based on the next financial year's budgets and forecasts, it is considered that future taxable
profit will be available against which unused tax losses can be utilised.
Notes to the Financial Statements (continued) For the year ended 30 June 2009
For
per
sona
l use
onl
y
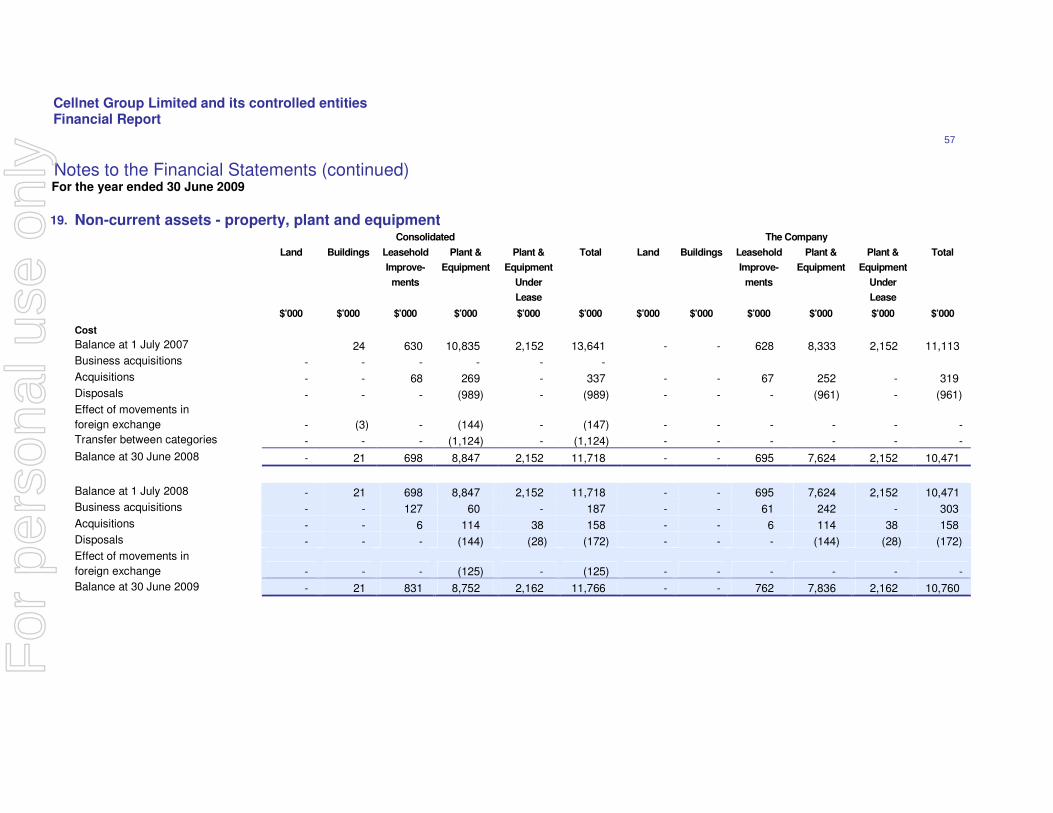
Cellnet Group Limited and its controlled entities Financial Report
57
Notes to the Financial Statements (continued) For the year ended 30 June 2009
19. Non-current assets - property, plant and equipment
Consolidated The Company
Land Buildings Leasehold
Improve-
ments
Plant &
Equipment
Plant &
Equipment
Under
Lease
Total Land Buildings Leasehold
Improve-
ments
Plant &
Equipment
Plant &
Equipment
Under
Lease
Total
$’000 $’000 $’000 $’000 $’000 $’000 $’000 $’000 $’000 $’000 $’000 $’000
Cost
Balance at 1 July 2007 24 630 10,835 2,152 13,641 - - 628 8,333 2,152 11,113
Business acquisitions - - - - - -
Acquisitions - - 68 269 - 337 - - 67 252 - 319
Disposals - - - (989) - (989) - - - (961) - (961)
Effect of movements in
foreign exchange - (3) - (144) - (147) - - - - - -
Transfer between categories - - - (1,124) - (1,124) - - - - - -
Balance at 30 June 2008 - 21 698 8,847 2,152 11,718 - - 695 7,624 2,152 10,471
Balance at 1 July 2008 - 21 698 8,847 2,152 11,718 - - 695 7,624 2,152 10,471
Business acquisitions - - 127 60 - 187 - - 61 242 - 303
Acquisitions - - 6 114 38 158 - - 6 114 38 158
Disposals - - - (144) (28) (172) - - - (144) (28) (172)
Effect of movements in
foreign exchange - - - (125) - (125) - - - - - -
Balance at 30 June 2009 - 21 831 8,752 2,162 11,766 - - 762 7,836 2,162 10,760
For
per
sona
l use
onl
y
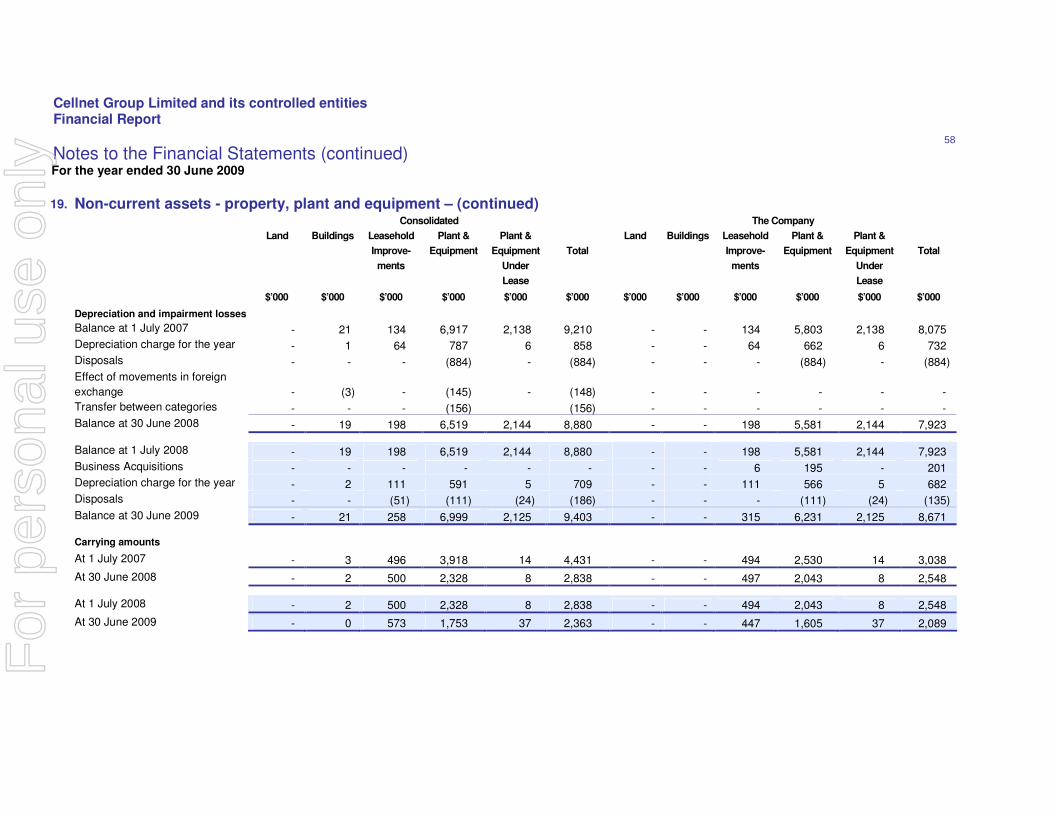
Cellnet Group Limited and its controlled entities Financial Report
58
Notes to the Financial Statements (continued) For the year ended 30 June 2009
19. Non-current assets - property, plant and equipment – (continued) Consolidated The Company
Land Buildings Leasehold
Improve-
ments
Plant &
Equipment
Plant &
Equipment
Under
Lease
Total
Land Buildings Leasehold
Improve-
ments
Plant &
Equipment
Plant &
Equipment
Under
Lease
Total
$’000 $’000 $’000 $’000 $’000 $’000 $’000 $’000 $’000 $’000 $’000 $’000
Depreciation and impairment losses
Balance at 1 July 2007 - 21 134 6,917 2,138 9,210 - - 134 5,803 2,138 8,075
Depreciation charge for the year - 1 64 787 6 858 - - 64 662 6 732
Disposals - - - (884) - (884) - - - (884) - (884)
Effect of movements in foreign
exchange - (3) - (145) - (148) - - - - - -
Transfer between categories - - - (156) (156) - - - - - -
Balance at 30 June 2008 - 19 198 6,519 2,144 8,880 - - 198 5,581 2,144 7,923
Balance at 1 July 2008 - 19 198 6,519 2,144 8,880 - - 198 5,581 2,144 7,923
Business Acquisitions - - - - - - - - 6 195 - 201
Depreciation charge for the year - 2 111 591 5 709 - - 111 566 5 682
Disposals - - (51) (111) (24) (186) - - - (111) (24) (135)
Balance at 30 June 2009 - 21 258 6,999 2,125 9,403 - - 315 6,231 2,125 8,671
Carrying amounts
At 1 July 2007 - 3 496 3,918 14 4,431 - - 494 2,530 14 3,038
At 30 June 2008 - 2 500 2,328 8 2,838 - - 497 2,043 8 2,548
At 1 July 2008 - 2 500 2,328 8 2,838 - - 494 2,043 8 2,548
At 30 June 2009 - 0 573 1,753 37 2,363 - - 447 1,605 37 2,089
For
per
sona
l use
onl
y
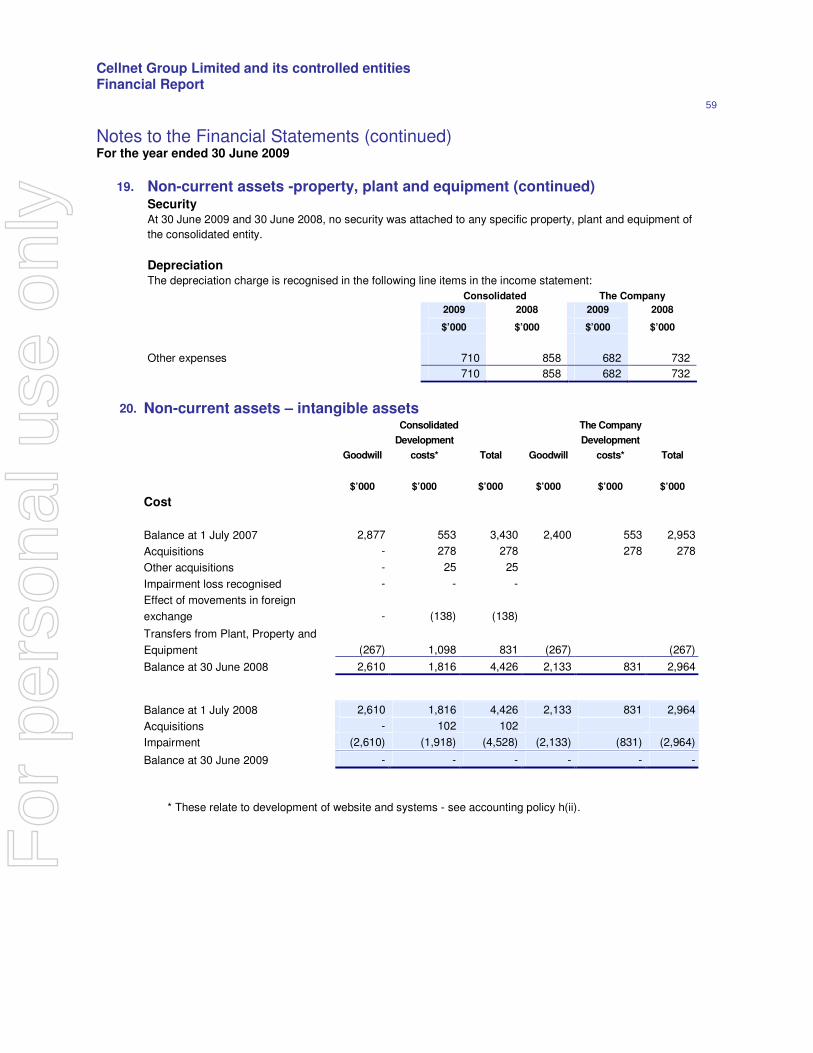
Cellnet Group Limited and its controlled entities Financial Report
59
Notes to the Financial Statements (continued) For the year ended 30 June 2009
19. Non-current assets -property, plant and equipment (continued)
Security At 30 June 2009 and 30 June 2008, no security was attached to any specific property, plant and equipment of
the consolidated entity.
Depreciation The depreciation charge is recognised in the following line items in the income statement:
Consolidated The Company
2009 2008 2009 2008
$’000 $’000 $’000 $’000
Other expenses 710 858 682 732
710 858 682 732
Effect of movements in foreign
exchange - (138) (138)
Impairment (2,610) (1,918) (4,528) (2,133) (831) (2,964)
* These relate to development of website and systems - see accounting policy h(ii).
20. Non-current assets – intangible assets
Consolidated The Company
Goodwill
Development
costs*
Total
Goodwill
Development
costs*
Total
$’000 $’000 $’000 $’000 $’000 $’000
Cost
Balance at 1 July 2007 2,877 553 3,430 2,400 553 2,953
Acquisitions - 278 278 278 278
Other acquisitions - 25 25
Impairment loss recognised - - -
Transfers from Plant, Property and
Equipment (267) 1,098 831 (267) (267)
Balance at 30 June 2008 2,610 1,816 4,426 2,133 831 2,964
Balance at 1 July 2008 2,610 1,816 4,426 2,133 831 2,964
Acquisitions - 102 102
Balance at 30 June 2009 - - - - - -
For
per
sona
l use
onl
y
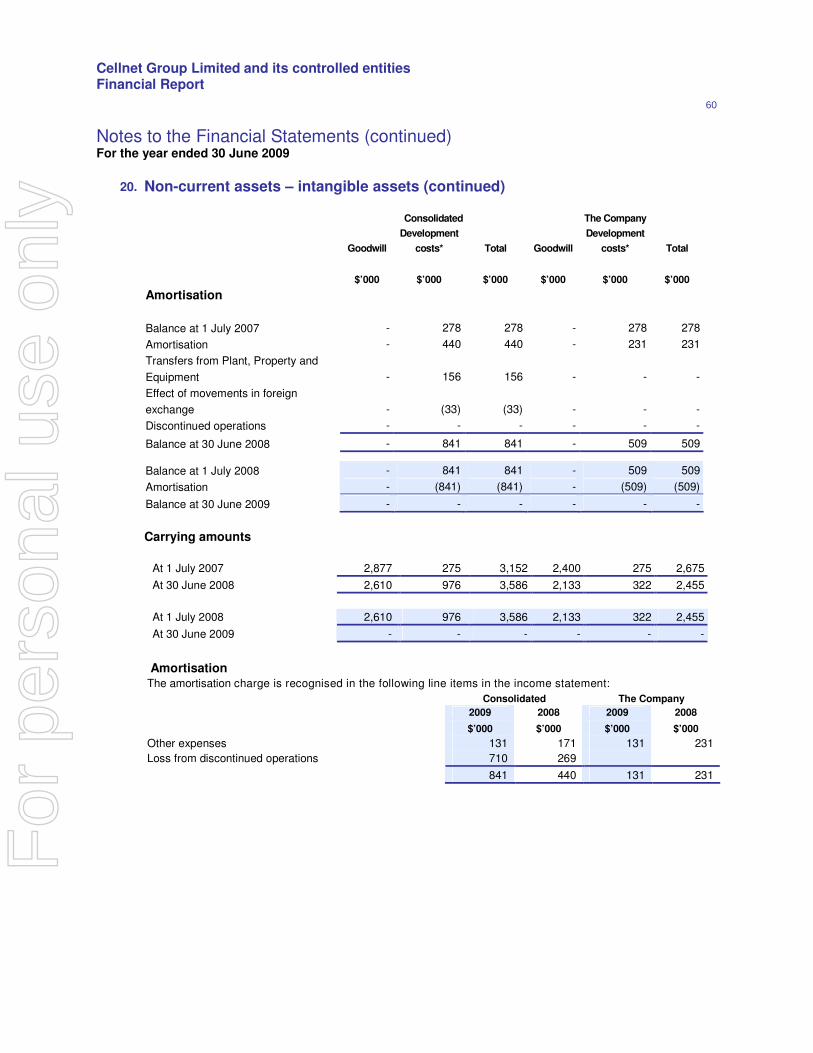
Cellnet Group Limited and its controlled entities Financial Report
60
Notes to the Financial Statements (continued) For the year ended 30 June 2009
20. Non-current assets – intangible assets (continued)
Carrying amounts
At 1 July 2007 2,877 275 3,152 2,400 275 2,675
At 30 June 2008 2,610 976 3,586 2,133 322 2,455
At 1 July 2008 2,610 976 3,586 2,133 322 2,455
At 30 June 2009 - - - - - -
Amortisation The amortisation charge is recognised in the following line items in the income statement:
Consolidated The Company
2009 2008 2009 2008
$’000 $’000 $’000 $’000
Other expenses 131 171 131 231
Loss from discontinued operations 710 269
841 440 131 231
Consolidated The Company
Goodwill
Development
costs*
Total
Goodwill
Development
costs*
Total
$’000 $’000 $’000 $’000 $’000 $’000
Amortisation
Balance at 1 July 2007 - 278 278 - 278 278
Amortisation - 440 440 - 231 231
Transfers from Plant, Property and
Equipment - 156 156 - - -
Effect of movements in foreign
exchange - (33) (33) - - -
Discontinued operations - - - - - -
Balance at 30 June 2008 - 841 841 - 509 509
Balance at 1 July 2008 - 841 841 - 509 509
Amortisation - (841) (841) - (509) (509)
Balance at 30 June 2009 - - - - - -
For
per
sona
l use
onl
y
Cellnet Group Limited and its controlled entities Financial Report
61
Notes to the Financial Statements (continued) For the year ended 30 June 2009
20. Non-current assets – intangible assets (continued)
Description of the consolidated entity’s intangible assets and goodwill
(i) Development costs
Development costs are carried at cost less accumulated amortisation and accumulated impairment losses. This
intangible asset has been assessed as having a finite life and is amortised using the straight line method over a
period of 3 years. If an impairment indication arises, the recoverable amount is estimated and an impairment loss
is recognised to the extent that the recoverable amount is lower than the carrying amount.
During the period assets relating to operational computer software were deemed to be impaired due to the
restructuring of the operations in New Zealand. The cost of this development in New Zealand of $572,000 has
been written off. Software previously developed internally in Australia has been written off as the recoverable
amount of the asset is less than carrying value and therefore an impairment loss has been recognised.
(ii) Goodwill
After initial recognition, goodwill acquired in a business combination is measured at cost less any accumulated
impairment losses. Goodwill is not amortised but is subject to impairment testing on an annual basis or whenever
there is an indication of impairment (refer to section (b) below).
(a) Impairment losses recognised
(i) Discontinued operation
As a direct result of the discontinued operations and restructure of the business, the recoverable amount of the IT
distribution cash generating unit has been impaired based on value in use calculations. The recoverable amount
of cash generating units has historically been tested for impairment at each balance date. The IT component of
goodwill ($2,399,551) represented the goodwill arising from Cellnet Group Ltd’s acquisition of Hi-Tech
Distribution. This carrying amount of goodwill was written off as being impaired based on future cash flows which
will not materialize due to the discontinuation of the desktop and notebook distribution.
(ii) Continued operations
The remaining $210,000 of goodwill relates to the retail segment which has been written off and impaired as the
recoverable amount of the asset is less than carrying value and therefore an impairment loss has been
recognised.
(b) Impairment tests for goodwill with indefinite life
(i) Description of the cash generating units and other relevant information
Goodwill acquired through business combinations have been allocated to two individual cash generating units,
each of which is a reportable segment for impairment testing as follows: IT cash generating unit; and Retail cash
generating unit.
IT cash generating unit
The recoverable amount of the IT unit has been determined based on value in use calculation using cash flow
projections as at 31 December 2008 based on financial forecasts approved by senior management for a one year
period extrapolated based on a consistent growth rate.
The pre-tax, discount rate applied to cash flow projections for 5 years is 12.88% (2008: 7.33%).
For
per
sona
l use
onl
y
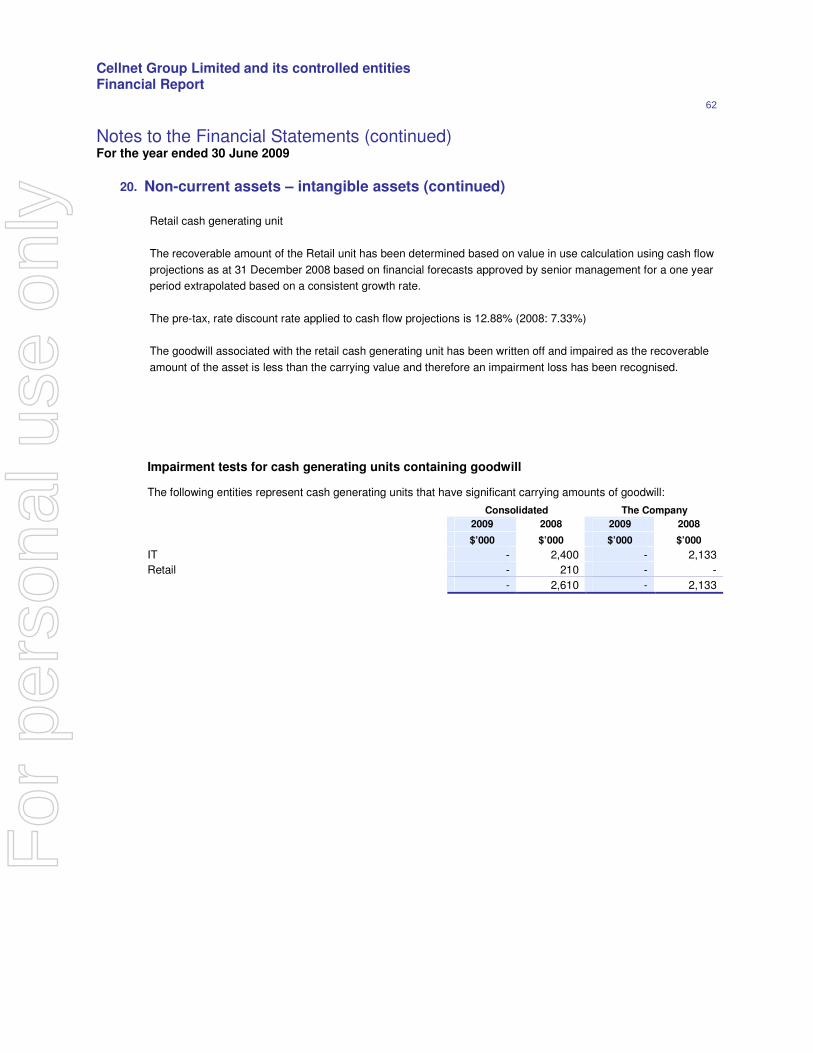
Cellnet Group Limited and its controlled entities Financial Report
62
Notes to the Financial Statements (continued) For the year ended 30 June 2009
20. Non-current assets – intangible assets (continued)
Retail cash generating unit
The recoverable amount of the Retail unit has been determined based on value in use calculation using cash flow
projections as at 31 December 2008 based on financial forecasts approved by senior management for a one year
period extrapolated based on a consistent growth rate.
The pre-tax, rate discount rate applied to cash flow projections is 12.88% (2008: 7.33%)
The goodwill associated with the retail cash generating unit has been written off and impaired as the recoverable
amount of the asset is less than the carrying value and therefore an impairment loss has been recognised.
Impairment tests for cash generating units containing goodwill
The following entities represent cash generating units that have significant carrying amounts of goodwill:
Consolidated The Company
2009 2008 2009 2008
$’000 $’000 $’000 $’000
IT - 2,400 - 2,133
Retail - 210 - -
- 2,610 - 2,133
For
per
sona
l use
onl
y
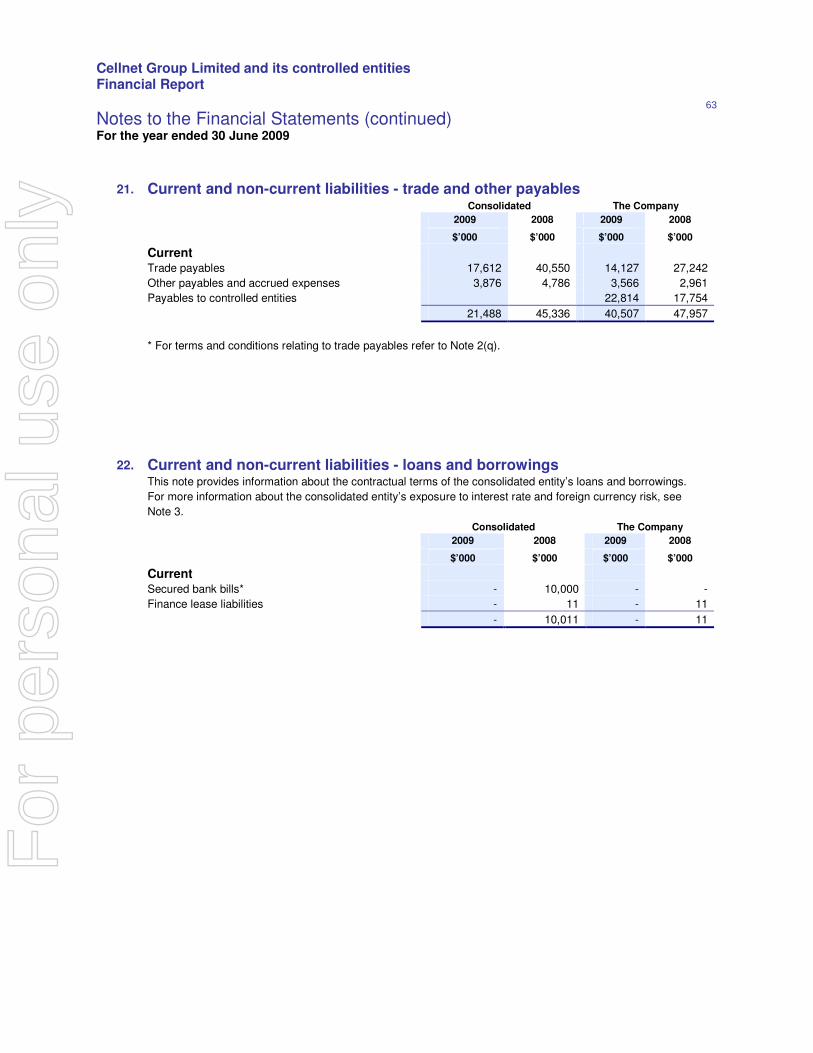
Cellnet Group Limited and its controlled entities Financial Report
63
Notes to the Financial Statements (continued) For the year ended 30 June 2009
21. Current and non-current liabilities - trade and other payables
Consolidated The Company
2009 2008 2009 2008
$’000 $’000 $’000 $’000
Current
Trade payables 17,612 40,550 14,127 27,242
Other payables and accrued expenses 3,876 4,786 3,566 2,961
Payables to controlled entities 22,814 17,754
21,488 45,336 40,507 47,957
* For terms and conditions relating to trade payables refer to Note 2(q).
22. Current and non-current liabilities - loans and borrowings
This note provides information about the contractual terms of the consolidated entity’s loans and borrowings.
For more information about the consolidated entity’s exposure to interest rate and foreign currency risk, see
Note 3.
Consolidated The Company
2009 2008 2009 2008
$’000 $’000 $’000 $’000
Current
Secured bank bills* - 10,000 - -
Finance lease liabilities - 11 - 11
- 10,011 - 11
For
per
sona
l use
onl
y
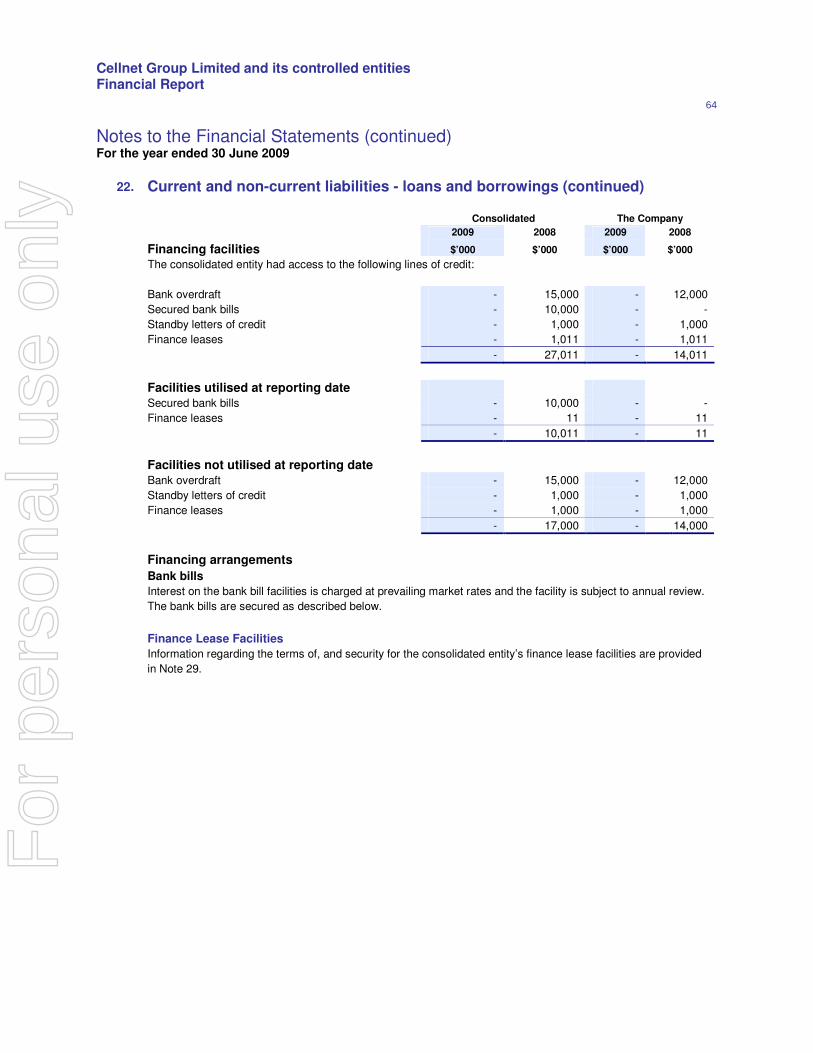
Cellnet Group Limited and its controlled entities Financial Report
64
Notes to the Financial Statements (continued) For the year ended 30 June 2009
22. Current and non-current liabilities - loans and borrowings (continued)
Consolidated The Company
2009 2008 2009 2008
Financing facilities $’000 $’000 $’000 $’000
The consolidated entity had access to the following lines of credit:
Bank overdraft - 15,000 - 12,000
Secured bank bills - 10,000 - -
Standby letters of credit - 1,000 - 1,000
Finance leases - 1,011 - 1,011
- 27,011 - 14,011
Facilities utilised at reporting date
Secured bank bills - 10,000 - -
Finance leases - 11 - 11
- 10,011 - 11
Facilities not utilised at reporting date
Bank overdraft - 15,000 - 12,000
Standby letters of credit - 1,000 - 1,000
Finance leases - 1,000 - 1,000
- 17,000 - 14,000
Financing arrangements Bank bills Interest on the bank bill facilities is charged at prevailing market rates and the facility is subject to annual review.
The bank bills are secured as described below.
Finance Lease Facilities
Information regarding the terms of, and security for the consolidated entity’s finance lease facilities are provided
in Note 29.
For
per
sona
l use
onl
y
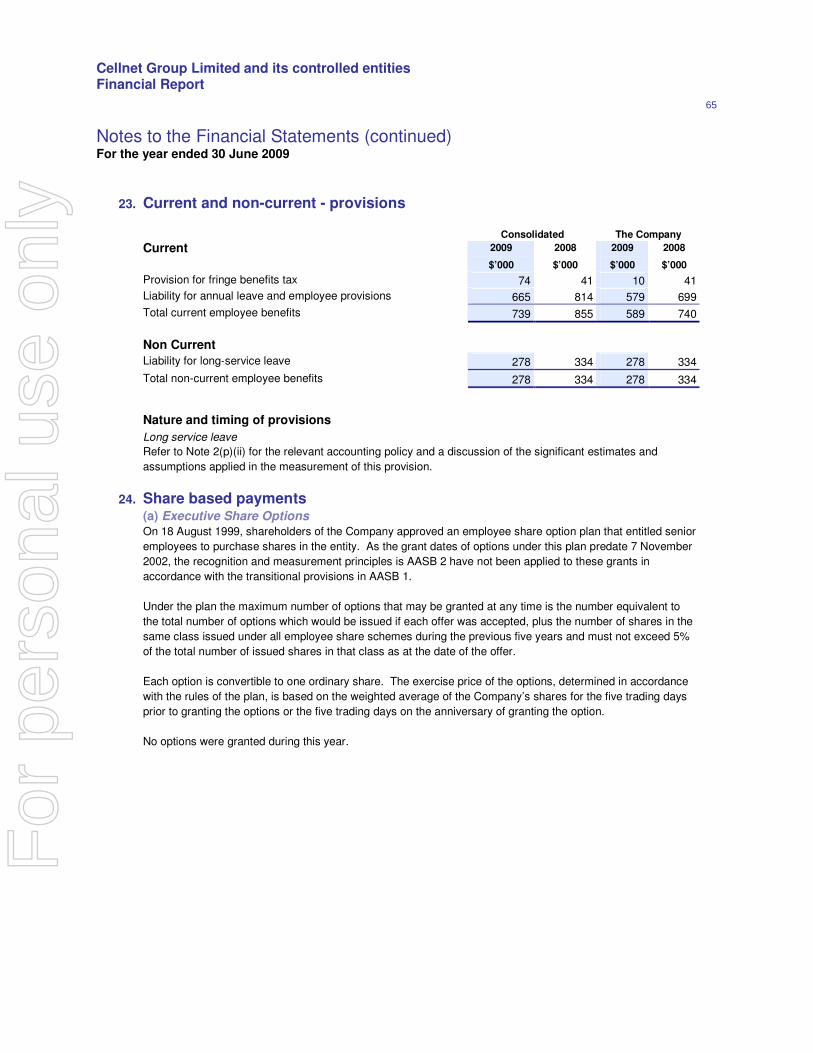
Cellnet Group Limited and its controlled entities Financial Report
65
Notes to the Financial Statements (continued) For the year ended 30 June 2009
23. Current and non-current - provisions
Consolidated The Company Current 2009 2008 2009 2008
$’000 $’000 $’000 $’000
Provision for fringe benefits tax 74 41 10 41
Liability for annual leave and employee provisions 665 814 579 699
Total current employee benefits 739 855 589 740 Non Current
Liability for long-service leave 278 334 278 334
Total non-current employee benefits 278 334 278 334
Nature and timing of provisions
Long service leave
Refer to Note 2(p)(ii) for the relevant accounting policy and a discussion of the significant estimates and
assumptions applied in the measurement of this provision.
24. Share based payments
(a) Executive Share Options
On 18 August 1999, shareholders of the Company approved an employee share option plan that entitled senior
employees to purchase shares in the entity. As the grant dates of options under this plan predate 7 November
2002, the recognition and measurement principles is AASB 2 have not been applied to these grants in
accordance with the transitional provisions in AASB 1. Under the plan the maximum number of options that may be granted at any time is the number equivalent to
the total number of options which would be issued if each offer was accepted, plus the number of shares in the
same class issued under all employee share schemes during the previous five years and must not exceed 5%
of the total number of issued shares in that class as at the date of the offer.
Each option is convertible to one ordinary share. The exercise price of the options, determined in accordance
with the rules of the plan, is based on the weighted average of the Company’s shares for the five trading days
prior to granting the options or the five trading days on the anniversary of granting the option.
No options were granted during this year.
For
per
sona
l use
onl
y
Cellnet Group Limited and its controlled entities Financial Report
66
Notes to the Financial Statements (continued) For the year ended 30 June 2009
24. Share based payments (continued)
(a) Executive Share Options (continued) All options expire: • Immediately upon the employee ceasing to be a Director, employee or independent contractor with the
Company for reasons involving fraud or misconduct;
• One month after the employee has ceased to be a Director, employee or independent contractor with the
Company for reasons other than fraud or misconduct; or
• On the expiry date.
One third of options granted vest 12 months after grant date, one third vest 24 months after grant date and one
third vest 36 months after grant date.
To be able to exercise the options the holder must be a Director, employee or independent contractor at the
exercise date.
There are no voting rights or dividend rights attached to options. There are no voting rights attached to the
unissued ordinary shares. Voting rights will be attached to the unissued ordinary shares when the options have
been exercised.
The fair value of shares issued as a result of exercising the options during the reporting period at their issue date
is the market price of shares of the Company on the Australian Securities Exchange as at close of trading.
The amounts recognised in contributed equity of the Company and consolidated entity in relation to employee
share options exercised during the year are provided in Note 28.
(b) Performance rights
On 18 November 2005, shareholders of the Company approved a performance share rights plan.
Under the plan, performance rights are issued to key management personnel. The rights deliver ordinary shares
to key management personnel (at no cost to the Executive) where the performance hurdle in relation to those
performance rights is met. Where the performance hurdle is met, the Company will acquire the necessary shares
on the stock market and allocate them to the key management person. Non-Executive Directors are not entitled to
participate in the plan.
The number of performance rights granted to each Executive is set by taking a specified percentage of the total
fixed remuneration of each key management person, exclusive of any bonuses, and dividing that by the five day
average closing share price of Cellnet Group Limited prior to the date of issue.
The number of performance rights that vest to key management personnel is determined according to the
Company’s relative Total Share Return (TSR) performance over the vesting period compared with a comparative
group of companies.
For
per
sona
l use
onl
y
Cellnet Group Limited and its controlled entities Financial Report
67
Notes to the Financial Statements (continued) For the year ended 30 June 2009
24. Share based payments (continued) (b) Performance rights (continued)
TSR measures growth in shareholder value (essentially movement in share price plus dividends, assuming re-
investment) over the performance period. Under the relative TSR test:
• no performance rights will vest unless the Company’s TSR over the performance period is greater than or
equal to the TSR of the Company which is at the 50th percentile of the comparative group ranked by TSR
performance. If that threshold is attained 50% of the performance shares will vest and become the property of
the key management personnel;
• all of the performance rights will vest if the Company’s TSR over the performance period is equal to or greater
than the TSR of the Company which is at the 75th percentile of the comparative group, ranked by TSR
performance; and
• the percentage of the performance rights which will vest will increase progressively as the Company’s TSR
moves from the 50th to 75th percentiles.
The comparative group for the relative TSR test will comprise a broad group of ASX-listed companies of
reasonably comparable size to the Company, as determined by the Board, but excluding listed property trusts and
similar entities. Companies that drop out of the comparative group during the performance period because of
mergers and delistings will not be replaced.
2007 Allocation
Performance rights for the prior year were issued on 1 July 2006. The performance period for these rights is three
years with performance being tested on an annual basis and a certain proportion of the rights being able to vest in
each of the three years should the performance criteria be met (20% in year 1, 30% in year 2 and 50% in year 3).
Where the criteria is not met in a given year the rights “roll” into the next year and are able to be tested again then.
The fair value of the prior year allocation of performance rights was calculated as being $0.83 for those able to
vest on 30 June 2007, $0.77 for those able to vest on 30 June 2008, and $0.70 cents for those able to vest on 30
June 2009. The performance for the first year to 30 June 2007 did not satisfy the performance criteria therefore
the balance of these rights has rolled over for testing again at 30 June 2008.
2008 and 2009 Allocation
The performance for the years to 30 June 2008 and 30 June 2009 did not satisfy the performance criteria
therefore the balance of these rights has rolled over for testing again at 30 June 2009 (refer next page). No further
performance rights were issued during the 2008 year.
Summary of performance rights
Details of the fair value of performance rights in relation to unissued ordinary shares and movements during the
year are set out below.
The fair value of performance rights granted during the year was independently determined using a Monte Carlo
simulation model utilising a Black-Scholes option pricing model framework that takes into account the term of the
rights, the vesting and performance criteria, the non-tradeable nature of the rights, the share price at grant date,
the expected price volatility of the underlying share, the expected dividend yield and the risk-free interest rate for
the term of the share rights.
The amounts recognised in retained earnings of the Company and consolidated entity in relation to performance
rights granted during the year are provided in Note 28, as are the amounts recognised in reserves in relation to
share issues made to key management personnel under the plan.
For
per
sona
l use
onl
y
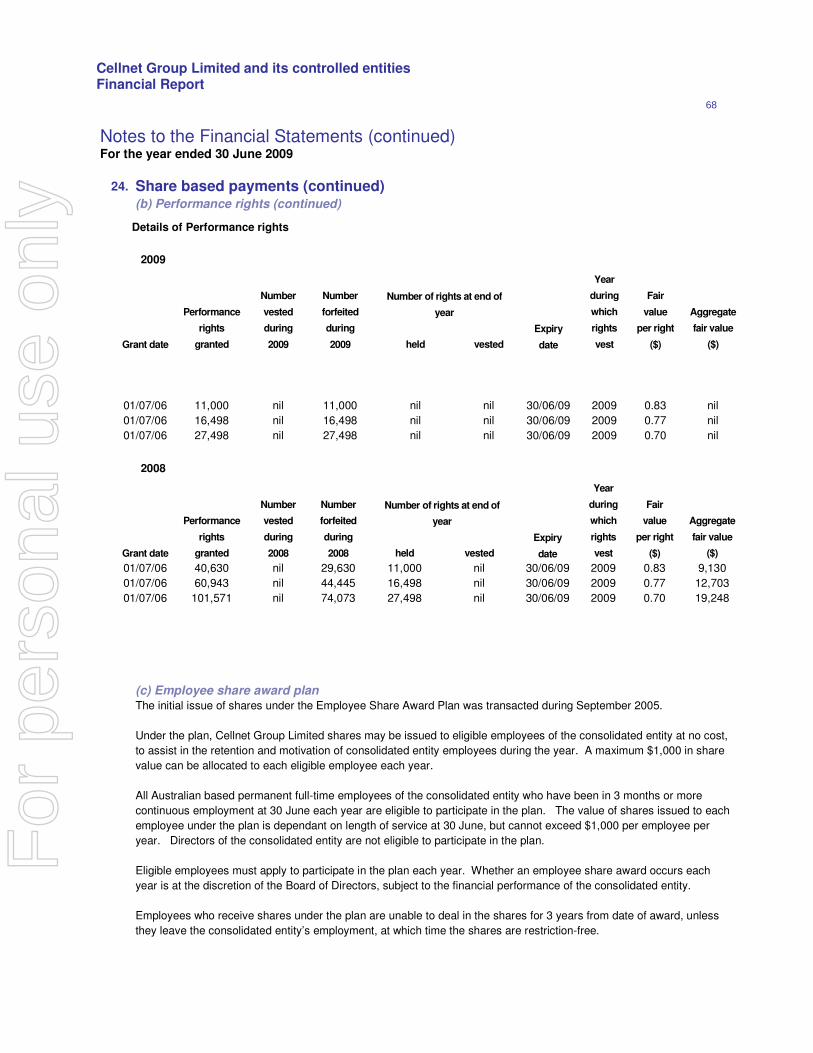
Cellnet Group Limited and its controlled entities Financial Report
68
Notes to the Financial Statements (continued) For the year ended 30 June 2009
24. Share based payments (continued) (b) Performance rights (continued)
2009
Number of rights at end of
year
Grant date
Performance
rights
granted
Number
vested
during
2009
Number
forfeited
during
2009 held vested
Expiry
date
Year
during
which
rights
vest
Fair
value
per right
($)
Aggregate
fair value
($)
01/07/06 11,000 nil 11,000 nil nil 30/06/09 2009 0.83 nil
01/07/06 16,498 nil 16,498 nil nil 30/06/09 2009 0.77 nil
01/07/06 27,498 nil 27,498 nil nil 30/06/09 2009 0.70 nil
2008
Number of rights at end of
year
Grant date
Performance
rights
granted
Number
vested
during
2008
Number
forfeited
during
2008 held vested
Expiry
date
Year
during
which
rights
vest
Fair
value
per right
($)
Aggregate
fair value
($)
01/07/06 40,630 nil 29,630 11,000 nil 30/06/09 2009 0.83 9,130
01/07/06 60,943 nil 44,445 16,498 nil 30/06/09 2009 0.77 12,703
01/07/06 101,571 nil 74,073 27,498 nil 30/06/09 2009 0.70 19,248
(c) Employee share award plan The initial issue of shares under the Employee Share Award Plan was transacted during September 2005. Under the plan, Cellnet Group Limited shares may be issued to eligible employees of the consolidated entity at no cost,
to assist in the retention and motivation of consolidated entity employees during the year. A maximum $1,000 in share
value can be allocated to each eligible employee each year. All Australian based permanent full-time employees of the consolidated entity who have been in 3 months or more
continuous employment at 30 June each year are eligible to participate in the plan. The value of shares issued to each
employee under the plan is dependant on length of service at 30 June, but cannot exceed $1,000 per employee per
year. Directors of the consolidated entity are not eligible to participate in the plan. Eligible employees must apply to participate in the plan each year. Whether an employee share award occurs each
year is at the discretion of the Board of Directors, subject to the financial performance of the consolidated entity. Employees who receive shares under the plan are unable to deal in the shares for 3 years from date of award, unless
they leave the consolidated entity’s employment, at which time the shares are restriction-free.
Details of Performance rights
For
per
sona
l use
onl
y
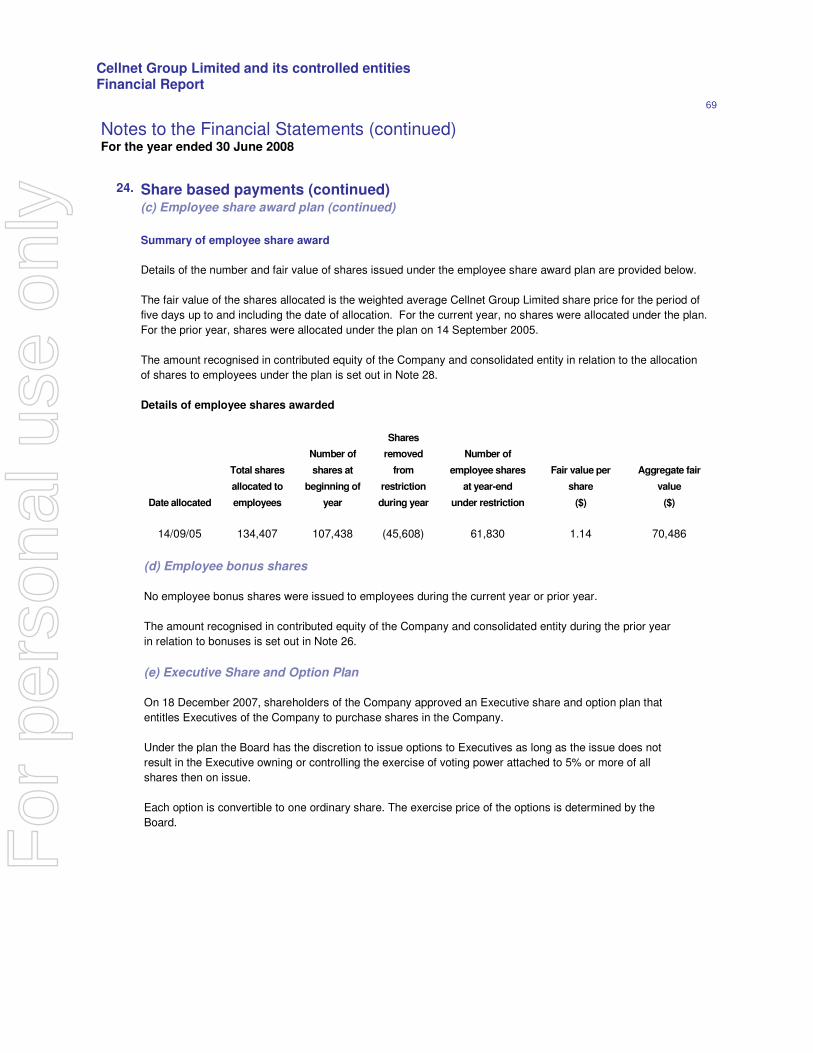
Cellnet Group Limited and its controlled entities Financial Report
69
Date allocated
Total shares
allocated to
employees
Number of
shares at
beginning of
year
Shares
removed
from
restriction
during year
Number of
employee shares
at year-end
under restriction
Fair value per
share
($)
Aggregate fair
value
($)
14/09/05 134,407 107,438 (45,608) 61,830 1.14 70,486
(d) Employee bonus shares
No employee bonus shares were issued to employees during the current year or prior year. The amount recognised in contributed equity of the Company and consolidated entity during the prior year
in relation to bonuses is set out in Note 26. (e) Executive Share and Option Plan
On 18 December 2007, shareholders of the Company approved an Executive share and option plan that
entitles Executives of the Company to purchase shares in the Company.
Under the plan the Board has the discretion to issue options to Executives as long as the issue does not
result in the Executive owning or controlling the exercise of voting power attached to 5% or more of all
shares then on issue.
Each option is convertible to one ordinary share. The exercise price of the options is determined by the
Board.
24.
Share based payments (continued)
(c) Employee share award plan (continued) Summary of employee share award Details of the number and fair value of shares issued under the employee share award plan are provided below.
The fair value of the shares allocated is the weighted average Cellnet Group Limited share price for the period of
five days up to and including the date of allocation. For the current year, no shares were allocated under the plan.
For the prior year, shares were allocated under the plan on 14 September 2005.
The amount recognised in contributed equity of the Company and consolidated entity in relation to the allocation
of shares to employees under the plan is set out in Note 28. Details of employee shares awarded
Notes to the Financial Statements (continued) For the year ended 30 June 2008
For
per
sona
l use
onl
y
Cellnet Group Limited and its controlled entities Financial Report
70
Notes to the Financial Statements (continued) For the year ended 30 June 2009
24. Share based payments (continued)
(e) Executive Share and Options Plan (continued) All options expire: • The date 10 years from the date the option was granted or 12 months after the death or total and
permanent disablement of the Executive;
• A determination of the Board that the Executive has, in the Board’s opinion, been dismissed or
removed from office for a reason which entitles a company in the consolidated entity to dismiss the
Executive without notice or has committed any act of fraud, or done any act which bring the
consolidated entity into disrepute;
• The date on which the Executive ceases to be employed by any member of the consolidated entity
(other than due to the occurrence of death or total and permanent disablement); or
• The surrender of the option by the Executive.
Upon the exercise of an option by an Executive, each share issued will rank equally with other shares of
the Company.
The Company may offer to provide such financial assistance to a person in relation to an invitation to
participate in the plan, as the Board may determine from time to time in its discretion.
The rules governing the operation of the plan may be amended, waived or modified, at any time by
resolution of the Board provided there is no reduction of rights to Executives in the plan. If an amendment
reduces the rights of Executives in the plan, it requires written consent of three-quarters of affected
Executives.
The plan may be terminated or suspended at any time by a resolution of the Board, provided the
termination or suspension does not materially adversely affect the rights of persons holding shares issued
under the plan at that time.
Nil options were granted in current year.
2008 allocation
2,500 000 options were issued to Stephen Harrison on 18 January 2008. The terms and conditions of the
issue are disclosed at Note 35. The theoretical value of the options was calculated as being $0.10 per
option.
The Black & Scholes methodology was used to value the options. The valuation was based using the
following assumptions:
• The risk free rate is 6.3% with a maturity date approximating that of the expiration period of the
options;
• The underlying security price used for the purposes of this valuation is $0.52, which is the closing price
of the shares as at 18 January 2008;
• For the purposes of the valuation, no future dividend payments have been forecast;
• The volatility of the Company’s shares is 45.00% (based on a 4 year historical volatility); and
• For the purposes of the valuation it is assumed that the options will not be exercised any earlier than
the expiry date.
• The exercise price was 70 cents
For
per
sona
l use
onl
y
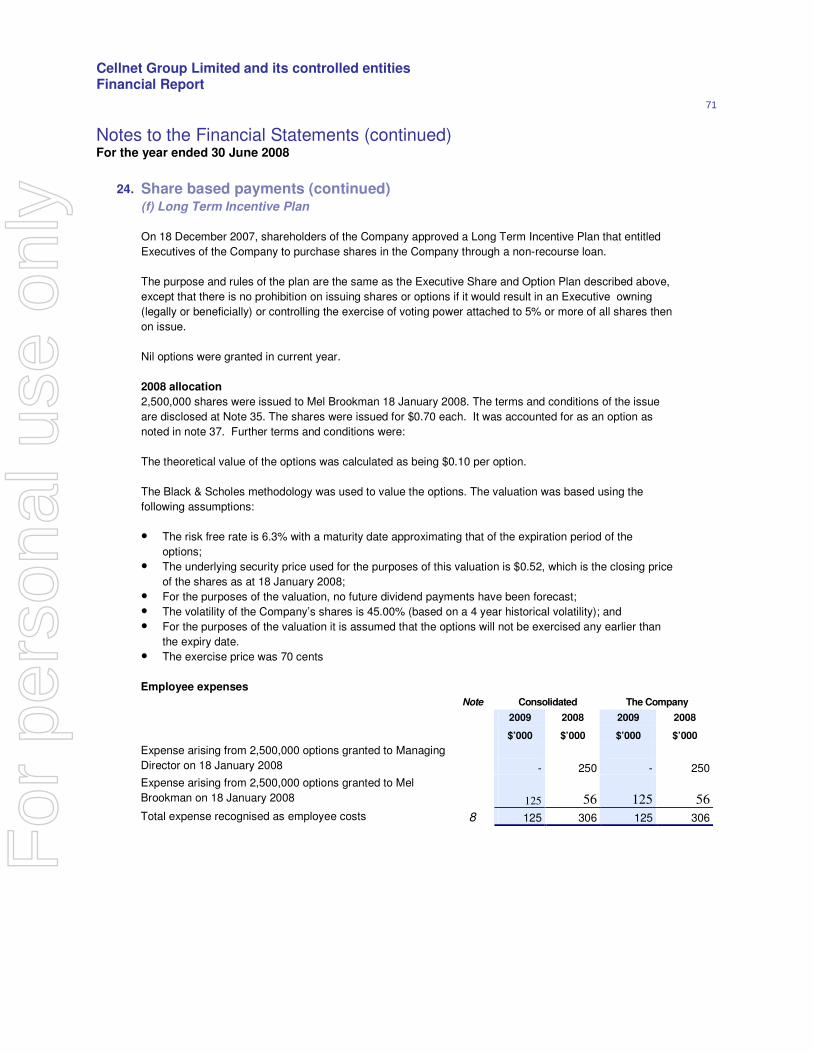
Cellnet Group Limited and its controlled entities Financial Report
71
Notes to the Financial Statements (continued) For the year ended 30 June 2008
24. Share based payments (continued) (f) Long Term Incentive Plan
On 18 December 2007, shareholders of the Company approved a Long Term Incentive Plan that entitled
Executives of the Company to purchase shares in the Company through a non-recourse loan.
The purpose and rules of the plan are the same as the Executive Share and Option Plan described above,
except that there is no prohibition on issuing shares or options if it would result in an Executive owning
(legally or beneficially) or controlling the exercise of voting power attached to 5% or more of all shares then
on issue.
Nil options were granted in current year.
2008 allocation
2,500,000 shares were issued to Mel Brookman 18 January 2008. The terms and conditions of the issue
are disclosed at Note 35. The shares were issued for $0.70 each. It was accounted for as an option as
noted in note 37. Further terms and conditions were:
The theoretical value of the options was calculated as being $0.10 per option.
The Black & Scholes methodology was used to value the options. The valuation was based using the
following assumptions:
• The risk free rate is 6.3% with a maturity date approximating that of the expiration period of the
options;
• The underlying security price used for the purposes of this valuation is $0.52, which is the closing price
of the shares as at 18 January 2008;
• For the purposes of the valuation, no future dividend payments have been forecast;
• The volatility of the Company’s shares is 45.00% (based on a 4 year historical volatility); and
• For the purposes of the valuation it is assumed that the options will not be exercised any earlier than
the expiry date.
• The exercise price was 70 cents
Employee expenses
Note Consolidated The Company
2009 2008 2009 2008
$’000 $’000 $’000 $’000
Expense arising from 2,500,000 options granted to Managing
Director on 18 January 2008
-
250
-
250
Expense arising from 2,500,000 options granted to Mel
Brookman on 18 January 2008
125
56
125
56
Total expense recognised as employee costs 8 125 306 125 306
F
or p
erso
nal u
se o
nly
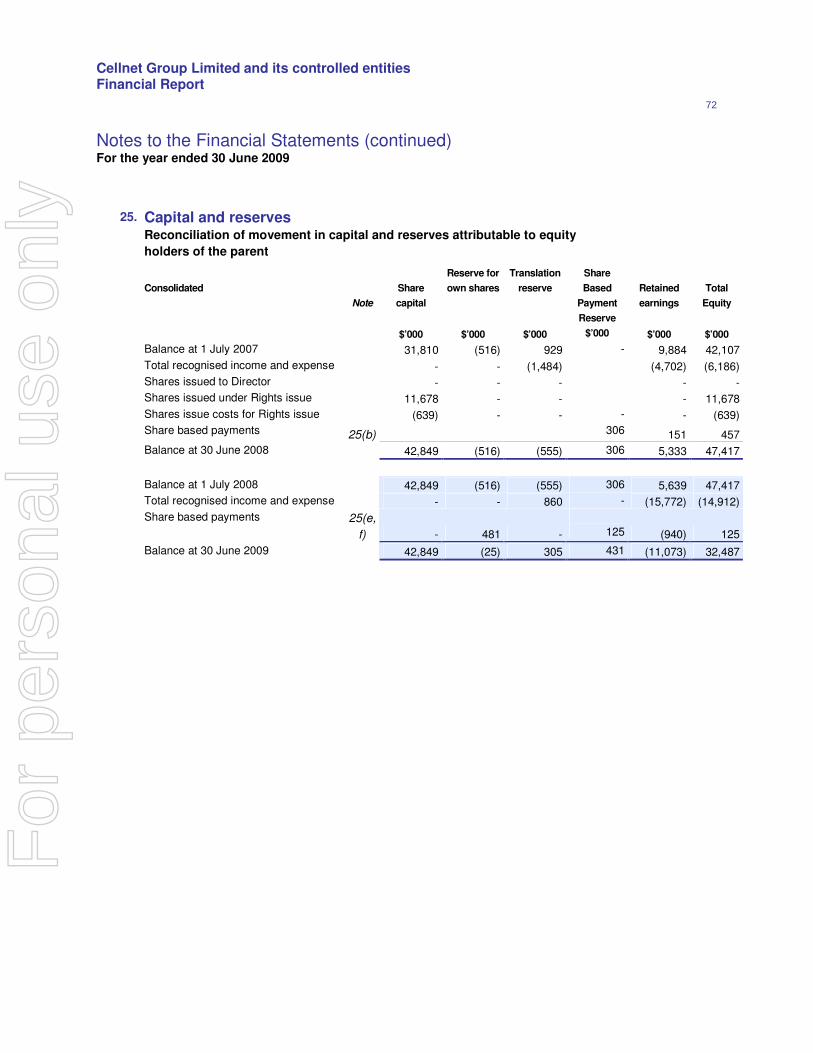
Cellnet Group Limited and its controlled entities Financial Report
72
Notes to the Financial Statements (continued) For the year ended 30 June 2009
25.
Capital and reserves
Reconciliation of movement in capital and reserves attributable to equity
holders of the parent
Consolidated
Note
Share
capital
Reserve for
own shares
Translation
reserve
Share
Based
Payment
Reserve
Retained
earnings
Total
Equity
$’000 $’000 $’000 $’000 $’000 $’000
Balance at 1 July 2007 31,810 (516) 929 - 9,884 42,107
Total recognised income and expense - - (1,484) (4,702) (6,186)
Shares issued to Director - - - - -
Shares issued under Rights issue 11,678 - - - 11,678
Shares issue costs for Rights issue (639) - - - - (639)
Share based payments 25(b) 306 151 457
Balance at 30 June 2008 42,849 (516) (555) 306 5,333 47,417
Balance at 1 July 2008 42,849 (516) (555) 306 5,639 47,417
Total recognised income and expense - - 860 - (15,772) (14,912)
Share based payments 25(e,
f) - 481 -
125 (940) 125
Balance at 30 June 2009 42,849 (25) 305 431 (11,073) 32,487
For
per
sona
l use
onl
y
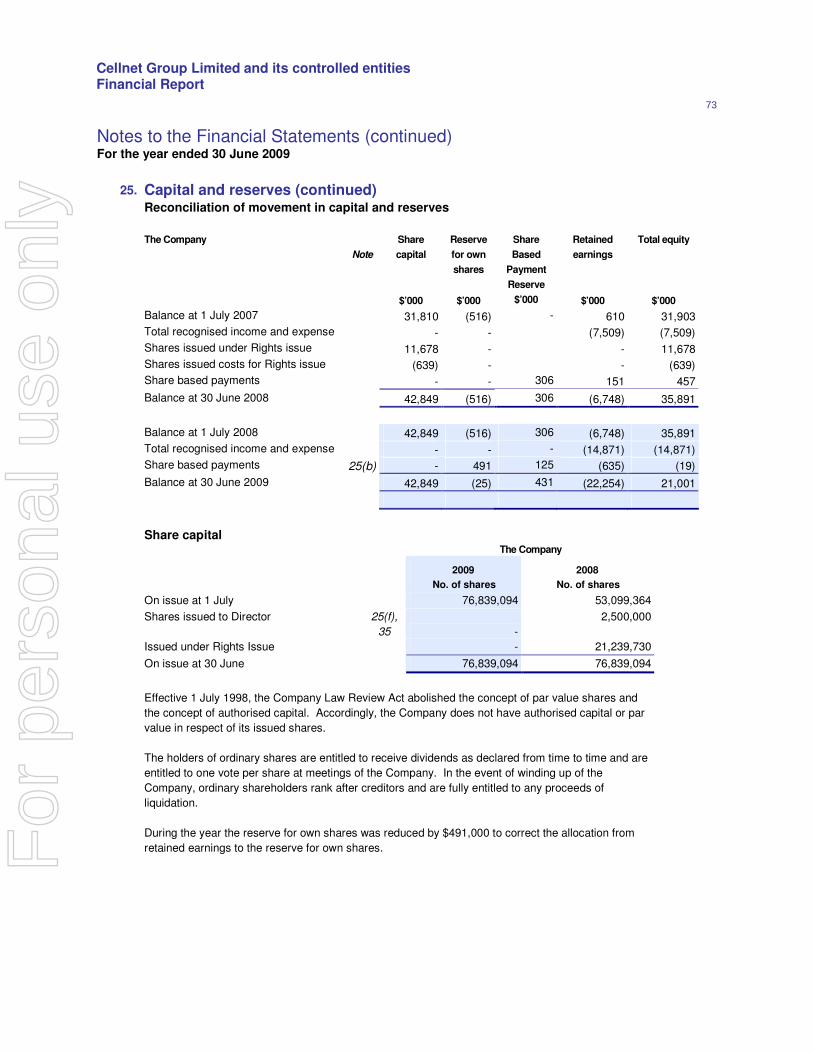
Cellnet Group Limited and its controlled entities Financial Report
73
Notes to the Financial Statements (continued) For the year ended 30 June 2009
25. Capital and reserves (continued)
Reconciliation of movement in capital and reserves
The Company
Note
Share
capital
Reserve
for own
shares
Share
Based
Payment
Reserve
Retained
earnings
Total equity
$’000 $’000 $’000 $’000 $’000
Balance at 1 July 2007 31,810 (516) - 610 31,903
Total recognised income and expense - - (7,509) (7,509)
Shares issued under Rights issue 11,678 - - 11,678
Shares issued costs for Rights issue (639) - - (639)
Share based payments - - 306 151 457
Balance at 30 June 2008 42,849 (516) 306 (6,748) 35,891
Balance at 1 July 2008 42,849 (516) 306 (6,748) 35,891
Total recognised income and expense - - - (14,871) (14,871)
Share based payments 25(b) - 491 125 (635) (19)
Balance at 30 June 2009 42,849 (25) 431 (22,254) 21,001
Share capital
The Company
2009 2008
No. of shares No. of shares
On issue at 1 July 76,839,094 53,099,364
Shares issued to Director 25(f),
35
-
2,500,000
Issued under Rights Issue - 21,239,730
On issue at 30 June 76,839,094 76,839,094
Effective 1 July 1998, the Company Law Review Act abolished the concept of par value shares and
the concept of authorised capital. Accordingly, the Company does not have authorised capital or par
value in respect of its issued shares.
The holders of ordinary shares are entitled to receive dividends as declared from time to time and are
entitled to one vote per share at meetings of the Company. In the event of winding up of the
Company, ordinary shareholders rank after creditors and are fully entitled to any proceeds of
liquidation.
During the year the reserve for own shares was reduced by $491,000 to correct the allocation from
retained earnings to the reserve for own shares. For
per
sona
l use
onl
y
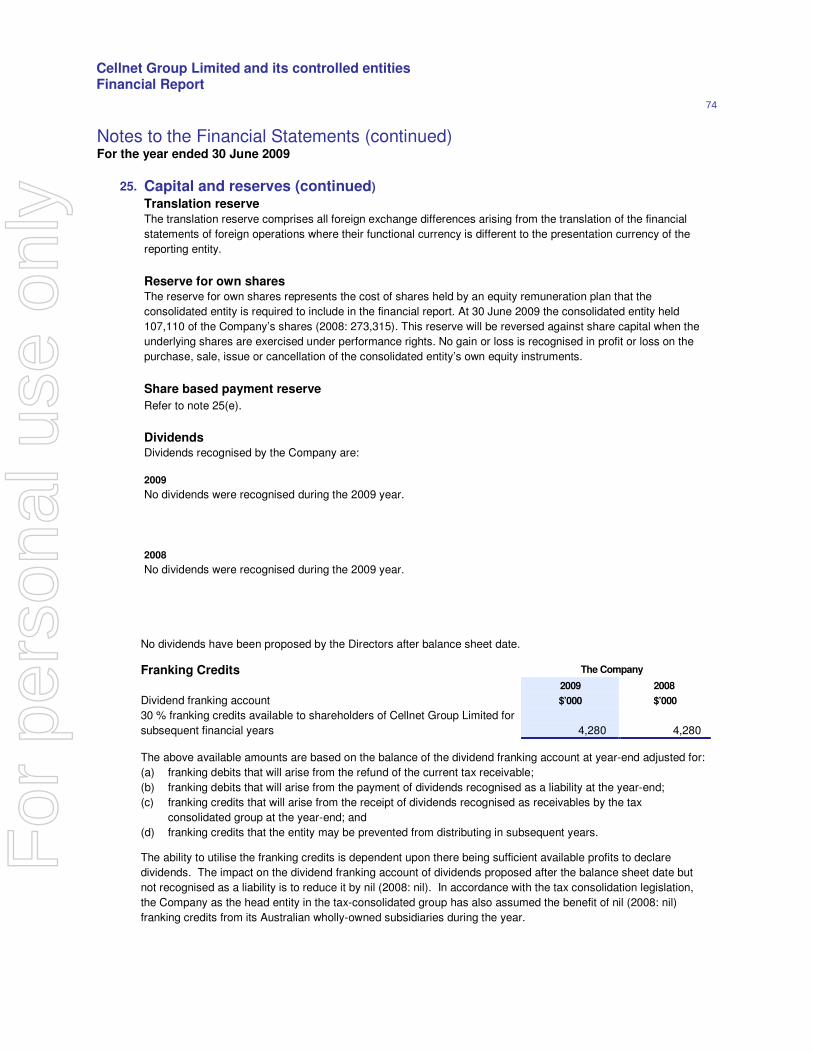
Cellnet Group Limited and its controlled entities Financial Report
74
Notes to the Financial Statements (continued) For the year ended 30 June 2009
25. Capital and reserves (continued)
Translation reserve
The translation reserve comprises all foreign exchange differences arising from the translation of the financial
statements of foreign operations where their functional currency is different to the presentation currency of the
reporting entity.
Reserve for own shares
The reserve for own shares represents the cost of shares held by an equity remuneration plan that the
consolidated entity is required to include in the financial report. At 30 June 2009 the consolidated entity held
107,110 of the Company’s shares (2008: 273,315). This reserve will be reversed against share capital when the
underlying shares are exercised under performance rights. No gain or loss is recognised in profit or loss on the
purchase, sale, issue or cancellation of the consolidated entity’s own equity instruments.
Share based payment reserve
Refer to note 25(e).
Dividends Dividends recognised by the Company are:
2009
No dividends were recognised during the 2009 year.
2008
No dividends were recognised during the 2009 year.
No dividends have been proposed by the Directors after balance sheet date.
Franking Credits The Company
2009 2008
Dividend franking account $’000 $’000
30 % franking credits available to shareholders of Cellnet Group Limited for
subsequent financial years
4,280
4,280
The above available amounts are based on the balance of the dividend franking account at year-end adjusted for:
(a) franking debits that will arise from the refund of the current tax receivable;
(b) franking debits that will arise from the payment of dividends recognised as a liability at the year-end;
(c) franking credits that will arise from the receipt of dividends recognised as receivables by the tax
consolidated group at the year-end; and
(d) franking credits that the entity may be prevented from distributing in subsequent years.
The ability to utilise the franking credits is dependent upon there being sufficient available profits to declare
dividends. The impact on the dividend franking account of dividends proposed after the balance sheet date but
not recognised as a liability is to reduce it by nil (2008: nil). In accordance with the tax consolidation legislation,
the Company as the head entity in the tax-consolidated group has also assumed the benefit of nil (2008: nil)
franking credits from its Australian wholly-owned subsidiaries during the year.
For
per
sona
l use
onl
y
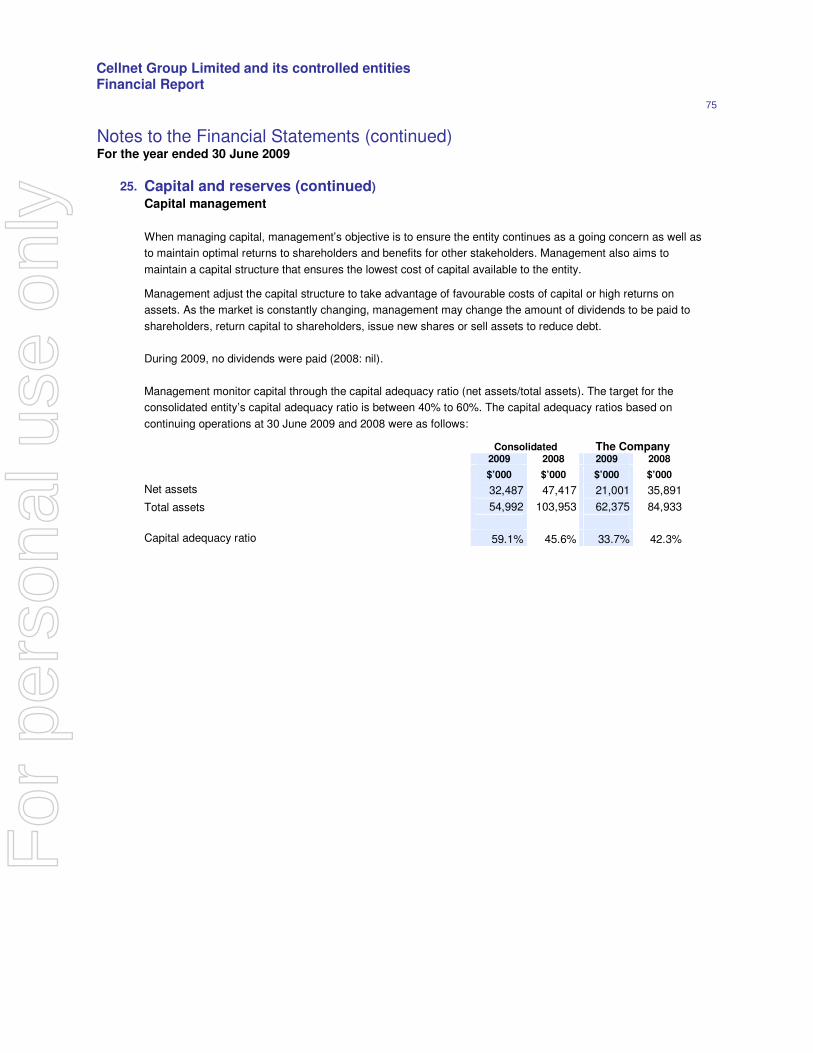
Cellnet Group Limited and its controlled entities Financial Report
75
Notes to the Financial Statements (continued) For the year ended 30 June 2009
25. Capital and reserves (continued)
Capital management
When managing capital, management’s objective is to ensure the entity continues as a going concern as well as
to maintain optimal returns to shareholders and benefits for other stakeholders. Management also aims to
maintain a capital structure that ensures the lowest cost of capital available to the entity.
Management adjust the capital structure to take advantage of favourable costs of capital or high returns on
assets. As the market is constantly changing, management may change the amount of dividends to be paid to
shareholders, return capital to shareholders, issue new shares or sell assets to reduce debt.
During 2009, no dividends were paid (2008: nil).
Management monitor capital through the capital adequacy ratio (net assets/total assets). The target for the
consolidated entity’s capital adequacy ratio is between 40% to 60%. The capital adequacy ratios based on
continuing operations at 30 June 2009 and 2008 were as follows:
Consolidated The Company 2009 2008 2009 2008
$’000 $’000 $’000 $’000
Net assets 32,487 47,417 21,001 35,891
Total assets 54,992 103,953 62,375 84,933
Capital adequacy ratio 59.1% 45.6% 33.7% 42.3%
For
per
sona
l use
onl
y
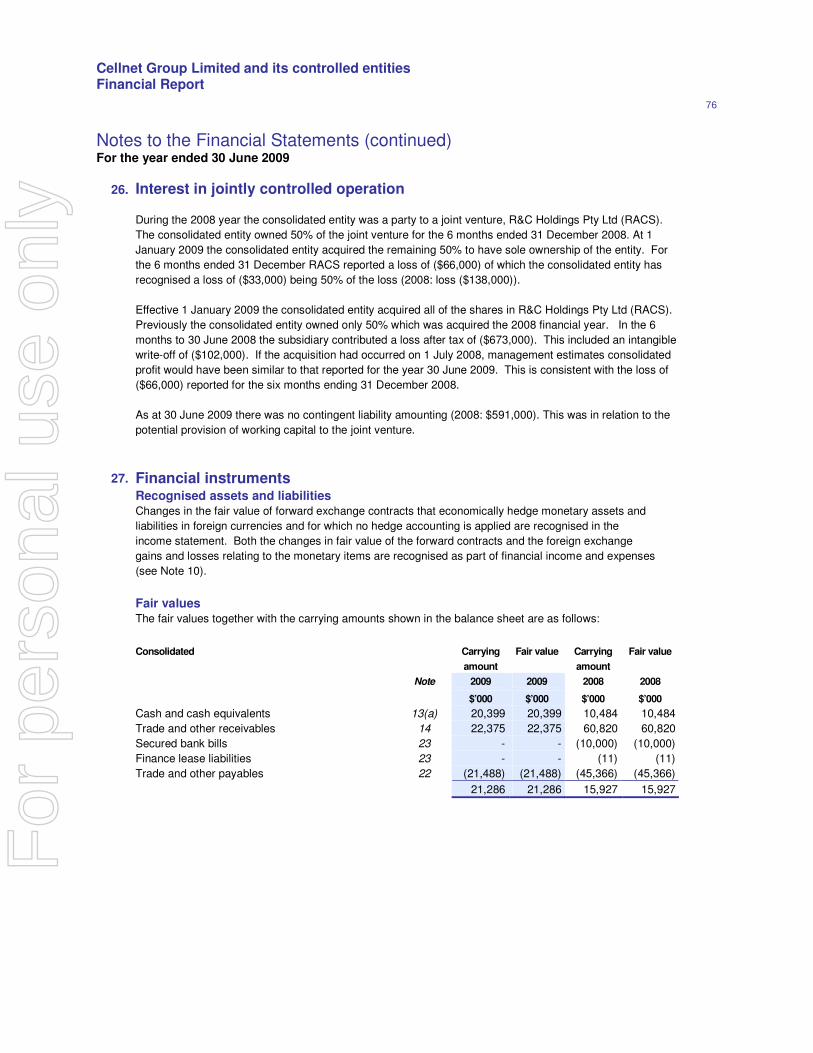
Cellnet Group Limited and its controlled entities Financial Report
76
26. Interest in jointly controlled operation
During the 2008 year the consolidated entity was a party to a joint venture, R&C Holdings Pty Ltd (RACS).
The consolidated entity owned 50% of the joint venture for the 6 months ended 31 December 2008. At 1
January 2009 the consolidated entity acquired the remaining 50% to have sole ownership of the entity. For
the 6 months ended 31 December RACS reported a loss of ($66,000) of which the consolidated entity has
recognised a loss of ($33,000) being 50% of the loss (2008: loss ($138,000)).
Effective 1 January 2009 the consolidated entity acquired all of the shares in R&C Holdings Pty Ltd (RACS).
Previously the consolidated entity owned only 50% which was acquired the 2008 financial year. In the 6
months to 30 June 2008 the subsidiary contributed a loss after tax of ($673,000). This included an intangible
write-off of ($102,000). If the acquisition had occurred on 1 July 2008, management estimates consolidated
profit would have been similar to that reported for the year 30 June 2009. This is consistent with the loss of
($66,000) reported for the six months ending 31 December 2008.
As at 30 June 2009 there was no contingent liability amounting (2008: $591,000). This was in relation to the
potential provision of working capital to the joint venture.
27. Financial instruments
Recognised assets and liabilities
Changes in the fair value of forward exchange contracts that economically hedge monetary assets and
liabilities in foreign currencies and for which no hedge accounting is applied are recognised in the
income statement. Both the changes in fair value of the forward contracts and the foreign exchange
gains and losses relating to the monetary items are recognised as part of financial income and expenses
(see Note 10).
Fair values
The fair values together with the carrying amounts shown in the balance sheet are as follows:
Consolidated Carrying
amount
Fair value Carrying
amount
Fair value
Note 2009 2009 2008 2008
$’000 $’000 $’000 $’000
Cash and cash equivalents 13(a) 20,399 20,399 10,484 10,484
Trade and other receivables 14 22,375 22,375 60,820 60,820
Secured bank bills 23 - - (10,000) (10,000)
Finance lease liabilities 23 - - (11) (11)
Trade and other payables 22 (21,488) (21,488) (45,366) (45,366)
21,286 21,286 15,927 15,927
Notes to the Financial Statements (continued) For the year ended 30 June 2009
For
per
sona
l use
onl
y
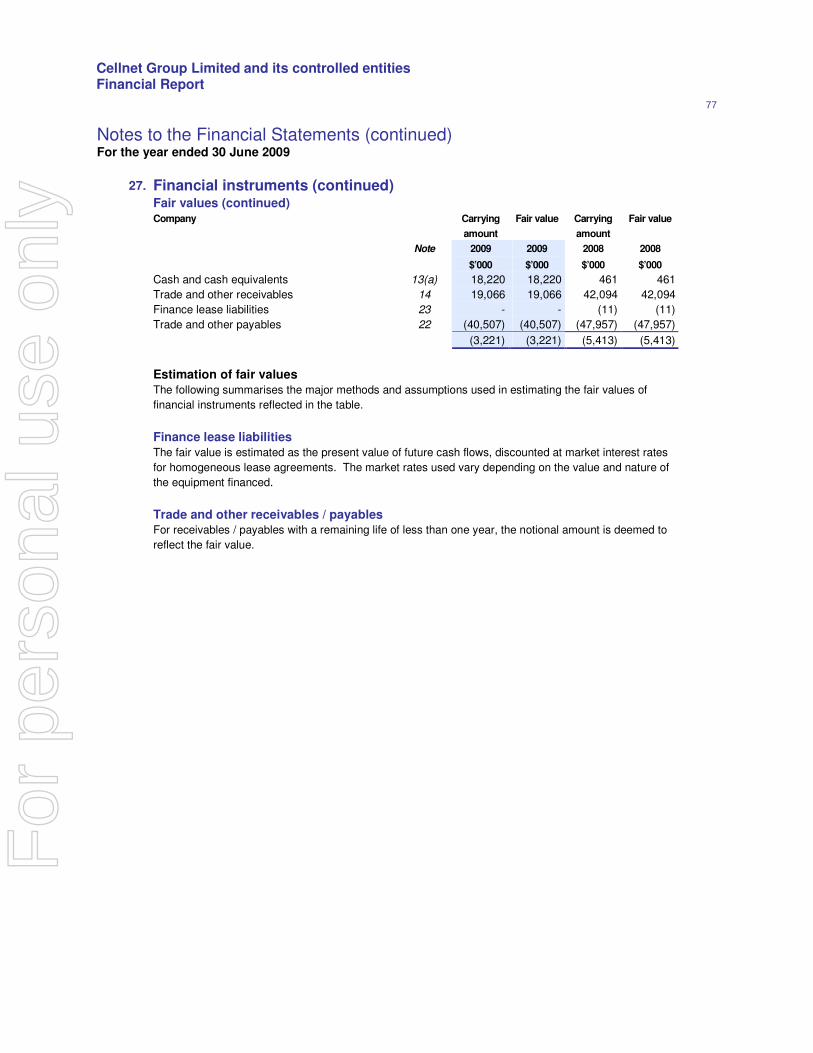
Cellnet Group Limited and its controlled entities Financial Report
77
Notes to the Financial Statements (continued) For the year ended 30 June 2009
27. Financial instruments (continued)
Fair values (continued)
Company Carrying
amount
Fair value Carrying
amount
Fair value
Note 2009 2009 2008 2008
$’000 $’000 $’000 $’000
Cash and cash equivalents 13(a) 18,220 18,220 461 461
Trade and other receivables 14 19,066 19,066 42,094 42,094
Finance lease liabilities 23 - - (11) (11)
Trade and other payables 22 (40,507) (40,507) (47,957) (47,957)
(3,221) (3,221) (5,413) (5,413)
Estimation of fair values
The following summarises the major methods and assumptions used in estimating the fair values of
financial instruments reflected in the table.
Finance lease liabilities
The fair value is estimated as the present value of future cash flows, discounted at market interest rates
for homogeneous lease agreements. The market rates used vary depending on the value and nature of
the equipment financed.
Trade and other receivables / payables
For receivables / payables with a remaining life of less than one year, the notional amount is deemed to
reflect the fair value.
For
per
sona
l use
onl
y
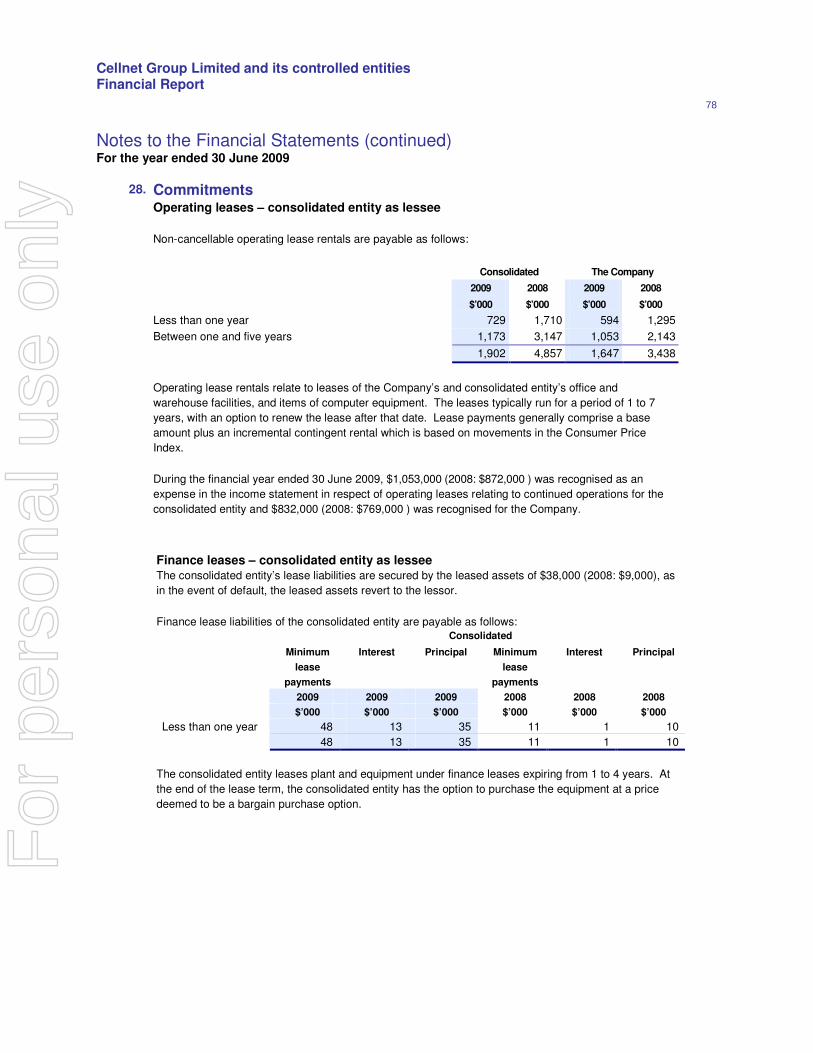
Cellnet Group Limited and its controlled entities Financial Report
78
Notes to the Financial Statements (continued) For the year ended 30 June 2009
28.
Commitments
Operating leases – consolidated entity as lessee
Non-cancellable operating lease rentals are payable as follows:
Consolidated The Company
2009 2008 2009 2008
$’000 $’000 $’000 $’000
Less than one year 729 1,710 594 1,295
Between one and five years 1,173 3,147 1,053 2,143
1,902 4,857 1,647 3,438
Operating lease rentals relate to leases of the Company’s and consolidated entity’s office and
warehouse facilities, and items of computer equipment. The leases typically run for a period of 1 to 7
years, with an option to renew the lease after that date. Lease payments generally comprise a base
amount plus an incremental contingent rental which is based on movements in the Consumer Price
Index.
During the financial year ended 30 June 2009, $1,053,000 (2008: $872,000 ) was recognised as an
expense in the income statement in respect of operating leases relating to continued operations for the
consolidated entity and $832,000 (2008: $769,000 ) was recognised for the Company.
Finance leases – consolidated entity as lessee The consolidated entity’s lease liabilities are secured by the leased assets of $38,000 (2008: $9,000), as
in the event of default, the leased assets revert to the lessor.
Finance lease liabilities of the consolidated entity are payable as follows:
Consolidated
Minimum
lease
payments
Interest Principal Minimum
lease
payments
Interest Principal
2009 2009 2009 2008 2008 2008
$’000 $’000 $’000 $’000 $’000 $’000
Less than one year 48 13 35 11 1 10
48 13 35 11 1 10
The consolidated entity leases plant and equipment under finance leases expiring from 1 to 4 years. At
the end of the lease term, the consolidated entity has the option to purchase the equipment at a price
deemed to be a bargain purchase option.
For
per
sona
l use
onl
y
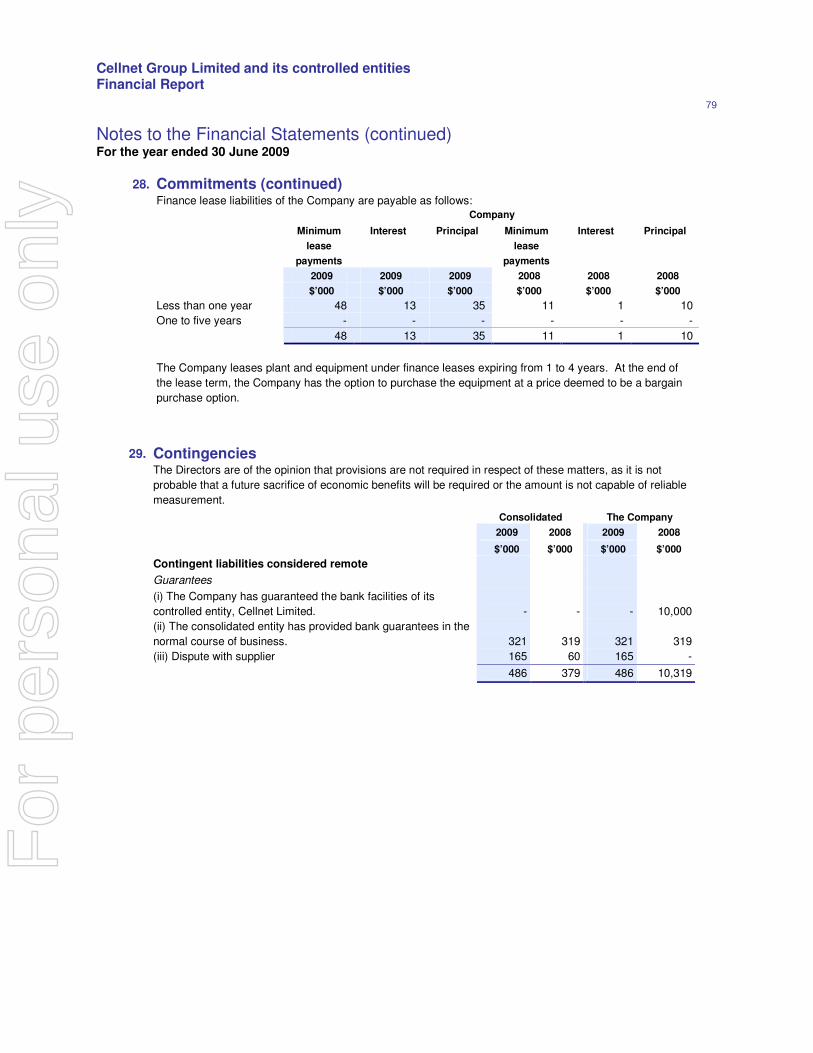
Cellnet Group Limited and its controlled entities Financial Report
79
Notes to the Financial Statements (continued) For the year ended 30 June 2009
28. Commitments (continued) Finance lease liabilities of the Company are payable as follows:
Company
Minimum
lease
payments
Interest Principal Minimum
lease
payments
Interest Principal
2009 2009 2009 2008 2008 2008
$’000 $’000 $’000 $’000 $’000 $’000
Less than one year 48 13 35 11 1 10
One to five years - - - - - -
48 13 35 11 1 10
The Company leases plant and equipment under finance leases expiring from 1 to 4 years. At the end of
the lease term, the Company has the option to purchase the equipment at a price deemed to be a bargain
purchase option.
29. Contingencies
The Directors are of the opinion that provisions are not required in respect of these matters, as it is not
probable that a future sacrifice of economic benefits will be required or the amount is not capable of reliable
measurement.
Consolidated The Company
2009 2008 2009 2008
$’000 $’000 $’000 $’000
Contingent liabilities considered remote
Guarantees
(i) The Company has guaranteed the bank facilities of its
controlled entity, Cellnet Limited.
-
-
-
10,000
(ii) The consolidated entity has provided bank guarantees in the
normal course of business.
321
319
321
319
(iii) Dispute with supplier 165 60 165 -
486 379 486 10,319
For
per
sona
l use
onl
y
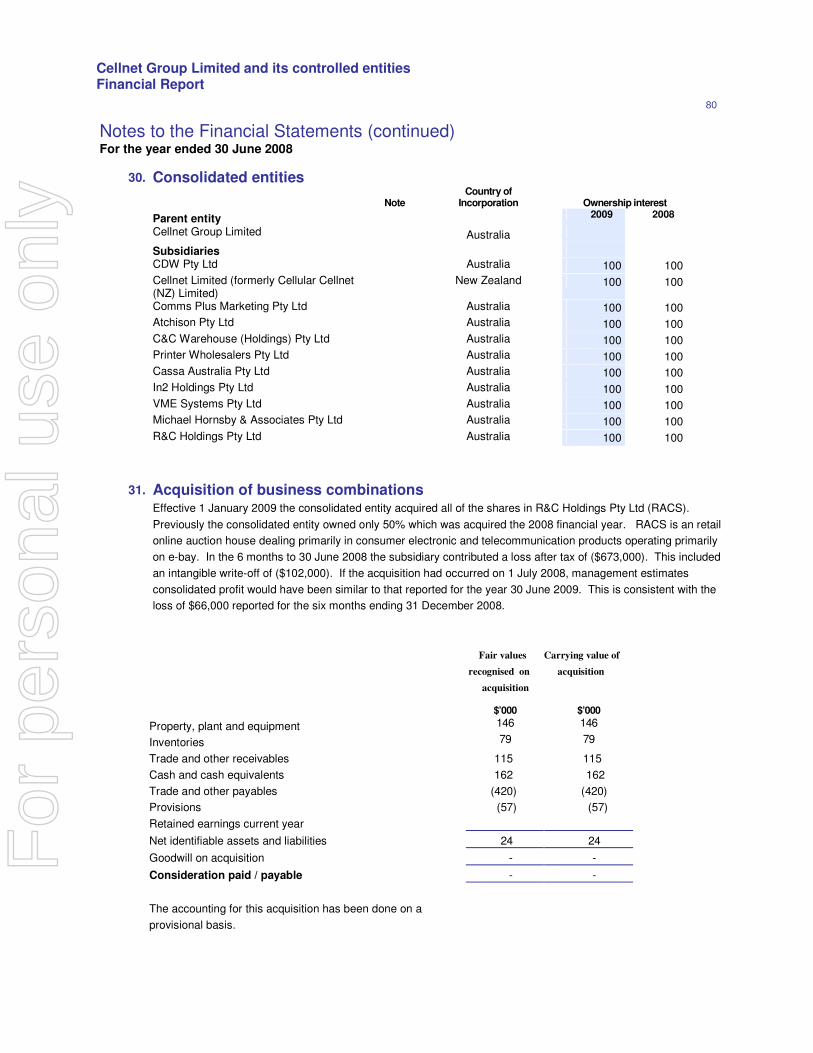
Cellnet Group Limited and its controlled entities Financial Report
80
Notes to the Financial Statements (continued) For the year ended 30 June 2008
30. Consolidated entities
Note Country of
Incorporation
Ownership interest Parent entity 2009 2008
Cellnet Group Limited Australia
Subsidiaries
CDW Pty Ltd Australia 100 100
Cellnet Limited (formerly Cellular Cellnet (NZ) Limited)
New Zealand 100 100
Comms Plus Marketing Pty Ltd Australia 100 100
Atchison Pty Ltd Australia 100 100
C&C Warehouse (Holdings) Pty Ltd Australia 100 100
Printer Wholesalers Pty Ltd Australia 100 100
Cassa Australia Pty Ltd Australia 100 100
In2 Holdings Pty Ltd Australia 100 100 VME Systems Pty Ltd Australia 100 100 Michael Hornsby & Associates Pty Ltd Australia 100 100 R&C Holdings Pty Ltd Australia 100 100
31. Acquisition of business combinations
Effective 1 January 2009 the consolidated entity acquired all of the shares in R&C Holdings Pty Ltd (RACS).
Previously the consolidated entity owned only 50% which was acquired the 2008 financial year. RACS is an retail
online auction house dealing primarily in consumer electronic and telecommunication products operating primarily
on e-bay. In the 6 months to 30 June 2008 the subsidiary contributed a loss after tax of ($673,000). This included
an intangible write-off of ($102,000). If the acquisition had occurred on 1 July 2008, management estimates
consolidated profit would have been similar to that reported for the year 30 June 2009. This is consistent with the
loss of $66,000 reported for the six months ending 31 December 2008.
Fair values
recognised on
acquisition
Carrying value of
acquisition
$’000
$’000
Property, plant and equipment 146 146
Inventories 79 79
Trade and other receivables 115 115
Cash and cash equivalents 162 162
Trade and other payables (420) (420)
Provisions (57) (57)
Retained earnings current year
Net identifiable assets and liabilities 24 24
Goodwill on acquisition - -
Consideration paid / payable - -
The accounting for this acquisition has been done on a
provisional basis.
For
per
sona
l use
onl
y
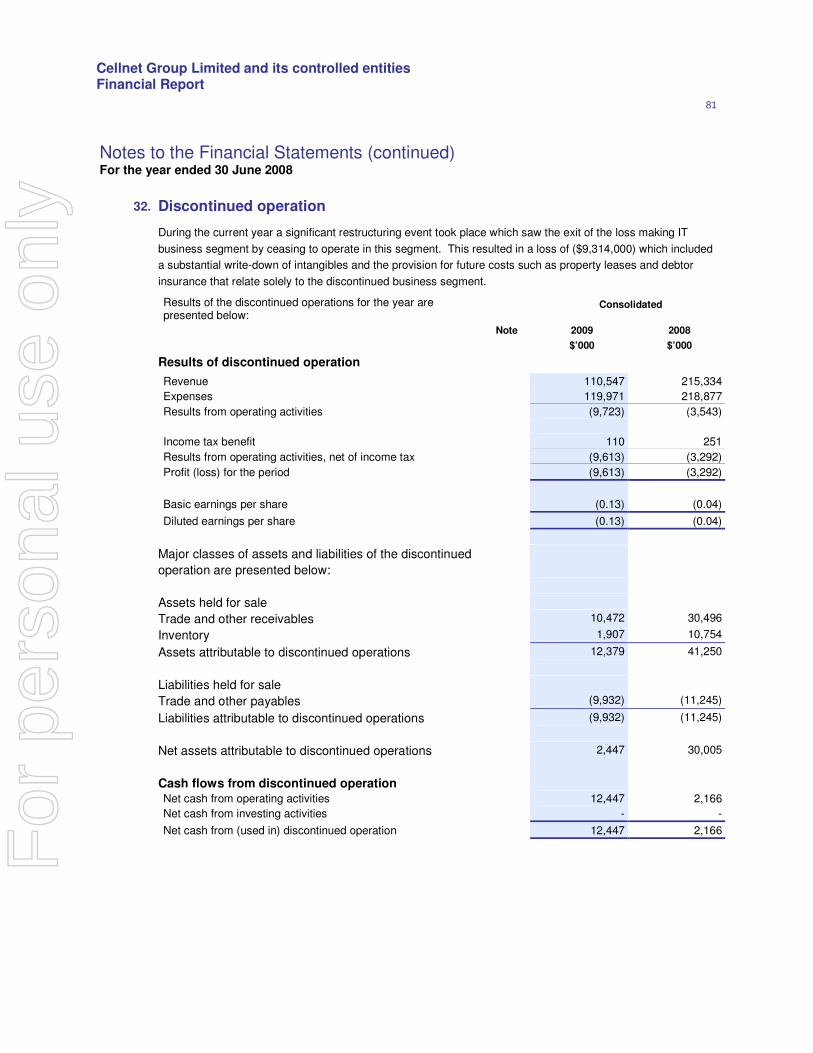
Cellnet Group Limited and its controlled entities Financial Report
81
Notes to the Financial Statements (continued) For the year ended 30 June 2008
32. Discontinued operation
During the current year a significant restructuring event took place which saw the exit of the loss making IT
business segment by ceasing to operate in this segment. This resulted in a loss of ($9,314,000) which included
a substantial write-down of intangibles and the provision for future costs such as property leases and debtor
insurance that relate solely to the discontinued business segment.
Results of the discontinued operations for the year are presented below:
Consolidated
Note 2009 2008
$’000 $’000
Results of discontinued operation Revenue 110,547 215,334
Expenses 119,971 218,877
Results from operating activities (9,723) (3,543)
Income tax benefit 110 251
Results from operating activities, net of income tax (9,613) (3,292)
Profit (loss) for the period (9,613) (3,292)
Basic earnings per share (0.13) (0.04)
Diluted earnings per share (0.13) (0.04)
Major classes of assets and liabilities of the discontinued
operation are presented below:
Assets held for sale
Trade and other receivables 10,472 30,496
Inventory 1,907 10,754
Assets attributable to discontinued operations 12,379 41,250
Liabilities held for sale
Trade and other payables (9,932) (11,245)
Liabilities attributable to discontinued operations (9,932) (11,245)
Net assets attributable to discontinued operations 2,447 30,005
Cash flows from discontinued operation
Net cash from operating activities 12,447 2,166
Net cash from investing activities - -
Net cash from (used in) discontinued operation 12,447 2,166
For
per
sona
l use
onl
y
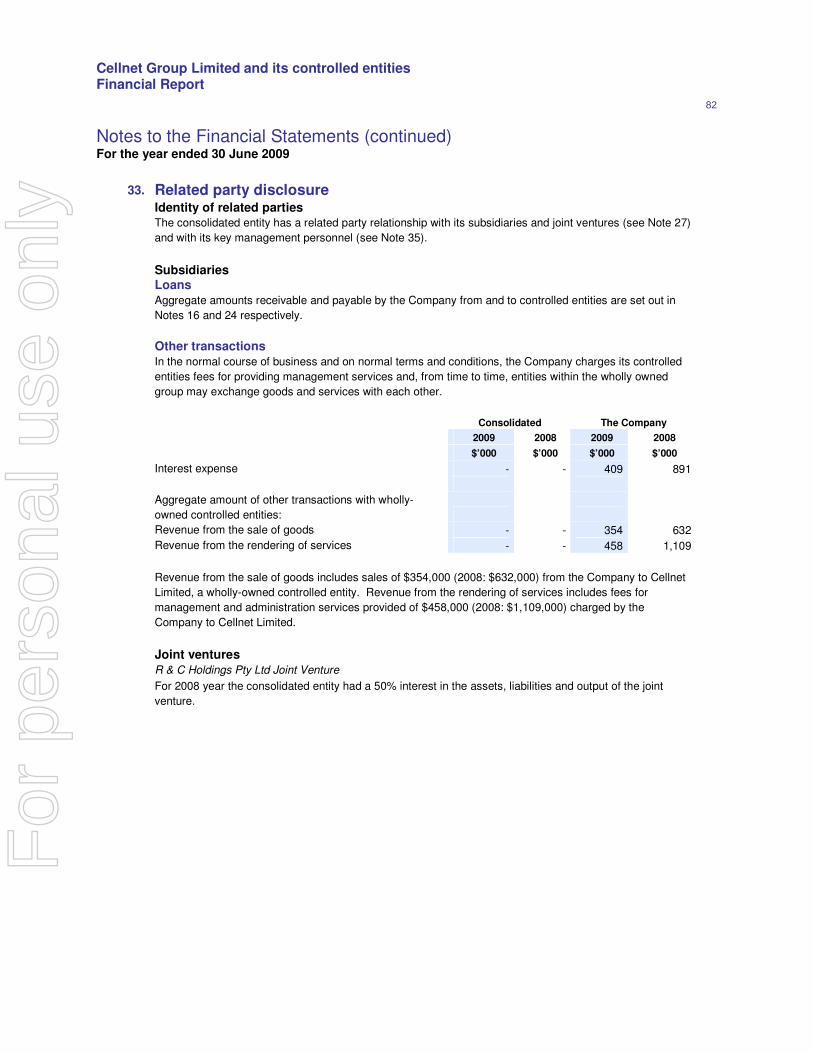
Cellnet Group Limited and its controlled entities Financial Report
82
Notes to the Financial Statements (continued) For the year ended 30 June 2009
33. Related party disclosure
Identity of related parties
The consolidated entity has a related party relationship with its subsidiaries and joint ventures (see Note 27)
and with its key management personnel (see Note 35).
Subsidiaries
Loans
Aggregate amounts receivable and payable by the Company from and to controlled entities are set out in
Notes 16 and 24 respectively.
Other transactions
In the normal course of business and on normal terms and conditions, the Company charges its controlled
entities fees for providing management services and, from time to time, entities within the wholly owned
group may exchange goods and services with each other.
Consolidated The Company
2009 2008 2009 2008
$’000 $’000 $’000 $’000
Interest expense - - 409 891
Aggregate amount of other transactions with wholly-
owned controlled entities:
Revenue from the sale of goods - - 354 632
Revenue from the rendering of services - - 458 1,109
Revenue from the sale of goods includes sales of $354,000 (2008: $632,000) from the Company to Cellnet
Limited, a wholly-owned controlled entity. Revenue from the rendering of services includes fees for
management and administration services provided of $458,000 (2008: $1,109,000) charged by the
Company to Cellnet Limited.
Joint ventures
R & C Holdings Pty Ltd Joint Venture
For 2008 year the consolidated entity had a 50% interest in the assets, liabilities and output of the joint
venture.
For
per
sona
l use
onl
y
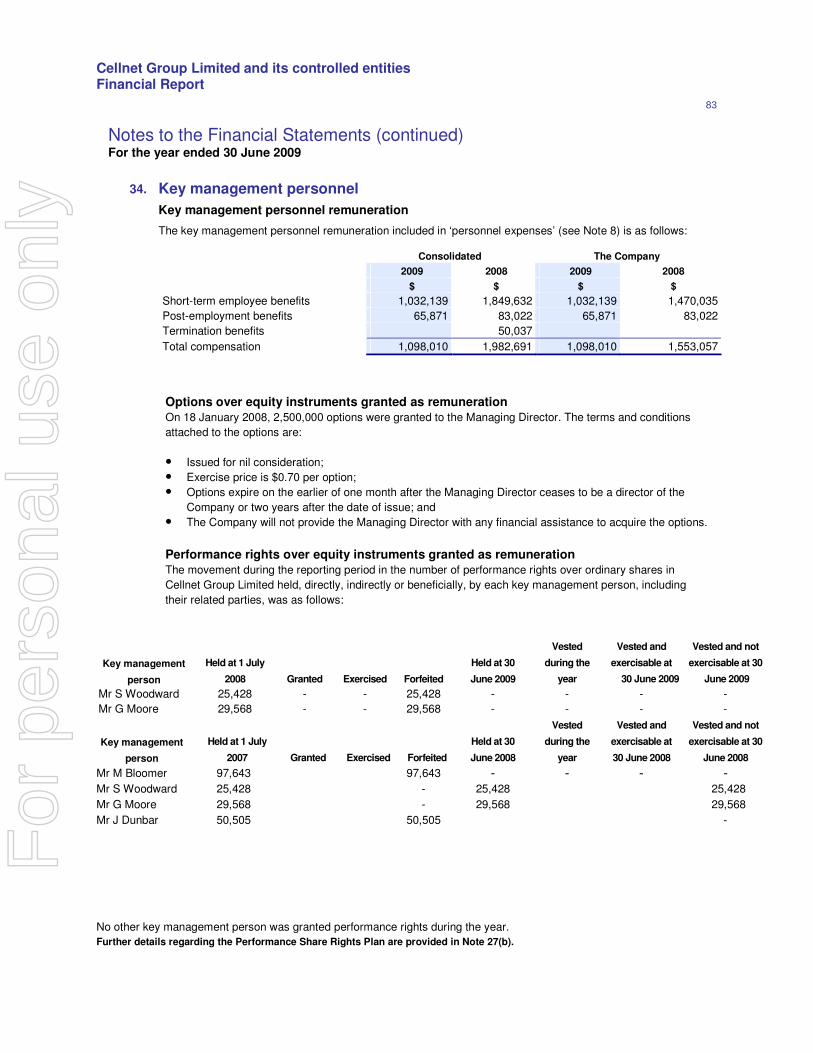
Cellnet Group Limited and its controlled entities Financial Report
83
Notes to the Financial Statements (continued) For the year ended 30 June 2009
34. Key management personnel
Key management personnel remuneration
The key management personnel remuneration included in ‘personnel expenses’ (see Note 8) is as follows:
Consolidated The Company
2009 2008 2009 2008
$ $ $ $
Short-term employee benefits 1,032,139 1,849,632 1,032,139 1,470,035
Post-employment benefits 65,871 83,022 65,871 83,022
Termination benefits 50,037
Total compensation 1,098,010 1,982,691 1,098,010 1,553,057
No other key management person was granted performance rights during the year.
Further details regarding the Performance Share Rights Plan are provided in Note 27(b).
Options over equity instruments granted as remuneration
On 18 January 2008, 2,500,000 options were granted to the Managing Director. The terms and conditions
attached to the options are:
• Issued for nil consideration;
• Exercise price is $0.70 per option;
• Options expire on the earlier of one month after the Managing Director ceases to be a director of the
Company or two years after the date of issue; and
• The Company will not provide the Managing Director with any financial assistance to acquire the options.
Performance rights over equity instruments granted as remuneration
The movement during the reporting period in the number of performance rights over ordinary shares in
Cellnet Group Limited held, directly, indirectly or beneficially, by each key management person, including
their related parties, was as follows:
Key management
person
Held at 1 July
2008 Granted Exercised Forfeited
Held at 30
June 2009
Vested
during the
year
Vested and
exercisable at
30 June 2009
Vested and not
exercisable at 30
June 2009
Mr S Woodward 25,428 - - 25,428 - - - -
Mr G Moore 29,568 - - 29,568 - - - -
Key management
person
Held at 1 July
2007 Granted Exercised Forfeited
Held at 30
June 2008
Vested
during the
year
Vested and
exercisable at
30 June 2008
Vested and not
exercisable at 30
June 2008
Mr M Bloomer 97,643 97,643 - - - - Mr S Woodward 25,428 - 25,428 25,428
Mr G Moore 29,568 - 29,568 29,568
Mr J Dunbar 50,505 50,505 -
For
per
sona
l use
onl
y
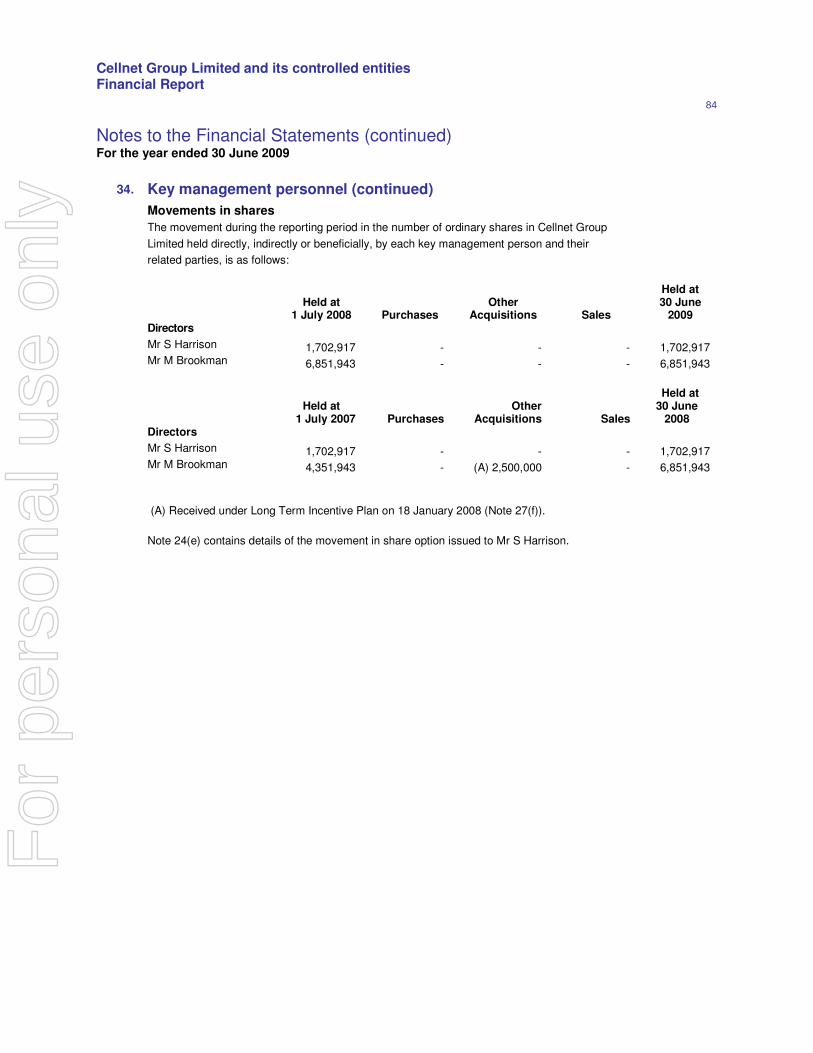
Cellnet Group Limited and its controlled entities Financial Report
84
Notes to the Financial Statements (continued) For the year ended 30 June 2009
34. Key management personnel (continued)
Movements in shares
The movement during the reporting period in the number of ordinary shares in Cellnet Group
Limited held directly, indirectly or beneficially, by each key management person and their
related parties, is as follows:
Held at 1 July 2008 Purchases
Other Acquisitions Sales
Held at 30 June
2009
Directors
Mr S Harrison 1,702,917 - - - 1,702,917
Mr M Brookman 6,851,943 - - - 6,851,943
Held at
1 July 2007 Purchases Other
Acquisitions Sales
Held at 30 June
2008
Directors
Mr S Harrison 1,702,917 - - - 1,702,917
Mr M Brookman 4,351,943 - (A) 2,500,000 - 6,851,943 (A) Received under Long Term Incentive Plan on 18 January 2008 (Note 27(f)).
Note 24(e) contains details of the movement in share option issued to Mr S Harrison.
For
per
sona
l use
onl
y
Cellnet Group Limited and its controlled entities Financial Report
85
Notes to the Financial Statements (continued) For the year ended 30 June 2009
34. Key management personnel (continued)
Loans to / from key management personnel and their related parties (consolidated)
A loan of $1,750,000 was provided to M. Brookman in accordance with the Long Term Incentive Plan on 18
January 2008 to fund the purchase of 2,500,000 million Company shares. This loan was a non-recourrse loan
and was approved by shareholders at the AGM held on 18 December 2007. The terms of the loan are as
follows:
• The loan shall be payable in full within two years after the date on which the loan was advanced, or within a
maximum of seven years if the Company so determines, or shall become immediately due and payable
upon:
1. The Board determining that the borrower has, in the Board’s opinion, been dismissed or removed
from office or done any act which brings the Company into disrepute; and
2. The resignation of the borrower from the position of Director of the Company or any subsidiary of
the Company.
• The borrower must pay principal and interest repayments in each financial year which are at least equal to
the minimum yearly repayments for such a loan calculated in accordance with sections 109E and 109N of
the Tax Act.
• Interest rate applicable on the loan is equal to the benchmark interest rate in accordance with section
109N(2) of the Tax Act.
• As security for the loan and interest payable on the loan, the borrower must grant to the Company a pledge
of the shares acquired with the loan.
For
per
sona
l use
onl
y
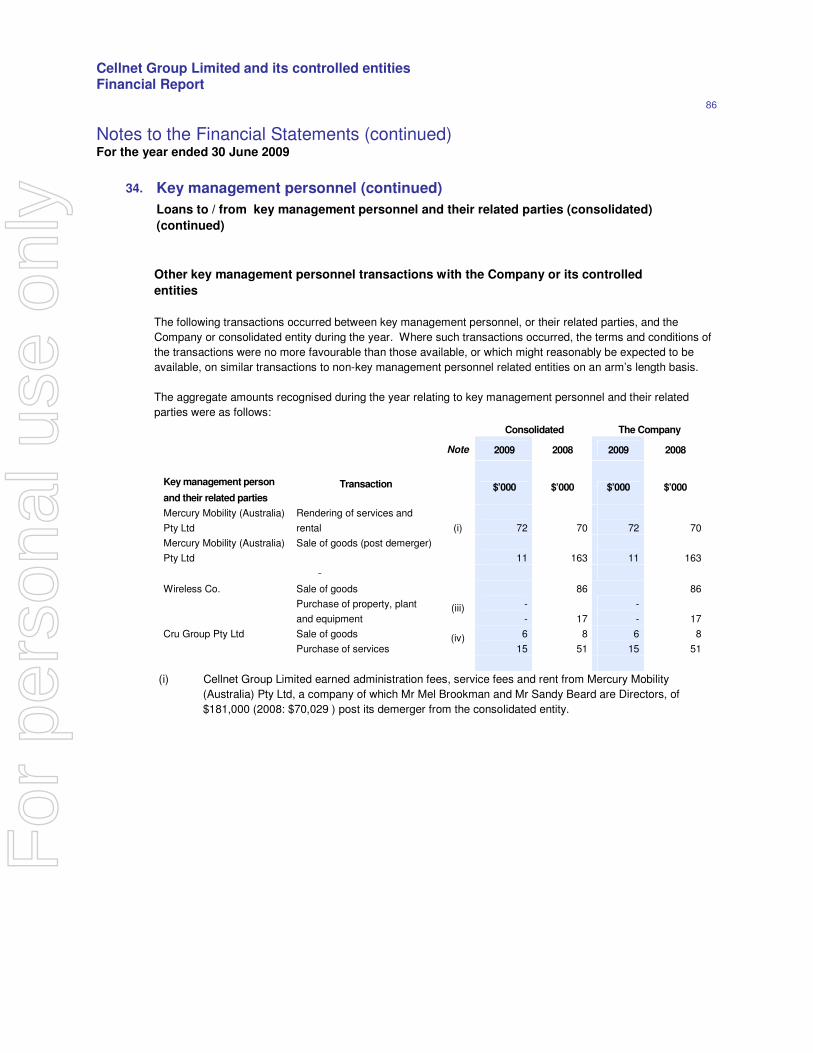
Cellnet Group Limited and its controlled entities Financial Report
86
Other key management personnel transactions with the Company or its controlled
entities
The following transactions occurred between key management personnel, or their related parties, and the
Company or consolidated entity during the year. Where such transactions occurred, the terms and conditions of
the transactions were no more favourable than those available, or which might reasonably be expected to be
available, on similar transactions to non-key management personnel related entities on an arm’s length basis.
The aggregate amounts recognised during the year relating to key management personnel and their related
parties were as follows:
Notes to the Financial Statements (continued) For the year ended 30 June 2009
34. Key management personnel (continued)
Loans to / from key management personnel and their related parties (consolidated)
(continued)
Consolidated The Company
Note 2009 2008 2009 2008
Key management person
and their related parties
Transaction
$’000 $’000 $’000 $’000
Mercury Mobility (Australia)
Pty Ltd
Rendering of services and
rental (i)
72
70
72
70
Mercury Mobility (Australia)
Pty Ltd
Sale of goods (post demerger)
11
163
11
163
-
Wireless Co. Sale of goods
Purchase of property, plant
and equipment (iii)
-
-
86
17
-
-
86
17
Cru Group Pty Ltd Sale of goods
Purchase of services (iv) 6
15
8
51
6
15
8
51
(i) Cellnet Group Limited earned administration fees, service fees and rent from Mercury Mobility
(Australia) Pty Ltd, a company of which Mr Mel Brookman and Mr Sandy Beard are Directors, of
$181,000 (2008: $70,029 ) post its demerger from the consolidated entity.
For
per
sona
l use
onl
y
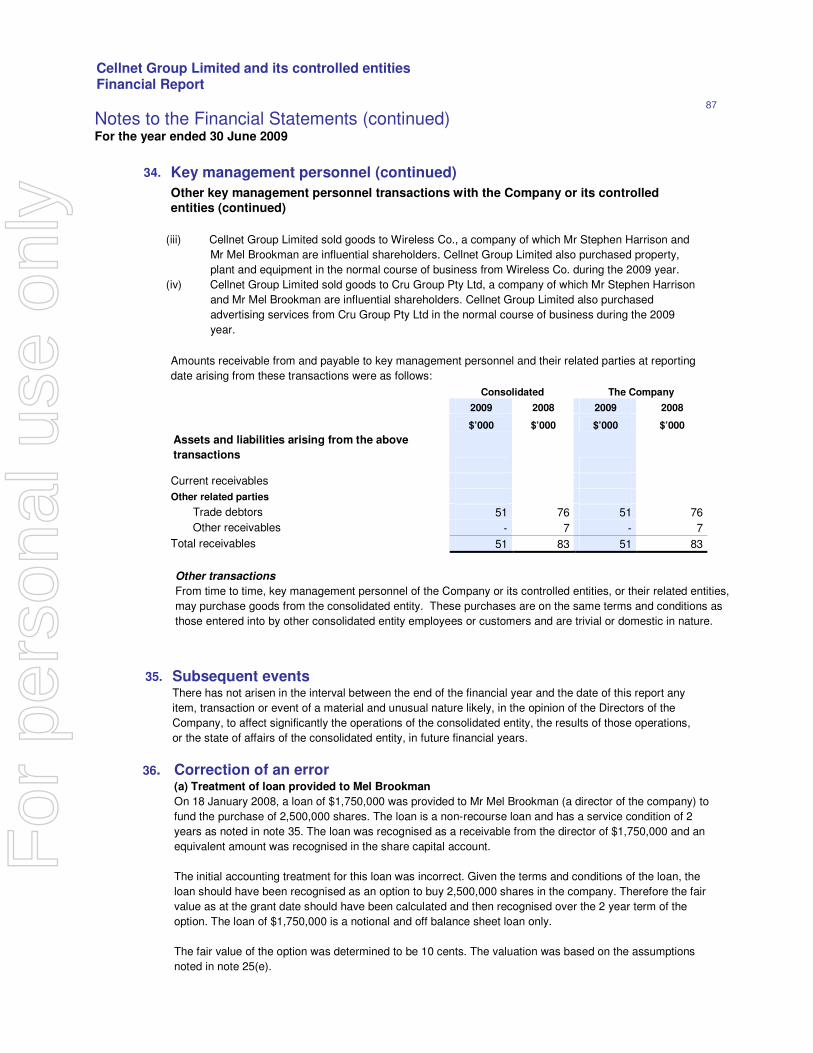
Cellnet Group Limited and its controlled entities Financial Report
87
Notes to the Financial Statements (continued) For the year ended 30 June 2009
34. Key management personnel (continued)
Other key management personnel transactions with the Company or its controlled entities (continued)
(iii) Cellnet Group Limited sold goods to Wireless Co., a company of which Mr Stephen Harrison and
Mr Mel Brookman are influential shareholders. Cellnet Group Limited also purchased property,
plant and equipment in the normal course of business from Wireless Co. during the 2009 year.
(iv) Cellnet Group Limited sold goods to Cru Group Pty Ltd, a company of which Mr Stephen Harrison
and Mr Mel Brookman are influential shareholders. Cellnet Group Limited also purchased
advertising services from Cru Group Pty Ltd in the normal course of business during the 2009
year.
Amounts receivable from and payable to key management personnel and their related parties at reporting
date arising from these transactions were as follows:
Consolidated The Company
2009 2008 2009 2008
$’000 $’000 $’000 $’000
Assets and liabilities arising from the above
transactions
Current receivables
Other related parties
Trade debtors 51 76 51 76
Other receivables - 7 - 7
Total receivables 51 83 51 83
Other transactions
From time to time, key management personnel of the Company or its controlled entities, or their related entities,
may purchase goods from the consolidated entity. These purchases are on the same terms and conditions as
those entered into by other consolidated entity employees or customers and are trivial or domestic in nature.
36. Correction of an error
(a) Treatment of loan provided to Mel Brookman
On 18 January 2008, a loan of $1,750,000 was provided to Mr Mel Brookman (a director of the company) to
fund the purchase of 2,500,000 shares. The loan is a non-recourse loan and has a service condition of 2
years as noted in note 35. The loan was recognised as a receivable from the director of $1,750,000 and an
equivalent amount was recognised in the share capital account.
The initial accounting treatment for this loan was incorrect. Given the terms and conditions of the loan, the
loan should have been recognised as an option to buy 2,500,000 shares in the company. Therefore the fair
value as at the grant date should have been calculated and then recognised over the 2 year term of the
option. The loan of $1,750,000 is a notional and off balance sheet loan only.
The fair value of the option was determined to be 10 cents. The valuation was based on the assumptions
noted in note 25(e).
35. Subsequent events
There has not arisen in the interval between the end of the financial year and the date of this report any
item, transaction or event of a material and unusual nature likely, in the opinion of the Directors of the
Company, to affect significantly the operations of the consolidated entity, the results of those operations,
or the state of affairs of the consolidated entity, in future financial years.
For
per
sona
l use
onl
y
Cellnet Group Limited and its controlled entities Financial Report
88
The error had the following impact:
- the non-current assets as at 30 June 2008 were overstated by $1,750,000.
- the issued capital as at 30 June 2008 was overstated by $1,750,000. There is no change to the
number of shares issued.
- the share based payments expense for the year ended 30 June 2008 was understated by $56,088.
The loss from continuing operations before tax and loss from continuing operations after tax were impacted
by the same amount.
- the retained earnings for the year ended 30 June 2008 were overstated by $56,088.
The error has been corrected by restating each of the affected financial statement line items for the prior year
as described above. The adjustments apply to both the consolidated and the parent entity.
Basic and diluted earnings per share for the prior year have been restated. The amount of the correction for
both basic and diluted earnings per share was nil.
The remuneration noted for Mel Brookman in the remuneration report was updated for the 2008 year to show
a value of $56,088 for share based payments expense.
(b) Error in the opening retained earnings
The retained earnings balance disclosed in the 30 June 2008 audited accounts was overstated by $600,000.
This adjustment relates to the adjustment recognised on the demerger of Mercury Mobility Limited during the
2007 financial year. The adjustment was recognised in the trade payables as at 30 June 2008, instead of
retained earnings.
The error had the following impact:
- the retained earnings as at 1 July 2007 and as at 30 June 2008 were overstated by $600,000.
- the trade and other payables as at 30 June 2008 were understated by $600,000.
The error has been corrected by restating each of the affected financial statement line items for the prior year
as described above. The adjustment applies to the consolidated entity only.
There is no change to basic or diluted earnings per share as a result of the change.
For
per
sona
l use
onl
y
Cellnet Group Limited and its controlled entities Financial Report
89
Directors’ declaration
1) In the opinion of the Directors of Cellnet Group Limited (the Company):
a) the financial statements, notes and the additional disclosures included in the Directors’ report
designated as audited, of the Company and consolidated entity are in accordance with the
Corporations Act 2001, including:
i) giving a true and fair view of the Company’s and consolidated entity’s financial position as at 30
June 2009 and of their performance for the year ended on that date; and
ii) complying with Australian Accounting Standards and Corporations Regulations 2001; and
b) there are reasonable grounds to believe that the Company will be able to pay its debts as and when
they become due and payable.
2) This declaration has been made after receiving the declarations required to be made to the Directors in
accordance with Section 295A of the Corporations Act 2001 for the financial year ended 30 June 2009.
Dated at Brisbane on 28 August 2009.
Signed in accordance with a resolution of the Directors:
Alexander Beard
Chairman
For
per
sona
l use
onl
y
Cellnet Group Limited and its controlled entities Financial Report
90
For
per
sona
l use
onl
y
Cellnet Group Limited and its controlled entities Financial Report
91
For
per
sona
l use
onl
y
Cellnet Group Limited and its controlled entities Financial Report
92
Corporate Governance Statement
Background
“Principles of Good Corporate Governance and Best Practice Recommendations” (ASX Best Practice
Recommendations) was published in March 2003 by the Australian Stock Exchange Limited’s Corporate
Governance Council and the Commonwealth Government’s CLERP 9 amendments to the Corporations Act.
The ASX Listing Rules require listed companies to include in their annual report a statement disclosing the
extent to which they have not followed the Best Practice Recommendations during the reporting period. Listed
companies must identify the recommendations that have not been followed and provide reasons for the non-
compliance. In addition certain specific corporate governance information must be included in the Corporate
Governance Statement section or elsewhere in the Annual Report.
Compliance
Until the restructure of the Board in August 2007 the Company was structured and adopted practices to ensure
it complied with all the Best Practice Recommendations.
In August 2007, in recognition of the poor performance of the business operations and the need to restructure
and refocus for the future, the composition of the Board and senior management was changed considerably and
rationalised. As a result of these changes, the Company was unable to continue to comply with all the
corporate governance best practices. In particular, the Company did not comply with the following
recommendations:
2.1 A majority of the board should be independent directors.
2.2 The chairperson should be an independent director.
4.3 Structure the audit committee so that it consists of:
· only non-executive directors
· a majority of independent directors
· an independent chairperson, who is not chairperson of the board
The Board considers that: - the cost of compliance with these recommendations is not currently justified given the size and nature of
the current operations, and in the context of the more urgent priority to return the Company to an appropriate level of base profitability and restore its fortunes generally; and
- in the meantime, the Board believes that the current Directors have the necessary skills, experience and motivation, through their significant ownership interests in the company, to satisfy the Companies current corporate governance objectives.
However, notwithstanding these current considerations, the Board advises that it intends to move towards a
return to full compliance with all best practice recommendations as soon as is practical.
Specific information on corporate governance • Details of each Directors’ qualifications, experience, term of office, independence and special
responsibilities, including membership of the audit and risk management committee, is set out in the attached Directors’ report.
• The Directors’ report also includes the procedures for directors to take independent advice in respect of their position.
• The Board as a whole assumes the functions of a nominations committee and the Chairman takes responsibility for evaluating the Board’s performance at least annually.
• The Board as a whole assumes the functions of a remuneration committee and details of remuneration policies, procedures and other specific disclosures are included in the remuneration report section of the attached Directors’ report.
Further information on the Company’s corporate governance policies and practices has been posted on its
website at www.cellnet.com.au.
For
per
sona
l use
onl
y
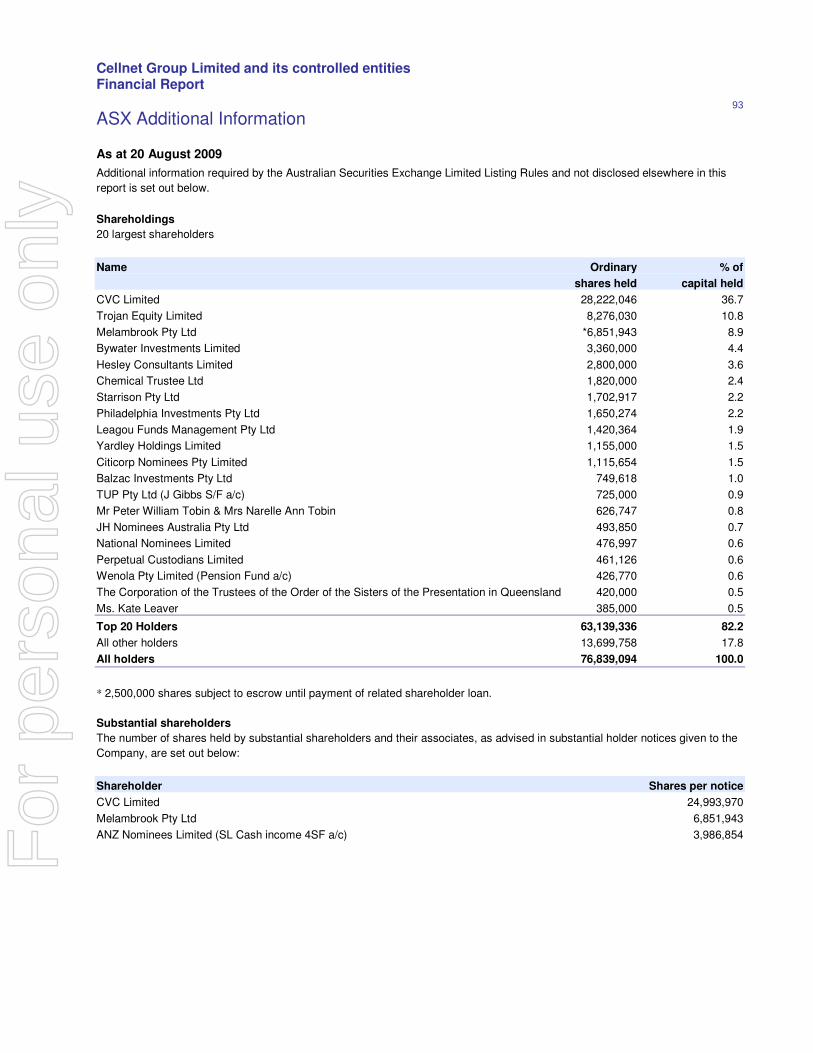
Cellnet Group Limited and its controlled entities Financial Report
93
ASX Additional Information
As at 20 August 2009
Additional information required by the Australian Securities Exchange Limited Listing Rules and not disclosed elsewhere in this
report is set out below.
Shareholdings
20 largest shareholders
Name Ordinary % of
shares held capital held
CVC Limited 28,222,046 36.7
Trojan Equity Limited 8,276,030 10.8
Melambrook Pty Ltd *6,851,943 8.9
Bywater Investments Limited 3,360,000 4.4
Hesley Consultants Limited 2,800,000 3.6
Chemical Trustee Ltd 1,820,000 2.4
Starrison Pty Ltd 1,702,917 2.2
Philadelphia Investments Pty Ltd 1,650,274 2.2
Leagou Funds Management Pty Ltd 1,420,364 1.9
Yardley Holdings Limited 1,155,000 1.5
Citicorp Nominees Pty Limited 1,115,654 1.5
Balzac Investments Pty Ltd 749,618 1.0
TUP Pty Ltd (J Gibbs S/F a/c) 725,000 0.9
Mr Peter William Tobin & Mrs Narelle Ann Tobin 626,747 0.8
JH Nominees Australia Pty Ltd 493,850 0.7
National Nominees Limited 476,997 0.6
Perpetual Custodians Limited 461,126 0.6
Wenola Pty Limited (Pension Fund a/c) 426,770 0.6
The Corporation of the Trustees of the Order of the Sisters of the Presentation in Queensland 420,000 0.5
Ms. Kate Leaver 385,000 0.5
Top 20 Holders 63,139,336 82.2
All other holders 13,699,758 17.8
All holders 76,839,094 100.0
* 2,500,000 shares subject to escrow until payment of related shareholder loan.
Substantial shareholders
The number of shares held by substantial shareholders and their associates, as advised in substantial holder notices given to the
Company, are set out below:
Shareholder Shares per notice
CVC Limited 24,993,970
Melambrook Pty Ltd 6,851,943
ANZ Nominees Limited (SL Cash income 4SF a/c) 3,986,854
For
per
sona
l use
onl
y
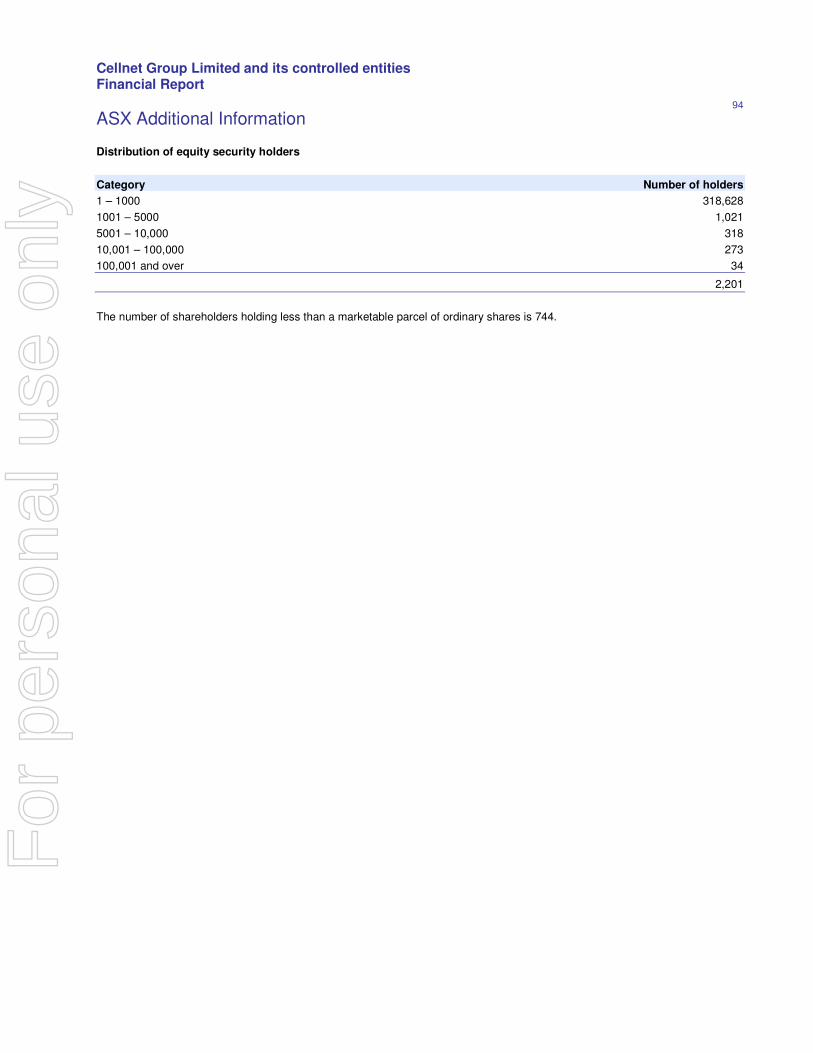
Cellnet Group Limited and its controlled entities Financial Report
94
ASX Additional Information
Distribution of equity security holders
Category Number of holders
1 – 1000 318,628
1001 – 5000 1,021
5001 – 10,000 318
10,001 – 100,000 273
100,001 and over 34
2,201
The number of shareholders holding less than a marketable parcel of ordinary shares is 744.
For
per
sona
l use
onl
y