For personal use only - ASX · 2. For HY 2014 calculated using securities outstanding at 30 June...
52
HY 2014 Results - August 2014 For personal use only
Transcript of For personal use only - ASX · 2. For HY 2014 calculated using securities outstanding at 30 June...

HY 2014 Results - August 2014
For
per
sona
l use
onl
y

Spark Infrastructure HY 2014 Results 2
PRESENTATION AGENDA
1. OVERVIEW
2. SPARK INFRASTRUCTURE PERFORMANCE
3. INVESTMENT PORTFOLIO PERFORMANCE
4. REGULATORY ENVIRONMENT
5. GROWTH
6. SUMMARY AND OUTLOOK
For
per
sona
l use
onl
y

3
1. OVERVIEW
Spark Infrastructure HY 2014 Results
For
per
sona
l use
onl
y

4
DELIVERING NOW AND INTO THE FUTURE FINANCIAL HIGHLIGHTS
Invested in regulated
assets with stable cash flows
► Current Regulatory Asset Base (RAB) of $8.86 billion (est.) (Spark share $4.34 billion)
► RAB growth of 2.8% for HY2014. RAB CAGR of 8.2% since 2010
► Net capital expenditure for HY2014 of $383.5 million1
Growing distributions
on back of growing standalone and
lookthrough OCF
Strong balance sheets
with enhanced flexibility
► Net debt to RAB at HY2014 is 77.8% (78.5% at FY2013)
► Strong investment grade credit ratings of A- (S&P) at SA Power Networks, BBB+ (S&P) at CitiPower and Powercor, Spark Baa1 (Moody’s)
Asset Companies1 delivering solid
improvements half on half
► Total revenue2 of $1,067.5 million – up 1.7%
► Distribution revenue3 of $915.0 million – up 5.0%
► Operating costs of $349.8 million – up 1.0%
► Aggregate EBITDA2 of $717.6 million – up 2.1%
► 5.75cps in HY2014; guiding 4.5% growth to 11.5cps for FY2014, and 3-5% growth for FY2015
► Standalone OCF per security up 2.3% to 6.4cps4
► Lookthrough OCF per security up 17.4% to 9.8cps4
► Distributions more than covered by both standalone and lookthrough cashflows
► Distributions to Spark from AssetCos of $92.7 million received in HY2014
Spark Infrastructure HY 2014 Results
1. Spark Infrastructure holds 49% interests in SA Power Networks (SAPN) and Victoria Power Networks (VPN), results shown on a 100% basis 2. Excludes customer contributions and gifted assets 3. Includes AMI revenue 4. Per security figures calculated using weighted average number of securities for the period.
For
per
sona
l use
onl
y

DELIVERING NOW AND INTO THE FUTURE
5
► Businesses performed strongly during heatwave conditions early in the period
► Preparations for regulatory resets well advanced
► Significant progress made on ATO matters
► World Class Operations Program underway at VPN, expected to deliver ongoing benefits to Consumers and Shareholders
► Volumes have fallen vs prior period, and continue to fall short of regulatory forecasts. However, move to revenue cap will remove volume risk in the next regulatory period from July 2015 (SAPN) and January 2016 (CitiPower and Powercor)
► 14.1%* interest in DUET Group acquired during HY2014
OPERATIONAL AND STRATEGIC UPDATE
Spark Infrastructure HY 2014 Results
* Subsequent to 30 June 2014 DUET Group issued a further 9.9 million securities under its Dividend Reinvestment Plan, reducing the economic interest held by Spark to 14.0%
For
per
sona
l use
onl
y
6.73 7.37 8.08
8.62 8.86
9.5% 9.6%
8.6%
8.2%
FY 2010 FY 2011 FY 2012 FY 2013 HY 2014
80.7% 81.5%
79.7% 78.5%
77.8%
FY 2010 FY 2011 FY 2012 FY 2013 HY 2014
10.0 10.5 11.0
5.75
5.75
FY 2011 FY 2012 FY 2013 HY 2014
6
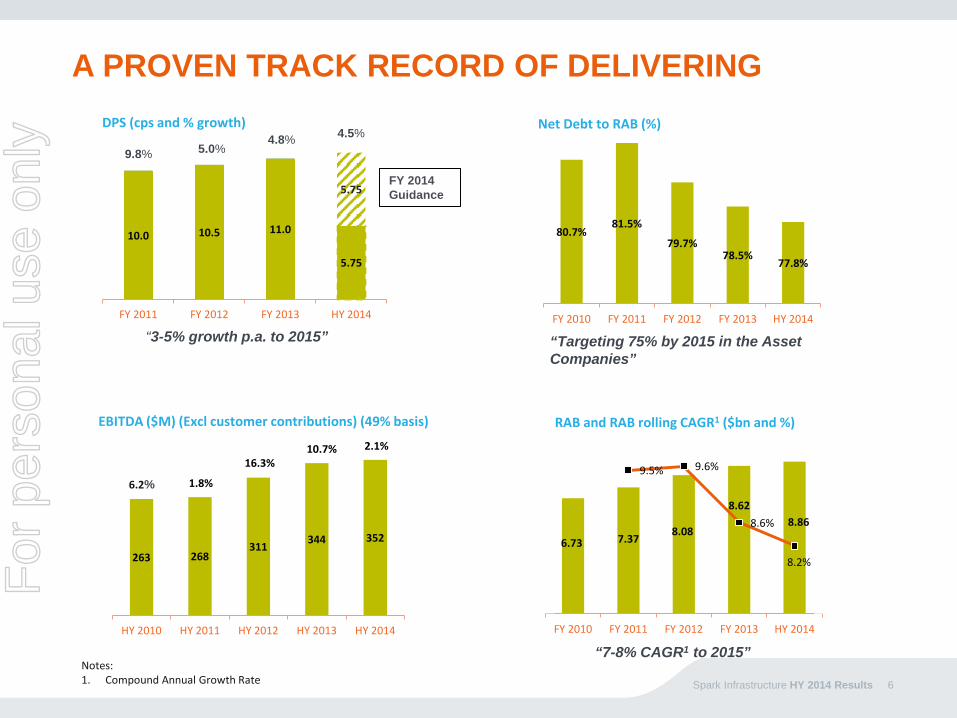
A PROVEN TRACK RECORD OF DELIVERING Net Debt to RAB (%)
RAB and RAB rolling CAGR1 ($bn and %)
DPS (cps and % growth)
EBITDA ($M) (Excl customer contributions) (49% basis)
263 268 311 344 352
HY 2010 HY 2011 HY 2012 HY 2013 HY 2014
9.8% 5.0% 4.8% 4.5%
“3-5% growth p.a. to 2015” “Targeting 75% by 2015 in the Asset Companies”
1.8%
16.3% 10.7%
6.2%
Spark Infrastructure HY 2014 Results
FY 2014 Guidance
Notes: 1. Compound Annual Growth Rate
2.1%
“7-8% CAGR1 to 2015”
For
per
sona
l use
onl
y

7
2. SPARK INFRASTRUCTURE PERFORMANCE
Spark Infrastructure HY 2014 Results
For
per
sona
l use
onl
y

8
FINANCIAL HIGHLIGHTS – HY 2014 SPARK INFRASTRUCTURE
1. On an accrued basis
2. For HY 2014 calculated using securities outstanding at 30 June 2014 (1.466bn securities)
3. For HY 2014 calculated using weighted average securities outstanding during the period (1.349bn securities)
4. Based on Asset Company estimates - including DUOS and AMI RAB
Spark Infrastructure HY 2014 Results
HY 2014 HY 2013 % Change
Spark dps1 5.75cps 5.50cps 4.5
Distribution payout ratio - standalone1,2 97.3% 87.6% +9.7%
Distribution payout ratio - lookthrough (post Spark costs)1,2 63.6% 66.0% -2.4%
Total Asset Company distributions to Spark $92.7m $91.3m 1.4
Standalone OCF $86.7m $83.3m 4.0
Standalone OCF per security3 6.4cps 6.3cps 2.3
Lookthrough OCF per security (post Spark costs)3 9.8cps 8.3cps 17.4
Net debt to RAB (Asset Company level)4 77.8% 79.5% -1.7%
For
per
sona
l use
onl
y

9
OPERATING CASHFLOW – HY 2014 SPARK INFRASTRUCTURE
Spark Infrastructure HY 2014 Results
1. For HY 2014 calculated using weighted average securities outstanding during the period (1.349bn securities)
HY 2014 HY 2013 % Change
$m $m %
SA Power Networks - PPC distributions 34.3 34.3 0.0
SA Power Networks - other distributions 17.9 16.7 7.4
Victoria Power Networks – sub debt interest 40.4 40.3 0.2
Asset Company distributions 92.7 91.3 1.4
Interest received 0.5 0.7 (30.1)
Interest paid (0.6) (2.5) (77.2)
Swap cancellation costs - (2.2) n/m
Finance costs paid - derivative contracts (0.7) - n/m
General administrative expenses (5.2) (4.0) (29.3)
Standalone OCF 86.7 83.3 4.0
Standalone OCF per security1 6.4cps 6.3cps 2.3For
per
sona
l use
onl
y

10
STANDALONE CASHFLOW – HY 2014 SPARK INFRASTRUCTURE
Spark Infrastructure HY 2014 Results
HY 2014 HY 2013 % Change
$m $m %
Standalone OCF 86.7 83.3 4.0
Investing cashflows
Prepayment of forward contract (195.8) - n/m
Transaction costs - derivative contracts (net) (2.7) - n/m
Cash outflow from investing activities (198.5) - n/m
Financing cashflows
Proceeds from issue of stapled securities 245.7 - n/m
Payment of issue costs (3.8) - n/m
Net repayment of external borrowings - (30.0) (100.0)
Payment of external borrowing costs (0.7) (0.6) 21.0
Distributions to Securityholders: n/m
- Loan Note interest (47.1) (47.1) 0.0
- Capital distributions (25.9) (22.6) 14.7
Cash inflow from financing activities 168.3 (100.2) (268.0)
Net increase/(decrease) in cash56.5 (16.9) (434.5)
Cash at the beginning of the period 33.0 42.0 (21.3)
Cash at the end of the period 89.5 25.1 256.9
► Forward contract prepaid Equity raise proceeds of
$195.8 million used to prepay part of the DUET Group interest
► Stapled securities issued $245.7 million raised via
Institutional Placement ($200 million) and Security Purchase Plan ($45.7 million);
139.6 million stapled securities at $1.76 per security
For
per
sona
l use
onl
y

11
PROFIT AND LOSS - HY 2014 SPARK INFRASTRUCTURE
1. Unamortised borrowing costs attached to the old syndicated facilities, refinanced in March 2013
Spark Infrastructure HY 2014 Results
$m HY 2014 HY 2013 % Change
Income from associates and interest income 152.6 156.6 (2.6)
Gain on derivative contracts (net of financing) 22.8 - n/m
Total income 175.3 156.6 12.0
General, administrative and employee expenses (5.0) (4.3) (17.3)
Transaction costs on derivative contracts (3.3) - n/m
Swap cancellation costs - (2.2) n/m
Previously capitalised borrowing costs1 - (1.0) n/m
Interest expense (gross) – senior debt (0.9) (2.4) 60.8
Profit before Loan Note interest and tax 166.1 146.7 13.2
Loan Note Interest (Distributions to Securityholders) (51.3) (46.4) (10.5)
Income tax expense (25.8) (24.3) (6.0)
Profit attributable to Securityholders 89.0 76.0 17.1
For
per
sona
l use
onl
y

$352.5m $386.9m
$34.4m
$111.2m
$79.1m
$18.0m $5.6m
$138.6m
0
50
100
150
200
250
300
350
400
450
EBITDA CustomerContributions(incl. Gifted
Assets)
EBITDA excl CCand GA
less: NetFinance
charges (cash)
less: Netregulatory
depreciation
+/- Net WorkingCapital Mvmts
Less VPNdisputed tax
payments
OperatingC/Flow
$m Lookthrough Operating Cashflow (Spark 49% Share) $m HY 2014
12
OPERATING CASH FLOW MODEL – HY 2014 Asset Companies producing 10.3 cps Operating Cash
28.7cps 2.5cps
26.1cps 8.2cps
5.9cps
1.3cps
9.8cps
10.3cps 0.4cps
Spark cash retained $13.7m
Cash retained – Asset level
$45.9m
Other costs incl operating costs and interest $6.0m
Distributions to securityholders
$73.0m
0.5cps
Spark Infrastructure HY 2014 Results
Notes:
1. All cents per security figures calculated using weighted average securities during the period (1.349bn securities)
2. Customer contributions figure shown is net of $1.8m rebates paid on gifted assets at SAPN
For
per
sona
l use
onl
y

13
3. INVESTMENT PORTFOLIO PERFORMANCE
Spark Infrastructure HY 2014 Results
For
per
sona
l use
onl
y

AGGREGATED FINANCIAL PERFORMANCE – HY 2014 (100% results – SA Power Networks & Victoria Power Networks) SA Power Networks and Victoria Power Networks HY 2014 HY 2013 Change
(100% basis) $m $m %
Regulated Revenue – DUOS 855.0 802.5 6.5
Regulated Revenue – AMI 59.9 69.3 (13.5)
Semi-regulated Revenue – Other 40.4 43.1 (6.2)
Unregulated Revenue 112.1 134.3 (16.5)
Total Revenue (ex customer contributions) 1,067.5 1,049.2 1.7
Semi-regulated Revenue – customer contributions incl gifted assets 71.9 77.3 (6.9)
Total Revenue 1,139.4 1,126.5 1.1
Total Operating Costs (349.8) (346.3) (1.0)
EBITDA (ex customer contributions) 717.6 702.9 2.1
EBITDA (incl customer contributions) 789.5 780.2 1.2
EBITDA Margin (ex customer contributions) 67.2% 67.0% +0.2%
Capital Expenditure (Net) 383.5 422.3 (9.2)
Spark Infrastructure HY 2014 Results 14
For
per
sona
l use
onl
y

15
SA POWER NETWORKS – HY 2014 (100% results)
1. Excluding adjustments for recovery of STPIS, PV and Q-factor and other immaterial adjustments
2. Approximately 50% of the growth in employee numbers relates to unregulated activities (largely NBN) and ~15% is the new intake of apprentices
► Revenue growth of 2.4%: CPI-X increase from July 2013 of 9.67%1, however
no STPIS benefit/penalty was booked in the period; Semi-regulated revenue reflects lower asset
relocation activities; Reduced unregulated revenues reflect lower
Electranet spending, partly offset by higher NBN revenues
► Operating costs up 6.5%: Underlying operating costs were lower in HY,
however results impacted by abnormal events; Vegetation management up $7.3m to $17.3m. Spend
in line with regulatory allowance including additional pass-through;
GSL costs up $6.9m primarily due to January and February severe weather events; offset by
Lower CaMS related costs
Spark Infrastructure HY 2014 Results
HY 2014 HY 2013 Change
$m $m %Regulated revenue – DUOS 439.5 418.6 5.0
Semi-regulated – other 18.3 21.3 (14.1)
Unregulated revenue 62.3 67.8 (8.1)
Total revenue (ex customer contributions) 520.1 507.7 2.4
Customer contributions incl gifted assets 41.3 43.5 (5.2)
Total revenue 561.3 551.2 1.8
Cash operating costs (160.0) (150.2) 6.5
EBITDA (ex customer contributions) 360.0 357.5 0.7
EBITDA 401.3 401.0 0.1
EBITDA ex customer contributions margin 69.2% 70.4% -1.2%
Total Capex (net) 151.9 183.2 (17.1)
Financial Operational HY 2014 HY 2013 Change Change %
Customer numbers 843,121 836,365 6,756 0.8
Employee numbers2 2,228 2,117 111 5.2
Network availability (%) 99.94% 99.97% -0.03% -
Volume sold (GWh) 5,380 5,531 (151) (2.7)
For
per
sona
l use
onl
y

16
SA POWER NETWORKS Delivering for investors – business update
► Sales Volumes – Decline in volumes continues to be driven primarily by residential customers. Actual volumes down 4.8% on regulatory allowances for the 2013/14 year
► Revenue recovery – AER has confirmed the move from a price cap to a revenue cap. Revenue cap will remove volume risk in the next regulatory period
► Service Target Performance Incentive Scheme (STPIS) –
• 12/13 regulatory year: ~$13m recovered from 1 July 2014 (revenue not yet recognised)
• 13/14 regulatory year: ~ $9m penalty likely from 1 July 2015 (provision not yet raised)
► Vegetation management costs – $39.8 million resulting from approval of pass through application for additional costs for 2012/13 – 2014/15. Pass through recoveries only from 1 July 2014 (revenue not yet recognised)
► National Broadband Network (NBN) – Contract works continue, albeit at slower than expected pace. $10.2 million of revenue in HY2014 (HY 2013: $3.9 million)
Spark Infrastructure HY 2014 Results
HY 2014 HY 2013 Variance Residential/Domestic 1,565 1,647 (5.0%)Hot Water 274 267 2.6%Small Business 2,795 2,865 (2.4%)Large Business 681 688 (1.0%)Unmetered 65 64 1.6%Total 5,380 5,531 (2.7%)(Residential solar penetration) 22.6% 19.2% +3.4%
Electricity sales volumesQuantity (GWh)
For
per
sona
l use
onl
y

17 Spark Infrastructure HY 2014 Results
KEY BUSINESS ISSUES
SA POWER NETWORKS
► Regulatory reset – Finalising reset preparations. Submission due to the AER 31 October 2014
► Robust Network and ability to respond to major events • January heatwave: 5 days of 42C+, 2 thunderstorms, 2 MEDs1, 300 personnel available during the day
• Feb 3 windstorm: 700 outages (incl 370 wires down). More than half of affected customers restored by early afternoon
► STPIS • Performance for latest regulatory year (2013/14) impacted by adverse weather events. Expected to be negative (~$9m)
• Cumulatively during the regulatory reset from 1 July 2010 to 30 June 2014 the performance is significantly positive (~$23m)
► Health, Safety and Environment – No LTIs. Safety certifications maintained. Superior Rating received under the Workcover Self Insurance Standards
► Solar PV – ~168k installations at the half year (~141k 30 June 13). PV is shifting peak, but also helping reduce stress on the network during heatwave
► Unregulated revenues – CaMS revenues benefiting (slowly) from NBN contract, but have and will continue to be impacted by lower levels of Electranet activity, particularly major projects
1. Major Event Days
For
per
sona
l use
onl
y
18
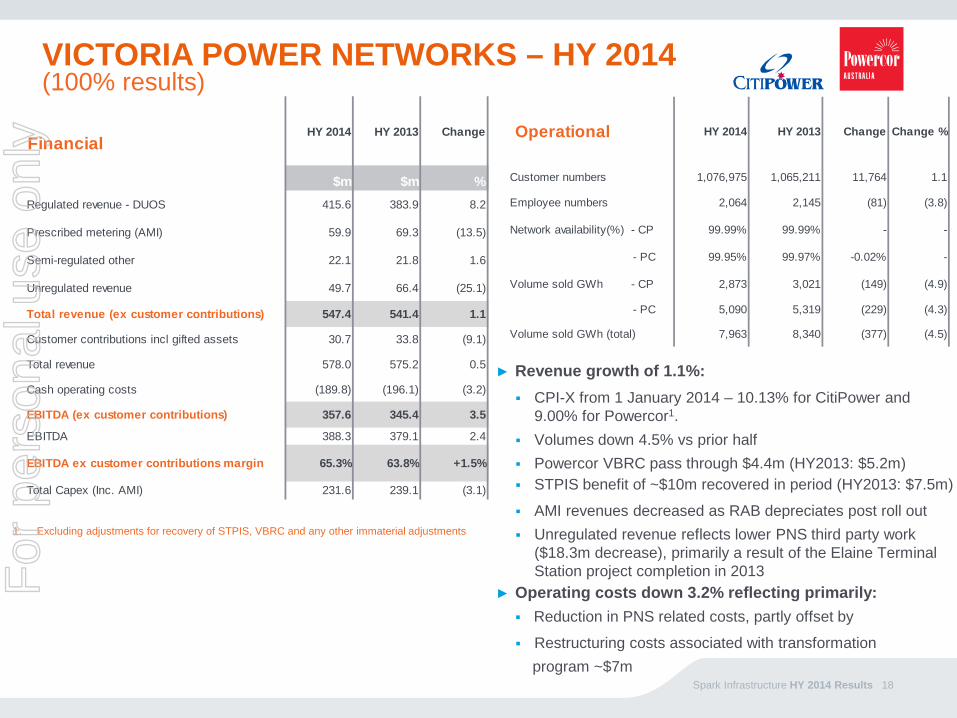
VICTORIA POWER NETWORKS – HY 2014 (100% results)
► Revenue growth of 1.1%: CPI-X from 1 January 2014 – 10.13% for CitiPower and
9.00% for Powercor1. Volumes down 4.5% vs prior half Powercor VBRC pass through $4.4m (HY2013: $5.2m) STPIS benefit of ~$10m recovered in period (HY2013: $7.5m)
AMI revenues decreased as RAB depreciates post roll out Unregulated revenue reflects lower PNS third party work
($18.3m decrease), primarily a result of the Elaine Terminal Station project completion in 2013
► Operating costs down 3.2% reflecting primarily: Reduction in PNS related costs, partly offset by
Restructuring costs associated with transformation program ~$7m
1. Excluding adjustments for recovery of STPIS, VBRC and any other immaterial adjustments
Spark Infrastructure HY 2014 Results
HY 2014 HY 2013 Change
$m $m %Regulated revenue - DUOS 415.6 383.9 8.2
Prescribed metering (AMI) 59.9 69.3 (13.5)
Semi-regulated other 22.1 21.8 1.6
Unregulated revenue 49.7 66.4 (25.1)
Total revenue (ex customer contributions) 547.4 541.4 1.1
Customer contributions incl gifted assets 30.7 33.8 (9.1)
Total revenue 578.0 575.2 0.5
Cash operating costs (189.8) (196.1) (3.2)
EBITDA (ex customer contributions) 357.6 345.4 3.5
EBITDA 388.3 379.1 2.4
EBITDA ex customer contributions margin 65.3% 63.8% +1.5%
Total Capex (Inc. AMI) 231.6 239.1 (3.1)
Financial Operational HY 2014 HY 2013 Change Change %
Customer numbers 1,076,975 1,065,211 11,764 1.1
Employee numbers 2,064 2,145 (81) (3.8)
Network availability(%) - CP 99.99% 99.99% - -
- PC 99.95% 99.97% -0.02% -
Volume sold GWh - CP 2,873 3,021 (149) (4.9)
- PC 5,090 5,319 (229) (4.3)
Volume sold GWh (total) 7,963 8,340 (377) (4.5)
For
per
sona
l use
onl
y

HY 2014 HY 2013 Variance Residential/Domestic 1,580 1,655 (4.6%)Small Business 998 989 0.9%Large Business 2,461 2,622 (6.2%)Unmetered 53 53 (0.7%)Total 5,090 5,319 (4.3%)(Residential solar penetration) 11.8% 10.4% +1.4%
Electricity sales volumesQuantity (GWh)
HY 2014 HY 2013 Variance Residential/Domestic 550 613 (10.2%)Small Business 892 958 (6.9%)Large Business 1,411 1,430 (1.3%)Unmetered 20 20 (1.5%)Total 2,873 3,021 (4.9%)(Residential solar penetration) 2.5% 2.3% +0.2%
Electricity sales volumesQuantity (GWh)
19
VICTORIA POWER NETWORKS Delivering for investors – business update
► Revenue recovery – Revenue cap expected – AER will finalise its position on a revenue cap in October 2014
► STPIS
• 2012 regulatory year: ~$10m recovered in HY2014, up ~$2.5m vs $7.5m in prior period. Further ~$10m to be recovered in H2 2014;
• 2013 regulatory year: ~$12m expected to be recovered in 2015
► AMI metering
• Rollout completed ahead of deadline
• 97% of installed meters are being remotely read
Spark Infrastructure HY 2014 Results
For
per
sona
l use
onl
y

► Regulatory reset effective 1 Jan 2016 – Submission due to the AER in April 2015
► Robust Network – January 2014 only relatively minor heat related outages experienced. Fires across western Victoria resulted in some network damage and impacts to customers. Repairs, including approximately 100 pole replacements, were completed in a safe and timely manner
► Health, Safety and Environment – continued strong performance in year to date across leading and lagging indicators. Remains the number one focus for the business
► Powercor Network Services (PNS) third party work –
Ausnet Services revenues have grown vs HY2013;
One off large project in prior period: Elaine Terminal Station project for Meridian Energy (~$14 million of revenue in HY 2013);
QLD and NSW markets are experiencing lower project activity as a result of government direction, reduced demand and capital expenditure constraints
20
KEY BUSINESS ISSUES
Spark Infrastructure HY 2014 Results
VICTORIA POWER NETWORKS F
or p
erso
nal u
se o
nly

21
VICTORIA POWER NETWORKS COST MANAGEMENT: “WORLD CLASS OPERATIONS PROGRAM”
Spark Infrastructure HY 2014 Results
► Reduced corporate function headcount (approx. 100 staff) in People & Culture, IT, Finance and Company Secretary & Legal due to:
Eliminating non-value adding activities (e.g. excessive reporting, duplication/overlap of roles)
Reducing management layers/overhead
Simplifying work processes
► Improved contractor management, more rigorous and competitive tendering and policy reviews
Negotiated lower rates for contractor resources and materials
More rigorous tender processes ensuring more favourable terms and conditions
Reduction of (external) resource partner numbers (reflecting internal resourcing, policy reviews and better planning)
► Streamlined maintenance processes and avoidance of unnecessary maintenance:
Improving inspection quality and changes to maintenance policies (e.g. cross arm replacement)
Changing maintenance timelines to improve flexibility and reduce field workforce costs
Reduced asset inspection crews from two to one person for mid-cycle inspections
► Multiple field workforce productivity initiatives (including roll-out of iPads to the field to improve communication, knowledge management, work scheduling and administration/automation of forms)
► Longer term system replacements initiated:
Workforce management
End to end connections
Design processes
For
per
sona
l use
onl
y

22
ASSET COMPANIES’ DEBT POSITION AT 30 JUNE 2014 100% basis – SA Power Networks & Victoria Power Networks
► CitiPower
► placed $150 million of domestic floating rate notes in February 2014 (maturing April 2019)
► executed a $200 million 4 year revolving bank facility in June 2014 (maturing May 2018)
► Powercor
► executed a $250 million 5 year syndicated bank facility in June 2014 (maturing May 2019)
► executed a $300 million 18 month bank facility also in June 2014 (maturing November 2015)
► SAPN
► placed a US$370 million USPP in May 2014, with two tranches of US$185 million – 8 and 12 year maturities. Only US$50 million of this has been received to date
► All 2014 Asset Company capital markets maturities have been refinanced
Spark Infrastructure HY 2014 Results
109
350
144 191 200
575
351
150 70
178
425
630
Nov-14 Nov-15 May-16 Nov-16 Apr-17 Jul-17 Jun-18 Apr-19 Aug-19 Jun-20 Aug-21 Jan-22
Victoria Power Networks - Capital Markets Debt ($m 100%)
203 300
472
265 350
150
350 200
569
53 Sep-14 Jul-15 Sep-16 Oct-16 Sep-17 Oct-17 Apr-18 Sep-19 Oct-19 Jun-22
SA Power Networks - Capital Markets Debt ($m 100%)
155 235
- - 65
-
335
- - 30
45
30
75 25
235
75
100
200 250
Aug-14 Sep-14 Dec-14 Apr-15 Jun-15 Nov-15 Dec-15 Feb-16 May-18 May-19
Asset Company Bank Debt Facilities ($m 100%)
DrawnUndrawnF
or p
erso
nal u
se o
nly

23 Spark Infrastructure HY 2014 Results
ASSET COMPANY TAXATION UPDATE Significant Progress during HY2014 Developments during HY 2014
► ATO advised VPN in May 2014 that it will not pursue its position re Division 974 (debt/equity), which concluded that matter for all years in question
► No subsequent updates as yet to previously disclosed amended assessments from the ATO
► All other matters with the ATO remain ongoing, including Part IVA
► VPN remains engaged in discussions with the ATO
► No further developments in respect of SAPN matters since settlement of CRISP matter (announced in January)
Outlook
► The developments during the period, in particular the withdrawal of the Division 974 matter, are evidence of progress
► Spark and the Asset Companies remain engaged with the ATO on the various matters and look forward to further progress
Full details of ongoing ATO matters disclosed in the Spark Financial Statements
For
per
sona
l use
onl
y

24
4. REGULATION
Spark Infrastructure HY 2014 Results
For
per
sona
l use
onl
y

25 Spark Infrastructure HY 2014 Results
Focus on upcoming regulatory resets REGULATORY ENVIRONMENT
AER has confirmed that SAPN will operate under a revenue cap from 1 July 2015, and has
proposed the same for all Victorian distributors (consultation paper issued in May 2014)
Capital expenditure requirements will be driven by replacement and maintenance needs rather
than by growth expectations – there is still much to do
Consumer engagement programs a key consideration for the AER when assessing proposals
from network businesses – SAPN and VPN well placed
AER Benchmarking report due by end September 2014 - benchmarking data in Regulatory
Information Notices (RINs) requires standardisation and interpretation - SAPN and VPN continue
to compare favourably to peers
For
per
sona
l use
onl
y

26 Spark Infrastructure HY 2014 Results
Timeline REGULATORY ENVIRONMENT
31 October 2014 SAPN submits its regulatory submission to the AER
CitiPower and Powercor new Framework and Approach papers published by AER
30 April 2015 SAPN Preliminary Determination expected from the AER
CitiPower and Powercor submit their regulatory submissions to the AER
1 July 2015 SAPN new 5-year regulatory period commences (transitional arrangement)
2 July 2015 SAPN submits revised regulatory submission to the AER
31 October 2015 CitiPower and Powercor Preliminary Determination expected from the AER
SAPN Final Determination expected from the AER
1 January 2016 CitiPower and Powercor new 5-year regulatory period commences (transitional arrangement)
6 January 2016 CitiPower and Powercor submit revised regulatory submission to the AER
30 April 2016 CitiPower and Powercor Final Determination expected from the AER
Under the transitional arrangements the businesses will operate under the AER’s Preliminary Determinations for year 1 of their regulatory periods
When the Final Determinations are published the AER will make adjustments to revenue recovery arrangements to years 2-5 of the regulatory periods to reflect any changes under a ‘no disadvantage’ basis
For
per
sona
l use
onl
y

Spark Infrastructure HY 2014 Results 27
5. GROWTH
For
per
sona
l use
onl
y

Spark Infrastructure HY 2014 Results 28
SA POWER NETWORKS AND VICTORIA POWER NETWORKS - REGULATED ORGANIC GROWTH
3.67 4.05 4.57 4.93 5.09
3.06 3.32
3.51 3.69 3.78
FY 2010 FY 2011 FY 2012 FY 2013 HY 2014
SA PowerNetworks
VictoriaPowerNetworks
$ billion
6.73 7.37
8.08 8.62
► 7-8% p.a. CAGR growth in total RAB (incl. AMI) expected over the 5 year regulatory periods to 2015 based on AER decisions and expected capital expenditure outperformance
► Capital expenditure earns a regulatory return from day one
► Asset Companies well advanced in preparations for regulatory resets for 2015-2020
Source: Asset Companies’ estimates, Spark internal projection. VPN figures include AMI RAB
9.5% 9.7% 6.6%
9.5% 9.6% 8.6% 8.2%1
2011 2012 2013 2014 2015
Annual % growth in Total RAB
Projecting 7-8% CAGR in aggregate RAB 2010-2015
Rolling CAGR %
8.86
For
per
sona
l use
onl
y

Spark Infrastructure HY 2014 Results 29
Acquisition of interest in DUET Group
► Spark entered into derivative contracts to acquire a minimum 14.1%* interest (equivalent to 185.9 million securities) in DUET Group at an average entry price of ~$2.16 per security
► Consistent with Spark’s strategy of investing in quality regulated and long-lived infrastructure assets in Australia
► Prudently funded via a mix of new equity and embedded funding in the derivatives
► Net unrealised gain of $22.8 million on derivative contracts (before transaction costs) recognised in 1H 2014 – includes fair value of notional distribution receivable
► First payment under the derivative contracts of $15.8 million (reflecting the DUET Group June final distribution) was received on 22 August 2014
► Refer Appendix for detailed reconciliation of accounting impact in 1H 2014.
* Subsequent to 30 June 2014 DUET Group issued a further 9.9 million securities under its Dividend Reinvestment Plan, which reduces the economic interest held by Spark to 14.0%
For
per
sona
l use
onl
y

Spark Infrastructure HY 2014 Results 30
Privately owned network assets set the standard
“…the rationale for government ownership of electricity network businesses no longer holds… the evidence appears to suggest that state owned enterprises are less efficient than their private sector peers. The best remedy is privatisation.”
‘Electricity Network Regulatory Frameworks Inquiry Report’ Productivity Commission - 26 June 2013
► Spark supports the NSW Government’s proposal for partial privatisation of electricity distribution and transmission network assets in New South Wales
► Spark’s Asset Companies are among the most reliable, efficient and safe businesses of their kind in Australia, and rank above their government owned peers
- Reliability – Network availability: SAPN - 99.94%; CitiPower – 99.99%; Powercor – 99.95%
- Safety - In HY 2014, SAPN recorded zero Lost Time Injuries (LTIs) and VPN recorded 1 LTI
- Efficiency – Consistent outperformance of regulatory benchmarks and allowances - neither SAPN or VPN have overspent their regulatory allowances since being privatised
- Consumer engagement – Delivering industry leading programs which have been praised by consumer groups and held up by the Australian Energy Regulator as best practice examples for others to follow F
or p
erso
nal u
se o
nly

Spark Infrastructure HY 2014 Results 31
6. SUMMARY & OUTLOOK
For
per
sona
l use
onl
y

► SAPN and VPN – 49% interests Strong RAB growth of 7-8% CAGR across 2010-2015 Prudent asset level gearing of 77.8%, moving towards 75% Net debt to RAB by end 2015
► Interest in DUET Group to contribute to cashflows from 2H 2014
► Cashflows on a standalone and lookthrough basis covering distributions
► Well positioned to participate in further industry consolidation and privatisation of NSW assets
► FY 2014 Distribution guidance of 11.5cps (4.5% growth on FY 2013)
► Distribution growth guidance of 3-5% for 2015
32 Spark Infrastructure HY 2014 Results
Quality Australian
assets
Quality management
Quality returns
Focus on generating opportunities to create and capture value A TIME FOR QUALITY
For
per
sona
l use
onl
y

FOR FURTHER INFORMATION
Spark Infrastructure HY 2014 Results 33
Please contact Mario Falchoni General Manager, Investor Relations and Corporate Affairs Spark Infrastructure P: + 61 2 9086 3607 F: + 61 2 9086 3666 [email protected]
For
per
sona
l use
onl
y

Spark Infrastructure HY 2014 Results 34
APPENDICES
For
per
sona
l use
onl
y
35 Spark Infrastructure HY 2014 Results
1. Excludes reserves
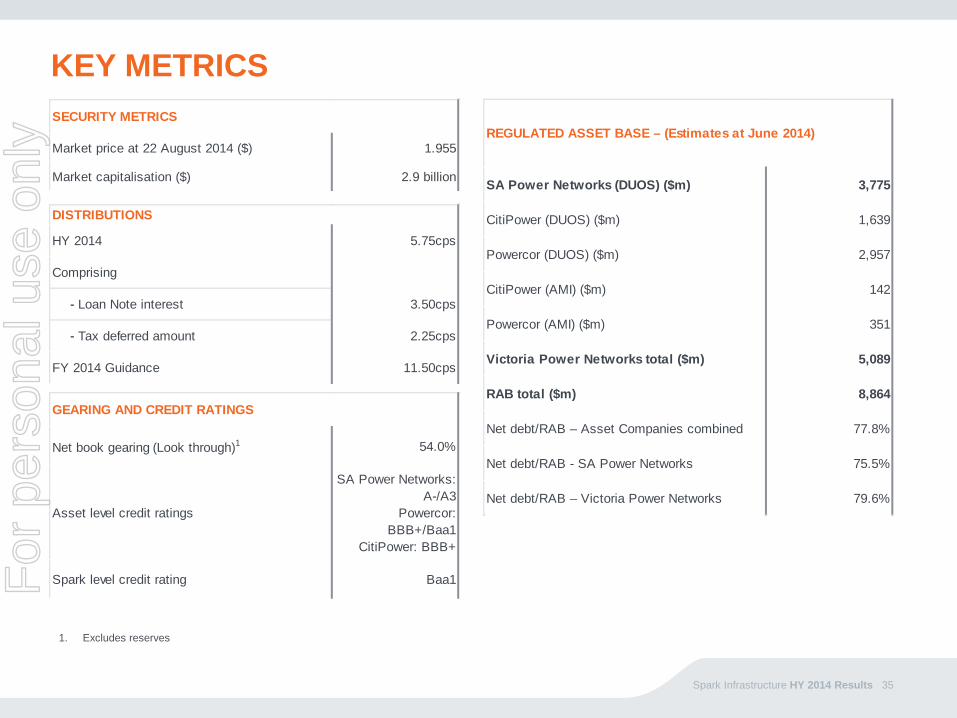
KEY METRICS
Market price at 22 August 2014 ($) 1.955
Market capitalisation ($) 2.9 billion
SECURITY METRICS
HY 2014 5.75cps
Comprising
- Loan Note interest 3.50cps
- Tax deferred amount 2.25cps
FY 2014 Guidance 11.50cps
DISTRIBUTIONS
Net book gearing (Look through)1 54.0%
Asset level credit ratings
SA Power Networks: A-/A3
Powercor: BBB+/Baa1
CitiPower: BBB+
Spark level credit rating Baa1
GEARING AND CREDIT RATINGS
SA Power Networks (DUOS) ($m) 3,775
CitiPower (DUOS) ($m) 1,639
Powercor (DUOS) ($m) 2,957
CitiPower (AMI) ($m) 142
Powercor (AMI) ($m) 351
Victoria Power Networks total ($m) 5,089
RAB total ($m) 8,864
Net debt/RAB – Asset Companies combined 77.8%
Net debt/RAB - SA Power Networks 75.5%
Net debt/RAB – Victoria Power Networks 79.6%
REGULATED ASSET BASE – (Estimates at June 2014)
For
per
sona
l use
onl
y

36 Spark Infrastructure HY 2014 Results
DEBT POSITION (AT 30 JUNE 2014)
1 Calculated as: EBITDA ex customer contributions and gifted assets / net interest expense 2 Advanced Metering Infrastructure (AMI) 3 For Spark level net debt, excludes $5.0 million cash, held for Australian Financial Services Licence purposes. Note that from 1 July 2014 this requirement is now $10.0 million. 4 Excludes reserves
SA Power Networks $m
RAB 3,775
Net Debt 2,849
Net Debt/RAB 75.5%
Percentage Hedged (gross) 100.6%
Rolling 12 Month ICR1 (x net interest) 3.5 x
Victoria Power Networks $m
RAB (Including AMI2) 5,089
Net Debt 4,048
Net Debt/RAB 79.6%
Percentage Hedged (gross) 95.9%
Rolling 12 Month ICR (x net interest) 2.9 x
SPARK INFRASTRUCTURE $m
Total RAB (49% share) 4,343
Gross Debt at Spark Level -
Net Debt at Asset Level (49% Share) 3,380
Total Proportionate Net Debt3 3,295
Net Debt/RAB – Asset Level 77.8%
Book Gearing Net (Look through)4 54.0%
Spark Look Through Proportion of Hedging (gross)
97.8%
For
per
sona
l use
onl
y

Actual volume Cumulative average
(AER forecast volume) actual to date
Growth in actual % (Cumulative average
(Growth in AER forecast %) Year 0 Year 1 Year 2 Year 3 Year 4 Year 5 annual forecast change)11,504 11,249 11,019 11,025 10,652
(11,555) (11,618) (11,422) (11,264) (11,194) (11,194)-2.2% -2.0% +0.1% -3.4% (-1.9%)
(+0.5%) (-1.7%) (-1.4%) (-0.6%) (0.0%) (-0.6%)
6,210 6,105 6,085 5,981(6,125) (6,180) (6,227) (6,218) (6,201) (6,237)
-1.7% -0.3% -1.7% (-1.2%)
(+0.9%) (+0.8%) (-0.1%) (-0.3%) (+0.6%) (+0.4%)
10,678 10,470 10,744 10,556(10,585) (10,726) (10,795) (10,781) (10,761) (10,797)
-1.9% +2.6% -1.8% (-0.4%)
(+1.3%) (+0.6%) (-0.1%) (-0.2%) (+0.3%) (+0.4%)
Regulatory year1
37 Spark Infrastructure HY 2014 Results
ELECTRICITY SALES VOLUMES Regulatory allowances v Actual sales (GWh)
1. June year end for SAPN, December year end for CitiPower and Powercor F
or p
erso
nal u
se o
nly

$m
HY 2014 HY 2013 HY 2014 HY 2013 HY 2014 HY 2013 HY 2014 HY 2013
80.8 79.0 114.3 104.9 (49.1) (20.6) 65.2 84.3
19.4 13.6 51.0 48.8 (18.9) (16.1) 32.1 32.7
77.6 54.4 98.9 95.5 (34.9) (29.4) 64.1 66.1
Totals 177.8 147.0 264.2 249.2 (102.8) (66.1) 161.4 183.1
Spark 49% share 87.1 72.0 129.5 122.1 (50.4) (32.4) 79.1 89.7
Maintenance capex spend
Regulatory depreciation
Less inflation uplift on RAB2
Net regulatory depreciation
38 Spark Infrastructure HY 2014 Results
CAPITAL EXPENDITURE (100%)
1. VPN HY 2013 figures have been restated to account for a change in allocation approach – growth vs maintenance capex 2. For SAPN, adjusted for CPI ‘true up’ in HY 2013 (1.25% actual vs 1.92% estimate) and in HY 2014 (1.46% actual vs 1.56% estimate)
$m
HY 2014 HY 2013 HY 2014 HY 20131 HY 2014 HY 20131
Growth Capex 71.1 104.2 117.6 104.0 188.7 208.2
Growth Capex AMI - - 17.0 67.1 17.0 67.1
Maintenance capex 80.8 79.0 97.0 68.0 177.8 147.0
Total 151.9 183.2 231.6 239.1 383.5 422.2
Change vs pcp (%)
TOTALS
-17.1% -3.1% -9.2%
For
per
sona
l use
onl
y

39 Spark Infrastructure HY 2014 Results
EQUITY ACCOUNTING PROFITS – HY 2014
1. Under the partnership agreement, Spark is entitled to an additional share of profit in SAPN. Note: Numbers may contain rounding errors.
100% Basis $mSA Power Networks
Victoria Power Networks Combined
Spark 49% Share
Regulated revenue - distribution and metering 439.5 475.5 915.0 448.3
Semi regulated and unregulated revenue 80.6 71.9 152.5 74.7
Customer contributions and gifted assets 41.3 30.7 71.9 35.2
Total Income 561.3 578.0 1,139.4 558.3
Total Income excl CCs and GAs 520.1 547.4 1,067.4 523.0
Operating Costs (160.0) (189.8) (349.8) (171.4)
EBITDA (excl CCs and GAs) 360.1 357.6 717.6 351.6
Depreciation and amortisation (90.0) (138.9) (228.9) (112.2)
EBIT 311.3 249.4 560.6 274.7
Net interest expense (excl Sub Debt) (101.2) (124.8) (226.0) (110.7)
Subordinated debt interest expense (35.9) (81.9) (117.8) (57.7)
Net profit before tax 174.1 42.7 216.9 106.3
Tax expense - (18.7) (18.7) (9.1)
Net profit after tax 174.1 24.1 198.2 97.1
less: additional share of profit from preferred partnership capital (PPC) 1 (34.3) - (34.3) (16.8)
Asset Company Net Profits for Equity Accounting 139.8 24.1 163.9 80.3
49% Basis - Spark Share 68.5 11.8 80.3 80.3
Add back: additional share of profit from preferred partnership capital (PPC) 1 34.3 - 34.3 34.3
Less: depreciation/amortisation of fair value on uplift of assets on acquisition (0.4) (2.4) (2.8) (2.8)
Share of equity accounted profits 102.4 9.4 111.9 111.9
Add: interest income from Associates (Victoria Power Networks 49% sub debt) 40.1 40.1 40.1
Total Income from Asset Companies included in Spark Profit and Loss 152.0
Gain on derivative contracts 22.8
Interest income 0.6
Interest expense (0.9)
Interest expense – Loan Notes (51.3)
General and administrative expenses (5.0)
Transaction fees - derivative contracts (3.3)
Profit for the period before tax 114.7
Income tax expense (25.8)
Net profit for the period attributable to Securityholders 89.0
For
per
sona
l use
onl
y

Public Lighting 8.3 45%
Asset Relocation 2.6 14% Metering Services
5.3 29%
Feeder Standby / Excess kVAR
1.1 6%
Pole/Duct Rental 0.9 5%
Other Excluded Services 0.1 1%
Semi-regulated revenue excl customer contributions
CaMS T&D – ElectraNet 15.6 25%
Other CaMS 18.1 29%
Material Sales 8.5
14% Interstate work
3.4 5%
Asset rentals 1.7 3%
Telecommunications 10.7 17%
Facilities Access / Dark Fibre 1.1 2%
Sale of Salvage 0.5 1%
Other 2.7 4%
Unregulated revenue
40 Spark Infrastructure HY 2014 Results
SA POWER NETWORKS REVENUE BREAKDOWN – HY 2014
Regulated distribution
revenue 439.5 84%
Semi-regulated revenue
excluding customer
contributions 18.3 4%
Unregulated revenue
62.3 12%
Total revenue
For
per
sona
l use
onl
y

PNS Resources, 18.5, 37%
PNS Transmission and Distribution - SP AusNet
12.2 25%
SLA Revenue (SA Power Networks and TOA)
7.2 14%
Material Sales 3.1 6%
Telecommunications 1.6 3%
Wellington Management Fees 2.0 4%
Joint Use of Poles 1.5 3%
Property Rental 0.4 1%
Other 3.2 7%
Unregulated revenue Public Lighting
7.1 32%
New Connections 4.4 20%
Special Reader Activities
2.9 13%
PV installation 1.4 6%
Service Truck
Activities 2.2
10%
Recoverable works 1.2 5%
Other 3.0
13%
Semi-regulated revenue excl customer contributions and AMI
41 Spark Infrastructure HY 2014 Results
VICTORIA POWER NETWORKS REVENUE BREAKDOWN – HY 2014
*100% owned by CKI and PAH
Regulated distribution
revenue 415.6 85%
Semi-regulated revenue excluding
customer contributions and
AMI 22.1 5%
Unregulated revenue
49.7 10%
Total revenue excl customer contributions
For
per
sona
l use
onl
y

HY 2014 HY 2013 Variance($m) ($m) ($m)
Public Lighting 8.3 8.1 0.2 Asset Relocation 2.6 4.6 (2.0) Metering Services 5.3 5.2 0.1 Feeder Standby / Excess kVAR 1.1 1.2 (0.1) Pole/Duct Rental 0.9 1.5 (0.6) Other Excluded Services1 0.1 0.7 (0.6) TOTAL2 18.3 21.3 (3.0)
42 Spark Infrastructure HY 2014 Results
SEMI REGULATED REVENUES HY 2014 vs HY 2013 (100% figures)
1. Includes profit/loss on asset disposals 2. Does not include Alternative Control Services (ACS) revenue, which is reported as part of DUOS revenue
HY 2014 HY 2013 Variance($m) ($m) ($m)
Public Lighting 7.1 7.1 (0.0)New Connections 4.4 4.0 0.4Special Reader Activities 2.9 3.8 (0.9)PV installation 1.4 1.7 (0.3)Service Truck Activities 2.2 2.0 0.2Recoverable works 1.2 1.1 0.1Other 3.0 2.1 0.9TOTAL 22.1 21.8 0.3
For
per
sona
l use
onl
y

43 Spark Infrastructure HY 2014 Results
UNREGULATED REVENUES HY 2014 vs HY 2013 (100% figures)
1. Decline driven by reduced ElectraNet spending following on from their regulatory reset 2. Includes NBN related revenue ($10.2m)
HY 2014 HY 2013 Variance($m) ($m) ($m)
Construction and Maintenance Services (CaMS) T&D - ElectraNet1 15.6 27.0 (11.4) Other CaMS 18.1 21.9 (3.8) Material Sales 8.5 7.1 1.4 Interstate work 3.4 3.7 (0.3) Asset rentals 1.7 1.7 0.0 Telecommunications2 10.7 2.8 7.9 Facilities Access / Dark Fibre 1.1 1.2 (0.1) Sale of Salvage 0.5 0.6 (0.1) Other 2.7 1.8 0.9 TOTAL 62.3 67.8 (5.5)
For
per
sona
l use
onl
y

44 Spark Infrastructure HY 2014 Results
UNREGULATED REVENUES (CONT.) HY 2014 vs HY 2013 (100% figures)
1. Significant decrease in PNS Resources revenue driven by non-recurring the Elaine Terminal Station project from HY 2013 ($13.9m), and due to the QLD and NSW markets experiencing lower project activity as a result of government direction, reduced demand and capital expenditure constraints.
2. $7.1m SA Power Networks, $0.1m TOA 3. Includes profit/loss on asset disposals and duct rental
*100% owned by CKI and PAH
HY 2014 HY 2013 Variance($m) ($m) ($m)
PNS Resources1 18.5 36.8 (18.3)
PNS Transmission and Distribution - SP AusNet 12.2 9.1 3.1
SLA Revenue (SA Power Networks and TOA*)2 7.2 7.1 0.1
Material Sales 3.1 3.2 (0.1)
Telecommunications 1.6 2.4 (0.8)
Wellington* Management Fees 2.0 2.0 0.0
Joint Use of Poles 1.5 1.5 (0.0)
Property Rental 0.4 0.3 0.1
Other3 3.2 4.0 (0.8) TOTAL 49.7 66.4 (16.7)
For
per
sona
l use
onl
y

$352.5m $345.3m $386.9m
($34.4m)
($111.2m)
($79.1m)
($18.0m) ($5.6m)
$138.6m
$382.3m
($37.0m)
($106.6m)
($89.8m)
($28.2m)
($1.5m)
$119.2m
0
50
100
150
200
250
300
350
400
450
EBITDA - H1 14 CustomerContributions
EBITDA exclCCs
less: NetFinance
charges (cash)
less: Netregulatory
depreciation
+/- Net WorkingCapital Mvmts
Less VPN cashtax payments
OperatingC/Flow - H1 14
EBITDA - H1 13 CustomerContributions
EBITDA exclCCs
less: NetFinance
charges (cash)
less: Netregulatory
depreciation
+/- Net WorkingCapital Mvmts
Less VPN cashtax payments
OperatingC/Flow - H1 13
$m Lookthrough Operating Cashflow (49% Share) $m
45 Spark Infrastructure HY 2014 Results
OPERATING CASH FLOW MODEL – HY 2014 Aggregated Asset Companies
H1 2014 H1 2013
For
per
sona
l use
onl
y

46 Spark Infrastructure HY 2014 Results
$361.8m $359.3m $401.3m
($39.5m)
($102.9m)
($65.2m)
($40.4m)
$153.3m
$401.0m
($41.7m)
($102.3m)
($84.3m)
($10.3m)
$162.4m
0
50
100
150
200
250
300
350
400
450
EBITDA - H1 14 CustomerContributions
EBITDA excl CCs less: Net Financecharges (cash)
less: Netregulatory
depreciation
+/- Net WorkingCapital Mvmts
Operating C/Flow- H1 14
EBITDA - H1 13 CustomerContributions
EBITDA excl CCs less: Net Financecharges (cash)
less: Netregulatory
depreciation
+/- Net WorkingCapital Mvmts
Operating C/Flow- H1 13
$m SA Power Networks Lookthrough Operating Cashflow (100% Share) $m
OPERATING CASH FLOW MODEL – HY 2014 SA Power Networks
Note re maintenance capex: Net regulatory depreciation is a proxy for maintenance capex. It is calculated as regulatory depreciation net of CPI uplift on RAB. CPI uplift on RAB is estimated by: In H1 2014, CPI is based on actual March 2014 CPI of 2.92% with ‘true up’ for CPI actual vs estimate for FY 2013 RAB estimate (1.46% being 2.92% over 6 months, vs 1.56%). In H1 2013, CPI is based on actual March 2013 CPI of 2.50% with ‘true up’ for CPI actual vs estimate for FY 2012 RAB estimate (1.25% being 2.50% over 6 months, vs 1.92%). CPI is based on ‘All groups CPI’ for weighted average of 8 capital cities, not seasonally adjusted (Source: ABS). March on March (released April)
H1 2014 H1 2013
For
per
sona
l use
onl
y

$357.6m $345.4m $388.3m
($30.7m)
($124.0m)
($96.2m)
$3.6m ($11.4m)
$129.6m
$379.2m
($33.8m)
($115.2m)
($98.9m)
($47.3m) ($3.1m)
$80.9m
0
50
100
150
200
250
300
350
400
450
EBITDA - H1 14 CustomerContributions
EBITDA exclCCs
less: NetFinance
charges (cash)
less: Netregulatory
depreciation
+/- Net WorkingCapital Mvmts
Less VPN cashtax payments
OperatingC/Flow - H1 14
EBITDA - H1 13 CustomerContributions
EBITDA exclCCs
less: NetFinance
charges (cash)
less: Netregulatory
depreciation
+/- Net WorkingCapital Mvmts
Less VPN cashtax payments
OperatingC/Flow - H1 13
$m Victoria Power Networks Lookthrough Operating Cashflow (100% Share) $m
47 Spark Infrastructure HY 2014 Results
OPERATING CASH FLOW MODEL – HY 2014 Victoria Power Networks
Note re maintenance capex: Net regulatory depreciation is a proxy for maintenance capex. It is calculated as regulatory depreciation net of CPI uplift on RAB. CPI uplift on RAB for DUOS is estimated by: In H1 2014, based on actual September 2013 CPI of 2.16%. In H1 2013, based on actual September 2012 CPI of 2.00%. CPI is based on ‘All groups CPI’ for weighted average of 8 capital cities, not seasonally adjusted (Source: ABS). September on September (released October)
H1 2014 H1 2013
For
per
sona
l use
onl
y

48 Spark Infrastructure HY 2014 Results
CURRENT REGULATORY SETTINGS TO 2015 SA Power Networks and Victoria Power Networks (100% figures)
REGULATORY PERIOD SA Power Networks1
1 Jul 2010 – 30 Jun 2015 Victoria Power Networks2
1 Jan 2011 – 31 Dec 2015
Beta 0.8 0.8
Risk Free Rate 5.89% 5.08%
Debt risk premium (DRP) 2.98% 3.89%3
Market risk premium (MRP) 6.50% 6.50%
Nominal vanilla WACC 9.76% 9.49%
Nominal post tax return on equity (2010 decision) 11.09% 10.28%
Gamma (Imputation) 0.25 (following successful appeal)
0.25 (following successful appeal)
Net capex over 5 years ($ 2010) $1,636m $2,115m
Opex over 5 years ($ 2010)4,5 $1,080m $997m
Revenue (Nominal)4,6 $3,930m $3,845m
1. Figures relate to DUOS incl. Alternative Control Services (ACS) revenue. 2. Figures relate to DUOS only 3. VPN DRP 3.89% following appeal outcomes (3.74% per final 2010 determination) 4. Figures revised for all successful outcomes, including $39.8 million (nominal dollars) vegetation management costs for SAPN awarded in July 2013 5. Operating expenditure numbers adjusted for efficiency carryover amounts per determinations 6. Revenue numbers not updated for actual CPI
For
per
sona
l use
onl
y

REGULATED PRICE PATH CPI minus X1
► Regulated electricity sales revenues are determined by a price path set according to the CPI-X1 formula. A negative X-Factor means a real increase in distribution tariffs
► Regulatory pricing period commences on 1 July each year for SAPN and 1 January each year for VPN (CitiPower and Powercor)
► X-Factors below include all regulatory appeal outcomes
► Whilst CPI-X is the key underlying driver for tariff increases, the tariff increases implied by reported results includes adjustments for other factors
1. Whilst referred to as “CPI-X”, the actual tariff increase formula used by the regulator is: (1+CPI)x(1-x)-1. Source: AER
2. Figures updated for regulatory appeals announced, excluding $39.8 million (nominal dollars) vegetation management costs for SAPN awarded in July 2013 (this is a passthrough and does not impact X-factors)
3. Figures for SAPN exclude adjustments for STPIS, PV and Q-factor actual and forecast adjustments. Figures for VPN exclude STPIS and any other adjustments.
49 Spark Infrastructure HY 2014 Results
CPI (%) Tariff increase (%)
Actual Actual/forecast 3
(Forecast)
Year 1 2.89(1 Jul 10) -2.52Year 2 3.33(1 Jul 11) -2.52Year 3 1.58(1 Jul 12) -2.52Year 4 2.50(1 Jul 13) -2.52Year 5 2.92(1 Jul 14) -2.52
-4.97 6.63
-7.00 9.67
-0.89 3.43
X-Factor2
-12.14 15.38
-18.10 22.03
CPI (%) Tariff increase (%)
Actual Actual/forecast 3
(Forecast)
Year 1 2.79(1 Jan 11) -2.57Year 2 3.52(1 Jan 12) -2.57Year 3 2.00(1 Jan 13) -2.57Year 4 2.16(1 Jan 14) -2.57Year 5 -(1 Jan 15) -2.57
-6.78 8.92
-7.80 10.13
-7.80 10.57
X-Factor2
6.41 -3.80
-4.00 7.66
CPI (%) Tariff increase (%)
Actual Actual/forecast 3
(Forecast)
Year 1 2.79(1 Jan 11) -2.57Year 2 3.52(1 Jan 12) -2.57Year 3 2.00(1 Jan 13) -2.57Year 4 2.16(1 Jan 14) -2.57Year 5 -(1 Jan 15) -2.57
-6.36 8.49
-6.70 9.00
-7.20 9.96
X-Factor2
-0.11 2.90
-3.00 6.63
For
per
sona
l use
onl
y

Spark Infrastructure HY 2014 Results 50
Acquisition of interest in DUET Group
► The cost of entry under the combined derivative contracts was ~$402 million:
► At 30 June 2014, the interest in DUET Group impacts Spark results (P&L and cashflow) as follows:
402.1
(206.3)
195.8
23.5
219.3
050
100150200250300350400450
Total acquisition costs* Less amount of embeddedfunding
Amount of pre-paid forward Add gain on derivativecontracts
Derivative asset
$m
P&L ($m) Cashflow ($m)Unrealised fair value gain 23.5 -Transaction costs (3.3) (2.7)Finance costs paid (0.7) (0.7)TOTAL 19.5 (3.4)
* Based on ~185.9 million securities at an average entry price of $2.16 per security
For
per
sona
l use
onl
y
51
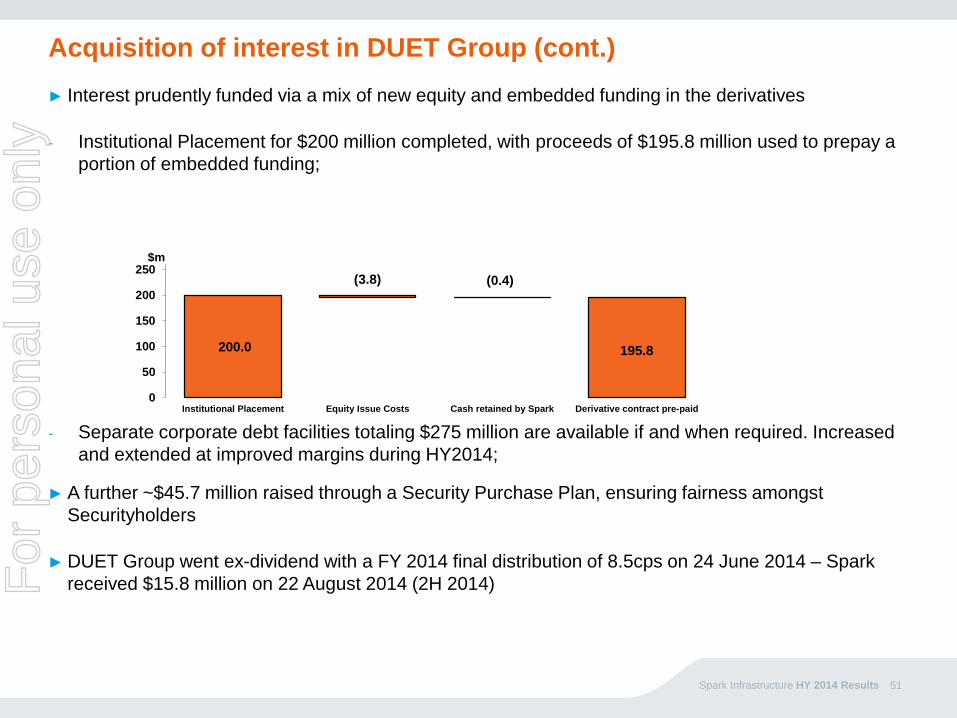
Acquisition of interest in DUET Group (cont.) ► Interest prudently funded via a mix of new equity and embedded funding in the derivatives
- Institutional Placement for $200 million completed, with proceeds of $195.8 million used to prepay a portion of embedded funding;
- Separate corporate debt facilities totaling $275 million are available if and when required. Increased and extended at improved margins during HY2014;
► A further ~$45.7 million raised through a Security Purchase Plan, ensuring fairness amongst Securityholders
► DUET Group went ex-dividend with a FY 2014 final distribution of 8.5cps on 24 June 2014 – Spark received $15.8 million on 22 August 2014 (2H 2014)
Spark Infrastructure HY 2014 Results
200.0
(3.8) (0.4)
195.8
0
50
100
150
200
250
Institutional Placement Equity Issue Costs Cash retained by Spark Derivative contract pre-paid
$m
For
per
sona
l use
onl
y

52 Spark Infrastructure HY 2014 Results
DISCLAIMER & SECURITIES WARNING No offer or invitation. This presentation is not an offer or invitation for subscription or purchase of or a recommendation to purchase securities or financial product. No financial product advice. This presentation contains general information only and does not take into account the investment objectives, financial situation and particular needs of individual investors. It is not financial product advice. Investors should obtain their own independent advice from a qualified financial advisor having regard to their objectives, financial situation and needs. Summary information. The information in this presentation does not purport to be complete. It should be read in conjunction with Spark Infrastructure’s other periodic and continuous disclosure announcements lodged with the Australian Securities Exchange (ASX), which are available at www.asx.com.au. U.S. ownership restrictions. This presentation does not constitute an offer to sell, or a solicitation of an offer to buy, securities in the United States or to any “U.S. person”. The Stapled Securities have not been registered under the U.S. Securities Act or the securities laws of any state of the United States. In addition, none of the Spark Infrastructure entities have been registered under the U.S. Investment Company Act of 1940, as amended, in reliance on the exemption provided by Section 3(c)(7) thereof. Accordingly, the Stapled Securities cannot be held at any time by, or for the account or benefit of, any U.S. person who is not both a QIB and a QP. Any U.S. person who is not both a QIB and a QP (or any investor who holds Stapled Securities for the account or benefit of any US person who is not both a QIB and a QP) is an "Excluded US Person" (A "U.S. person", a QIB or "Qualified Institutional Buyer" and a QP or "Qualified Purchaser" have the meanings given under US law). Spark Infrastructure may require an investor to complete a statutory declaration as to whether they (or any person on whose account or benefit it holds Stapled Securities) are an Excluded US Person. Spark Infrastructure may treat any investor who does not comply with such a request as an Excluded US Person. Spark Infrastructure has the right to: (i) refuse to register a transfer of Stapled Securities to any Excluded U.S. Person; or (ii) require any Excluded US Person to dispose of their Stapled Securities; or (iii) if the Excluded US Person does not do so within 30 business days, require the Stapled Securities be sold by a nominee appointed by Spark. To monitor compliance with these foreign ownership restrictions, the ASX’s settlement facility operator (ASX Settlement Pty Limited) has classified the Stapled Securities as Foreign Ownership Restricted financial products and put in place certain additional monitoring procedures. Foreign jurisdictions. No action has been taken to register or qualify the Stapled Securities in any jurisdiction outside Australia. It is the responsibility of any investor to ensure compliance with the laws of any country (outside Australia) relevant to their securityholding in Spark Infrastructure. No liability. No representation or warranty, express or implied, is made in relation to the fairness, accuracy or completeness of the information, opinions and conclusions expressed in the course of this presentation. To the maximum extent permitted by law, each of Spark Infrastructure, all of its related bodies corporate and their representatives, officers, employees, agents and advisors do not accept any responsibility or liability (including without limitation any liability arising from negligence on the part of any person) for any direct, indirect or consequential loss or damage suffered by any person, as a result of or in connection with this presentation or any action taken by you on the basis of the information, opinions or conclusions expressed in the course of this presentation. You must make your own independent assessment of the information and in respect of any action taken on the basis of the information and seek your own independent professional advice where appropriate. Forward looking statements. No representation or warranty is given as to the accuracy, completeness, likelihood of achievement or reasonableness of any forecasts, projections, prospects, returns, forward-looking statements or statements in relation to future matters contained in the information provided in this presentation. Such forecasts, projections, prospects, returns and statements are by their nature subject to significant unknown risks, uncertainties and contingencies, many of which are outside the control of Spark Infrastructure, that may cause actual results to differ materially from those expressed or implied in such statements. There can be no assurance that actual outcomes will not differ materially from these statements.
For
per
sona
l use
onl
y